Embed Size (px)
Citation preview

37
Chapter 2 Solid fuels and derived gases
Introduction 2.1 This chapter presents statistics on supply and demand for coal (tables 2.1 - 2.4) and manufactured solid fuels, including coke oven coke, coke breeze, patent fuel, coke oven gas, blast furnace gas, benzole and tar (tables 2.5 and 2.6). A full list of tables is available at the end of the chapter. 2.2 In 2016, coal comprised 5.8 per cent of UK primary energy demand, half that of the previous year and under a third of its recent peak of 19 per cent in 2012. Most coal is used for electricity generation, coke manufacture, or in blast furnaces in the steel industry. 2.3 Overleaf, an energy flow chart for 2016 shows the flows of coal from production and imports through to consumption. It is a way of simplifying the figures that can be found in the commodity balance for coal in Table 2.4. The chart illustrates the flow of coal from the point of supply (on the left) to its eventual final use (on the right).
Key points
Coal production fell more than half compared to last year, down to an all-time low of 4 million tonnes (Table 2.4). This is the largest ever year-on-year reduction and is a marked step down from the 30 million tonnes produced at the start of the century. The decrease is due to the closure of the last large deep mines in 2015, combined with a steep reduction in demand) as government policy and market forces reduced the use of coal for electricity generation.
Similarly, demand for coal halved, falling from 38 million tonnes in 2015 to 18 million tonnes in 2016 (Table 2.4), with a 59 per cent decrease in the use of coal for electricity generation. Demand last year was around quarter of that seen at the start of the century.
In 2016 around 67 per cent of demand for coal was from major power producers for electricity generation with around a further 15 per cent used for the manufacture of coke (Table 2.4).
In 2016 UK imports were 8.5 million tonnes (the lowest value for 15 years), a decrease of 62 per cent on 2015 due to lower demand from generators (Table 2.4).
In 2016 Columbia was the UK’s largest supplier of coal imports with a share of 31 per cent. The other main suppliers were Russia with a 27 per cent share and USA with a 17 per cent share (Table 2B).
Total stock levels decreased in 2016 to 8 million tonnes, which was 5.7 million tonnes lower than in 2015, due to generators using more stocks for electricity generation. (Table 2.4).
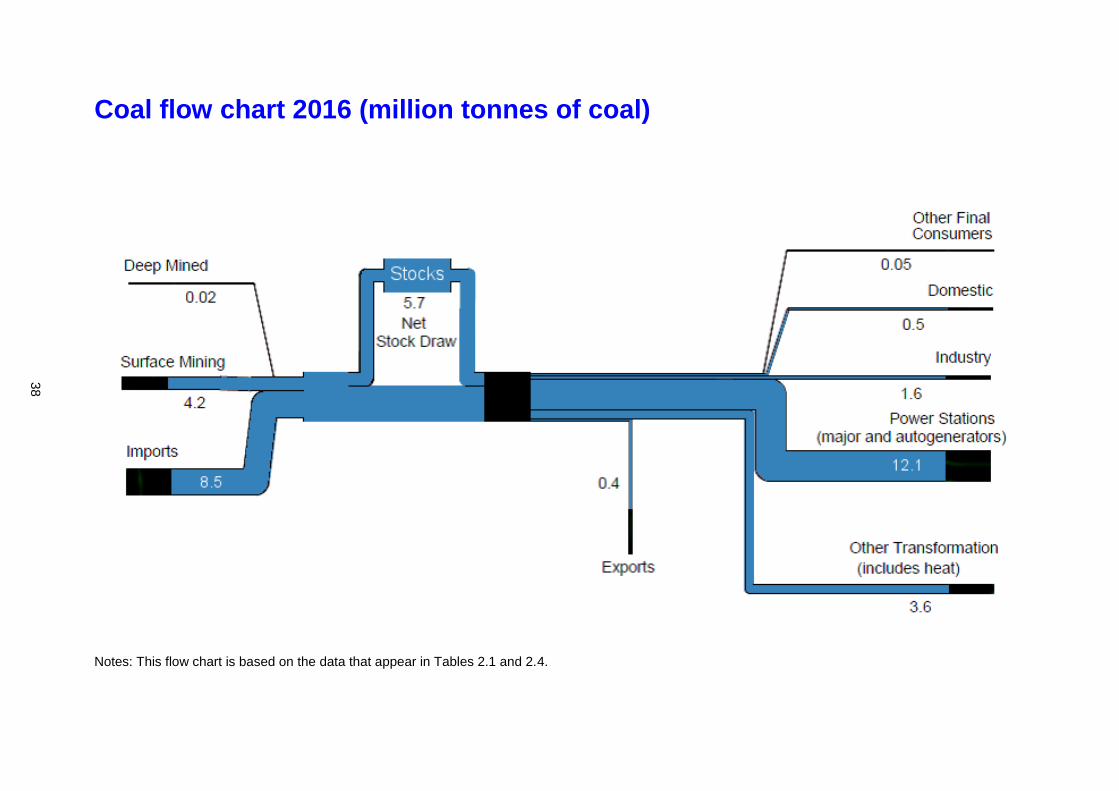
Coal flow chart 2016 (million tonnes of coal)
Notes: This flow chart is based on the data that appear in Tables 2.1 and 2.4.
38

39
Coal supply and demand (Table 2.1) 2.4 In 2016, coal production halved (-51 per cent) compared to 2015 to an all-time low of 4.2 million tonnes. Net imports fell 64 per cent to 8.0 million tonnes (Chart 2.1).
Chart 2.1: UK coal supply and demand to 2016
2.5 Deep mined production fell to just 0.02 million tonnes in 2016, from 2.8 million tonnes in 2015. Kellingley, the last remaining large deep mine, closed in December 2015 and there are only seven small deep mines left in the UK. Similarly, surface mine production decreased by 29 per cent to a new record low of 4.2 million tonnes. This was due to the closure of a number of mines in 2015 and some other mines producing less coal as they are coming to the end of operation. Production from deep mines and surface mines accounted for 23 per cent of UK coal supply, with 45 per cent from net imports and the remaining 32 per cent drawn from stocks held by coal power plants and coke ovens. 2.6 Steam coal, mainly used by power stations, accounted for 88 per cent of total coal production in 2016, with 11 per cent anthracite and the remainder coking coal (Table 2.1). No coal slurry has been produced since the last UK sites closed in 2013.
40
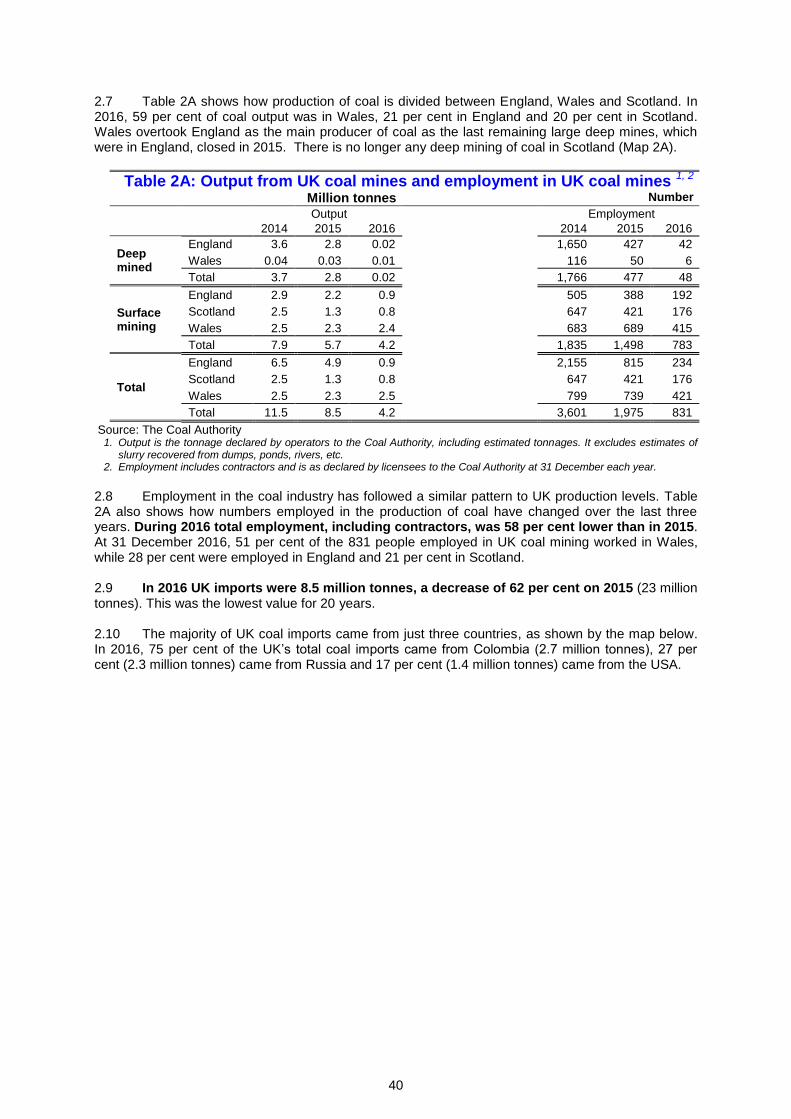
2.7 Table 2A shows how production of coal is divided between England, Wales and Scotland. In 2016, 59 per cent of coal output was in Wales, 21 per cent in England and 20 per cent in Scotland. Wales overtook England as the main producer of coal as the last remaining large deep mines, which were in England, closed in 2015. There is no longer any deep mining of coal in Scotland (Map 2A). Table 2A: Output from UK coal mines and employment in UK coal mines 1, 2
Million tonnes Number
Output Employment
2014 2015 2016 2014 2015 2016
Deep mined
England 3.6 2.8 0.02 1,650 427 42
Wales 0.04 0.03 0.01 116 50 6
Total 3.7 2.8 0.02 1,766 477 48
Surface mining
England 2.9 2.2 0.9 505 388 192
Scotland 2.5 1.3 0.8 647 421 176
Wales 2.5 2.3 2.4 683 689 415
Total 7.9 5.7 4.2 1,835 1,498 783
Total
England 6.5 4.9 0.9 2,155 815 234
Scotland 2.5 1.3 0.8 647 421 176
Wales 2.5 2.3 2.5 799 739 421
Total 11.5 8.5 4.2 3,601 1,975 831
Source: The Coal Authority 1. Output is the tonnage declared by operators to the Coal Authority, including estimated tonnages. It excludes estimates of
slurry recovered from dumps, ponds, rivers, etc. 2. Employment includes contractors and is as declared by licensees to the Coal Authority at 31 December each year.
2.8 Employment in the coal industry has followed a similar pattern to UK production levels. Table 2A also shows how numbers employed in the production of coal have changed over the last three years. During 2016 total employment, including contractors, was 58 per cent lower than in 2015. At 31 December 2016, 51 per cent of the 831 people employed in UK coal mining worked in Wales, while 28 per cent were employed in England and 21 per cent in Scotland. 2.9 In 2016 UK imports were 8.5 million tonnes, a decrease of 62 per cent on 2015 (23 million tonnes). This was the lowest value for 20 years.
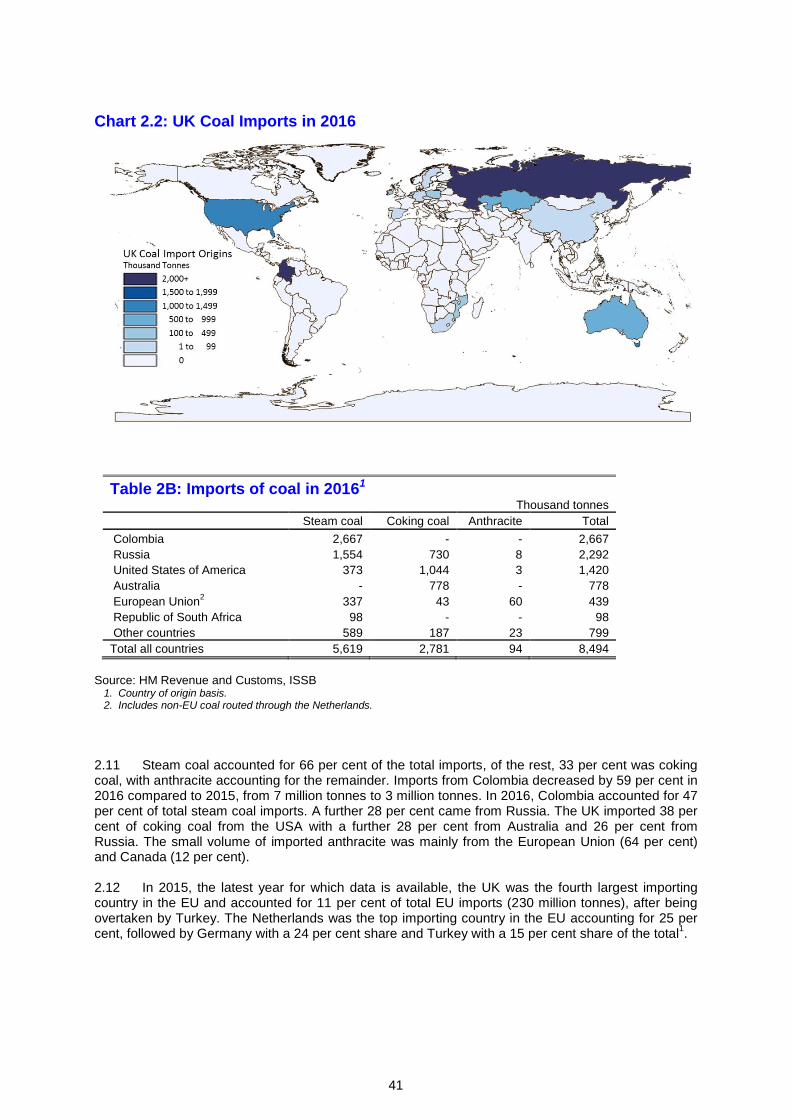
2.10 The majority of UK coal imports came from just three countries, as shown by the map below. In 2016, 75 per cent of the UK’s total coal imports came from Colombia (2.7 million tonnes), 27 per cent (2.3 million tonnes) came from Russia and 17 per cent (1.4 million tonnes) came from the USA.
41
Chart 2.2: UK Coal Imports in 2016
Table 2B: Imports of coal in 20161 Thousand tonnes
Steam coal Coking coal Anthracite Total
Colombia 2,667 - - 2,667 Russia 1,554 730 8 2,292 United States of America 373 1,044 3 1,420 Australia - 778 - 778 European Union
2 337 43 60 439
Republic of South Africa 98 - - 98 Other countries 589 187 23 799
Total all countries 5,619 2,781 94 8,494
Source: HM Revenue and Customs, ISSB
1. Country of origin basis. 2. Includes non-EU coal routed through the Netherlands.
2.11 Steam coal accounted for 66 per cent of the total imports, of the rest, 33 per cent was coking coal, with anthracite accounting for the remainder. Imports from Colombia decreased by 59 per cent in 2016 compared to 2015, from 7 million tonnes to 3 million tonnes. In 2016, Colombia accounted for 47 per cent of total steam coal imports. A further 28 per cent came from Russia. The UK imported 38 per cent of coking coal from the USA with a further 28 per cent from Australia and 26 per cent from Russia. The small volume of imported anthracite was mainly from the European Union (64 per cent) and Canada (12 per cent). 2.12 In 2015, the latest year for which data is available, the UK was the fourth largest importing country in the EU and accounted for 11 per cent of total EU imports (230 million tonnes), after being overtaken by Turkey. The Netherlands was the top importing country in the EU accounting for 25 per cent, followed by Germany with a 24 per cent share and Turkey with a 15 per cent share of the total
1.
42
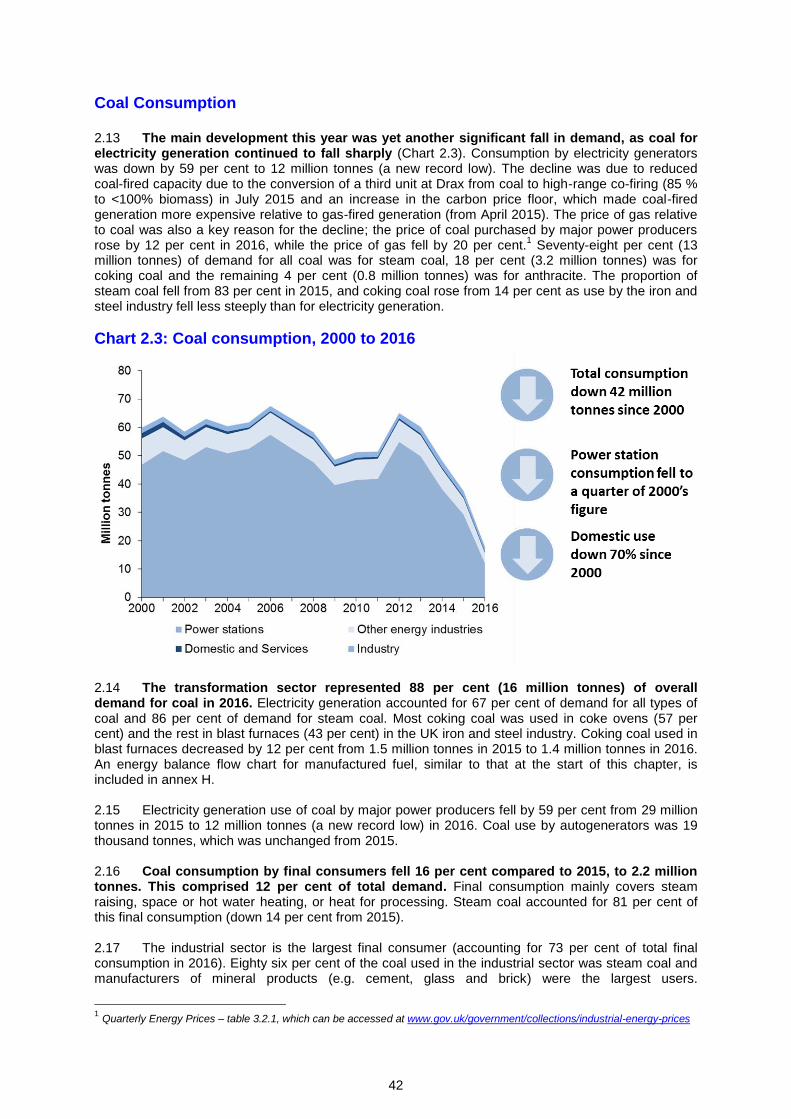
Coal Consumption 2.13 The main development this year was yet another significant fall in demand, as coal for electricity generation continued to fall sharply (Chart 2.3). Consumption by electricity generators was down by 59 per cent to 12 million tonnes (a new record low). The decline was due to reduced coal-fired capacity due to the conversion of a third unit at Drax from coal to high-range co-firing (85 % to <100% biomass) in July 2015 and an increase in the carbon price floor, which made coal-fired generation more expensive relative to gas-fired generation (from April 2015). The price of gas relative to coal was also a key reason for the decline; the price of coal purchased by major power producers rose by 12 per cent in 2016, while the price of gas fell by 20 per cent.
1 Seventy-eight per cent (13
million tonnes) of demand for all coal was for steam coal, 18 per cent (3.2 million tonnes) was for coking coal and the remaining 4 per cent (0.8 million tonnes) was for anthracite. The proportion of steam coal fell from 83 per cent in 2015, and coking coal rose from 14 per cent as use by the iron and steel industry fell less steeply than for electricity generation.
Chart 2.3: Coal consumption, 2000 to 2016
2.14 The transformation sector represented 88 per cent (16 million tonnes) of overall demand for coal in 2016. Electricity generation accounted for 67 per cent of demand for all types of coal and 86 per cent of demand for steam coal. Most coking coal was used in coke ovens (57 per cent) and the rest in blast furnaces (43 per cent) in the UK iron and steel industry. Coking coal used in blast furnaces decreased by 12 per cent from 1.5 million tonnes in 2015 to 1.4 million tonnes in 2016. An energy balance flow chart for manufactured fuel, similar to that at the start of this chapter, is included in annex H. 2.15 Electricity generation use of coal by major power producers fell by 59 per cent from 29 million tonnes in 2015 to 12 million tonnes (a new record low) in 2016. Coal use by autogenerators was 19 thousand tonnes, which was unchanged from 2015.
2.16 Coal consumption by final consumers fell 16 per cent compared to 2015, to 2.2 million tonnes. This comprised 12 per cent of total demand. Final consumption mainly covers steam raising, space or hot water heating, or heat for processing. Steam coal accounted for 81 per cent of this final consumption (down 14 per cent from 2015). 2.17 The industrial sector is the largest final consumer (accounting for 73 per cent of total final consumption in 2016). Eighty six per cent of the coal used in the industrial sector was steam coal and manufacturers of mineral products (e.g. cement, glass and brick) were the largest users.
1 Quarterly Energy Prices – table 3.2.1, which can be accessed at www.gov.uk/government/collections/industrial-energy-prices
43
2.18 The domestic sector accounted for 25 per cent of the final consumption of coal, with 66 per cent of this demand being for steam coal and the remainder for anthracite. Domestic consumption fell slightly, by 0.4 per cent in 2016 compared with 2015. 2.19 In 2015, the UK was the third largest consumer of coal among the EU countries, accounting for 13 per cent (39 million tonnes) of total coal consumption in the EU (289 million tonnes). The top consumer was Poland accounting for 23 per cent (65 million tonnes) of total EU consumption, while Germany was second accounting for 22 per cent (64 million tonnes)
1.
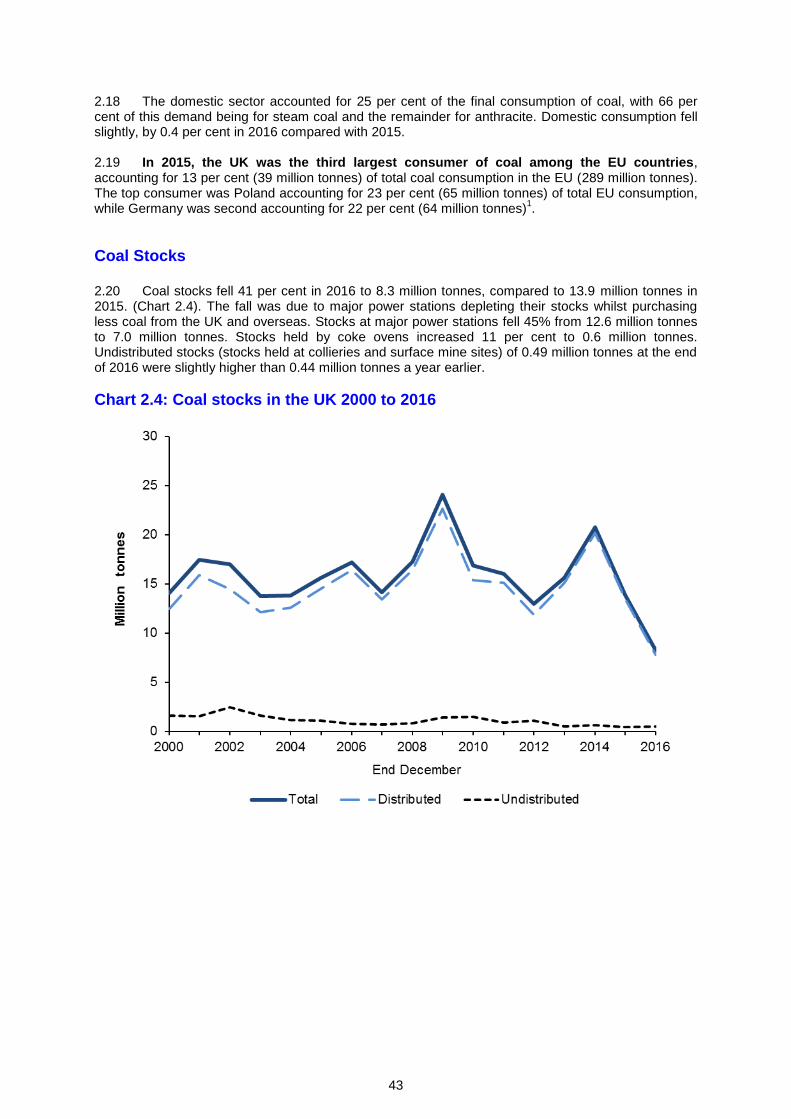
Coal Stocks 2.20 Coal stocks fell 41 per cent in 2016 to 8.3 million tonnes, compared to 13.9 million tonnes in 2015. (Chart 2.4). The fall was due to major power stations depleting their stocks whilst purchasing less coal from the UK and overseas. Stocks at major power stations fell 45% from 12.6 million tonnes to 7.0 million tonnes. Stocks held by coke ovens increased 11 per cent to 0.6 million tonnes. Undistributed stocks (stocks held at collieries and surface mine sites) of 0.49 million tonnes at the end of 2016 were slightly higher than 0.44 million tonnes a year earlier.
Chart 2.4: Coal stocks in the UK 2000 to 2016

44
Coal Resources 2.21 The Coal Authority estimates that overall there are 3,365 million tonnes of coal resources, including prospects (Table 2C), down from 3,560 million tonnes assessed in June 2016. Of the economically recoverable and minable coal resource in current operations (including those in the planning or pre-planning process) 471 million tonnes is in underground mines and 67 million tonnes in surface mines. Overall England had a 66 per cent share of UK current mines and licenced resources, followed by Scotland with 28 per cent and Wales 7 per cent. 2.22 In prospects, there were 2,000 million tonnes suitable for underground mining and 777 million tonnes suitable for surface mining. Table 2C gives details of the resource assessment by England, Scotland and Wales as at 14 June 2017.
Table 2C: Identified GB coal resource assessment at 14 June 2017 UNDERGROUND MINING
Million tonnes
England Scotland Wales Total
Operational mines 1 0 25 26
Planning granted 5 0 0 5
In planning process 340 0 0 340
Pre-planning 0 100 0 100
Prospects 2,000 0 50 2,050
Closed mines still in licence 0 0 0 0
Total 2,346 100 75 2,521
SURFACE MINING
Million tonnes
England Scotland Wales Total
Operational mines 1 3 9 13
Planning granted 3 5 1 9
In planning process 3 1 1 5
Pre-planning 0 40 0 40
Prospects 516 115 147 777
Total 523 164 158 844
Source: Coal Authority

45
2 Includes non-coastal ports: Immingham (River Humber), Avonmouth (River Avon) and Tilbury (River Thames)
Map 2A: UK coal production sites and ports as at the end of December 20162
46
Manufactured Solid Fuels (Tables 2.5 and 2.6)
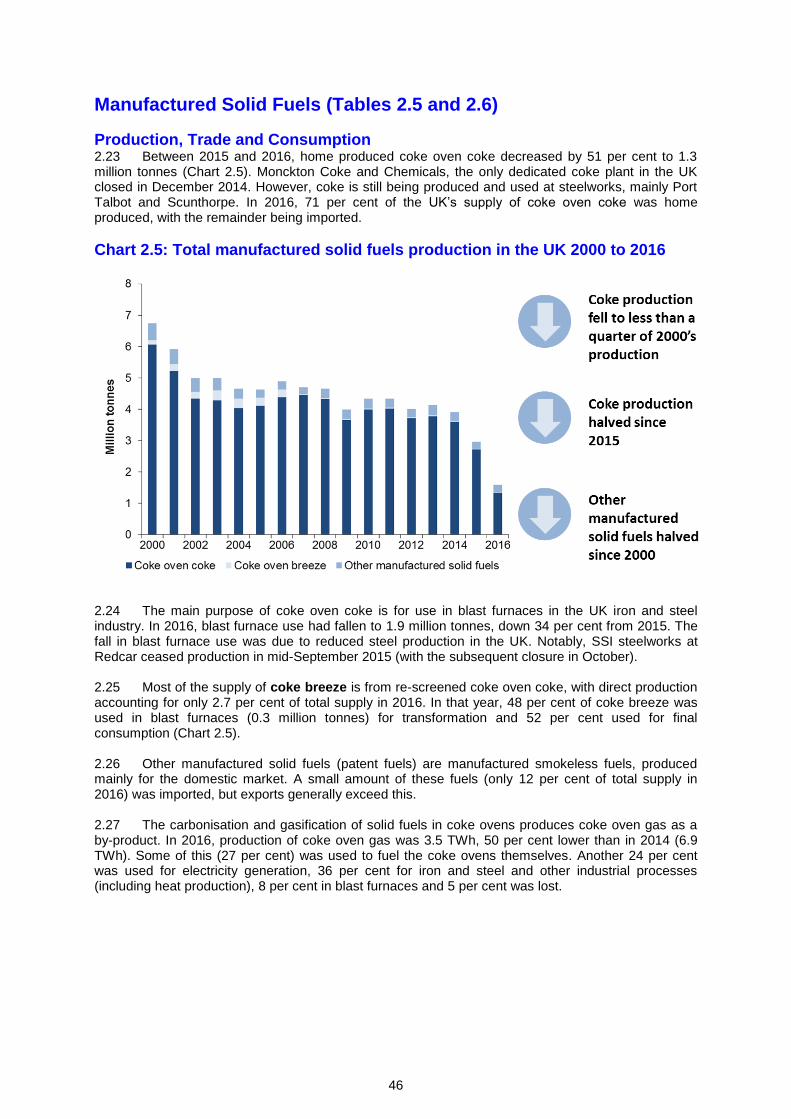
Production, Trade and Consumption 2.23 Between 2015 and 2016, home produced coke oven coke decreased by 51 per cent to 1.3 million tonnes (Chart 2.5). Monckton Coke and Chemicals, the only dedicated coke plant in the UK closed in December 2014. However, coke is still being produced and used at steelworks, mainly Port Talbot and Scunthorpe. In 2016, 71 per cent of the UK’s supply of coke oven coke was home produced, with the remainder being imported.
Chart 2.5: Total manufactured solid fuels production in the UK 2000 to 2016
2.24 The main purpose of coke oven coke is for use in blast furnaces in the UK iron and steel industry. In 2016, blast furnace use had fallen to 1.9 million tonnes, down 34 per cent from 2015. The fall in blast furnace use was due to reduced steel production in the UK. Notably, SSI steelworks at Redcar ceased production in mid-September 2015 (with the subsequent closure in October). 2.25 Most of the supply of coke breeze is from re-screened coke oven coke, with direct production accounting for only 2.7 per cent of total supply in 2016. In that year, 48 per cent of coke breeze was used in blast furnaces (0.3 million tonnes) for transformation and 52 per cent used for final consumption (Chart 2.5). 2.26 Other manufactured solid fuels (patent fuels) are manufactured smokeless fuels, produced mainly for the domestic market. A small amount of these fuels (only 12 per cent of total supply in 2016) was imported, but exports generally exceed this. 2.27 The carbonisation and gasification of solid fuels in coke ovens produces coke oven gas as a by-product. In 2016, production of coke oven gas was 3.5 TWh, 50 per cent lower than in 2014 (6.9 TWh). Some of this (27 per cent) was used to fuel the coke ovens themselves. Another 24 per cent was used for electricity generation, 36 per cent for iron and steel and other industrial processes (including heat production), 8 per cent in blast furnaces and 5 per cent was lost.

47
Chart 2.6: Total manufactured solid fuels consumption in the UK 2000 to 2016
2.28 Blast furnace gas is a by-product of iron smelting in a blast furnace. A similar product is obtained when steel is made in basic oxygen steel (BOS) converters and “BOS” gas is included in this category. Most of these gases are used in other parts of integrated steel works. Production decreased by 29 per cent in 2016 compared with 2015. The generation of electricity in 2016 used 53 per cent of total blast furnace gas and BOS gas, while 35 per cent was used in coke ovens and blast furnaces themselves, 1.8 per cent used in general heat production, 9.1 per cent was lost or burned as waste and a further 0.9 per cent was used in the iron and steel industry.
2.29 Demand for benzole and tars decreased by 53 per cent from 1,136 GWh in 2015 to 531 GWh in 2016, all of which was met by domestic production. From 2009, based on information from the EU-ETS, all consumption of these products has been allocated to non-energy use – see also paragraph 2.51 (d) and (e).

48
List of DUKES coal tables Table Description Period
2.1-2.3
Commodity balances for coal – supply, demand & final consumption 1998-2016
2.4 Supply and consumption of coal 2016
2.5 Supply and consumption of coke oven coke, coke breeze and other manufactured solid fuels
1996-2016
2.6 Supply and consumption of coke oven gas, blast furnace gas, benzole and tars
1996-2016
2.7 Deep mines and surface mines in production, December 2016. 2016
2.1.1 Coal production and stocks 1970-2016
2.1.2 Inland consumption of solid fuels 1970-2016
2A Output from UK coal mines and employment in UK coal mines 2014-2016
2B Imports of coal in 2016, by grade and origin 2016
2C Identified GB coal resource assessment at 6 June 2016 6th June 2016
Technical notes and definitions 2.30 These notes and definitions are in addition to the technical notes and definitions covering all fuels and energy as a whole in Chapter 1. Additional guidance on the compilation of the solid fuels and derived gases statistics can be found in the document ‘Data Sources and Methodologies’, available on the BEIS section of the GOV.UK website at: www.gov.uk/government/collections/coal-statistics. For notes on the commodity balances and definitions of the terms used in the row headings see Annex A. While the data in the printed and bound copy of this Digest cover only the most recent 5 years, these notes also cover data for earlier years that are available on the BEIS website.
Coal production 2.31 Deep mined: The statistics cover saleable output from deep mines including coal obtained from working on both revenue and capital accounts. All licensed collieries (and British Coal collieries prior to 1995) are included, even where coal is only a subsidiary product. 2.32 Surface mines: The figures cover saleable output and include the output of sites worked by operators under agency agreements and licences, as well as the output of sites licensed for the production of coal as a subsidiary to the production of other minerals. The term ‘surface mining’ has now replaced opencast production as defined in DUKES pre-2011. Opencast production is a particular type of surface mining technique. 2.33 Other sources/Slurry: Estimates of slurry etc recovered and disposed of from dumps, ponds, rivers, etc.
Steam coal, coking coal and anthracite 2.34 Steam coal is coal classified as such by UK coal producers and by importers of coal. It tends to have calorific values at the lower end of the range. 2.35 Coking coal is coal sold by producers for use in coke ovens and similar carbonising processes. The definition is not therefore determined by the calorific value or caking qualities of each batch of coal sold, although calorific values tend to be higher than for steam coal.

49
2.36 Anthracite is coal classified as such by UK coal producers and importers of coal. Typically it has a high heat content making it particularly suitable for certain industrial processes and for use as a domestic fuel. Some UK anthracite producers have found a market for their lower calorific value output at power stations.
Allocation of imported coal 2.37 Although data are available on consumption of home produced coal, and also on consumption of imported coal by secondary fuel producers, there is only very limited direct information on consumption of imported coal by final users. Guidance on how BEIS allocate imports to final users is outlined in paragraph 3.2.5 of the ‘Data Sources and Methodologies’ document. This guidance can be found on the BEIS section of the GOV.UK website at: www.gov.uk/government/collections/coal-statistics.
Coal consumption 2.38 Figures for actual consumption of coal are available for all fuels and power producers and for final use by the iron and steel industry. The remaining final users’ consumption figures are based on information on disposals to consumers by producers and on imports. 2.39 Annex A of this Digest outlines the principles of energy and commodity balances and defines the activities that fall within these parts of the balances. However, the following additional notes relevant to solid fuels are given below: Transformation: Blast furnaces: Coking coal injected into blast furnaces is shown separately within the balance tables. Transformation: Low temperature carbonisation plants and patent fuel plants: Coal used at these plants for the manufacture of domestic coke such as Coalite and of briquetted fuels such as Phurnacite and Homefire. Consumption: Industry: The statistics comprise sales of coal by the six main coal producers and a few small producers to the iron and steel industry (excluding those used at coke ovens and blast furnaces) and to other industrial sectors, estimated proportions of anthracite and steam coal imports, and submission made to the EU Emissions Trading Scheme. The figures exclude coal used for industries’ own generation of electricity, which appear separately under transformation. Consumption: Domestic: Some coal is supplied free of charge to retired miners and other retired eligible employees through the National Concessionary Fuel Scheme (NCFS). The concessionary fuel provided in 2015 is estimated at 34.9 thousand tonnes. This estimate is included in the domestic steam coal and domestic anthracite figures.
Stocks of coal 2.40 Undistributed stocks are those held at collieries and surface mine sites. It is not possible to distinguish these two locations in the stock figures. Distributed stocks are those held at power stations and stocking grounds of the major power producing companies (as defined in Chapter 5, paragraphs 5.62 and 5.63), coke ovens, low temperature carbonisation plants and patent fuel plants.
Coke oven coke (hard coke), hard coke breeze and other manufactured fuels 2.41 The statistics cover coke produced at coke ovens owned by Corus plc, Coal Products Ltd and other producers. Low temperature carbonisation plants are not included (see paragraph 2.39). Breeze (as defined in paragraph 2.42) is excluded from the figures for coke oven coke. 2.42 Breeze can generally be described as coke screened below 19 mm (¾ inch) with no fines removed, but the screen size may vary in different areas and to meet the requirements of particular markets. Coke that has been transported from one location to another is usually re-screened before use to remove smaller sizes, giving rise to further breeze. 2.43 The coke screened out by producers as breeze and fines appears as transfers in the coke breeze column of the balances. Transfers out of coke oven coke have not always been equal to transfers into coke oven breeze. This was due to differences arising from the timing, location of measurement and the practice adopted by the iron and steel works. Since 2000, however, the Iron

50
and Steel Statistics Bureau have been able to reconcile these data. Since 2007, most of the supply of coke breeze was reclassified to coke oven coke following better information received by the Iron and Steel Statistics Bureau. 2.44 Figures are derived from returns made to HM Revenue and Customs and are broken down in greater detail in Annex G on the BEIS section of the GOV.UK website at: www.gov.uk/government/collections/digest-of-uk-energy-statistics-dukes. 2.45 In Table 2.5, the export figures used for hard coke, coke breeze and other manufactured solid fuels for the years before 1998 (as reported on the BEIS web site) are quantities of fuel exported as reported to BEIS or its predecessor Departments by the companies concerned, rather than quantities recorded by HM Revenue and Customs in their Trade Statistics. A long-term trend commentary and tables on exports are on the BEIS section of the GOV.UK website at: www.gov.uk/government/collections/digest-of-uk-energy-statistics-dukes. 2.46 In 1998, an assessment using industry data showed that on average over the previous five years 91 per cent of imports had been coke and 9 per cent breeze and it is these proportions that have been used for 1998 and subsequent years in Table 2.5. 2.47 The calorific value for coke breeze has been set the same as for coke oven coke. This is following information from the iron and steel industry on the similarities between the two types of manufactured fuels. 2.48 Imports and exports of manufactured smokeless fuels can contain small quantities of non-smokeless fuels. 2.49 Other manufactured solid fuels are mainly solid smokeless fuels for the domestic market for use in both open fires and in boilers. A smaller quantity is exported (although exports are largely offset by similar quantities of imports in most years). Manufacture takes place in patented fuel plants and low-temperature carbonisation plants. The brand names used for these fuels include Homefire, Phurnacite, Ancit and Coalite. 2.50 Consumption of coke and other manufactured solid fuels: These are disposals from coke ovens to merchants. The figures also include estimated proportions of coke imports.
Blast furnace gas, coke oven gas, benzole and tars 2.51 The following definitions are used in the tables that include these fuels: (a) Blast furnace gas: includes Basic Oxygen Steel furnace (BOS) gas. Blast furnace gas is the gas produced during iron ore smelting when hot air passes over coke within the blast ovens. It contains carbon monoxide, carbon dioxide, hydrogen and nitrogen. In a BOS furnace the aim is not to introduce nitrogen or hydrogen into the steel making process, so pure oxygen gas and suitable fluxes are used to remove the carbon and phosphorous from the molten pig iron and steel scrap. A similar fuel gas is thus produced. (b) Coke oven gas: is a gas produced during the carbonisation of coal to form coke at coke ovens. In 2009, some coke oven gas was produced using a combination of gases other than natural gas and blast furnace gas. This total has been added to the production of coke oven gas rather than transfers because it is specifically defined as the mixture of natural gas, blast furnace gas and BOS gas. See the paragraph below on synthetic coke oven gas for a complete definition of this. (c) Synthetic coke oven gas: is mainly natural gas that is mixed with smaller amounts of blast furnace and BOS gas to produce a gas with almost the same qualities as coke oven gas. The transfers row of Table 2.6 shows the quantities of blast furnace gas used for this purpose and the total input of gases to the synthetic coke oven gas process. There is a corresponding outward transfer from natural gas in Chapter 4, Table 4.1. (d) Benzole: a colourless, liquid, flammable, aromatic hydrocarbon by-product of the iron and steel making process. It is used in the UK as a solvent in the manufacture of styrenes and phenols. All consumption of benzole has been allocated to non-energy use from 2009 onwards.

51
(e) Tars: viscous materials usually derived from the destructive distillation of coal, which are by-products of the coke and iron making processes. . All consumption of tars has been allocated to non-energy use from 2009 onwards. Contact: Chris Michaels
Energy Statistics Team [email protected] 0300 068 5050
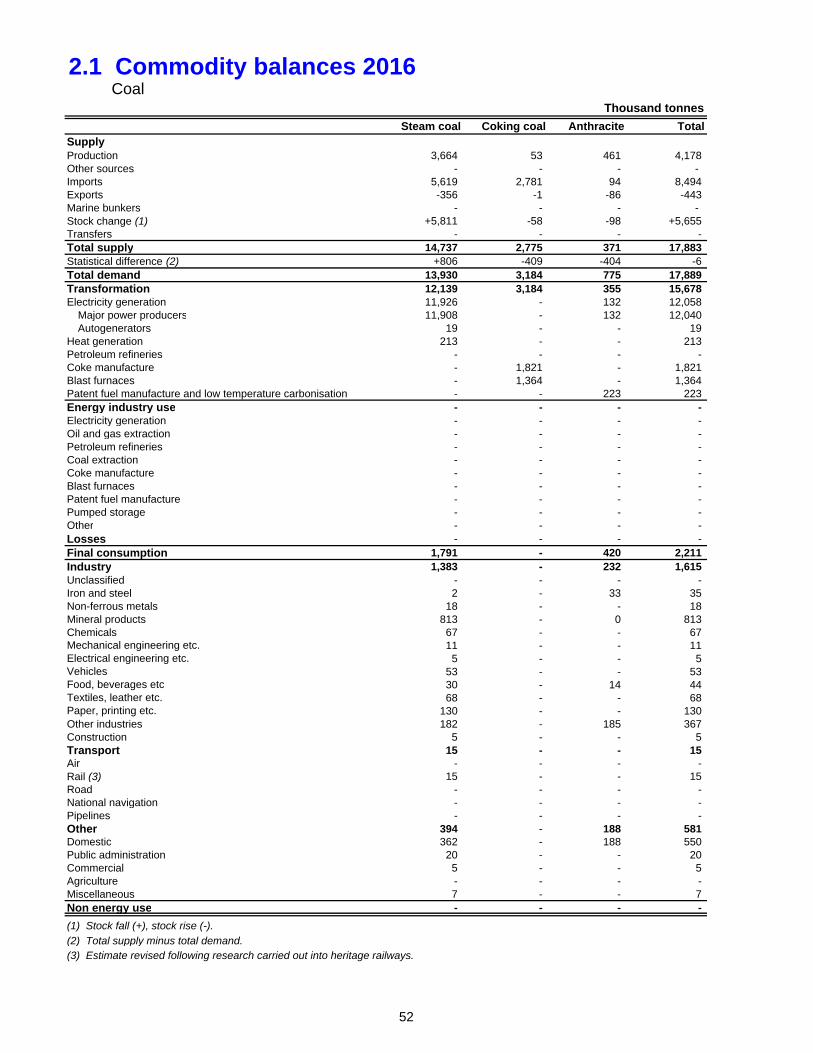
2.1 Commodity balances 2016Coal
Steam coal Coking coal Anthracite TotalSupplyProduction 3,664 53 461 4,178 Other sources - - - - Imports 5,619 2,781 94 8,494 Exports -356 -1 -86 -443 Marine bunkers - - - - Stock change (1) +5,811 -58 -98 +5,655 Transfers - - - - Total supply 14,737 2,775 371 17,883 Statistical difference (2) +806 -409 -404 -6 Total demand 13,930 3,184 775 17,889 Transformation 12,139 3,184 355 15,678 Electricity generation 11,926 - 132 12,058
Major power producers 11,908 - 132 12,040 Autogenerators 19 - - 19
Heat generation 213 - - 213 Petroleum refineries - - - - Coke manufacture - 1,821 - 1,821 Blast furnaces - 1,364 - 1,364 Patent fuel manufacture and low temperature carbonisation - - 223 223 Energy industry use - - - - Electricity generation - - - - Oil and gas extraction - - - - Petroleum refineries - - - - Coal extraction - - - - Coke manufacture - - - - Blast furnaces - - - - Patent fuel manufacture - - - - Pumped storage - - - - Other - - - - Losses - - - - Final consumption 1,791 - 420 2,211 Industry 1,383 - 232 1,615 Unclassified - - - - Iron and steel 2 - 33 35 Non-ferrous metals 18 - - 18 Mineral products 813 - 0 813 Chemicals 67 - - 67 Mechanical engineering etc. 11 - - 11 Electrical engineering etc. 5 - - 5 Vehicles 53 - - 53 Food, beverages etc 30 - 14 44 Textiles, leather etc. 68 - - 68 Paper, printing etc. 130 - - 130 Other industries 182 - 185 367 Construction 5 - - 5 Transport 15 - - 15 Air - - - - Rail (3) 15 - - 15 Road - - - - National navigation - - - - Pipelines - - - - Other 394 - 188 581 Domestic 362 - 188 550 Public administration 20 - - 20 Commercial 5 - - 5 Agriculture - - - - Miscellaneous 7 - - 7 Non energy use - - - -
(1) Stock fall (+), stock rise (-).
(2) Total supply minus total demand.(3) Estimate revised following research carried out into heritage railways.
Thousand tonnes
52

2.2 Commodity balances 2015Coal
Steam coal Coking coal Anthracite TotalSupplyProduction 7,668r 72r 858r 8,598rOther sources - - - -Imports 17,665r 4,750 102 22,518rExports -303r -1 -81r -385rMarine bunkers - - - -Stock change (1) 6,590r 248r 25r 6,862rTransfers - - - -Total supply 31,620r 5,069r 904r 37,593rStatistical difference (2) 467r -148r -337r -18rTotal demand 31,153r 5,217r 1,242r 37,612rTransformation 29,070r 5,217r 701r 34,988rElectricity generation 28,857r - 473r 29,330r
Major power producers 28,838r - 473r 29,310rAutogenerators 19r - - 19r
Heat generation 213r - - 213rPetroleum refineries - - - -Coke manufacture - 3,673r - 3,673rBlast furnaces - 1,544r - 1,544rPatent fuel manufacture and low temperature carbonisation - - 228r 228rEnergy industry use - - - -Electricity generation - - - -Oil and gas extraction - - - -Petroleum refineries - - - -Coal extraction - - - -Coke manufacture - - - -Blast furnaces - - - -Patent fuel manufacture - - - -Pumped storage - - - -Other - - - -Losses - - - -Final consumption 2,084r - 541r 2,624rIndustry 1,707r - 336r 2,043rUnclassified - - - -Iron and steel 1r - 43 44rNon-ferrous metals 21r - - 21rMineral products 1,048r - 0 1,048rChemicals 74r - - 74rMechanical engineering etc. 11r - - 11rElectrical engineering etc. 5r - - 5rVehicles 60r - - 60rFood, beverages etc. 33r - 21 54rTextiles, leather etc. 66r - - 66rPaper, printing etc. 133r - - 133rOther industries 248r - 272r 520rConstruction 6 - - 6Transport 13r - - 13rAir - - - -Rail (3) 13r - - 13rRoad - - - -National navigation - - - -Pipelines - - - -Other 363r - 205r 568rDomestic 347r - 205r 552rPublic administration 4r - - 4rCommercial 5 - - 5Agriculture - - - -Miscellaneous 7r - - 7rNon energy use - - - -
(1) Stock fall (+), stock rise (-).
(2) Total supply minus total demand.(3) Estimate revised following research carried out into heritage railways.
Thousand tonnes
53
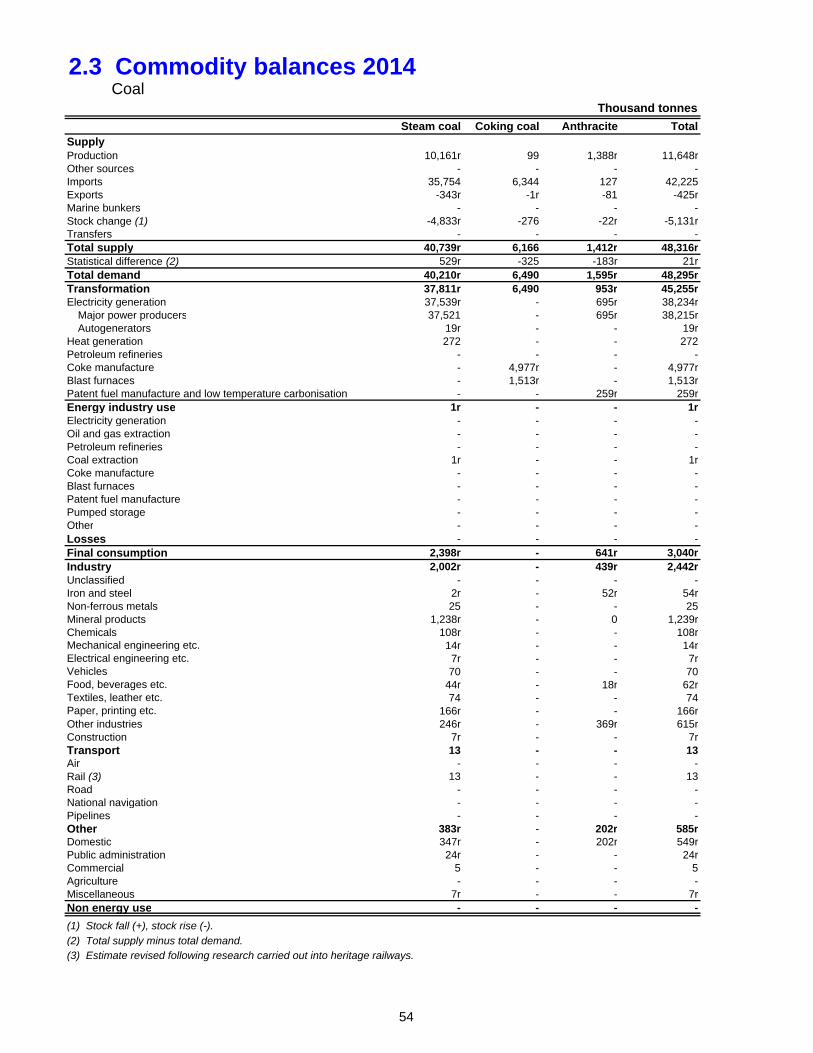
2.3 Commodity balances 2014Coal
Steam coal Coking coal Anthracite TotalSupplyProduction 10,161r 99 1,388r 11,648rOther sources - - - -Imports 35,754 6,344 127 42,225Exports -343r -1r -81 -425rMarine bunkers - - - -Stock change (1) -4,833r -276 -22r -5,131rTransfers - - - -Total supply 40,739r 6,166 1,412r 48,316rStatistical difference (2) 529r -325 -183r 21rTotal demand 40,210r 6,490 1,595r 48,295rTransformation 37,811r 6,490 953r 45,255rElectricity generation 37,539r - 695r 38,234r
Major power producers 37,521 - 695r 38,215rAutogenerators 19r - - 19r
Heat generation 272 - - 272Petroleum refineries - - - -Coke manufacture - 4,977r - 4,977rBlast furnaces - 1,513r - 1,513rPatent fuel manufacture and low temperature carbonisation - - 259r 259rEnergy industry use 1r - - 1rElectricity generation - - - -Oil and gas extraction - - - -Petroleum refineries - - - -Coal extraction 1r - - 1rCoke manufacture - - - -Blast furnaces - - - -Patent fuel manufacture - - - -Pumped storage - - - -Other - - - -Losses - - - -Final consumption 2,398r - 641r 3,040rIndustry 2,002r - 439r 2,442rUnclassified - - - -Iron and steel 2r - 52r 54rNon-ferrous metals 25 - - 25Mineral products 1,238r - 0 1,239rChemicals 108r - - 108rMechanical engineering etc. 14r - - 14rElectrical engineering etc. 7r - - 7rVehicles 70 - - 70Food, beverages etc. 44r - 18r 62rTextiles, leather etc. 74 - - 74Paper, printing etc. 166r - - 166rOther industries 246r - 369r 615rConstruction 7r - - 7rTransport 13 - - 13Air - - - -Rail (3) 13 - - 13Road - - - -National navigation - - - -Pipelines - - - -Other 383r - 202r 585rDomestic 347r - 202r 549rPublic administration 24r - - 24rCommercial 5 - - 5Agriculture - - - -Miscellaneous 7r - - 7rNon energy use - - - -
(1) Stock fall (+), stock rise (-).
(2) Total supply minus total demand.(3) Estimate revised following research carried out into heritage railways.
Thousand tonnes
54
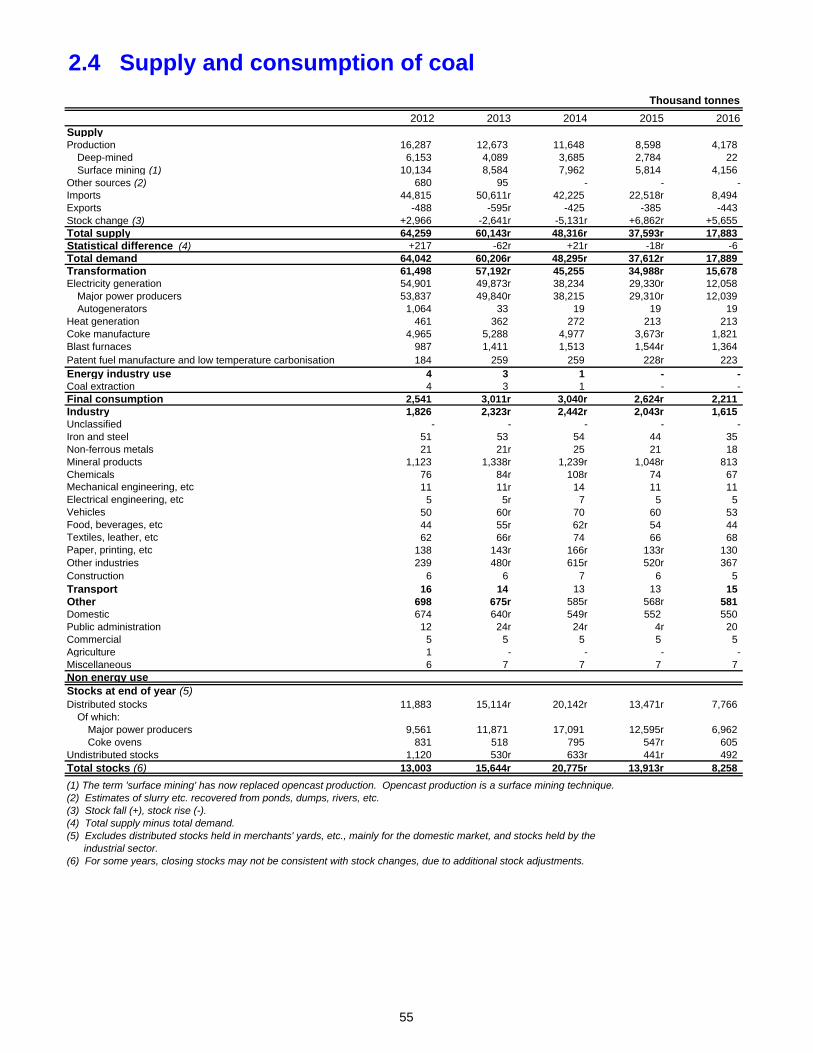
2.4 Supply and consumption of coal
Thousand tonnes
2012 2013 2014 2015 2016SupplyProduction 16,287 12,673 11,648 8,598 4,178
Deep-mined 6,153 4,089 3,685 2,784 22 Surface mining (1) 10,134 8,584 7,962 5,814 4,156
Other sources (2) 680 95 - - -Imports 44,815 50,611r 42,225 22,518r 8,494 Exports -488 -595r -425 -385 -443 Stock change (3) +2,966 -2,641r -5,131r +6,862r +5,655 Total supply 64,259 60,143r 48,316r 37,593r 17,883 Statistical difference (4) +217 -62r +21r -18r -6 Total demand 64,042 60,206r 48,295r 37,612r 17,889 Transformation 61,498 57,192r 45,255 34,988r 15,678 Electricity generation 54,901 49,873r 38,234 29,330r 12,058
Major power producers 53,837 49,840r 38,215 29,310r 12,039 Autogenerators 1,064 33 19 19 19
Heat generation 461 362 272 213 213 Coke manufacture 4,965 5,288 4,977 3,673r 1,821 Blast furnaces 987 1,411 1,513 1,544r 1,364 Patent fuel manufacture and low temperature carbonisation 184 259 259 228r 223 Energy industry use 4 3 1 - -Coal extraction 4 3 1 - -Final consumption 2,541 3,011r 3,040r 2,624r 2,211 Industry 1,826 2,323r 2,442r 2,043r 1,615 Unclassified - - - - -Iron and steel 51 53 54 44 35 Non-ferrous metals 21 21r 25 21 18 Mineral products 1,123 1,338r 1,239r 1,048r 813 Chemicals 76 84r 108r 74 67 Mechanical engineering, etc 11 11r 14 11 11 Electrical engineering, etc 5 5r 7 5 5 Vehicles 50 60r 70 60 53 Food, beverages, etc 44 55r 62r 54 44 Textiles, leather, etc 62 66r 74 66 68 Paper, printing, etc 138 143r 166r 133r 130 Other industries 239 480r 615r 520r 367 Construction 6 6 7 6 5 Transport 16 14 13 13 15 Other 698 675r 585r 568r 581 Domestic 674 640r 549r 552 550 Public administration 12 24r 24r 4r 20 Commercial 5 5 5 5 5 Agriculture 1 - - - -Miscellaneous 6 7 7 7 7 Non energy useStocks at end of year (5)Distributed stocks 11,883 15,114r 20,142r 13,471r 7,766
Of which:Major power producers 9,561 11,871 17,091 12,595r 6,962 Coke ovens 831 518 795 547r 605
Undistributed stocks 1,120 530r 633r 441r 492 Total stocks (6) 13,003 15,644r 20,775r 13,913r 8,258
(1) The term 'surface mining' has now replaced opencast production. Opencast production is a surface mining technique.(2) Estimates of slurry etc. recovered from ponds, dumps, rivers, etc.(3) Stock fall (+), stock rise (-).(4) Total supply minus total demand.(5) Excludes distributed stocks held in merchants' yards, etc., mainly for the domestic market, and stocks held by the industrial sector.(6) For some years, closing stocks may not be consistent with stock changes, due to additional stock adjustments.
55
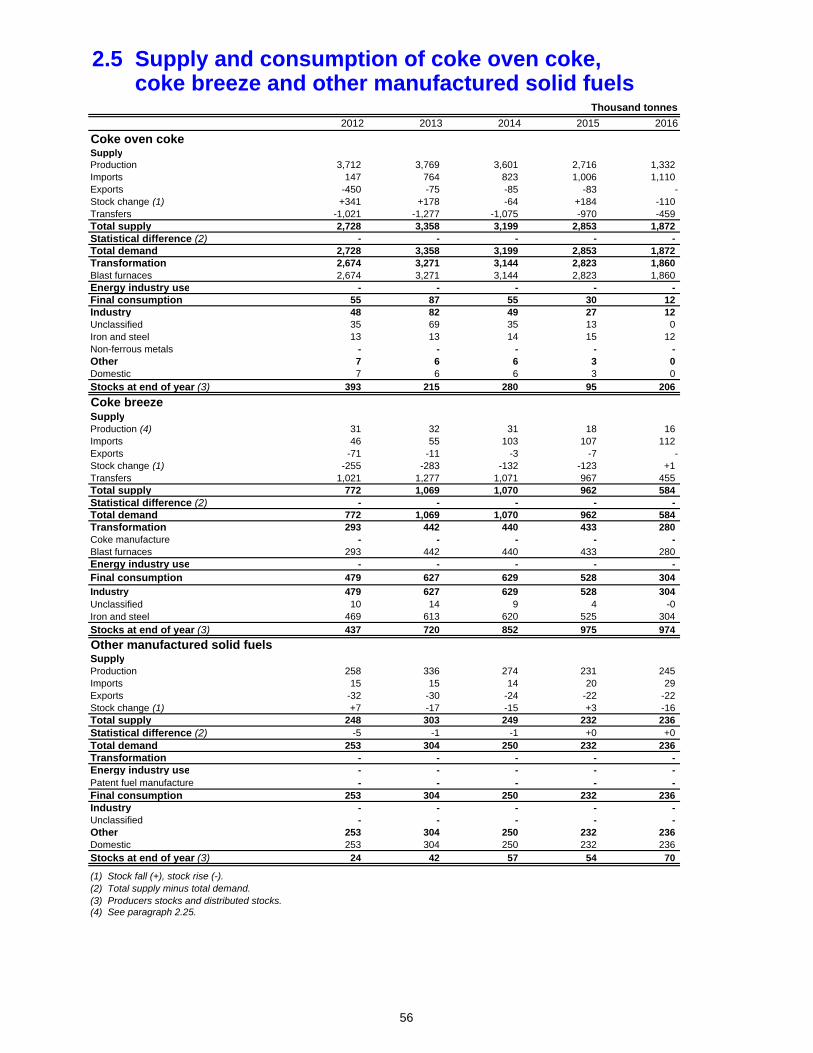
2.5 Supply and consumption of coke oven coke, coke breeze and other manufactured solid fuels
Thousand tonnes
2012 2013 2014 2015 2016
Coke oven cokeSupplyProduction 3,712 3,769 3,601 2,716 1,332 Imports 147 764 823 1,006 1,110 Exports -450 -75 -85 -83 -Stock change (1) +341 +178 -64 +184 -110 Transfers -1,021 -1,277 -1,075 -970 -459 Total supply 2,728 3,358 3,199 2,853 1,872 Statistical difference (2) - - - - - Total demand 2,728 3,358 3,199 2,853 1,872 Transformation 2,674 3,271 3,144 2,823 1,860 Blast furnaces 2,674 3,271 3,144 2,823 1,860 Energy industry use - - - - - Final consumption 55 87 55 30 12 Industry 48 82 49 27 12 Unclassified 35 69 35 13 0 Iron and steel 13 13 14 15 12 Non-ferrous metals - - - - - Other 7 6 6 3 0 Domestic 7 6 6 3 0 Stocks at end of year (3) 393 215 280 95 206
Coke breezeSupplyProduction (4) 31 32 31 18 16 Imports 46 55 103 107 112 Exports -71 -11 -3 -7 -Stock change (1) -255 -283 -132 -123 +1 Transfers 1,021 1,277 1,071 967 455 Total supply 772 1,069 1,070 962 584 Statistical difference (2) - - - - - Total demand 772 1,069 1,070 962 584 Transformation 293 442 440 433 280 Coke manufacture - - - - - Blast furnaces 293 442 440 433 280 Energy industry use - - - - -
Final consumption 479 627 629 528 304
Industry 479 627 629 528 304 Unclassified 10 14 9 4 -0 Iron and steel 469 613 620 525 304 Stocks at end of year (3) 437 720 852 975 974
Other manufactured solid fuelsSupplyProduction 258 336 274 231 245 Imports 15 15 14 20 29 Exports -32 -30 -24 -22 -22 Stock change (1) +7 -17 -15 +3 -16 Total supply 248 303 249 232 236 Statistical difference (2) -5 -1 -1 +0 +0 Total demand 253 304 250 232 236 Transformation - - - - - Energy industry use - - - - - Patent fuel manufacture - - - - - Final consumption 253 304 250 232 236 Industry - - - - - Unclassified - - - - - Other 253 304 250 232 236 Domestic 253 304 250 232 236 Stocks at end of year (3) 24 42 57 54 70
(1) Stock fall (+), stock rise (-).(2) Total supply minus total demand.(3) Producers stocks and distributed stocks.(4) See paragraph 2.25.
56
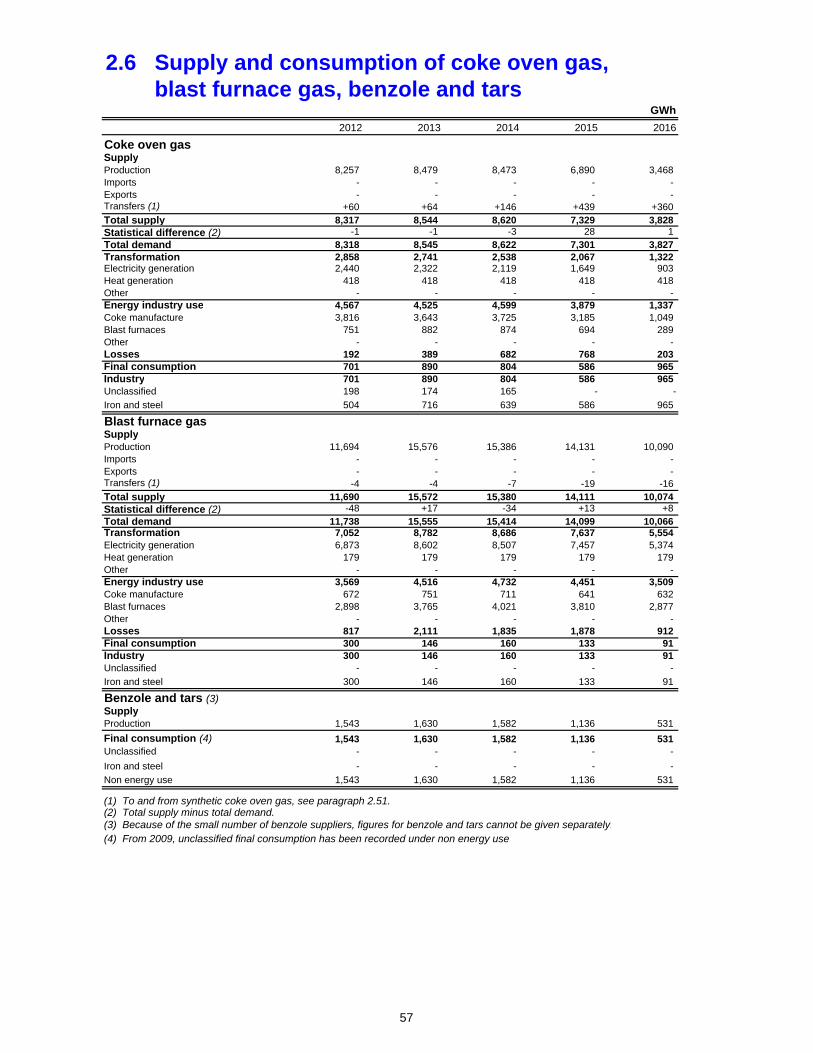
2.6 Supply and consumption of coke oven gas, blast furnace gas, benzole and tars
GWh
2012 2013 2014 2015 2016
Coke oven gasSupplyProduction 8,257 8,479 8,473 6,890 3,468 Imports - - - - - Exports - - - - - Transfers (1) +60 +64 +146 +439 +360 Total supply 8,317 8,544 8,620 7,329 3,828 Statistical difference (2) -1 -1 -3 28 1 Total demand 8,318 8,545 8,622 7,301 3,827 Transformation 2,858 2,741 2,538 2,067 1,322 Electricity generation 2,440 2,322 2,119 1,649 903 Heat generation 418 418 418 418 418 Other - - - - - Energy industry use 4,567 4,525 4,599 3,879 1,337 Coke manufacture 3,816 3,643 3,725 3,185 1,049 Blast furnaces 751 882 874 694 289 Other - - - - - Losses 192 389 682 768 203 Final consumption 701 890 804 586 965 Industry 701 890 804 586 965 Unclassified 198 174 165 - -
Iron and steel 504 716 639 586 965
Blast furnace gasSupplyProduction 11,694 15,576 15,386 14,131 10,090 Imports - - - - - Exports - - - - - Transfers (1) -4 -4 -7 -19 -16 Total supply 11,690 15,572 15,380 14,111 10,074 Statistical difference (2) -48 +17 -34 +13 +8 Total demand 11,738 15,555 15,414 14,099 10,066 Transformation 7,052 8,782 8,686 7,637 5,554 Electricity generation 6,873 8,602 8,507 7,457 5,374 Heat generation 179 179 179 179 179 Other - - - - - Energy industry use 3,569 4,516 4,732 4,451 3,509 Coke manufacture 672 751 711 641 632 Blast furnaces 2,898 3,765 4,021 3,810 2,877 Other - - - - - Losses 817 2,111 1,835 1,878 912 Final consumption 300 146 160 133 91 Industry 300 146 160 133 91 Unclassified - - - - -
Iron and steel 300 146 160 133 91
Benzole and tars (3)SupplyProduction 1,543 1,630 1,582 1,136 531
Final consumption (4) 1,543 1,630 1,582 1,136 531 Unclassified - - - - -
Iron and steel - - - - -
Non energy use 1,543 1,630 1,582 1,136 531
(1) To and from synthetic coke oven gas, see paragraph 2.51.(2) Total supply minus total demand.(3) Because of the small number of benzole suppliers, figures for benzole and tars cannot be given separately.(4) From 2009, unclassified final consumption has been recorded under non energy use
57
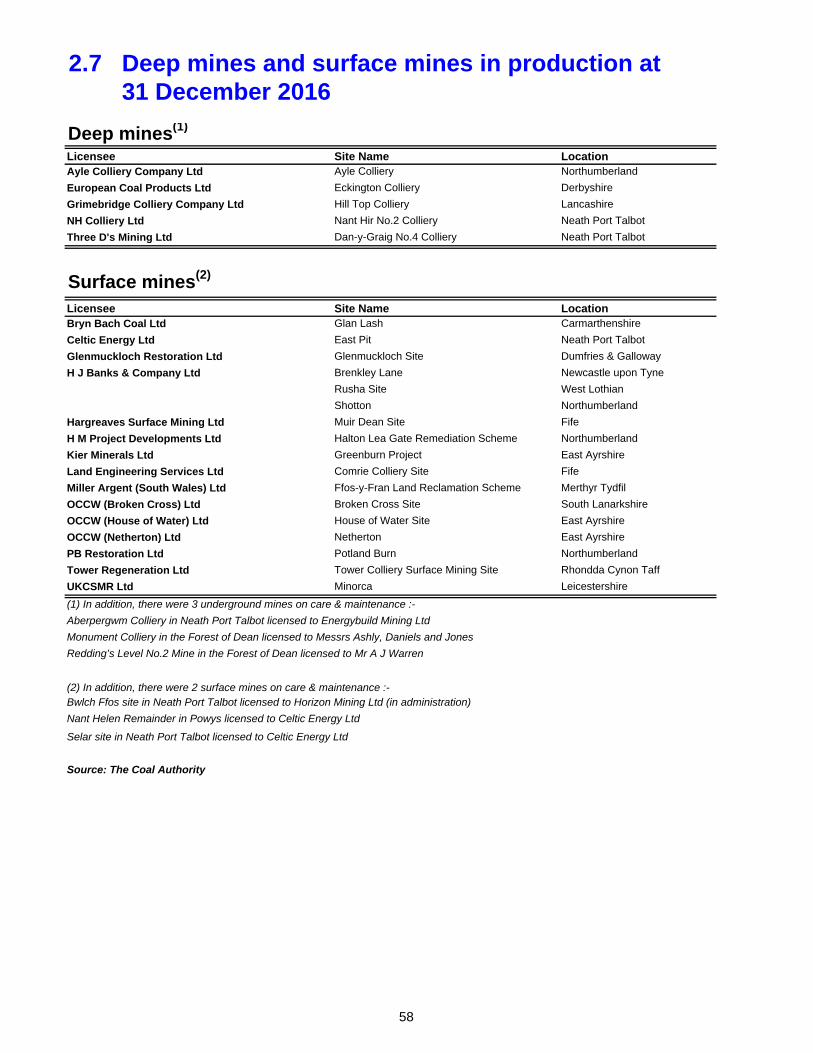
2.7 Deep mines and surface mines in production at 31 December 2016
Deep mines(1)
Licensee Site Name LocationAyle Colliery Company Ltd Ayle Colliery Northumberland
European Coal Products Ltd Eckington Colliery Derbyshire
Grimebridge Colliery Company Ltd Hill Top Colliery Lancashire
NH Colliery Ltd Nant Hir No.2 Colliery Neath Port Talbot
Three D's Mining Ltd Dan-y-Graig No.4 Colliery Neath Port Talbot
Surface mines(2)
Licensee Site Name LocationBryn Bach Coal Ltd Glan Lash Carmarthenshire
Celtic Energy Ltd East Pit Neath Port Talbot
Glenmuckloch Restoration Ltd Glenmuckloch Site Dumfries & Galloway
H J Banks & Company Ltd Brenkley Lane Newcastle upon Tyne
Rusha Site West Lothian
Shotton Northumberland
Hargreaves Surface Mining Ltd Muir Dean Site Fife
H M Project Developments Ltd Halton Lea Gate Remediation Scheme Northumberland
Kier Minerals Ltd Greenburn Project East Ayrshire
Land Engineering Services Ltd Comrie Colliery Site Fife
Miller Argent (South Wales) Ltd Ffos-y-Fran Land Reclamation Scheme Merthyr Tydfil
OCCW (Broken Cross) Ltd Broken Cross Site South Lanarkshire
OCCW (House of Water) Ltd House of Water Site East Ayrshire
OCCW (Netherton) Ltd Netherton East Ayrshire
PB Restoration Ltd Potland Burn Northumberland
Tower Regeneration Ltd Tower Colliery Surface Mining Site Rhondda Cynon Taff
UKCSMR Ltd Minorca Leicestershire
(2) In addition, there were 2 surface mines on care & maintenance :-Bwlch Ffos site in Neath Port Talbot licensed to Horizon Mining Ltd (in administration)
Nant Helen Remainder in Powys licensed to Celtic Energy Ltd
Selar site in Neath Port Talbot licensed to Celtic Energy Ltd
Source: The Coal Authority
(1) In addition, there were 3 underground mines on care & maintenance :-
Aberpergwm Colliery in Neath Port Talbot licensed to Energybuild Mining Ltd
Monument Colliery in the Forest of Dean licensed to Messrs Ashly, Daniels and Jones
Redding’s Level No.2 Mine in the Forest of Dean licensed to Mr A J Warren
58


![REFERENCES AND CHAPTER NOTES - Mass.gov REFERENCES AND CHAPTER NOTES Introduction: 1 Coke, E. [1660] 1826. The Reports of Sir Edward Coke, Knt., in thirteen parts. A new edition](https://img.pdfslide.net/doc/110x75/5aec789b7f8b9ac3619081ae/references-and-chapter-notes-mass-references-and-chapter-notes-introduction.jpg)