Embed Size (px)
Citation preview
Chapter 20: Defect Classification and Analysis
General Types of Defect Analyses.
ODC: Orthogonal Defect Classification.
Analysis of ODC Data.
Defect Analysis Goal:
(actual/potential) defect ↓ quality ↑ in current and future products.
Defect in Quality Data/Models Defect data is quality measurement data:
Extracted from defect tracking tools. Additional (defect classification) data may be available. post-release data issues
Defect data in quality models: As results in generalized models. As response/independent variables in product specific
models.
General Defect Analysis General defect analyses: Questions
What? identification (and classification). type, severity, etc.,
Where? distribution across location. When? discovery/observation
what about when injection occurs? harder pre-release: more data post-release: less data, but more meaningful/sensitive
How/why? related to injection => use in future defect prevention.
General Defect Analysis General defect analyses: Types
Distribution by type or area. Trend over time. Causal analysis. Other analysis for classified data.
Defect Analysis: Data Treatment Variations of defect data:
Error/fault/failure perspective. Pre-/post-release. Unique defect? Focus here: defect fixes – usually contain more data
Why defect fixes (DF)? Propagation information (system structure, component
interconnection, product evolution) Close ties to effort (defect fixing). Pre-release: more meaningful (post release: each
failure occurrence.)
Defect Distribution Analysis What: Distribution over defect types.
Types/sub-types. Defect types related to product's “domain". Tied to quality attributes (in Ch. 2)
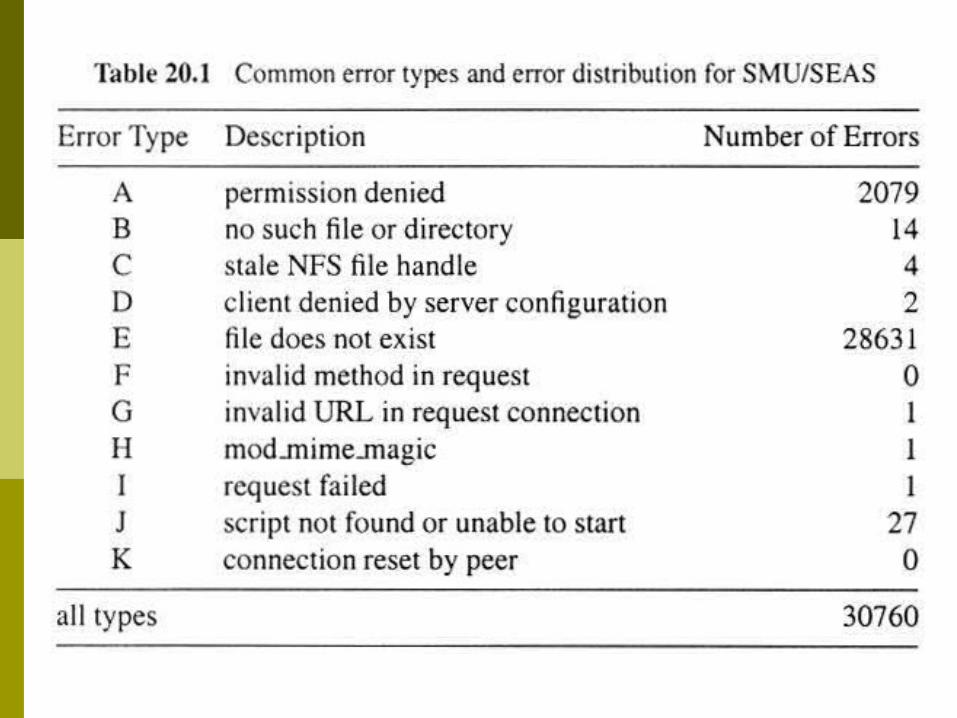
Web example: Table 20.1 (p.341) Defect = “error" in web community. Dominance of type E error (93%): “missing files". Type A error (6.76%): “permission denied” requires
further analysis All other types: negligible
Defect Distribution Analysis Where: Distribution over locations.
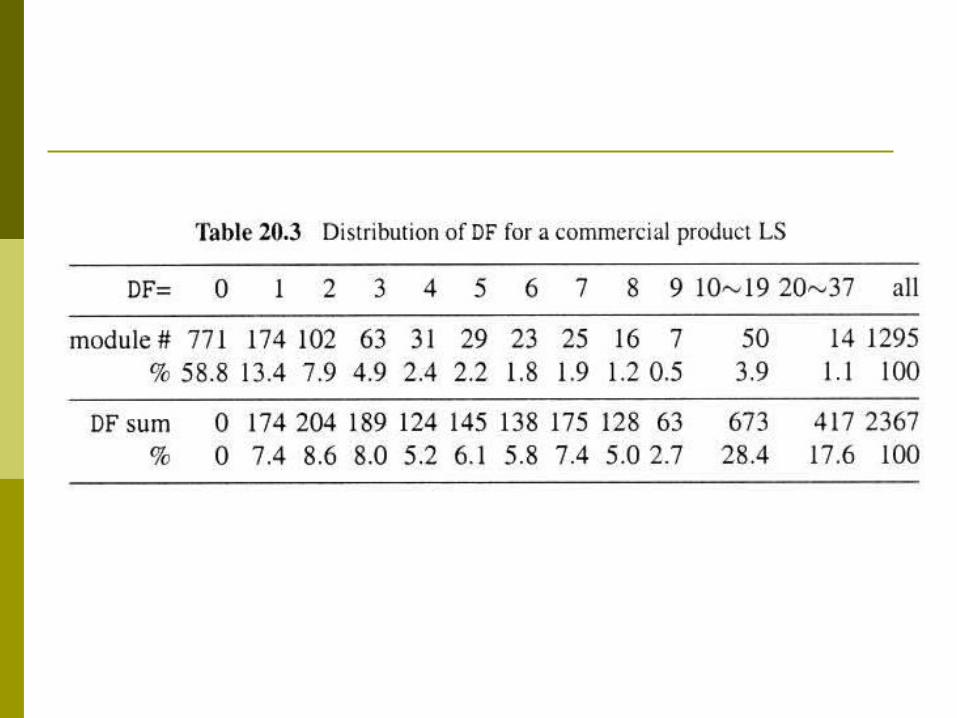
Common: by product areas sub-product/module/procedure/etc. IBM-LS: Table 20.3 (p.342) and IBM-NS: Table 20.4 (p.343) common pattern: skewed distribution
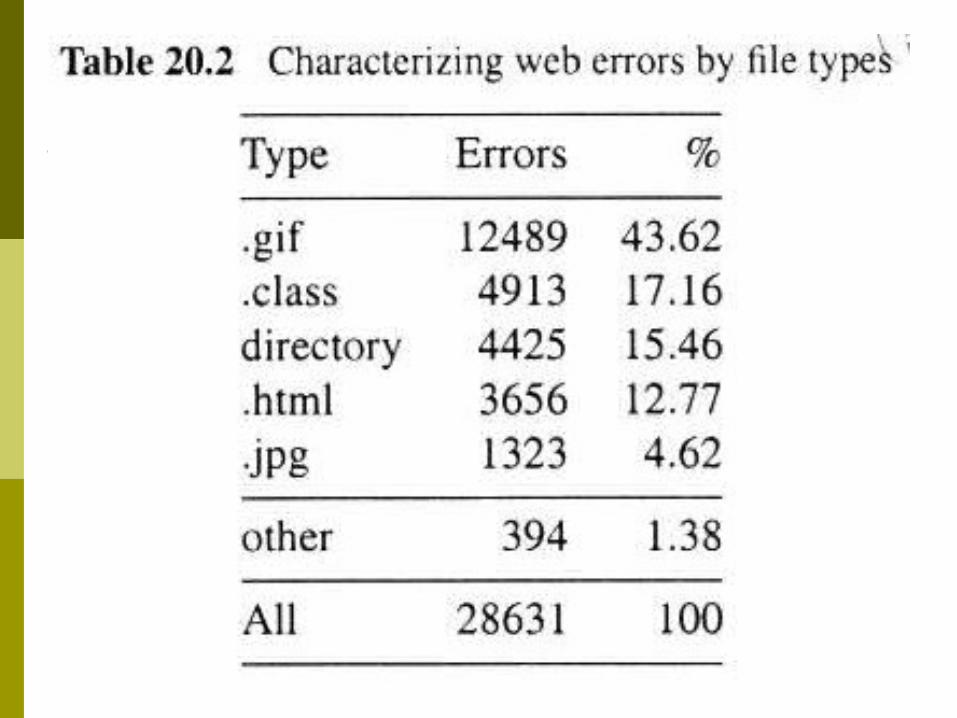
Extension: by other locators e.g., types of sources or code example of web error distribution Table 20.2 (p.342) by file type again, skewed distribution!
Distribution over other defect attributes: e.g. severity, fix type, functionality, usage scenarios, etc.
Defect Distribution Analysis Important observation:
Skewed distribution, or 80:20 rule => importance of risk identification for effective quality improvement
Early indicators needed! (Cannot wait after defect discoveries.)
Defect Trend Analysis Trend as a continuous function of time (or phases):
Similar to Putnam model (Ch.19), need precise time Other analysis related to SRE
defect / effort / reliability curves (Ch.22). Sometimes discrete analysis may be more meaningful (see
examples later).
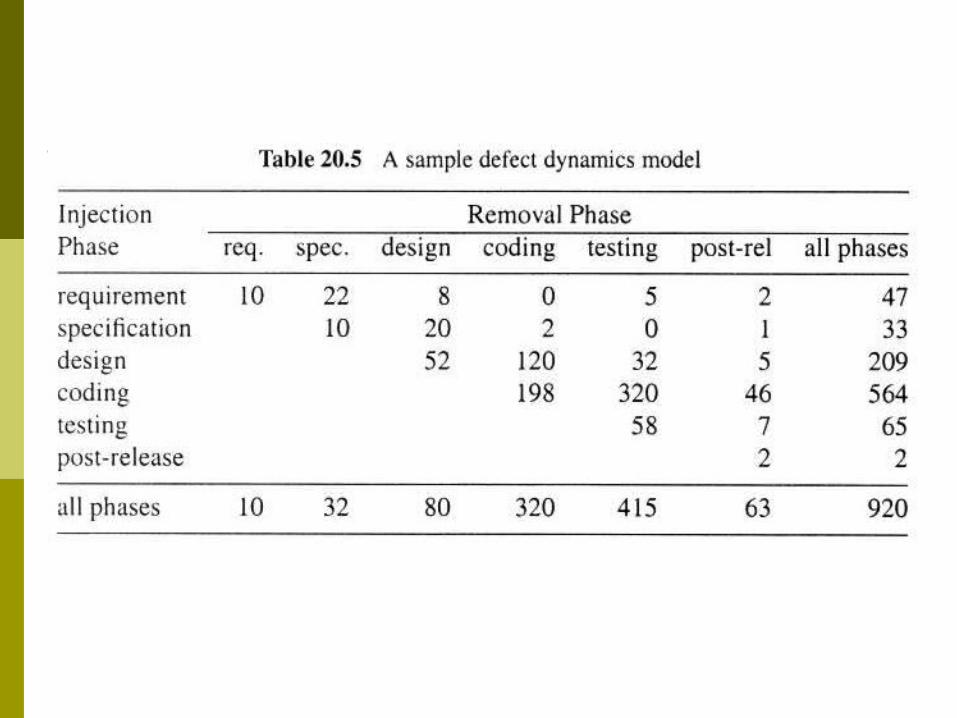
Defect dynamics model: Table 20.5 (p.344) Important variation to trend analysis. Defect categorized by phase. Discovery (already done). Analysis to identify injection phase (difficult) Focus out-of-phase/off-diagonal ones because of expense!
Defect Causal Analysis Defect causal analyses: Types
Causal relation identified: error-fault vs fault-failure works backwards
Techniques: statistical or logical.
Root cause analysis (logical): Human intensive. Good domain knowledge. Fault-failure: individual and common. Error-fault: project-wide effort focused on pervasive problems. Gilb inspection has a step called process brainstorming
Statistical causal analysis: ≈ risk identification techniques in Ch.21.
Orthogonal Defect Analysis (ODC): Overview Key elements of ODC
Aim: tracking/analysis/improve Approach: classification and analysis Key attributes of defects Views: both failure and fault Applicability: inspection and testing Analysis: attribute focusing Need for historical data
ODC: Why? Statistical defect models:
Quantitative and objective analyses. SRGMs (Ch.22), DRM (Ch.19), etc. Problems: accuracy & timeliness.
Causal (root cause) analyses: Qualitative but subjective analyses. Use in defect prevention.
ODC solution: Bridge the gap between the two. Systematic scheme used. Wide applicability.
ODC: Ideas Cause-effect relation by type:
Different types of faults. Causing different failures. Need defect classification. Multiple attributes for defects.
Good measurement: Orthogonality (independent view). Consistency across phases. Uniformity across products.
ODC process/implementation: Human classification. Analysis method and tools. Feedback results (and followup).
ODC: Theory Classification for cause-effect or views:
Cause/fault: type, trigger, etc. Effect/failure: severity, impact, etc. Additional causal-analysis-related: source, where/when
injected.
ODC Attributes: Effect/Failure-View Defect attribute data collected by testers at defect
discovery Defect trigger classes:
product specific black box in nature – may resemble test scenario classes pre/post-release triggers
Impact: e.g., IBM's CUPRIMDSO. Severity: low-high (e.g., 1-4). Detection time, etc.
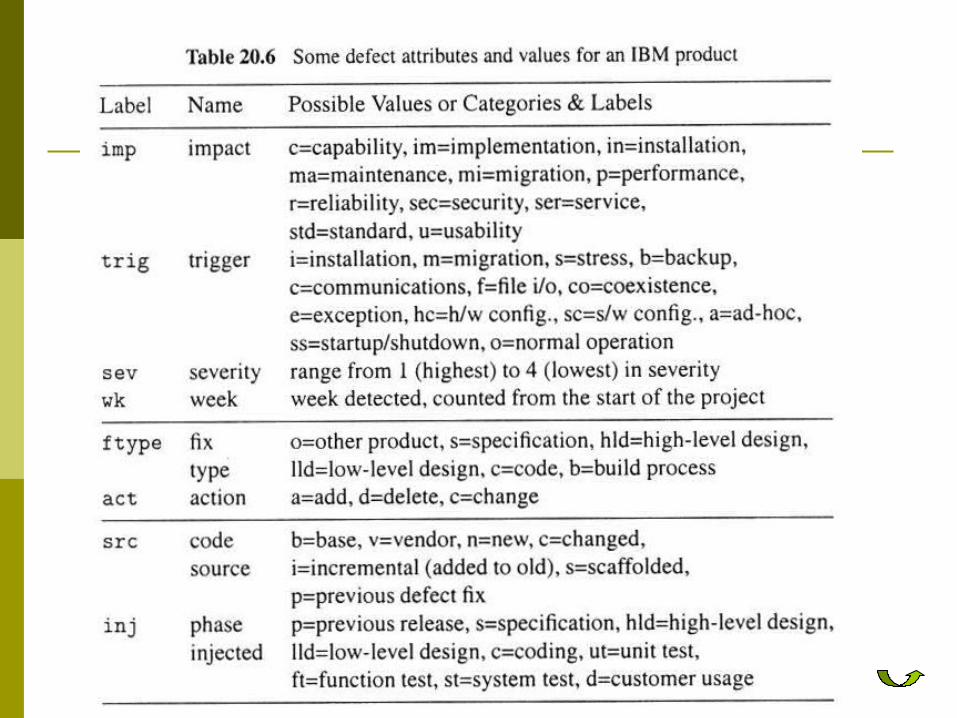
Concrete example: Table 20.6 (p.347)
ODC Attributes: Cause/Fault-View Defect attribute data collected by developers
(when locating, identifying and fixing the faults) Defect type
Associated with development process. Missing or incorrect. May be adapted for other products.
Action: add, delete, change. Number of lines changed, etc.
Concrete example: Table 20.6 (p.347)
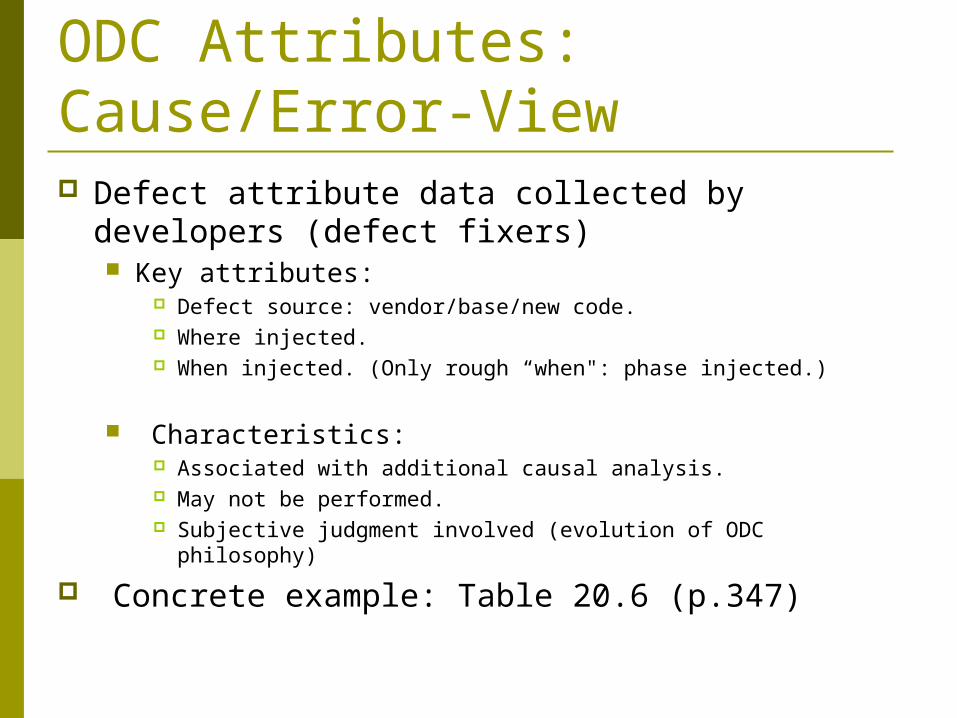
ODC Attributes: Cause/Error-View Defect attribute data collected by developers (defect
fixers) Key attributes:
Defect source: vendor/base/new code. Where injected. When injected. (Only rough “when": phase injected.)
Characteristics: Associated with additional causal analysis. May not be performed. Subjective judgment involved (evolution of ODC philosophy)
Concrete example: Table 20.6 (p.347)
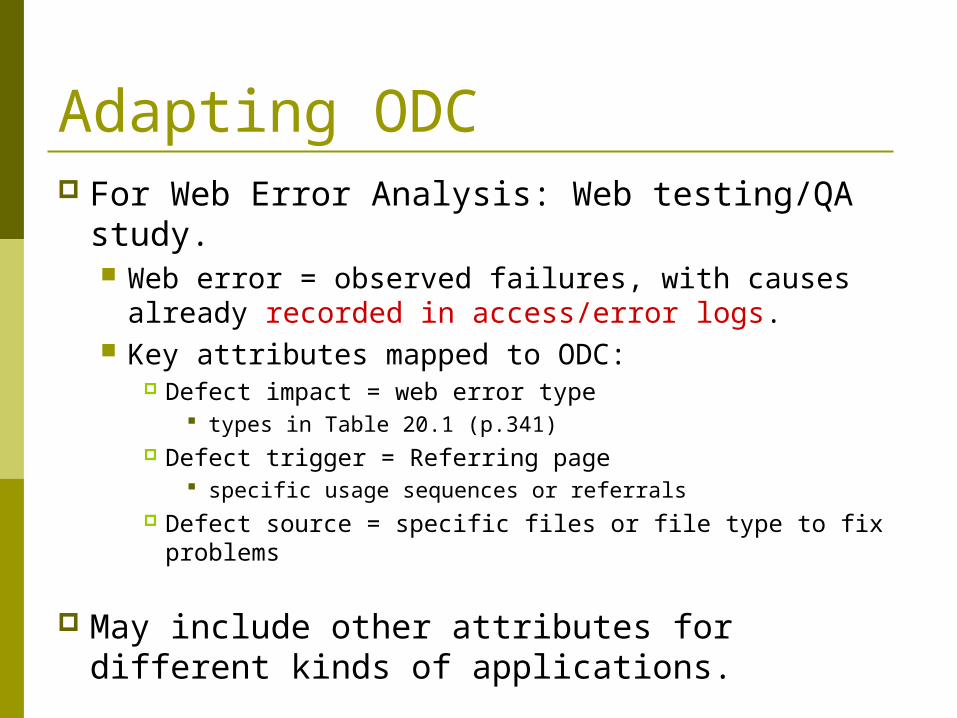
Adapting ODC For Web Error Analysis: Web testing/QA study.
Web error = observed failures, with causes already recorded in access/error logs.
Key attributes mapped to ODC: Defect impact = web error type
types in Table 20.1 (p.341) Defect trigger = Referring page
specific usage sequences or referrals Defect source = specific files or file type to fix problems
May include other attributes for different kinds of applications.
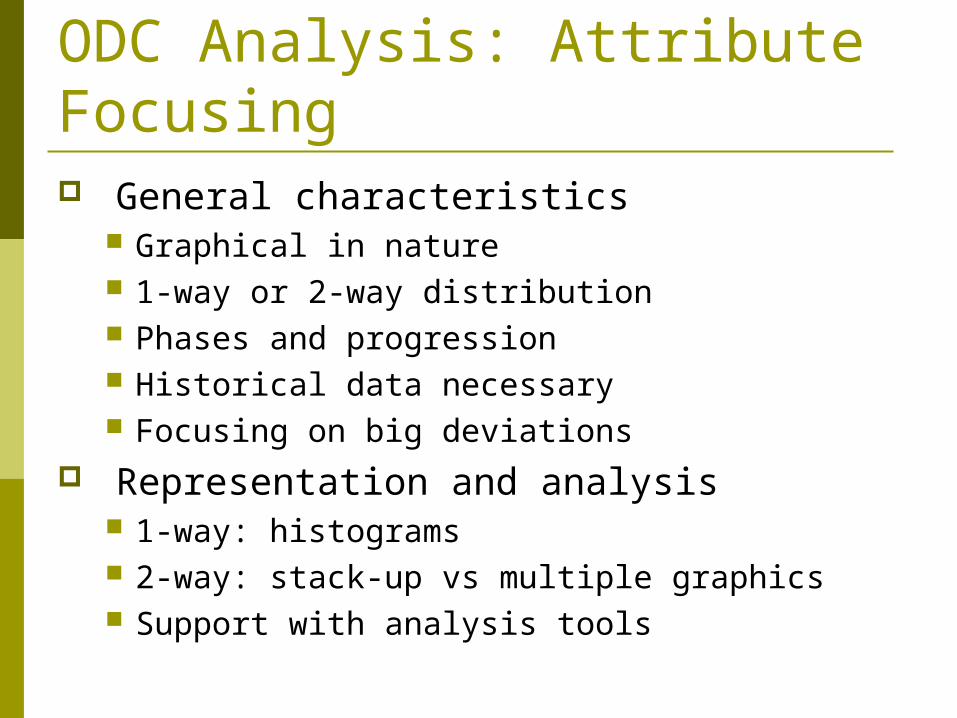
ODC Analysis: Attribute Focusing General characteristics
Graphical in nature 1-way or 2-way distribution Phases and progression Historical data necessary Focusing on big deviations
Representation and analysis 1-way: histograms 2-way: stack-up vs multiple graphics Support with analysis tools
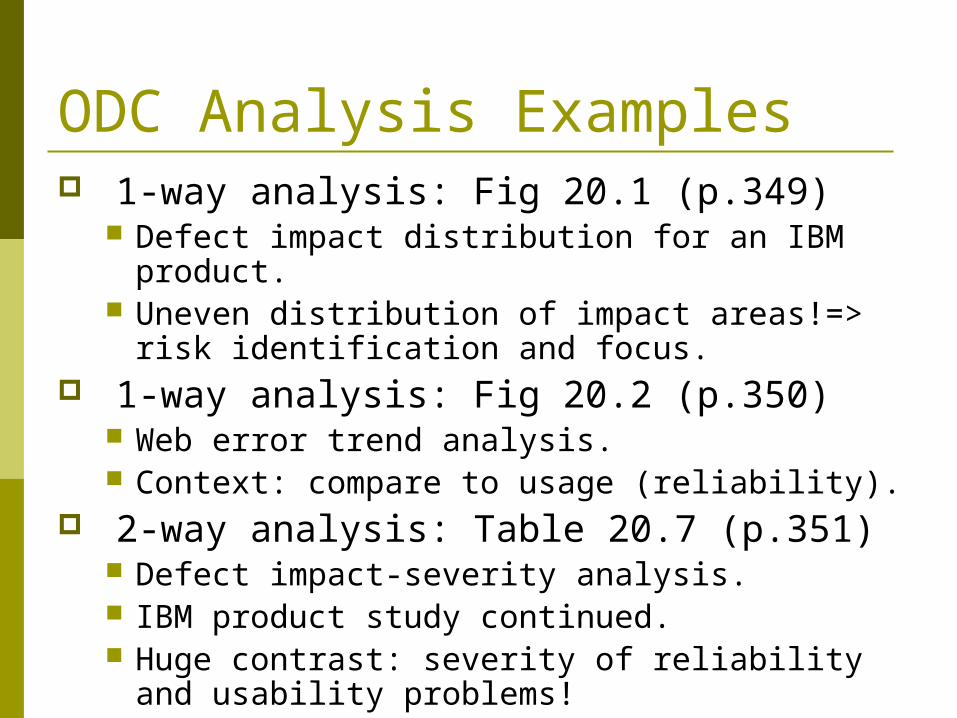
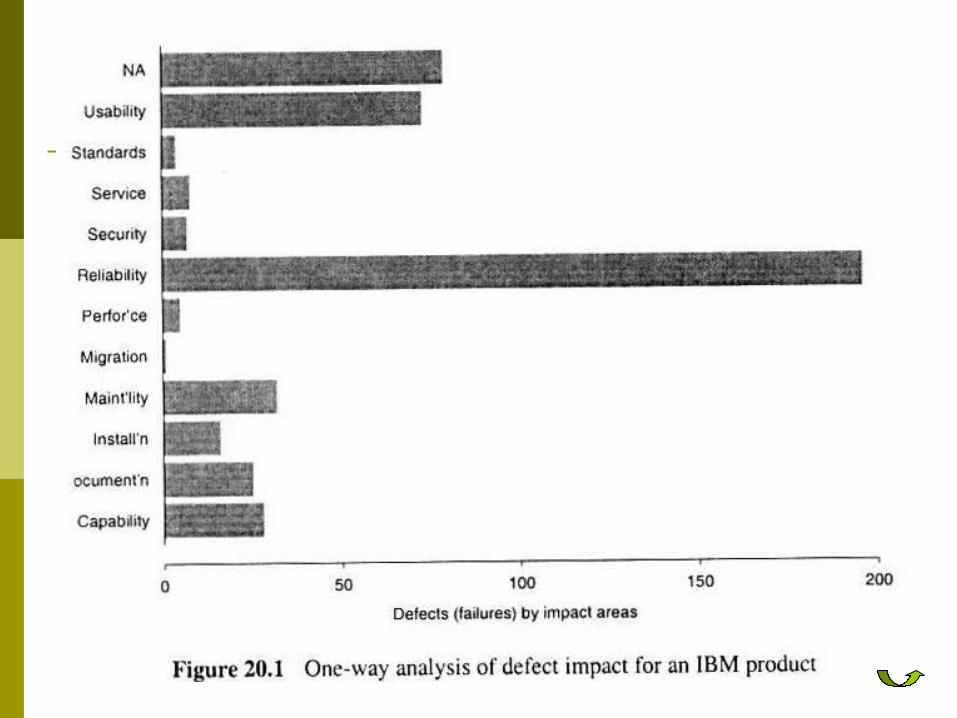
ODC Analysis Examples 1-way analysis: Fig 20.1 (p.349)
Defect impact distribution for an IBM product. Uneven distribution of impact areas!=> risk
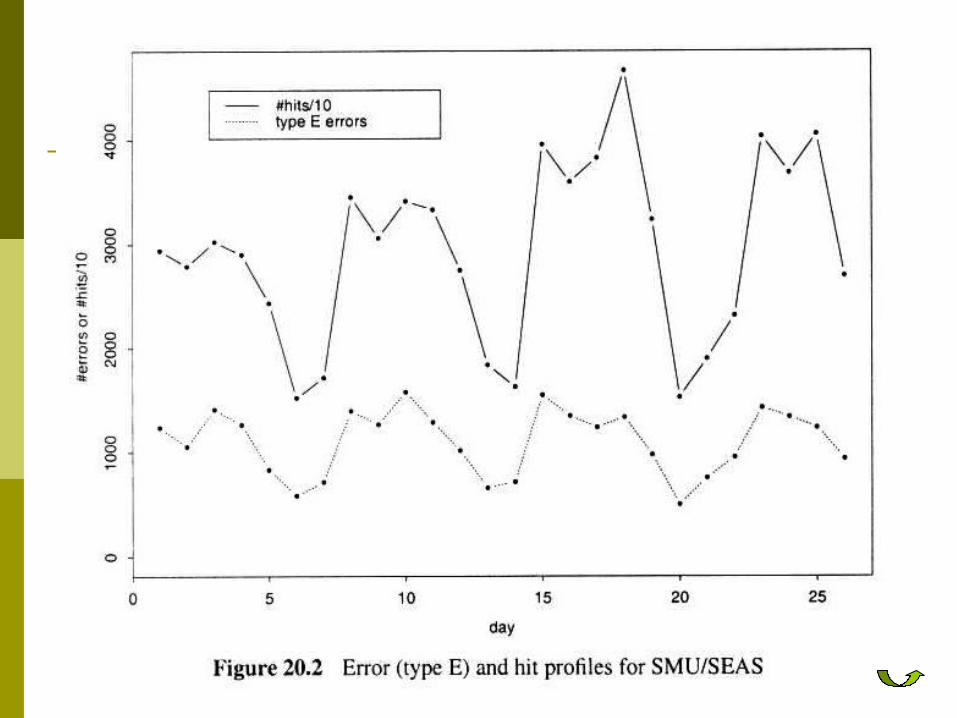
identification and focus. 1-way analysis: Fig 20.2 (p.350)
Web error trend analysis. Context: compare to usage (reliability).
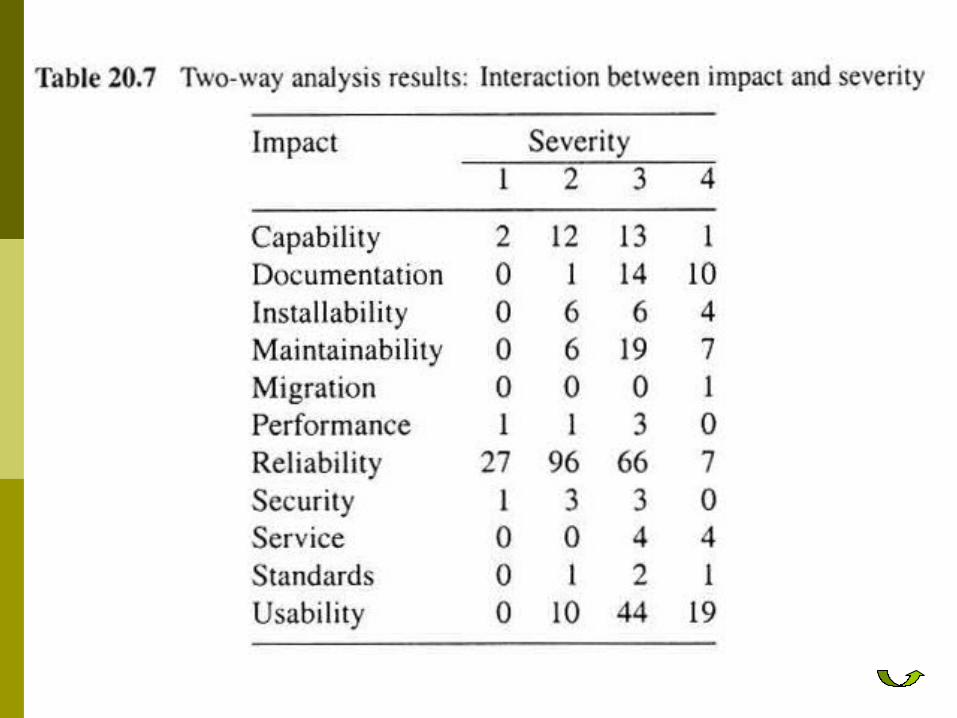
2-way analysis: Table 20.7 (p.351) Defect impact-severity analysis. IBM product study continued. Huge contrast: severity of reliability and usability
problems!
ODC Process and Implementation ODC process:
Human classification defect type: developers, defect trigger and effect: testers, other information: coordinator/other.
Tie to inspection/testing processes. Analysis: attribute focusing. Feedback results: graphical.
Implementation and deployment: Training of participants. Data capturing tools. Centralized analysis. Usage of analysis results.