Embed Size (px)
Citation preview
20-i
CHAPTER 20
NONGAME MAMMALS (Revised October 2013)
Nongame Mammal Program
TABLE OF CONTENTS
Nongame Mammals:
Introduction: ................................................................................................ 20-ii
Subchapter 20.1: Nongame Mammals Other Than Bats
Small Mammals: ................................................................................................ 20.1-1
Pygmy Rabbit: ................................................................................................ 20.1-6
Black-tailed and White-tailed Prairie Dog: ........................................................... 20.1-9
Northern Flying Squirrel: ...................................................................................... 20.1-12
Swift Fox: ................................................................................................ 20.1-13
Black-footed Ferret: .............................................................................................. 20.1-17
Wolverine: ................................................................................................ 20.1-23
Northern River Otter: ............................................................................................ 20.1-26
Canada Lynx: ................................................................................................ 20.1-28
Literature Cited: ................................................................................................ 20.1-32
Attachment 1: Mammal Observation Record Form ...................................... 20.1-40
Attachment 2: Voucher Specimen Tag ......................................................... 20.1-42
Attachment 3: Handling Form for Swift Fox ............................................... 20.1-43
Attachment 4: Spotlighting Record Form for Ferrets .................................... 20.1-44
Attachment 5: Equipment Set-up for Processing Ferrets ............................. 20.1-46
Attachment 6: Chemical Immobilization Form for Ferrets .......................... 20.1-50
Attachment 7: Blood Collection for Ferrets ................................................. 20.1-51
Attachment 8: Gait and Snow Tracks for Wolverine ................................... 20.1-52
Attachment 9: Examples of Survey Form for Wolverines ........................... 20.1-54
Attachment 10: Chemical Immobilization Form for Lynx ............................. 20.1-55
Subchapter 20.2: Bats (Order Chiroptera: Families Vespertilionidae and Molossidae)
Introduction: ................................................................................................ 20.2-1
Survey Techniques: ............................................................................................... 20.2-3
Immobilization, Handling, and Marking: ............................................................. 20.2-12
Assessment of Age, Sex, and Reproductive Status: .............................................. 20.2-15
Collection of Biological Samples: ......................................................................... 20.2-16
Euthanasia: ................................................................................................ 20.2-17
Human-Bat Interactions: ........................................................................................ 20.2-18
Diseases: ................................................................................................ 20.2-21
Literature Cited: ................................................................................................ 20.2-21
Attachment 11: Acoustic Form ....................................................................... 20.2-25

20-ii
Attachment 12: Acoustic and Netting Capture Form ..................................... 20.2-26
Attachment 13: Interior Roost Survey Form .................................................. 20.2-30
Attachment 14: Exterior Roost Form ............................................................. 20.2-32
Attachment 15: Exit Count Survey Form ....................................................... 20.2-33
Attachment 16: Roost Capture Form ............................................................... 20.2-34
Attachment 17: Bat-Occupied Building Contact Form .................................. 20.2-36
Attachment 18: Dichotomous Key to the Bats of Wyoming ........................... 20.2-37

20-ii
Introduction
Nichole Cudworth, Becky L. Abel, and Martin B. Grenier
Of the 121 mammal species recognized in Wyoming, the Wyoming Game and Fish Department
(WGFD) classifies 85 as nongame, including 43 Species of Greatest Conservation Need (SGCN; WGFD
2010, Orabona et al. 2012). Our ability to conserve nongame wildlife is enhanced by improving
knowledge of these species’ abundance and distribution (Oakleaf et al. 1996, WGFD 2010).
Anthropogenic and natural habitat alterations (e.g., energy development, climate change, etc.), invasive
species, and changes in land management practices all have the potential to impact populations of
nongame mammals. Data obtained from standardized surveys are necessary to address these
conservation challenges. The WGFD’s Nongame Program also relies on standardized survey data to
monitor populations and assess species’ status in relation to objectives outlined by the State Wildlife
Action Plan (WGFD 2010). Other uses include improving predictive distribution models, establishing
programmatic priorities, documenting environmental reviews, assisting planning efforts, and responding
to potential listings under the Endangered Species Act. All mammal observations, especially of SGCN
with Native Species Status 4 or less, are potentially useful and should be recorded (Orabona et al. 2012,
WGFD 2010). Record all sightings in the Wildlife Observation System (WOS) and submit a mammal
observation record form to the Nongame Mammal Biologist at the Wyoming Game and Fish
Department (WGFD) Lander Regional Office (refer to Attachment 1).
This chapter describes common survey techniques used to conduct inventories, document species
presence, and estimate abundance or species richness of nongame mammals, and reflects the preferred
or alternative techniques that should be used by WGFD personnel. The chapter is organized according
to species or, where appropriate, major taxonomic group. Survey techniques for most mammals are
covered in Subchapter 20.1; survey techniques for bats are described in Subchapter 20.2. In addition to
survey techniques, each section addresses immobilization, handling, and marking methods;
determination of sex and age; collection of biological samples; and common infectious diseases. We
also discuss types of data that should be collected, basic analytical procedures, and handling and
dissemination of information. We do not, however, provide direction on rigorous statistical design and
analysis. For additional information and guidance, contact the Nongame Mammal Biologist at the
WGFD Lander Regional Office.
20.1-1
Subchapter 20.1
Nongame Mammals Other Than Bats
Nichole Cudworth, Laurie Van Fleet, David Wilckens, and Martin B. Grenier
I. SMALL MAMMALS (Families Soricidae, Talpidae, Sciuridae, Geomyidae, Heteromyidae,
Cricetidae, Muridae, and Zapodidae) –
A. Survey Techniques –
1. Trapping Transects –
a. Rationale – Small mammals must be captured to reliably identify species
and individuals, and to obtain morphometric measurements, demographic
data, and biological samples. Individuals may also be marked with
passive integrated transponder [PIT] tags or ear tags for unique
identification and to estimate abundance. Transects are the simplest trap
setup for basic inventories and to assess community assemblages;
however, trapping grids are better suited to assess relative and absolute
abundance (refer to Section I.A.2; Jones et al. 1996).
b. Application – Transects should be at least 150 m long with traps spaced
every 10 m. Set at least 2 traps per trapping station. Depending on the
goal of the project and anticipated species assemblage, use a mixture of
live box traps (such as Sherman or Tomahawk), Museum Special mouse
or rat snap traps, and pitfall traps. Pitfall traps are used to collect shrews
and other mammals weighing under 10 g, and work best if set in
conjunction with drift fences that funnel passing animals into the traps.
Supply all live traps with sufficient bait consisting of small grains, seeds,
or oats mixed with peanut butter. Place poly fill bedding in each trap to
sustain individuals until traps are checked. Set traps along habitat
features, such as logs, trees, rocks, shrubs, runways, and burrows
whenever possible. To increase probability of catching habitat specialists
such as jumping mice (Zapus spp.), place transects along landscape
features, such as riparian corridors where these species are more likely to
be caught (USFWS 2004, Thompson 2011). Check all traps twice daily,
preferably mid-morning and mid-afternoon, to document both diurnal and
nocturnal species. Plan at least 500 trap nights per trapping session for
preliminary inventories (refer to Section I.A.1.c; Jones et al. 1996).
Capturing fossorial mammals such as moles (Family Talpidae) and pocket
gophers (Family Geomyidae) may require specialized traps and methods
(Baker and Williams 1972, Jones et al. 1996, Griscom et al. 2010).

20.1-2
c. Analysis of Data – Report total number of trap nights, number of species
captured, number of individuals of each species captured per trap night,
and minimum number alive (MNA) for each species. Trap nights are
defined as the number of traps multiplied by number of nights the traps
were set during a given trapping session. Traps that were triggered but
failed to capture an individual are recorded as ½ trap night each; all other
traps, including traps with captures, are recorded as full trap nights. MNA
is defined as number of unique individuals of each species captured during
an entire trapping session (Krebs 1966).
d. Disposition of Data – Send a report containing trapping records and
associated data to the Nongame Mammal Biologist at the WGFD Lander
Regional Office. The Nongame Program will incorporate data into the
Threatened, Endangered, and Nongame Bird and Mammal Investigations
annual completion report. Data will also be used to update wildlife
distribution maps and databases, including the WGFD’s Wildlife
Observation System and Atlas of Birds, Mammals, Amphibians, and
Reptiles in Wyoming.
2. Trapping Grids –
a. Rationale – Rational is similar to that provided for transects (Refer to
Section I.A.1.a.). Trapping grids can be deployed in conjunction with
mark-recapture techniques to estimate density and abundance (Parmenter
et al. 2003).
b. Application – The application of trapping grids is identical to that of
transects except traps are arrayed in a square grid instead of a linear
transect (refer to Section I.A.1). Each grid is comprised of a 10 × 10 or
larger array of trapping stations, with ≥ 2 traps placed every 10 m (Jones
et al. 1996). Captured individuals must be marked prior to release to
estimate recapture rates and abundance (refer to Section I.B). Record each
capture location within the grid if data will be used to estimate density.
c. Analysis of Data – Report total number of trap nights, number of species
captured, number of individuals of each species caught per trap night, and
MNA for each species (refer to Section I.A.1.c). If conducting a mark-
recapture study, report locations of each capture as well as the following
statistics for each species (Chao and Huggins 2005:25):
Number of trap nights (k)
Number of individuals captured each trap night (nj)
Number of unmarked individuals captured each trap night (uj)
Number of marked individuals captured each trap night (mj)
Minimum number of individuals alive and marked prior to each
trap night (Mj; refer to Section I.A.1.c)

20.1-3
Numbers of individuals captured based on frequency of capture,
i.e., 1, 2,..., k times (fj)
d. Disposition of Data – Send a report containing capture records and
associated data (refer to Sections I.A.1.c and I.A.2.c) to the Nongame
Mammal Biologist at the WGFD Lander Regional Office (refer to Section
I.A.1.d).
B. Immobilization, Handling, and Marking –
1. Rationale – Small mammals must be handled or collected as voucher specimens
to reliably identify species (Reynolds et al. 1996). In order to calculate relative or
absolute abundance, individuals must be handled and marked prior to release.
2. Application – Most handling and marking procedures can be accomplished with a
re-sealable plastic or cloth handling bag. When it is necessary to chemically
immobilize small mammals, for example to insert a PIT tag, use a cotton ball
soaked in isoflurane. Enclose the animal and the cotton ball in an airtight
container and monitor breathing. Smaller species can be transferred directly to a
re-sealable plastic bag containing cotton balls. Limit isoflurane exposure to the
time necessary to achieve immobilization, as prolonged exposure can lead to
mortality. Individuals are properly immobilized when they display deep, regular
breathing; lack of whisker movement; total body relaxation; and lack of response
to external stimuli (Anstee and Needham 1998). Release individuals only after
they display normal activity and movement.
Upon initial capture, transfer smaller species to a plastic Ziploc bag. Use one
hand to immobilize individuals at the bottom of the bag. Slide your other hand
inside the re-sealable plastic bag, grip the individual by the nape of the neck, and
remove the individual from the bag. Identify species; record morphometric
measurements; and determine sex, age, and reproductive status (refer to Section
I.C). Use cloth handling cones to process larger species such as squirrels
(Koprowski 2002).
Morphometric measurements are commonly used to identify species of small
mammals. Record the following measurements for all captured individuals: total
body length from tip of nose to tip of tail; tail length from base of tail to tip of tail;
hind foot length from heel of foot to end of longest nail; ear length from base of
ear to tip of ear; and weight.
To avoid recounting individuals, mark each captured animal by affixing
numbered ear tags prior to release. Alternatively, use colored dye for short-term
marking. PIT tags are a reliable method for long-term marking. Implant PIT tags
subcutaneously in the scruff of the neck between the shoulder blades. Apply skin
glue to close puncture holes when necessary to speed healing and prevent PIT
tags from being excreted (Gannon et al. 2007).

20.1-4
Individuals must be euthanized if they will be collected as voucher specimens or
are seriously injured during trapping. Individuals weighing over 200 g are
euthanized with an overdose of isoflurane. Individuals weighing less than 200 g
can be euthanized with an overdose of isoflurane, or chemical immobilization
followed by cervical dislocation (Mills et al. 1995, AVMA 2007).
3. Analysis of Data – Report the number of individuals of each species caught and
information on sex, age, and morphometric measurements (refer to Section I.C).
Report unique identification numbers, including ear tags and PIT tags assigned to
each individual. If collecting voucher specimens or in the event of mortality,
record pertinent information, affix a voucher specimen tag (refer to Attachment
2), and freeze the specimen (Gannon et al. 2007).
4. Disposition of Data – Send a report containing capture records and associated data
to the Nongame Mammal Biologist at the WGFD Lander Regional Office (refer
to Section I.A.1.d). Also note any trapping-related mortalities or voucher
specimens collected.
C. Assessment of Sex and Age – Sex and age of small mammals, especially insectivores,
are often difficult to determine. Body size and weight of males and females
commonly overlap and are often poor characteristics for determining sex. During the
breeding season, most males can be distinguished by descended testes. During the
nonbreeding season, testes often retract into the abdominal cavity and different
characteristics must be used. In rodents, the anal-genital distance of males is greater
than that of than females. In insectivores, males and females can be distinguished by
the number of openings in the perineal region – males have 2 openings, and females
have 3 openings. The presence of nipples can also be used to identify females, but
these may not always be readily evident, especially if the female has not yet
reproduced. Males of some species can also be distinguished by presence of scent
glands (Kunz et al. 1996b).
Ages of small mammals are commonly classified according to categories rather than
specific ages. Weight is a poor predictor of age. Some species exhibit distinct molt
patterns on which age estimates up to adulthood can be based. Juveniles often have
fur that is darker, longer, duller, and less dense than adult fur (Kunz et al. 1996b).
Generally, small mammals are classified as juvenile or adult, often based on the timing
of trapping in relation to the reproductive season.
D. Collection of Biological Samples –
1. Rationale – Biological samples may be needed to distinguish among individuals
and species, or for diseases surveillance. Blood, tissue, or hair samples are
typically collected. Disease analyses are based on blood samples, whereas all
biological samples can be used for genetic analyses. In particular, the Preble’s
meadow jumping mouse (Z. hudsonius preblei), is distinguishable from the

20.1-5
sympatric western jumping mouse (Z. princeps) only through genetic analyses
(King et al. 2006).
2. Application – The preferred method of collecting blood from individuals
weighing less than 100 g is to perforate the submandibular area with a lancet
point. After the individual has been chemically immobilized, (refer to Section
I.B.2), locate the back of the jaw bone. Insert a 5.5-mm lancet point (Golden Rod
Animal Lancet, Medipoint Inc., Mineola, NY) into the vascular bundle located at
the rear of the jaw bone. Collect blood into small vial. After collection is
completed, apply a clean compress with slight pressure to the wound to stop
bleeding. Release the individual after it has resumed normal activity. Most
species will self-groom and clean the wound area after release. Although drawing
blood has little effect on survival, special techniques may be required to obtain
samples from some species, including voles (Microtus spp.) and pocket mice
(Perognathus spp.; Frase et al. 1990, Swann et al. 1997). Blood can also be
collected for genetic sampling by pressing an FTA card to the wound created by
an ear punch or tail snip (Thompson et al. 2011).
Use a 2-mm diameter ear punch to collect tissue samples from the external pinna
of the ear. Disinfect the ear punch with 10% bleach solution to avoid cross-
contamination between samples (Thompson et al. 2011). To sample species
lacking external pinna, use canine nail clippers to cut a 1–2 mm segment from the
tip of the tail. Apply an antibiotic cream to the wound when necessary (Antolin et
al. 2001, Castro-Arellano 2005). Store tissue samples in individually labeled, 2.5-
ml vials containing enough 95% ethyl alcohol to keep the tissue suspended.
3. Analysis of Data – After analyses are completed, report results from each
individual. Prior to beginning surveys, contact appropriate laboratories to obtain
direction regarding proper storage and shipping protocol and to ensure timely
completion of analyses. Biological samples collected for disease testing are sent
to the WGFD Veterinary Laboratory in Laramie. Samples collected for genetic
analyses must be sent to a qualified, independent laboratory.
4. Disposition of Data – Forward a report containing capture records and disease or
genetic results to the Nongame Mammal Biologist at the WGFD Lander Regional
Office (refer to Section I.A.1.d).
E. Diseases – Hantavirus pulmonary syndrome (HPS) is the primary human health hazard
associated with trapping and handling small mammals, especially deer mice
(Peromyscus maniculatus) and other rodents. Although HPS has little effect on small
mammal populations, it can be deadly to humans. Only handle rodents in open air and
hold the specimen and trap downwind. Wear masks, eye protection, and latex or
nitrile gloves to minimize exposure to bites, scratches, and HPS. Disinfect all traps
with a 10% solution of bleach and water after each trapping session and before they
are transported in an enclosed vehicle (Mills et al. 1995, Kunz et al. 1996a, Mills and
Childs 2001, Kelt et al. 2010).

20.1-6
PYGMY RABBIT (Sylvilagus idahoensis) –
F. Survey Techniques –
1. Presence –
a. Rationale – Presence of pygmy rabbits is readily detected through
noninvasive survey techniques. Such surveys should be used when it is
not necessary to collect population parameters.
b. Application – Searches for pygmy rabbit sign (i.e., burrows, runways,
recently deposited fecal pellets) can be conducted year-round. However,
searches in winter (> 2.5 cm of snow cover) tend to maximize return on
effort (Green and Flinders 1980, Katzner 1994, Thimmayya 2010). At
other times of year, identifying pellets of pygmy rabbits becomes
problematic because pellets of juvenile cottontails (Sylvilagus spp.)
overlap in size. In addition, detection probabilities can be low because
pellets are cryptic and easily overlooked.
Search suitable habitats (i.e., sagebrush with more than 46% cover that is
over 56 cm in height) for sign of pygmy rabbits for 30 minutes or until
species is detected, whichever occurs first. Burrows are approximately
10-12 cm in diameter and located at the base of shrubs. Runways are
formed in high use areas and result from compaction of snow. Fecal
pellets are round, approximately 5 mm in diameter, and generally appear
in small clusters of about a dozen or more.
c. Analysis of Data – Record location and type of sign at every site where
pygmy rabbit sign is observed.
d. Disposition of Data – Send a report containing locations of observations
and associated data to the Nongame Mammal Biologist at the WGFD
Lander Regional Office (refer to Section I.A.1.d).
2. Live Capture –
a. Rationale – Pygmy rabbits are captured to obtain morphometric and
demographic information, and to collect biological samples. Individuals
may also be marked with PIT tags or ear tags for unique identification.
Capture surveys may be combined with mark-recapture studies to estimate
population size, survival rates, and to compare relative abundance among
sites.
b. Application – Although pygmy rabbits can be captured all seasons,
trapping is most effective during winter (Thimmayya 2010). To maximize

20.1-7
success, personnel should familiarize themselves with sign of pygmy
rabbits (refer to Section II.A.1). Use Tomahawk collapsible single-door
(Model #202) or double-door (Model #206) traps to capture pygmy
rabbits. Place unbaited, double-door traps in runways. Place single-door
traps near burrow entrances and at the base of shrubs where fecal pellets
are observed. Leave traps open day and night and check once daily.
Trapping success during summer months may be increased by using
canned green beans as bait (Larrucea and Brussard 2007). Cover traps
with 4-mil plastic in winter and burlap during other seasons to provide
thermal cover.
c. Analysis of Data – Report total number of trap nights, number of
individuals caught per trap night, and MNA for each area trapped (refer to
Section I.A.1.c). If conducting a mark-recapture analysis, also report
location and descriptive statistics from each capture (refer to Section
I.A.2.c).
d. Disposition of Data – Send a report containing locations of traps and
associated capture data to the Nongame Mammal Biologist at the WGFD
Lander Regional Office (refer to Section I.A.1.d).
G. Immobilization, Handling, and Marking –
1. Rationale – Pygmy rabbits must be handled for marking, determination of sex,
and to collect biological samples. In order to calculate relative or absolute
abundance, individuals must be uniquely marked prior to release.
2. Application – Immobilization can be accomplished by physical restraint and a
cloth handling cone (Koprowski 2002). Chemical immobilization is generally not
required to handle and mark pygmy rabbits.
Use a cloth handling cone to facilitate handling of captured rabbits. A general
technique for carrying pygmy rabbits is to fold your arm across your sternum,
grasp the individual by the scruff of the neck with your other hand, and tuck its
head in the crook of the folded arm so the feet and body are supported by your
hand. Ventral cradling is a similar method except the hind feet are held with your
fingers.
Record the following morphometric measurements: weight; ear length from base
of ear to tip of ear; length of each hind foot from heal to tip of foot, excluding
nail; and total body length from tip of nose to tip of tail along contour of the back.
Use PIT tags for long-term identification. Implant PIT tags subcutaneously in the
scruff of the neck between the shoulder blades (refer to Section I.B.2.paragraph
4). Ear tags can also be used to mark individuals.

20.1-8
Any rabbits seriously injured during trapping should be euthanized by lethal
injection. Use isoflurane to anesthetize the individual and inject 2-3 cc of
potassium chloride directly into the heart (T. Kreeger, WGFD Veterinarian,
personal communication). After the rabbit is euthanized, record pertinent
information, affix a voucher specimen tag (refer to Attachment 2), and freeze the
specimen.
3. Analysis of Data – Report number of individuals caught and information on sex,
age, and morphometric measurements if collected (refer to Section II.C). Report
unique identification numbers including ear and PIT tag numbers, from all
marked individuals.
4. Disposition of Data – Send a report containing capture records and associated data
to the Nongame Mammal Biologist at the WGFD Lander Regional Office (refer
to Section I.A.1.d). Also note any trapping-related mortalities
H. Assessment of Sex and Age – Sex of pygmy rabbits can easily be determined. Cradle
the individual in one hand, ventral side up, with head facing away. Place your index
and middle fingers on either side of the vent area just in front of the anus and press
down gently. Females will display a slit or central line running vertically. Both sides
of the slit will be pink. Adult males will display a penis that looks like a pink tube
with a pointed end that resembles a bullet. Juvenile males will display a slit with
white sides.
Age determination is difficult in all lagomorphs. Typically, individuals are classified
as either juvenile or adult; however, juveniles grow quickly and generally resemble
adults in size and weight by around 80 days of age. When it is possible to determine
age based on body size and weight, classify young of the year are as juveniles and all
others as adults.
I. Collection of Biological Samples –
1. Rationale – Biological samples may be needed to distinguish among individuals
or species. This typically involves collection of blood, tissue, and fecal samples.
Disease analyses are based on blood samples, whereas all biological samples can
be used for genetic analyses.
2. Application – The simplest method for bleeding rabbits is by venipuncture of the
marginal or central ear artery, although this commonly results in hematoma or
bruising (Mader 2004). However, this method can easily be performed without
chemical immobilization or shaving. It may help to have an assistant restrain
individuals. Begin by cleaning the ear with alcohol, then warm the ear by
wrapping in a warm cloth. Use a 25- or 27-gauge needle without a syringe to
puncture the vessel; syringes or vacuum tubes generally collapse the artery.
Allow blood to drip from the hub of the needle, and collect blood in a collection
tube. For standard disease analysis, place blood into a red-top collection tube.

20.1-9
For genetic and other analyses, place blood into a purple-top collection tube.
Label each collection tube with date, age, sex, and unique identification number.
Keep blood containers in a cooler with ice. After blood is collected, apply
pressure on the puncture site until the wound stops bleeding.
Techniques for collection of tissue and genetic samples are similar to those
described for small mammals (refer to Section I.D.2, paragraph 2).
3. Analysis of Data –Within 72 hours, send biological samples to a genetic
laboratory or the Wildlife Veterinary Laboratory in Laramie for genetic and
disease analyses, respectively (refer to Section I.D.4). After analyses are
completed, report results from each captured individual.
4. Disposition of Data –Send a report containing capture records and disease or
genetic results to the Nongame Mammal Biologist at the WGFD Lander Regional
Office (refer to Section I.A.1.d).
J. Diseases – Pygmy rabbits are believed susceptible to the common diseases that affect
other rabbits and hares (Family Leporidae), including Colorado tick fever, equine
encephalitis, botfly infestations, papillomas, and tularemia (a.k.a., rabbit fever; Mörner
and Addison 2001, Williams and Barker 2001). Unlike other Leporides, pygmy rabbit
populations are not known to be cyclical or irruptive, and these diseases likely do not
present significant threats to populations. Although major human health risks from
handling pygmy rabbits are not known, rabbits often carry relatively high flea loads;
consequently, we recommend using DEET-based insect repellent as a precautionary
measure.
II. BLACK-TAILED AND WHITE-TAILED PRAIRIE DOG (Cynomys ludovicianus and C.
leucurus) –
A. Survey Techniques –
1. Ground Mapping –
a. Rationale – Ground surveys are conducted to delineate the spatial extent
of colony boundaries. Ground mapping provides an alternative technique
to evaluate changes in distribution of prairie dog colonies and occupied
area when counts of individuals or mark-recapture sampling are not
feasible (Biggins et al. 1993, McDonald et al. 2011).
a. Application – Conduct surveys during summer months, preferably during
the green-up period from May–July. To map colonies, circumnavigate the
colony by walking from active burrow to active burrow along the outer
periphery of each colony, and record UTM coordinates with a GPS unit
every 5 m. Active burrows have openings over 7 cm dia., display
evidence of use by prairie dogs such as fresh feces within 5 m, and are free
20.1-10
from obstructions, including clumps of dirt, vegetation, or spider webs.
Exclude inactive burrows and burrows of other species when mapping
prairie dog colonies. Black-tailed prairie dogs are unique in that colony
boundaries are marked by a noticeable “clip line” where vegetation tends
to be much shorter between active burrows and areas not used by prairie
dogs. Stop recording locations once you have returned to the start point.
Colonies are considered separate if the distance between active burrows is
≥ 200 m (Grenier et al. 2009b). Because prairie dog colonies are dynamic,
we recommend surveys every 3 yrs to adjust boundaries and assess
changes in distribution (McDonald et al. 2011).
b. Analysis of Data – Import waypoints into ArcGIS (Esri, Inc., Redlands,
CA) and digitally connect them to create a polygon shapefile. Complexes
and subcomplexes are defined based on proximity of colonies. The
criterion for delineating a prairie dog complex is the maximum distance a
black-footed ferret (Mustela nigripes) will move in a night (a.k.a., the 7-
km rule; Biggins et al. 1993). Accordingly, a complex is a group of
prairie dog colonies in which the distance between colonies is ≤ 7 km. To
determine whether individual colonies form a complex, draw a 3.5-km
buffer around the exterior boundary of each colony; colonies with
overlapping 3.5-km buffers constitute a complex. Recent research,
however, has shown that ferrets most commonly move between colonies
less than 1.5 km apart, and these are defined as a subcomplex (Biggins et
al. 2004). Subcomplexes are determined by drawing 0.75-km buffers
around each colony; colonies with overlapping 0.75-km buffers constitute
a subcomplex. Size of a complex or subcomplex is determined by adding
the total area (in ha) of colonies within the complex or subcomplex
excluding interstitial spaces between colonies.
c. Disposition of Data – Send a report containing colony inventories and
digital information to the Nongame Mammal Biologist at the WGFD
Lander Regional Office (refer to Section I.A.1.d). Provide final shapefiles
and report number of colonies and size (ha) of each colony, subcomplex,
and complex.
2. Aerial Surveys –
a. Rationale – Aerial surveys can be flown over larger areas to determine
presence and status of prairie dog colonies, although ground mapping is
preferred to delineate colony boundaries (refer to Section III.A.1;
Cudworth et al. 2012).
b. Application – Prairie dog colonies are easy to detect from the air.
Locations of interest can be systematically searched, or incidental
observations can be recorded during aerial surveys for other species.
Conduct aerial surveys from a fixed-wing aircraft (e.g., Cessna 180, 210,
20.1-11
or SuperCub) flying approximately 150 m above ground level at a speed
of 160 km per hr. Surveys should be flown during or shortly after spring
green-up (typically mid-May through mid-Jul) to maximize detection
rates. If the objective is to delineate boundaries, record locations of
colonies with a GPS unit and return to the area on foot to map the colony
(refer to Section III.A.1). Status of black-tailed prairie dog colonies is
easily determined from the air. However, status of white-tailed prairie dog
colonies can only be assessed from the ground (Cudworth et al. 2012).
Colonies are classified as active if the following conditions are noted
throughout at least 50% of the colony: recent excavation within and
around most mounds, unobstructed burrow entrances, and vegetation
absent from mounds. Inactive colonies do not meet the 50% criterion, and
mounds will often appear old and ‘crusty’ or dilapidated (Grenier et al.
2004).
c. Analysis of Data – Record location and status of all observed colonies.
d. Disposition of Data – Send a report containing colony locations, status
information, and flight paths to the Nongame Mammal Biologist at the
WGFD Lander Regional Office (refer to Section I.A.1.d).
B. Immobilization, Handling, and Marking – Not applicable.
C. Assessment of Sex and Age – Not applicable.
D. Collection of Biological Samples – Not applicable.
E. Diseases – Prairie dogs are known to susceptible to sylvatic plague caused by the
bacterium Yersinia pestis, which is spread when fleas from infected individuals
(typically rodents) bite other individuals of the same or different species (Gasper and
Watson 2001, Orloski and Lathrop 2003). Mortality can approach 100% and can
spread rapidly through a colony; (Orabona-Cerovski 1991, Antolin et al. 2002).
Various insecticides and vaccines have been used with some success to control the
spread of sylvatic plague (Antolin et al. 2002, Seery et al. 2003). Exercise caution
when working in and around prairie dog colonies by avoiding sick or dead individuals
and use DEET-based insect repellent to minimize risk of flea bites. Refer to Section
I.E for a description of proper protective equipment to use when it is necessary to
handle prairie dogs.

20.1-12
III. NORTHERN FLYING SQUIRREL (Glaucomys sabrinus) –
A. Survey Techniques –
1. Remote Cameras –
a. Rationale – Flying squirrels are easily detected through noninvasive
survey techniques. Because flying squirrels are susceptible to capture
myopathy, noninvasive surveys are recommended whenever it is
unnecessary to handle them for data collection (Rosenberg and Anthony
1993). Remote infrared cameras are used to detect northern flying
squirrels and can be deployed in structured surveys to meet specific
monitoring objectives (e.g., occupancy modeling; Finley et al. 2005).
b. Application – Randomly select 4-ha grids located in old growth forests.
Each grid will consist of 16 camera stations at 50-m spacing within a 4 × 4
square grid, and a 50-m buffer between the exterior stations and grid
border (Meyer et al 2005). At each station, secure 1 remote infrared
camera 1.5 m above ground on the trunk of a tree. Attach a 10-cm dia.
polyvinyl chloride (PVC) pipe enclosure to another tree within 2 m from
the camera (Van Fleet and Grenier 2012). Point the camera at the PVC
enclosure and ensure the view is unobstructed. Use a mix of peanut
butter, rolled oats, and bacon grease to bait the PVC pipe enclosure, and
reapply bait at each station in the late afternoon for 5 consecutive days.
Program cameras to activate between 1800 and 0600 to maximize
detections of flying squirrels and avoid nuisance diurnal photos. Set
cameras to take 3 photos every 10 seconds each time the camera is
triggered. Deploy cameras for 5 consecutive nights. After the fifth night,
retrieve cameras, download pictures, and erase each memory card.
c. Analysis of Data – Combine data from all cameras within the survey area.
Report total number of camera nights, all species detected (species
richness), total detections of each species, number of detections per
camera night, and locations of cameras (refer to Section I.A.1.c).
d. Disposition of Data – Send a report containing photo records and
associated data to the Nongame Mammal Biologist at the WGFD Lander
Regional Office (refer to Section I.A.1.d).
B. Immobilization, Handling, and Marking – Not applicable.
C. Assessment of Sex and Age – Not applicable.
D. Collection of Biological Samples – Not applicable.

20.1-13
E. Diseases – Although individuals are not handled directly, humans may still come in
contact with urine or feces from flying squirrels and other non-target species that may
carry hantavirus particles. Use proper protective equipment and follow appropriate
protocols when handling and disinfecting bait tubes (refer to Section I.E).
IV. SWIFT FOX (Vulpes velox) –
A. Survey Techniques –
1. Remote Cameras –
a. Rationale – Remote infrared cameras are used to detect presence of swift
fox and can be deployed in structured surveys to meet specific monitoring
objectives (e.g., occupancy modeling; Finley et al. 2005). This method is
also effective for detecting other carnivores.
b. Application – Although survey areas can be any size, 31-km2 grids are
recommended to conform with statewide protocols (Cudworth et al. 2011).
Alternatively, cameras can be placed at ≥ 0.8 km intervals along transects.
Secure each camera to a rebar stake. Position a wooden surveyor’s stake
(2.5 × 5 × 45.7 cm) 2.5 m from the camera for application of a lure and to
focus the camera. Lure should consist of a skunk-based attractant of
petroleum jelly and skunk essence mixture as well as a few sprays of fish
oil (Knox and Grenier 2010). Time surveys to correspond with seasons of
high movement and activity (e.g., juvenile dispersal during Sep–Nov;
Olson et al. 2003, Finley et al. 2005). Program cameras to activate
between 1800 and 0600 hrs to maximize detections of nocturnal canids
and avoid nuisance diurnal photos, including moving vegetation. Set
cameras to take 3 photos every 10 seconds each time the camera is
triggered. Deploy cameras for at least 5 consecutive nights. Collect
cameras and download pictures on 6th
day. Cameras can be reset as soon
as memory cards are erased (Cudworth et al. 2011).
c. Analysis of Data –Combine data from all cameras within a survey area.
Report total number of camera nights, all species detected (species
richness), total number of detections of each species, number of detections
per camera night, and locations of cameras (refer to Section I.A.1.c).
d. Disposition of Data – Send a report containing photo records and
associated data to the Nongame Mammal Biologist at the WGFD Lander
Regional Office (refer to Section I.A.1.d).

20.1-14
2. Spotlight Surveys –
a. Rationale – Spotlight surveys are an effective method for detecting
individuals and dens in locations where swift fox are known or suspected
to occur.
b. Application – Spotlight surveys are most effective if a manageable area is
searched within clearly defined boundaries. We recommend the survey be
conducted by a single observer in most situations. Although surveys can
be completed both from vehicle and on foot (refer to Section VI.A.1.b),
vehicle surveys cover a larger area more efficiently. However, vehicles
should be confined to existing roads and 2-track trails unless landowner
authorizes off-road driving; consequently, observers may need to search
inaccessible areas on foot with a portable spotlight. Refer to Section
VI.A.1.b for a description of recommended spotlight equipment. Survey
areas should be 404 ha or less depending on accessibility. Areas surveyed
without vehicle access should be less than 129 ha. Complete at least 1
pass through the entire survey area per hr. Conduct surveys in blocks of 3
consecutive nights during May-Sep when foxes den and rear pups. Each
survey session should span 4 hrs beginning at dusk. Do not conduct
surveys during unsuitable weather (i.e., high winds over 40 km per hr,
rain, or lightning storms). In some instances it may be necessary to
observe individuals at least 30 min to locate dens. Extend surveys if
necessary to identify dens in areas where swift fox have been detected.
Use a GPS unit to record locations of dens.
c. Analysis of Data – Refer to Section VI.A.1.c.
d. Disposition of Data – Send a report containing all observation records and
associated data to the Nongame Mammal Biologist at the WGFD Lander
Regional Office (refer to Section I.A.1.d).
3. Live Capture –
a. Rationale – Swift fox are typically captured for translocation and
population recovery. Foxes are also captured to obtain morphometric and
demographic information and to collect biological samples. Individuals
may be marked with PIT tags or radio collars for unique identification and
to estimate abundance or survival.
b. Application – Swift fox are most effectively captured during the pup
dispersal period but may be captured at other times of year as well (refer
to Section V.A.1.b). Set 28 × 30 × 82 cm single door live traps (Model
608, Tomahawk Live Trap Company, Wisconsin, USA) along transects at
spacing similar to that described for remote camera surveys (refer to
Section V.A.1.b). Use rabbit quarters (Lepus or Sylvilagus spp.) or small
20.1-15
chunks of ungulates for bait and secure to back of trap with metal bailing
wire. In Wyoming, baiting with dead game animal parts (e.g. obtained
from road kills) must be authorized in a Chapter 33 permit issued to
conduct scientific research. If live game animals such as cottontail rabbits
(Sylvilagus spp.) will be killed and used for bait, a Chapter 56 permit is
also required. Jackrabbits are classified as predatory animals and may be
taken and used for bait without a permit or license.
Swift fox are cautious and delicate when approaching bait, and often
succeed in removing bait without triggering the treadle if bait is not
properly secured. Apply a long-range skunk based lure (refer to Section
V.A.1.b) near traps. An alternative trap layout for mark-recapture studies
is a grid pattern (refer to Section I.A.2.b; Finley et al. 2005).
c. Analysis of Data – Report the number of individuals caught and
information on sex, age, and morphometric measurements if collected
(refer to Section V.C). Refer to Section I.A.2.c. for information on mark-
recapture techniques. Report unique identification numbers, including
PIT tags and radio-collar frequencies assigned to each individual.
d. Disposition of Data – Send a report containing capture records and
associated data to the Nongame Mammal Biologist at the WGFD Lander
Regional Office (refer to Section I.A.1.d).
B. Immobilization, Handling, and Marking –
1. Rationale – Swift fox must be handled to uniquely mark individuals, affix radio-
collars, and collect biological samples.
2. Application – Swift fox can be physically restrained with a cloth handling bag.
Generally, chemical immobilization is unnecessary.
Keep all captured individuals in covered traps and place them in a cool, dry
location until they can be processed. Personnel should work in pairs. One
individual is responsible for handling and restraining the swift fox while the other
collects and records data. Wear leather gloves at all times while handling and
restraining foxes. Transfer captured individuals to a large capture bag. Hold the
open end of the bag off the ground and roll it down and over the fox, forcing the
individual’s head into a corner of the bag. If the head is not in one of the corners,
gently feel the body of the swift fox to determine location of the head and repeat
the previous steps. Pin the individual to the ground by placing a free hand outside
the bag just behind the swift fox’s head. Slowly unroll the capture bag. Carefully
insert your other hand into the bag, grasp the swift fox by the scruff of the neck,
and remove the individual from the bag. A properly restrained fox will be unable
to turn its head and will have slightly bulging eyes. The handler should sit facing
the processor, with the swift fox on the handler’s lap and the fox’s hind feet
20.1-16
restrained between the handler’s legs. The processor should affix a small canid
muzzle as soon the fox is secured. Once processing is completed, remove the
muzzle and place the fox in a holding cage until it is released.
Record the following morphometric measurements on the handling form for swift
fox (refer to Attachment 3): shoulder height from top of scapula to tip of
outstretched foot; right upper canine width at gum line; and canine length from
gum line to tip of tooth. Use a caliper to take tooth measurements. Also note and
record observations about tooth wear and staining. Carefully examine individuals
for past and current injuries and note these under “comments.”
PIT tags provide a means for long-term identification of captured individuals.
Implant PIT tags subcutaneously in the scruff of the neck between the shoulder
blades (refer to Section I.B.2.paragraph 4). If affixing radio-collars, verify the
collar is transmitting before beginning. When placing a collar on individuals less
than 1 yr old, apply foam padding to the back of the collar and use a single layer
of duct tape to temporarily tighten the fit. Padding will pack down and
disintegrate over time as the fox grows. It is often helpful to lay a plastic bag
between the shackle and the neck to avoid catching hair when tightening collar
bolts. Double check to verify proper fit and ensure the fox’s lower jaw cannot
become caught under the collar. If in doubt, tighten the collar one notch. Spin
the collar around the neck to free any hair from the shackle, and check that
shackle nuts are tight. Record the collar frequency on the capture form.
Refer to Section II.B.2, paragraph 5 for euthanasia protocol in the event of a
serious trapping injury.
3. Analysis of Data – If several foxes are handled, complete a data summary table.
Otherwise, no analysis is necessary.
4. Disposition of Data – Send a report containing capture records and associated data
to the Nongame Mammal Biologist at the WGFD Lander Regional Office (refer
to Section I.A.1.d). Also note any trapping-related mortalities.
C. Assessment of Sex and Age – Males are easily distinguished by presence of a penis;
descended testes are also present in males over 6 months of age. Conversely, females
have a noticeable vulva shaped like a pointed leaf anterior to the anus.
Generally only juvenile and adult age classes can be distinguished in the field. The
exact age of swift fox can be determined from tooth cementum annuli (Richholt and
Carbyn 2003). By September, juveniles resemble adults in size; juveniles over 6
months of age are difficult to distinguish from adults based on size alone. Juveniles
have bright white canines that lack wear or staining and may not be fully erupted.
Conversely, adults have stained, well-worn, and fully erupted canines.

20.1-17
D. Collection of Biological Samples –
1. Rationale – Biological samples are generally collected for disease analysis. Blood
samples are preferred for determining prevalence of common wildlife diseases.
Application – Venipuncture of the cephalic vein is the preferred method for
collecting blood. Begin by locating the cephalic vein on the front leg. Wet the
area just above the knee with rubbing alcohol and press your thumb down on the
vein to raise it above the point of insertion. Use a 25-gauge needle and 12-ml
syringe to draw blood. Insert the needle parallel to the vein and pull back on the
plunger slightly until blood fills the syringe, being careful not to collapse the vein.
Blood flow may be slow and may take some time to fill the syringe. For standard
disease analysis, place blood into a red-top collection tube. For genetic and other
analyses, place blood into a purple-top collection tube. Label each collection tube
with the date, a unique identification number, and the fox’s age and sex. Keep
blood containers in a cooler with ice.
2. Analysis of Data – Report results from each captured individual.
3. Disposition of Data – Send biological samples to a genetics laboratory or the
WGFD Wildlife Veterinary Laboratory in Laramie for genetic or disease
analyses, respectively, within 72 hrs (refer to Section I.D.4). Send a report
containing capture records and results from disease or genetic analyses to the
Nongame Mammal Biologist at the WGFD Lander Regional Office (refer to
Section I.A.1.d).
E. Diseases – Swift fox have been reported to carry many diseases common to wild
canids, including canine distemper, sylvatic plague (refer to Section III.E), rabies,
tularemia (refer to Section II.E), and mange (Williams and Barker 2001). None of
these diseases are expected to pose serious population-level threats. Human health
risks are minimized if researchers take precautions not to expose themselves to fluids
(e.g., blood and saliva). Protective equipment is necessary when handling swift fox,
particularly if biological samples are collected (refer to Section I.E). Use a DEET-
based insect repellent as a precautionary measure against ectoparasites.
V. BLACK-FOOTED FERRET (Mustela nigripes) –
A. Survey Techniques –
1. Spotlight Surveys –
a. Rationale – Spotlight surveys are the most common and effective method
used to locate ferrets (Campbell et al. 1985, Grenier et al. 2009a).
Spotlight surveys may also be combined with capture methods to identify
individuals or to collect biological samples.
20.1-18
b. Application – Schedule surveys to coincide with kit emergence (15 Aug –
15 Sept) or dispersal (16 Sept – 1 Nov) to detect presence of ferrets.
Surveys to estimate abundance or document production of kits are
competed during the emergence phase. Survey coverage and specific
routes depend on available resources, personnel, and availability of roads
within prairie dog colonies. Contact landowners for permission to access
their land prior to initiation of surveys. If surveys are conducted on foot,
survey areas should be under 120 ha. Areas with adequate vehicular
access can be up to 240 ha. Actual size of the survey area will depend on
size and configuration of prairie dog colonies as well as geographic
boundaries (Grenier 2008). It is more effective to survey smaller areas
multiple times during a single night than to survey a larger area once.
Conduct spotlight surveys from 2000-2400 hrs and 0200-0600 hrs, in
blocks of 3 consecutive nights (Grenier 2008, Grenier et al. 2009). Equip
vehicles with roof- or window-mounted spotlights (Model RM 240 Blitz,
Lightforce Professional Lighting Systems, Orofino, ID). Portions of the
colony that cannot be surveyed from a vehicle should be traversed on foot
by personnel wearing a backpack spotlight unit (Walkabout Kit,
Lightforce Professional Lighting Systems, Orofino, ID). Sweep spotlights
back and forth to provide constant illumination. In most situations,
observers are able to detect eye shine up to 400 m depending on
experience, topography, and vegetation, although ferrets have been
detected at distances up to 1,200 m. All Mustelids including ferrets
display green eye shine; Leporids have red eye shine; Canids and Felids
have yellow eye shine; and pronghorn (Antilocapra americana) have
turquoise eye shine. Record observations and associated information on
the ferret spotlighting record form (Attachment 4). Use a GPS unit to
record locations of all ferret observations and burrow entrances. Once
ferrets are located, personnel may need to observe individuals for
extended periods of at least 30 min or multiple times to accurately count
the number of kits.
c. Analysis of Data – Report total number of ferrets observed and minimum
number alive (MNA). MNA is determined by spatially and temporally
distinguishing among observations (Grenier 2008). Also report survey
dates and total hours spotlighting. Include individual ferret locations, date
and time of observation, and the observer’s name.
d. Disposition of Data – Send a report containing records of observations and
associated data to the Nongame Mammal Biologist at the WGFD Lander
Regional Office (refer to Section I.A.1.d). A report will also be submitted
annually to the U.S. Fish and Wildlife Service’s Black-footed Ferret
Recovery Coordinator.
20.1-19
2. Live Capture –
a. Rationale – Ferrets are captured to obtain morphometric and demographic
information and to collect biological samples. Individuals may also be
marked with PIT tags and hair dye to provide a means of uniquely
identifying individuals and to estimate abundance.
b. Application – After a ferret is located during spotlight surveys (refer to
VI.A.1), place an unbaited live trap in the burrow entrance where the
ferret was observed (Sheets 1972). Traps should be wrapped in burlap
from the trap entrance to approximately 15 cm from the end of the trap
and secured in 2 places with nylon cord. Place a reflector pole near the
burrow entrance to easily relocate the trap, and record the location with a
GPS unit. Use metal or plastic cups, wood, or grass to plug entrances of
connected burrows and prevent the ferret from escaping. Record from
trapping sessions on the ferret spotlighting record form (Attachment 4).
Check traps hourly and remove all traps and burrow plugs at sunrise.
Leave reflector poles in place until the end of the spotlight survey.
c. Analysis of Data – Enter capture data on a spreadsheet at the conclusion of
the survey.
d. Disposition of Data – Send a report containing capture records, associated
data, and spreadsheets to the Nongame Mammal Biologist at the WGFD
Lander Regional Office (refer to Sections I.A.1.d and VI.A.1.d).
B. Immobilization, Handling, and Marking –
1. Rationale – Ferrets must be chemically immobilized to collect biological samples,
record morphometric measurements or mark individuals for recapture analyses.
Ferrets must also be marked to derive a population estimate. Individuals are
typically marked with hair dye for short-term identification. Long-term marking
methods are used to estimate demographic parameters.
2. Application – Transfer captured ferrets from live traps to transfer tubes
constructed of 10-cm diameter, perforated, corrugated black pipe. To do this,
place the trap and transfer tube on the ground with the open end of the transfer
tube next to the end of trap. Open the trap and place the transfer tube as close as
possible. Gently coax the ferret into the transfer tube by removing the burlap
cover from the trap. In most cases, captured individuals will run into transfer
tubes with little difficulty. To encourage hesitant individuals, crinkle a piece of
plastic repeatedly near the trap. When the ferret enters the transfer tube, quickly
insert the partition and secure it with a cotter pin. Be sure both ends of the tube
are secured. Hold the tube with both hands when carrying it. Transport captured
individuals to a mobile processing trailer for chemical immobilization. While
20.1-20
transporting a ferret, keep the cab of the truck at a moderate temperature and
lower the volume of the radio.
Only trained and qualified WGFD personnel should process ferrets. Refer to
Attachment 5 for set up of immobilization equipment including oxygen tank,
isoflurane vaporizer, and an overview of the processing trailer. All personnel
present during immobilization should wear masks, and the anesthesiologist should
wear nitrile gloves while handling ferrets. To chemically immobilize a captured
individual, connect the transfer tube to the immobilization chamber (refer to
Attachment 5). Cover the clear portal of the chamber with a cloth. Remove both
partitions of the transfer tube, beginning with the partition between the tube and
chamber. While wearing a welding glove, insert a fist into the other end of the
transfer tube to force the ferret into the chamber. Once the ferret is in the
chamber, slowly close the door taking care not to pinch appendages.
Record processing data onto the ferret chemical immobilization form (refer to
Attachment 6). Follow the numerical order outlined on the form to ensure the
ferret reaches a deep and consistent state of immobilization before procedures are
conducted. Turn on oxygen and set to 3.5 Lpm. Set vaporizer unit to 4.0 percent
by volume (Vol %). Wait approximately 3 min for the drug to take effect. Ferrets
can be removed from the chamber when they are nonresponsive; exhibit deep,
regular breathing; and the eyes have rolled back slightly, exposing their white
portion. Remove the immobilized ferret from the chamber and lay the individual
on its ventral side on a towel. Straighten all appendages. Remove the tube
connecting the vaporizer to the chamber and insert a gas mask on the exposed
end. Insert the entire head of the ferret inside the mask (refer to Attachment 5).
Adjust the oxygen setting to 2.0 Lpm and vaporizer to 2.5 Vol %. Processing
time should take approximately 10–15 min. Begin by applying eye drops, taking
the ferret’s rectal temperature, and counting breaths for 15 sec. Multiply the
breath count by 4 to calculate respiration rate. Normal vital measurements are 98º
- 105º F (37° - 41° C) body temperature and 12 – 24 breaths per min.
Place the individual on its back to obtain morphometric measurements. Record
the following measurements: total body length from tip of nose to tip of tail;
body length from tip of nose to anterior point of anus; and upper canine width at
gum line. Use a caliper to take tooth measurements. Record tooth wear and note
broken teeth on the ferret chemical immobilization form (refer to Attachment 6).
Carefully examine each individual for past and current injuries, paying special
attention to mouth and chin areas. If extensive wounds are apparent, administer
an additional 1cc of penicillin.
To avoid double counting and re-processing of previously captured individuals,
mark the underside of the neck just below jaw line using hair dye (e.g., Clairol
Nice N’ Easy). Dark colors including black, red, and brown work best. Dye
marks typically last 4 weeks (Grenier et al. 2009a). Implant PIT tags

20.1-21
subcutaneously in the scruff of the neck between the shoulder blades (refer to
Section I.B.2.paragraph 4).
When processing is complete, turn the vaporizer and oxygen off. Wrap
individuals in towels and move to a “pet taxi” for recovery. Lay the ferret on a
towel, on its side, and ensure the face and nose are not covered. Most ferrets
recover quickly, will shake and shiver profusely within minutes, and are able to
metabolize residual isoflurane within 15 min. Once ferrets are alert and standing
on all 4 legs, they can be removed from the processing trailer and returned to
burrows for release. Use Nolvalsan Otic cleaning solution to disinfect all
equipment, including the chamber, mask, and tools, after each ferret is processed.
Refer to Section II.B.2, paragraph 5 for euthanasia protocol in the event of a
serious trapping injury.
3. Analysis of Data – Report the number of individuals captured and information on
sex, age, and morphometric measurements if collected (refer to Section VI.C).
Report unique identification numbers (e.g., dye marks and PIT tags) from each
individual.
4. Disposition of Data – Send a report containing capture records and associated data
to the Nongame Mammal Biologist at the WGFD Lander Regional Office (refer
to Section I.A.1.d and Section VI.A.1.d). Also note any trapping-related
mortalities.
C. Assessment of Sex and Age – Sex of ferrets can be readily determined throughout the
year. The anal-genital distance of male ferrets is greater than that of females (the
same criterion used to determine sex of rodents). These characteristics can be
examined while the ferret is in the trap and without handling it. Sex can also be
determined in the field based on skull shape. Male ferrets have a broad head that
appears generally large and square whereas females have a much narrower, slender
skull.
Most individuals can be classified as adult or juvenile based on upper canine width
measured during Aug and Sep. Adults have a fully erupted upper canine that
measures over 4.0 mm wide in males and over 3.7 mm in females. Nipples are also
visible on adult females, as most adult female reproduce annually (Grenier 2008).
Nipples are not visible in juvenile females.
D. Collection of Biological Samples –
1. Rationale – Biological samples are required to perform genetic and disease
analyses. This typically entails collection of blood and hair samples. Blood
samples are collected to test for, and monitor prevalence of diseases; hair is
collected for genetic analysis.

20.1-22
2. Application – The preferred method to obtain blood samples is venipuncture of
the anterior vena cava (Quesenberry and Orcutt 2004; refer to Attachment 7).
Ferrets must be chemically immobilized to perform this procedure. Position the
immobilized ferret on its back while keeping its head firmly inside the anesthesia
mask (refer to Section VI.B.2). Disinfect the puncture area by swabbing with
alcohol. Insert a 25-gauge needle attached to a 3-ml syringe at a 45° angle
between the first rib and manubrium. Direct the needle toward the opposite hind
leg and insert it almost to the hub. Pull back on the plunger slightly until blood
fills the syringe. It is possible to collect up to 4 ml of blood from an individual of
average weight (i.e., >750 g). In most applications, 3 ml should suffice for
standard disease testing (refer to Section VI.E). For standard disease analysis,
place blood into a red-top collection tube. For genetic and other analyses, place
blood into a purple-top collection tube. Label each collection tube with the date
and the ferret’s age, sex, and unique identification number. Keep blood samples
upright in a cooler. After a blood draw is completed, administer 20 ml of lactated
ringer solution (LRS) subcutaneously between the shoulders.
Use tweezers to collect hair samples. Collect one small tuft of hair from the rump
and another from the side. Place hair in a 6.4 × 8.3 cm manila envelope and store
in a cool dry place. Record stud book number, date, and age and sex of the ferret
on all biological samples. The stud book number is a unique 4-digit identification
number assigned to each ferret when it is first captured. The number reflects the
year the individual was first captured as well as the order in which it was
captured.
3. Analysis of Data – Report analytical results from each captured individual.
4. Disposition of Data – Deliver all blood samples to the WGFD laboratory in
Laramie, Wyoming within 72 hrs (refer to Section I.D.4). Send a report
containing capture records and results of disease analyses and all hair samples to
the Nongame Mammal Biologist at the WGFD Lander Regional Office (refer to
Sections I.A.1.d and VI.A.1.d).
E. Diseases – Black-footed ferrets are susceptible to a number of infectious diseases
including canine distemper, Sylvatic plague (refer to Section III.E), and tularemia
(refer to Section II.E; Williams and Barker 2001). Tularemia presents little threat to
the persistence of ferret populations, but both canine distemper and Sylvatic plague are
100% fatal to ferrets. Plague and tularemia also pose potential risks to humans.
Apply DEET-based insect repellent as a precautionary measure and use proper
protective equipment when handling ferrets (refer to Section I.E), and check yourself
and others for ticks every 2–3 hrs.

20.1-23
VI. WOLVERINE (Gulo gulo) –
A. Survey Techniques –
1. Remote Cameras –
a. Rationale –Noninvasive survey techniques, including remote cameras, can
be used to detect presence of wolverines (refer to Section IV.A.1.a) and to
identify individuals (Magoun et al. 2011).
b. Application – Divide the study area into 3.2×3.2 km survey grids (Kucera
et al. 1996). Attach cameras to tree trunks 2 m above ground and
approximately 4 m from a bait tree. Cameras can also be positioned to
capture images of the ventral side of wolverines in order to identify
individuals. Ventral photos display unique pelage patterns of individuals
and can also be used to identify sex (Magoun et al. 2011). Locate camera
sites in travel corridors within preferred habitat. Distance between camera
sites can vary depending on terrain features and survey grid size (Magoun
et al. 2011). Wire a whole beaver carcass to the bait tree and apply a long-
range skunk-based lure as an attractant. Program cameras to take 3 photos
every 10 seconds each time the camera is triggered. Program a sleep
period of at 10-min or more intervals between triggers. Check cameras
bimonthly to download memory cards and re-bait sites (Bradbury and
Fisher 2007, Nielsen and McCollough 2009). Because of potential for
conflicts with bears, use proper precautions when selecting time of year
and locations for camera setups (Nielsen and McCollough 2009).
c. Analysis of Data – Combine data from all cameras within the survey area.
Report the following information from each study area: total number of
camera nights, all species detected (species richness), total detections of
each species, number of detections per camera night, and locations of
cameras (refer to Section I.A.1.c).
d. Disposition of Data – Send a report containing photo records and
associated data to the Nongame Mammal Biologist at the WGFD Lander
Regional Office (refer to Section I.A.1.d).
2. Snow Tracking (Aerial) –
a. Rationale –Track surveys conducted from a low-flying aircraft are an
effective method to detect wolverines when weather and snow conditions
are conducive. Large areas can be surveyed efficiently from fixed-wing
aircraft or helicopters (Magoun et al. 2007). Probability of occurrence can
also be estimated for the entire survey area (Koen et al. 2008).

20.1-24
b. Application – Conduct snow tracking surveys in late winter beginning
after mid-February. Partition the survey area into hexagon grids of at least
100 km2 – the approximate average minimum size of the home range of a
female wolverine (Inman et al, 2009, Magoun et al. 2007). Plan flight
paths in advance to minimize ferry time and avoid densely forested areas.
To maximize coverage, conduct fewer repeated surveys and fly more
survey grids (Koen et al. 2008). Use aircrafts such as PA-18 Super Cub,
from which the observer can see out both sides. Fly surveys at 110–140
km per hr and 100 m above ground level. Conduct surveys 24 hrs or more
following widespread snowfall of at least 3 cm, or after windstorms with
average gusts exceeding 50 km per hr. Ideal survey conditions are sunny
or lightly overcast days with wind conditions that are safe for operating
aircraft at slow speeds. Favorable lighting conditions are typically from
1000-1500 hrs depending on location, weather, and time of year.
Wolverine tracks are identified based on a combination of track size,
shape, depth, and 3-lope gait (refer to Attachment 8; Halfpenny et al.
1996, Magoun et al. 2007, Koen et al. 2008). Exclude tracks if a positive
identification cannot be made (Magoun et al. 2007).
c. Analysis of Data – Record the flight path and all tracks and observations
of carnivores on a wolverine survey form (refer to Attachment 9; Koen et
al. 2008).
d. Disposition of Data – Send a report identifying areas surveyed, track
locations, and species detected to the Nongame Mammal Biologist at the
WGFD Lander Regional Office (refer to Section I.A.1.d).
3. Snow Tracking (Ground) –
a. Rationale –Track surveys conducted from the ground can also be effective
to detect presence of wolverines. This approach provides an inexpensive
alternative to aerial surveys, however ground surveys are most effectively
done in smaller areas of less than 100,000 km2 (Koen et al. 2008). Track
identification can be verified by collecting and analyzing biological
samples (Ulizio et al. 2006).
b. Application – Partition the survey area into 8×8 km grids and select
random grids to survey. The number of grids depends on project
objectives, amount of personnel time available, and budgets. When
feasible, conduct track surveys from a snowmobile at 15–20 km per hr
(refer to Section VII.A.2.b), or use snowshoes or skis if snowmobile
access is not possible (Squires et al. 2004, Ulizio et al. 2006). Survey
routes should be 10 km long within each grid and should focus on
preferred habitat. Survey each grid at least 3 times per winter or until
wolverines are detected (Halfpenny et al. 1996). Record locations of
20.1-25
survey routes and all wolverine tracks encountered. Back trail along each
set of tracks to collect biological samples (refer to Section VII.D).
c. Analysis of Data – Record all tracks and observations of carnivores on a
wolverine survey form (refer to Attachment 9; Koen et al. 2008).
d. Disposition of Data – Send a report containing survey data to the
Nongame Mammal Biologist at the WGFD Lander Regional Office (refer
to Section I.A.1.d).
B. Immobilization, Handling, and Marking – Not applicable.
C. Assessment of Sex and Age – Not applicable, although sex can be determined from
biological samples (refer to Section VII.D).
D. Collection of Biological Samples –
1. Rationale – Collection of biological samples may be necessary to monitor
diseases, identify individuals, or confirm species identification. This typically
entails collecting fecal or hair samples during snow tracking.
2. Application – After intersecting a set of tracks while conducting ground surveys
(refer to Section VII.A.3.), back trail the tracks at least 2 km or until biological
samples, including feces or hair, are encountered. Fecal and hair samples may be
found in tracks or temporary resting places such as daybeds. Scan from multiple
angles approximately 30 cm above the snow surface to locate hair samples in
suitable locations including daybeds, foraging sites, tracks, tree boles, and woody
debris along the animal’s trail. Fecal samples are more visible and may be
encountered while back trailing an individual. Place fecal samples in a vial with
10–18 mesh silica desiccant to inhibit enzyme activity from degrading samples.
Place hair samples in a small manila envelope (i.e., 6.4 × 8.3 cm) and store in a
cool dry place (Ulizio et al. 2006).
3. Analysis of Data – Report results from genetic analyses, including number and
sex of unique individuals documented throughout the survey area.
4. Disposition of Data – Deliver samples collected for genetic analysis to the
University of Montana, U.S. Forest Service Rocky Mountain Research Station in
Missoula. Send a report containing sample records, including location and unique
identification numbers, and results from genetic analyses, to the Nongame
Mammal Biologist in the WGFD Lander Regional Office (refer to Section
I.A.1.d).
E. Diseases – Wolverines are known to harbor many parasites, such as flukes,
tapeworms, roundworms, trematodes, nematodes, cestodes, heartworms, ticks, fleas,
and ear canker mites (Pasitschnaik-Arts and Larivière 1995). Because researchers

20.1-26
normally do not directly handle individuals, human health risk is minimal. However,
we recommend use of gloves and other personal protective equipment when collecting
and handling biological samples (refer to Section I.E).
VII. NORTHERN RIVER OTTER (Lontra canadensis) –
A. Survey Techniques –
1. Latrine Surveys –
a. Rationale – Indirect, noninvasive survey methods can be used effectively
to detect river otters. Fecal deposition rates can provide an index of river
otter abundance per site, per river mile, or per unit time. Population
attributes including sex or genetics can be evaluated from biological
samples (Ben-David et al. 1998, Ben-David and Golden 2007).
b. Application – Walk along river banks to locate latrine sites. Some terrain
may necessitate use of either a small boat or raft to access the river bank.
Sites actively used by river otters are often characterized by well-
established trails or slides, low slopes, and vegetation (Bowyer et al. 1994,
1995). Once a latrine is located, use a GPS device to record its location.
Mark all latrine sites with forestry flagging for short-term identification
and metal tags attached to tree trunks for long-term identification. Visit
each latrine site at least twice during the survey year and separate
individual visits by 2-3 days. Search latrines thoroughly (sites can range
from 10-500 m2). To index river otter abundance, count and remove all
fecal deposits or mark them to prevent recounting on subsequent visits.
Do not mark samples that will be used for genetic analyses. Record all
fecal deposits distinguished as fresh or old (i.e., >12 hr). To determine
density and other population attributes, collect all fresh feces and anal
gland excretions at each site (refer to Section VIII.D.2). Conduct surveys
every 3 yrs to evaluate changes in abundance and every 6 yrs to evaluate
changes in density (Ben-David and Golden 2007).
c. Analysis of Data –Tally numbers of fresh and old fecal samples counted at
each latrine site visit.
d. Disposition of Data – Send a report containing latrine locations and
collection records to the Nongame Mammal Biologist at the WGFD
Lander Regional Office (refer to Section I.A.1.d).
B. Immobilization, Handling, and Marking – Not applicable.
C. Assessment of Sex and Age – Not applicable, although sex can be determined from
biological samples (refer to Section VIII.D).

20.1-27
D. Collection of Biological Samples –
1. Rationale – Genetic analysis of biological samples provides a means to
distinguish individuals. Identification of unique individuals is necessary to
estimate population size.
2. Application – Refer to Section VIII.1.b for selection of sampling locations in the
field. Collect all fresh fecal deposits at each latrine site. Fresh deposits are whole
and intact with a glossy appearance and strong smell, often with visible crayfish
carapaces (Bowyer et al. 1994, Hansen et al. 2007). Older fecal deposits may
have a glossy appearance when they are wet, but lack the characteristic smell.
Whenever possible, collect anal gland secretions (a.k.a., anal jellies) or feces with
this material attached, as these samples provide more DNA than fecal samples
alone. Use a clean stick or twig to pick up each sample and place it into an
individual 50-ml vial. Be sure to use a different stick for each sample. Add
enough ethyl alcohol to completely cover the sample and shake the vial lightly to
ensure the sample is completely saturated. Mark each vial with the location
where the sample was collected and a unique identification number. Store vials in
coolers with ice packs (Ben-David and Golden 2007).
3. Analysis of Data – Report results from genetic analyses including number and sex
of unique individuals documented at each latrine site and throughout the survey
area.
4. Disposition of Data – Send fecal samples to a genetics laboratory within 72 hrs
(refer to Section I.D.4). Send a report containing sample records including
number of individuals recorded at each latrine site, locations, unique identification
numbers, and results from genetic analyses to the Nongame Mammal Biologist at
the WGFD Lander Regional Office (refer to Section I.A.1.d).
E. Diseases – River otters are susceptible to a number of diseases, including canine
distemper, rabies, respiratory tract disease, urinary infection, jaundice, hepatitis, feline
panleucopenia, and pneumonia (Larivière and Walton 1998, Williams and Barker
2001). None of these diseases are expected to have severe population-level effects.
Because researchers do not directly handle otters, human health risks are minimal.
However, river otters are known to carry various endoparasites including nematodes,
cestodes, trematodes, the sporozoan Isopora, and acanthocephalans (Larivière and
Walton 1998). Consequently, we recommend use of gloves and other personal
protective equipment when collecting and handling biological samples (refer to
Section I.E).
20.1-28
VIII. CANADA LYNX (Lynx canadensis) –
A. Survey Techniques –
1. Snow Tracking (Ground) –
a. Rationale – Track surveys are an effective method to detect lynx when
weather and snow conditions are suitable. Biological samples can also be
collected and analyzed to obtain additional information about population
attributes including estimates of population size.
b. Application – Snow track surveys for lynx follow the same methods used
for wolverines (refer to Section VII.A.3.b.). Characteristic of Felids, lynx
forepaws leave larger tracks than hind paws and claw prints are usually
not visible. Toe pads are often indistinguishable due to the dense hair on
the bottom of a lynx’s feet (Halfpenny et al. 1996).
c. Analysis of Data – Refer to Section VII.A.3.c.
d. Disposition of Data – Send a report containing track locations, observation
records of all carnivores, and associated data to the Nongame Mammal
Biologist at the WGFD Lander Regional Office (refer to Section I.A.1.d).
2. Live Capture –
a. Rationale – Lynx must be captured to obtain morphometric and
demographic information, and to collect biological samples. Individuals
may also be marked with PIT tags or radiocollars for unique identification
and to estimate abundance.
b. Application – Lynx are most effectively captured during winter when
snow cover is extensive. Kolbe et al. (2003) designed a lynx trap made of
PVC pipe and chicken wire. The Nongame Program has several of these
traps on-hand. Contact the Nongame Mammal Biologist at the WGFD
Lander Regional Office to determine availability. Assemble traps on-site
and conceal them among existing vegetation, usually pine trees. Cover
traps with pine boughs for camouflage and to provide thermal protection.
Bait traps with ≤5 lbs of deer and apply a long-range lure such as beaver
castor. Use fishing line to hang a visual attractant such as a grouse wing,
pie plate, or CD, within 50 m of traps. Check traps every 24–36 hrs and
re-bait as necessary. In Wyoming, baiting with dead game animal parts
(e.g. from road kills) must be authorized by a Chapter 33 permit issued to
conduct scientific research. If live game animals such as cottontail rabbits
will be killed and used for bait, a Chapter 56 permit is also required.
20.1-29
c. Analysis of Data – Report number of individuals caught and information
on sex, age, and morphometric measurements if collected (refer to Section
IX.C). Record unique identification numbers including PIT tags and
radio-collar frequencies from each previously marked individual captured.
d. Disposition of Data – Send a report containing capture records and
associated data to the Nongame Mammal Biologist at the WGFD Lander
Regional Office (refer to Section I.A.1.d).
B. Immobilization, Handling, and Marking –
1. Rationale – Lynx must be handled in order to obtain morphometric measurements
and tissue samples or to mark individuals. Chemical immobilization is required
to handle lynx.
2. Application – Immobilization and handling recommendations were provided by J.
Squires and J. Kolbe (personal communication, USDA Rocky Mountain Research
Station). Calmly approach traps being careful not to startle the lynx. In most
situations, individuals will remain relatively docile and are easy to inject. A
second person can distract the lynx, if necessary, during the injection. Use a
syringe pole and 20-gauge × 2.5-cm needle to administer drugs in the front
shoulder or ham while the lynx is in the trap. To immobilize lynx, administer
Ketamine at 8 milligrams per kilogram body weight plus Xylazine at 3 milligrams
per kilogram body weight. Record time of injection on the lynx chemical
immobilization form (refer to Attachment 10).
Although unusual reactions to drugs are rare in healthy individuals, malnourished
or severely dehydrated lynx may display unstable vital signs. Normal vital signs
are: respiration: 20-40 breaths per min; heart rate: 80-120 beats per min; and
body temperature: 37 º-39º C. If unusual symptoms are observed, do not
antagonize the Xylazine as this can cause a convulsive reaction. Allow the
individual to metabolize the dosage without the reversal agent. This process can
be facilitated by keeping individuals as warm as possible.
Use the lynx chemical immobilization form (refer to Attachment 10) to record
data during processing. The form is designed to be followed in numerical order to
ensure an appropriate level of immobilization is achieved before procedures are
conducted. Lynx can usually be handled within 10 min of injection. In rare
cases, including young, agitated, or very large individuals, a booster dose may be
necessary. Wait at least 15 min after the initial injection before administering a
booster. A booster dosage should never exceed 1/3 of the initial capture dose.
While waiting for the drug to take effect, place a handling tarp on top of a
sleeping bag on the ground. Lynx are properly immobilized when breathing
becomes deep and regular and individuals are unresponsive to stimuli. Remove
the lynx from the trap. Position the lynx on its side on the tarp and immediately
20.1-30
apply ophthalmic lotion to eyes, rubbing gently. Cover the head and eyes, being
careful not to obstruct the nasal passage.
Record the following morphometric measurements from the individual lying in a
natural position: shoulder to hip length from front point of shoulder to ball of hip;
shoulder height from top of scapula to tip of outstretched foot; total body length
from tip of nose to tip of tail along the contour of back; right upper canine width
at the gum line; canine length from gum line to tip; and ear tuft length from base
of ear to end of longest hair. Use a caliper to take tooth measurements. Note
tooth wear and broken teeth on the lynx chemical immobilization form (refer to
Attachment 10). Carefully examine the lynx for past and current injuries, paying
special attention to condition of its feet. Manually extend each claw and check
the pad condition. Apply triple antibiotic ointment to any open wounds or
abrasions.
Insert PIT tags for long-term identification of captured individuals. Implant PIT
tags subcutaneously in the scruff of the neck between the shoulder blades (refer to
Section I.B.2.paragraph 4). Refer to Section V.B.2, paragraph 2 for the procedure
to affix radio-collars.
To ensure individuals are released in good condition, place lynx back in the trap
for 3-3.5 hrs after capture. Before placing individuals in traps, remove the trigger
wire or bury it underneath the treadle so individuals will not snare themselves
during recovery. If the ambient temperature is less than 0º C, lay traps with lynx
inside on the sleeping bag. Check the lynx often to assure the head and airway
are clear and to look for signs of heightened consciousness. Administer
Yohimbine (0.10 mg per kg) when individuals begin to move on their own,
usually 75–90 min after the initial injection. Release the lynx only after it is fully
recovered.
Refer to Section II.B.2, paragraph 5 for euthanasia protocol in the event of a
serious trapping injury.
3. Analysis of Data – If multiple individuals are handled, complete a summary table
containing data from each lynx. Otherwise, no data analysis is necessary.
4. Disposition of Data – Send a report containing capture records and associated data
to the Nongame Mammal Biologist at the WGFD Lander Regional Office (refer
to Section I.A.1.d). Also note any trapping-related mortalities.
C. Assessment of Sex and Age – Determining sex of Felids is generally more difficult
than for other carnivores, especially in young individuals (Rolley 1987). This can
usually be accomplished by palpitation of genitals. In some cases, males can be
distinguished from females by presence of testes. Replacement patterns of teeth can
be a useful method to distinguish between adults and juveniles up to 240 days of age

20.1-31
(McCord and Cardoza 1982). Ages of older adults can be determined based on
cementum annuli in tooth cross-sections (Crowe 1972).
D. Collection of Biological Samples –
1. Rationale – Biological samples are collected to detect and monitor diseases and to
distinguish individuals through genetic analysis. Blood samples are typically
obtained during capture, and scat or hair samples can be collected during snow
tracking surveys.
2. Application – The method for collecting blood from lynx is identical to that
described for swift fox (refer to Section V.D.2). Use a 22-gauge needle and 12-
or 20-ml syringe to draw blood, depending upon how much is needed for analysis.
Generally, fecal and hair samples can be found near temporary resting places, day
beds, or ambush beds. Day beds are sites where individuals lay to rest and are
characteristically oval-shaped depressions, usually with crusty or icy snow.
Ambush beds lack crusty or icy snow; depressions formed by the front legs are
often visible in the snow. Refer to Section VII.D.2 for information on how to
collect and store fecal and hair samples.
3. Analysis of Data – Report analysis results from each captured individual.
4. Disposition of Data – Deliver all blood samples to the WGFD Laboratory in
Laramie, Wyoming within 72 hrs. Send a report containing sample records
including locations and unique identification numbers, and results from genetic
analyses, to the Nongame Mammal Biologist at the WGFD Lander Regional
Office (refer to Section I.A.1.d).
E. Disease Precautions – Felids including lynx, are highly susceptible to sylvatic plague
(refer to Section III.E). Wear proper protective equipment when handling lynx,
particularly if collecting biological samples (refer to Section I.E), and use appropriate
protective measures to minimize exposure risk while handling or transporting dead
individuals.
20.1-32
IX. LITERATURE CITED –
American Veterinary Medical Association [AVMA]. 2007. AVMA guidelines on
euthanasia. American Veterinary Medical Association, Schaumburg, Illinois, USA.
Anstee, S. D., and D. J. Needham. 1998. The use of a new field anesthesia technique to
allow the correct fitting of radio collars on the western pebble mound mouse,
Pseudomys chapmani. Australian Mammalogy 20:99-101.
Antolin, M. F., P. Gober, B. Luce, D. E. Biggins, W. E. Van Pelt, D. B. Seery, M.
Lockhart, and M. Ball. 2002. The influence of sylvatic plague on North American
wildlife at the landscape level, with special emphasis on black-footed ferret and
prairie dog conservation. Pages 104-127 in J. H. Rahm, editor. Transactions of the
67th
North American wildlife and natural resources conference. Washington, D.C.,
USA.
Antolin, M. F., B. Van Horne, M. D. Berger, Jr., A. K. Holloway, J. L. Roach, and R. D.
Weeks, Jr. 2001. Effective population size and genetic structure of a Piute ground
squirrel (Spermophilus mollis) population. Canadian Journal of Zoology 79:26-34.
Baker, R. J., and S. L. Williams. 1972. A live trap for pocket gophers. Journal of Wildlife
Management 36:1320-1322.
Ben-David, M., R. T. Bowyer, L. K. Duffy, D. D. Roby, and D. M. Schell. 1998. Social
behavior and ecosystem processes: river otter latrines and nutrient dynamics of
terrestrial vegetation. Ecology 79:2567-2571.
Ben-David, M. and H. Golden. 2007. River otter survey protocols for coastal habitats.
South West Alaska Network, National Park Service, Anchorage, USA.
Biggins, D. E., J. M. Lockhard, and J. G. Godbey. 2004. Evaluating habitat for black-
footed ferrets: revision of an existing model. Pages 143-150 in J. E. Roelle, B. J.
Miller, J. L. Godbey, and D. E. Biggins, editors. Recovery of the black-footed ferret:
progress and continuing challenges – proceedings of the Symposium on the Status of
the Black-footed Ferret and Its Habitat, Fort Collins, Colorado, January 29-29, 2004.
USGS Fort Collins Science Center, Fort Collins, Colorado, USA.
Biggins, D. E., B. J. Miller, L. R. Hanebury, B. Oakleaf, A. H. Farmer, R. Crete, and A.
Dood. 1993. A technique for evaluating black-footed ferret habitat. Pages 73-88 in J.
L. Oldemeyer, D. E. Biggins, and B. J. Miller, editors. Proceedings on the
Symposium on the Management of Prairie Dog Complexes for the Reintroduction of
the Black-footed Ferret. U.S. Department of the Interior, Fish and Wildlife Service
Biological Report 13, Washington, D.C.

20.1-33
Bowyer, R. T., J. W. Testa, and J. B. Faro. 1995. Habitat selection and home ranges of
river otters in a marine environment: effects of the Exxon Valdez oil spill. Journal of
Mammalogy 76:1-11.
Bowyer, R. T., J. W. Testa, J. B. Faro, C. C. Shhwartz, and J. B. Browning. 1994. Changes
in diets of river otters in Prince William Sound, Alaska: effects of the Exxon Valdez
oil spill. Canadian Journal of Zoology 72:970-976.
Bradbury, S., and J. Fisher. 2007. Wolverine abundance and habitat use in the Rocky
Mountain parks of central Alberta, Canada: year-end report 2006-2007. Alberta
Research Council, Vegreville, Canada.
Campbell, T. M., III, D. Biggins, S. Forrest, and T. W. Clark. Spotlighting as a method to
locate and study black-footed ferrets. Pages 24.1-24.7 in S. H. Anderson and D. B.
Inkley, editors. Black-footed ferret workshop proceedings, Wyoming Game and Fish
Department, Cheyenne, USA.
Castro-Arellano, I. 2005. Ecological patterns of the small mammal communities at El Cielo
Biosphere Reserve, Tamaulipas, Mexico. Ph.D. Dissertation. Texas A&M University,
College Station, USA.
Chao, A., and R. M. Huggins. 2005. Classical closed-population capture-recapture models.
Pages 22-35 in S. C. Amstrup, T. L. McDonald, and B. F. J. Manly, editors.
Handbook of capture-recapture analysis. Princeton University Press, New Jersey,
USA.
Crowe, D. M. 1972. The presence of annuli in bobcat cementum layers. Journal of Wildlife
Management 36:1330-1332.
Cudworth, N., S. Cornell, and M. Grenier. 2012. Evaluating aerial survey techniques to
estimate abundance of white-tailed prairie dogs in Wyoming. Pages 249-259 in M. B.
Grenier, B. Abel, and N. Cudworth, editors. Threatened, endangered, and nongame
bird and mammal investigations. Wyoming Game and Fish Department Nongame
Program, Lander, USA.
Cudworth, N., L. Van Fleet, and M. Grenier. 2011. Monitoring trends and documenting
distribution of swift fox in Wyoming. Pages 164-172 in M. B. Grenier, editor.
Threatened, endangered, and nongame bird and mammal investigations. Wyoming
Game and Fish Department Nongame Program, Lander, USA.
Finley, D. J., G. C. White, and J. P. Fitzgerald. 2005. Estimation of swift fox population
size and occupancy rates in eastern Colorado. Journal of Wildlife Management
69:861-873.
Frase, B. A., T. M. Pizzuto, and L. L. Getz. 1990. Survivorship of bled voles measured by
recapture. Journal of Mammalogy 71:104-105.
20.1-34
Gannon, W. L., R. S. Sikes, and the Animal Care and Use Committee of the American
Society of Mammalogists. 2007. Guidelines of the American Society of
Mammalogists for the use of wild mammals in research. Journal of Mammalogy
88:809-823.
Gasper, P. W. and R. P. Watson. 2001. Plague and yersiniosis. Pages 313-329 in E. S.
Williams and I. K. Barker, editors. Infectious diseases of wild mammals. Blackwell
Publishing, Ames, Iowa, USA.
Green, J. S., and J. T. Flinders. 1980. Brachylagus idahoensis. Mammalian Species 125:1-
4.
Grenier, M. B. 2008. Population biology of the black-footed ferret reintroduced into
Shirley Basin, Wyoming. M.S. Thesis. University of Wyoming, Laramie, USA.
Grenier, M. B., S. W. Buskirk, and R. Anderson-Sprecher. 2009a. Population indices
versus correlated density estimates of black-footed ferret abundance. Journal of
Wildlife Management 73:669-676.
Grenier, M., T. Filipi, B. Oakleaf, and N. Whitford. 2009b. White-tailed prairie dog
evaluation of survey techniques completion report. Pages 143-148 in A. Orabona,
editor. Threatened, endangered, and nongame bird and mammal investigations.
Wyoming Game and Fish Department Nongame Program, Lander, USA.
Grenier, M., B. Oakleaf, K. Taylor, and M. Hymas. 2004. Inventory and monitoring of
black-tailed prairie dogs in Wyoming – status of colonies completion report. Pages
94-113 in A.O. Cerovski, editor. Threatened, endangered, and nongame bird and
mammal investigations. Wyoming Game and Fish Department Nongame Program,
Lander, USA.
Griscom, H., D. Keinath, and M. Andersen. 2010. Pocket gopher surveys in southwestern
Wyoming: draft project report. Wyoming Natural Diversity Database, University of
Wyoming, Laramie, USA.
Halfpenny, J. C., R. W. Thompson, S. C. Morse, T. Holden, and P. Rezendes.1996. Snow
tracking. Pages 91-163 in W. J. Zielinski and T. E. Kucera, technical editors.
American marten, fisher, lynx, and wolverine: survey methods for their detection.
USDA Forest Service General Technical Report PSW-GTR-157, Albany, California,
USA.
Hansen, H., M. Ben-David, and D. B. McDonald. 2007. Effects of genotyping protocols on
success and errors in identifying individual river otters (Lontra canadensis) from their
faeces. Molecular Ecology Resources 8:282-289.
20.1-35
Inman, R. M., M. L. Packila, K. H. Inman, B. Aber, R. Spence, and D. McCauley. 2009.
Greater Yellowstone wolverine program, progress report – December 2009. Wildlife
Conservation Society, North America Program, General Report, Bozeman, Montana,
USA.
Jones, C., W. J. McShea, M. J. Conroy, and T. H. Kunz. 1996. Capturing mammals. Pages
115–155 in D. E. Wilson, F. R. Cole, J. D. Nichols, R. Rudran, and M. S. Foster,
editors. Measuring and monitoring biological diversity: standard methods for
mammals. The Smithsonian Institution, Washington, D.C., USA.
Katzner, T. E. 1994. Winter ecology of the pygmy rabbit (Brachylagus idahoensis) in
Wyoming. M.S. Thesis. University of Wyoming, Laramie, USA.
Kelt, D. A., M. S. Hafner, and the American Society of Mammalogists’ ad hoc Committee
for Guidelines on Handling Rodents in the Field. 2010. Updated guidelines for
protection of mammalogists and wildlife researches from hantavirus pulmonary
syndrome (HPS). Journal of Mammalogy 91:1524-1527.
King, T. L., J. F. Switzer, C. L. Morrison, M. S. Eackles, C. C. Young, B. A. Lubinski, and
P. Cryan. 2006. Comprehensive genetic analyses reveal evolutionary distinction of a
mouse (Zapus hudsonius preblei) proposed for delisting from the U.S. Endangered
Species Act. Molecular Ecology 15:4331-4359.
Knox, L., and M. Grenier. 2010. Evaluation of swift fox survey techniques completion
report. Pages 205-212 in A.C. Orabona, editor. Threatened, endangered, and nongame
bird and mammal investigations. Wyoming Game and Fish Department Nongame
Program, Lander, USA.
Koen, E. L., J. C. Ray, J. Bowman, F. N. Dawson, and A. J. Magoun. 2008. Surveying and
monitoring wolverines in Ontario and other lowland, boreal forest habitats:
recommendations and protocols. NWSI Field Guide FG-06. Ontario Ministry of
Natural Resources, Northwest Science and Information, Thunder Bay, Ontario,
Canada.
Kolbe, J. A., J. R. Squires, and T. W. Parker. 2003. An effective box trap for capturing
lynx. Wildlife Society Bulletin 31:980-985.
Koprowski, J. L. 2002. Handling tree squirrels with a safe and efficient restraint. Wildlife
Society Bulletin 30:101-103.
Krebs, C. J. 1966. Demographic changes in fluctuating populations of Microtus
californicus. Ecological Monographs 36:239-173.
Kucera, T. E., A. M. Soukkala, and W. J. Zielinski. 1996. Photographic bait stations. Pages
25-65 in W. J. Zielinski and T. E. Kucera, technical editors. American marten, fisher,
20.1-36
lynx, and wolverine: survey methods for their detection. USDA Forest Service
General Technical Report PSW-GTR-157, Albany, California, USA.
Kunz, T. H., R. Rudran, and G. Gurri-Glass. 1996a. Human health concerns. Pages 255-
264 in D. E. Wilson, F. R. Cole, J. D. Nichols, R. Rudran, and M. S. Foster, editors.
Measuring and monitoring biological diversity: standard methods for mammals. The
Smithsonian Institution, Washington, D.C., USA.
Kunz, T. H., C. Wemmer, and V. Hayssen. 1996b. Sex, age, and reproductive condition of
mammals. Pages 279-290 in D. E. Wilson, F. R. Cole, J. D. Nichols, R. Rudran, and
M.S. Foster, editors. Measuring and monitoring biological diversity: standard
methods for mammals. The Smithsonian Institution, Washington, D.C., USA.
Larivière, S., and L. R. Walton. 1998. Lontra canadensis. Mammalian Species 587:1-8.
Larrucea, E. S., and P. F. Brussard. 2007. A method for capturing pygmy rabbit in summer.
Journal of Wildlife Management 71:1016-1018.
Mader, D. R. 2004. Basic approach to veterinary care. Pages 147-154 in K. E. Quesenberry
and J. W. Carpenter, editors. Ferrets, rabbits, and rodents. Saunders, St. Louis,
Missouri, USA.
Magoun, A. J., C. D. Long, M. K. Schwartz, K. L. Pilgrim, R. E. Lowell, and P.
Valkenburg. 2011. Integrating motion-detection cameras and hair snags for wolverine
identification. The Journal of Wildlife Management 75:731-739.
Magoun, A. J., J. C. Ray, D. S. Johnson, P. Valkenburg, F. N. Dawson, and J. Bowman.
2007. Modeling wolverine occurrence using aerial surveys of tracks in snow. The
Journal of Wildlife Management 71:2221-2229.
McCord, C. M., and J. E. Cardoza. 1982. Bobcat and lynx. Pages 728-766 in J. A.
Chapman and G. A. Fieldhamer, editors. Wild mammals of North America. Johns
Hopkins University Press, Baltimore, Maryland, USA.
McDonald, L. L., T. R. Stanley, D. L. Otis, D. E. Biggins, P. D. Stevens, J. L. Koprowski,
and W. Ballard. 2011. Recommended methods for range-wide monitoring of prairie
dogs in the United States. U.S. Department of the Interior, U.S. Geological Survey
Scientific Investigations Report 2011-5063, Reston, Virginia, USA.
Meyer, M. D., D. A. Kelt, and M. P. North. 2005. Nest trees of northern flying squirrels in
the Sierra Nevada. Journal of Mammalogy 86:275-280.
Mills, J. N. and J. E. Childs. 2012. Rodent-borne hemorrhagic fever viruses. Pages 254-270
in E. S. Williams and I. K. Barker, editors. Infectious diseases of wild mammals.
Blackwell Publishing, Ames, Iowa, USA.
20.1-37
Mills, J. N., T. L. Yates, J. E. Childs, R. R. Parmenter, T. G. Ksiazek, P. E. Rollin, and C. J.
Peters. 1995. Guidelines for working with rodents potentially infected with
Hantavirus. Journal of Mammalogy 76:716-722.
Morner, T. and E. Addison. 2001. Tularemia. Pages 303-312 in E. S. Williams and I. K.
Barker, editors. Infectious diseases of wild mammals. Blackwell Publishing, Ames,
Iowa, USA.
Nielsen, C. K., and M. A. McCollough. 2009. Considerations on the use of remote cameras
to detect Canada lynx in northern Maine. Northeastern Naturalist 16:153-157.
Oakleaf, B., A. O. Cerovski, and B. Luce. 1996. Nongame bird and mammal plan: a plan
for inventories and management of nongame birds and mammals in Wyoming.
Wyoming Game and Fish Department, Cheyenne.
Olson T. L., J. S. Dieni, F. G. Lindzey, and S. H. Anderson. 2003. Swift fox detection
probability using tracking plate transects in southeast Wyoming. Pages 93-99 in M. S.
Sovada and L. C. Carbyn, editors. The swift fox: ecology and conservation of swift
foxes in a changing world. Canadian Plains Research Center, Regina, Saskatchewan.
Orabona, A., C. Rudd, M. Grenier, Z. Walker, S. Patla, and B. Oakleaf. 2012. Atlas of
birds, mammals, amphibians, and reptiles in Wyoming. Wyoming Game and Fish
Department Nongame Program, Lander.
Orabona-Cerovski, A. 1991. Habitat characteristics, population dynamics, and behavioral
interactions of white-tailed prairie dogs in Shirley Basin, Wyoming. M.S. Thesis.
University of Wyoming, Laramie, USA.
Orloski, K. A., and S. L. Lathrop. 2003. Plague: a veterinary perspective. Journal of the
American Veterinary Medical Association 222:444-448.
Parmenter, R. R., T. L. Yates, D. R. Anderson, K. P. Burnham, J. L. Dunnum, A. B.
Franklin, M. T. Friggens, B. C. Lubow, M. Miller, G. S. Olson, C. A. Parmenter, J.
Pollard, E. Rexstad, T. M. Schenk, T. R. Stanley, and G. C. White. 2003. Small-
mammal density estimation: a field comparison of grid-based vs. web-based density
estimators. Ecological Monographs 73:1-26.
Pasitschnaik-Arts, M., and S. Larivière. 1995. Gulo gulo. Mammalian Species 499:1-10.
Poole, K. G., G. Mowat, and B. G. Slough. 1993. Chemical immobilization of lynx.
Wildlife Society Bulletin 21:136-140.
Quesenberry, K. E., and C. Orcutt. 2004. Basic approach to veterinary care. Pages 13-24 in
K. E. Quesenberry and J. W. Carpenter, editors. Ferrets, rabbits, and rodents.
Saunders, St. Louis, Missouri, USA.
20.1-38
Reynolds, R. P., R. I. Crombie, R. W. McDiarmid, and T. L. Yates. 1996. Voucher
specimens. Pages 63–68 in D. E. Wilson, F. R. Cole, J. D. Nichols, R. Rudran, and
M. S. Foster, editors. Measuring and monitoring biological diversity: standard
methods for mammals. The Smithsonian Institution, Washington, D.C., USA.
Richholt, M., and L. Carbyn. 2003. Using tooth sectioning to age swift fox. Pages 161-166
in M. S. Sovada and L. C. Carbyn, editors. The swift fox: ecology and conservation
of swift foxes in a changing world. Canadian Plains Research Center, Regina,
Saskatchewan.
Rolley, R. E. 1987. Bobcat. Pages 671-681 in M. Novak, J. A. Baker, M. E. Obbard, and B.
Malloch, editors. Wild furbearer management and conservation in North America.
Ministry of Natural Resources, Toronto, Ontario, Canada.
Rosenberg, D. K. and R. G. Anthony. 1993. Differences in trapping mortality rates of
northern flying squirrels. Canadian Journal of Zoology 71:660-663.
Seery, D. B., D. E. Biggins, J. A. Montenieri, R. E. Enscore, D. T. Tanda, and K. L. Gage.
2003. Treatment of black-tailed prairie dog burrows with deltamethrin to control fleas
(Insecta: Siphonaptera) and plague. Journal of Medical Entomology 40:718-722.
Sheets, R. G. 1972. A trap for capturing black-footed ferrets. American Midland
Naturalist 88:461-462.
Squires, J. R., K. S. McKelvey, and L. F. Ruggiero. 2004. A snow-tracking protocol used
to delineate local lynx, Lynx canadensis, distributions. Canadian Field Naturalist 118:
583-589.
Swann, D. E., A. J. Kuenzi, M. L. Morrison, and S. DeStefano. 1997. Effects of blood
sampling on survival of small mammals. Journal of Mammalogy 78:908-913.
Thimmayya, A. C. 2010. Habitat ecology and genetic connectivity of the pygmy rabbit
(Brachylagus idahoensis) across southern Wyoming. M.S. Thesis. University of
Wyoming, Laramie, USA.
Thompson, J., N. Cudworth, and M. Grenier. 2011. Population inventories of jumping mice
(Zapus spp.) in southeastern Wyoming. Pages 150-155 in M. B. Grenier, editor.
Threatened, endangered, and nongame bird and mammal investigations. Wyoming
Game and Fish Department Nongame Program, Lander, USA.
Ulizio, T. J., J. R. Squires, D. H. Pletscher, M. K. Schwartz, J. J. Claar, and L. F. Ruggiero.
2006. The efficacy of obtaining genetic-based identifications from putative wolverine
snow tracks. Wildlife Society Bulletin 34:1326-1332.
20.1-39
U.S. Fish and Wildlife Service [USFWS]. 2004. Preble’s meadow jumping mouse survey
guidelines – revised April 2004. Ecological Services, Colorado Field Office,
Lakewood, USA.
Van Fleet, L. and M. Grenier. 2012. Evaluation of survey techniques for the northern flying
squirrel. Pages 182-193 in M. B. Grenier, B. Abel, and N. Cudworth, editors.
Threatened, endangered, and nongame bird and mammal investigations. Wyoming
Game and Fish Department Nongame Program, Lander, USA.
Van Fleet, L., M. Wells, M. Grenier, and B. Oakleaf. 2006. Canada lynx trapping on the
Shoshone and Bridger-Teton National Forests, Wyoming completion report. Pages
46-54 in A. O. Cerovski, editor. Threatened, endangered, and nongame bird and
mammal investigations. Wyoming Game and Fish Department Nongame Program,
Lander, USA.
Williams, E. S. and I. K. Barker, editors. 2001. Infectious diseases of wild mammals.
Blackwell Publishing, Ames, Iowa, USA.
Wyoming Game and Fish Department [WGFD]. 2010. Wyoming state wildlife action plan.
Wyoming Game and Fish Department, Cheyenne, USA.

20.1-40
ATTACHMENT 1: MAMMAL OBSERVATION RECORD FORM
Rationale – The Nongame Program relies on Mammal Observation Record Forms to track
nongame mammalian observations of interest and validate their identification. This enables
Nongame personnel to plan follow up surveys as necessary. Many mammalian species are easily
confused. Information provided on the form helps Nongame Program personnel determine
whether observers used appropriate criteria to consider and eliminate similar species. The form
is routinely sent to WGFD personnel and the general public to request additional information
about observations.
Species / Observations of Interest – The following list identifies species and geographic regions
for which observations are of particular interest to the Nongame Mammal Program.
Small mammals and Bats – Generally, most small mammals and bats must be captured
for proper identification. Consequently, a mammal observation form is not the
appropriate instrument to record information from encounters. Voucher specimens are
usually collected and cataloged to document new records of species and locations.
American pika – Eastern of Wyoming only
Black-tailed jackrabbit – Southwest corner of Wyoming only
Abert’s squirrel – All observations
Eastern gray squirrel – All observations
Northern flying squirrel – Eastern Wyoming only
Swift fox – Western ½ of Wyoming only
Gray fox – All observations
Ringtail– All observations
Fisher – All observations
Least weasel – All observations except Sheridan County
Wolverine – All observations and tracks
Spotted skunk (eastern and western) – All observations and tracks
Canada lynx – All observations and track

20.1-41
MAMMAL OBSERVATION RECORD
PLEASE RETURN TO: Nongame Mammal Biologist
Wyoming Game and Fish Department
260 Buena Vista Drive
Lander, Wyoming 82520
Species Observed:
Number Observed: Photograph Taken:
Observer’s Name: Telephone:
Address:
Occupation:
Name of Other Observers:
Address of Other Observers:
Agency/Organization:
Reporting Date:
Location (direction and distance from the nearest town or identifiable landmark and legal description of the site):
UTM Coordinates: E N Zone Datum (e.g. NAD83)
Latitude/Longitude Coordinates:
¼ ¼ Section Township Range
Describe Site (details about land use, habitat type, etc.):
COLLECTION OF DEAD ANIMAL:
Currently Held Where?
How Was Specimen Acquired?
OBSERVATION OF LIVE ANIMAL:
Time and Duration of Sighting:
Weather Conditions:
Distance of Observation:
Binoculars Used? Spotting Scope Used?
Description of Animal(s) (color, size, markings):
Body:
Legs and Feet:
Tail:
Head and Face:
Other Comments:
Behavior (describe in observer’s words):
Similar Species and How Observer Eliminated Them:
PLEASE DO NOT WRITE IN THIS SPACE:
Classification:
Confirmed: Probable: Unconfirmed:
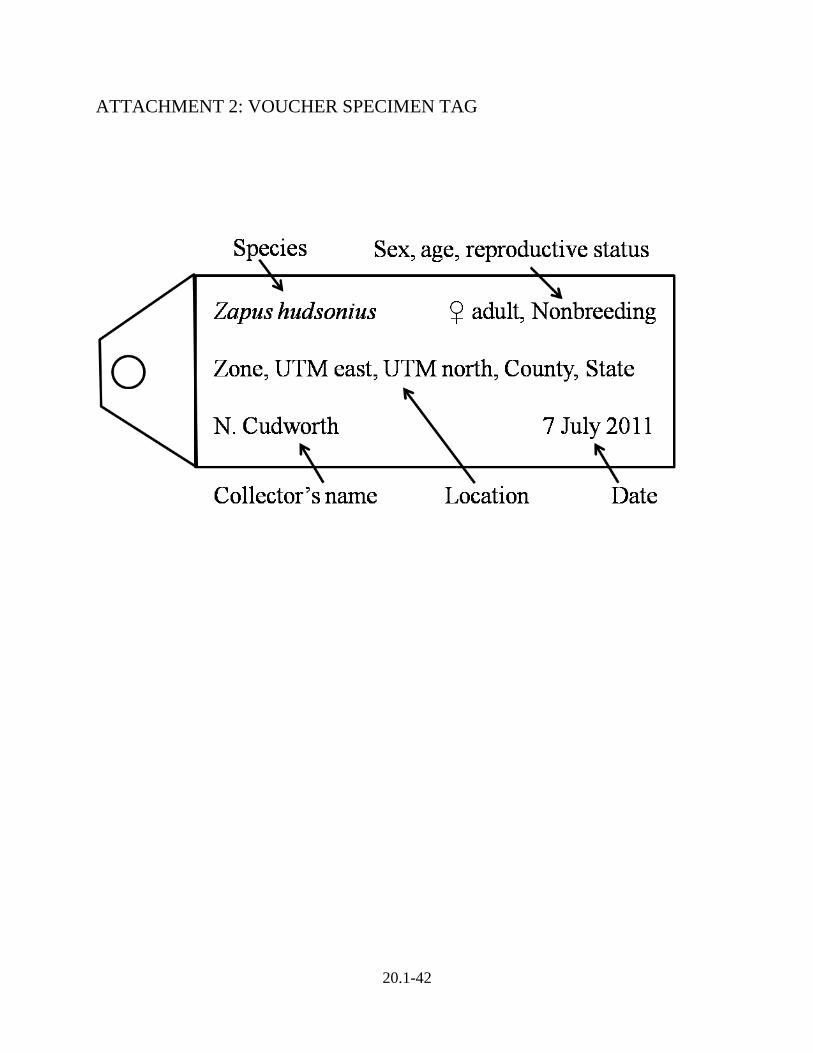
20.1-42
ATTACHMENT 2: VOUCHER SPECIMEN TAG

20.1-43
ATTACHMENT 3: HANDLING RECORD FORM FOR SWIFT FOX
Date:_____________ Survey Area:______________ Field Collector:_____________
Trap Location:____________ Handler:_____________ Processor:_____________
Swift Fox ID #_______________ Sex:_______________ Verified age:_______________
1. Handling start time:_______________
2. Gross weight:_______________Kg
3. Bag weight: _______________ Kg
4. Calculated Animal Weight (GW – TW = CAW) ____________ Kg
5. Current collar frequency: ________________ Khz
6. Turn on and verify new VHF collar frequency: ________________ Khz
7. Affix new radio collar
8. Sex: Male_______________ Female________________
9. Estimated age: Juvenile_______________ Adult_______________
10. Check vitals. Body temperature____________°F Time __________
11. Test and implant transponder chips. Head chip#______-______-______
12. Hair sample: Yes______ No______
13. Draw Blood: (Purple Top) __________ cc (Red Top) __________ cc
14. Measurements (Shoulder Height):_______________cm
15. Right Upper canine measurement (Width) ___________mm (Length) __________ mm
16. Time handling complete: _________
17. Time animal released: ___________ Date Released: _______________
18. Comments (dye mark, teeth, body condition, wounds, irregularities):

20.1-44
ATTACHMENT 4: SPOTLIGHTING RECORD FORM FOR FERRETS

20.1-45
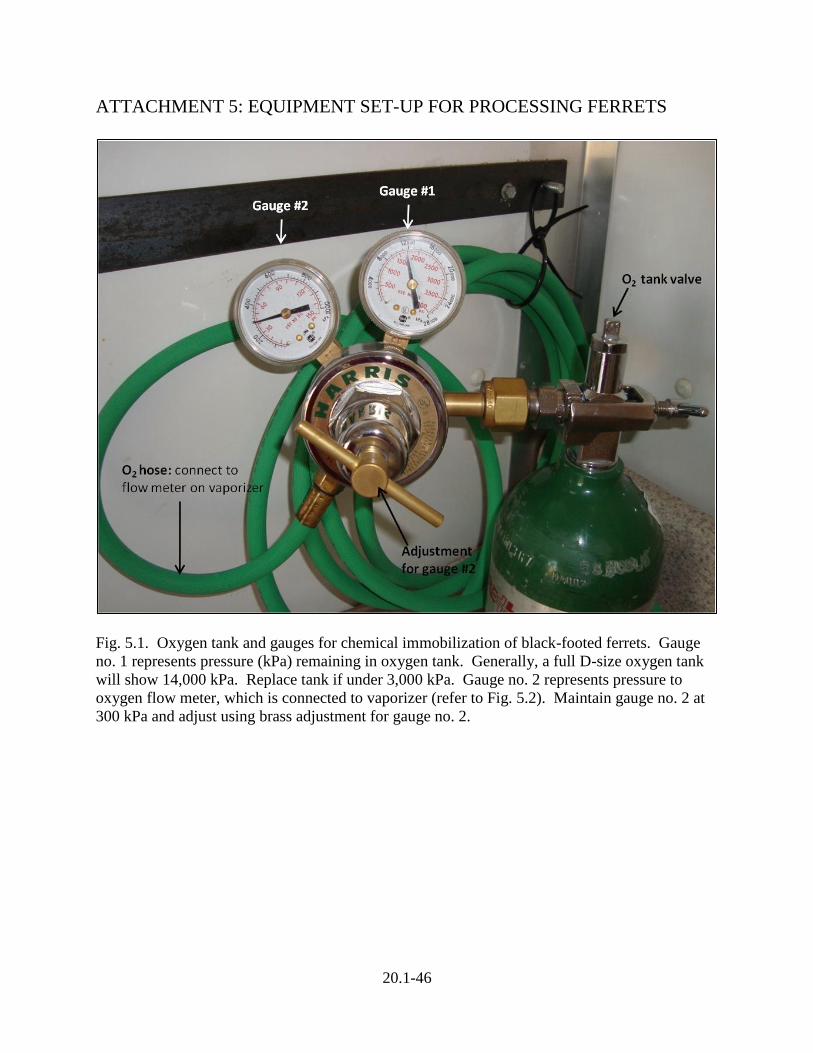
20.1-46
ATTACHMENT 5: EQUIPMENT SET-UP FOR PROCESSING FERRETS
Fig. 5.1. Oxygen tank and gauges for chemical immobilization of black-footed ferrets. Gauge
no. 1 represents pressure (kPa) remaining in oxygen tank. Generally, a full D-size oxygen tank
will show 14,000 kPa. Replace tank if under 3,000 kPa. Gauge no. 2 represents pressure to
oxygen flow meter, which is connected to vaporizer (refer to Fig. 5.2). Maintain gauge no. 2 at
300 kPa and adjust using brass adjustment for gauge no. 2.
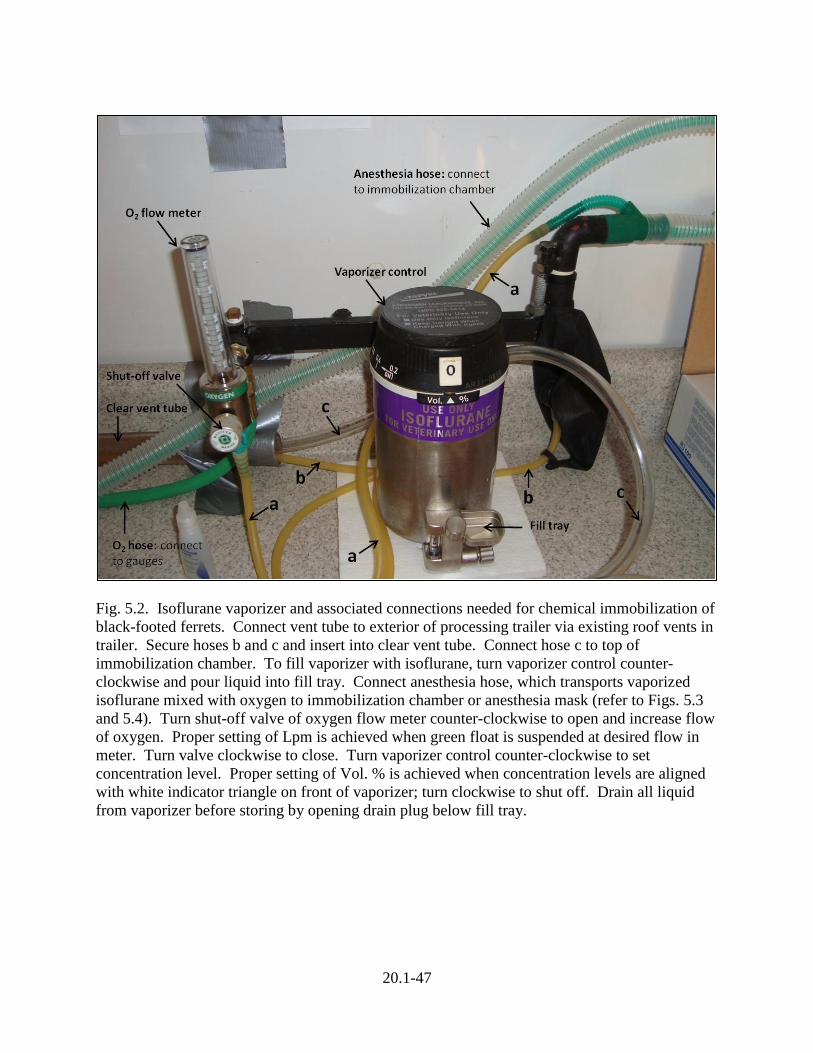
20.1-47
Fig. 5.2. Isoflurane vaporizer and associated connections needed for chemical immobilization of
black-footed ferrets. Connect vent tube to exterior of processing trailer via existing roof vents in
trailer. Secure hoses b and c and insert into clear vent tube. Connect hose c to top of
immobilization chamber. To fill vaporizer with isoflurane, turn vaporizer control counter-
clockwise and pour liquid into fill tray. Connect anesthesia hose, which transports vaporized
isoflurane mixed with oxygen to immobilization chamber or anesthesia mask (refer to Figs. 5.3
and 5.4). Turn shut-off valve of oxygen flow meter counter-clockwise to open and increase flow
of oxygen. Proper setting of Lpm is achieved when green float is suspended at desired flow in
meter. Turn valve clockwise to close. Turn vaporizer control counter-clockwise to set
concentration level. Proper setting of Vol. % is achieved when concentration levels are aligned
with white indicator triangle on front of vaporizer; turn clockwise to shut off. Drain all liquid
from vaporizer before storing by opening drain plug below fill tray.
a
c
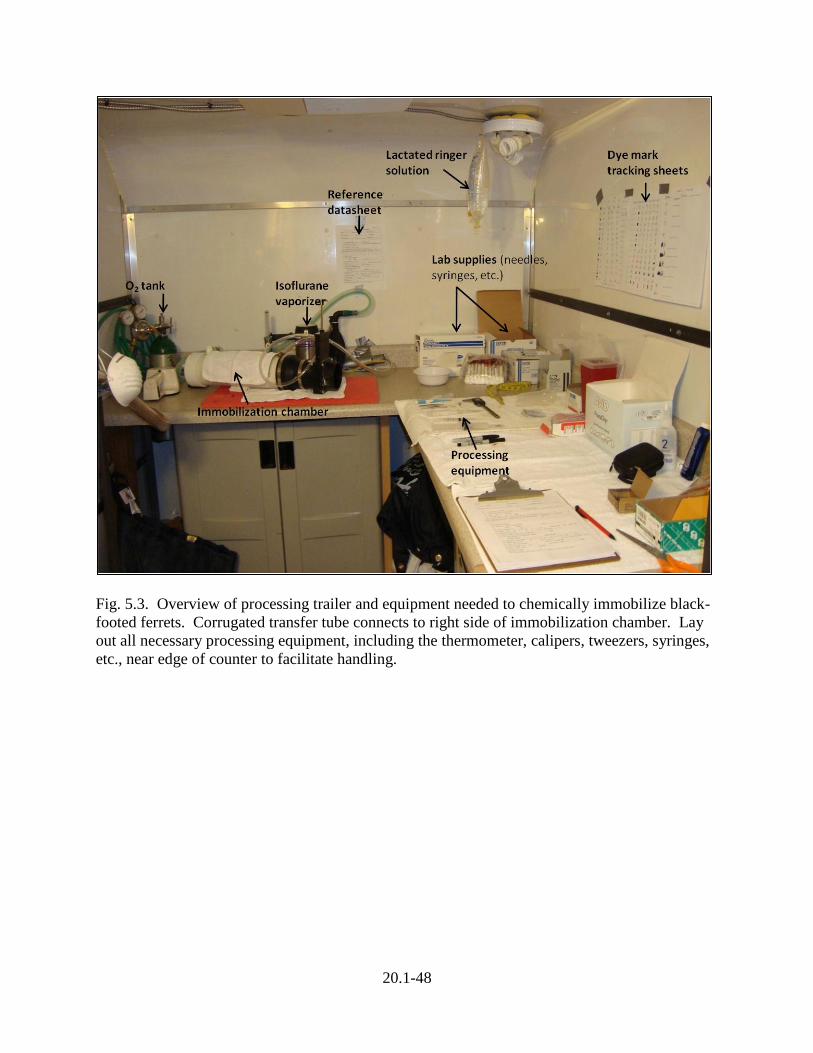
20.1-48
Fig. 5.3. Overview of processing trailer and equipment needed to chemically immobilize black-
footed ferrets. Corrugated transfer tube connects to right side of immobilization chamber. Lay
out all necessary processing equipment, including the thermometer, calipers, tweezers, syringes,
etc., near edge of counter to facilitate handling.
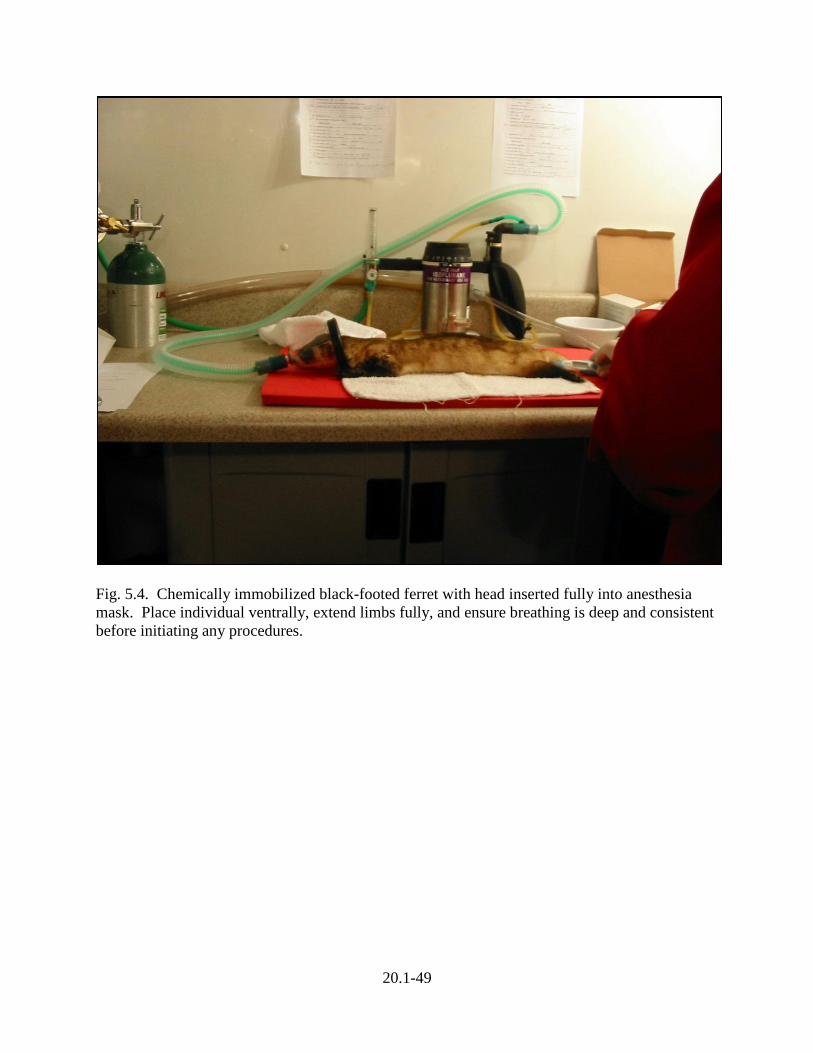
20.1-49
Fig. 5.4. Chemically immobilized black-footed ferret with head inserted fully into anesthesia
mask. Place individual ventrally, extend limbs fully, and ensure breathing is deep and consistent
before initiating any procedures.

20.1-50
ATTACHMENT 6: CHEMICAL IMMOBILIZATION FORM FOR FERRETS
Date:_____________ Survey Area:______________ Field Collector:_____________
Trap Location:____________ Anesthetist:_____________ Recorder:_____________
Ferret ID #_______________ Sex:_______________ Verified age:_______________
19. Anesthesia start time:_______________ (ISO 4.0 and O2 3.5)
20. Time of transfer to face mask:____________ (ISO 2.0 and O2 2.5) [blood (ISO 2.5 / 02 2.0]
21. Sex: Male or Female
22. Estimated age: Kit or Adult
23. Body temperature____________°F
Time Respiration rate
7. Apply eye drops.
8. Scan for existing transponder.
None Head:______-______-______ Hip:______-______-______
9. Hair sample: Yes______ No______
10. Ticks: none 1-10 10-25 25+, if > 25, count _____ Fleas: none 1-10 10-25
25+
11. Blood drawn: Yes ________ No________ If yes, ml drawn _________
12. Upper canine width measurement: _______________mm
13. Test and implant transponder chips.
Head chip#______-______-______ Hip chip#______-______-______
14. Administer penicillin (<1,000 g use 0.3 mL and >1,000 g use 0.4 mL) Yes______ No______
15. Fluids given: Yes______ No ______ If yes, cc given ______ (Lacted Ringer Solution - LRS)
16. Time ISO turned off: _______________ Time O2 turned off: _______________
17. Body length (head to anus):_______________mm (head to tail):_______________mm
18. Dye mark: Color _________ Symbol _________
19. Body weight: _____________ g
20. Comments (swollen teats, teeth, body condition, wounds, irregularities):
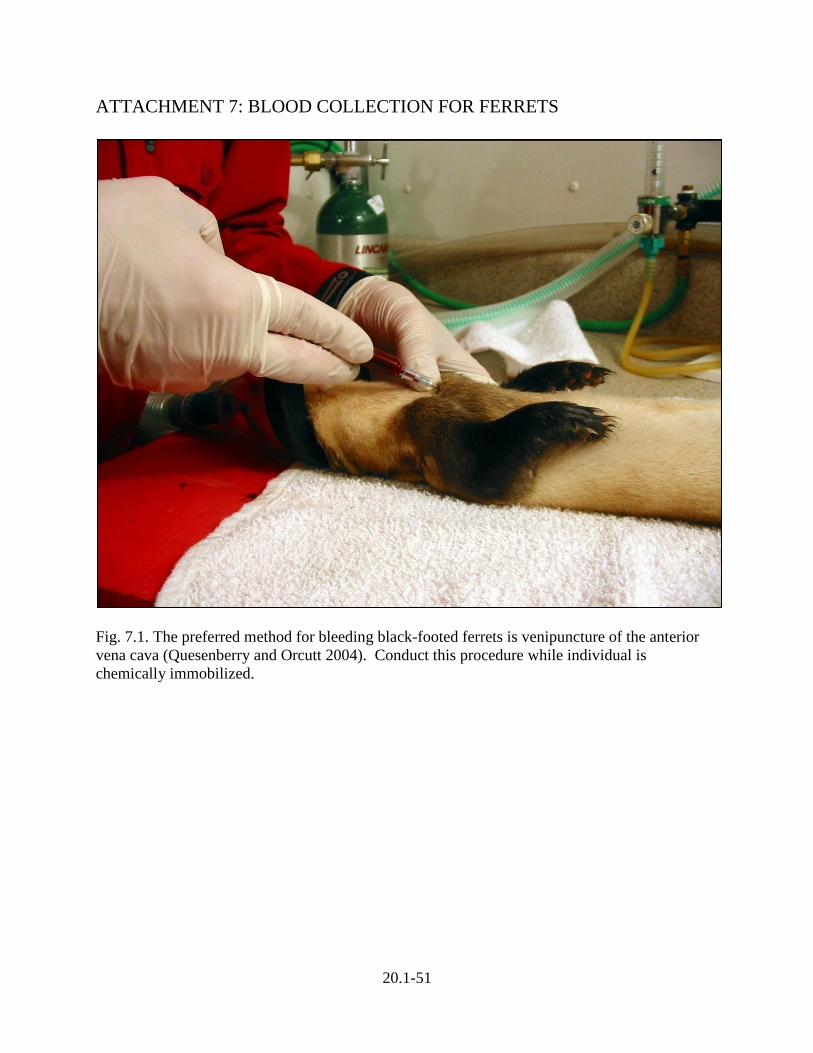
20.1-51
ATTACHMENT 7: BLOOD COLLECTION FOR FERRETS
Fig. 7.1. The preferred method for bleeding black-footed ferrets is venipuncture of the anterior
vena cava (Quesenberry and Orcutt 2004). Conduct this procedure while individual is
chemically immobilized.
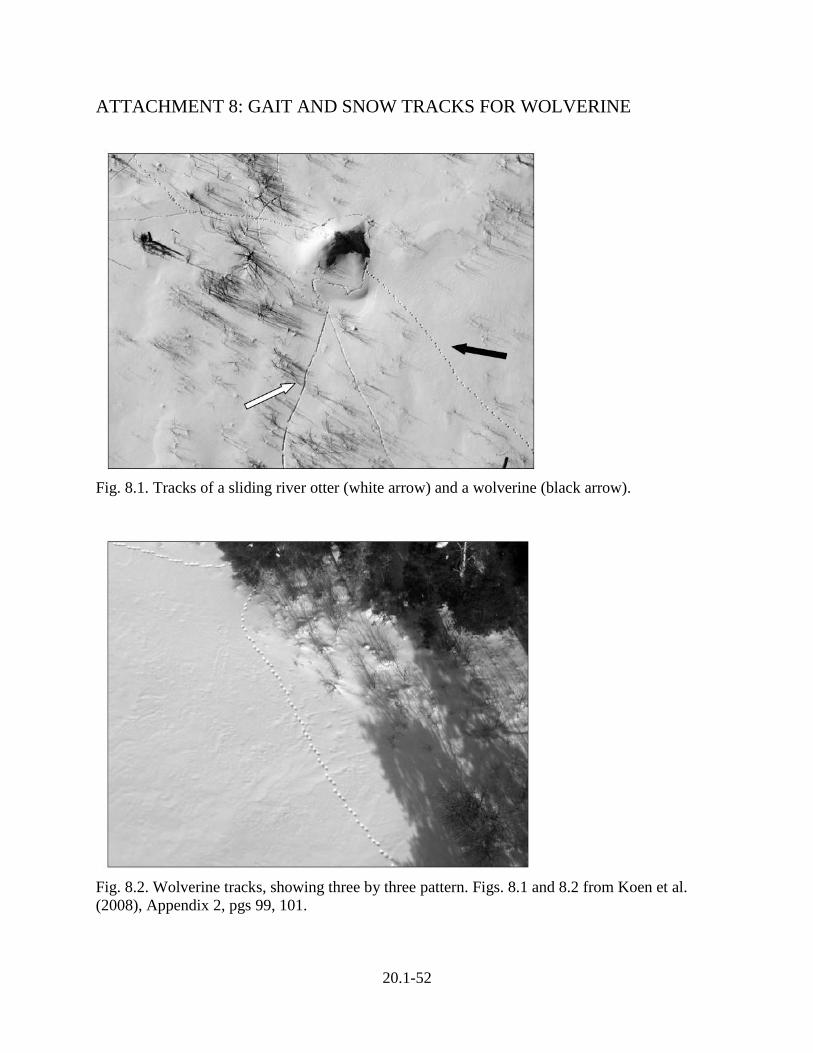
20.1-52
ATTACHMENT 8: GAIT AND SNOW TRACKS FOR WOLVERINE
Fig. 8.1. Tracks of a sliding river otter (white arrow) and a wolverine (black arrow).
Fig. 8.2. Wolverine tracks, showing three by three pattern. Figs. 8.1 and 8.2 from Koen et al.
(2008), Appendix 2, pgs 99, 101.
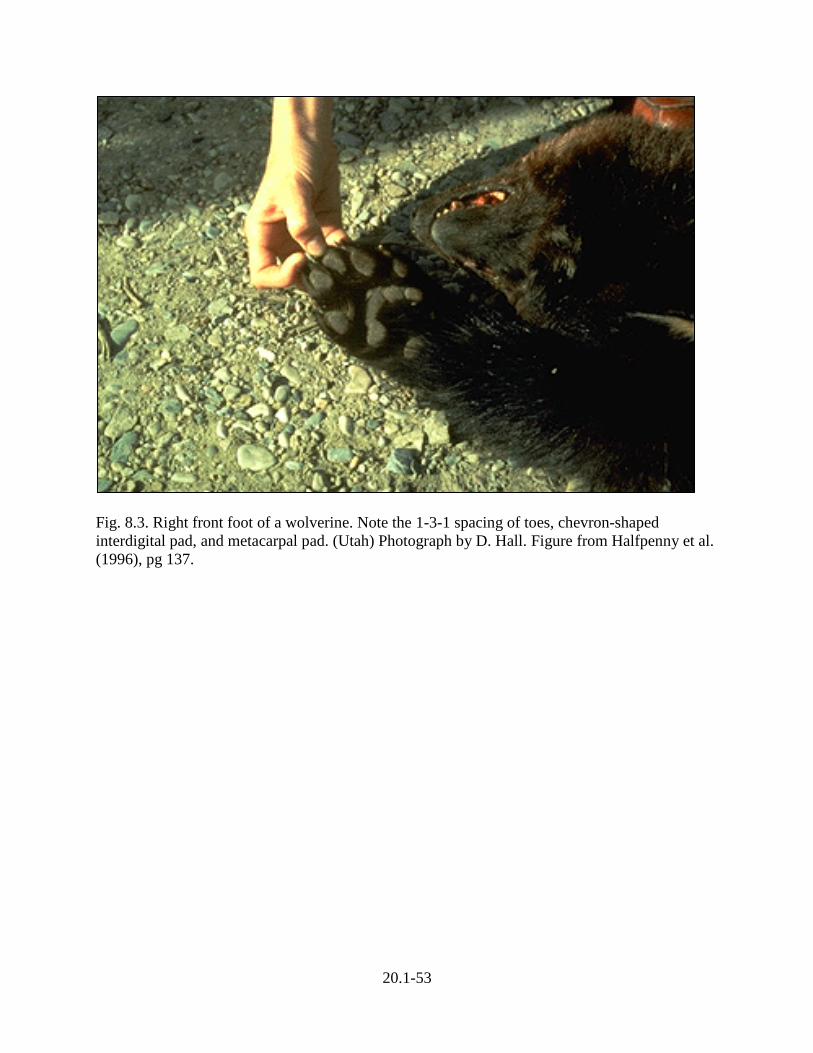
20.1-53
Fig. 8.3. Right front foot of a wolverine. Note the 1-3-1 spacing of toes, chevron-shaped
interdigital pad, and metacarpal pad. (Utah) Photograph by D. Hall. Figure from Halfpenny et al.
(1996), pg 137.
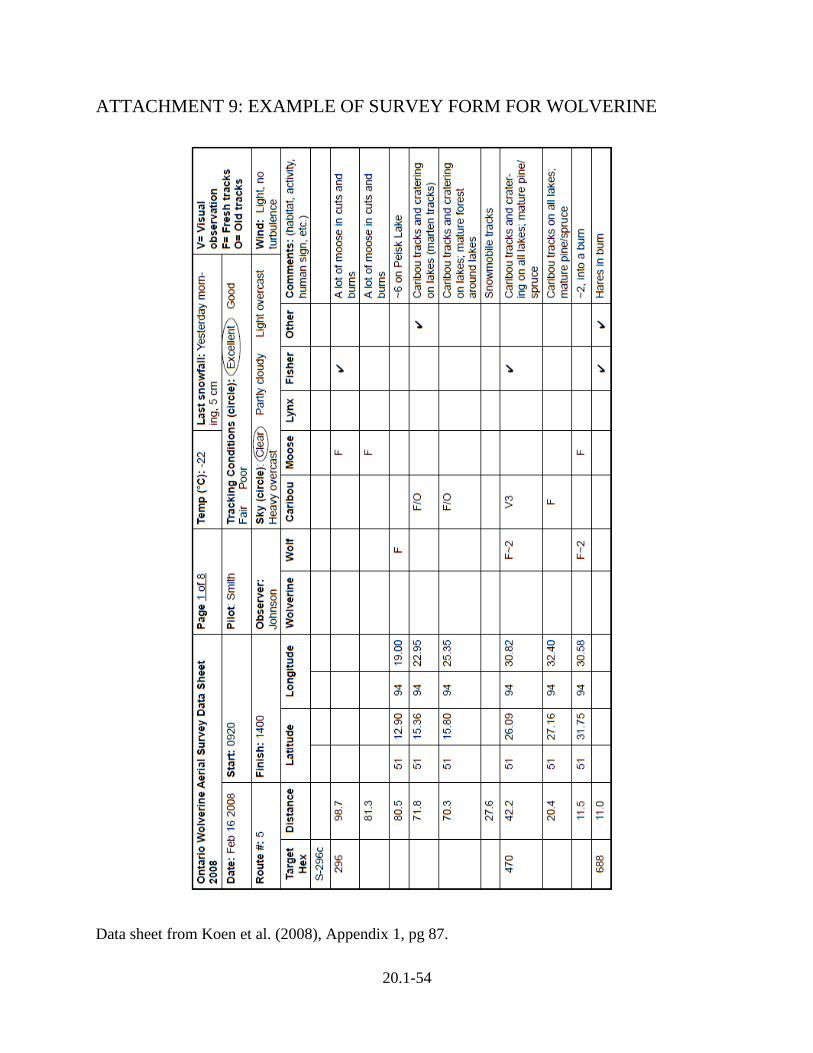
20.1-54
ATTACHMENT 9: EXAMPLE OF SURVEY FORM FOR WOLVERINE
Data sheet from Koen et al. (2008), Appendix 1, pg 87.

20.1-55
ATTACHMENT 10: CHEMICAL IMMOBILIZATION FORM FOR LYNX
Date:_____________ Survey Area:______________ Field Collector:_____________
Trap Location:____________ Anesthetist:_____________ Recorder:_____________
Lynx ID #_______________ Sex:_______________ Verified age:_______________
1. Anesthesia start time:_______________ (0.7 mL Ketamine and 0.3 mL Xylazine) Adult
2. Time of Handling:_______________ (0.5 mL Ketamine and 0.2 mL Xylazine) Kitten
3. Apply eye drops and cover head.
4. Current collar frequency: ________________ Khz
5. Turn on and verify new VHF collar frequency: ________________ Khz
6. Affix new radio collar
7. Sex: Male_______________ Female________________
8. Estimated age: Kitten_______________ Adult_______________
9. Check vitals. Body temperature____________°F Time __________
Time Respiration rate Heart rate Booster (Dosage) Booster (Time)
10. Test and implant transponder chips.
Head chip#______-______-______ Hip chip#__-----_-_None___-_-----_
11. Hair sample: Yes______ No______
12. Gross weight:_______________Kg
13. Tarp Weight: _______________ Kg
14. Calculated Animal Weight (GW – TW = CAW) ____________ Kg
15. Draw Blood: (Purple Top) ___________ (Red Top) __________
16. Body length (Shoulder to Hip):_______________cm (Shoulder Height):_______________cm
(Nose to tip of tail): _____________ cm
17. Right Upper canine measurement (Width) ___________mm (Length) __________ mm
18. Ear Tuft length: __________ cm
19. Check feet and extend claws for observation ____________________________________
20. Time handling complete: _________ Time Yohimbine administered: _________
21. Time animal released: ___________ (0.7 mL Kittens : 1.0 mL Adults)
22. Comments (dye mark, teeth, body condition, wounds, irregularities):
20.2-1
Subchapter 20.2
Bats (Order Chiroptera: Families Vespertilionidae and Molossidae)
Becky L. Abel and Martin B. Grenier
I. INTRODUCTION –
A. Life History – Bats are the only mammal capable of true powered flight. The ability
to fly has enabled bats to become widely distributed and undoubtedly contributed to
their diverse foraging and roosting habits and other behaviors (Hinman and Snow
2003). Indeed, 1,232 living species of bats occupy diverse ecological niches
worldwide (Kunz et al. 2011). Forty-five species are found in the United States
(Wilson and Ruff 1999) including 18 species documented in Wyoming (Table 1; Luce
1998). Bats inhabit all areas of Wyoming and account for 15% of mammalian species,
thus contributing extensively to the State’s biological diversity.
All bats that inhabit Wyoming are nocturnal insectivores, feeding exclusively on
flying insects which they detect by echolocation. In their natural habitats, bats are
capable of consuming up to 100% of their body weight per night (Kurta et al. 1989,
Kunz et al. 2011). As the primary predator of nocturnal insects, bats likely play an
important role in top-down regulation of insect populations (Kunz et al. 1995, Boyles
et al. 2011). A large proportion of the insects bats eat are among North America’s
most costly agricultural and forest pests (Hester and Grenier 2005, Kunz et al. 2011).
Bats have evolved a variety of strategies to capture and eat insect prey, for example
“gleaning” and “aerial hawking.” Bats typically forage throughout the night, with
most activity around sunset when insects are most active.
During May through September, bats roost in locations affording protection from
predation and weather. Roosts are important habitat for mating, pup-rearing, and
energy conservation (Kunz and Lumsden 2003). Bats in Wyoming can be divided into
2 groupings based on roosting ecology: bats that roost in tree cavities, under bark, and
among foliage; and bats that roost in caves, rock crevices, and manmade structures.
Bats occupy day roosts between sunrise and sunset and often select a different roost
for resting between foraging bouts at night. Reproductive females of several species
congregate at maternity roosts to gestate and care for their pups. Maternity roosts are
usually separate from roosts used by males and non-reproductive females. Lactating
females return to the maternity roost frequently to nurse throughout the night rather
than using different night roosts.
Species incapable of long distance migration hibernate during winter within areas that
cannot supply enough insects for sustenance. Bats select hibernacula with suitable
stable conditions: cool temperature, high humidity, and air flow. Additionally,
hibernacula must provide security from predators and other threats. These conditions
are usually found in underground sites such as caves or abandoned mines, or in
cavities deep within old trees (Richardson 2002, Adams 2003, Hinman and Snow
2003).

20.2-2
Bats, unlike other small mammals, are extremely long-lived. Many Wyoming species
live up to 30 years (O’Shea et al. 2003) and most raise only 1 pup annually. Under
normal circumstances, low reproductive rates are offset by long life spans. However,
bat populations are very vulnerable to declines in adult survival. Declines in many bat
populations at both continental and local scales have led to concern about the future of
migratory and resident bats in Wyoming. Reasons for declines are many: habitat loss,
modification, and fragmentation; roost site disturbances; collisions with wind turbines;
pesticides; and emerging pathogens have all been implicated (Hester and Grenier
2005).
Table1. Resident (res), peripheral (per), and accidental (acc) species of bats that occur in
Wyoming. Species of Greatest Conservation Need (SGCN) are indicated at the far right
(Orabona et al. 2009).
Common Name Scientific Name Status SGCN
Western small-footed myotis Myotis ciliolabrum res y
Long-eared myotis Myotis evotis res y
Northern myotis Myotis septentrionalis res y
Little brown myotis Myotis lucifugus res y
Fringed myotis Myotis thysanodes res y
Long-legged myotis Myotis volans res y
Hoary bat Lasiurus cinereus res y
Silver-haired bat Lasionycteris noctivagans res y
Big brown bat Eptesicus fuscus res y
Spotted bat Euderma maculatum res y
Townsend’s big-eared bat Corynorhinus townsendii res y
Pallid bat Antrozous pallidus res y
California myotis Myotis californicus per n
Yuma myotis Myotis yumanensis per n
Eastern red bat Lasiurus borealis per n
Brazilian free-tailed bata Tadarida brasiliensis per n
Eastern pipistrelle Perimyotis subflavus acc n
Big free-tailed bata Nyctinomops macrotis acc n
a Family Molossidae; all other species of bats found in Wyoming are members of the family Vespertilionidae
B. Bat Conservation – Bat conservation efforts in Wyoming began in 1994 when the
Game and Fish Commission approved a nongame wildlife regulation that classified
several wildlife species, including bats, as protected (Hester and Grenier 2005). Bats
are currently protected against intentional take except permitted scientific collection or
when control measures are deemed necessary for reasons of public health and
approved by the Wyoming Game and Fish Department (WGFD).
The Department’s Nongame Program began conducting bat surveys in caves and
abandoned mines throughout the state from 1994-1997. Those surveys provided
baseline data on roost distribution and bat abundance. Since then, the Section has
continued to survey caves and abandoned mines known to be important roosts.
Nongame conducted additional inventories of bats with mist nets and acoustic
detectors in forested habitats during summer from 2007-2011.
20.2-3
The Department’s Nongame Program, in cooperation with the Wyoming Bat Working
Group (WYBWG), drafted the “Conservation Plan for Bats in Wyoming” in 2005.
The conservation plan provides a technical framework to facilitate bat conservation by
summarizing the most current literature on bat ecology and life history, and
recommending conservation actions (Hester and Grenier 2005). In a similar
cooperative venture, Nongame Section developed a strategic plan to coordinate a
statewide response to the threat of White-Nose Syndrome in Wyoming (Abel and
Grenier 2011).
II. SURVEY TECHNIQUES – To conduct bat surveys successfully, investigators must have
an awareness of activity patterns including when and where bats roost and forage. A
multitude of variables can drastically alter activity patterns between survey nights or even
within a single survey. If a comprehensive inventory is the goal, more than one survey
must be conducted at each site in order to maximize probability of detecting all species.
Although bats are primarily nocturnal, individual bats and certain species may emerge as
early as ½ hour before sunset. On the other hand, some bat species are considered late
fliers and typically emerge well after sunset. Under normal conditions, bat activity is
highest during the first half of the night. In most cases surveys should be initiated a
minimum of ½ hour before sunset and continue a minimum of 3 hours after sunset to
maximize detection of all species.
If surveys are intended to document a particular species, focus near suitable roosting habitat
of that species. If the objective is to document a range or diversity of species, focus on
locations that concentrate large numbers of different species. For example, water bodies
provide important foraging habitat and drinking water that attract many bat species.
Additionally, bats use travel corridors such as forest edges and riparian areas to commute
between roosts and foraging areas. When selecting a water feature to survey, choose an
area where water is limited, because bats will often concentrate there. Large water features
are not necessary to attract bats; suitable survey sites can include stock ponds, watering
tanks, and even puddles in 2-track roads. Try to select sites with vegetation or landscape
features that naturally funnel bats into a small area. Always survey a variety of sites
throughout the entire area of interest. Bats often use specific or traditional foraging areas or
roosts. Therefore, negative survey results from a single location are insufficient evidence to
conclude bats are not present; they may be concentrated elsewhere nearby.
Multiple survey methods are most effective to survey bats in a given location because some
species are difficult to detect with standard equipment (Kunz et al. 2009). For example,
calls of Townsend’s big-eared bat are quiet and those of the spotted bat are low in
frequency, both of which may often be difficult to record and accurately identify.
Conversely, certain species of bats are difficult to capture in nets because they fly high or
are adept and nimble flyers that can easily avoid the net. To maximize the number of
species identified, we recommend acoustic surveys in conjunction with capture methods
whenever possible.
A. Acoustic Surveys – Acoustic surveys are used to document presence of bats at specific
locations and to identify roost sites. They can also identify potentially productive sites
for mist-netting. Advanced ultrasonic survey systems such as those developed by

20.2-4
Anabat, Petterson, and Wildlife Acoustics can be used to identify species from a
recorded bat pass, and to determine composition of species within the community. A
“pass” is a discrete event wherein a bat is heard or seen in the vicinity of the observer.
Under most circumstances it is impossible to distinguish between 1 bat that passes by
the detector many times and several bats each passing by the detector once.
1. Audible Bat Surveys –Surveys of species that vocalize in frequencies of 20 kHz
or lower can be done without specialized equipment. In Wyoming, the spotted
bat can be heard without specialized acoustic detectors.
a. Rationale – Audible surveys are an inexpensive, effective method to
document presence of spotted bats.
b. Application – Observers who are unfamiliar with behavior and ecology of
spotted bats should review the species account in the Conservation Plan
for Bats in Wyoming and must have good hearing in high frequency
ranges (Hester and Grenier 2005). Inexperienced observers should receive
formal training or be accompanied by an experienced observer before
conducting surveys alone. Avoid surveying areas when background noise
is excessive because this can inhibit the observer’s ability to detect bats. If
multiple calls are detected simultaneously during a pass, record only the
number of unique individuals. Audible surveys can be conducted during
mist netting or while recorded acoustic surveys are conducted, or they can
be conducted independently using stationary count or transect methods.
Record time and location of each bat pass and habitat type (refer to
Attachment 11: Acoustic Form).
c. Analysis of Data –From stationary counts, report total number of passes
and passes per minute. From transect counts, report total number of
passes only (refer to Attachment 11).
d. Disposition of Data – Send a report containing detection totals to the
Nongame Mammal Biologist at the WGFD Lander Regional Office. The
Nongame Program will incorporate data into the Threatened, Endangered,
and Nongame Bird and Mammal Investigations annual completion report.
Data will also be used to update distribution maps and databases including
the Department’s Wildlife Observation System and the Atlas of Birds,
Mammals, Amphibians, and Reptiles in Wyoming.
2. Heterodyne Acoustic Surveys – Heterodyne detectors are used to document
presence of bats and level of bat activity before capture surveys are conducted.
This type of detector uses a tunable constant internal frequency that combines
with the incoming bat call to produce sum and difference frequency sounds that
are audible through speakers or headphones. The resulting audible sounds
indicate a bat pass. Several manufacturers market a wide range of heterodyne
detectors. Although all models of heterodyne detectors operate similarly, they
vary from under $100 to several hundred dollars and come with a variety of

20.2-5
feature options such as digital displays and frequency scanning. Detectors with a
tunable frequency dial or digital scanner are preferable.
a. Rationale – Heterodyne detectors are used to document presence of bats at
a given location. This is a valuable and cost effective method to identify
areas used by bats.
b. Application – Detectors with tunable frequencies should be set between 20
and 40 kHz, as most bats in Wyoming echolocate within this frequency
range. Some detectors can be tuned to a specific frequency and may be
used to document presence of a target species; however, species
identification is generally difficult with heterodyne detectors because
many species of Myotis emit calls with overlapping frequencies.
Generally, the acoustic survey is conducted at a single location such as
near a water source or roost portal. However, it is also possible to survey
by walking systematically through a survey area. Survey intensity should
ensure adequate coverage of the survey area.
Record time and location of each bat pass, and habitat type (Attachment
11).
c. Analysis of Data – Refer to Section II.A.1.c.
d. Disposition of Data – Send a report containing acoustic detection totals to
the Nongame Mammal Biologist at the WGFD Lander Regional Office
(refer to Section II.A.1.d).
3. Advanced Bat Detection Systems – Bat detection systems that rely on advanced
acoustic technologies such as frequency division, zero crossings analysis, time
expansion, and full spectrum provide the capability to accurately identify species.
Some of the systems using these technologies include AnaBat, Petterson, Binary
Acoustics, and Wildlife Acoustics. Although AnaBat will detect vocalizations of
all Wyoming bat species simultaneously, species identification is time-consuming
and can be difficult for the Myotis species. Petterson, Binary Acoustics, and
Wildlife Acoustics detectors are full spectrum and offer enhanced species
identification by creating a high-resolution call diagram and incorporating
additional call parameters such as harmonics and amplitude.
a. Rationale – Acoustic surveys with advanced detectors are used to
document species presence and composition of bat communities.
b. Application – Acoustic surveys can be conducted actively or passively.
During active surveys, the observer tracks bats in flight with a microphone
to obtain more complete recordings and fewer fragmentary call sequences.
The observer also records field notes to assist with data analysis. Passive
surveys are conducted with acoustic recording devices in stationary
locations and do not require an observer to be present. Passive surveys
allow an area to be covered with multiple acoustic units or multiple areas
can be surveyed simultaneously. Both active and passive surveys can be
20.2-6
completed in conjunction with other types of surveys (refer to Section
II.B.1). If passive surveys are not associated with capture surveys,
program detectors to operate the entire night whenever possible.
When detectors are set up, record location, habitat type, and weather
conditions (refer to Attachment 11). Also record detector settings,
memory card identification number, and equipment number. After the
survey, download files containing call recordings. Call files are stored on
a network drive or external hard drive and organized in separate
directories corresponding to each survey site or date. Call files recorded
with AnaBat detectors are qualitatively identified to species based on
known call parameters of Wyoming bats. This method is time consuming,
as each individual call needs to be identified by an experienced observer.
When calls cannot be identified to species, they should be assigned to
species groupings such as 40-kHz bats, 50-kHz bats, and so forth. The
analysis of call files recorded with full spectrum detectors, such as
Petterson, Binary Acoustics, or Wildlife Acoustics models, may be
automated using SonoBat version 3.02 or later. Calls that cannot be
identified by the automatic process will also need to be identified
manually.
Record length of survey, number of species present, number of passes
recorded for each species, and total number of passes.
c. Analysis of Data – Convert the number of passes by each species and total
number of passes to passes per hour (refer to Attachment 11).
d. Disposition of Data – Send a report summarizing acoustic detection totals
and if possible, provide acoustic files to the Nongame Mammal Biologist
at the WGFD Lander Regional Office (refer to Section II.A.1.d).
B. Capture Surveys – A Chapter 33 Permit must be obtained from the Department prior
to capturing and handling bats.
A wide variety of techniques have been developed to capture bats. They range from
simple techniques such as hand capture to more complex techniques requiring highly
specialized equipment such as harp traps. Capture method varies depending on target
species, accessibility, and survey objectives. Only mist nets and harp traps are
discussed in this section because the simpler techniques have only specialized
applications and are not widely utilized.
Identify potentially productive capture sites by conducting acoustic surveys (refer to
Section II.A) beforehand. Both mist nets and harp traps are suitable capture methods
to deploy near roosts, however special care should be taken to avoid harming young
bats or causing roost abandonment.
Capture probability varies among bat species and some may go undetected at a given
site. For example, high-flying species such as hoary and silver-haired bats are more
difficult to capture than lower-flying species such as little brown bat. Some less

20.2-7
abundant species may not be represented in capture samples obtained during a single
survey period. To effectively detect all species present in the area, the observer should
survey multiple nights and utilize a detector to supplement capture data. If multiple
surveys are planned, avoid trapping on consecutive nights and change net locations
and configurations to improve success (Kunz and Brock 1975).
If possible, sample survey sites at least twice each year and during two different
seasons. Schedule the first sampling period in early summer to assess the community
of adult bats. Schedule the second sampling period during August, after young are
volant (i.e., capable of flying), to assess reproduction.
1. Mist Net – Mist nets are the most commonly used equipment for capturing bats
because they are lightweight, compact, relatively inexpensive, and easy to
transport and erect in the field (Kunz et al. 2009). Mist nets can be deployed
virtually anywhere.
a. Rationale – Mist nets are used to determine species composition and
relative abundance. Additional information such as sex, reproductive
status, and health can also be obtained (Hester and Grenier 2005).
b. Application – Mist nets can be deployed successfully in almost any
location bats are expected to fly, and are effective for capturing bats at
ground, sub-canopy, and canopy levels. Capture success is usually highest
near water sources and flyways such as forest gaps, trails, and mountain
ridges. Avoid large bodies of water where flight patterns are not
concentrated enough to funnel bats into the nets. Choose smaller ponds
that are less than 1.2 m deep, enabling personnel to wade and reach the
upper pocket of the net. When netting over streams, choose streams with
slow-moving water or large pools. Set the lowest shelf cord close enough
to the water surface so bats do not fly beneath the net; however, keep the
net pocket high enough to ensure captured bats do not contact the water.
The number of mist nets often depends on size of the area being surveyed.
Larger areas require multiple nets. Nets can be deployed in many patterns,
including H, T, V, W, X, Y, and Z configurations. Triple-high canopy
nets can also be utilized where appropriate. Properly set, mist nets have
distinct pockets formed by the netting and shelf cords. Avoid sagging
nets. Stabilize net poles by anchoring guy ropes to other objects such as
stakes, tree limbs, or large rocks.
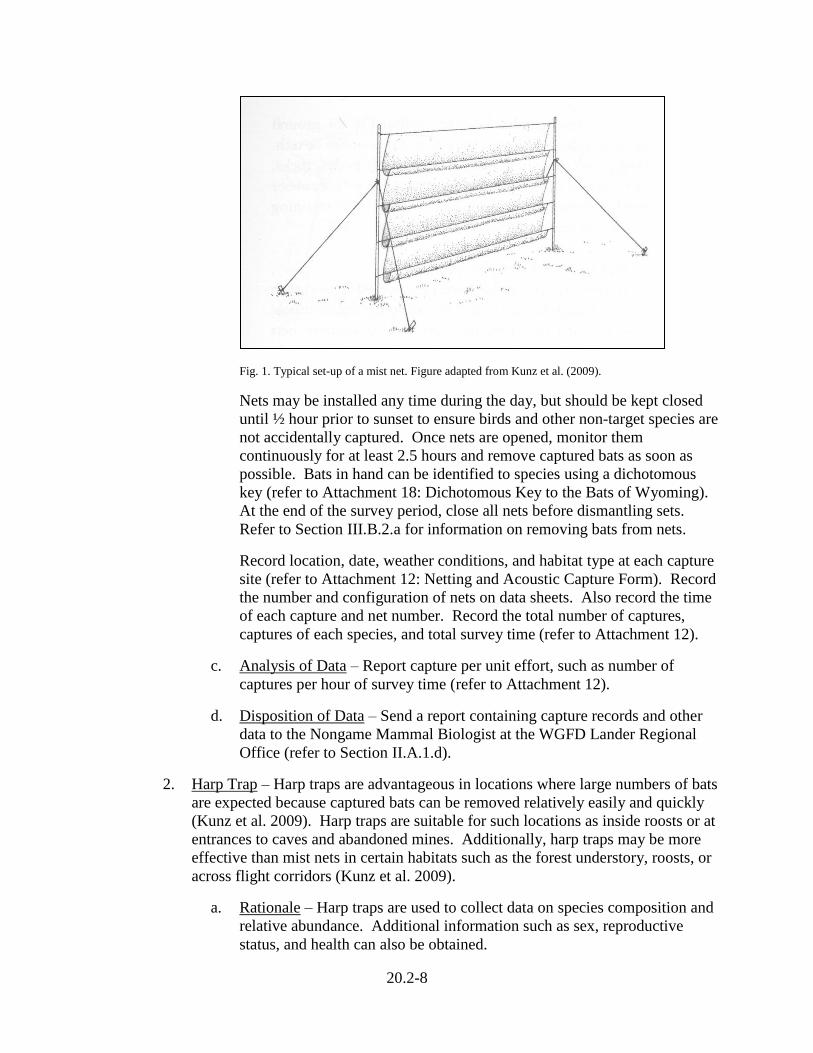
20.2-8
Fig. 1. Typical set-up of a mist net. Figure adapted from Kunz et al. (2009).
Nets may be installed any time during the day, but should be kept closed
until ½ hour prior to sunset to ensure birds and other non-target species are
not accidentally captured. Once nets are opened, monitor them
continuously for at least 2.5 hours and remove captured bats as soon as
possible. Bats in hand can be identified to species using a dichotomous
key (refer to Attachment 18: Dichotomous Key to the Bats of Wyoming).
At the end of the survey period, close all nets before dismantling sets.
Refer to Section III.B.2.a for information on removing bats from nets.
Record location, date, weather conditions, and habitat type at each capture
site (refer to Attachment 12: Netting and Acoustic Capture Form). Record
the number and configuration of nets on data sheets. Also record the time
of each capture and net number. Record the total number of captures,
captures of each species, and total survey time (refer to Attachment 12).
c. Analysis of Data – Report capture per unit effort, such as number of
captures per hour of survey time (refer to Attachment 12).
d. Disposition of Data – Send a report containing capture records and other
data to the Nongame Mammal Biologist at the WGFD Lander Regional
Office (refer to Section II.A.1.d).
2. Harp Trap – Harp traps are advantageous in locations where large numbers of bats
are expected because captured bats can be removed relatively easily and quickly
(Kunz et al. 2009). Harp traps are suitable for such locations as inside roosts or at
entrances to caves and abandoned mines. Additionally, harp traps may be more
effective than mist nets in certain habitats such as the forest understory, roosts, or
across flight corridors (Kunz et al. 2009).
a. Rationale – Harp traps are used to collect data on species composition and
relative abundance. Additional information such as sex, reproductive
status, and health can also be obtained.

20.2-9
b. Application – Harp traps can be deployed in almost any location bats are
expected to fly and are effective for capturing bats at ground and sub-
canopy levels. Harp traps can also be deployed in many different
situations including locations where the trap must be suspended. Because
of the relatively small capture area, effectiveness of harp traps can be
increased by using mist nets to funnel bats into the trap (Kunz et al. 2009).
Record number of harp traps, mist nets, and their configuration on data
sheets for future reference.
Harp traps may be set anytime during the day up to ½ hour prior to sunset.
Once installed, harp traps can be monitored continuously or periodically,
such as every 15 minutes, for a minimum of 2.5 hours. Captured bats
should be removed regularly during monitoring intervals. Refer to Section
III.A for additional information on handling bats after capture and see
Attachment 18 for species identification.
Record the location, date, weather conditions, and habitat (refer to
Attachment 12). Also record the time of each capture and net number.
Bats in hand can be identified to species using a dichotomous key (refer to
Attachment 18).
c. Analysis of Data – Refer to Section II.B.1.c
d. Disposition of Data – Send a report containing capture records and other
data to the Nongame Mammal Biologist at the WGFD Lander Regional
Office (refer to Section II.A.1.d).
C. Roost Surveys – Surveys of known or suspected bat roosts are an effective means to
document occupancy, species presence, and seasonal use. However, surveys
conducted by poorly-trained but well intentioned individuals may negatively impact a
roost site, individual bats, and populations, and may place the surveyor at risk of
injury or death. Only trained personnel should conduct roost surveys. Hazards exist
on the surface, around openings, and inside roosts and potential roosts. Several
excellent resources including Altenbach et al. (2002) and Sherwin et al. (2000)
provide specific guidelines for conducting roost surveys. The Nongame Program
maintains a database of known and potential roosts in Wyoming. Personnel planning
to conduct roost surveys should contact the Nongame Mammal Biologist for
assistance and to obtain copies of protocols and additional information.
1. Interior Roost Surveys –
a. Rationale – Interior surveys are done primarily to assess a site’s potential
to serve as a roost for bats and to census bats. Data are used to determine
whether the site is currently used by bats and if so, the species and number
present and seasonality of use.
b. Application – Conduct interior surveys at least once during November-
April and once during June-August. Conduct surveys of roosts known to
be occupied by bats only once every three years during the season of

20.2-10
occupancy. Avoid entering known maternity roosts before August to
minimize impacts. If abundance estimates are required, conduct exit count
surveys during summer (refer to Section II.C.3.a).
Record the survey date, dimensions of the roost entrance, location and
number of bats, and signs of bat use. Signs of bat use include guano,
staining, and insect remains. Note locations of additional openings and
noticeable airflow. Also map the interior of the site including interior
dimensions, lengths of passages and chambers, and record ambient
temperatures and humidity within each chamber and passage (refer to
Attachment 13: Interior Roost Form).
c. Analysis of Data –This type of survey is done for inventory purposes and
there is no data analysis.
d. Disposition of Data – Send a report containing roost data and any bat
observations to the Nongame Mammal Biologist at the WGFD Lander
Regional Office. Roost data will be incorporated into the Wyoming bat
roost database (refer to Section II.A.1.d)
2. Diurnal Exterior Roost Surveys – Exterior surveys can be conducted with
minimal impact to roosts and bats. Risk to the observer is also greatly reduced.
a. Rationale – Diurnal exterior surveys are done primarily to document roost
locations and physical features. Data are useful to identify potential roost
sites and other survey priorities.
b. Application – Diurnal exterior roost surveys can be performed year-round,
however it is preferable to conduct them when snow cover is absent to
ensure potential hazards are visible to the surveyor. It is usually not
possible to determine with certainty whether bats are currently using the
roost.
Record date and time of survey, potential hazards surrounding the site,
substrate, habitat type, actual or approximate size of the portal or shaft,
compass bearing of the opening, slope aspect, and GPS location. At mine
shafts, if possible, record whether a horizontal passage exists (Pierson et
al. 1999; refer to Attachment 14: Exterior Roost Form).
c. Analysis of Data –This type of survey is done for inventory purposes and
there is no data analysis.
d. Disposition of Data – Send a report containing roost data to the Nongame
Mammal Biologist at the WGFD Lander Regional Office (refer to Section
II.A.1.d and II.C.1.c).

20.2-11
3. Nocturnal Exterior Roost Surveys –
a. Exit count surveys –
i. Rationale – Exit counts are conducted to document bat presence and
count the numbers individuals at roost sites. These surveys cause
minimal impact and require no special training. Exit surveys are
particularly useful at sites that cannot be safely entered. Species are
difficult to identify in flight, so identification of species is not a
priority for this survey.
ii. Application – Visually count the number of bats exiting a roost at
dusk. The observer should be positioned so exiting bats are backlit
against the sky to enhance their visibility. Terminate surveys 1 hour
after sunset, when no additional bats are observed exiting the roost, or
when it is too dark to accurately count. If possible, repeat exit
surveys at least twice during a season. A tally counter is
recommended to minimize errors.
Record the roost location and type, presence and condition of any
gates, and other physical features. Also record survey start and end
times, number of bats observed, time of first exit, and time of last exit
(refer to Attachment 15: Exit Count Form).
iii. Analysis of Data – Convert the total number of bats observed to bats
exiting per hour (refer to Attachment 15).
iv. Disposition of Data – Send a report containing exit count data to the
Nongame Mammal Biologist at the WGFD Lander Regional Office
(refer to Section II.A.1.d).
b. Acoustic roost surveys –
v. Rationale – Acoustic surveys are useful to document summer use and
presence of bats at potential roost sites. This method is not suitable
for identification of most species because bats exiting a roost do not
emit foraging calls, which are diagnostic for species identification.
Acoustic surveys of roosts are particularly useful at roosts that cannot
be entered safely.
vi. Application – Surveys should be conducted June - September.
Depending on the model of detector used (refer to Section II.A),
surveys can be conducted either actively (i.e., observer is present and
operating the detector) or passively (i.e., detectors record data while
observer is absent). Initialize surveys ½ hour before sunset and
monitor the roost entrance a minimum of 2.5 hours. Locate survey
stations 30-50 m from the roost entrance to reduce risk to the surveyor
and maximize quality of call sequences. If possible, repeat surveys at
least twice during a season.

20.2-12
Record the date and time of survey, length of survey, habitat type,
distance from detector to roost, number of total passes, number of
passes by each species, time of first pass, and time of last pass. If
actively surveying, also note whether bats are flying into or out of the
roost (refer to Attachment 11).
vii. Analysis of Data – Convert both the total number of passes and passes
by each species to passes per hour (refer to Attachment 11).
viii. Disposition of Data – Send a report containing roost data and acoustic
detection totals to the Nongame Mammal Biologist at the WGFD
Lander Regional Office (Section II.A.1.d and II.C.1.c). If possible,
also include the acoustic files.
b. Roost capture surveys –
i. Rationale – Capture surveys are commonly done to survey for bats
using a roost and to identify species, sex, and reproductive status.
ii. Application – Prior to conducting capture surveys, confirm presence
of bats through use of acoustic equipment (refer to Section II.C.3.a) or
by conducting an exit count (refer to Section II.C.3.b). The size of the
capture device will vary depending on the opening (refer to Section
II.B). Once capture devices are deployed, monitor them continuously
a minimum of 2.5 hrs and remove bats as soon as possible after each
capture. Use plastic polysheeting to seal portions of the portal not
covered by the capture device to prevent bats from evading capture.
If mist nets are used, place nets a few feet in front of the portal so the
surveyor has access to both sides to remove both incoming and
outgoing bats.
Record physical conditions and measurements (refer to Section
II.C.2.d), date and time of survey, weather conditions, capture device
locations and configurations, and bat data (refer to Section II.B.1.c;
Attachment 16: Roost Capture Form). Record the total number of
captures, total captures of each species, and total survey time.
iii. Analysis of Data – Report captures per unit effort, such as number of
captures per hour of survey time (refer to Attachment 16).
iv. Disposition of Data – Send a report containing roost data and capture
records to the Nongame Mammal Biologist at the WGFD Lander
Regional Office (refer to Section II.A.1.d and II.C.1.c).
III. IMMOBILIZATION, HANDLING, AND MARKING –
A. Immobilization – Bats are small and easy to handle, therefore chemical
immobilization is unnecessary.
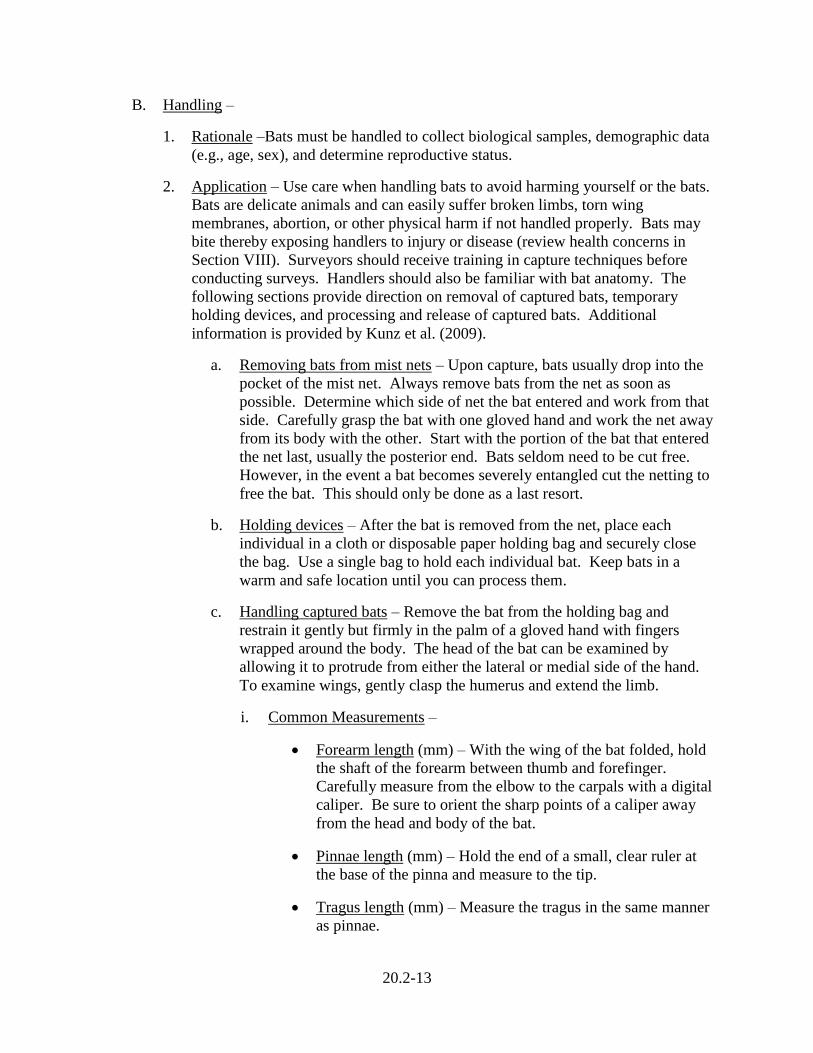
20.2-13
B. Handling –
1. Rationale –Bats must be handled to collect biological samples, demographic data
(e.g., age, sex), and determine reproductive status.
2. Application – Use care when handling bats to avoid harming yourself or the bats.
Bats are delicate animals and can easily suffer broken limbs, torn wing
membranes, abortion, or other physical harm if not handled properly. Bats may
bite thereby exposing handlers to injury or disease (review health concerns in
Section VIII). Surveyors should receive training in capture techniques before
conducting surveys. Handlers should also be familiar with bat anatomy. The
following sections provide direction on removal of captured bats, temporary
holding devices, and processing and release of captured bats. Additional
information is provided by Kunz et al. (2009).
a. Removing bats from mist nets – Upon capture, bats usually drop into the
pocket of the mist net. Always remove bats from the net as soon as
possible. Determine which side of net the bat entered and work from that
side. Carefully grasp the bat with one gloved hand and work the net away
from its body with the other. Start with the portion of the bat that entered
the net last, usually the posterior end. Bats seldom need to be cut free.
However, in the event a bat becomes severely entangled cut the netting to
free the bat. This should only be done as a last resort.
b. Holding devices – After the bat is removed from the net, place each
individual in a cloth or disposable paper holding bag and securely close
the bag. Use a single bag to hold each individual bat. Keep bats in a
warm and safe location until you can process them.
c. Handling captured bats – Remove the bat from the holding bag and
restrain it gently but firmly in the palm of a gloved hand with fingers
wrapped around the body. The head of the bat can be examined by
allowing it to protrude from either the lateral or medial side of the hand.
To examine wings, gently clasp the humerus and extend the limb.
i. Common Measurements –
Forearm length (mm) – With the wing of the bat folded, hold
the shaft of the forearm between thumb and forefinger.
Carefully measure from the elbow to the carpals with a digital
caliper. Be sure to orient the sharp points of a caliper away
from the head and body of the bat.
Pinnae length (mm) – Hold the end of a small, clear ruler at
the base of the pinna and measure to the tip.
Tragus length (mm) – Measure the tragus in the same manner
as pinnae.

20.2-14
Weight (g) – Using a 50-60 g spring scale, weigh the holding
bag containing each bat. Later subtract the weight of each
empty bag.
ii. Common examinations –
Calcar assessment – Examine the calcar located on the
posterior edge of the uropatagium (i.e., tail membrane).
Report whether or not a keel is present.
Determination of sex and species –Identify the sex and species
of the bat based on criteria outlined in the Wyoming
dichotomous key for bats (refer to Attachment 18).
Determination of age – Refer to Section IV.A.
Determination of sex – Refer to Section IV.B.
Reproductive assessment – Refer to Section IV.C.
iii. Other examinations –
Wing damage index (WDI) – Examine both wing membranes
for physical damage as well as damage resulting from white-
nose syndrome infection (refer to Section VIII). Refer to
Attachment 12 for reporting guidelines.
d. Releasing Captured Bats – To release a bat, first be sure it is warm and not
in a state of torpor. In most cases the bat will launch itself from the
observer’s open hand after a brief reorientation. Watch the bat fly away to
ensure it doesn’t drop to the ground where it is likely to be injured.
Record the following information from each individual captured: time of
capture, weight, forearm length, pinnae length, and presence or absence of
a keeled calcar. Once the species is identified, record sex, age,
reproductive status, condition of wing membranes, and any additional
notes. Finally, report the time the bat was released from captivity (refer to
Attachment 12).
3. Analysis of Data – Calculate the number of bats captured per hour of survey (refer
to Attachment 12).
4. Disposition of Data – Send a report with capture records and data to the Nongame
Mammal Biologist at the WGFD Lander Regional Office (refer to Section
II.A.1.d).
C. Marking –Marking bats is not recommended due to their small size and susceptibility
to injury (Ellison 2008, Kunz and Weise 2009).
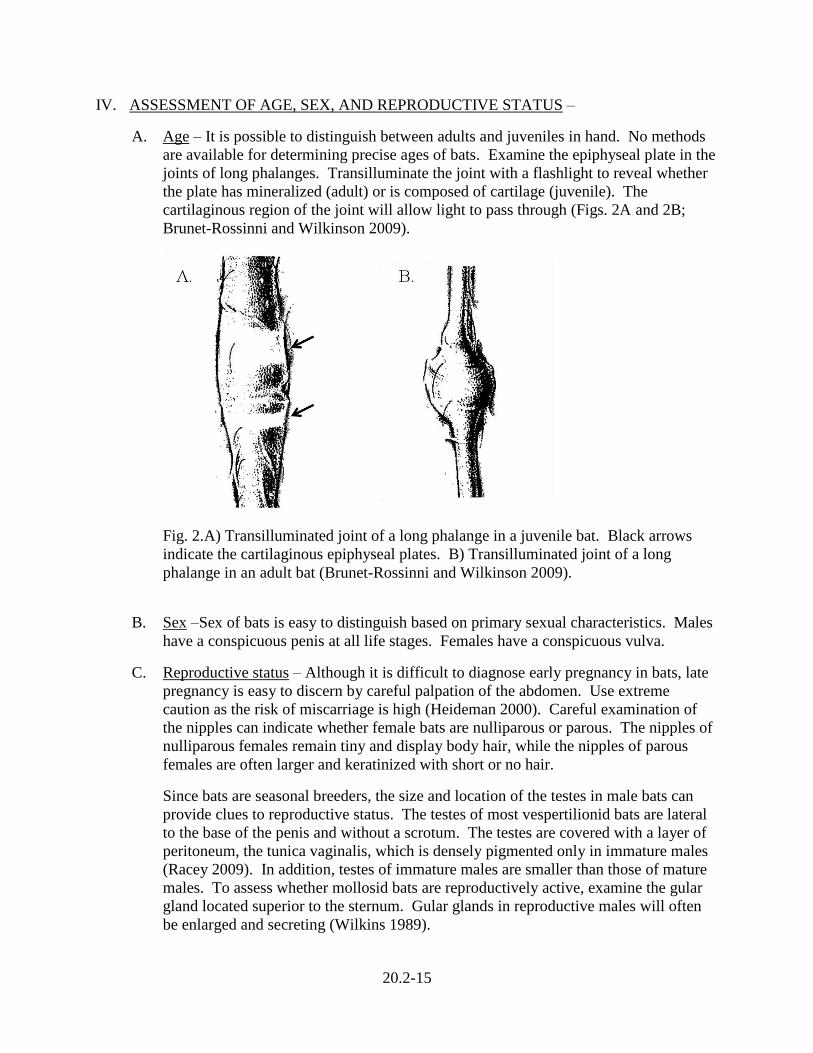
20.2-15
IV. ASSESSMENT OF AGE, SEX, AND REPRODUCTIVE STATUS –
A. Age – It is possible to distinguish between adults and juveniles in hand. No methods
are available for determining precise ages of bats. Examine the epiphyseal plate in the
joints of long phalanges. Transilluminate the joint with a flashlight to reveal whether
the plate has mineralized (adult) or is composed of cartilage (juvenile). The
cartilaginous region of the joint will allow light to pass through (Figs. 2A and 2B;
Brunet-Rossinni and Wilkinson 2009).
Fig. 2.A) Transilluminated joint of a long phalange in a juvenile bat. Black arrows
indicate the cartilaginous epiphyseal plates. B) Transilluminated joint of a long
phalange in an adult bat (Brunet-Rossinni and Wilkinson 2009).
B. Sex –Sex of bats is easy to distinguish based on primary sexual characteristics. Males
have a conspicuous penis at all life stages. Females have a conspicuous vulva.
C. Reproductive status – Although it is difficult to diagnose early pregnancy in bats, late
pregnancy is easy to discern by careful palpation of the abdomen. Use extreme
caution as the risk of miscarriage is high (Heideman 2000). Careful examination of
the nipples can indicate whether female bats are nulliparous or parous. The nipples of
nulliparous females remain tiny and display body hair, while the nipples of parous
females are often larger and keratinized with short or no hair.
Since bats are seasonal breeders, the size and location of the testes in male bats can
provide clues to reproductive status. The testes of most vespertilionid bats are lateral
to the base of the penis and without a scrotum. The testes are covered with a layer of
peritoneum, the tunica vaginalis, which is densely pigmented only in immature males
(Racey 2009). In addition, testes of immature males are smaller than those of mature
males. To assess whether mollosid bats are reproductively active, examine the gular
gland located superior to the sternum. Gular glands in reproductive males will often
be enlarged and secreting (Wilkins 1989).
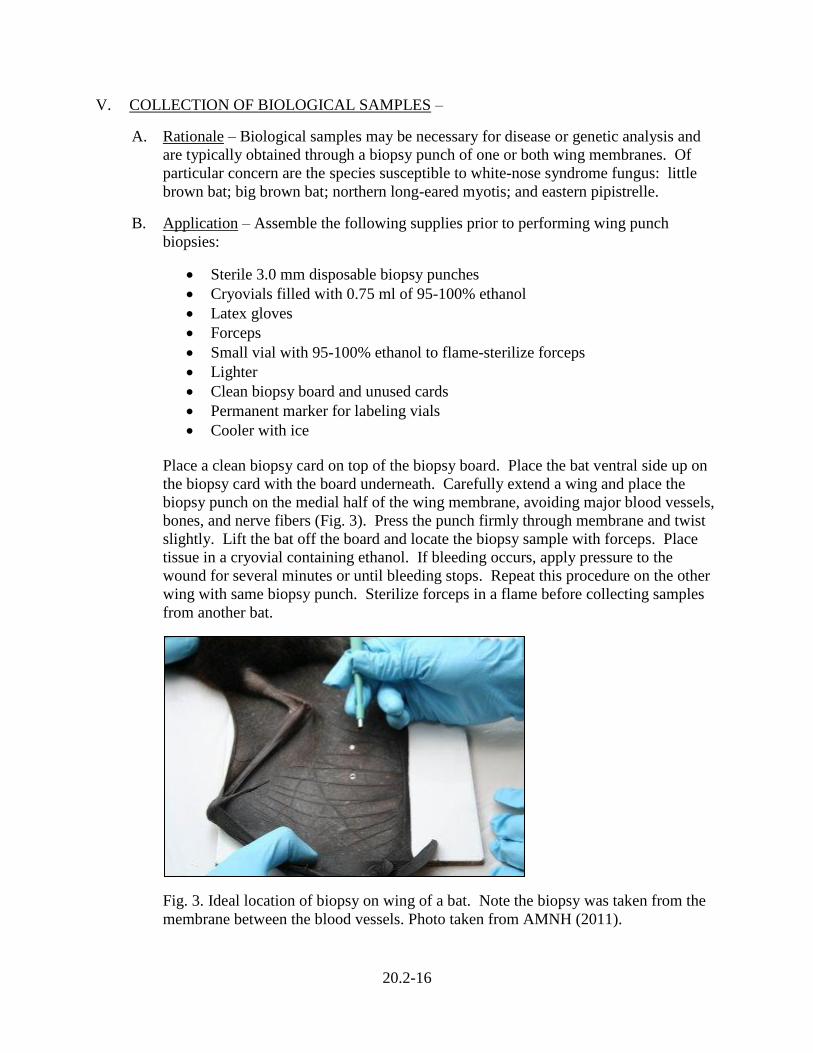
20.2-16
V. COLLECTION OF BIOLOGICAL SAMPLES –
A. Rationale – Biological samples may be necessary for disease or genetic analysis and
are typically obtained through a biopsy punch of one or both wing membranes. Of
particular concern are the species susceptible to white-nose syndrome fungus: little
brown bat; big brown bat; northern long-eared myotis; and eastern pipistrelle.
B. Application – Assemble the following supplies prior to performing wing punch
biopsies:
Sterile 3.0 mm disposable biopsy punches
Cryovials filled with 0.75 ml of 95-100% ethanol
Latex gloves
Forceps
Small vial with 95-100% ethanol to flame-sterilize forceps
Lighter
Clean biopsy board and unused cards
Permanent marker for labeling vials
Cooler with ice
Place a clean biopsy card on top of the biopsy board. Place the bat ventral side up on
the biopsy card with the board underneath. Carefully extend a wing and place the
biopsy punch on the medial half of the wing membrane, avoiding major blood vessels,
bones, and nerve fibers (Fig. 3). Press the punch firmly through membrane and twist
slightly. Lift the bat off the board and locate the biopsy sample with forceps. Place
tissue in a cryovial containing ethanol. If bleeding occurs, apply pressure to the
wound for several minutes or until bleeding stops. Repeat this procedure on the other
wing with same biopsy punch. Sterilize forceps in a flame before collecting samples
from another bat.
Fig. 3. Ideal location of biopsy on wing of a bat. Note the biopsy was taken from the
membrane between the blood vessels. Photo taken from AMNH (2011).
20.2-17
Record the date, location, and capture information (Section III.B) on the netting and
acoustic capture form (Attachment 12). Be sure to label the cryovial with a unique
identification number to cross-reference the biopsy sample with capture data from the
same bat.
C. Analysis of Data – There is no data analysis associated with this type of survey.
D. Disposition of Data – Notify the Nongame Mammal Biologist that tissue samples are
being shipped. Send samples to:
Nongame Mammal Biologist
Wyoming Game and Fish Department
260 Buena Vista Dr.
Lander, Wyoming, 82520
VI. EUTHANASIA –
A. Rationale – Bats with serious injuries or disease should be humanely euthanized.
Occasionally, a biological voucher specimen may be necessary to test for rabies or
WNS fungus, or may be needed to positively identify species.
B. Application – Only experienced personnel should euthanize bats. We recommend the
following three methods: inhalants, cervical dislocation, or thoracic compression
(Simmons and Voss 2009).
1. Liquid inhalant anesthetics: Isoflurane – Soak a cotton ball with isoflurane. Place
the soaked cotton ball and holding bag containing the bat inside a heavy-duty
plastic ziplock bag. Seal the plastic bag and allow sufficient time for the
anesthetic gas to euthanize the bat (MIRWG 2008).
2. Cervical dislocation – Euthanize small bats weighing ≤60 g by cervical
dislocation. Hold the bat in one hand with the index finger across the throat and
thumbnail on the back of the neck. Quickly pull backward on the hind limbs with
the other hand so pressure from the thumbnail causes separation of the cervical
vertebrae (Simmons and Voss 2009).
3. Thoracic compression – Euthanize small bats weighing ≤50 g by thoracic
compression. Quickly and firmly compress the bat’s chest between your thumb
and forefinger. Force all air out of the lungs and maintain compression for at least
2 minutes until the heart stops beating (Simmons and Voss 2009).
Fill out a specimen tag (refer to Chapter 20.1, Attachment 2: Voucher Specimen Tag).
Record notes including whether the specimen was found dead or was euthanized, the
method by which it was euthanized, and a unique reference number to match any
photos taken. Attach the specimen tag to the carcass. Place each carcass in its own
plastic bag; close and seal the bag with tape.

20.2-18
If multiple specimens are processed at a time, place all individually bagged specimens
inside a larger second bag and seal. Mark second bag with:
Number of animals and species
Date
Location (Lat/long, UTM, County, State, etc.)
Collector(s) (name, address, phone)
Line a hard-sided cooler with a third plastic bag and place absorbent material inside.
Place enough frozen ice packs (sealed) inside the third bag to keep carcasses cold. Do
not use dry ice. Seal the third bag securely. Mark package with appropriate
information: “Tissue samples from dead animals; Biological Substance, Category B,
UN3373”.
C. Analysis of Data – There is no data analysis associated with this type of survey.
D. Disposition of Data – Notify the Nongame Mammal Biologist that specimens are
being shipped. If photographs were taken, mark them with the same unique reference
number assigned to the specimens. Include photos of the specimen that are not fuzzy
or blurry in the package with specimens or email them to the WGFD Lander Regional
Office. Send samples to:
Nongame Mammal Biologist
Wyoming Game and Fish Department
260 Buena Vista Dr.
Lander, Wyoming, 82520
VII. HUMAN-BAT INTERACTIONS – Over half the bat species found in the US are known to
roost in or on buildings at least occasionally, however only two species are known to roost
in buildings in Wyoming (Adams 2003, Kunz and Reynolds 2003). Unfortunately, this
sometimes places them in conflict with humans (Fenton 2003). In many cases, owners are
not bothered by or even aware of bats roosting in or on their houses and buildings (Olson
1991). Large concentrations of bats can cause odors and accumulations of guano.
However many roosts are small and do not cause problems other than deposition of
droppings (Brown and Berry 1991, Luce 1998, Tigner 2002). Although people are
occasionally concerned about transmission of rabies and other diseases, bats pose little risk
when roosting outside the living space of humans, such as in attics or on the exterior of
buildings. Nonetheless, direct contact with bats should be avoided and any bites should be
treated as potential rabies transmission cases (refer to Section VI for more details).
Many bats are loyal to specific roosts and studies have shown bats that are excluded from
roosts in buildings often do not survive (Humphrey 1982, Neilson and Fenton 1994,
Brittingham and Williams 2000). Because the vast majority of bat colonies occupying
buildings do not cause problems, they should be allowed to remain in place wherever
possible (Luce 1998).
A. Bat Evictions and Exclusions – If it is necessary to discourage bats from roosting in a
building, eviction and exclusion is the most effective and permanent method (Barclay
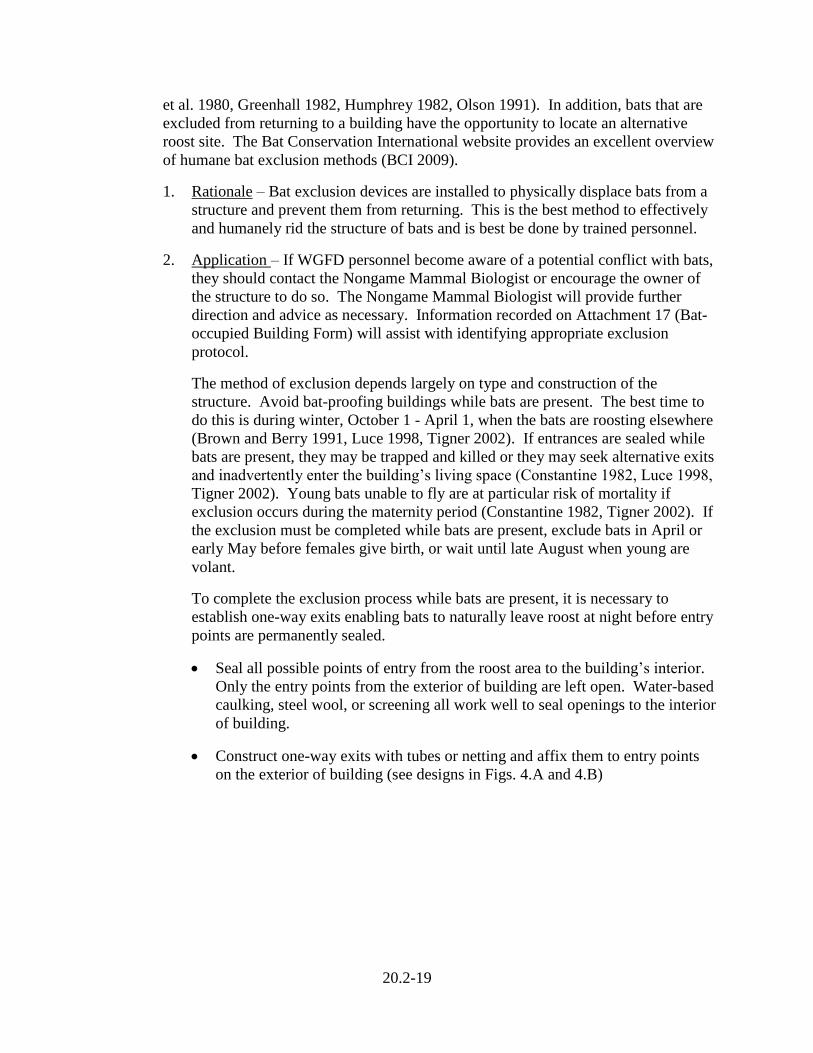
20.2-19
et al. 1980, Greenhall 1982, Humphrey 1982, Olson 1991). In addition, bats that are
excluded from returning to a building have the opportunity to locate an alternative
roost site. The Bat Conservation International website provides an excellent overview
of humane bat exclusion methods (BCI 2009).
1. Rationale – Bat exclusion devices are installed to physically displace bats from a
structure and prevent them from returning. This is the best method to effectively
and humanely rid the structure of bats and is best be done by trained personnel.
2. Application – If WGFD personnel become aware of a potential conflict with bats,
they should contact the Nongame Mammal Biologist or encourage the owner of
the structure to do so. The Nongame Mammal Biologist will provide further
direction and advice as necessary. Information recorded on Attachment 17 (Bat-
occupied Building Form) will assist with identifying appropriate exclusion
protocol.
The method of exclusion depends largely on type and construction of the
structure. Avoid bat-proofing buildings while bats are present. The best time to
do this is during winter, October 1 - April 1, when the bats are roosting elsewhere
(Brown and Berry 1991, Luce 1998, Tigner 2002). If entrances are sealed while
bats are present, they may be trapped and killed or they may seek alternative exits
and inadvertently enter the building’s living space (Constantine 1982, Luce 1998,
Tigner 2002). Young bats unable to fly are at particular risk of mortality if
exclusion occurs during the maternity period (Constantine 1982, Tigner 2002). If
the exclusion must be completed while bats are present, exclude bats in April or
early May before females give birth, or wait until late August when young are
volant.
To complete the exclusion process while bats are present, it is necessary to
establish one-way exits enabling bats to naturally leave roost at night before entry
points are permanently sealed.
Seal all possible points of entry from the roost area to the building’s interior.
Only the entry points from the exterior of building are left open. Water-based
caulking, steel wool, or screening all work well to seal openings to the interior
of building.
Construct one-way exits with tubes or netting and affix them to entry points
on the exterior of building (see designs in Figs. 4.A and 4.B)
20.2-20
Fig. 4. A) One-way netting affixed to an entry point on a building. The netting
is attached securely on three sides, and bottom is left open enabling bats to exit
but not reenter. B) A one-way exit using a smooth plastic tube with a flexible
plastic sleeve attached to the end. The plastic sleeve collapses on itself and
prevents bats from entering the tube from the exterior. Adapted from BCI
(2009).
Leave one-way exits in place for 5-7 days and carefully observe to ensure all
bats have left the structure (BCI 2009). After all bats have exited building,
remove one-way exits and permanently seal openings with caulking, steel
wool, or screening. All possible entrances as small as 1 cm must be
completely sealed to permanently and effectively exclude bats (Luce 1998,
Olson 1991).
Conduct a follow-up inspection to evaluate effectiveness of the exclusion
measures.
Record the address of the structure and owner contact information, structure and
roost data, additional comments, and any follow-up information (Attachment 17).
3. Analysis of Data – There is no data analysis associated with this type of survey.
4. Disposition of Data – Please contact the Nongame Mammal Biologist for advice
before attempting to exclude bats from a structure. After inspecting the building
and/or completing the exclusion process, send a report to the Nongame Mammal
Biologist at the WGFD Lander Regional Office (refer to Section II.A.1.d).
20.2-21
VIII. DISEASES – Rabies and White-nose Syndrome (WNS) are among the relatively few
documented diseases of bats. WNS is named after a conspicuous white fungus, Geomyces
destructans, which invades and erodes the skin of hibernating bats. The fungus causes
hibernating bats to arouse more frequently and deplete fat stores. G. destructans growth
causes a loss of dermal integrity and disrupts skin’s capability to regulate fluid balance.
WNS-affected bats are known to leave hibernacula mid-day during winter presumably to
forage or drink, and to roost in unusual areas of the hibernacula. G. destructans infection is
the ultimate cause of death. However, resulting proximal causes can include starvation,
dehydration, and exposure to cold temperatures (Abel and Grenier 2011, USFWS 2011).
WNS is only known to affect bats and is not a known risk to humans (Abel and Grenier
2011).
Transmission of diseases from bats to humans is rare (Tuttle and Kern 1981). Only two
diseases, rabies and histoplasmosis, are known to be transmissible from bats to humans.
Exposure risks are easy to avoid (Keeley and Tuttle 1999). Anyone handling bats is
considered at risk of contracting rabies and should receive a rabies prophylaxis
immunization (CDC 2011a) prior to handling bats. Histoplasmosis is rare in northern
latitudes and dry western states. Although it is possible for it to develop in environments
such as warm, moist caves, it is rare in Wyoming and has only been documented in one
cave (Luce 1998). As a precautionary measure, wear masks when entering caves.
IX. LITERATURE CITED –
Abel, B. L., and M. B. Grenier. 2011. A Strategic Plan for White-Nose Syndrome in
Wyoming. Wyoming Game and Fish Department, Nongame Program, Lander, WY.
Adams, R. A. 2003. Bats of the Rocky Mountain West: natural history, ecology, and
conservation. Boulder: University Press of Colorado. 289 pp.
Altenbach, J. S., W. Amy, P. V. Bradley, P. E. Brown, K. Dewberry, D. B. Hall, J. Jeffers,
B. Lund, J. E. Newmark, M. J. O’Farrell, et al. 2002. Nevada bat conservation plan.
Austin: Nevada Bat Working Group. 188 pp.
American Museum of Natural History [AMNH]. 2011. Wing punch and hair sampling
protocols. <http://research.amnh.org/vz/mammalogy/donating-bat-tissue-and-hair-
samples-genomic-and-stable-isotope-studies/wing-punch-and-hair-sampling>.
Accessed 21 September 2011.
Barclay R. M. R., D. W. Thomas, M. B. Fenton. 1980. Comparison of methods used for
controlling bats in buildings. Journal of Wildlife Management 44:502-6.
Bat Conservation International [BCI]. 2009. Bats in buildings: a guide to safe and humane
exclusions. <http://www.batcon.org/pdfs/education/fof_ug.pdf>. Accessed 8 August
2011.
Boyles, J. G., P. M. Cryan, G. F. McCracken, and T. H. Kunz. 2011. Economic importance
of bats in agriculture. Science 332:41-42.
20.2-22
Brittingham, M. C., and L. M. Williams. 2000. Bat boxes as alternative roosts for displaced
bat maternity colonies. Wildlife Society Bulletin 28:197-207.
Brown, P. E., and R. D. Berry. 1991. Bats: habitat, impacts, and mitigation. Pages 26-30 in
Proceedings of the Thorne Ecological Institute: issues and technology in the
management of impacted wildlife. Thorne Ecological Institute. Snowmass, Colorado,
USA.
Brunet-Rossinni, A. K., and G. S. Wilkinson. 2009. Methods for age estimation and the
study of senescence in bats. Pages 315-325 in T. H. Kunz and S. Parsons, editors.
Ecological and behavioral methods for the study of bats. Johns Hopkins University
Press, Baltimore, Maryland, USA. 901 pp.
Centers for Disease Control and Prevention [CDC]. 2011a. Rabies. <http://www.cdc.gov/
rabies>. Accessed 9 August 2011.
Centers for Disease Control and Prevention [CDC]. 2011b. Histoplasmosis.
<http://www.cdc. gov/nczved/divisions/dfbmd/diseases/histoplasmosis>. Accessed 9
August 2011.
Constantine, D. G. 1982. Batproofing of buildings by installation of valve-like devices in
entryways. Journal of Wildlife Management 46:507-13.
Ellison, L. E. 2008. Summary and Analysis of the U.S. Government Bat Banding Program:
U.S. Geological Survey Open-File Report 2008-1363, 117 pp.
Fenton, M. B. 2003. Science and the conservation of bats: where to next? Wildlife Society
Bulletin 31:6-15.
Greenhall, A. M. 1982. House bat management. Washington: US Fish and Wildlife
Service. Resource Publication No. 143. 33 pp.
Hester S. G., and M. B. Grenier. 2005. A conservation plan for bats in Wyoming.
Wyoming Game and Fish Department, Nongame Program, Lander, WY.
Hinman, K. E., and T. K. Snow, 2003. Arizona bat conservation strategic plan. Phoenix:
Arizona Game and Fish Department, Nongame and Endangered Wildlife Program.
Report NR 213. 173 pp.
Humphrey, S. R. 1982. Bats. Pages 52-70 in J. A. Chapman, and G. A. Feldhamer, editors.
Wild mammals of North America: biology, management, and economics. Baltimore:
Johns Hopkins University Press, Baltimore, Maryland, USA.
Keeley, B. W., and M. D. Tuttle. 1999. Bats in American bridges. Research Publication no.
4. Austin, TX: Bat Conservation International. 41 p. <http://www.batcon.org/pdfs/
bridges/BatsBridges2.pdf>. Accessed 9 August 2011.
Kunz, T. H., E. Braun de Torrez, D. Bauer, T. Lobova, and T. H. Fleming. 2011.
Ecosystem services provided by bats. Annals of the New York Academy of Sciences
1223:1-38.
20.2-23
Kunz, T. H., and C. E. Brock. 1975. A comparison of mist nets and ultrasonic detectors for
monitoring flight activity of bats. Journal of Mammalogy 58:309-315.
Kunz, T. H., R. Hodgkison, and C. D. Weise. 2009. Methods of capturing and handling
bats. Pages 3-35 in T. H. Kunz and S. Parsons, editors. Ecological and behavioral
methods for the study of bats. Johns Hopkins University Press, Baltimore, Maryland,
USA. 901 pp.
Kunz, T. H., and A. Kurta. 1988. Capture methods and holding devices. Pages 1-30 in T.
H. Kunz, editor. Ecological and behavioral methods for the study of bats.
Smithsonian Institution Press, Washington, DC, USA.
Kunz, T. H., and L. F. Lumsden. 2003. Ecology of cavity and foliage roosting bats. Pages
3-89 in T. H. Kunz and M. B. Fenton, editors. Bat ecology. University of Chicago
Press, Chicago, Illinois, USA. 779 pp.
Kunz, T. H., and D. S. Reynolds. 2003. Bat colonies in buildings. Pages 91-102 in T. J.
O’Shea, and M. A. Bogan, editors. Monitoring trends in bat populations of the United
States and territories: problems and prospects. Information and Technology Report
USGS/BRD/ITR-2003-0003. US Geological Survey, Biological Resources
Discipline. Online: http://www.fort.usgs.gov/products/publications/21329/21329.pdf.
Kunz, T. H., and C. D. Weise. 2009. Methods and devices for marking bats. Pp. 36-56 in T.
H. Kunz and S. Parsons, editors. Ecological and behavioral methods for the study of
bats. Johns Hopkins University Press, Baltimore, Maryland, USA. 901 pp.
Kunz, T. H., J. O. Whitaker, Jr., and M. D. Wadanoli. 1995. Dietary energetic of the
insectivorous Mexican free-tailed bat (Tadarida basiliensis) during pregnancy and
lactation. Oecologia 101:407-415.
Kurta, A., G. Bell, K. Nagy, T. H. Kunz. 1989. Energetics of pregnancy and lactation in
free-ranging little brown bats (Myotis lucifugus). Physiological Zoology 62:804-818.
Luce, B. 1998. Wyoming’s bats: wings of the night. Wyoming Wildlife 62:17-32.
Messenger, S. L., C. E. Rupprecht, and J. S. Smith. 2003. Bats, emerging virus infections,
and the rabies paradigm. Pages 622-679 in T. H. Kunz and M. B. Fenton, editors. Bat
ecology. University of Chicago Press, Chicago, Illinois, USA. 779 pp.
Michigan Rabies Working Group [MIRWG]. 2008. Humane euthanasia of bats for public
health rabies testing. <http://www.michigan.gov/documents/emergingdiseases
/Humane_Euthanasia_of_Bats-Final_244979_7.pdf>. Accessed 20 September 2011.
Neilson A. L., and M. B. Fenton. 1994. Responses of little brown myotis to exclusion and
to bat houses. Wildlife Society Bulletin 22:8-14.
O’Shea, T. J., M. A. Bogan, and L. E. Ellison. 2003. Monitoring trends in bat populations
of the United States and territories: status of the science and recommendations for the
future. Wildlife Society Bulletin 31:16-29.

20.2-24
Olson, R. 1991. Bats: information and management techniques for Wyoming homeowners.
B-945. Laramie: University of Wyoming, Cooperative Extension Service. 27 pp.
Orabona, A., S. Patla, L. Van Fleet, M. Grenier, B. Oakleaf, and Z. Walker. 2009. Atlas of
birds, mammals, amphibians, and reptiles in Wyoming. Wyoming Game and Fish
Department Nongame Program, Lander.
Pierson, E. D., M. C. Wackenhut, J. S. Altenbach, P. Bradley, P. Call, D. L. Genter, C. E.
Harris, B. L. Keller, B. Lengus, L. Lewis, and others. 1999. Species conservation
assessment and strategy for Townsend’s big-eared bat (Corynorhinus townsendii
townsendii and Corynorhinus townsendii pallescens). Idaho Conservation Effort,
Idaho Department of Fish and Game, Boise, USA. 68 pp.
Racey, P. A. 2009. Reproductive assessment of bats. Pages 249-264 in T. H. Kunz and S.
Parsons, editors. Ecological and behavioral methods for the study of bats. Johns
Hopkins University Press, Baltimore, Maryland, USA. 901 pp.
Racey, P. A., and A. C. Entwhistle. 2003. Conservation ecology of bats. Pages 680-743 in
T. H. Kunz and M. B. Fenton, editors. Bat ecology. University of Chicago Press,
Chicago, Illinois, USA. 779 pp.
Richardson, P. 2002. Bats. Washington: Smithsonian Institute Press. 112 pp.
Simmons, N. B. and R. S. Voss. 2009. Collection, preparation, and fixation of bat
specimens and tissues. Pages 849-867 in T. H. Kunz and S. Parsons, editors.
Ecological and behavioral methods for the study of bats. Johns Hopkins University
Press, Baltimore, Maryland, USA. 901 pp.
Sherwin R. E., D. Stricklan, and D. S. Rogers. 2000. Roosting affinities of Townsend’s big-
eared bat (Corynorhinus townsendii) in northern Utah. Journal of Mammalogy
81:939-947.
Tidemann, C. R., and D. P. Woodside. 1978. A collapsible bat-trap and a comparison of
results obtained with the trap and with mist nets. Australian Wildlife Research 5:335-
362.
Tigner, J. 2002. Bats in buildings. South Dakota Conservation Digest 69:22-23.
Tuttle, M. D., and S. J. Kern. 1981. Bats and public health. Contributions in Biology and
Geology, Milwaukee Public Museum 48:1-11.
US Fish and Wildlife Service [USFWS]. 2011. About White-Nose Syndrome.
<http://www.fws.gov/whitenosesyndrome/about.html>. Accessed 9 August 2011.
Wilkins, K. T. 1989. Tadarida Brasiliensis. Mammalian Species 331:1-10.
Wilson, D. E., and S. Ruff, eds. 1999. The Smithsonian book of North American mammals.
Smithsonian Institution Press, Washington, DC, USA. 750 pp.

ATTACHMENT 11: ACOUSTIC FORM
20.2-25
SM2 ACOUSTIC SURVEY FORM SITE INFORMATION Site ID: WP#: Locality (e.g. Place name/drainage):
Property owner: Elevation (m): Observers (circle recorder):
Picture # (if applicable):
Confirm Datum: NAD83 GPS EPE (m):
GPS Location of Waypoint (UTM): Zone (circle): 12 or 13 ; E: ; N:
SESSION INFORMATION Date (mm/dd/yy): Time of civil sunset (24hr): Phase of Moon:
Time Activated (24 hr): Time Deactivated (24 hr): Survey Length:
Detector #: SD Card #: Gain: SNR: Height:
Site type (Check): □ Lake/reservoir □ Pond □ Marsh □ Stream
□ Spring □ Flight corridor □ Cave/mine □ Roost;
□ Other:______________________________
Habitat type (Check): □ Grassland □ Riparian □ Aspen/Decid. □ Cliff/Cave/Canyon/Rock-outcrop □ Montane/subalpine forest □ Shrub
steppe □ Lower montane forest □ Pinyon-juniper □ Other:__________________________________________________
SM2 Configuration: Sketch (grid cell size :_________) Notes (Placement, veg. species, etc. During active surveys at roost sites, note whether bats observed flying into or out of the roost entrance):
WEATHER DATA Temperature
(C) Barometric Pressure
(inHg) Wind (mph) Relative Humidity (%)
Cloud Cover (%)
Survey Start:
Survey End:
Precip in last 24 hrs? (Y/N) NOTES:
TOTALS # Passes Pass/Hr # Passes Pass/Hr # Passes Pass/Hr
ANPA _______ _______ MYCA _______ _______ MYTH _______ _______ Total Species _______
COTO _______ _______ MYCI _______ _______ MYVO _______ _______ Total # Bat Passes _______
EPFU _______ _______ MYEV _______ _______ MYYU _______ _______ Total Pass/Hour _______
EUMA _______ _______ MYLU _______ _______ PIHE _______ _______
LABO _______ _______ MYSE _______ _______ NYMA _______ _______
LACI _______ _______ LANO _______ _______ TABR _______ _______

ATTACHMENT 12: NETTING AND ACOUSTIC CAPTURE FORM
21.2-26
ACOUSTIC AND NETTING CAPTURE FORM
SITE INFORMATION Site ID (R = replacement) BLM Map Locality (e.g., Drainage, HWY, reference pts):
Roost Type (Cave, Mine, Other, n/a): Elevation (m): Observers (full name; circle recorder)
Property Owner: Contact:
Confirm Datum : NAD 83 GPS EPE (m): WP #:
GPS Location of capture site (UTM): Zone: _______; Easting ___________________________; Northing ______________________________
SESSION INFORMATION
Date (mm/dd/yy): Time of civil sunset (24hr): Phase of Moon:
Time Nets Open (24hr): Time Nets Closed (24hr): Total hrs (to Qtr): No. of Net Sets:
Net Configuration and Bat Detector (BD) Placements: Sketch (grid cell size: ________m) and include net #’s # 2.6m: ________
# 6m: _________
# 9m: _________
# 12m: ________
# 18m: ________
Triple-high Net: _______
2.6m, 6m, 9m, 12m, 18m
Harp Trap: _______
Total net (m): ________
Habitat type (Check): □ Grassland □ Riparian □ Aspen/Decid.
□ Cliff/Cave/Canyon/Rock-outcrop □ Montane/subalpine forest
□ Shrub steppe □ Lower montane forest □ Pinyon-juniper □ Other:__________________________________________________
Site type (Check): □ Lake/reservoir □ Pond □ Marsh
□ Stream □ Spring □ Flight corridor □ Cave/mine
□ Roost
□ Other:______________________________________________
Other plant/animal spp observed:
Distance to nearest water/ type of water:
NOTES:
WEATHER
DATA Temperature
(C) Barometric Pressure
(inHg) Wind (mph)
Relative Humidity (%)
Cloud Cover (%)
Survey Start:
Survey End:
Precip in last 24 hrs? (Y/N) NOTES:

ATTACHMENT 12: NETTING AND ACOUSTIC CAPTURE FORM
21.2-27
BAT DETECTOR SETUP
Capture Site Detector
(A)
Acoustic ID________; Detector ID:___________;
WP#:________; SD CARD #:_______
Acoustic Site Detector
(B)
Acoustic ID________; Detector ID:___________;
WP#:________; SD CARD #:_______
UTM (Zone, Easting, Northing)
T m E m N UTM
T m E m N
Elevation (m)
Time Activated
Elevation (m)
Time Activated
Time Deactivated Time Deactivated
Signal-Noise Ratio (SNR)
Gain
SNR
Gain
Height above Ground
Distance to nets Height above Ground
Distance to Nets
Habitat
Habitat
Notes (Detector placement, habitat notes, etc)
Notes
CAPTURE DATA
TOC = Time of Capture; Repro = Males: N (Non-reproductive), D (descended); Females: N (non-reproductive), P (pregnant), L (lactating), PL (post-lactating); FA = Forearm Length; E = ear length; Wt = Weight in grams 1) weight of bat in bag, 2) bag weight, 3) bat weight; WDI (Reichard Wing damage index) = 0 (No damage), 1 (Light damage), 2 (Moderate damage), 3 (Heavy damage); Add “–P” to score if there is physical damage to wings without signs of splotching or necrotic tissue (0-P, 1-P, 2-P, or 3-P); TOR = Time of Release; include voucher number in notes, if collected.
Bat ID Net# SPECIES (4 letter
code)
TOC (24hr)
Sex (M/F)
Age (J/A)
Repro FA
(mm) E
(mm) Wt (g)
1 2 3 Keel (y/n)
WDI TOR
(24hr)
Notes (color, dentition, fringe, fur,
wing biopsy, etc)

ATTACHMENT 12: NETTING AND ACOUSTIC CAPTURE FORM
21.2-28
TOC = Time of Capture; Repro = Males: N (Non-reproductive), D (descended); Females: N (non-reproductive), P (pregnant), L (lactating), PL (post-lactating); FA = Forearm Length; E = ear length; Wt = Weight in grams 1) weight of bat in bag, 2) bag weight, 3) bat weight; WDI (Reichard Wing damage index) = 0 (No damage), 1 (Light damage), 2 (Moderate damage), 3 (Heavy damage); Add “–P” to score if there is physical damage to wings without signs of splotching or necrotic tissue (0-P, 1-P, 2-P, or 3-P); TOR = Time of Release; include voucher number in notes, if collected.
Bat ID Net# SPECIES (4 letter
code)
TOC (24hr)
Sex (M/F)
Age (J/A)
Repro FA
(mm) E
(mm) Wt (g)
1 2 3 Keel (y/n)
WDI TOR
(24hr)
Notes (color, dentition, fringe, fur, wing biopsy,
etc)

ATTACHMENT 12: NETTING AND ACOUSTIC CAPTURE FORM
21.2-29
CAPTURE TOTALS M_|_F A | J M | F A | J M | F A | J
ANPA _______ _______ MYCA ______ _______ MYTH _______ _______ Total Species _______
COTO _______ _______ MYCI ______ _______ MYVO _______ _______ Total Adults _______
EPFU _______ _______ MYEV ______ _______ MYYU _______ _______ Total Juveniles _______
EUMA _______ _______ MYLU ______ _______ PISU _______ _______ Total Males _______
LABO _______ _______ MYSE ______ _______ NYMA _______ _______ Total Females _______
LACI _______ _______ LANO ______ _______ TABR _______ _______ Total Bats _______
ACOUSTIC TOTALS
CAPTURE SITE; SITE ID: ______
# Files Files/Hr # Files File/Hr # Files File/Hr
ANPA _______ _______ MYCA _______ _______ MYTH _______ _______ Total Species _______
COTO _______ _______ MYCI _______ _______ MYVO _______ _______ Total # Bat Files _______
EPFU _______ _______ MYEV _______ _______ MYYU _______ _______ Total File/Hour _______
EUMA _______ _______ MYLU _______ _______ PIHE _______ _______
LABO _______ _______ MYSE _______ _______ NYMA _______ _______
LACI _______ _______ LANO _______ _______ TABR _______ _______
ACOUSTIC SITE; SITE ID: ______ # Files File/Hr # Files File/Hr # Files File/Hr
ANPA _______ _______ MYCA _______ _______ MYTH _______ _______ Total Species _______
COTO _______ _______ MYCI _______ _______ MYVO _______ _______ Total # Bat Files _______
EPFU _______ _______ MYEV _______ _______ MYYU _______ _______ Total File/Hour _______
EUMA _______ _______ MYLU _______ _______ PIHE _______ _______
LABO _______ _______ MYSE _______ _______ NYMA _______ _______
LACI _______ _______ LANO _______ _______ TABR _______ _______

ATTACHMENT 13: INTERIOR ROOST FORM
21.2-30
INTERIOR ROOST SURVEY FORM
SITE INFORMATION Date (mm/dd/yy): Site ID: WP#: Locality (e.g. Place name/drainage):
Property owner: Contact: Observers (Full name; circle recorder):
Picture # (if applicable):
Confirm Datum: NAD83 GPS EPE (m): Elev. (m):
GPS Location of Waypoint (UTM): Zone (circle): 12 or 13 ; E: ; N:
Route from known location:
ROOST TYPE
□ Mine Adit (Horizontal opening) □ Mine Shaft (Vertical opening) □ Cave □ Other: ______________________________
GATE
Gate Present? □ Yes □No Describe Gate:
EXTERNAL FEATURES Slope: Aspect: Entrance Substrate:
Entrance Width (m or in): Entrance Height (m or in): Entrance length/depth (m):
Airflow? (Yes/No/Unk) Airflow Direction (in/out): Airflow speed (mph):
Habitat description (Check): □ Woodland; □ Scrub; □ Canyon; □ Alpine meadow; □ Rocky; □ Agriculture; □ Pasture;
□ Riparian; □ Other:____________________________________________________________________________________________
INTERNAL FEATURES Width (m): Height: Substrate:
Dark zone present? (Yes/No/Unk) Depth to dark zone (m): Survey Length:
Timbered Adit? (Yes/No) Condition of Timbers:
Water Present? (Yes/No) Location and depth of water:
Number of Entrances: Previously mapped? (Yes/No/Unk) Map Location:
HAZARDS
Physical hazards present? □ Yes □No Describe Hazards:
OBSERVED BATS ANPA _______ MYCA _______ MYTH _______ BAT SIGN PRESENT? (circle) Yes No
COTO _______ MYCI _______ MYVO _______
EPFU _______ MYEV _______ MYYU _______ TYPE (Guano, wrappings, etc): ____________________
EUMA _______ MYLU _______ PIHE _______ If no bats or bat sign observed, evaluate suitability for bats based on
LABO _______ MYSE _______ NYMA _______ habitat characteristics: (HIGH LOW NIL)
LACI _______ LANO _______ TABR _______

ATTACHMENT 13: INTERIOR ROOST FORM
21.2-31
OBSERVED BATS DATA
SPECIES (4 letter code)
QTY STATUS* LOCATION (room or corridor)
DEPTH (m)
HEIGHT (m)
TEMP (oC)
HUMIDITY (%)
NOTES
* Status = T (torpid), F (flying), R (roosting and alert)
Previously mapped? (Yes/No/Unk) Map Location:
INTERIOR MAP (Draw if not mapped and plot locations for: bats, sign, hazards, temperature, and humidity)

ATTACHMENT 14: EXTERIOR ROOST FORM
21.2-32
EXTERIOR ROOST SURVEY FORM
SITE INFORMATION Date (mm/dd/yy): Site ID: WP#: Locality (e.g. Place name/drainage):
Property owner: Contact: Observers (Full name; circle recorder):
Picture # (if applicable):
Confirm Datum: NAD83 GPS EPE (m): Elev. (m):
GPS Location of Waypoint (UTM): Zone (circle): 12 or 13 ; E: ; N:
Route from known location:
ROOST TYPE
□ Mine Adit (Horizontal opening) □ Mine Shaft (Vertical opening) □ Cave □ Other: ______________________________
GATE
Gate Present? □ Yes □No Describe Gate:
EXTERNAL FEATURES Slope: Aspect: Entrance Substrate:
Dark zone present? (Yes/No/Unk) Approx. depth to dark zone (m): Survey Length:
Entrance Width (m or in): Entrance Height (m or in): Entrance length/depth (m):
Habitat description (Check): □ Woodland; □ Scrub; □ Canyon; □ Alpine meadow; □ Rocky; □ Agriculture; □ Pasture;
□ Riparian; □ Other:____________________________________________________________________________________________
HAZARDS
Physical hazards present? □ Yes □No Describe Hazards:
COMMENTS

ATTACHMENT 15: EXIT COUNT FORM
21.2-33
EXIT COUNT SURVEY FORM
SITE INFORMATION Date (mm/dd/yy): Site ID: WP#: Locality (e.g. Place name/drainage):
Property owner: Contact: Observers (Full name; circle recorder):
Picture # (if applicable):
Confirm Datum: NAD83 GPS EPE (m): Elev. (m):
GPS Location of Waypoint (UTM): Zone (circle): 12 or 13 ; E: ; N:
Route from known location:
ROOST TYPE
□ Mine Adit (Horizontal opening) □ Mine Shaft (Vertical opening) □ Cave □ Other: ______________________________
Entrance width (m or in): Entrance Height (m or in):
GATE
Gate Present? □ Yes □No Describe Gate:
SURVEY INFORMATION Time of civil sunset: Moon phase:
Survey start (24 hr) Survey end (24 hr): Survey Length (hr):
Distance to roost: Time of 1st
exit: Time of last exit:
Number of bats observed exiting roost: Bats/hr:
Habitat description (Check): □ Woodland; □ Scrub; □ Canyon; □ Alpine meadow; □ Rocky; □ Agriculture; □ Pasture;
□ Riparian; □ Other:____________________________________________________________________________________________
COMMENTS

ATTACHMENT 16: ROOST CAPTURE FORM
21.2-34
ROOST CAPTURE FORM SITE INFORMATION Site ID: WP#: Locality (e.g. Drainage):
Property owner: Elevation (m): Observers (circle recorder):
Roost Survey : Y or N Roost Type:
Confirm Datum: NAD83 GPS EPE (m):
GPS Location of Waypoint (UTM): Zone (circle): 12 or 13 ; E: ; N:
ROOST TYPE
□ Mine Adit (Horizontal opening) □ Mine Shaft (Vertical opening) □ Cave □ Rock Shelter □ Other: __________________
Gate Present? □ Yes □No Describe Gate:
Slope: Aspect: Entrance Substrate:
Dark zone present? (Yes/No/Unk) Approx. depth to dark zone (m): Survey Length:
Entrance Width (m or in): Entrance Height (m or in): Entrance length/depth (m):
Habitat type (Check): □ Cliff/Cave/Canyon/Rock-outcrop; □ Shrubland; □ Lower montane forest □ Montane/subalpine forest;
□ Aspen/Decid. □ Alpine tundra; □ Grassland; □ Riparian Notes:_______________________________________________________
SESSION INFORMATION Date (mm/dd/yy): Time of civil sunset (24hr): Phase of Moon:
Time nets open (24 hr): Time nets closed (24 hr): Survey Length:
Describe location of Net #1 (draw diagram on back if needed):
Describe location of additional nets (w/ numbers):
WEATHER
DATA Temperature
(C) Barometric
Pressure (inHg) Wind (mph)
Relative Humidity (%)
Cloud Cover (%)
Survey Start:
Survey End:
Precip in last 24 hrs? (Y/N) NOTES:
CAPTURE TOTALS M_|_F A | J M | F A | J M | F A | J
ANPA _______ _______ MYCA ______ _______ MYTH _______ _______ Total Species _______
COTO _______ _______ MYCI ______ _______ MYVO _______ _______ Total Adults _______
EPFU _______ _______ MYEV ______ _______ MYYU _______ _______ Total Juveniles _______
EUMA _______ _______ MYLU ______ _______ PIHE _______ _______ Total Males _______
LABO _______ _______ MYSE ______ _______ NYMA _______ _______ Total Females _______
LACI _______ _______ LANO ______ _______ TABR _______ _______ Total Bats _______

ATTACHMENT 16: ROOST CAPTURE FORM
21.2-35
IN/OUT = Indicate whether bat was attempting to fly into or out of roost, if net is blocking entrance; TOC = Time of Capture; Repro = Males: N (Non-reproductive), D (descended); Females: N (non-reproductive), P (pregnant), L (lactating), PL (post-lactating); FA = Forearm Length; E = ear length; Wt = Weight in grams 1) weight of bat in bag, 2) bag weight, 3) bat weight; WDI (Reichard Wing damage index) = 0 (No damage), 1 (Light damage), 2 (Moderate damage), 3 (Heavy damage); Add “–P” to score if there is physical damage to wings without signs of splotching or necrotic tissue (0-P, 1-P, 2-P, or 3-P); TOR = Time of Release; include voucher number in notes, if collected.
Bat ID
Net#
IN/OUT
SPECIES (4 letter
code)
TOC (24hr)
Sex (M/F)
Age (J/A)
Repro FA
(mm) E
(mm) Wt (g)
1 2 3 Keel (y/n)
WDI TOR
(24hr)
Notes (color, dentition, fringe, fur, wing biopsy,
etc)
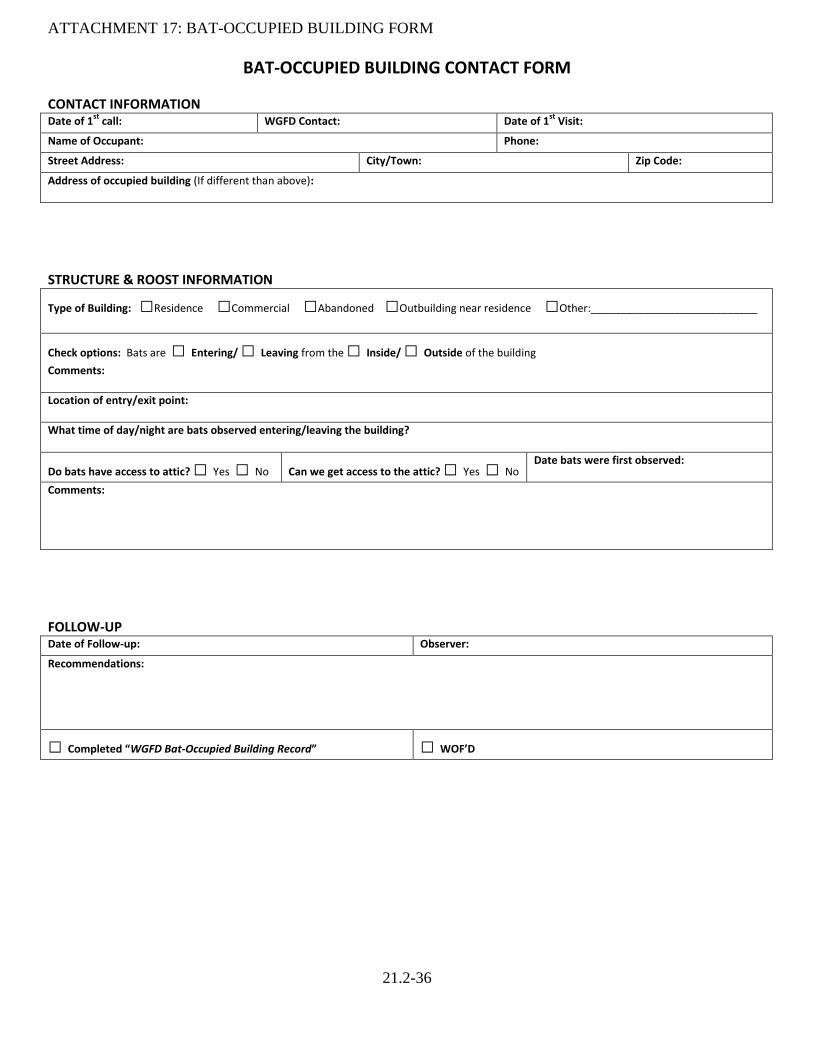
ATTACHMENT 17: BAT-OCCUPIED BUILDING FORM
21.2-36
BAT-OCCUPIED BUILDING CONTACT FORM
CONTACT INFORMATION Date of 1
st call: WGFD Contact: Date of 1
st Visit:
Name of Occupant: Phone:
Street Address: City/Town: Zip Code:
Address of occupied building (If different than above):
STRUCTURE & ROOST INFORMATION
Type of Building: □Residence □Commercial □Abandoned □Outbuilding near residence □Other:____________________________
Check options: Bats are □ Entering/ □ Leaving from the □ Inside/ □ Outside of the building
Comments:
Location of entry/exit point:
What time of day/night are bats observed entering/leaving the building?
Do bats have access to attic? □ Yes □ No Can we get access to the attic? □ Yes □ No Date bats were first observed:
Comments:
FOLLOW-UP Date of Follow-up: Observer:
Recommendations:
□ Completed “WGFD Bat-Occupied Building Record” □ WOF’D
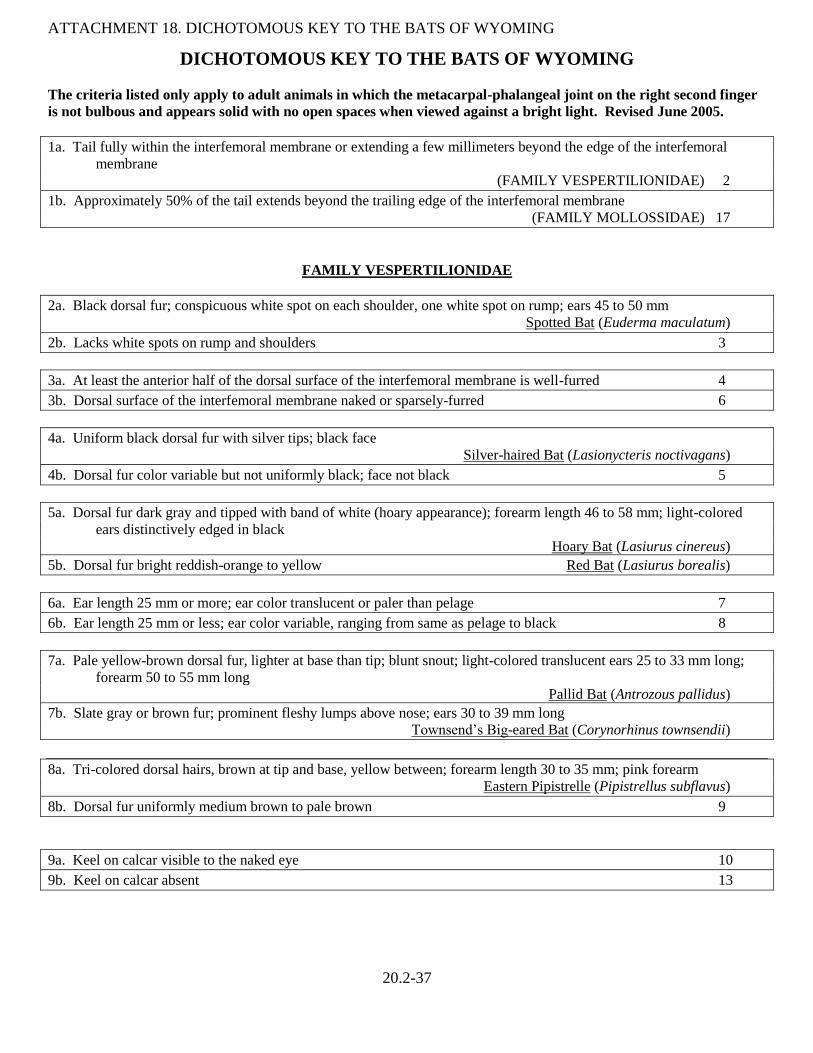
ATTACHMENT 18. DICHOTOMOUS KEY TO THE BATS OF WYOMING
20.2-37
DICHOTOMOUS KEY TO THE BATS OF WYOMING
The criteria listed only apply to adult animals in which the metacarpal-phalangeal joint on the right second finger
is not bulbous and appears solid with no open spaces when viewed against a bright light. Revised June 2005.
1a. Tail fully within the interfemoral membrane or extending a few millimeters beyond the edge of the interfemoral
membrane
(FAMILY VESPERTILIONIDAE) 2
1b. Approximately 50% of the tail extends beyond the trailing edge of the interfemoral membrane
(FAMILY MOLLOSSIDAE) 17
FAMILY VESPERTILIONIDAE
2a. Black dorsal fur; conspicuous white spot on each shoulder, one white spot on rump; ears 45 to 50 mm
Spotted Bat (Euderma maculatum)
2b. Lacks white spots on rump and shoulders 3
3a. At least the anterior half of the dorsal surface of the interfemoral membrane is well-furred 4
3b. Dorsal surface of the interfemoral membrane naked or sparsely-furred 6
4a. Uniform black dorsal fur with silver tips; black face
Silver-haired Bat (Lasionycteris noctivagans)
4b. Dorsal fur color variable but not uniformly black; face not black 5
5a. Dorsal fur dark gray and tipped with band of white (hoary appearance); forearm length 46 to 58 mm; light-colored
ears distinctively edged in black
Hoary Bat (Lasiurus cinereus)
5b. Dorsal fur bright reddish-orange to yellow Red Bat (Lasiurus borealis)
6a. Ear length 25 mm or more; ear color translucent or paler than pelage 7
6b. Ear length 25 mm or less; ear color variable, ranging from same as pelage to black 8
7a. Pale yellow-brown dorsal fur, lighter at base than tip; blunt snout; light-colored translucent ears 25 to 33 mm long;
forearm 50 to 55 mm long
Pallid Bat (Antrozous pallidus)
7b. Slate gray or brown fur; prominent fleshy lumps above nose; ears 30 to 39 mm long
Townsend’s Big-eared Bat (Corynorhinus townsendii)
8a. Tri-colored dorsal hairs, brown at tip and base, yellow between; forearm length 30 to 35 mm; pink forearm
Eastern Pipistrelle (Pipistrellus subflavus)
8b. Dorsal fur uniformly medium brown to pale brown 9
9a. Keel on calcar visible to the naked eye 10
9b. Keel on calcar absent 13

ATTACHMENT 18. DICHOTOMOUS KEY TO THE BATS OF WYOMING
20.2-38
10a. Wingspan 325 to 350 mm; tragus round; forearm length > 42 mm
Big Brown Bat (Eptesicus fuscus)
10b. Wingspan < 300 mm; forearm length < 42 mm 11
11a. Underside of wing furred from side of body to the elbow; wingspan 250 to 270 mm; forearm length 35 to 41 mm
Long-legged Myotis (Myotis volans)
11b. Underside of wing not furred from side of body to the elbow 12
12a. Tail extends slightly beyond the interfemoral membrane; black mask visible; no distinct rise in the braincase profile;
length of bare snout approx. 1.5 times the width across nostrils; forearm length 30 to 36 mm
Western Small-footed Myotis (Myotis ciliolabrum)
12b. Tail does not extend beyond the interfemoral membrane; black mask absent; distinct rise in the braincase profile;
length of bare snout approx. equal to the width across nostrils; forearm length 32 to 35 mm
California Myotis (Myotis californicus)
13a. Distinct fringe of hair on trailing edge of interfemoral membrane visible to naked eye; ears 16 to 20 mm; forearm
length 39 to 46 mm
Fringed Myotis (Myotis thysanodes)
13b. Some hairs may be present but lacks distinct fringe on trailing edge 14
14a. Ears 19 to 25 mm long; ears extend up to 7 mm beyond nose when laid forward; tragus long and thin
Long-eared Myotis (Myotis evotis)
14b. Ears < 19 mm long 15
15a. Ears 17 to 19 mm; ears extend < 2 mm beyond nose when laid forward; tragus long, thin, pointed, and > 50% of ear
height
Northern Long-eared Myotis (Myotis septentrionalis)
15a. Ears < 16 mm 16
16a. Ears generally darker than dorsal fur; forearm length 36 to 41 mm; usually 1 upper premolar; foot hairs usually
extend past toes; pelage dark brown with silky sheen
Little Brown Bat (Myotis lucifugus)
16b. Ears pale and nearly same color as dorsal fur; forearm length 32 to 38 mm; always 2 upper premolars; foot hairs do
not extend past toes; pelage lacks silky sheen
Yuma Myotis (Myotis yumanensis)
FAMILY MOLLOSSIDAE
17a. Ears connected and joined at base before reaching top of nose; forearm length 44 to 50 mm
Big Free-tailed Bat (Nyctinomops macrotis)
17b. Ears not connected, although occasionally meeting before reaching top of nose; forearm length 36 to 46 mm
Brazilian Free-tailed Bat (Tadarida brasiliensis)