Embed Size (px)
Citation preview

21-1
Chapter 21: Mitigation Measures
A. INTRODUCTION The preceding chapters of this Final Draft Generic Environmental Impact Statement (DFGEIS) discuss the potential for significant adverse environmental impacts resulting from the proposed Seward Park Mixed-Use Development Project. Such potential impacts were identified in the areas of historic and cultural resources, transportation, and construction. Measures have been examined to minimize or eliminate these anticipated impacts. These mitigation measures are discussed below.
B. HISTORIC AND CULTURAL RESOURCES As described in Chapter 7, “Historic and Cultural Resources,” the proposed actions, through redevelopment, would have significant adverse direct impacts on two architectural resources that have been determined eligible for listing on the State and National Registers of Historic Places (S/NR)—the Essex Street Market and the former fire station at 185 Broome Street. In addition, new development on Site 1 could have significant adverse visual and contextual impacts on the S/NR-listed Lower East Side Historic District and the S/NR-eligible Eastern Dispensary, which also appears to be eligible for New York City Landmark (NYCL) designation.
In accordance with CEQR guidelines, the New York City Economic Development Corporation (NYCEDC) and the City of New York Department of Housing Preservation & Development (HPD) are undertaking ongoing consultation with the New York City Landmarks Preservation Commission (LPC) regarding the development of mitigation measures for these significant adverse impacts. In addition, because construction financing may come from New York State and/or the United States Department of Housing and Urban Development, NYCEDC and HPD are undertaking ongoing consultation with the New York State Office of Parks, Recreation and Historic Preservation (OPRHP) in accordance with the New York State Historic Preservation Act of 1980 (Section 14.09 of the New York Parks, Recreation and Historic Preservation Law) and, acting in its capacity as the State Historic Preservation Office, Section 106 of the National Historic Preservation Act of 1966.
Should there be any State or Federal permitting or funding for development on Sites 1, 2, 5, 8, 9 and 10, HPD and NYCEDC shall continue to consult with OPRHP regarding impacts from development on Site 1 (indirect impacts to the NYCL- and S/NR-eligible Eastern Dispensary and the S/NR-listed Lower East Side Historic District), Site 2 (the proposed demolition of an S/NR-eligible Essex Street Market building), Site 5 (the proposed demolition of a S/NR-eligible fire station), and Sites 8, 9, and 10 (the proposed demolition of the S/NR-eligible Essex Street Market buildings and indirect impacts to the adjacent NYCL- and S/NR-eligible Clinton, Rivington, Stanton Street Historic District). Furthermore, consultation shall include an evaluation of any prudent and feasible alternatives specific to the affected historic properties and project goals and objectives. If no prudent and feasible alternatives specific to the historic properties and project goals and objectives are identified, HPD and/or NYCEDC will enter into a formal agreement with OPRHP to identify proper mitigation measures. LPC shall be a signatory

Seward Park Mixed-Use Development
21-2
to the formal agreement with regard to any potential effects to NYCL designated and eligible properties and districts. Potential mitigation measures that could partially mitigate the impact of the demolition of the Essex Street Market and former fire station may include, to the extent practicable and feasible:
• Historic American Buildings Survey (HABS) documentation. HABS Level I documentation of all four buildings of the Essex Street Market and the former fire station could be conducted by a recognized professional credentialed for preparing such reports, to be submitted to LPC, OPRHP, the New York Historical Society, the Museum of the City of New York, and/or other repositories.
• A site commemoration plan. A permanent interpretive exhibit or exhibits about the Essex Street Market and the former fire station could be developed and installed in the new Essex Street Market facility on Site 2 or in another appropriate location near the project site. This exhibit could document the history of the Essex Street Market and former fire station and could encompass the larger history of the project site neighborhood.
• Architectural salvage. Surveys of the Essex Street Market and former fire station could be conducted to determine if any significant exterior or interior architectural elements could be removed and incorporated into the proposed development.
• Design of the new buildings on Sites 2, 8, 9, and/or 10 to reference the design of the Essex Street Market. This could include incorporating references to such architectural elements of the market buildings as the strip windows and the incised lettering above the entrances.
As described above, NYCEDC and HPD will continue to consult with LPC and/or OPRHP regarding the compatibility of the proposed development on Site 1 with the S/NR-listed Lower East Side District, in which it is located, and with the S/NR-eligible and NYCL-eligible Eastern Dispensary. Submission of the preliminary design of the proposed building on Site 1 to LPC and/or OPRHP for review and comment following a developer’s Request for Proposals (RFP) process (described below) is proposed as a means to eliminate or partially mitigate the potential contextual and visual impact on the historic district and Eastern Dispensary from the proposed development on Site 1. If LPC and/or OPRHP determine that the preliminary design of the proposed building on Site 1 would result in a significant adverse impact on the Lower East Side Historic District and/or the Eastern Dispensary and no design changes, which are feasible and practicable given NYCEDC and HPD’s goals and objectives, are identified to eliminate or fully mitigate this impact, it would constitute an unmitigable significant adverse impact on the Lower East Side Historic District and/or the Eastern Dispensary. Although the historic and cultural resources analysis (See Chapter 7, “Historic and Cultural Resources”) concluded that the proposed developments on Sites 8, 9, and 10 would not have significant adverse visual and contextual impacts on the adjacent potential Clinton, Rivington, Stanton Street Historic District (NYCL-eligible, S/NR-eligible), should there be any State or Federal permitting or funding for development on those sites, HPD and NYCEDC shall consult with OPRHP regarding the compatibility of the proposed developments on Sites 8, 9, and 10 with the historic district. At this time, there are no specific development proposals for Sites 1 through 6 and 8 through 10, and future developers will be selected pursuant to an RFP process. For sites that may be under the jurisdiction of HPD, mitigation, which could include design review of Site 1 with LPC and/or OPRHP, would, to the extent practicable and feasible, either be undertaken by HPD or required to be undertaken by the developer(s) through provisions in the Land Disposition Agreement (LDA) between HPD and the developer(s). For City properties that may be managed by NYCEDC, mitigation, which could include design review of Site 1 with LPC and/or OPRHP,
Chapter 21: Mitigation Measures
21-3
would, to the extent practicable and feasible, either be undertaken by NYCEDC or required to be undertaken by the developer(s) through the provisions of a contract of sale or long-term lease or other legally binding agreement between NYCEDC and the developer(s). As noted above, construction financing for some portions of the proposed development may come from HUD and, under the Code of Federal Regulations Title 24-Housing and Urban Development, Part 58, HPD assumes the responsibilities for environmental review, decision-making, and action that would otherwise apply to HUD. Accordingly, HPD is required to conduct environmental reviews under the laws and reviews that apply to HUD programs and policies, including the National Environmental Policy Act and related Federal Laws, Executive Orders, and Rules, including the National Historic Preservation Act. Since it is not known at this time which sites will be disposed of by which project sponsors, it is expected that, if warranted, HPD would enter into a formal agreement with OPRHP, LPC, and potentially the Advisory Council on Historic Preservation regarding the assessment of effects on historic and cultural resources related to the HUD construction financing and the development and implementation of mitigation for any identified adverse effects.
C. TRANSPORTATION
TRAFFIC
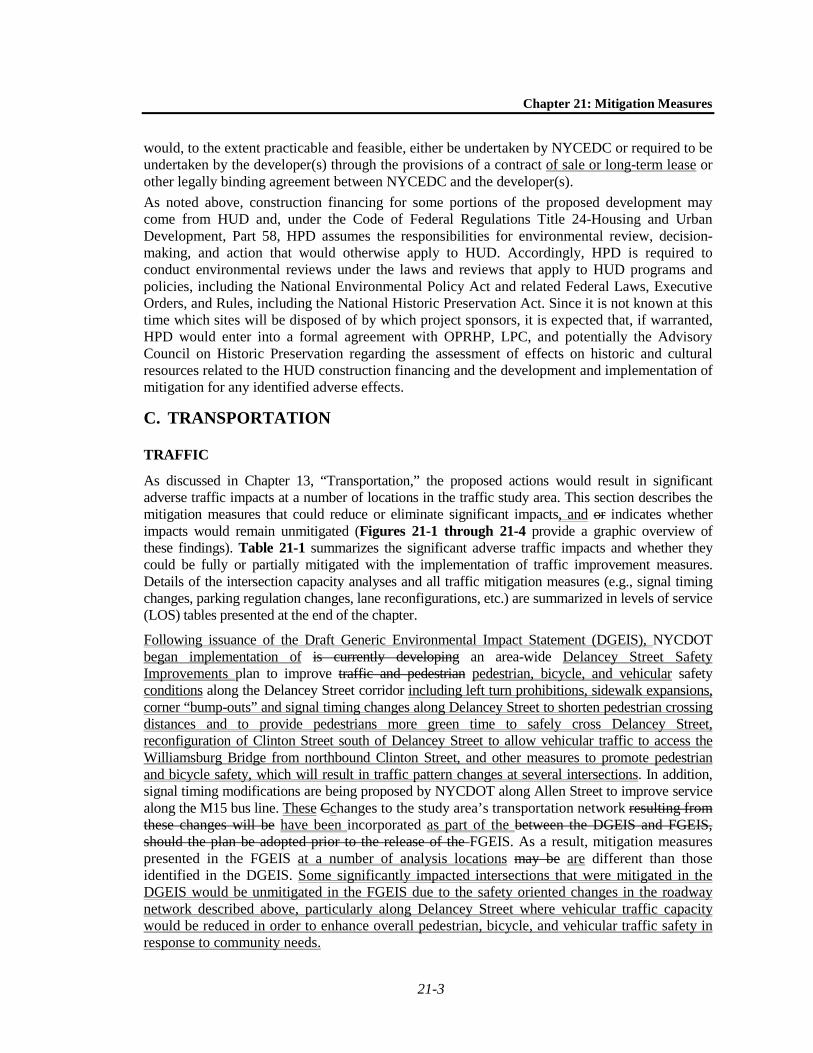
As discussed in Chapter 13, “Transportation,” the proposed actions would result in significant adverse traffic impacts at a number of locations in the traffic study area. This section describes the mitigation measures that could reduce or eliminate significant impacts, and or indicates whether impacts would remain unmitigated (Figures 21-1 through 21-4 provide a graphic overview of these findings). Table 21-1 summarizes the significant adverse traffic impacts and whether they could be fully or partially mitigated with the implementation of traffic improvement measures. Details of the intersection capacity analyses and all traffic mitigation measures (e.g., signal timing changes, parking regulation changes, lane reconfigurations, etc.) are summarized in levels of service (LOS) tables presented at the end of the chapter.
Following issuance of the Draft Generic Environmental Impact Statement (DGEIS), NYCDOT began implementation of is currently developing an area-wide Delancey Street Safety Improvements plan to improve traffic and pedestrian pedestrian, bicycle, and vehicular safety conditions along the Delancey Street corridor including left turn prohibitions, sidewalk expansions, corner “bump-outs” and signal timing changes along Delancey Street to shorten pedestrian crossing distances and to provide pedestrians more green time to safely cross Delancey Street, reconfiguration of Clinton Street south of Delancey Street to allow vehicular traffic to access the Williamsburg Bridge from northbound Clinton Street, and other measures to promote pedestrian and bicycle safety, which will result in traffic pattern changes at several intersections. In addition, signal timing modifications are being proposed by NYCDOT along Allen Street to improve service along the M15 bus line. These Cchanges to the study area’s transportation network resulting from these changes will be have been incorporated as part of the between the DGEIS and FGEIS, should the plan be adopted prior to the release of the FGEIS. As a result, mitigation measures presented in the FGEIS at a number of analysis locations may be are different than those identified in the DGEIS. Some significantly impacted intersections that were mitigated in the DGEIS would be unmitigated in the FGEIS due to the safety oriented changes in the roadway network described above, particularly along Delancey Street where vehicular traffic capacity would be reduced in order to enhance overall pedestrian, bicycle, and vehicular traffic safety in response to community needs.

HAMILTONFISHPARK
EA
ST
RIV
ER
PA
RK
SE
CO
ND
AV
E.
FIR
ST
AV
E.
AV
E. A
AV
E. B
AV
E. C
BIA
LYS
TO
KE
R P
L.
AB
RA
HA
M E
. KA
ZA
N S
T.
LEW
IS S
T.
RU
TGER
S ST.
GRAND ST.
EAST BROADWAY
HENRY ST.
MONROE ST.
E. 7TH ST.
E. 6TH ST.
E. 5TH ST.
E. 4TH ST.
E. 3RD ST.
E. 2ND ST.
E. 1ST ST.
STANTON ST.
PIT
T S
T.
CLIN
TO
N S
T.
SU
FF
OLK
ST
.
NO
RF
OLK
ST
.E
SS
EX
ST
.
LUD
LOW
ST
.
OR
CH
AR
D S
T.
FO
RS
YT
H S
T.
CH
RY
ST
IE S
T.
ELD
RID
GE
ST
.A
LLEN
ST
.
CO
LUM
BIA
ST
.
RIVINGTON ST.
DELANCEY ST.
KENMARE ST.
E. HOUSTON ST.
GR
EE
NE
ST
.
ME
RC
ER
ST
.
CR
OS
BY
ST
.
WHITE ST.
HOWARD ST.
BROOME ST.
SPRING ST.
PRINCE ST.
W. HOUSTON ST.
BLEECKER ST.
BO
WE
RY
BO
WE
RY
MU
LBE
RR
Y S
T.
MO
TT
ST
.
ELIZ
AB
ET
H S
T.
HESTER ST.
PELL ST.BAYARD ST.
BA
XT
ER
ST
.
CO
RT
LAN
DT
AL.
CE
NT
RE
ST
.
FD
R D
RIV
E
Traffic Mitigation OverviewWeekday AM Peak Hour
Figure 21-1SEWARD PARK MIXED-USE DEVELOPMENT PROJECT
N
SCALE
0 800 FEET
8.7.12
No Significant Impact
Mitigated Impact
Partially Mitigated Impact
Unmitigated Impact
Unsignalized Intersection
NOTE: Overall Intersection LOS is Shown
NOTE: This figure has been revised for the FGEIS.

HAMILTONFISHPARK
EA
ST
RIV
ER
PA
RK
SE
CO
ND
AV
E.
FIR
ST
AV
E.
AV
E. A
AV
E. B
AV
E. C
BIA
LYS
TO
KE
R P
L.
AB
RA
HA
M E
. KA
ZA
N S
T.
LEW
IS S
T.
RU
TGER
S ST.
GRAND ST.
EAST BROADWAY
HENRY ST.
MONROE ST.
E. 7TH ST.
E. 6TH ST.
E. 5TH ST.
E. 4TH ST.
E. 3RD ST.
E. 2ND ST.
E. 1ST ST.
STANTON ST.
PIT
T S
T.
CLIN
TO
N S
T.
SU
FF
OLK
ST
.
NO
RF
OLK
ST
.E
SS
EX
ST
.
LUD
LOW
ST
.
OR
CH
AR
D S
T.
FO
RS
YT
H S
T.
CH
RY
ST
IE S
T.
ELD
RID
GE
ST
.A
LLEN
ST
.
CO
LUM
BIA
ST
.
RIVINGTON ST.
DELANCEY ST.
KENMARE ST.
E. HOUSTON ST.
GR
EE
NE
ST
.
ME
RC
ER
ST
.
CR
OS
BY
ST
.
WHITE ST.
HOWARD ST.
BROOME ST.
SPRING ST.
PRINCE ST.
W. HOUSTON ST.
BLEECKER ST.
BO
WE
RY
BO
WE
RY
MU
LBE
RR
Y S
T.
MO
TT
ST
.
ELIZ
AB
ET
H S
T.
HESTER ST.
PELL ST.BAYARD ST.
BA
XT
ER
ST
.
CO
RT
LAN
DT
AL.
CE
NT
RE
ST
.
FD
R D
RIV
E
Traffic Mitigation OverviewWeekday Midday Peak Hour
Figure 21-2SEWARD PARK MIXED-USE DEVELOPMENT PROJECT
N
SCALE
0 800 FEET
8.7.12
No Significant Impact
Mitigated Impact
Partially Mitigated Impact
Unmitigated Impact
Unsignalized Intersection
NOTE: Overall Intersection LOS is Shown
NOTE: This figure has been revised for the FGEIS.

HAMILTONFISHPARK
EA
ST
RIV
ER
PA
RK
SE
CO
ND
AV
E.
FIR
ST
AV
E.
AV
E. A
AV
E. B
AV
E. C
BIA
LYS
TO
KE
R P
L.
AB
RA
HA
M E
. KA
ZA
N S
T.
LEW
IS S
T.
RU
TGER
S ST.
GRAND ST.
EAST BROADWAY
HENRY ST.
MONROE ST.
E. 7TH ST.
E. 6TH ST.
E. 5TH ST.
E. 4TH ST.
E. 3RD ST.
E. 2ND ST.
E. 1ST ST.
STANTON ST.
PIT
T S
T.
CLIN
TO
N S
T.
SU
FF
OLK
ST
.
NO
RF
OLK
ST
.E
SS
EX
ST
.
LUD
LOW
ST
.
OR
CH
AR
D S
T.
FO
RS
YT
H S
T.
CH
RY
ST
IE S
T.
ELD
RID
GE
ST
.A
LLEN
ST
.
CO
LUM
BIA
ST
.
RIVINGTON ST.
DELANCEY ST.
KENMARE ST.
E. HOUSTON ST.
GR
EE
NE
ST
.
ME
RC
ER
ST
.
CR
OS
BY
ST
.
WHITE ST.
HOWARD ST.
BROOME ST.
SPRING ST.
PRINCE ST.
W. HOUSTON ST.
BLEECKER ST.
BO
WE
RY
BO
WE
RY
MU
LBE
RR
Y S
T.
MO
TT
ST
.
ELIZ
AB
ET
H S
T.
HESTER ST.
PELL ST.BAYARD ST.
BA
XT
ER
ST
.
CO
RT
LAN
DT
AL.
CE
NT
RE
ST
.
FD
R D
RIV
E
Traffic Mitigation OverviewWeekday PM Peak Hour
Figure 21-3SEWARD PARK MIXED-USE DEVELOPMENT PROJECT
N
SCALE
0 800 FEET
8.7.12
No Significant Impact
Mitigated Impact
Partially Mitigated Impact
Unmitigated Impact
Unsignalized Intersection
NOTE: Overall Intersection LOS is Shown
NOTE: This figure has been revised for the FGEIS.

HAMILTONFISHPARK
EA
ST
RIV
ER
PA
RK
SE
CO
ND
AV
E.
FIR
ST
AV
E.
AV
E. A
AV
E. B
AV
E. C
BIA
LYS
TO
KE
R P
L.
AB
RA
HA
M E
. KA
ZA
N S
T.
LEW
IS S
T.
RU
TGER
S ST.
GRAND ST.
EAST BROADWAY
HENRY ST.
MONROE ST.
E. 7TH ST.
E. 6TH ST.
E. 5TH ST.
E. 4TH ST.
E. 3RD ST.
E. 2ND ST.
E. 1ST ST.
STANTON ST.
PIT
T S
T.
CLIN
TO
N S
T.
SU
FF
OLK
ST
.
NO
RF
OLK
ST
.E
SS
EX
ST
.
LUD
LOW
ST
.
OR
CH
AR
D S
T.
FO
RS
YT
H S
T.
CH
RY
ST
IE S
T.
ELD
RID
GE
ST
.A
LLEN
ST
.
CO
LUM
BIA
ST
.
RIVINGTON ST.
DELANCEY ST.
KENMARE ST.
E. HOUSTON ST.
GR
EE
NE
ST
.
ME
RC
ER
ST
.
CR
OS
BY
ST
.
WHITE ST.
HOWARD ST.
BROOME ST.
SPRING ST.
PRINCE ST.
W. HOUSTON ST.
BLEECKER ST.
BO
WE
RY
BO
WE
RY
MU
LBE
RR
Y S
T.
MO
TT
ST
.
ELIZ
AB
ET
H S
T.
HESTER ST.
PELL ST.BAYARD ST.
BA
XT
ER
ST
.
CO
RT
LAN
DT
AL.
CE
NT
RE
ST
.
FD
R D
RIV
E
Traffic Mitigation OverviewSaturday Peak Hour
Figure 21-4SEWARD PARK MIXED-USE DEVELOPMENT PROJECT
N
SCALE
0 800 FEET
8.7.12
No Significant Impact
Mitigated Impact
Partially Mitigated Impact
Unmitigated Impact
Unsignalized Intersection
NOTE: Overall Intersection LOS is Shown
NOTE: This figure has been revised for the FGEIS.

Seward Park Mixed-Use Development
21-4
Table 21-1 Traffic Impact Mitigation Summary
Intersections Weekday Peak Hours Saturday
Peak Hour AM Midday PM No significant impact 21 17 23 19 12 15 20 16 Impact could be fully mitigated 6 5 6 7 12 8 8 Impact could be partially mitigated 0 1 0 1 0 1 0 Unmitigated impact 3 7 1 4 5 7 1 6
The major overall finding of the traffic mitigation analysis is that the majority of the 30 intersections analyzed would either not be significantly impacted or could be mitigated with readily implementable traffic improvement measures, including signal timing and phasing changes, parking regulation changes to gain or widen a travel lane at key intersections, and lane restriping. These measures represent some of the standard traffic capacity improvements that are typically implemented by the New York City Department of Transportation (NYCDOT).
As shown in Table 21-1, in the weekday AM peak hour, three seven of the 30 intersections would remain unmitigated, and one intersection could only be partially mitigated; in the weekday midday peak hour, one four intersections would remain unmitigated; in the weekday PM peak hour, five seven intersections would remain unmitigated, and one intersection could only be partially mitigated; and in the Saturday peak hour, one six intersections would remain unmitigated, and one intersection could be partially mitigated.
Six Ten of the thirty intersections have significant adverse traffic impacts that would result from the proposed actions and could not be fully mitigated in at least one peak hour, including:
• East Houston Street and Chrystie Street/Second Avenue (unmitigated during the weekday AM peak hour).
• East Houston Street and Allen Street/First Avenue (unmitigated could be partially mitigated during the weekday AM and PM peak hours).
• Delancey Street and Allen Street (could be partially mitigated unmitigated during the weekday AM and PM peak hour).
• Delancey Street and Ludlow Street (unmitigated during all four peak hours). • Delancey Street and Essex Street (unmitigated during all four peak hours). • Delancey Street and Norfolk Street (unmitigated during all four peak hours could be
partially mitigated during the Saturday peak hour; unmitigated during the weekday PM peak hour).
• Delancey Street and Suffolk Street (unmitigated during the weekday PM and Saturday peak hours).
• Delancey Street and Clinton Street (unmitigated during the weekday AM and PM all four peak hours).
• Broome Street and Norfolk Street (unmitigated during the weekday PM peak hour).
• Grand Street and Clinton Street (unmitigated during the weekday AM and Saturday peak hours).
Six Five of these intersections are along Delancey Street, which is characterized by heavy volumes approaching and leaving the Williamsburg Bridge.

Chapter 21: Mitigation Measures
21-5
Traffic mitigation measures needed for each intersection are described below; details of signal timing modifications are summarized in the LOS tables presented at the end of the chapter.
DELANCEY STREET CORRIDOR
Five Three of the seven intersections analyzed along Delancey Street would be significantly impacted during the weekday AM and Saturday peak hours, four would be significantly impacted during the weekday midday peak hour, and six would be significantly impacted during the weekday PM peak hour. Of the six impacted intersections along Delancey Street, only the intersection of Delancey Street and Ludlow Street could be fully mitigated in each peak hour with traffic capacity improvements. The other impacted intersections that could not be mitigated during all peak hours are as follows: Delancey Street and Allen Street could only be partially mitigated during the weekday PM peak hour; Delancey Street and Essex Street could not be mitigated during all peak hours; Delancey Street and Norfolk Street could only be partially mitigated in the Saturday peak hour, and could not be mitigated during the weekday PM peak hour; Delancey Street and Suffolk Street could not be mitigated during the weekday PM peak hour; and Delancey Street and Clinton Street could not be mitigated during the weekday AM and PM peak hours. Typical traffic improvement measures, such as signal timing changes and lane restriping, would not be deemed feasible for implementation due to the safety plan being implemented along the Delancey Street corridor, and as a result, none of the six impacted intersections along Delancey Street could be mitigated. The prohibition of parking along Delancey Street at certain times of the day was considered but is not recommended due to the commercial character of Delancey Street and the scarce parking currently available along the corridor.
Delancey Street and Allen Street Significant impacts would occur at this location during the weekday midday AM and PM peak hours. These impacts could not be fully mitigated. during the weekday midday peak hour, and only partially mitigated during the weekday PM peak hour by modifying the signal phasing to allow the northbound right turn movement during the westbound lead phase. This measure would be in place at all times and the signal timing would remain the same.
Delancey Street and Ludlow Street Significant impacts would occur at this intersection during all four peak hours the weekday midday and PM, and Saturday peak hours, and could be fully not be mitigated by modifying the signal timing.
Delancey Street and Essex Street This intersection would have significant impacts during all four peak hours, and could not be mitigated.
Delancey Street and Norfolk Street This intersection would have significant impacts during all peak hours, and could be fully mitigated during the weekday AM and midday peak hours by installing “No Standing 11 AM to 2 PM Monday to Friday” regulations along the north curb of the westbound approach for 100 feet (entailing a loss of approximately three parking spaces during the weekday midday peak period) to provide daylighting to widen the westbound lane, and by modifying the signal timing. These mitigation measures could only partially mitigate impacts at this intersection during the Saturday peak hour. Significant impacts during the weekday PM peak hour could not be mitigated.

Seward Park Mixed-Use Development
21-6
Delancey Street and Suffolk Street Significant impacts during the weekday PM and Saturday peak hours could not be mitigated.
Delancey Street and Clinton Street Significant impacts during the weekday AM and PM all four peak hours could not be mitigated.
BROOME STREET CORRIDOR
Significant impacts would occur at one two of the five intersections analyzed along Broome Street during all peak hours, and at two intersections during the weekday PM peak hour. Impacts at the intersection of Broome Street and Essex Street would occur during all four peak hours and could be fully mitigated with signal timing and phasing modifications. Impacts at both of these intersections of Broome Street and Norfolk Street would occur during the weekday PM peak hour and could not be fully mitigated with signal timing and phasing modifications.
Broome Street and Essex Street Significant impacts that would occur during the weekday PM all four peak hours at this intersection could be fully mitigated by modifying the signal phasing to include a southbound lead phase. (The existing traffic signal operates in two phases—an eastbound phase followed by a northbound/southbound phase). The sidewalk along the west side of Essex Street could be extended eight inches to the east to mitigate pedestrian impacts; this would not affect vehicular operations at this intersection.
Broome Street and Norfolk Street Significant impacts would occur at this intersection during the weekday PM peak hour and could not be fully mitigated by modifying the signal timing.
GRAND STREET CORRIDOR
Significant impacts would occur at two of the eight intersections analyzed along Grand Street during the weekday AM, and midday, and PM peak hours, and at five intersections during the weekday PM peak hour, and at three intersections during the Saturday peak hour. Impacts at these intersections could be fully mitigated with traffic capacity improvements except at the intersection of Grand Street and Clinton Street during the weekday AM and Saturday peak hours.
Grand Street and Allen Street Significant impacts would occur at this intersection during all four peak hours and could be mitigated by installing “No Standing 11 AM to 2 PM Monday to Friday” regulations along the north curb of the westbound approach for the entire block (entailing a loss of approximately two parking spaces over a distance of approximately 85 feet during the weekday midday peak period) to provide daylighting to widen the westbound lane, and by modifying the signal timing. A second option to mitigate the intersection during all peak hours would involve the modification of modifying the signal phasing as follows: an eastbound/westbound phase; a northbound/southbound exclusive left turn phase (pedestrians would not be allowed to cross during this phase); and a northbound/southbound phase (left turns would not be permitted). The existing traffic signal operates as follows: an eastbound/westbound phase; a southbound phase (pedestrians are not allowed to cross the east crosswalk during this phase); a

Chapter 21: Mitigation Measures
21-7
northbound/southbound phase (left turns are not permitted); and a northbound phase (pedestrians are not allowed to cross the west crosswalk during this phase). Either of these two options could fully mitigate projected impacts.
Grand Street and Essex Street This intersection would be significantly impacted during the weekday PM Saturday peak hour and could be fully mitigated by modifying the signal timing at this location installing “No Standing Anytime” regulations along the north curb of the westbound approach for 100 feet from the intersection (entailing a loss of approximately five parking spaces) to allow for two moving lanes. The westbound approach curb lane could be restriped from a 10-foot wide parking lane to a 10-foot wide right turn lane.
Grand Street and Norfolk Street This intersection would be significantly impacted during all four peak analysis hours and could be fully mitigated by installing “No Standing Anytime” regulations along the north curb of the westbound approach for 100-feet from the intersection (entailing a loss of approximately three parking spaces) to allow for two moving lanes. The westbound approach curb lane could be restriped from a 10-foot wide parking lane to a 10-foot wide right turn lane.
Grand Street and Suffolk Street Significant impacts at this intersection during the weekday PM peak hour could be fully mitigated by modifying the signal timing.
Grand Street and Clinton Street Significant impacts at this intersection would occur during the weekday PM and Saturday all four peak hours. Impacts at this intersection could be fully mitigated installing “No Standing 4 PM to 7 PM Monday to Friday” regulations along the south curb of the eastbound approach for the entire block (approximately 165 feet), entailing a loss of approximately five parking spaces during the weekday PM peak hour to reduce the effects of parking friction along the approach, and by modifying the signal timing during the weekday midday and PM peak hours by modifying the signal timing. As part of this measure, installation of a pedestrian countdown signal would be required as per NYCDOT’s standards. Significant impacts during the weekday AM and Saturday peak hours could not be mitigated.
RIVINGTON STREET CORRIDOR
Of the three intersections analyzed along Rivington Street, the intersection of Rivington Street and Essex Street would be significantly impacted during the weekday AM and PM all four peak hours. Significant impacts could be fully mitigated during both peak hours by installing “No Standing 10 AM to 7 PM Saturday” regulations along the west curb of the southbound approach for approximately 250 feet, entailing a loss of approximately seven parking spaces, restriping the northbound and southbound approaches, and modifying the signal timing modifications. The northbound approach centerline could be shifted six feet to the east and the approach could be restriped from one 10-foot wide travel lane and one 18-foot wide travel lane with parking to one 12-foot travel lane and one 9-foot wide parking lane (the sidewalk along the east side of Essex Street could be extended seven inches to the west to mitigate pedestrian impacts). The southbound receiving side could be restriped from one 10-foot wide travel lane and one 17-foot wide travel lane with parking to one 12-foot wide travel lane, one 11-foot travel lane, and one 10-foot wide parking

Seward Park Mixed-Use Development
21-8
lane. The southbound approach centerline could be shifted six feet to the east and the approach could be restriped from one 10-foot wide travel lane and one 17-foot wide travel lane with parking to one 12-foot wide travel lane, one 11-foot wide travel lane, and one 10-foot wide parking lane, which could operate as a travel lane in the Saturday peak period. The northbound receiving side could be restriped from one 10-foot wide travel lane and one 18-foot wide travel lane with parking to one 12-foot wide travel lane, and one 10-foot wide parking lane. The lane restriping along northbound and southbound Rivington Street could be similar to the restriping proposed by NYCDOT at the intersection of Essex Street and Delancey Street as part of the Delancey Street Safety Improvements plan.
EAST HOUSTON STREET CORRIDOR
Three of the four intersections along East Houston Street would be significantly impacted during the weekday AM peak hour, and only one intersection would be significantly impacted during the weekday midday peak hour. All four intersections analyzed along East Houston Street would be significantly impacted during the weekday AM, PM, and Saturday peak hours. Significant impacts could be fully mitigated with signal timing modifications at two three of the four intersections; the intersection of East Houston Street and Chrystie Street/Second Avenue would be unmitigatable, and the intersection of East Houston Street and Allen Street/First Avenue could not be fully mitigated during the weekday AM and PM peak hours.
East Houston Street and Bowery Significant impacts would occur at this location during the weekday AM and PM, and Saturday peak hours, and could be fully mitigated by modifying the signal timing.
East Houston Street and Chrystie Street/Second Avenue Significant impacts would occur at this location during the weekday PM and Saturday all four peak hours, and could be fully mitigated during the weekday midday, PM, and Saturday peak hours by modifying the signal timing. Significant impacts could not be mitigated during the weekday AM peak hour.
East Houston Street and Allen Street/First Avenue This intersection would be significantly impacted during the weekday AM, midday, and PM, and Saturday peak hours, and could be fully mitigated during the Saturday peak hour by modifying the signal timing during all peak hours except for the weekday AM peak hour. Significant impacts at this intersection during the weekday AM and PM peak hours could not only be fully partially mitigated.
East Houston Street and Essex Street/Avenue A Significant impacts would occur at this location during all peak hours and could be fully mitigated by modifying the signal timing.
IMPLEMENTATION
Each of the traffic capacity improvements described above fall within the jurisdiction of NYCDOT for implementation. The implementation of these measures would result in the loss of approximately eight metered parking or “standing” spaces during the weekday AM peak period, 13 spaces during the weekday midday peak period, 13 spaces during the weekday PM peak period, and seven eight parking spaces along Essex Street between Rivington Street and Stanton

Chapter 21: Mitigation Measures
21-9
Street during the Saturday peak period. Delancey Street would lose three parking spaces between Norfolk Street and Suffolk Street, and Grand Street would lose up to 10 parking spaces between Allen Street and Clinton Street. No designated truck loading/unloading zones or bus layover space would be affected by the proposed parking modifications for mitigation. If it is determined that on-street parking should be retained at locations where such mitigation was assumed, additional unmitigated traffic impacts could result.
TRANSIT
As discussed in Chapter 13, “Transportation,” the proposed actions would result in significant adverse bus line haul impacts on the M9 bus route during both the AM and PM peak periods and the M14A bus route during the AM peak period. Potential measures to mitigate these impacts are described below.
BUS LINE HAUL
The proposed actions would result in significant adverse bus line haul impacts on the M9 and M14A routes as the projected passenger volumes in the future with the proposed actions condition would exceed the NYCT guideline capacity during the following peak periods:
• Southbound M9 bus route during the AM and PM peak periods; • Northbound M9 bus route during the PM peak period; and • Westbound M14A bus route during the AM peak period.
Table 21-2 provides a comparison of existing service and the number of buses required to fully mitigate the identified significant adverse line haul impacts along the M9 and M14A bus routes. While NYCT routinely monitors changes in bus ridership and would make the necessary service adjustments where warranted, these service adjustments are subject to the agencies’ fiscal and operational constraints and, if implemented, are expected to take place over time.
Table 21-2 2022 Mitigated Future With The Proposed Actions
Condition (Capacity Improvement): Bus Line Haul Levels
Route Peak Period
Northbound/Eastbound Buses per Hour
Southbound/Westbound Buses per Hour
Existing Mitigation Existing Mitigation
M9 AM 8 n/a 6 8 PM 5 7 4 5
M14A AM 7 n/a 8 9 Notes: The M9 bus route operates standard buses with a guideline capacity of 54 passengers per bus. The M14A bus route operates articulated buses with a guideline capacity of 85 passengers per bus.
SUBWAYS
Although no potential significant adverse subway station impacts have so far been determined, Subsequent to the publication of the DGEIS, at the direction of the Metropolitan Transportation Authority-New York City Transit, analyses of the following interior transfer and platform stairways and an escalator will be were undertaken for the FGEIS:
• Station escalator at Essex Street between Delancey Street and Broome Street on the east sidewalk (E328)

Seward Park Mixed-Use Development
21-10
• PL3(PL4):A61) - platform stair at uptown Manhattan bound J/M/Z platform connecting to Uptown F platform;
• P9(P10):N525) -stairway leading to uptown F train platform; • PL2&PL9 (leading to PL11B on uptown F train platform) – Brooklyn bound J/M/Z
platform; and • PL18 (connecting to downtown F train platform) - Brooklyn bound J/M/Z platform. As part of incorporating these stairway elements in the subway analyses, the distribution of project generated subway trips will be refined to reflect the connectivity of the interior and platform stairways with the street-level stairways analyzed in the DGEIS.
The above amendments to the analysis may result in significant adverse subway station impacts that are being conservatively disclosed in this DGEIS. Should the results of the analyses identify significant adverse impacts, measures to increase capacity would be recommended to mitigate such impacts. The practicability and feasibility of such mitigation measures will be further assessed in the FGEIS.
As discussed in Chapter 13, “Transportation,” the analysis results show that the proposed actions would not result in any significant subway impacts.
PEDESTRIANS
As discussed in Chapter 13, “Transportation,” the proposed actions would result in significant adverse pedestrian impacts at four five pedestrian analysis locations at along Delancey Street and at Essex and Clinton Streets including the west crosswalk of Delancey Street and Essex Street during the midday peak period, the east crosswalk of Delancey Street and Essex Street during the midday, PM and Saturday peak periods, the west sidewalk of Essex Street between Delancey Street and Broome Street during the AM and midday peak periods, and the east sidewalk of Essex Street between Delancey Street and Rivington Street during the midday and Saturday peak periods, and the north crosswalk of Delancey Street and Clinton Street during the Saturday peak period.
Potential measures to mitigate these impacts are described below, and the mitigated conditions are summarized in Table 21-3.
Delancey Street and Essex Street Crosswalks
• The west crosswalk at this intersection would deteriorate from below mid-LOS D (22.4 21.7 SFP) to beyond mid-LOS D (18.4 17.2 SFP) during the midday peak period. This significant adverse pedestrian impact could be fully mitigated by restriping the width of this crosswalk from its existing width of 14 feet to 15 16 feet.
• The east crosswalk at this intersection would deteriorate from LOS C (39.6 SFP), LOS C (39.8 SFP) and LOS B C (40.5 34.5 SFP) to LOS E (14.5 SFP), LOS D (15.4 SFP) and LOS D E (18.5 13.5 SFP) during the midday, PM and Saturday peak periods, respectively. This significant adverse pedestrian impact could be fully mitigated by restriping the width of this crosswalk from its existing width of 14 feet to 15 20 feet.

Chapter 21: Mitigation Measures
21-11
Table 21-3 2022 No Action, With Action, and Mitigated With Action Conditions
Pedestrian Level of Service Analysis
Location Mitigation Measures No Action With Action
Mitigated With Action
SFP/PMF LOS SFP/PMF LOS SFP/PMF LOS Weekday AM Peak 15-Minutes
Delancey Street and Essex Street – SW sidewalk
Widening sidewalk by 2 feet 3 8 inches to 15 13 feet 3 8 inches
6.3 6.4 D 11.1 10.9 E D 8.4 8.5 D
Weekday Midday Peak 15-Minutes Delancey Street and Essex Street – SW sidewalk
Widening sidewalk by 2 feet 3 8 inches to 15 13 feet 3 8 inches
4.5 4.6 C 9.2 9.3 D 6.9 7.3 D
Delancey Street and Essex Street – NE sidewalk
Widening sidewalk by 7 inches to 13 feet 7 inches 3.7 C 8.6 D 7.5 D
Delancey Street and Essex Street – West Crosswalk
Widening crosswalk by 1 2 foot feet to 15 16 feet 22.4 21.7 D 18.4 17.2 D 19.9 D
Delancey Street and Essex Street – East Crosswalk
Widening crosswalk by 6 feet to 20 feet 39.6 C 14.5 E 21.1 D
Weekday PM Peak 15-Minutes Delancey Street and Essex Street – East Crosswalk
Widening crosswalk by 6 feet to 20 feet 39.8 C 15.4 D 22.5 D
Saturday Peak 15-Minutes Delancey Street and Essex Street – NE sidewalk
Widening sidewalk by 2 7 inches to 13 feet 2 7 inches
5.3 5.2 C 8.8 9.8 D 8.4 8.5 D
Delancey Street and Essex Street – East Crosswalk
Widening crosswalk by 1 6 foot feet to 15 20 feet 40.5 34.5 B C 18.5 13.5 D E 19.9 19.7 D
Delancey Street and Clinton Street – North Crosswalk
Widening crosswalk by 1 foot to 17 feet 16.7 D 14.9 E 16.0 D
Note: SFP = square feet per pedestrian; PMF = pedestrians per minute per foot.
Sidewalks • The west sidewalk of Essex Street between Delancey Street and Broome Street would
deteriorate from below mid-LOS D (6.3 6.4 PMF) and LOS C (4.5 4.6 PMF) to LOS E beyond mid-LOS D (11.1 10.9 PMF) and LOS D (9.2 9.3 PMF) during the AM and midday peak periods, respectively. As discussed in Chapter 13, “Transportation,” subsequent to the issuance of the DGEIS, at NYCDOT’s direction, the assignment of pedestrian trips to study area sidewalks and crosswalks was revised to direct more pedestrian trips on Essex Street. These changes resulted in increased project-generated pedestrian trips on Essex Street’s sidewalks and crosswalks, and subsequently in a potential significant adverse impact at this sidewalk location. The pedestrian analysis for the 2022 With Action condition was performed by incorporating the pedestrian activities generated by the proposed actions’ RWCDS full build-out. In addition, the pedestrian analysis used the narrowest pedestrian walking paths by reducing the available sidewalk widths from obstructions created by subway stair entrances, street furniture, and “shy-distances” (i.e., the space left between pedestrians and curbs/building façades) throughout the entire length of this sidewalk segment following the 2000 Highway Capacity Manual guidelines. These assumptions reduced the effective sidewalk width to approximately 20 percent of the overall width. The combination of all these factors resulted in the potential for a significant adverse sidewalk impact at this location in the future 2022 With Action condition. This potential significant adverse pedestrian impact could be fully mitigated by widening the sidewalk from its

Seward Park Mixed-Use Development
21-12
existing width of 13 feet to 13 feet and 8 inches. However, this mitigation measure is not feasible and practicable since there are constraints that would prohibit such widening. Specifically, the presence of a subway stairway would preclude any widening towards the west side. Although widening the sidewalk by extending it into the roadbed is a potential mitigation measure, NYCDOT does not typically undertake such widening except for extending corners by providing bulbouts; thus, the potential significant adverse sidewalk impact would be unmitigated. It should be further noted that the pedestrian analysis presents a RWCDS assessment of future pedestrian levels since the proposed actions’ development program and design may not be fully realized as assumed in the RWCDS in the future conditions, resulting in different travel patterns at this location.
• The east sidewalk of Essex Street between Delancey Street and Rivington Street would deteriorate from LOS C (3.7 PMF) and LOS C (5.3 5.2 PMF) to LOS D (8.6 PMF) and LOS D (8.8 9.8 PMF) during the midday and Saturday peak periods, respectively. As discussed in Chapter 13, “Transportation,” subsequent to the issuance of the DGEIS, at NYCDOT’s direction, the assignment of pedestrian trips to study area sidewalks and crosswalks was revised to direct more pedestrian trips on Essex Street. These changes resulted in increased project-generated pedestrian trips on Essex Street’s sidewalks and crosswalks, and subsequently in a potential significant adverse impact at this sidewalk location. In addition, the pedestrian analysis for the 2022 With Action condition was performed by incorporating the pedestrian activities generated by the proposed actions’ RWCDS full build-out. The sidewalk analysis used the narrowest pedestrian walking paths by reducing the available sidewalk widths from obstructions created by subway stair entrances, street furniture, and “shy-distances” throughout the entire length of this sidewalk segment following the 2000 Highway Capacity Manual guidelines. This assumption reduced the effective sidewalk width to approximately 30 percent of the overall width. The combination of all these factors resulted in the potential for a significant adverse sidewalk impact at this location in the future 2022 With Action condition. This potential significant adverse pedestrian impact could be fully mitigated by widening the sidewalk from its existing width of 13 feet to 13 feet and 7 inches. However, this mitigation measure is not feasible and practicable since there are constraints that would prohibit such widening. Specifically, the presence of subway stairways abutting the proposed development site (Site 9) would preclude any widening towards the east side. Although widening the sidewalk by extending it into the roadbed is a potential mitigation measure, NYCDOT does not typically undertake such widening except for extending corners by providing bulbouts; thus, the potential significant adverse sidewalk impact would be unmitigated. It should be further noted that the pedestrian analysis presents a RWCDS assessment of future pedestrian levels since the proposed actions’ development program and design may not be fully realized as assumed in the RWCDS in the future conditions, resulting in different travel patterns at this location.
Delancey Street and Clinton Street The north crosswalk at this intersection would deteriorate from LOS D (16.7 SFP) to LOS E (14.9 SFP) during the Saturday peak period. This significant adverse pedestrian impact could be fully mitigated by restriping the width of this crosswalk from its existing width of 16 feet to 17 feet.

Chapter 21: Mitigation Measures
21-13
EFFECTS OF TRAFFIC MITIGATION MEASURES ON PEDESTRIAN OPERATIONS
As described above, intersection operations would alter with the implementation of the recommended traffic mitigation measures. These measures would include changes to existing signal timings and lane utilizations. A review of the effects of these changes on pedestrian circulation and service levels at intersection corners and crosswalks showed that they would not alter the conclusions made for the pedestrian impact analyses, nor would they result in the potential for any additional significant adverse pedestrian impacts.
As mentioned above, NYCDOT is currently developing a Delancey Street corridor plan to improve traffic and pedestrian safety. Once this plan is finalized and implemented, it is expected that the pedestrian safety conditions in the study area would improve. Details related to this plan would be included in the FGEIS should the plan be adopted prior to the release of the FGEIS.
Following the issuance of the DGEIS, as noted previously, NYCDOT adopted and began implementing an area-wide Delancey Street Safety Improvements plan to improve pedestrian, bicycle, and vehicular safety along the Delancey Street corridor including left turn prohibitions, sidewalk expansions, corner “bump-outs” and signal timing changes to shorten pedestrian crossing distances and to provide pedestrians more green time to safely cross Delancey Street, reconfiguration of Clinton Street south of Delancey Street to allow vehicular traffic to access the Williamsburg Bridge from northbound Clinton Street, and other measures to promote pedestrian and bicycle safety, which will result in traffic pattern changes at several intersections. In addition, signal timing modifications are being proposed by NYCDOT along Allen Street to improve service along the M15 bus line. These changes to the study area’s transportation network were incorporated as part of the FGEIS.
EFFECTS OF TRAFFIC MITIGATION MEASURES ON AIR QUALITY Chapter 14, “Air Quality,” concluded that there would be no potential for any significant adverse air quality impacts and no air quality mitigation would be required. However, an analysis is warranted of the proposed actions’ potential effects on air quality with the implementation of the traffic mitigation measures discussed above. The tables below present the effect that proposed traffic mitigation measures would have on maximum predicted pollutant concentrations with the proposed actions. Since the proposed traffic mitigation measures include two options for one of the intersections within the receptor Site 2 study area, results for both options are presented. Tables 21-4 and 21-5 summarize the maximum 8-hour average CO and 24-hour average PM10 concentrations, respectively, each with and without mitigation measures in place. Tables 21-6 and 21-7 summarize the maximum predicted 24-hour and annual average PM2.5 concentration increments, respectively, with and without mitigation measures in place. The values shown are the highest predicted concentrations for the analyzed receptor locations. The results show that with the proposed traffic mitigation measures, as with the proposed actions, concentrations of PM10 with the proposed actions would be below the National Ambient Air Quality Standards (NAAQS) and would not exceed the de minimis threshold for CO or the PM2.5 interim guidance criteria. Therefore, there would be no potential for a significant adverse impact on air quality with the implementation of the traffic mitigation measures. There would also be no potential for a cumulative adverse impact on air quality with the implementation of the traffic mitigation measure and other sources of emissions, discussed in the Chapter 14, “Air Quality.”

Seward Park Mixed-Use Development
21-14
Table 21-4 Future (2022) Maximum Predicted 8-Hour Average Carbon Monoxide
With Action and With Action-Traffic Mitigation Concentrations (parts per million)
Receptor Site Location
Time Period
8-Hour Concentration (ppm)
With Action With Action-
Mitigation 1 Delancey Street at Norfolk Street PM 4.7 5.0 4.7 5.0 2 Grand Street at Norfolk Street (Mitigation Option 1) PM 2.7 2.6 2.9 2.6 2 Grand Street at Norfolk Street (Mitigation Option 2) PM 2.9 2.6
Note: National Ambient Air Quality Standards—8-hour, 9 ppm.
Table 21-5
Future (2022) Maximum Predicted 24-Hour Average PM10 With Action and With Action-Traffic Mitigation Concentrations (µg/m3)
Receptor Site Location
24-Hour Concentration
With Action With Action-
Mitigation 1 Delancey Street at Norfolk Street 91.5 89.9 91.5 89.9 2 Grand Street at Norfolk Street (Mitigation Option 1) 58.3 59.6
59.2 59.6 2 Grand Street at Norfolk Street (Mitigation Option 2) 59.2 59.6
Note: National Ambient Air Quality Standards—24-hour, 150 μg/m3.
Table 21-6 Future (2022) Maximum Predicted 24-Hour Average
PM2.5 With Action and With Action-Traffic Mitigation Increments (µg/m3)
Receptor Site Location
24-Hour Concentration Increments
With Action With Action-
Mitigation 1 Delancey Street at Norfolk Street 0.4 0.5 0.4 0.5 2 Grand Street at Norfolk Street (Mitigation Option 1)
0.2 0.5 0.2
2 Grand Street at Norfolk Street (Mitigation Option 2) 0.5 0.2 Note: PM2.5 interim guidance criteria—24-hour average, 2 µg/m3 (5 µg/m3 not-to-exceed value).
Table 21-7 Future (2022) Maximum Predicted Annual Average
PM2.5 With Action and With Action-Traffic Mitigation Increments (µg/m3)
Receptor Site Location
Annual Concentration Increments
With Action With Action-
Mitigation 1 Delancey Street at Norfolk Street 0.005 0.006 0.005 0.006 2 Grand Street at Norfolk Street (Mitigation Option 1)
0.004 0.006 0.004
2 Grand Street at Norfolk Street (Mitigation Option 2) 0.006 0.004 Note: PM2.5 interim guidance criteria—annual average (neighborhood scale), 0.1 µg/m3.

Chapter 21: Mitigation Measures
21-15
D. CONSTRUCTION
TRAFFIC
The highest amount of construction traffic associated with construction pursuant to the proposed actions is anticipated in the third quarter of 2017. The total number of vehicle trips generated during construction would be approximately 68 percent and 86 percent lower than the total number of vehicle trips generated by the completed development during the weekday AM and PM peak hours, respectively. Nevertheless, because existing and No Action traffic conditions at some study area intersections through which construction-related traffic would travel would operate at unacceptable levels during commuter peak hours, it is possible that significant adverse traffic impacts could occur at some of these locations during construction at some times. A detailed analysis of traffic conditions was completed for nine key intersections near the construction sites, and this analysis indicated that significant adverse traffic impacts could occur at four one of these locations during construction, but at lesser magnitudes than impacts identified under the With Action condition. Where impacts during construction may occur, measures similar to the ones recommended to mitigate impacts of the proposed actions (described above) could be implemented early to alleviate congested traffic conditions.
NOISE
Construction of the proposed development would be required to include measures to reduce noise levels during construction as required by the New York City Noise Control Code. Even with these measures, an analysis based on a conceptual worst-case construction activity and equipment schedule determined that noise levels due to construction activities would result in significant adverse noise impacts at some sensitive receptors (i.e., residential/school buildings) immediately adjacent to some of the proposed development sites. Construction activities would be expected to result in substantially elevated noise levels for two or more continuous years at forty-five (45) 13 locations within the study area. Most of those locations, however, have double-glazed windows and an alternate means of ventilation. For buildings with double-glazed windows and window air conditioners, interior noise levels would be approximately 20 to 25 dBA less than exterior noise levels, and for buildings with double-glazed windows and well-sealed through-the-wall/sleeve/PTAC air conditioners interior noise levels would be approximately 25 to 30 dBA less than exterior noise levels. The typical attenuation provided by double-glazed windows and the alternate ventilation outlined above would be expected to result in interior noise levels during most of the time that are below 45 dBA L10(1) (the CEQR acceptable interior noise level criteria). The projected development at 89 Ludlow Street (see No. 39c on Figure 2-3 in Chapter 2, “Land Use, Zoning and Public Policy) that would also be expected to experience substantially elevated noise levels for two or more continuous years would likely, as a newly constructed building, have double glazed windows and an alternate means of ventilation as well, providing at least 20 to 30 dBA of window/wall attenuation. Given the building attenuation provided by these existing and projected structures, additional receptor controls would be unlikely to fully mitigate the temporary construction noise impacts. Although these structures have double-glazed windows and alternate ventilation, during some limited time periods construction activities may result in interior noise levels that would be above the 45 dBA L10(1) noise level recommended by CEQR for these uses.
A visual survey was performed to identify which locations may not currently have double-glazed windows and/or a means of alternate ventilation, and which locations may have balconies, whose exterior space would have the potential to experience impact. At locations without double-glazed

Seward Park Mixed-Use Development
21-16
windows and/or a means of alternate ventilation, typical attenuation provided by single-paned windows would range from 5 dBA for an open window condition (i.e., no alternate means of ventilation) to 20 dBA (i.e., with an alternate means of ventilation/closed-window condition). This level of attenuation would not be expected to result in interior noise levels during most of the time that are below 45 dBA L10(1) (the CEQR acceptable interior noise level criteria). Construction activities would be expected to result at various times in significant adverse noise impacts at these 15 3 locations, which are shown in Table 21-8.
Some potential receptor controls that could be used to mitigate the impacts at the 10 residential/commercial locations where interior L10 values would be expected to exceed the value considered acceptable by CEQR criteria include the installation of interior storm windows at locations with single-glazed windows, replacement of single-glazed windows with acoustically rated windows, improvements in the sealing of the existing windows, and/or the provision of air-conditioning so that the impacted structures can maintain a closed-window condition. These measures would have the potential to partially mitigate the impacts at these 10 locations. However, such measures would represent a substantial additional cost to the proposed development, and in balancing the goals of the proposed actions to provide substantial affordable residential units, additional receptor controls would not be practicable and feasible mitigation. Thus, should the developments sites be developed and constructed as conservatively presented in this conceptual schedule, up to 10 locations would be expected to experience an unmitigated significant adverse impact at various times.
The refined construction analysis performed between the DGEIS and FGEIS predicted construction noise impacts at fewer windows at Seward Park High School and a shorter duration of impacts. The remaining impacts at the school are a result of noise generated by construction of Sites 1, 2, and 3.
Upon selection of a developer for each of these development sites, an additional construction noise analysis shall be completed by the developer(s) of each site, taking into consideration: (1) the specific development project(s) to be constructed; (2) the anticipated construction timeline and sequencing in relation to the other project sites; (3) the proposed construction means and methodologies, and any new available technologies that exist at the time of construction to reduce construction noise; and (4) the path and source controls, which are to be implemented in conjunction with the project. The Office of the Deputy Mayor for Economic Development (ODMED), as lead agency, and HPD and/or NYCEDC will review the additional analyses.
If the additional analyses find that construction at any of the three development sites would continue to have the potential to result in significant noise impacts at Seward Park High School, the developer(s) of the site(s) with the potential to result in significant noise impacts will investigate whether additional path and source controls may be available to mitigate the potential significant impact and the extent to which the impact would be mitigated.
If the additional analysis, taking into account the detailed information on construction methodology, timing and sequencing and any available additional path and source controls, still shows the potential for significant noise impacts at Seward Park High School resulting from construction at one of the development sites, the developer of that site will explore potential receptor controls for the school facility in consultation with the New York City School Construction Authority (SCA). Potential receptor controls to be considered may include the installation of interior storm windows at locations with single-glazed windows, replacement of single-glazed windows with acoustically rated windows, improvements in the sealing of the existing windows, and/or the provision of air conditioning, so that the impacted façades of the school can maintain a maximum interior noise environment of 45dBA under closed-window conditions. These measures would have the potential

Chapter 21: Mitigation Measures
21-17
Table 21-8 Predicted Noise Impact Locations
Building/Location Associated Land Use
Total Stories Façade
Associated Receptor(s)
Impacted Floor(s)
Impact Duration
(year)
Range of Increase(s)
in dBA*
# of Impacted Single-Glazed
Windows Air-
Conditioning
Balconies of Residential Building
south of Grand Street between Essex and
Clinton Streets Residential 18
North 1A, 1B, 1E All 2nd to
top 2016-2018 5.0-8.8
n/a
East (northernmost
section) 1C 7th 5th to
top 2016-2018 5.7 5.4-10.1 West
(northernmost section) 1D
7th 5th to top 2016-2018 5.4 5.2-7.3
Balconies of Residential Building at the southeast corner of
Clinton and Grand Streets Residential 19
North 3B 7th 5th to
top 2016-2017 4.7 3.0-8.4
n/a
West (northernmost
section) 3C, 3D 5th 2nd to
top 2016-2018 3.3-8.5 3.2-9.2
West (middle section) 3E, 3F
7th 2nd to top 2016-2018 5.3 5.0-9.5
West (southernmost
section) 3G, 3H 11th 5th to
top 2016-2018 5.2 5.1-9.3 South 3I top 2016-2018 5.6-6.9
350 Grand Street
Institutional (Seward Park High School/
Urban Assembly
Academy of Government
and Law) 10
North 14 All 2016-2019 5.5 5.2-17.5 111
Existing Window A/C
East (northernmost
section) 14A 5th 3rd to
top 2016-2018 3.3-6.9 110 East (middle
section) 14B 9th to top 2016-2017 3.0-3.7 192 West
(northernmost section) 14G 4th to top 2019-2020 4.1-11.1 156
83 Essex Street Residential/ Commercial 4 East 15 2nd to top 2016-2017 3.1-7.5 9 None visible
101 Delancey Street Residential/ Commercial 6
East 16C Top 2016-2017 3.2-4.2 Not Visible Not Visible South 16B All 2016-2017 5.1-10.0 Not Visible Not Visible
87 Ludlow Street Residential/ Commercial 6 East 17 3rd to top 2019-2020 3.4-10.6 5
Existing Window A/C
249-255 Broome Street (indoor and balconies)
Residential/ Commercial 7 North 21 3rd to top 2019-2020 5.4-14.8 43
Existing Window A/C
141 Essex Street Residential/ Commercial 6 East 35 5th to top 2020-2021 3.1-4.9 6
Existing Window A/C
145 Essex Street Residential/ Commercial 6 East 37 4th to top 2020-2021 3.2-6.0 2
Existing Window A/C
149 Essex Street (indoor and balconies)
Residential/ Commercial 7 East 39 4th to top 2020-2021 3.4-7.2 18 Existing PTAC
Balconies of 153 Essex Street
Residential/ Commercial 6 East 41 top 2020-2021 3.3-5.2 n/a
Balconies of 113 Norfolk Street Residential 8 West 46A 6th to top 2020-2021 5.0-17.9 n/a
123 Rivington Street Residential/ Commercial 7 South 51B 4th to top 2020-2021 5.1-20.2 5
Existing Window A/C
133 Norfolk Street Residential/ Commercial 7 West 54A 6th to top 2020-2021 3.5-19.1 3 None visible
106 Norfolk Street Residential/ Commercial 7 West 69 6th to top 2017-2018 3.1-3.7 30
Existing Window A/C
Note: * Range of increases values were taken from predicted noise levels compared to existing noise levels.

Seward Park Mixed-Use Development
21-18
to mitigate the impacts at Seward Park High School. In the event that implementing such receptor controls is not practicable, as determined by ODMED as lead agency in consultation with HPD and/or NYCEDC, the proposed actions would result in a partially mitigated impact on Seward Park High School, as set forth in this FGEIS.
For properties that may be under the jurisdiction of HPD or developed through an HPD program, additional mitigation (source and path control measures) identified in the refined and/or additional analyses would be required to be undertaken by the developer(s) through provisions in a Land Disposition Agreement to be entered into at the time of closing. The Land Disposition Agreement would also require the use of a construction monitor, which would operate under the oversight of ODMED, to ensure such measures are implemented during construction activities. In the event it is determined that receptor controls will be implemented at the school, the developer(s) would be required to fund and install the measures (in coordination with ODMED, HPD and SCA) at the affected facades of the school prior to the commencement of construction at the site(s) causing the noise impact.
For properties that may be under the jurisdiction of NYCEDC, noise control measures identified in the refined and/or additional analyses, including receptor controls if determined to be practicable, would be required to be undertaken by the developer(s) through provisions of a contract or other legally binding agreement between NYCEDC and the developer(s). The contract or other legally binding agreement would require the use of a construction monitor, which will operate under the oversight of ODMED, to ensure that such measures are implemented during construction activities.
At limited times during the construction period, Seward Park High School (350 Grand Street) would be expected to experience significant noise impacts that would be considered unmitigated. The west, north, and east facades of the school building may experience elevated noise as a result of the Proposed Project. The DGEIS discloses worst-case construction-related noise impacts at the school. However, it is possible that based on further assessment of conditions at the school, certain facades (or portions thereof) may be less affected (or not be affected at all) by project-related construction noise. Further assessment related to construction impacts at the school will be conducted between DGEIS and FGEIS to refine the area of potential impact. Some potential receptor controls that could be used to mitigate the impacts include the installation of interior storm windows, replacement of single-glazed windows with acoustically rated windows, improvements in the sealing of the existing windows, and/or the provision of air-conditioning so that the impacted structures can maintain a closed-window condition. The project sponsors will explore potential mitigation measures between DGEIS and FGEIS. In the event that mitigation measures are not determined feasible and practicable, the impact would be unmitigated.
Additionally, at the four (4) two buildings that have the potential to experience noise impacts only at outdoor balconies at various floors, there would be no feasible or practicable mitigation to mitigate the construction noise impacts at the balconies. Therefore these balconies would be considered to experience unmitigated significant noise impacts as a result of construction.
Construction activities at the other receptor sites in the study area would at times produce noise levels which would be noisy and intrusive, but due to their limited duration, they would not produce significant noise impacts.

Chapter 21: Mitigation Measures
21-19
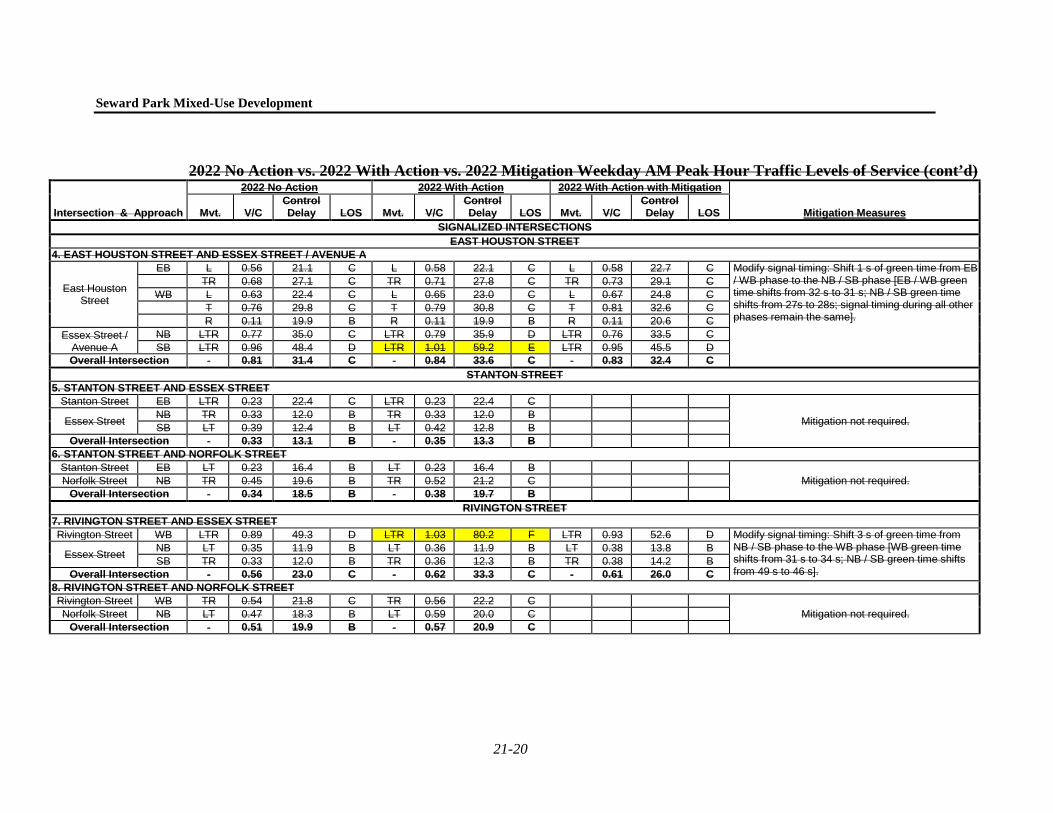
2022 No Action vs. 2022 With Action vs. 2022 Mitigation Weekday AM Peak Hour Traffic Levels of Service
Intersection & Approach
2022 No Action 2022 With Action 2022 With Action with Mitigation
Mitigation Measures Mvt. V/C Control Delay LOS Mvt. V/C
Control Delay LOS Mvt. V/C
Control Delay LOS
SIGNALIZED INTERSECTIONS EAST HOUSTON STREET
1. EAST HOUSTON STREET AND BOWERY
East Houston Street
EB L 0.28 30.4 C L 0.28 30.7 C L 0.30 31.3 C Modify signal timing: Shift 1 s of green time from EBL / WBL lag phase to the EB / WB phase [EB / WB green time shifts from 29 s to 30 s; EBL / WBL lag phase green time shifts from 8 s to 7 s; signal timing during all other phases remain the same].
TR 0.68 29.2 C TR 0.71 29.9 C TR 0.69 28.6 C
WB L 0.68 29.9 C L 0.69 30.9 C L 0.71 31.3 C
TR 1.04 54.6 D TR 1.07 66.1 E TR 1.03 51.9 D
Bowery
NB L 0.84 42.3 D L 0.84 42.3 D L 0.84 42.3 D
TR 0.91 40.3 D TR 0.92 40.6 D TR 0.92 40.6 D
SB L 0.32 26.2 C L 0.32 26.2 C L 0.32 26.2 C
TR 0.92 42.5 D TR 0.92 42.5 D TR 0.92 42.5 D
Overall Intersection - 0.97 42.5 D - 0.97 46.7 D - 0.98 41.6 D 2. EAST HOUSTON STREET AND CHRYSTIE STREET / SECOND AVENUE
East Houston Street
EB T 0.56 29.3 C T 0.59 29.7 C
Mitigation not required.
R 0.79 46.1 D R 0.83 50.7 D
WB L 0.68 42.9 D L 0.71 45.5 D
T 0.74 31.6 C T 0.77 32.4 C
Chrystie Street / Second Avenue
NB L 0.85 39.9 D L 0.86 40.4 D
LR 0.87 42.5 D LR 0.87 42.5 D
SB L 0.78 38.8 D L 0.78 38.8 D
LT 0.75 35.0 D LT 0.79 35.8 D
R 1.01 64.0 E R 1.01 64.0 E Overall Intersection - 0.87 38.5 D - 0.89 39.2 D 3. EAST HOUSTON STREET AND ALLEN STREET / FIRST AVENUE
East Houston Street
EB L 1.12 102.6 F L 1.12 101.6 F
Unmitigatable Impact
T 0.79 29.7 C T 0.82 30.4 C
R 0.82 37.6 D R 0.82 37.6 D WB L 0.43 28.0 C L 0.43 28.8 C
TR 1.04 67.8 E TR 1.07 78.3 E
Allen Street
NB L 0.62 32.6 C L 0.66 33.6 C
T 0.97 49.0 D T 0.98 51.3 D
R 0.35 28.5 C R 0.35 28.5 C Overall Intersection - 1.13 52.1 D - 1.17 55.5 E
Seward Park Mixed-Use Development
21-20
2022 No Action vs. 2022 With Action vs. 2022 Mitigation Weekday AM Peak Hour Traffic Levels of Service (cont’d)
Intersection & Approach
2022 No Action 2022 With Action 2022 With Action with Mitigation
Mitigation Measures Mvt. V/C Control Delay LOS Mvt. V/C
Control Delay LOS Mvt. V/C
Control Delay LOS
SIGNALIZED INTERSECTIONS EAST HOUSTON STREET
4. EAST HOUSTON STREET AND ESSEX STREET / AVENUE A
East Houston Street
EB L 0.56 21.1 C L 0.58 22.1 C L 0.58 22.7 C Modify signal timing: Shift 1 s of green time from EB / WB phase to the NB / SB phase [EB / WB green time shifts from 32 s to 31 s; NB / SB green time shifts from 27s to 28s; signal timing during all other phases remain the same].
TR 0.68 27.1 C TR 0.71 27.8 C TR 0.73 29.1 C
WB L 0.63 22.4 C L 0.65 23.0 C L 0.67 24.8 C
T 0.76 29.8 C T 0.79 30.8 C T 0.81 32.6 C
R 0.11 19.9 B R 0.11 19.9 B R 0.11 20.6 C
Essex Street / Avenue A
NB LTR 0.77 35.0 C LTR 0.79 35.9 D LTR 0.76 33.5 C SB LTR 0.96 48.4 D LTR 1.01 59.2 E LTR 0.95 45.5 D
Overall Intersection - 0.81 31.4 C - 0.84 33.6 C - 0.83 32.4 C STANTON STREET
5. STANTON STREET AND ESSEX STREET Stanton Street EB LTR 0.23 22.4 C LTR 0.23 22.4 C
Mitigation not required. Essex Street NB TR 0.33 12.0 B TR 0.33 12.0 B
SB LT 0.39 12.4 B LT 0.42 12.8 B Overall Intersection - 0.33 13.1 B - 0.35 13.3 B 6. STANTON STREET AND NORFOLK STREET
Stanton Street EB LT 0.23 16.4 B LT 0.23 16.4 B Mitigation not required. Norfolk Street NB TR 0.45 19.6 B TR 0.52 21.2 C Overall Intersection - 0.34 18.5 B - 0.38 19.7 B RIVINGTON STREET
7. RIVINGTON STREET AND ESSEX STREET Rivington Street WB LTR 0.89 49.3 D LTR 1.03 80.2 F LTR 0.93 52.6 D Modify signal timing: Shift 3 s of green time from
NB / SB phase to the WB phase [WB green time shifts from 31 s to 34 s; NB / SB green time shifts from 49 s to 46 s].
Essex Street NB LT 0.35 11.9 B LT 0.36 11.9 B LT 0.38 13.8 B SB TR 0.33 12.0 B TR 0.36 12.3 B TR 0.38 14.2 B
Overall Intersection - 0.56 23.0 C - 0.62 33.3 C - 0.61 26.0 C 8. RIVINGTON STREET AND NORFOLK STREET Rivington Street WB TR 0.54 21.8 C TR 0.56 22.2 C
Mitigation not required. Norfolk Street NB LT 0.47 18.3 B LT 0.59 20.0 C Overall Intersection - 0.51 19.9 B - 0.57 20.9 C

Chapter 21: Mitigation Measures
21-21
2022 No Action vs. 2022 With Action vs. 2022 Mitigation Weekday AM Peak Hour Traffic Levels of Service (cont’d)
Intersection & Approach
2022 No Action 2022 With Action 2022 With Action with Mitigation
Mitigation Measures Mvt. V/C Control Delay LOS Mvt. V/C
Control Delay LOS Mvt. V/C
Control Delay LOS
SIGNALIZED INTERSECTIONS DELANCEY STREET
9. DELANCEY STREET AND ALLEN STREET
Delancey Street EB TR 0.94 36.4 D TR 0.98 41.3 D TR 0.98 41.3 D Mitigation not required.
Modify signal phasing: Allow the NB-right turn movement during the WB-lead phase. Signal timing remains the same during all peak hours. [Measures reflect signal phasing improvements needed to mitigate the intersection during the weekday midday peak period.]
WB L 0.88 55.3 E L 0.90 58.1 E L 0.90 58.1 E
TR 1.02 41.4 D TR 1.03 44.1 D TR 1.03 44.1 D
Allen Street NB T 0.70 35.1 D T 0.73 36.1 D TR 0.73 36.1 D
R 0.60 37.7 D R 0.63 39.5 D R 0.23 8.6 A
SB TR 0.55 32.0 C TR 0.56 32.2 C TR 0.56 32.2 C Overall Intersection - 0.92 39.6 D - 0.94 42.6 D - 0.94 41.7 D
10. DELANCEY STREET AND ORCHARD STREET
Delancey Street EB T 0.41 9.7 A T 0.43 9.8 A
Mitigation not required. WB TR 0.78 14.7 B TR 0.79 14.8 B Orchard Street NB LTR 0.26 26.2 C LTR 0.26 26.2 C Overall Intersection - 0.61 13.3 B - 0.61 13.4 B 11. DELANCEY STREET AND LUDLOW STREET
Delancey Street EB TR 0.43 10.1 B TR 0.45 10.3 B
Mitigation not required. WB T 0.75 13.4 B T 0.75 13.5 B Ludlow Street SB LTR 0.72 41.5 D LTR 0.77 45.8 D Overall Intersection - 0.74 13.9 B - 0.76 14.2 B 12. DELANCEY STREET AND ESSEX STREET
Delancey Street EB TR 0.51 14.1 B TR 0.53 14.3 B
Unmitigatable Impact
WB TR 1.01 41.6 D TR 1.02 42.8 D
Essex Street NB LTR 0.82 46.9 D LTR 0.92 60.4 E
SB DefL 1.08 108.3 F DefL 1.34 209.8 F
TR 0.76 44.7 D TR 0.89 58.4 E
Overall Intersection - 1.04 37.2 D - 1.14 45.4 D 13. DELANCEY STREET AND NORFOLK STREET
Delancey Street EB T 0.61 12.6 B T 0.64 13.0 B T 0.70 16.1 B Modify signal timing: Shift 4 s of green time from EB / WB phase to the NB phase [EB / WB green time shifts from 53 s to 49 s; NB green time shifts from 27 s to 31 s].
WB TR 0.93 19.0 B TR 0.95 20.3 C TR 1.03 38.5 D
Norfolk Street NB TR 0.95 61.9 E TR 1.07 93.6 F TR 0.93 53.8 D
R 0.93 58.7 E R 1.08 97.2 F R 0.94 56.0 E
Overall Intersection - 0.94 22.4 C - 0.99 29.1 C - 0.99 33.0 C

Seward Park Mixed-Use Development
21-22
2022 No Action vs. 2022 With Action vs. 2022 Mitigation Weekday AM Peak Hour Traffic Levels of Service Table 21-9 (cont’d)
Intersection & Approach
2022 No Action 2022 With Action 2022 With Action with Mitigation
Mitigation Measures Mvt. V/C Control Delay LOS Mvt. V/C
Control Delay LOS Mvt. V/C
Control Delay LOS
SIGNALIZED INTERSECTIONS 14. DELANCEY STREET AND SUFFOLK STREET
Delancey Street EB T 0.79 17.4 B T 0.80 17.6 B Mitigation not required. WB T 0.94 20.0 B T 0.96 20.6 C Delancey Street
Service Road EB TR 0.19 10.3 B TR 0.44 13.0 B Suffolk Street SB R 0.11 21.5 C R 0.14 22.1 C Overall Intersection - 0.63 18.6 B - 0.65 18.9 B 15. DELANCEY STREET AND CLINTON STREET
Delancey Street EB T 0.64 10.1 B T 0.64 10.2 B
Unmitigatable Impact
Williamsburg Bridge
WB T 1.07 54.1 D T 1.08 59.4 E
R 1.07 82.0 F R 1.08 86.3 F
Delancey Street Service Road
EB TR 0.14 6.5 A TR 0.16 6.7 A WB TR 1.01 88.5 F TR 1.01 88.5 F Clinton Street NB R 0.17 28.0 C R 0.17 28.0 C Overall Intersection - 0.82 39.8 D - 0.83 42.7 D BROOME STREET
16. BROOME STREET AND ESSEX STREET Broome Street EB LTR 0.17 21.3 C LTR 0.20 21.8 C LTR 0.20 21.8 C Mitigation not required.
Modify signal phasing: Add a new lead phase for the SB approach. The existing signal phasing [EB phase has 31 s of green time; NB / SB phase has 49 s of green time] would be modified to the following: EB phase will have 31 s of green time, SB-lead phase will have 11 s of green time, and NB / SB phase will have 33 s of green [each phase will have 3 s amber and 2 s all red]. [Measures reflect signal phasing improvements needed to mitigate the intersection during the weekday PM peak period.]
Essex Street
NB TR 0.30 11.6 B TR 0.32 11.9 B TR 0.48 23.5 C SB L 0.11 10.4 B L 0.25 12.3 B L 0.21 11.3 B
T 0.26 11.4 B T 0.26 11.4 B T 0.26 11.4 B
Overall Intersection - 0.25 12.6 B - 0.27 12.8 B - 0.37 19.0 B 17. BROOME STREET AND NORFOLK STREET
Broome Street EB L 0.12 10.3 B L 0.18 10.8 B
Mitigation not required. WB R 0.41 13.7 B R 0.43 14.1 B Norfolk Street NB T 0.77 30.4 C T 0.92 40.0 D Overall Intersection - 0.55 21.9 C - 0.62 27.2 C

Chapter 21: Mitigation Measures
21-23
2022 No Action vs. 2022 With Action vs. 2022 Mitigation Weekday AM Peak Hour Traffic Levels of Service (cont’d)
Intersection & Approach
2022 No Action 2022 With Action 2022 With Action with Mitigation
Mitigation Measures Mvt. V/C Control Delay LOS Mvt. V/C
Control Delay LOS Mvt. V/C
Control Delay LOS
SIGNALIZED INTERSECTIONS GRAND STREET
18. GRAND STREET AND ALLEN STREET
Grand Street EB LTR 1.05 66.9 E LTR 1.16 112.5 F LTR 1.01 52.7 D Option 1 Modify signal timing: Shift 3 s of green time from NB / SB phase to the EB / WB phase; shift 1 s from the NB / SB phase to SB-lead phase [EB / WB green time shifts from 27 s to 30 s; SB-lead phase green time shifts from 10 s to 11 s, NB / SB green time shifts from 23 s to 19 s, NB-lead phase green time remains the same].
WB LTR 0.79 45.1 D LTR 0.95 68.2 E LTR 0.84 47.2 D
Allen Street
NB L 0.63 55.7 E L 0.63 55.7 E L 0.63 55.7 E
TR 0.53 21.0 C TR 0.54 21.2 C TR 0.60 25.1 C
SB L 0.86 73.7 E L 0.90 81.2 F L 0.82 66.2 E
TR 0.58 21.8 C TR 0.58 21.8 C TR 0.63 24.9 C
Overall Intersection - 0.76 37.0 D - 0.81 49.5 D - 0.80 37.2 D
LTR 0.93 36.4 D Option 2
Modify signal phasing: The existing signal phasing [EB / WB phase has 27 s of green; SB-lead phase has 10 s of green; NBTR / SBTR phase has 23 s of green; NB-lag phase has 10 s of green] would be modified to the following: EB / WB phase will have 32 s of green time; NBL / SBL phase will have 11 s of green time; NBTR / SBTR phase will have 32 s of green time [each phase will have 3 s amber and 2 s all red]. Pedestrians are not allowed to cross during the NBL / SBL phase.
LTR 0.79 40.2 D
L 0.57 50.5 D
TR 0.64 27.3 C
L 0.82 66.2 E
TR 0.69 28.5 C
- 0.81 35.0 C
19. GRAND STREET AND ORCHARD STREET
Grand Street EB LT 0.63 21.1 C LT 0.69 22.6 C
Mitigation not required. WB TR 0.50 20.9 C TR 0.58 22.8 C Orchard Street NB LTR 0.15 15.4 B LTR 0.15 15.4 B Overall Intersection - 0.39 20.3 C - 0.42 21.9 C 20. GRAND STREET AND LUDLOW STREET
Grand Street EB TR 0.59 22.5 C TR 0.66 24.6 C
Mitigation not required. WB LT 0.34 17.3 B LT 0.41 18.3 B Ludlow Street SB LTR 0.28 17.4 B LTR 0.29 17.5 B Overall Intersection - 0.44 19.7 B - 0.48 21.1 C

Seward Park Mixed-Use Development
21-24
2022 No Action vs. 2022 With Action vs. 2022 Mitigation Weekday AM Peak Hour Traffic Levels of Service (cont’d)
Intersection & Approach
2022 No Action 2022 With Action 2022 With Action with Mitigation
Mitigation Measures Mvt. V/C Control Delay LOS Mvt. V/C
Control Delay LOS Mvt. V/C
Control Delay LOS
SIGNALIZED INTERSECTIONS GRAND STREET
21. GRAND STREET AND ESSEX STREET
Grand Street EB LTR 0.76 30.1 C LTR 0.86 38.1 D LTR 0.87 40.1 D Mitigation not required.
Install "No Standing Anytime" regulation along the north curb of the WB approach for 100-feet from the intersection to allow for two moving lanes. Restripe the WB approach from one 11-foot travel lane, one 5-foot bike lane, and one 10-foot parking lane to one 11-foot left-through lane, one 5-foot bike lane, and one 10-foot right turn lane. [Measures reflect geometric improvements needed to mitigate the intersection during the weekday PM peak period.]
WB LTR 0.72 21.7 C LTR 0.88 26.3 C LT 0.44 17.6 B
- - - - - - - - R 0.43 17.8 B
Essex Street NB LTR 0.38 17.9 B LTR 0.40 18.2 B LTR 0.40 18.2 B SB DefL 0.40 21.5 C DefL 0.43 22.9 C DefL 0.43 22.9 C
TR 0.29 17.5 B TR 0.30 17.6 B TR 0.30 17.6 B
Overall Intersection - 0.58 22.5 C - 0.66 26.5 C - 0.65 24.4 C 22. GRAND STREET AND NORFOLK STREET
Grand Street
EB L 0.31 15.0 B L 0.56 23.9 C L 0.31 14.2 B Install "No Standing Anytime" regulation along the north curb of the WB approach for 100-feet from the intersection to allow for two moving lanes. Restripe the WB approach from one 11-foot travel lane, one 5-foot bike lane, and one 10-foot parking lane to one 11-foot left-through lane, one 5-foot bike lane, and one 10-foot right turn lane.
T 0.54 17.1 B T 0.54 17.1 B T 0.54 17.1 B
WB TR 1.02 49.2 D TR 1.19 115.9 F T 0.53 15.3 B
- - - - - - - - R 0.63 17.6 B
Overall Intersection - 1.01 37.0 D - 1.19 80.9 F - 0.63 16.4 B 23. GRAND STREET AND SUFFOLK STREET
Grand Street EB T 0.49 15.9 B T 0.49 15.9 B
Mitigation not required. WB T 0.89 30.8 C T 0.95 39.4 D Suffolk Street SB LR 0.10 19.2 B LR 0.34 22.7 C Overall Intersection - 0.56 25.3 C - 0.70 30.5 C 24. GRAND STREET AND CLINTON STREET
Grand Street
EB LTR 0.73 26.9 C LTR 0.81 32.7 C
Mitigation not required.
WB L 0.05 11.8 B L 0.06 11.8 B
T 0.70 21.0 C T 0.75 22.7 C
R 0.68 25.7 C R 0.75 30.2 C
Clinton Street NB LTR 0.67 29.3 C LTR 0.72 31.4 C SB LTR 0.02 17.0 B LTR 0.04 17.2 B Overall Intersection - 0.70 24.5 C - 0.77 27.6 C

Chapter 21: Mitigation Measures
21-25
2022 No Action vs. 2022 With Action vs. 2022 Mitigation Weekday AM Peak Hour Traffic Levels of Service (cont’d)
Intersection & Approach
2022 No Action 2022 With Action 2022 With Action with Mitigation
Mitigation Measures Mvt. V/C Control Delay LOS Mvt. V/C
Control Delay LOS Mvt. V/C
Control Delay LOS
SIGNALIZED INTERSECTIONS GRAND STREET
25. GRAND STREET AND EAST BROADWAY
Grand Street EB T 0.16 7.1 A T 0.17 7.2 A
Mitigation not required. WB LT 0.76 15.5 B LT 0.81 17.7 B East Broadway NB R 0.00 6.1 A R 0.00 6.1 A Overall Intersection - 0.76 13.9 B - 0.81 15.7 B UNSIGNALIZED INTERSECTIONS
26. STANTON STREET AND LUDLOW STREET Stanton Street EB TR - 8.0 A TR - 8.0 A
Mitigation not required. Ludlow Street SB LT - 9.2 A LT - 9.2 A Overall Intersection - - 8.9 A - - 8.9 A 27. RIVINGTON STREET AND LUDLOW STREET
Rivington Street WB LT - 10.3 B LT - 10.3 B Mitigation not required. Ludlow Street SB TR - 9.4 A TR - 9.5 A Overall Intersection - - 9.9 A - - 10.0 A 28. BROOME STREET AND LUDLOW STREET
Broome Street EB TR - 10.5 B TR - 10.7 B Mitigation not required. Ludlow Street SB LT - 7.5 A LT - 7.5 A Overall Intersection - - 1.8 A - - 6.0 A 29. BROOME STREET AND SUFFOLK STREET
Broome Street WB LT - 7.3 A LT - 7.4 A Mitigation not required. Suffolk Street SB TR - 10.9 B TR - 13.9 B Overall Intersection - - 1.8 A - - 5.2 A 30. BROOME STREET AND CLINTON STREET
Broome Street NB LTR - 8.5 A LTR - 8.6 A
Mitigation not required. SB LTR - 8.8 A LTR - 8.8 A Overall Intersection - - 6.0 A - - 5.9 A Notes:
(1) Control delay is measured in seconds per vehicle. (2) Overall intersection V/C ratio is the critical lane groups' V/C ratio.
Denotes a significant impact.

Seward Park Mixed-Use Development
21-26
2022 No Action vs. 2022 With Action vs. 2022 Mitigation Weekday AM Peak Hour Traffic Levels of Service1
Intersection & Approach
2022 No Action 2022 With Action 2022 With Action with Mitigation
Mitigation Measures Mvt. V/C Control Delay LOS Mvt. V/C
Control Delay LOS Mvt. V/C
Control Delay LOS
SIGNALIZED INTERSECTIONS EAST HOUSTON STREET
1. EAST HOUSTON STREET AND BOWERY
East Houston Street
EB L 0.28 30.5 C L 0.28 30.9 C L 0.30 31.4 C Modify signal timing: Shift 1 s of green time from EBL / WBL lag phase to the EB / WB phase [EB / WB green time shifts from 29 s to 30 s; EBL / WBL lag phase green time shifts from 8 s to 7 s; signal timing during all other phases remain the same].
TR 0.69 29.4 C TR 0.72 30.1 C TR 0.69 28.8 C
WB L 0.69 30.4 C L 0.71 31.4 C L 0.73 32.0 C
TR 1.05 58.3 E TR 1.08 69.9 E TR 1.04 54.8 D
Bowery
NB L 0.86 44.0 D L 0.86 44.0 D L 0.86 44.0 D
TR 0.92 41.3 D TR 0.93 41.4 D TR 0.93 41.4 D
SB L 0.32 26.3 C L 0.32 26.4 C L 0.32 26.4 C
TR 0.92 42.8 D TR 0.92 42.8 D TR 0.92 42.8 D
Overall Intersection - 0.97 44.1 D - 0.98 48.3 D - 0.99 42.9 D 2. EAST HOUSTON STREET AND CHRYSTIE STREET / SECOND AVENUE
East Houston Street
EB T 0.57 29.4 C T 0.59 29.8 C
Unmitigatable Impact
R 0.82 49.4 D R 0.87 55.6 E
WB L 0.72 45.7 D L 0.74 48.4 D
T 0.74 31.7 C T 0.77 32.5 C
Chrystie Street / Second Avenue
NB L 0.89 42.3 D L 0.89 42.7 D
LR 0.83 40.5 D LR 0.84 40.7 D
SB L 0.78 38.8 D L 0.78 38.8 D
LT 0.76 35.1 D LT 0.79 35.9 D
R 1.01 64.0 E R 1.01 64.0 E Overall Intersection - 0.90 39.0 D - 0.91 39.8 D 3. EAST HOUSTON STREET AND ALLEN STREET / FIRST AVENUE
East Houston Street
EB L 0.90 42.4 D L 0.90 42.2 D L 0.93 46.1 D
Partially Mitigated Modify signal timing: Shift 1 s of green time from EBL/WBL lag phase to the NB phase [EBL / WBL green time shifts from 15 s to 14 s; NB green time shifts from 22 s to 23 s; signal timing during all other phases remain the same].
T 0.86 33.1 C T 0.89 34.3 C T 0.89 34.3 C
R 0.90 47.0 D R 0.90 47.0 D R 0.90 47.0 D
WB L 0.36 24.8 C L 0.36 25.3 C L 0.37 26.2 C
TR 1.13 101.3 F TR 1.16 114.7 F TR 1.16 114.7 F
Allen Street NB L 0.70 37.6 D L 0.74 39.3 D L 0.71 37.0 D
T 1.10 90.7 F T 1.11 95.9 F T 1.06 77.2 E
R 0.41 32.5 C R 0.41 32.5 C R 0.39 31.2 C
Overall Intersection - 1.13 66.0 E - 1.13 71.2 E - 1.13 67.2 E
1 This table has been revised for the FGEIS.

Chapter 21: Mitigation Measures
21-27
2022 No Action vs. 2022 With Action vs. 2022 Mitigation Weekday AM Peak Hour Traffic Levels of Service (cont’d)
Intersection & Approach
2022 No Action 2022 With Action 2022 With Action with Mitigation
Mitigation Measures Mvt. V/C Control Delay LOS Mvt. V/C
Control Delay LOS Mvt. V/C
Control Delay LOS
SIGNALIZED INTERSECTIONS EAST HOUSTON STREET
4. EAST HOUSTON STREET AND ESSEX STREET / AVENUE A
East Houston Street
EB L 0.57 21.6 C L 0.59 22.5 C L 0.59 23.1 C Modify signal timing: Shift 1 s of green time from EB / WB phase to the NB / SB phase [EB / WB green time shifts from 32 s to 31 s; NB / SB green time shifts from 27 s to 28 s; signal timing during all other phases remain the same].
TR 0.69 27.3 C TR 0.72 28.0 C TR 0.74 29.4 C
WB L 0.64 22.7 C L 0.65 23.4 C L 0.67 25.0 C
T 0.77 30.0 C T 0.79 30.9 C T 0.82 32.8 C
R 0.11 19.9 B R 0.11 19.9 B R 0.11 20.6 C
Essex Street / Avenue A
NB LTR 0.77 35.0 C LTR 0.79 36.0 D LTR 0.76 33.5 C SB LTR 0.97 50.5 D LTR 1.02 63.1 E LTR 0.96 47.6 D
Overall Intersection - 0.87 31.8 C - 0.91 34.3 C - 0.89 32.9 C STANTON STREET
5. STANTON STREET AND ESSEX STREET Stanton Street EB LTR 0.23 22.4 C LTR 0.23 22.4 C
Mitigation not required. Essex Street NB TR 0.33 12.0 B TR 0.33 12.0 B
SB LT 0.39 12.4 B LT 0.42 12.7 B Overall Intersection - 0.33 13.1 B - 0.34 13.3 B 6. STANTON STREET AND NORFOLK STREET
Stanton Street EB LT 0.23 16.4 B LT 0.23 16.4 B Mitigation not required. Norfolk Street NB TR 0.45 19.7 B TR 0.52 21.2 C Overall Intersection - 0.34 18.6 B - 0.38 19.7 B

Seward Park Mixed-Use Development
21-28
2022 No Action vs. 2022 With Action vs. 2022 Mitigation Weekday AM Peak Hour Traffic Levels of Service (cont’d)
Intersection & Approach
2022 No Action 2022 With Action 2022 With Action with Mitigation
Mitigation Measures Mvt. V/C Control Delay LOS Mvt. V/C
Control Delay LOS Mvt. V/C
Control Delay LOS
SIGNALIZED INTERSECTIONS RIVINGTON STREET
7. RIVINGTON STREET AND ESSEX STREET Rivington Street WB LTR 1.07 92.4 F LTR 1.22 148.0 F LTR 1.07 88.4 Shift the NB approach centerline six feet to the east
and restripe the NB approach from one 10-foot wide travel lane and one 18-foot wide travel lane with parking to one 12-foot wide travel lane and one 10-foot wide parking lane. Restripe the SB receiving side from one 10-foot wide travel lane and one 17-foot wide travel lane with parking to one 12-foot wide travel lane, one 11-foot wide travel lane, and one 10-foot wide parking lane. Shift the SB approach centerline six feet to the east and restripe the SB approach from one 10-foot wide travel lane and one 17-foot wide travel lane with parking to one 11-foot wide travel lane, one 12-foot wide travel lane, and one 10-foot wide parking lane (which would operate as a travel lane during the Saturday peak hour). Restripe the NB receiving side from one 10-foot wide travel lane and one 18-foot wide travel lane with parking to one 12-foot wide travel lane and one 10-foot wide parking lane.
Modify signal timing: Shift 4 s of green time from NB / SB phase to the WB phase [WB green time shifts from 31 s to 35 s; NB / SB green time shifts
from 49 s to 45 s].
Essex Street NB LT 0.35 11.9 B LT 0.36 12.0 B LT 0.71 20.4 SB TR 0.35 12.2 B TR 0.38 12.6 B TR 0.39 14.8
Overall Intersection - 0.63 39.4 D - 0.70 60.1 E - 0.87 42.4 D
8. RIVINGTON STREET AND NORFOLK STREET Rivington Street WB TR 0.69 26.4 C TR 0.71 27.1 C
Mitigation not required. Norfolk Street NB LT 0.45 18.1 B LT 0.58 19.8 B Overall Intersection - 0.57 22.5 C - 0.64 23.4 C

Chapter 21: Mitigation Measures
21-29
2022 No Action vs. 2022 With Action vs. 2022 Mitigation Weekday AM Peak Hour Traffic Levels of Service (cont’d)
Intersection & Approach
2022 No Action 2022 With Action 2022 With Action with Mitigation
Mitigation Measures Mvt. V/C Control Delay LOS Mvt. V/C
Control Delay LOS Mvt. V/C
Control Delay LOS
SIGNALIZED INTERSECTIONS DELANCEY STREET
9. DELANCEY STREET AND ALLEN STREET
Delancey Street EB TR 0.98 40.4 D TR 1.02 50.6 D
Unmitigatable Impact
WB L 0.82 48.0 D L 0.84 49.9 D
TR 1.08 64.6 E TR 1.09 68.5 E
Allen Street
NB T 0.67 33.4 C T 0.70 34.3 C
R 0.23 9.0 A R 0.24 9.1 A
SB TR 0.55 31.1 C TR 0.56 31.3 C Overall Intersection - 0.96 49.6 D - 0.97 54.5 D 10. DELANCEY STREET AND ORCHARD STREET
Delancey Street EB T 0.45 12.0 B T 0.46 12.2 B
Mitigation not required. WB TR 0.86 19.4 B TR 0.87 19.6 B Orchard Street NB LTR 0.22 22.7 C LTR 0.22 22.7 C Overall Intersection - 0.62 17.0 B - 0.63 17.1 B 11. DELANCEY STREET AND LUDLOW STREET
Delancey Street EB TR 0.47 12.5 B TR 0.49 12.8 B Unmitigatable Impact WB T 1.14 85.3 F T 1.15 88.3 F Ludlow Street SB LTR 0.78 42.0 D LTR 0.85 49.4 D Overall Intersection - 1.01 57.5 E - 1.04 59.3 E 12. DELANCEY STREET AND ESSEX STREET
Delancey Street EB TR 0.51 12.9 B TR 0.53 13.2 B
Unmitigatable Impact
WB T 1.17 99.9 F T 1.17 101.2 F
Essex Street
R 0.76 34.3 C R 0.80 39.0 D NB LT 0.69 44.5 D LT 0.76 49.9 D
R 0.80 57.7 E R 0.97 91.5 F
SB TR 0.82 42.2 D TR 0.93 54.7 D Overall Intersection - 1.06 62.0 E - 1.11 64.8 E 13. DELANCEY STREET AND NORFOLK STREET
Delancey Street EB T 0.57 13.7 B T 0.59 13.9 B
Unmitigatable Impact WB TR 1.03 37.8 D TR 1.05 45.8 D
Norfolk Street NB TR 0.74 35.7 D TR 0.89 48.3 D
R 0.71 34.6 C R 0.88 48.3 D Overall Intersection - 0.92 29.3 C - 0.99 35.5 D

Seward Park Mixed-Use Development
21-30
2022 No Action vs. 2022 With Action vs. 2022 Mitigation Weekday AM Peak Hour Traffic Levels of Service (cont’d)
Intersection & Approach
2022 No Action 2022 With Action 2022 With Action with Mitigation
Mitigation Measures Mvt. V/C Control Delay LOS Mvt. V/C
Control Delay LOS Mvt. V/C
Control Delay LOS
SIGNALIZED INTERSECTIONS 14. DELANCEY STREET AND SUFFOLK STREET
Delancey Street EB TR 0.74 16.3 B TR 0.82 18.3 B
Mitigation not required. WB T 0.94 20.0 C T 0.96 20.6 C Suffolk Street SB R 0.21 23.0 C R 0.25 24.0 C Overall Intersection - 0.67 18.4 B - 0.69 19.6 B 15. DELANCEY STREET AND CLINTON STREET
Delancey Street EB T 0.72 15.7 B T 0.73 15.9 B
Unmitigatable Impact
Williamsburg Bridge
WB T 1.24 132.0 F T 1.26 138.8 F
R 0.86 28.8 C R 0.87 29.9 C
Delancey Street Service Road WB R 2.05 571.1 F R 2.05 571.1 F
Clinton Street NB R 1.01 75.8 E R 1.01 75.8 E Overall Intersection - 1.15 78.9 E - 1.16 82.2 F BROOME STREET
16. BROOME STREET AND ESSEX STREET Broome Street EB LTR 0.17 21.3 C LTR 0.20 21.9 C LTR 0.24 25.3 C Modify signal phasing: Add a new lead phase for
the SB approach. The existing signal phasing [EB phase has 31 s of green time; NB / SB phase has 49 s of green time] would be modified to the following: EB phase will have 27 s of green time, SB-lead phase will have 19 s of green time, and NB / SB phase will have 29 s of green [each phase will have 3 s amber and 2 s all red].
Essex Street
NB TR 0.30 11.6 B TR 0.32 11.9 B TR 0.55 27.5 C SB L 0.92 44.6 D L 1.32 179.4 F L 0.83 23.8 C
T 0.33 12.3 B T 0.33 12.3 B T 0.31 10.0 A
Overall Intersection - 0.63 21.7 C - 0.88 66.9 E - 0.57 22.5 C 17. BROOME STREET AND NORFOLK STREET
Broome Street EB L 0.43 14.0 B L 0.72 22.6 C
Mitigation not required. WB R 0.11 10.2 B R 0.18 11.1 B Norfolk Street NB T 0.53 25.1 C T 0.67 27.8 C Overall Intersection - 0.47 18.2 B - 0.70 23.5 C
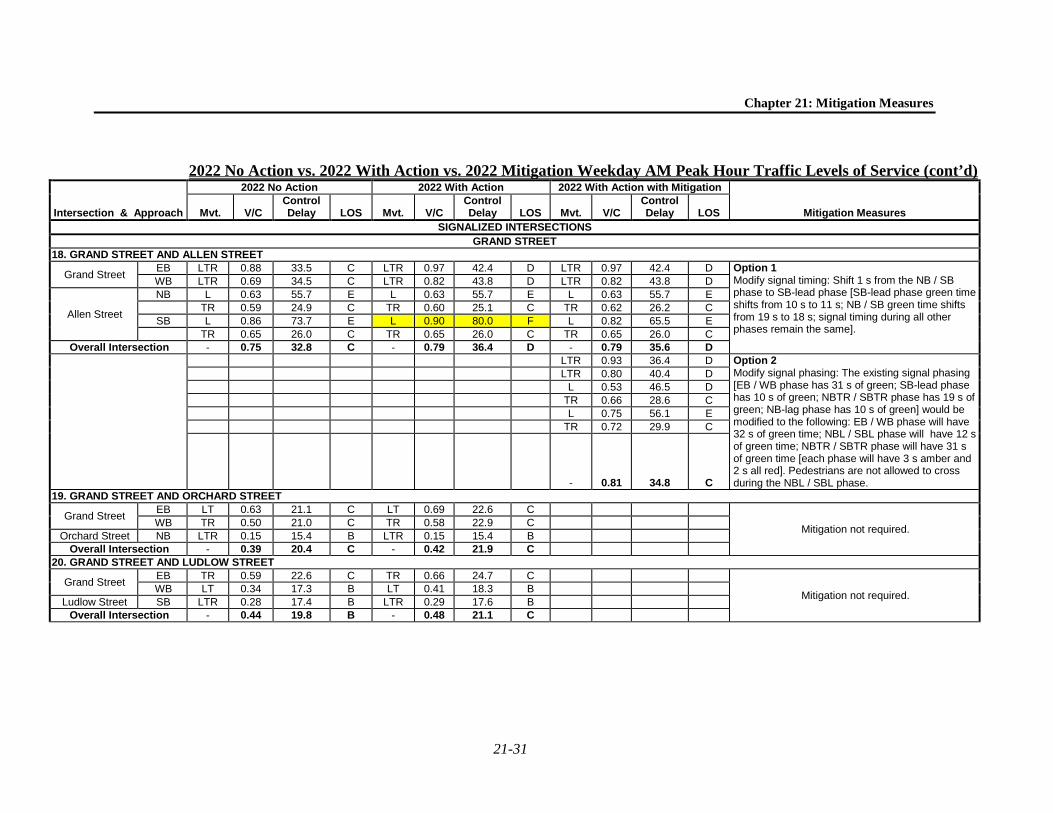
Chapter 21: Mitigation Measures
21-31
2022 No Action vs. 2022 With Action vs. 2022 Mitigation Weekday AM Peak Hour Traffic Levels of Service (cont’d)
Intersection & Approach
2022 No Action 2022 With Action 2022 With Action with Mitigation
Mitigation Measures Mvt. V/C Control Delay LOS Mvt. V/C
Control Delay LOS Mvt. V/C
Control Delay LOS
SIGNALIZED INTERSECTIONS GRAND STREET
18. GRAND STREET AND ALLEN STREET
Grand Street EB LTR 0.88 33.5 C LTR 0.97 42.4 D LTR 0.97 42.4 D Option 1 Modify signal timing: Shift 1 s from the NB / SB phase to SB-lead phase [SB-lead phase green time shifts from 10 s to 11 s; NB / SB green time shifts from 19 s to 18 s; signal timing during all other phases remain the same].
WB LTR 0.69 34.5 C LTR 0.82 43.8 D LTR 0.82 43.8 D
Allen Street
NB L 0.63 55.7 E L 0.63 55.7 E L 0.63 55.7 E
TR 0.59 24.9 C TR 0.60 25.1 C TR 0.62 26.2 C
SB L 0.86 73.7 E L 0.90 80.0 F L 0.82 65.5 E
TR 0.65 26.0 C TR 0.65 26.0 C TR 0.65 26.0 C
Overall Intersection - 0.75 32.8 C - 0.79 36.4 D - 0.79 35.6 D
LTR 0.93 36.4 D Option 2
Modify signal phasing: The existing signal phasing [EB / WB phase has 31 s of green; SB-lead phase has 10 s of green; NBTR / SBTR phase has 19 s of green; NB-lag phase has 10 s of green] would be modified to the following: EB / WB phase will have 32 s of green time; NBL / SBL phase will have 12 s of green time; NBTR / SBTR phase will have 31 s of green time [each phase will have 3 s amber and 2 s all red]. Pedestrians are not allowed to cross during the NBL / SBL phase.
LTR 0.80 40.4 D
L 0.53 46.5 D
TR 0.66 28.6 C
L 0.75 56.1 E
TR 0.72 29.9 C
- 0.81 34.8 C
19. GRAND STREET AND ORCHARD STREET
Grand Street EB LT 0.63 21.1 C LT 0.69 22.6 C
Mitigation not required. WB TR 0.50 21.0 C TR 0.58 22.9 C Orchard Street NB LTR 0.15 15.4 B LTR 0.15 15.4 B Overall Intersection - 0.39 20.4 C - 0.42 21.9 C 20. GRAND STREET AND LUDLOW STREET
Grand Street EB TR 0.59 22.6 C TR 0.66 24.7 C
Mitigation not required. WB LT 0.34 17.3 B LT 0.41 18.3 B Ludlow Street SB LTR 0.28 17.4 B LTR 0.29 17.6 B Overall Intersection - 0.44 19.8 B - 0.48 21.1 C
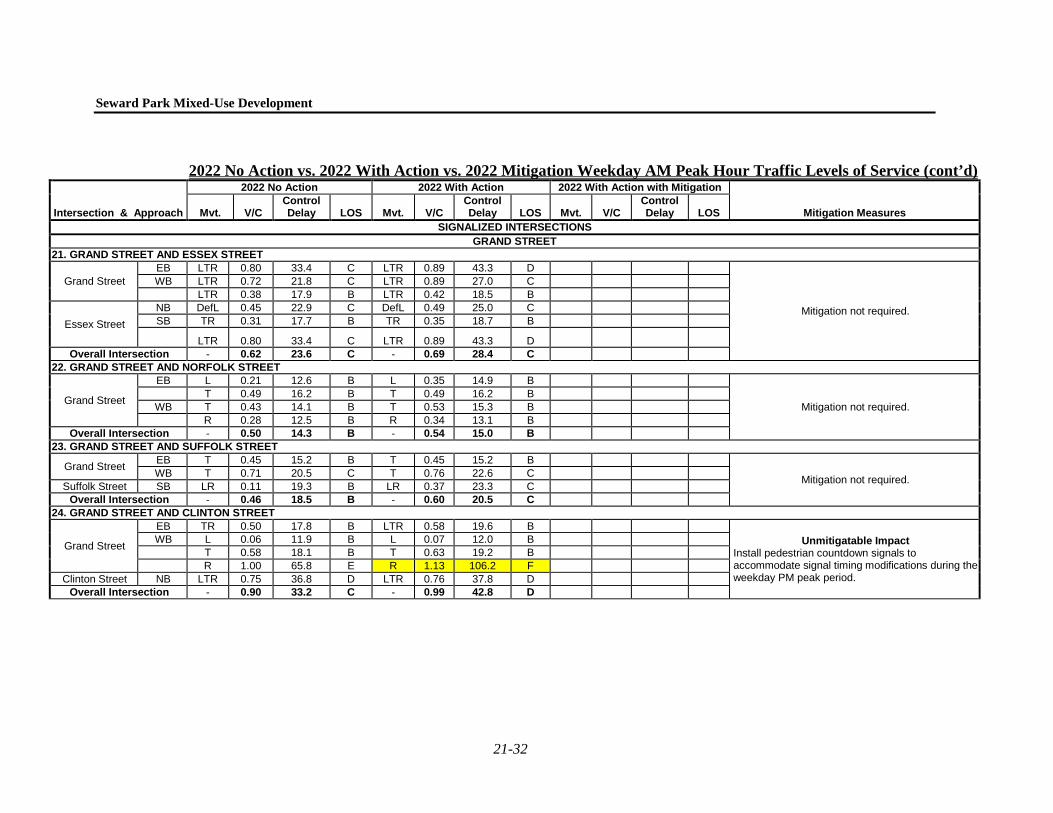
Seward Park Mixed-Use Development
21-32
2022 No Action vs. 2022 With Action vs. 2022 Mitigation Weekday AM Peak Hour Traffic Levels of Service (cont’d)
Intersection & Approach
2022 No Action 2022 With Action 2022 With Action with Mitigation
Mitigation Measures Mvt. V/C Control Delay LOS Mvt. V/C
Control Delay LOS Mvt. V/C
Control Delay LOS
SIGNALIZED INTERSECTIONS GRAND STREET
21. GRAND STREET AND ESSEX STREET
Grand Street EB LTR 0.80 33.4 C LTR 0.89 43.3 D
Mitigation not required.
WB LTR 0.72 21.8 C LTR 0.89 27.0 C
LTR 0.38 17.9 B LTR 0.42 18.5 B
Essex Street
NB DefL 0.45 22.9 C DefL 0.49 25.0 C SB TR 0.31 17.7 B TR 0.35 18.7 B
LTR 0.80 33.4 C LTR 0.89 43.3 D
Overall Intersection - 0.62 23.6 C - 0.69 28.4 C 22. GRAND STREET AND NORFOLK STREET
Grand Street
EB L 0.21 12.6 B L 0.35 14.9 B
Mitigation not required. T 0.49 16.2 B T 0.49 16.2 B
WB T 0.43 14.1 B T 0.53 15.3 B
R 0.28 12.5 B R 0.34 13.1 B
Overall Intersection - 0.50 14.3 B - 0.54 15.0 B 23. GRAND STREET AND SUFFOLK STREET
Grand Street EB T 0.45 15.2 B T 0.45 15.2 B
Mitigation not required. WB T 0.71 20.5 C T 0.76 22.6 C Suffolk Street SB LR 0.11 19.3 B LR 0.37 23.3 C Overall Intersection - 0.46 18.5 B - 0.60 20.5 C 24. GRAND STREET AND CLINTON STREET
Grand Street
EB TR 0.50 17.8 B LTR 0.58 19.6 B Unmitigatable Impact
Install pedestrian countdown signals to accommodate signal timing modifications during the weekday PM peak period.
WB L 0.06 11.9 B L 0.07 12.0 B
T 0.58 18.1 B T 0.63 19.2 B
R 1.00 65.8 E R 1.13 106.2 F Clinton Street NB LTR 0.75 36.8 D LTR 0.76 37.8 D Overall Intersection - 0.90 33.2 C - 0.99 42.8 D

Chapter 21: Mitigation Measures
21-33
2022 No Action vs. 2022 With Action vs. 2022 Mitigation Weekday AM Peak Hour Traffic Levels of Service(cont’d)
Intersection & Approach
2022 No Action 2022 With Action 2022 With Action with Mitigation
Mitigation Measures Mvt. V/C Control Delay LOS Mvt. V/C
Control Delay LOS Mvt. V/C
Control Delay LOS
SIGNALIZED INTERSECTIONS GRAND STREET
25. GRAND STREET AND EAST BROADWAY
Grand Street EB T 0.16 7.1 A T 0.17 7.2 A
Mitigation not required. WB LT 0.76 15.5 B LT 0.81 17.8 B East Broadway NB R - 10.2 B R - 10.3 B Overall Intersection - 0.76 13.6 B - 0.82 15.4 B UNSIGNALIZED INTERSECTIONS
26. STANTON STREET AND LUDLOW STREET Stanton Street EB TR - 8.0 A TR - 8.0 A
Mitigation not required. Ludlow Street SB LT - 9.2 A LT - 9.2 A Overall Intersection - - 8.9 A - - 9.0 A 27. RIVINGTON STREET AND LUDLOW STREET
Rivington Street WB LT - 12.3 B LT - 12.4 B Mitigation not required. Ludlow Street SB TR - 10.0 A TR - 10.1 B Overall Intersection - - 11.5 B - - 11.6 B 28. BROOME STREET AND LUDLOW STREET
Broome Street EB TR - 10.5 B TR - 10.7 B Mitigation not required. Ludlow Street SB LT - 7.5 A LT - 7.5 A Overall Intersection - - 5.9 A - - 6.0 A 29. BROOME STREET AND SUFFOLK STREET
Broome Street WB LT - 7.6 A LT - 7.6 A Mitigation not required. Suffolk Street SB TR - 10.6 B TR - 14.2 B Overall Intersection - - 6.1 A - - 10.6 B 30. BROOME STREET AND CLINTON STREET
Broome Street NB LTR - 7.9 A LTR - 7.9 A Mitigation not required. Overall Intersection - - 1.2 A - - 1.3 A Notes:
(1) Control delay is measured in seconds per vehicle. (2) Overall intersection V/C ratio is the critical lane groups' V/C ratio.
Denotes a significant impact.

Seward Park Mixed-Use Development
21-34
2022 No Action vs. 2022 With Action vs. 2022 Mitigation Weekday Midday Peak Hour Traffic Levels of Service
Intersection & Approach
2022 No Action 2022 With Action 2022 With Action with Mitigation
Mitigation Measures Mvt. V/C Control Delay LOS Mvt. V/C
Control Delay LOS Mvt. V/C
Control Delay LOS
SIGNALIZED INTERSECTIONS EAST HOUSTON STREET
1. EAST HOUSTON STREET AND BOWERY
East Houston Street
EB L 0.43 32.5 C L 0.43 32.7 C
Mitigation not required.
TR 0.77 31.2 C TR 0.80 32.1 C
WB L 0.79 42.1 D L 0.80 43.5 D
TR 0.89 34.6 C TR 0.92 36.7 D
Bowery
NB L 0.50 29.2 C L 0.50 29.2 C
TR 0.74 35.0 C TR 0.75 35.3 D
SB L 0.41 25.4 C L 0.41 25.6 C
TR 0.82 38.0 D TR 0.82 38.0 D
Overall Intersection - 0.90 34.2 C - 0.90 35.2 D 2. EAST HOUSTON STREET AND CHRYSTIE STREET / SECOND AVENUE
East Houston Street
EB T 0.77 33.9 C T 0.79 34.7 C
Mitigation not required.
R 0.70 39.9 D R 0.74 41.8 D
WB L 0.58 45.4 D L 0.63 50.4 D
T 0.66 30.5 C T 0.69 31.2 C
Chrystie Street / Second Avenue
NB L 0.55 35.1 D L 0.56 35.3 D
LR 0.60 38.2 D LR 0.60 38.2 D
SB L 0.84 36.6 D L 0.85 36.7 D
LT 0.86 35.3 D LT 0.90 36.4 D
R 1.14 100.0 F R 1.14 100.0 F Overall Intersection - 0.82 42.2 D - 0.83 42.7 D 3. EAST HOUSTON STREET AND ALLEN STREET / FIRST AVENUE
East Houston Street
EB L 0.81 33.5 C L 0.83 34.8 C
Mitigation not required.
T 0.88 30.9 C T 0.91 31.7 C
R 1.29 165.2 F R 1.29 165.2 F WB L 0.27 26.2 C L 0.27 26.9 C
TR 0.87 38.9 D TR 0.91 43.3 D
Allen Street
NB L 0.46 29.4 C L 0.48 29.9 C
T 0.77 34.9 C T 0.78 35.5 D
R 0.29 28.0 C R 0.29 28.0 C Overall Intersection - 0.97 47.0 D - 0.99 48.3 D

Chapter 21: Mitigation Measures
21-35
2022 No Action vs. 2022 With Action vs. 2022 Mitigation Weekday Midday Peak Hour Traffic Levels of Service (cont’d)
Intersection & Approach
2022 No Action 2022 With Action 2022 With Action with Mitigation
Mitigation Measures Mvt. V/C Control Delay LOS Mvt. V/C
Control Delay LOS Mvt. V/C
Control Delay LOS
SIGNALIZED INTERSECTIONS EAST HOUSTON STREET
4. EAST HOUSTON STREET AND ESSEX STREET / AVENUE A
East Houston Street
EB L 0.42 14.3 B L 0.45 14.8 B L 0.47 15.6 B Modify signal timing: Shift 1 s of green time from EB / WB phase to the NB / SB phase [EB / WB green time shifts from 32 s to 31 s; NB / SB green time shifts from 27 s to 28 s; signal timing during all other phases remain the same].
TR 0.80 27.8 C TR 0.83 28.7 C TR 0.86 30.2 C
WB L 0.74 31.0 C L 0.76 32.6 C L 0.78 35.6 D
T 0.62 26.2 C T 0.65 27.0 C T 0.67 28.2 C
R 0.10 19.8 B R 0.11 19.9 B R 0.11 20.6 C
Essex Street / Avenue A
NB LTR 0.77 35.3 D LTR 0.81 37.2 D LTR 0.77 34.4 C SB LTR 1.06 68.3 E LTR 1.15 101.6 F LTR 1.07 71.5 E
Overall Intersection - 0.85 33.6 C - 0.91 39.4 D - 0.90 35.8 D STANTON STREET
5. STANTON STREET AND ESSEX STREET Stanton Street EB LTR 0.48 27.7 C LTR 0.50 28.3 C
Mitigation not required. Essex Street NB TR 0.25 11.2 B TR 0.27 11.4 B
SB LT 0.36 12.0 B LT 0.39 12.4 B Overall Intersection - 0.40 14.5 B - 0.43 14.7 B 6. STANTON STREET AND NORFOLK STREET
Stanton Street EB LT 0.19 15.9 B LT 0.21 16.1 B Mitigation not required. Norfolk Street NB TR 0.51 20.6 C TR 0.63 23.8 C Overall Intersection - 0.35 19.3 B - 0.42 21.8 C RIVINGTON STREET
7. RIVINGTON STREET AND ESSEX STREET Rivington Street WB LTR 0.64 32.4 C LTR 0.80 41.9 D
Mitigation not required. Essex Street NB LT 0.28 11.3 B LT 0.30 11.4 B
SB TR 0.42 13.1 B TR 0.45 13.5 B Overall Intersection - 0.50 16.7 B - 0.58 19.5 B 8. RIVINGTON STREET AND NORFOLK STREET
Rivington Street WB TR 0.20 16.2 B TR 0.22 16.5 B Mitigation not required. Norfolk Street NB LT 0.63 20.9 C LT 0.82 26.5 C Overall Intersection - 0.41 20.0 B - 0.52 24.6 C

Seward Park Mixed-Use Development
21-36
2022 No Action vs. 2022 With Action vs. 2022 Mitigation Weekday Midday Peak Hour Traffic Levels of Service (cont’d)
Intersection & Approach
2022 No Action 2022 With Action 2022 With Action with Mitigation
Mitigation Measures Mvt. V/C Control Delay LOS Mvt. V/C
Control Delay LOS Mvt. V/C
Control Delay LOS
SIGNALIZED INTERSECTIONS DELANCEY STREET
9. DELANCEY STREET AND ALLEN STREET
Delancey Street
EB TR 0.82 27.9 C TR 0.86 29.3 C TR 0.86 29.3 C Modify signal phasing: Allow the NB-right turn movement during the WB-lead phase. Signal timing remains the same during all peak hours.
WB L 0.75 41.9 D L 0.77 43.1 D L 0.77 43.1 D
TR 0.79 14.9 B TR 0.80 15.2 B TR 0.80 15.2 B
Allen Street NB T 0.67 34.7 C T 0.71 35.7 D TR 0.71 35.7 D
R 0.79 50.6 D R 0.87 61.4 E R 0.37 15.5 B
SB TR 0.71 33.8 C TR 0.71 33.9 C TR 0.71 33.9 C Overall Intersection - 0.79 25.4 C - 0.84 26.6 C - 0.79 24.9 C
10. DELANCEY STREET AND ORCHARD STREET
Delancey Street EB T 0.57 11.4 B T 0.59 11.7 B
Mitigation not required. WB TR 0.72 13.6 B TR 0.72 13.8 B
Orchard Street NB LTR 0.34 27.9 C LTR 0.34 27.9 C Overall Intersection - 0.59 13.1 B - 0.60 13.3 B 11. DELANCEY STREET AND LUDLOW STREET
Delancey Street EB TR 0.58 11.7 B TR 0.61 12.1 B TR 0.63 13.5 B Modify signal timing: Shift 2 s of green time
from EB / WB phase to the SB phase [EB / WB green time shifts from 54 s to 52 s; SB green time shifts from 26 s to 28 s].
WB T 0.73 13.2 B T 0.74 13.4 B T 0.77 14.9 B Ludlow Street SB LTR 1.00 84.2 F LTR 1.10 114.2 F LTR 1.01 85.5 F
Overall Intersection - 0.82 17.7 B - 0.86 20.0 B - 0.85 19.4 B 12. DELANCEY STREET AND ESSEX STREET
Delancey Street EB TR 0.68 16.5 B TR 0.71 17.0 B
Unmitigatable Impact
WB TR 0.96 23.6 C TR 0.97 24.4 C
Essex Street NB LTR 0.77 41.8 D LTR 0.97 68.0 E
SB DefL 1.10 116.6 F DefL 1.46 260.7 F
TR 0.76 44.4 D TR 0.90 60.2 E
Overall Intersection - 1.02 27.6 C - 1.17 39.0 D 13. DELANCEY STREET AND NORFOLK STREET
Delancey Street EB T 0.72 14.2 B T 0.76 15.0 B T 0.82 18.8 B Install "No Standing 11 AM - 2 PM Mon - Fri"
regulation along the north curb of the WB approach for 100-feet from the intersection to provide daylighting. Modify signal timing: Shift 4 s of green time from EB / WB phase to the NB phase [EB / WB greentime shifts from 53 s to 49 s; NB green time shifts from 27 s to 31 s].
WB TR 0.98 27.9 C TR 1.01 33.5 C TR 1.02 38.8 D
Norfolk Street
NB
TR 0.77 40.3 D TR 1.00 71.9 E TR 0.87 44.4 D
R 0.82 44.7 D R 1.01 76.6 E R 0.88 46.8 D Overall Intersection - 0.93 24.2 C - 1.01 31.9 C - 0.96 31.9 C

Chapter 21: Mitigation Measures
21-37
2022 No Action vs. 2022 With Action vs. 2022 Mitigation Weekday Midday Peak Hour Traffic Levels of Service (cont’d)
Intersection & Approach
2022 No Action 2022 With Action 2022 With Action with Mitigation
Mitigation Measures Mvt. V/C Control Delay LOS Mvt. V/C
Control Delay LOS Mvt. V/C
Control Delay LOS
SIGNALIZED INTERSECTIONS DELANCEY STREET
14. DELANCEY STREET AND SUFFOLK STREET
Delancey Street EB T 0.81 16.1 B T 0.83 16.4 B
Mitigation not required.
WB T 0.78 14.8 B T 0.79 15.0 B Delancey Street
Service Road EB TR 0.14 8.5 A TR 0.45 11.5 B Suffolk Street SB R 0.06 22.8 C R 0.08 23.2 C Overall Intersection - 0.56 15.3 B - 0.58 15.5 B 15. DELANCEY STREET AND CLINTON STREET
Delancey Street EB T 0.74 11.6 B T 0.75 11.8 B
Mitigation not required.
Williamsburg Bridge WB T 0.89 18.3 B T 0.90 19.0 B
R 0.89 40.8 D R 0.91 43.3 D Delancey Street
Service Road EB TR 0.12 6.4 A TR 0.16 6.7 A
WB TR 0.69 59.2 E TR 0.73 62.8 E
Clinton Street NB R 0.09 26.8 C R 0.09 26.8 C Overall Intersection - 0.67 17.8 B - 0.68 18.4 B BROOME STREET
16. BROOME STREET AND ESSEX STREET Broome Street EB LTR 0.13 20.9 C LTR 0.19 21.8 C LTR 0.19 21.8 C Mitigation not required.
Modify signal phasing: Add a new lead phase for the SB approach. The existing signal phasing [EB phase has 31 s of green time; NB / SB phase has 49 s of green time] would be modified to the following: EB phase will have 31 s of green time, SB-lead phase will have 11 s of green time, and NB / SB phase will have 33 s of green [each phase will have 3 s amber and 2 s all red].[Measures reflect signal phasing improvements needed to mitigate the intersection during the weekday PM peak period.]
Essex Street NB TR 0.28 11.4 B TR 0.32 11.9 B TR 0.48 23.6 C SB L 0.10 10.2 B L 0.28 12.7 B L 0.23 11.5 B
T 0.25 11.3 B T 0.25 11.3 B T 0.25 11.3 B
Overall Intersection - 0.22 12.1 B - 0.27 12.7 B - 0.37 19.1 B

Seward Park Mixed-Use Development
21-38
2022 No Action vs. 2022 With Action vs. 2022 Mitigation Weekday Midday Peak Hour Traffic Levels of Service (cont’d)
Intersection & Approach
2022 No Action 2022 With Action 2022 With Action with Mitigation
Mitigation Measures Mvt. V/C Control Delay LOS Mvt. V/C
Control Delay LOS Mvt. V/C
Control Delay LOS
SIGNALIZED INTERSECTIONS BROOME STREET
17. BROOME STREET AND NORFOLK STREET
Broome Street EB L 0.09 10.0 B L 0.15 10.6 B
Mitigation not required. WB R 0.32 12.5 B R 0.36 13.0 B Norfolk Street NB T 0.71 28.8 C T 0.91 39.0 D Overall Intersection - 0.47 21.2 C - 0.57 27.1 C GRAND STREET
18. GRAND STREET AND ALLEN STREET
Grand Street EB LTR 1.14 97.5 F LTR 1.31 172.7 F LTR 1.12 87.8 F Option 1 Install "No Standing 11 AM - 2 PM Mon - Fri" regulation along the north curb of the WB approach for 85-feet from the intersection to provide daylighting. Modify signal timing: Shift 3 s of green time from NB / SB phase to the EB / WB phase; shift 1 s from the NB / SB phase to SB-lead phase [EB / WB green time shifts from 27 s to 30 s; SB-lead phase green time shifts from 10 s to 11 s, NB / SB green time shifts from 23 s to 19 s, NB-lead phase green time remains the same].
WB LTR 0.90 57.9 E LTR 1.09 106.2 F LTR 0.75 36.1 D
Allen Street
NB L 0.39 44.2 D L 0.39 44.2 D L 0.39 44.2 D
TR 0.45 19.9 B TR 0.46 20.1 C TR 0.52 23.7 C
SB L 1.07 111.1 F L 1.11 125.3 F L 1.01 91.8 F
TR 0.74 24.9 C TR 0.75 24.9 C TR 0.82 29.4 C
Overall Intersection
- 0.84 47.8 D - 0.90 70.7 E - 0.88 44.5 D
LTR 1.02 49.1 D Option 2
Modify signal phasing: The existing signal phasing [EB / WB phase has 27 s of green; SB-lead phase has 10 s of green; NBTR / SBTR phase has 23 s of green; NB-lag phase has 10 s of green] would be modified to the following: EB / WB phase will have 32 s of green time; NBL / SBL phase will have 11 s of green time; NBTR / SBTR phase will have 32 s of green time [each phase will have 3 s amber and 2 s all red]. Pedestrians are not allowed to cross during the NBL / SBL phase.
LTR 0.91 53.5 D
L 0.35 41.8 D
TR 0.55 25.7 C
L 1.01 91.8 F
TR 0.90 37.0 D
- 0.97 44.3 D

Chapter 21: Mitigation Measures
21-39
2022 No Action vs. 2022 With Action vs. 2022 Mitigation Weekday Midday Peak Hour Traffic Levels of Service (cont’d)
Intersection & Approach
2022 No Action 2022 With Action 2022 With Action with Mitigation
Mitigation Measures Mvt. V/C Control Delay LOS Mvt. V/C
Control Delay LOS Mvt. V/C
Control Delay LOS
SIGNALIZED INTERSECTIONS GRAND STREET
19. GRAND STREET AND ORCHARD STREET
Grand Street EB LT 0.71 21.7 C LT 0.85 25.5 C
Mitigation not required. WB TR 0.55 21.8 C TR 0.65 25.0 C
Orchard Street NB LTR 0.15 15.4 B LTR 0.15 15.4 B Overall Intersection - 0.43 21.0 C - 0.50 24.3 C 20. GRAND STREET AND LUDLOW STREET
Grand Street EB TR 0.66 24.5 C TR 0.76 28.4 C
Mitigation not required. WB LT 0.37 17.8 B LT 0.48 19.6 B
Ludlow Street SB LTR 0.27 17.2 B LTR 0.29 17.5 B Overall Intersection - 0.46 20.8 C - 0.52 23.3 C 21. GRAND STREET AND ESSEX STREET
Grand Street EB LTR 0.65 25.0 C LTR 0.78 30.8 C LTR 0.77 30.5 C Mitigation not required.
Install "No Standing Anytime" regulation along the north curb of the WB approach for 100-feet from the intersection to allow for two moving lanes. Restripe the WB approach from one 11-foot travel lane, one 5-foot bike lane, and one 10-foot parking lane to one 11-foot left-through lane, one 5-foot bike lane, and one 10-foot right turn lane.[Measures reflect geometric improvements needed to mitigate the intersection during the weekday PM peak period.]
WB LTR 0.64 20.5 C LTR 0.90 28.8 C LT 0.46 17.9 B
- - - - - - - - R 0.44 18.1 B
Essex Street NB LTR 0.30 16.9 B LTR 0.33 17.2 B LTR 0.33 17.2 B SB LTR 0.33 17.6 B LTR 0.37 18.4 B LTR 0.37 18.4 B
Overall Intersection - 0.49 20.2 C - 0.64 24.9 C - 0.57 21.3 C 22. GRAND STREET AND NORFOLK STREET
Grand Street
EB L 0.23 13.5 B L 0.53 23.0 C L 0.29 13.8 B Install "No Standing Anytime" regulation along the north curb of the WB approach for 100-feet from the intersection to allow for two moving lanes. Restripe the WB approach from one 11-foot travel lane, one 5-foot bike lane, and one 10-foot parking lane to one 11-foot left-through lane, one 5-foot bike lane, and one 10-foot right turn lane.
T 0.43 15.2 B T 0.44 15.3 B T 0.44 15.3 B
WB TR 0.97 39.3 D TR 1.22 128.2 F T 0.51 15.2 B
- - - - - - - - R 0.67 19.1 B
Overall Intersection - 0.98 31.0 C - 1.23 92.9 F - 0.67 16.4 B

Seward Park Mixed-Use Development
21-40
2022 No Action vs. 2022 With Action vs. 2022 Mitigation Weekday Midday Peak Hour Traffic Levels of Service (cont’d)
Intersection & Approach
2022 No Action 2022 With Action 2022 With Action with Mitigation
Mitigation Measures Mvt. V/C Control Delay LOS Mvt. V/C
Control Delay LOS Mvt. V/C
Control Delay LOS
SIGNALIZED INTERSECTIONS GRAND STREET
23. GRAND STREET AND SUFFOLK STREET
Grand Street EB T 0.38 14.3 B T 0.38 14.4 B
Mitigation not required. WB T 0.85 27.6 C T 0.95 38.4 D Suffolk Street SB LR 0.06 18.7 B LR 0.39 23.6 C Overall Intersection - 0.53 23.6 C - 0.72 30.5 C 24. GRAND STREET AND CLINTON STREET
Grand Street
EB LTR 0.55 19.6 B LTR 0.68 24.3 C
Mitigation not required.
WB L 0.06 11.8 B L 0.07 12.0 B
T 0.72 21.8 C T 0.79 24.8 C
R 0.47 17.8 B R 0.55 20.3 C
Clinton Street NB LTR 0.46 24.2 C LTR 0.53 26.3 C SB LTR 0.03 17.1 B LTR 0.06 17.4 B Overall Intersection - 0.60 20.8 C - 0.68 23.9 C 25. GRAND STREET AND EAST BROADWAY
Grand Street EB T 0.13 6.9 A T 0.14 6.9 A
Mitigation not required. WB LT 0.82 17.2 B LT 0.90 21.9 C East Broadway NB R 0.00 6.1 A R 0.00 6.1 A Overall Intersection - 0.82 15.7 B - 0.90 19.7 B UNSIGNALIZED INTERSECTIONS
26. STANTON STREET AND LUDLOW STREET Stanton Street EB TR - 9.0 A TR - 9.0 A
Mitigation not required. Ludlow Street SB LT - 10.8 B LT - 10.9 B Overall Intersection - - 10.3 B - - 10.3 B 27. RIVINGTON STREET AND LUDLOW STREET
Rivington Street WB LT - 9.7 A LT - 9.7 A Mitigation not required. Ludlow Street SB TR - 10.2 B TR - 10.3 B Overall Intersection - - 10.0 A - - 10.1 B 28. BROOME STREET AND LUDLOW STREET
Broome Street EB TR - 14.0 B TR - 14.5 B Mitigation not required. Ludlow Street SB LT - 7.4 A LT - 7.5 A Overall Intersection - - 1.3 A - - 4.6 A

Chapter 21: Mitigation Measures
21-41
2022 No Action vs. 2022 With Action vs. 2022 Mitigation Weekday Midday Peak Hour Traffic Levels of Service (cont’d)
Intersection & Approach
2022 No Action 2022 With Action 2022 With Action with Mitigation
Mitigation Measures Mvt. V/C Control Delay LOS Mvt. V/C
Control Delay LOS Mvt. V/C
Control Delay LOS
UNSIGNALIZED INTERSECTIONS 29. BROOME STREET AND SUFFOLK STREET
Broome Street WB LT - 7.3 A LT - 7.3 A Mitigation not required. Suffolk Street SB TR - 10.2 B TR - 12.2 B Overall Intersection - - 1.3 A - - 5.5 A 30. BROOME STREET AND CLINTON STREET
Broome Street NB LTR - 8.7 A LTR - 8.8 A Mitigation not required. SB LTR - 9.3 A LTR - 9.3 A Overall Intersection - - 6.4 A - - 5.9 A Notes:
(1) Control delay is measured in seconds per vehicle. (2) Overall intersection V/C ratio is the critical lane groups' V/C ratio. Denotes a significant impact.

Seward Park Mixed-Use Development
21-42
2022 No Action vs. 2022 With Action vs. 2022 Mitigation Weekday Midday Peak Hour Traffic Levels of Service1
Intersection & Approach
2022 No Action 2022 With Action 2022 With Action with Mitigation
Mitigation Measures Mvt. V/C Control Delay LOS Mvt. V/C
Control Delay LOS Mvt. V/C
Control Delay LOS
SIGNALIZED INTERSECTIONS EAST HOUSTON STREET
1. EAST HOUSTON STREET AND BOWERY
East Houston Street
EB L 0.43 32.5 C L 0.43 32.7 C
Mitigation not required.
TR 0.78 31.6 C TR 0.81 32.4 C
WB L 0.82 44.2 D L 0.83 46.1 D
TR 0.90 35.2 D TR 0.93 37.6 D
Bowery
NB L 0.53 30.1 C L 0.53 30.1 C
TR 0.76 35.6 D TR 0.76 35.8 D
SB L 0.41 25.7 C L 0.41 25.8 C
TR 0.82 38.2 D TR 0.82 38.2 D
Overall Intersection - 0.91 34.7 C - 0.91 35.8 D 2. EAST HOUSTON STREET AND CHRYSTIE STREET / SECOND AVENUE
East Houston Street
EB T 0.77 34.0 C T 0.79 34.8 C T 0.76 33.0 C Modify signal timing: Shift 1 s of green time from NB phase to the EB / WB phase [EB / WB green time shifts from 26 s to 27 s; NB phase green time shifts from 21 s to 20 s; SB phase green time remains the same].
R 0.75 42.7 D R 0.80 46.2 D R 0.76 42.3 D
WB L 0.68 53.7 D L 0.73 61.2 E L 0.68 52.4 D
T 0.66 30.5 C T 0.69 31.2 C T 0.66 29.9 C
Chrystie Street / Second Avenue
NB L 0.60 36.5 D L 0.61 36.8 D L 0.64 38.9 D
LR 0.57 37.2 D LR 0.57 37.2 D LR 0.60 39.3 D
SB L 0.84 36.6 D L 0.85 36.7 D L 0.85 36.7 D
LT 0.86 35.4 D LT 0.90 36.5 D LT 0.90 36.5 D
R 1.14 100.0 F R 1.14 100.0 F R 1.14 100.0 F
Overall Intersection - 0.82 42.6 D - 0.83 43.3 D - 0.83 42.4 D 3. EAST HOUSTON STREET AND ALLEN STREET / FIRST AVENUE
East Houston Street
EB L 0.69 28.7 C L 0.69 29.4 C L 0.71 29.9 C Modify signal timing: Shift 1 s of green time from EBL/WBL lag phase to the EB/WB phase [EB/WB green time shifts from 27 s to 28 s; EBL/WBL green time shifts from 15 s to 14 s; signal timing during all other phases remain the same].
T 0.96 36.3 D T 0.98 39.6 D T 0.95 34.7 C
R 1.41 220.9 F R 1.41 220.9 F R 1.35 191.7 F
WB L 0.22 23.8 C L 0.22 24.1 C L 0.23 24.4 C
TR 0.95 50.8 D TR 1.00 60.9 E TR 0.96 51.4 D
Allen Street NB L 0.51 32.8 C L 0.54 33.4 C L 0.54 33.4 D
T 0.87 43.3 D T 0.89 44.7 D T 0.89 44.7 D
R 0.33 31.4 C R 0.33 31.4 C R 0.33 31.4 C
Overall Intersection - 1.07 58.3 E - 1.08 61.7 E - 1.08 55.2 E
1 This table has been revised for the FGEIS.

Chapter 21: Mitigation Measures
21-43
2022 No Action vs. 2022 With Action vs. 2022 Mitigation Weekday Midday Peak Hour Traffic Levels of Service (cont’d)
Intersection & Approach
2022 No Action 2022 With Action 2022 With Action with Mitigation
Mitigation Measures Mvt. V/C Control Delay LOS Mvt. V/C
Control Delay LOS Mvt. V/C
Control Delay LOS
SIGNALIZED INTERSECTIONS EAST HOUSTON STREET
4. EAST HOUSTON STREET AND ESSEX STREET / AVENUE A
East Houston Street
EB L 0.43 14.5 B L 0.47 15.0 B L 0.50 16.5 B Modify signal timing: Shift 2 s of green time from EB / WB phase to the NB / SB phase [EB / WB green time shifts from 32 s to 30 s; NB / SB green time shifts from 27 s to 29 s; signal timing during all other phases remain the same].
TR 0.80 28.0 C TR 0.84 28.9 C TR 0.90 32.5 C
WB L 0.74 31.3 C L 0.76 33.3 C L 0.81 39.6 D
T 0.62 26.4 C T 0.66 27.2 C T 0.70 29.8 C
R 0.10 19.8 B R 0.11 19.9 B R 0.12 21.4 C
Essex Street / Avenue A
NB LTR 0.77 35.3 D LTR 0.81 37.6 D LTR 0.74 32.4 C SB LTR 1.08 74.6 E LTR 1.16 109.2 F LTR 1.03 53.5 D
Overall Intersection - 0.94 34.6 C - 0.99 40.6 D - 0.97 34.3 C STANTON STREET
5. STANTON STREET AND ESSEX STREET Stanton Street EB LTR 0.48 27.8 C LTR 0.51 28.7 C
Mitigation not required. Essex Street NB TR 0.25 11.2 B TR 0.27 11.4 B
SB LT 0.36 12.0 B LT 0.39 12.4 B Overall Intersection - 0.41 14.5 B - 0.43 14.8 B 6. STANTON STREET AND NORFOLK STREET
Stanton Street EB LT 0.19 15.9 B LT 0.22 16.2 B Mitigation not required. Norfolk Street NB TR 0.52 20.8 C TR 0.64 23.9 C Overall Intersection - 0.36 19.4 B - 0.43 21.9 C
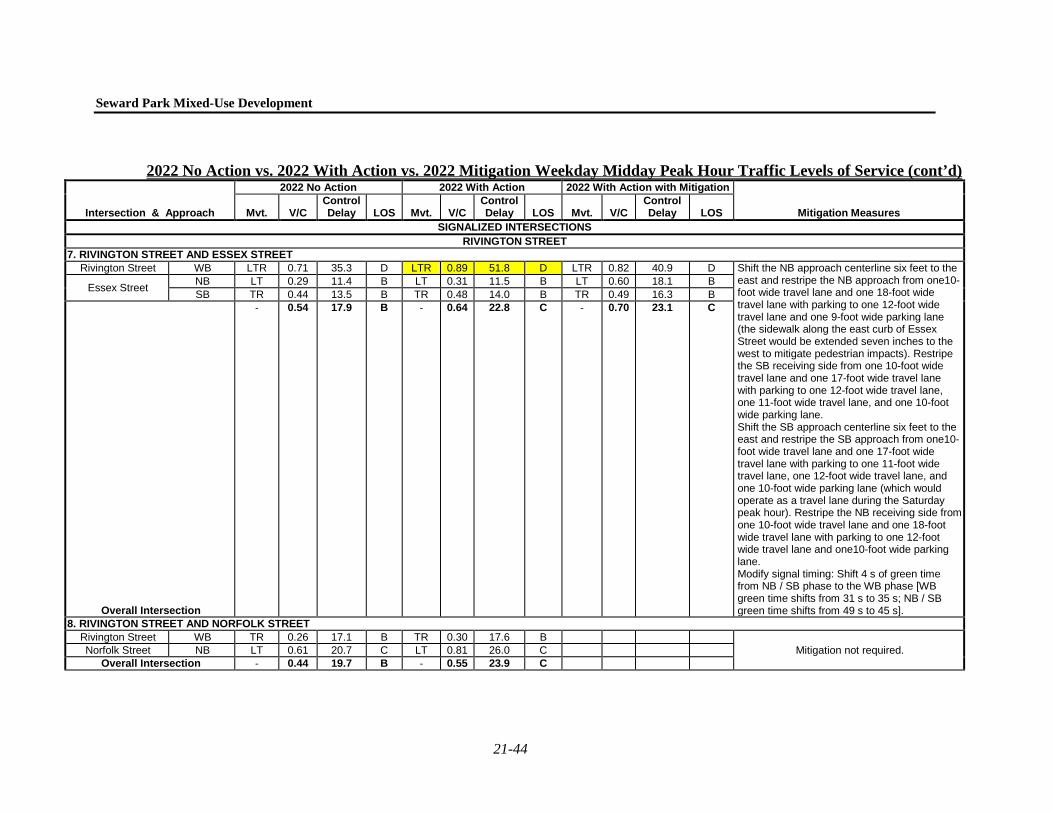
Seward Park Mixed-Use Development
21-44
2022 No Action vs. 2022 With Action vs. 2022 Mitigation Weekday Midday Peak Hour Traffic Levels of Service (cont’d)
Intersection & Approach
2022 No Action 2022 With Action 2022 With Action with Mitigation
Mitigation Measures Mvt. V/C Control Delay LOS Mvt. V/C
Control Delay LOS Mvt. V/C
Control Delay LOS
SIGNALIZED INTERSECTIONS RIVINGTON STREET
7. RIVINGTON STREET AND ESSEX STREET Rivington Street WB LTR 0.71 35.3 D LTR 0.89 51.8 D LTR 0.82 40.9 D Shift the NB approach centerline six feet to the
east and restripe the NB approach from one10-foot wide travel lane and one 18-foot wide travel lane with parking to one 12-foot wide travel lane and one 9-foot wide parking lane (the sidewalk along the east curb of Essex Street would be extended seven inches to the west to mitigate pedestrian impacts). Restripe the SB receiving side from one 10-foot wide travel lane and one 17-foot wide travel lane with parking to one 12-foot wide travel lane, one 11-foot wide travel lane, and one 10-foot wide parking lane. Shift the SB approach centerline six feet to the east and restripe the SB approach from one10-foot wide travel lane and one 17-foot wide travel lane with parking to one 11-foot wide travel lane, one 12-foot wide travel lane, and one 10-foot wide parking lane (which would operate as a travel lane during the Saturday peak hour). Restripe the NB receiving side from one 10-foot wide travel lane and one 18-foot wide travel lane with parking to one 12-foot wide travel lane and one10-foot wide parking lane. Modify signal timing: Shift 4 s of green time from NB / SB phase to the WB phase [WB green time shifts from 31 s to 35 s; NB / SB green time shifts from 49 s to 45 s].
Essex Street NB LT 0.29 11.4 B LT 0.31 11.5 B LT 0.60 18.1 B SB TR 0.44 13.5 B TR 0.48 14.0 B TR 0.49 16.3 B
Overall Intersection
- 0.54 17.9 B - 0.64 22.8 C - 0.70 23.1 C
8. RIVINGTON STREET AND NORFOLK STREET Rivington Street WB TR 0.26 17.1 B TR 0.30 17.6 B
Mitigation not required. Norfolk Street NB LT 0.61 20.7 C LT 0.81 26.0 C Overall Intersection - 0.44 19.7 B - 0.55 23.9 C

Chapter 21: Mitigation Measures
21-45
2022 No Action vs. 2022 With Action vs. 2022 Mitigation Weekday Midday Peak Hour Traffic Levels of Service (cont’d)
Intersection & Approach
2022 No Action 2022 With Action 2022 With Action with Mitigation
Mitigation Measures Mvt. V/C Control Delay LOS Mvt. V/C
Control Delay LOS Mvt. V/C
Control Delay LOS
SIGNALIZED INTERSECTIONS DELANCEY STREET
9. DELANCEY STREET AND ALLEN STREET
Delancey Street
EB TR 0.77 26.4 C TR 0.80 27.4 C
Mitigation not required.
WB L 0.71 39.7 D L 0.73 40.5 D
TR 0.85 17.0 B TR 0.86 17.5 B
Allen Street
NB T 0.65 33.1 C T 0.68 34.0 C
R 0.36 15.8 B R 0.38 16.2 B
SB TR 0.68 32.5 C TR 0.69 32.6 C Overall Intersection - 0.80 24.0 C - 0.81 24.7 C 10. DELANCEY STREET AND ORCHARD STREET
Delancey Street EB T 0.62 14.2 B T 0.64 14.6 B
Mitigation not required. WB TR 0.72 15.9 B TR 0.73 16.1 B
Orchard Street NB LTR 0.30 24.0 C LTR 0.30 24.0 C Overall Intersection - 0.56 15.4 B - 0.57 15.6 B 11. DELANCEY STREET AND LUDLOW STREET
Delancey Street EB TR 0.63 14.6 B TR 0.66 15.1 B
Unmitigatable Impact WB T 1.02 36.8 D T 1.04 40.5 D Ludlow Street SB LTR 1.01 79.7 E LTR 1.14 124.2 F Overall Intersection - 1.02 31.4 C - 1.08 37.0 D 12. DELANCEY STREET AND ESSEX STREET
Delancey Street EB TR 0.67 15.2 B TR 0.70 15.7 B
Unmitigatable Impact
WB T 1.03 37.7 D T 1.03 38.8 D
Essex Street
R 0.70 18.2 B R 0.80 22.9 C NB LT 0.54 36.1 D LT 0.65 40.6 D
R 0.91 74.3 E R 1.40 249.0 F
SB TR 0.76 38.8 D TR 0.90 49.2 D Overall Intersection - 0.99 30.5 C - 1.15 39.3 D 13. DELANCEY STREET AND NORFOLK STREET
Delancey Street EB T 0.69 15.4 B T 0.72 15.9 B
Unmitigatable Impact
WB TR 1.00 32.8 C TR 1.02 39.2 D
Norfolk Street NB TR 0.64 31.5 C TR 0.88 46.8 D
R 0.67 33.0 C R 0.88 48.8 D Overall Intersection - 0.88 26.2 C - 0.97 31.9 C

Seward Park Mixed-Use Development
21-46
2022 No Action vs. 2022 With Action vs. 2022 Mitigation Weekday Midday Peak Hour Traffic Levels of Service (cont’d)
Intersection & Approach
2022 No Action 2022 With Action 2022 With Action with Mitigation
Mitigation Measures Mvt. V/C Control Delay LOS Mvt. V/C
Control Delay LOS Mvt. V/C
Control Delay LOS
SIGNALIZED INTERSECTIONS DELANCEY STREET
14. DELANCEY STREET AND SUFFOLK STREET
Delancey Street EB TR 0.83 18.2 B TR 0.94 23.9 C
Mitigation not required. WB T 0.84 17.8 B T 0.85 18.1 B
Suffolk Street SB R 0.12 21.4 C R 0.16 22.3 C Overall Intersection - 0.57 18.1 B - 0.65 21.1 C 15. DELANCEY STREET AND CLINTON STREET
Delancey Street EB T 0.86 19.1 B T 0.88 19.8 B
Unmitigatable Impact Williamsburg Bridge WB
T 1.04 50.2 D T 1.05 54.3 D R 0.71 20.3 C R 0.73 21.0 C Delancey Street
Service Road WB R 0.68 93.4 F R 0.82 132.7 F Clinton Street NB R 0.73 36.4 D R 0.73 36.4 D Overall Intersection - 0.92 33.6 C - 0.93 35.8 D BROOME STREET
16. BROOME STREET AND ESSEX STREET Broome Street EB LTR 0.13 20.9 C LTR 0.19 21.8 C LTR 0.22 25.2 C Modify signal phasing: Add a new lead phase
for the SB approach. The existing signal phasing [EB phase has 31 s of green time; NB / SB phase has 49 s of green time] would be modified to the following: EB phase will have 27 s of green time, SB-lead phase will have 19 s of green time, and NB / SB phase will have 29 s of green [each phase will have 3 s amber and 2 s all red].
Essex Street NB TR 0.28 11.4 B TR 0.32 11.9 B TR 0.55 27.7 C SB L 0.83 31.5 C L 1.41 219.4 F L 0.87 27.3 C
T 0.30 11.9 B T 0.31 12.0 B T 0.28 9.7 A
Overall Intersection - 0.56 18.0 B - 0.94 80.3 F - 0.60 23.9 C

Chapter 21: Mitigation Measures
21-47
2022 No Action vs. 2022 With Action vs. 2022 Mitigation Weekday Midday Peak Hour Traffic Levels of Service (cont’d)
Intersection & Approach
2022 No Action 2022 With Action 2022 With Action with Mitigation
Mitigation Measures Mvt. V/C Control Delay LOS Mvt. V/C
Control Delay LOS Mvt. V/C
Control Delay LOS
SIGNALIZED INTERSECTIONS BROOME STREET
17. BROOME STREET AND NORFOLK STREET
Broome Street EB L 0.37 12.9 B L 0.69 21.4 C
Mitigation not required. WB R 0.10 10.2 B R 0.20 11.4 B Norfolk Street NB T 0.49 24.6 C T 0.68 28.1 C Overall Intersection - 0.41 17.4 B - 0.68 23.1 C GRAND STREET
18. GRAND STREET AND ALLEN STREET
Grand Street EB LTR 1.11 87.6 F LTR 1.28 158.9 F LTR 1.10 79.5 E Option 1 Install "No Standing 11 AM - 2 PM Mon - Fri" regulation along the north curb of the WB approach for 85-feet from the intersection to provide daylighting. Modify signal timing: Shift 3 s of green time from NB / SB phase to the EB / WB phase and 1 s from the NB / SB phase to SB-lead phase [EB / WB green time shifts from 28 s to 31 s; SB-lead phase green time shifts from 12 s to 13 s, NB / SB green time shifts from 20 s to 16 s, NB-lead phase green time remains the same].
WB LTR 0.87 52.3 D LTR 1.05 92.2 F LTR 0.73 34.2 C
Allen Street
NB L 0.39 44.2 D L 0.39 44.2 D L 0.39 44.2 D
TR 0.49 22.5 C TR 0.50 22.8 C TR 0.57 26.8 C
SB L 0.89 64.8 E L 0.93 70.7 E L 0.85 57.8 E
TR 0.77 26.3 C TR 0.77 26.4 C TR 0.85 31.6 C
Overall Intersection - 0.85 42.5 D - 0.91 62.3 E - 0.89 41.3 D
LTR 1.10 79.5 E Option 2
Install "No Standing 11 AM - 2 PM Mon - Fri" regulation along the north curb of the WB approach for 85-feet from the interesction to provide daylighting. Modify signal phasing: The existing signal phasing [EB / WB phase has 28 s of green; SB-lead phase has 12 s of green; NBTR / SBTR phase has 20 s of green; NB-lag phase has 10 s of green] would be modified to the following: EB / WB phase will have 31 s of green time; NBL / SBL phase will have 13 s of green time; NBTR / SBTR phase will have 31 s of green time [each phase will have 3 s amber and 2 s all red]. Pedestrians are not allowed to cross during the NBL / SBL phase.
LTR 0.73 34.2 C
L 0.30 38.1 D
TR 0.57 26.8 C
L 0.85 57.8 E
TR 0.94 41.9 D
- 0.99 44.7 D

Seward Park Mixed-Use Development
21-48
2022 No Action vs. 2022 With Action vs. 2022 Mitigation Weekday Midday Peak Hour Traffic Levels of Service (cont’d)
Intersection & Approach
2022 No Action 2022 With Action 2022 With Action with Mitigation
Mitigation Measures Mvt. V/C Control Delay LOS Mvt. V/C
Control Delay LOS Mvt. V/C
Control Delay LOS
SIGNALIZED INTERSECTIONS GRAND STREET
19. GRAND STREET AND ORCHARD STREET
Grand Street EB LT 0.71 21.7 C LT 0.85 25.3 C
Mitigation not required. WB TR 0.55 21.9 C TR 0.65 25.0 C
Orchard Street NB LTR 0.15 15.4 B LTR 0.15 15.4 B Overall Intersection - 0.43 21.1 C - 0.50 24.2 C 20. GRAND STREET AND LUDLOW STREET
Grand Street EB TR 0.68 25.4 C TR 0.78 29.7 C
Mitigation not required. WB LT 0.37 17.8 B LT 0.47 19.5 B
Ludlow Street SB LTR 0.27 17.2 B LTR 0.29 17.5 B Overall Intersection - 0.48 21.3 C - 0.53 23.9 C 21. GRAND STREET AND ESSEX STREET
Grand Street EB LTR 0.68 26.1 C LTR 0.80 32.6 C
Mitigation not required. WB LTR 0.64 20.6 C LTR 0.90 28.9 C
Essex Street NB LTR 0.30 16.9 B LTR 0.33 17.2 B
SB LTR 0.34 17.8 B LTR 0.38 18.5 B Overall Intersection - 0.51 20.6 C - 0.64 25.4 C 22. GRAND STREET AND NORFOLK STREET
Grand Street
EB L 0.15 11.8 B L 0.31 14.2 B
Mitigation not required. T 0.39 14.6 B T 0.39 14.6 B
WB T 0.38 13.5 B T 0.51 15.2 B
R 0.30 12.7 B R 0.38 13.6 B
Overall Intersection - 0.40 13.5 B - 0.52 14.6 B

Chapter 21: Mitigation Measures
21-49
2022 No Action vs. 2022 With Action vs. 2022 Mitigation Weekday Midday Peak Hour Traffic Levels of Service (cont’d)
Intersection & Approach
2022 No Action 2022 With Action 2022 With Action with Mitigation
Mitigation Measures Mvt. V/C Control Delay LOS Mvt. V/C
Control Delay LOS Mvt. V/C
Control Delay LOS
SIGNALIZED INTERSECTIONS GRAND STREET
23. GRAND STREET AND SUFFOLK STREET
Grand Street EB T 0.34 13.9 B T 0.34 13.9 B
Mitigation not required. WB T 0.69 19.8 B T 0.77 22.9 C Suffolk Street SB LR 0.07 18.9 B LR 0.45 24.8 C Overall Intersection - 0.43 17.9 B - 0.64 21.2 C 24. GRAND STREET AND CLINTON STREET
Grand Street
EB TR 0.46 17.1 B LTR 0.59 20.3 C LTR 0.54 17.2 B Modify signal timing: Shift 3 s from the NB phase to EB/WB [EB/WB green time shifts from 45 s to 48 s; NB green time shifts from 28 s to 25 s; LPI phase signal timing remains the same]. Install pedestrian countdown signals to accommodate signal timing modifications during the weekday PM peak period.
WB L 0.07 12.0 B L 0.08 12.2 B L 0.07 10.6 B
T 0.60 18.8 B T 0.68 20.7 C T 0.63 17.7 B
R 0.74 27.1 C R 1.00 66.7 E R 0.88 39.7 D
Clinton Street NB LTR 0.51 29.7 C LTR 0.55 31.1 C LTR 0.58 34.5 C
Overall Intersection - 0.65 22.0 C - 0.83 32.2 C - 0.78 24.8 C 25. GRAND STREET AND EAST BROADWAY
Grand Street EB T 0.13 6.9 A T 0.14 6.9 A
Mitigation not required. WB LT 0.85 18.6 B LT 0.92 24.6 C East Broadway NB R - 12.1 B R - 12.2 B Overall Intersection - 0.85 16.5 B - 0.92 21.3 C UNSIGNALIZED INTERSECTIONS
26. STANTON STREET AND LUDLOW STREET Stanton Street EB TR - 9.0 A TR - 9.0 A
Mitigation not required. Ludlow Street SB LT - 10.8 B LT - 11.0 B Overall Intersection - - 10.3 B - - 10.4 B 27. RIVINGTON STREET AND LUDLOW STREET
Rivington Street WB LT - 10.9 B LT - 11.0 B Mitigation not required. Ludlow Street SB TR - 10.7 B TR - 10.9 B Overall Intersection - - 10.8 B - - 10.9 B 28. BROOME STREET AND LUDLOW STREET
Broome Street EB TR - 14.0 B TR - 14.5 B Mitigation not required. Ludlow Street SB LT - 7.4 A LT - 7.5 A Overall Intersection - - 4.4 A - - 4.6 A
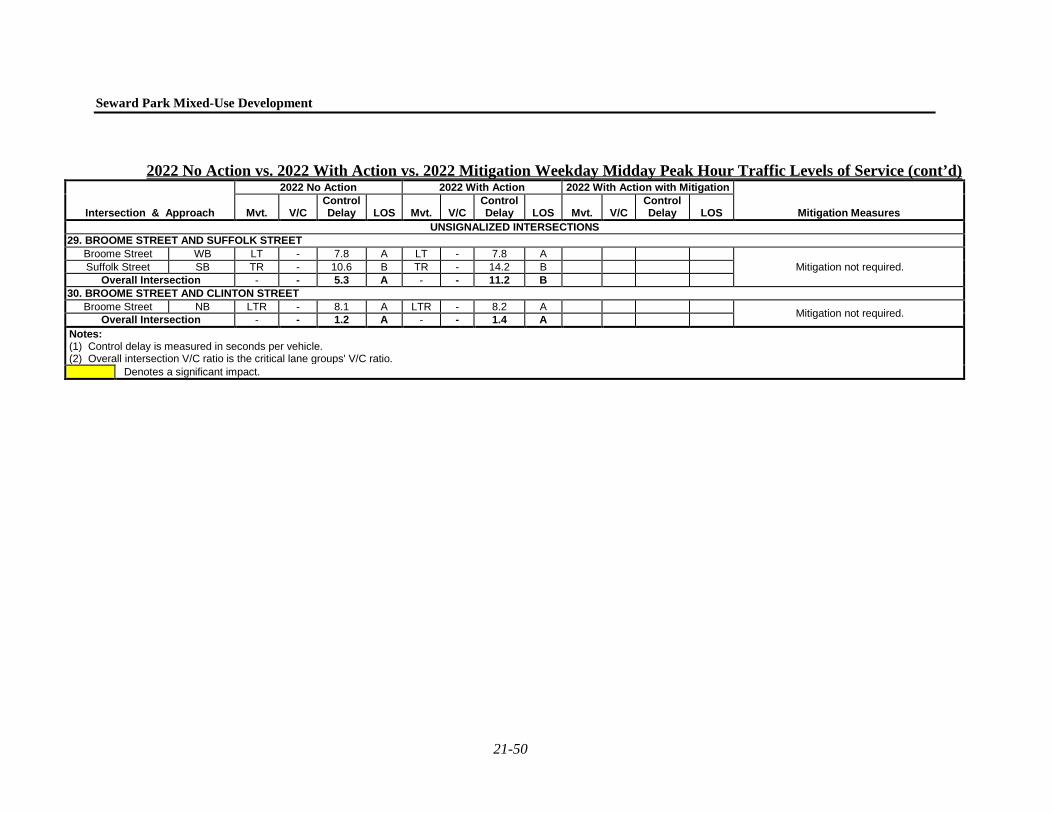
Seward Park Mixed-Use Development
21-50
2022 No Action vs. 2022 With Action vs. 2022 Mitigation Weekday Midday Peak Hour Traffic Levels of Service (cont’d)
Intersection & Approach
2022 No Action 2022 With Action 2022 With Action with Mitigation
Mitigation Measures Mvt. V/C Control Delay LOS Mvt. V/C
Control Delay LOS Mvt. V/C
Control Delay LOS
UNSIGNALIZED INTERSECTIONS 29. BROOME STREET AND SUFFOLK STREET
Broome Street WB LT - 7.8 A LT - 7.8 A Mitigation not required. Suffolk Street SB TR - 10.6 B TR - 14.2 B Overall Intersection - - 5.3 A - - 11.2 B 30. BROOME STREET AND CLINTON STREET
Broome Street NB LTR - 8.1 A LTR - 8.2 A Mitigation not required. Overall Intersection - - 1.2 A - - 1.4 A Notes:
(1) Control delay is measured in seconds per vehicle. (2) Overall intersection V/C ratio is the critical lane groups' V/C ratio. Denotes a significant impact.

Chapter 21: Mitigation Measures
21-51
2022 No Action vs. 2022 With Action vs. 2022 Mitigation Weekday PM Peak Hour Traffic Levels of Service
Intersection & Approach
2022 No Action 2022 With Action 2022 With Action with Mitigation
Mitigation Measures Mvt. V/C Control Delay LOS Mvt. V/C
Control Delay LOS Mvt. V/C
Control Delay LOS
SIGNALIZED INTERSECTIONS EAST HOUSTON STREET
1. EAST HOUSTON STREET AND BOWERY
East Houston Street
EB L 0.41 33.1 C L 0.41 33.5 C L 0.43 34.5 C Modify signal timing: Shift 1 s of green time from EBL / WBL lag phase to the EB / WB phase [EB / WB green time shifts from 29 s to 30 s; EBL / WBL lag phase green time shifts from 8 s to 7 s; signal timing during all other phases remain the same].
TR 0.74 30.2 C TR 0.77 31.0 C TR 0.74 29.5 C
WB L 0.70 39.8 D L 0.71 41.3 D L 0.74 43.3 D
TR 1.04 64.3 E TR 1.09 79.6 E TR 1.05 65.7 E
Bowery
NB L 0.80 50.1 D L 0.80 50.1 D L 0.80 50.1 D
TR 0.68 33.0 C TR 0.68 33.1 C TR 0.68 33.1 C
SB L 0.48 26.8 C L 0.48 27.0 C L 0.48 27.0 C
TR 1.00 53.8 D TR 1.00 53.8 D TR 1.00 53.8 D
Overall Intersection - 0.95 47.1 D - 0.95 52.5 D - 0.96 47.7 D 2. EAST HOUSTON STREET AND CHRYSTIE STREET / SECOND AVENUE
East Houston Street
EB T 0.72 32.4 C T 0.74 33.2 C T 0.72 31.7 C Modify signal timing: Shift 1 s of green time from NB phase to the EB / WB phase and 1 s of green time from NB phase to the SB phase [EB / WB green time shifts from 26 s to 27 s; NB phase green time shifts from 21 s to 19 s; SB phase green time shifts from 20 s to 21s].
R 1.07 105.1 F R 1.14 125.7 F R 1.09 106.4 F
WB L 0.84 75.1 E L 0.90 88.6 F L 0.85 74.5 E
T 0.64 30.1 C T 0.68 30.9 C T 0.65 29.7 C
Chrystie Street / Second Avenue
NB L 0.68 37.3 D L 0.69 37.6 D L 0.76 42.7 D
LR 0.68 39.0 D LR 0.68 39.0 D LR 0.75 44.7 D
SB L 1.06 77.3 E L 1.06 78.5 E L 1.00 58.8 E
LT 1.12 92.3 F LT 1.15 107.1 F LT 1.01 83.3 F
R 1.07 77.8 E R 1.07 77.8 E R 1.02 61.4 E
Overall Intersection - 0.97 59.4 E - 1.01 64.6 E - 1.01 54.9 D 3. EAST HOUSTON STREET AND ALLEN STREET / FIRST AVENUE
East Houston Street
EB L 0.85 44.2 D L 0.88 48.0 D
Unmitigatable Impact
T 0.84 33.0 C T 0.87 34.5 C
R 0.90 53.4 D R 0.90 53.4 D WB L 0.36 27.6 C L 0.37 28.6 C
TR 0.83 35.0 C TR 0.88 38.7 D
Allen Street
NB L 0.39 28.1 C L 0.43 28.7 C
T 0.99 56.0 E T 1.01 60.2 E
R 0.19 26.1 C R 0.19 26.1 C Overall Intersection - 0.95 40.8 D - 0.97 43.4 D

Seward Park Mixed-Use Development
21-52
2022 No Action vs. 2022 With Action vs. 2022 Mitigation Weekday PM Peak Hour Traffic Levels of Service (cont’d)
Intersection & Approach
2022 No Action 2022 With Action 2022 With Action with Mitigation
Mitigation Measures Mvt. V/C Control Delay LOS Mvt. V/C
Control Delay LOS Mvt. V/C
Control Delay LOS
SIGNALIZED INTERSECTIONS EAST HOUSTON STREET
4. EAST HOUSTON STREET AND ESSEX STREET / AVENUE A
East Houston Street
EB L 0.30 14.6 B L 0.33 15.3 B L 0.32 15.9 B Modify signal timing: Shift 2 s of green time from EB / WB phase to the EBL / WBL lead phase and 1 s of green time from EB / WB phase to the NB / SB phase [EBL / WBL lead phase green time shifts from 9 s to 11 s; EB / WB green time shifts from 32 s to 29 s; NB / SB green time shifts from 27 s to 28 s; LPI remains the same].
TR 0.77 29.0 C TR 0.81 30.4 C TR 0.90 37.4 D
WB L 1.00 83.9 F L 1.02 90.5 F L 0.99 67.1 E
T 0.65 26.7 C T 0.70 27.8 C T 0.77 32.1 C
R 0.26 22.0 C R 0.27 22.2 C R 0.30 24.9 C
Essex Street / Avenue A
NB LTR 0.74 33.7 C LTR 0.77 35.1 D LTR 0.74 32.8 C SB LTR 0.96 48.7 D LTR 1.03 65.5 E LTR 0.97 48.4 D
Overall Intersection - 0.99 36.0 D - 1.04 39.5 D - 1.05 38.1 D STANTON STREET
5. STANTON STREET AND ESSEX STREET Stanton Street EB LTR 0.28 23.3 C LTR 0.29 23.4 C
Mitigation not required. Essex Street NB TR 0.32 11.9 B TR 0.34 12.1 B
SB LT 0.39 12.3 B LT 0.42 12.6 B Overall Intersection - 0.35 13.2 B - 0.37 13.4 B 6. STANTON STREET AND NORFOLK STREET
Stanton Street EB LT 0.16 15.5 B LT 0.17 15.6 B Mitigation not required. Norfolk Street NB TR 0.41 18.9 B TR 0.54 21.3 C Overall Intersection - 0.29 17.8 B - 0.35 19.8 B RIVINGTON STREET
7. RIVINGTON STREET AND ESSEX STREET Rivington Street WB LTR 0.75 37.6 D LTR 0.86 47.8 D LTR 0.83 43.5 D Modify signal timing: Shift 1 s of green time from
NB / SB phase to the WB phase [WB green time shifts from 31 s to 32 s; NB / SB green time shifts from 49 s to 48 s].
Essex Street NB LT 0.33 11.5 B LT 0.35 11.7 B LT 0.36 12.2 B SB TR 0.44 13.4 B TR 0.48 13.8 B TR 0.49 14.6 B
Overall Intersection - 0.56 18.4 B - 0.63 21.4 C - 0.63 20.8 C 8. RIVINGTON STREET AND NORFOLK STREET
Rivington Street WB TR 0.45 19.8 B TR 0.47 20.1 C Mitigation not required. Norfolk Street NB LT 0.56 19.2 B LT 0.75 22.7 C Overall Intersection - 0.50 19.5 B - 0.61 21.7 C

Chapter 21: Mitigation Measures
21-53
2022 No Action vs. 2022 With Action vs. 2022 Mitigation Weekday PM Peak Hour Traffic Levels of Service (cont’d)
Intersection & Approach
2022 No Action 2022 With Action 2022 With Action with Mitigation
Mitigation Measures Mvt. V/C Control Delay LOS Mvt. V/C
Control Delay LOS Mvt. V/C
Control Delay LOS
SIGNALIZED INTERSECTIONS DELANCEY STREET
9. DELANCEY STREET AND ALLEN STREET
Delancey Street EB TR 1.08 72.0 E TR 1.11 85.6 F TR 1.11 85.6 F Partially Mitigated. WB L 0.73 43.9 D L 0.75 44.8 D L 0.75 44.8 D Modify signal phasing: Allow the NB-right turn
movement during the WB-lead phase. Signal timing remains the same during all peak hours. [Measures reflect signal phasing improvements needed to mitigate the intersection during the weekday midday peak period.]
TR 1.01 39.6 D TR 1.02 42.4 D TR 1.02 42.4 D
Allen Street NB T 0.66 33.8 C T 0.70 34.8 C TR 0.70 34.8 C
R 1.00 84.9 F R 1.11 119.0 F R 0.48 17.2 B
SB TR 0.56 31.7 C TR 0.56 31.7 C TR 0.56 31.7 C
Overall Intersection - 1.01 53.0 D - 1.05 60.9 E - 0.92 56.6 E 10. DELANCEY STREET AND ORCHARD STREET
Delancey Street EB T 0.66 12.3 B T 0.68 12.6 B
Mitigation not required. WB TR 0.82 15.6 B TR 0.82 15.7 B
Orchard Street NB LTR 0.33 27.4 C LTR 0.33 27.4 C Overall Intersection - 0.66 14.4 B - 0.66 14.6 B 11. DELANCEY STREET AND LUDLOW STREET
Delancey Street EB TR 0.70 13.3 B TR 0.73 13.8 B TR 0.75 15.4 B Modify signal timing: Shift 2 s of green time from EB / WB phase to the SB phase [EB / WB green time shifts from 54 s to 52 s; SB green time shifts from 26 s to 28 s].
WB T 0.79 14.1 B T 0.79 14.1 B T 0.82 15.8 B Ludlow Street SB LTR 1.25 168.9 F LTR 1.32 200.4 F LTR 1.22 156.4 F Overall Intersection - 0.94 24.0 C - 0.97 26.3 C - 0.96 25.0 C
12. DELANCEY STREET AND ESSEX STREET
Delancey Street EB TR 1.00 39.4 D TR 1.03 46.3 D
Unmitigatable Impact WB TR 1.05 54.8 D TR 1.06 56.9 E
Essex Street NB LTR 1.02 75.7 E LTR 1.20 140.1 F
SB LTR 1.00 70.7 E LTR 1.15 119.3 F Overall Intersection - 1.04 51.9 D - 1.11 65.7 E 13. DELANCEY STREET AND NORFOLK STREET
Delancey Street EB T 1.06 53.4 D T 1.08 63.3 E
Unmitigatable Impact WB TR 1.00 29.0 C TR 1.01 32.7 C
Norfolk Street NB TR 1.01 71.5 E TR 1.27 166.4 F
R 1.02 74.4 E R 1.27 165.4 F Overall Intersection - 1.04 45.1 D - 1.15 66.0 E

Seward Park Mixed-Use Development
21-54
2022 No Action vs. 2022 With Action vs. 2022 Mitigation Weekday PM Peak Hour Traffic Levels of Service (cont’d)
Intersection & Approach
2022 No Action 2022 With Action 2022 With Action with Mitigation
Mitigation Measures Mvt. V/C Control Delay LOS Mvt. V/C
Control Delay LOS Mvt. V/C
Control Delay LOS
SIGNALIZED INTERSECTIONS DELANCEY STREET
14. DELANCEY STREET AND SUFFOLK STREET
Delancey Street EB T 1.07 52.7 D T 1.08 59.3 E
Unmitigatable Impact
WB T 0.85 16.0 B T 0.85 16.1 B Delancey Street
Service Road EB TR 0.13 8.3 A TR 0.41 10.6 B Suffolk Street SB R 0.21 25.0 C R 0.28 26.9 C Overall Intersection - 0.78 35.4 D - 0.81 38.4 D 15. DELANCEY STREET AND CLINTON STREET
Delancey Street EB T 1.06 48.7 D T 1.07 54.7 D
Unmitigatable Impact
Williamsburg Bridge
WB T 1.07 55.1 E T 1.08 57.9 E
R 1.07 80.0 F R 1.09 86.8 F
Delancey Street Service Road
EB TR 0.09 6.2 A TR 0.14 6.5 A WB TR 0.93 83.1 F TR 0.93 82.9 F Clinton Street NB R 0.16 27.7 C R 0.16 27.7 C Overall Intersection - 0.82 53.9 D - 0.83 58.3 E BROOME STREET
16. BROOME STREET AND ESSEX STREET Broome Street EB LTR 0.13 20.9 C LTR 0.18 21.8 C LTR 0.18 21.8 C Modify signal phasing: Add a new lead phase for
the SB approach. The existing signal phasing [EB phase has 31 s of green time; NB / SB phase has 49 s of green time] would be modified to the following: EB phase will have 31 s of green time, SB-lead phase will have 11 s of green time, and NB / SB phase will have 33 s of green [each phase will have 3 s amber and 2 s all red].
Essex Street NB TR 0.43 12.9 B TR 0.47 13.4 B TR 0.71 27.6 C SB L 0.84 23.1 C L 1.22 126.1 F L 0.97 44.5 D
T 0.29 11.3 B T 0.31 11.4 B T 0.31 11.4 B
Overall Intersection - 0.57 14.9 B - 0.82 38.7 D - 0.65 27.7 C 17. BROOME STREET AND NORFOLK STREET
Broome Street EB L 0.65 36.7 D L 0.85 48.1 D L 0.78 40.6 D Modify signal timing: Shift 2 s of green time from NB phase to the EB / WB phase [EB / WB green time shifts from 49 s to 51 s; NB green time shifts from 31 s to 29 s].
WB R 0.93 68.8 E R 1.04 95.6 F R 0.96 71.0 E Norfolk Street NB T 0.64 26.7 C T 0.81 31.1 C T 0.87 35.2 D Overall Intersection - 0.77 43.6 D - 0.91 55.7 E - 0.91 47.8 D

Chapter 21: Mitigation Measures
21-55
2022 No Action vs. 2022 With Action vs. 2022 Mitigation Weekday PM Peak Hour Traffic Levels of Service (cont’d)
Intersection & Approach
2022 No Action 2022 With Action 2022 With Action with Mitigation
Mitigation Measures Mvt. V/C Control Delay LOS Mvt. V/C
Control Delay LOS Mvt. V/C
Control Delay LOS
GRAND STREET 18. GRAND STREET AND ALLEN STREET
Grand Street EB LTR 0.98 57.5 E LTR 1.12 100.5 F LTR 0.97 52.3 D Option 1 Modify signal timing: Shift 3 s of green time from NB / SB phase to the EB / WB phase; shift 1 s from the NB / SB phase to SB-lead phase [EB / WB green time shifts from 27 s to 30 s; SB-lead phase green time shifts from 10 s to 11 s, NB / SB green time shifts from 23 s to 19 s, NB-lead phase green time remains the same].
WB LTR 0.65 35.6 D LTR 0.87 52.2 D LTR 0.78 40.1 D
Allen Street
NB L 0.26 39.8 D L 0.26 39.8 D L 0.26 39.8 D
TR 0.59 21.9 C TR 0.60 22.1 C TR 0.67 26.3 C
SB L 0.95 86.0 F L 0.98 92.8 F L 0.89 71.7 E
TR 0.64 22.7 C TR 0.64 22.7 C TR 0.70 26.1 C
Overall Intersection - 0.78 34.6 C - 0.84 44.8 D - 0.82 36.1 D
LTR 0.89 39.4 D Option 2 Modify signal phasing: The existing
signal phasing [EB / WB phase has 27 s of green; SB-lead phase has 10 s of green; NBTR / SBTR phase has 23 s of green; NB-lag phase has 10 s of green] would be modified to the following: EB / WB phase will have 32 s of green time; NBL / SBL phase will have 11 s of green time; NBTR / SBTR phase will have 32 s of green time [each phase will have 3 s amber and 2 s all red]. Pedestrians are not allowed to cross during the NBL / SBL phase.
LTR 0.73 35.0 D
L 0.24 28.3 D
TR 0.71 28.9 C
L 0.89 71.7 E
TR 0.77 30.3 C
- 0.84 35.4 D
19. GRAND STREET AND ORCHARD STREET
Grand Street EB LT 0.68 22.4 C LT 0.76 24.6 C
Mitigation not required. WB TR 0.46 20.0 C TR 0.57 22.7 C Orchard Street NB LTR 0.17 15.7 B LTR 0.17 15.7 B Overall Intersection - 0.43 20.7 C - 0.47 22.8 C 20. GRAND STREET AND LUDLOW STREET
Grand Street EB TR 0.60 22.4 C TR 0.68 24.5 C
Mitigation not required. WB LT 0.34 17.1 B LT 0.47 18.9 B Ludlow Street SB LTR 0.18 15.9 B LTR 0.20 16.1 B Overall Intersection - 0.39 19.6 B - 0.44 21.2 C

Seward Park Mixed-Use Development
21-56
2022 No Action vs. 2022 With Action vs. 2022 Mitigation Weekday PM Peak Hour Traffic Levels of Service (cont’d)
Intersection & Approach
2022 No Action 2022 With Action 2022 With Action with Mitigation
Mitigation Measures Mvt. V/C Control Delay LOS Mvt. V/C
Control Delay LOS Mvt. V/C
Control Delay LOS
GRAND STREET 21. GRAND STREET AND ESSEX STREET
Grand Street EB LTR 0.65 24.8 C LTR 0.76 29.7 C LTR 0.71 26.9 C Install "No Standing Anytime" regulation along the
north curb of the WB approach for 100-feet from the intersection to allow for two moving lanes. Restripe the WB approach from one 11-foot travel lane, one 5-foot bike lane, and one 10-foot parking lane to one 11-foot left-through lane, one 5-foot bike lane, and one 10-foot right turn lane.
WB LTR 1.02 43.9 D LTR 1.24 134.9 F LT 0.39 16.9 B
- - - - - - - - R 0.90 27.1 C
Essex Street NB LTR 0.38 17.8 B LTR 0.40 18.2 B LTR 0.40 18.2 B SB LTR 0.35 17.8 B LTR 0.40 18.7 B LTR 0.40 18.7 B
Overall Intersection - 0.70 28.1 C - 0.82 63.5 E - 0.65 21.9 C 22. GRAND STREET AND NORFOLK STREET
Grand Street
EB L 0.25 14.1 B L 0.57 25.9 C L 0.34 15.4 B Install "No Standing Anytime" regulation along the north curb of the WB approach for 100-feet from the intersection to allow for two moving lanes. Restripe the WB approach from one 11-foot travel lane, one 5-foot bike lane, and one 10-foot parking lane to one 11-foot left-through lane, one 5-foot bike lane, and one 10-foot right turn lane.
T 0.45 15.3 B T 0.47 15.6 B T 0.47 15.6 B
WB TR 1.05 52.3 D TR 1.27 144.8 F T 0.65 16.5 B
- - - - - - - - R 0.56 15.5 B
Overall Intersection - 1.05 40.1 D - 1.26 104.7 F - 0.65 15.9 B 23. GRAND STREET AND SUFFOLK STREET
Grand Street EB T 0.38 14.2 B T 0.40 14.5 B T 0.38 12.5 B Modify signal timing: Shift 3 s of green time from SB phase to the EB / WB phase [EB / WB green time shifts from 47 s to 50 s; SB green time shifts from 33 s to 30 s].
WB T 0.99 44.7 D T 1.07 67.0 E T 1.00 45.5 D Suffolk Street SB LR 0.08 19.0 B LR 0.41 23.8 C LR 0.45 27.1 C Overall Intersection - 0.62 35.7 D - 0.79 48.5 D - 0.80 35.2 D
24. GRAND STREET AND CLINTON STREET
Grand Street
EB LTR 0.90 48.2 D LTR 1.16 123.2 F LTR 0.92 48.6 D Install "No Standing 4 PM to 7 PM Mon - Fri" regulation along the south curb of the EB approach for 165-feet to reduce parking friction along the approach. Modify signal timing: Shift 2 s of green time from NB / SB phase to the EB / WB phase [EB / WB green time shifts from 45 s to 47 s; NB / SB green time shifts from 35 s to 33 s].
WB L 0.04 11.6 B L 0.04 11.6 B L 0.04 10.6 B
T 0.78 23.0 C T 0.84 26.1 C T 0.81 22.8 C
R 0.75 28.3 C R 0.79 31.9 C R 0.75 27.3 C
Clinton Street NB LTR 0.69 30.8 C LTR 0.79 37.4 D LTR 0.84 44.4 D SB LTR 0.01 16.9 B LTR 0.05 17.3 B LTR 0.05 18.6 B
Overall Intersection - 0.81 30.4 C - 1.00 50.1 D - 0.89 32.6 C 25. GRAND STREET AND EAST BROADWAY
Grand Street EB T 0.12 6.8 A T 0.13 6.9 A
Mitigation not required. WB LT 0.88 19.1 B LT 0.95 25.6 C East Broadway NB R 0.00 6.1 A R 0.00 6.1 A Overall Intersection - 0.88 17.5 B - 0.95 23.3 C

Chapter 21: Mitigation Measures
21-57
2022 No Action vs. 2022 With Action vs. 2022 Mitigation Weekday PM Peak Hour Traffic Levels of Service (cont’d)
Intersection & Approach
2022 No Action 2022 With Action 2022 With Action with Mitigation
Mitigation Measures Mvt. V/C Control Delay LOS Mvt. V/C
Control Delay LOS Mvt. V/C
Control Delay LOS
UNSIGNALIZED INTERSECTIONS 26. STANTON STREET AND LUDLOW STREET
Stanton Street EB TR - 7.9 A TR - 7.9 A Mitigation not required. Ludlow Street SB LT - 9.7 A LT - 9.8 A Overall Intersection - - 9.4 A - - 9.4 A 27. RIVINGTON STREET AND LUDLOW STREET
Rivington Street WB LT - 10.8 B LT - 10.9 B Mitigation not required. Ludlow Street SB TR - 11.0 B TR - 11.1 B Overall Intersection - - 10.9 B - - 11.0 B 28. BROOME STREET AND LUDLOW STREET
Broome Street EB TR - 10.9 B TR - 11.1 B Mitigation not required. Ludlow Street SB LT - 7.3 A LT - 7.3 A Overall Intersection - - 5.5 A - - 5.3 A 29. BROOME STREET AND SUFFOLK STREET
Broome Street WB LT - 15.0 B LT - 15.5 C Mitigation not required. Suffolk Street SB TR - 12.0 B TR - 15.8 C Overall Intersection - - 2.5 A - - 6.8 A 30. BROOME STREET AND CLINTON STREET
Broome Street NB LTR - 9.4 A LTR - 9.7 A Mitigation not required. SB LTR - 9.4 A LTR - 9.4 A Overall Intersection - - 7.1 A - - 6.9 A Notes:
(1) Control delay is measured in seconds per vehicle. (2) Overall intersection V/C ratio is the critical lane groups' V/C ratio. Denotes a significant impact.

Seward Park Mixed-Use Development
21-58
2022 No Action vs. 2022 With Action vs. 2022 Mitigation Weekday PM Peak Hour Traffic Levels of Service1
Intersection & Approach
2022 No Action 2022 With Action 2022 With Action with Mitigation
Mitigation Measures Mvt. V/C Control Delay LOS Mvt. V/C
Control Delay LOS Mvt. V/C
Control Delay LOS
SIGNALIZED INTERSECTIONS EAST HOUSTON STREET
1. EAST HOUSTON STREET AND BOWERY
East Houston Street
EB L 0.41 33.2 C L 0.41 33.5 C L 0.43 34.5 C Modify signal timing: Shift 1 s of green time from EBL / WBL lag phase to the EB / WB phase [EB / WB green time shifts from 29 s to 30 s; EBL / WBL lag phase green time shifts from 8 s to 7 s; signal timing during all other phases remain the same].
TR 0.75 30.5 C TR 0.78 31.3 C TR 0.76 29.8 C
WB L 0.71 41.0 D L 0.73 42.5 D L 0.75 44.6 D
TR 1.05 67.6 E TR 1.09 83.1 F TR 1.06 68.7 E
Bowery
NB L 0.83 53.0 D L 0.83 53.0 D L 0.83 53.0 D
TR 0.69 33.3 C TR 0.70 33.4 C TR 0.70 33.4 C
SB L 0.49 27.1 C L 0.49 27.2 C L 0.49 27.2 C
TR 1.01 55.0 D TR 1.01 55.0 D TR 1.01 55.0 D
Overall Intersection - 0.96 48.7 D - 0.96 54.2 D - 0.97 49.2 D 2. EAST HOUSTON STREET AND CHRYSTIE STREET / SECOND AVENUE
East Houston Street
EB T 0.72 32.5 C T 0.75 33.3 C T 0.72 31.7 C Modify signal timing: Shift 1 s of green time from NB phase to the EB / WB phase and 1 s of green time from NB phase to the SB phase [EB / WB green time shifts from 26 s to 27 s; NB phase green time shifts from 21 s to 19 s; SB phase green time shifts from 20 s to 21 s].
R 1.15 128.8 F R 1.21 153.3 F R 1.16 130.9 F
WB L 0.94 94.1 F L 0.99 110.0 F L 0.93 91.1 F
T 0.64 30.1 C T 0.68 30.9 C T 0.65 29.7 C
Chrystie Street / Second Avenue
NB L 0.71 38.5 D L 0.72 38.8 D L 0.79 44.6 D
LR 0.68 39.0 D LR 0.68 39.2 D LR 0.75 44.7 D
SB L 1.06 77.3 E L 1.06 78.5 E L 1.00 58.8 E
LT 1.12 93.6 F LT 1.15 108.4 F LT 1.10 84.5 F
R 1.07 77.8 E R 1.07 77.8 E R 1.02 61.4 E
Overall Intersection - 1.01 62.2 E - 1.05 67.9 E - 1.05 57.8 E 3. EAST HOUSTON STREET AND ALLEN STREET / FIRST AVENUE
East Houston Street
EB L 0.71 33.6 C L 0.71 34.4 C L 0.77 38.1 D Modify signal timing: Shift 1 s of green time from EBL/WBL lag phase to the EB/WB phase and 1 s of green time from EBL/WBL lag phase to the NB phase [EB / WB green time shifts from 27 s to 28 s; EBL/WBL green time shifts from 15 s to 13 s; NB green time shifts from 22 s to 23 s; LPI remains the same].
T 0.91 39.1 D T 0.94 42.7 D T 0.91 38.2 D
R 0.98 73.7 E R 0.98 73.7 E R 0.94 61.5 E
WB L 0.30 24.9 C L 0.30 25.6 C L 0.32 26.6 C
TR 0.90 42.4 D TR 0.96 50.7 D TR 0.93 44.3 D
Allen Street NB L 0.44 31.1 C L 0.48 31.9 C L 0.46 30.7 C
T 1.13 103.5 F T 1.15 111.2 F T 1.10 90.5 F
R 0.22 29.0 C R 0.22 29.0 C R 0.20 28.0 C
Overall Intersection - 0.98 56.2 E - 1.10 61.0 E - 0.99 52.8 D 1 This table has been revised for the FGEIS.

Chapter 21: Mitigation Measures
21-59
2022 No Action vs. 2022 With Action vs. 2022 Mitigation Weekday PM Peak Hour Traffic Levels of Service (cont’d)
Intersection & Approach
2022 No Action 2022 With Action 2022 With Action with Mitigation
Mitigation Measures Mvt. V/C Control Delay LOS Mvt. V/C
Control Delay LOS Mvt. V/C
Control Delay LOS
SIGNALIZED INTERSECTIONS EAST HOUSTON STREET
4. EAST HOUSTON STREET AND ESSEX STREET / AVENUE A
East Houston Street
EB L 0.32 14.9 B L 0.34 15.5 B L 0.33 16.0 B Modify signal timing: Shift 2 s of green time from EB / WB phase to the EBL / WBL lead phase and 1 s of green time from EB / WB phase to the NB / SB phase [EBL / WBL lead phase green time shifts from 9 s to 11 s; EB / WB green time shifts from 32 s to 29 s; NB / SB green time shifts from 27 s to 28 s; LPI remains the same].
TR 0.78 29.3 C TR 0.82 30.8 C TR 0.91 38.3 D
WB L 1.00 85.1 F L 1.03 92.1 F L 1.00 69.6 E
T 0.66 26.9 C T 0.71 28.0 C T 0.78 32.4 C
R 0.26 22.0 C R 0.27 22.2 C R 0.30 24.9 C
Essex Street / Avenue A
NB LTR 0.74 33.8 C LTR 0.78 35.2 D LTR 0.74 32.9 C SB LTR 0.98 51.9 D LTR 1.05 69.9 E LTR 0.98 51.5 D
Overall Intersection - 0.99 36.6 D - 1.05 40.4 D - 1.06 39.1 D STANTON STREET
5. STANTON STREET AND ESSEX STREET Stanton Street EB LTR 0.29 23.5 C LTR 0.30 23.7 C
Mitigation not required. Essex Street NB TR 0.32 11.9 B TR 0.34 12.1 B
SB LT 0.39 12.3 B LT 0.42 12.6 B Overall Intersection - 0.35 13.3 B - 0.37 13.5 B 6. STANTON STREET AND NORFOLK STREET
Stanton Street EB LT 0.16 15.5 B LT 0.17 15.6 B Mitigation not required. Norfolk Street NB TR 0.42 18.9 B TR 0.55 21.5 C Overall Intersection - 0.29 17.9 B - 0.36 20.0 C

Seward Park Mixed-Use Development
21-60
2022 No Action vs. 2022 With Action vs. 2022 Mitigation Weekday PM Peak Hour Traffic Levels of Service (cont’d)
Intersection & Approach
2022 No Action 2022 With Action 2022 With Action with Mitigation
Mitigation Measures Mvt. V/C Control Delay LOS Mvt. V/C
Control Delay LOS Mvt. V/C
Control Delay LOS
SIGNALIZED INTERSECTIONS RIVINGTON STREET
7. RIVINGTON STREET AND ESSEX STREET Rivington Street WB LTR 0.85 45.4 D LTR 0.97 65.4 E LTR 0.88 46.2 D Shift the NB approach centerline six feet to the
east and restripe the NB approach from one 10-foot wide travel lane and one 18-foot wide travel lane with parking to one 12-foot wide travel lane and one 9-foot wide parking lane (the sidewalk along the east curb of Essex Street would be extended seven inches to the west to mitigate pedestrian impacts). Restripe the SB receiving side from one 10-foot wide travel lane and one 17-foot wide travel lane with parking to one 12-foot wide travel lane, one 11-foot wide travel lane, and one 10-foot wide parking lane. Shift the SB approach centerline six feet to the east and restripe the SB approach from one 10-foot wide travel lane and one 17-foot wide travel lane with parking to one 11-foot wide travel lane, one 12-foot wide travel lane, and one 10-foot wide parking lane (which would operate as a travel lane during the Saturday peak hour). Restripe the NB receiving side from one 10-foot wide travel lane and one 18-foot wide travel lane with parking to one 12-foot wide travel lane and one 10-foot wide parking lane. Modify signal timing: Shift 4 s of green time from NB / SB phase to the WB phase [WB green time shifts from 31 s to 35 s; NB / SB green time shifts from 49 s to 45 s].
Essex Street NB LT 0.33 11.5 B LT 0.35 11.6 B LT 0.68 18.0 B SB TR 0.45 13.6 B TR 0.49 14.0 B TR 0.50 16.4 B
Overall Intersection - 0.61 21.1 C - 0.67 26.9 C - 0.77 24.8 C 8. RIVINGTON STREET AND NORFOLK STREET
Rivington Street WB TR 0.52 21.4 C TR 0.55 21.9 C Mitigation not required. Norfolk Street NB LT 0.55 19.2 B LT 0.75 22.8 C Overall Intersection - 0.54 20.3 C - 0.65 22.4 C

Chapter 21: Mitigation Measures
21-61
2022 No Action vs. 2022 With Action vs. 2022 Mitigation Weekday PM Peak Hour Traffic Levels of Service (cont’d)
Intersection & Approach
2022 No Action 2022 With Action 2022 With Action with Mitigation
Mitigation Measures Mvt. V/C Control Delay LOS Mvt. V/C
Control Delay LOS Mvt. V/C
Control Delay LOS
SIGNALIZED INTERSECTIONS DELANCEY STREET
9. DELANCEY STREET AND ALLEN STREET
Delancey Street EB TR 1.11 87.6 F TR 1.15 102.0 F
Unmitigatable Impact
WB L 0.69 41.4 D L 0.71 42.2 D
TR 1.08 64.3 E TR 1.09 69.0 E
Allen Street
NB T 0.63 32.3 C T 0.66 33.2 C
R 0.46 17.4 B R 0.49 18.0 B
SB TR 0.54 30.6 C TR 0.55 30.7 C Overall Intersection - 0.95 65.2 E - 0.96 72.7 E 10. DELANCEY STREET AND ORCHARD STREET
Delancey Street EB T 0.72 15.3 B T 0.74 15.7 B
Mitigation not required. WB TR 0.83 18.0 B TR 0.83 18.1 B Orchard Street NB LTR 0.28 23.6 C LTR 0.28 23.6 C Overall Intersection - 0.62 16.9 B - 0.63 17.1 B 11. DELANCEY STREET AND LUDLOW STREET
Delancey Street EB TR 0.76 16.7 B TR 0.79 17.3 B
Unmitigatable Impact WB T 1.10 68.3 E T 1.11 69.9 E Ludlow Street SB LTR 1.09 105.3 F LTR 1.20 145.0 F Overall Intersection - 1.10 47.4 D - 1.14 50.9 D 12. DELANCEY STREET AND ESSEX STREET
Delancey Street EB TR 0.97 30.7 C TR 0.99 35.4 D
Unmitigatable Impact
WB T 1.09 68.9 E T 1.09 69.8 E
R 0.89 51.5 D R 0.98 74.5 E
Essex Street
NB T 0.40 30.7 C LT 0.43 31.2 C
R 1.38 228.7 F R 1.94 478.4 F
SB TR 0.71 35.5 D TR 0.81 39.8 D Overall Intersection - 1.18 56.9 E - 1.37 72.5 E 13. DELANCEY STREET AND NORFOLK STREET
Delancey Street EB T 1.06 56.8 E T 1.09 67.2 E
Unmitigatable Impact WB TR 1.01 34.0 C TR 1.03 38.9 D
Norfolk Street NB TR 0.72 33.1 C TR 0.94 52.2 D
R 0.71 33.3 C R 0.97 59.3 E Overall Intersection - 0.93 43.8 D - 1.04 53.1 D
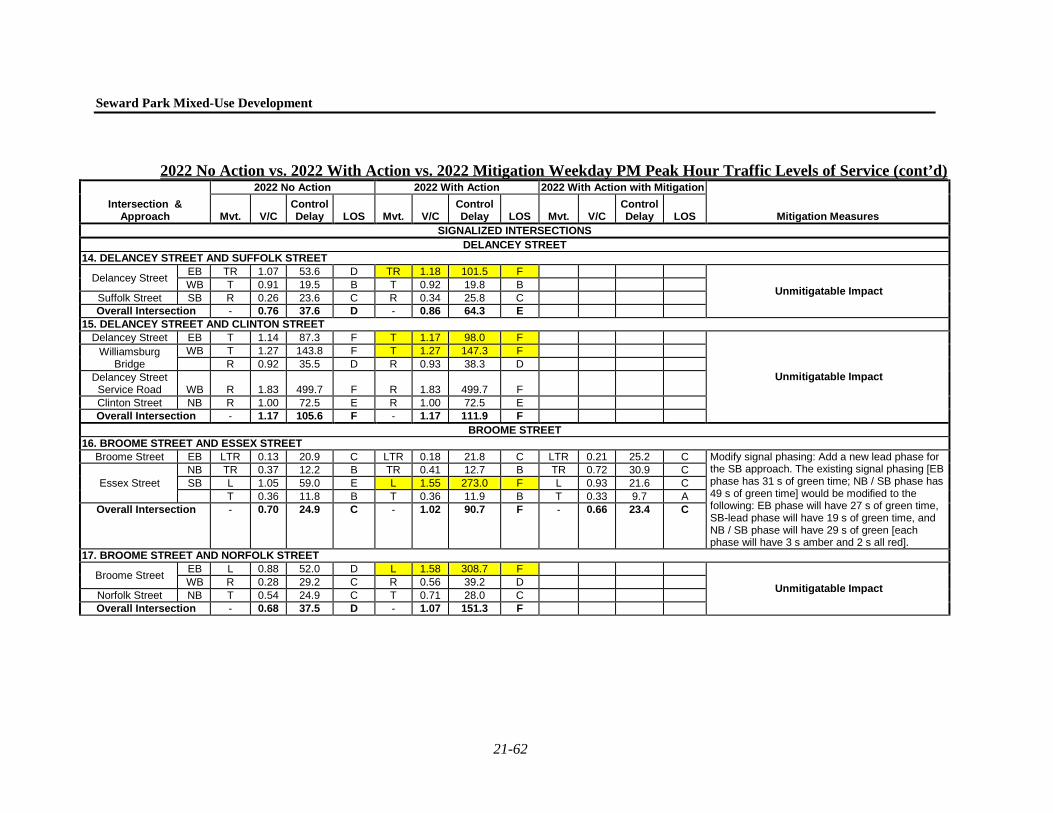
Seward Park Mixed-Use Development
21-62
2022 No Action vs. 2022 With Action vs. 2022 Mitigation Weekday PM Peak Hour Traffic Levels of Service (cont’d)
Intersection & Approach
2022 No Action 2022 With Action 2022 With Action with Mitigation
Mitigation Measures Mvt. V/C Control Delay LOS Mvt. V/C
Control Delay LOS Mvt. V/C
Control Delay LOS
SIGNALIZED INTERSECTIONS DELANCEY STREET
14. DELANCEY STREET AND SUFFOLK STREET
Delancey Street EB TR 1.07 53.6 D TR 1.18 101.5 F
Unmitigatable Impact WB T 0.91 19.5 B T 0.92 19.8 B Suffolk Street SB R 0.26 23.6 C R 0.34 25.8 C Overall Intersection - 0.76 37.6 D - 0.86 64.3 E 15. DELANCEY STREET AND CLINTON STREET
Delancey Street EB T 1.14 87.3 F T 1.17 98.0 F
Unmitigatable Impact
Williamsburg Bridge
WB T 1.27 143.8 F T 1.27 147.3 F
R 0.92 35.5 D R 0.93 38.3 D
Delancey Street Service Road WB R 1.83 499.7 F R 1.83 499.7 F
Clinton Street NB R 1.00 72.5 E R 1.00 72.5 E Overall Intersection - 1.17 105.6 F - 1.17 111.9 F BROOME STREET
16. BROOME STREET AND ESSEX STREET Broome Street EB LTR 0.13 20.9 C LTR 0.18 21.8 C LTR 0.21 25.2 C Modify signal phasing: Add a new lead phase for
the SB approach. The existing signal phasing [EB phase has 31 s of green time; NB / SB phase has 49 s of green time] would be modified to the following: EB phase will have 27 s of green time, SB-lead phase will have 19 s of green time, and NB / SB phase will have 29 s of green [each phase will have 3 s amber and 2 s all red].
Essex Street NB TR 0.37 12.2 B TR 0.41 12.7 B TR 0.72 30.9 C SB L 1.05 59.0 E L 1.55 273.0 F L 0.93 21.6 C
T 0.36 11.8 B T 0.36 11.9 B T 0.33 9.7 A
Overall Intersection - 0.70 24.9 C - 1.02 90.7 F - 0.66 23.4 C
17. BROOME STREET AND NORFOLK STREET
Broome Street EB L 0.88 52.0 D L 1.58 308.7 F Unmitigatable Impact WB R 0.28 29.2 C R 0.56 39.2 D Norfolk Street NB T 0.54 24.9 C T 0.71 28.0 C Overall Intersection - 0.68 37.5 D - 1.07 151.3 F

Chapter 21: Mitigation Measures
21-63
2022 No Action vs. 2022 With Action vs. 2022 Mitigation Weekday PM Peak Hour Traffic Levels of Service (cont’d)
Intersection & Approach
2022 No Action 2022 With Action 2022 With Action with Mitigation
Mitigation Measures Mvt. V/C Control Delay LOS Mvt. V/C
Control Delay LOS Mvt. V/C
Control Delay LOS
GRAND STREET 18. GRAND STREET AND ALLEN STREET
Grand Street EB LTR 0.90 42.8 D LTR 1.02 65.5 E LTR 0.93 45.3 D Option 1 Modify signal timing: Shift 2 s from the NB/SB phase to EB/WB phase [EB/WB green time shifts from 29 s to 31 s; NB / SB green time shifts from 19 s to 17 s; signal timing during all other phrases remain the same].
WB LTR 0.61 32.1 C LTR 0.81 43.6 D LTR 0.76 37.6 D
Allen Street
NB L 0.26 39.8 D L 0.26 39.8 D L 0.26 39.8 D
TR 0.66 26.1 C TR 0.67 26.3 C TR 0.71 28.8 C
SB L 0.79 57.1 E L 0.82 59.5 E L 0.82 59.5 E
TR 0.68 24.9 C TR 0.68 24.9 C TR 0.72 27.4 C
Overall Intersection - 0.77 31.6 C - 0.83 37.4 D - 0.82 34.8 C
LTR 0.90 39.9 D Option 2
Modify signal phasing: The existing signal phasing [EB / WB phase has 29 s of green; SB-lead phase has 12 s of green; NBTR / SBTR phase has 19 s of green; NB-lag phase has 10 s of green] would be modified to the following: EB / WB phase will have 32 s of green time; NBL / SBL phase will have 12 s of green time; NBTR / SBTR phase will have 31 s of green time [each phase will have 3 s amber and 2 s all red]. Pedestrians are not allowed to cross during the NBL / SBL phase.
LTR 0.73 35.2 D
L 0.22 36.9 D
TR 0.73 30.2 C
L 0.82 59.5 E
TR 0.80 32.2 C
- 0.84 35.5 D
19. GRAND STREET AND ORCHARD STREET
Grand Street EB LT 0.68 22.4 C LT 0.76 24.6 C
Mitigation not required. WB TR 0.46 20.1 C TR 0.57 22.7 C Orchard Street NB LTR 0.17 15.7 B LTR 0.17 15.7 B Overall Intersection - 0.43 20.7 C - 0.47 22.8 C 20. GRAND STREET AND LUDLOW STREET
Grand Street EB TR 0.60 22.5 C TR 0.68 24.7 C
Mitigation not required. WB LT 0.34 17.1 B LT 0.47 18.8 B Ludlow Street SB LTR 0.18 15.9 B LTR 0.20 16.2 B Overall Intersection - 0.39 19.7 B - 0.44 21.3 C

Seward Park Mixed-Use Development
21-64
2022 No Action vs. 2022 With Action vs. 2022 Mitigation Weekday PM Peak Hour Traffic Levels of Service (cont’d)
Intersection & Approach
2022 No Action 2022 With Action 2022 With Action with Mitigation
Mitigation Measures Mvt. V/C Control Delay LOS Mvt. V/C
Control Delay LOS Mvt. V/C
Control Delay LOS
GRAND STREET 21. GRAND STREET AND ESSEX STREET
Grand Street EB LTR 0.68 26.2 C LTR 0.77 30.8 C
WB LTR 0.78 22.6 C LTR 1.00 38.0 D
Essex Street NB LTR 0.38 17.8 B LTR 0.40 18.2 B
SB LTR 0.35 17.8 B LTR 0.38 18.3 B Overall Intersection - 0.58 21.3 C - 0.70 27.8 C 22. GRAND STREET AND NORFOLK STREET
Grand Street
EB L 0.17 12.0 B L 0.33 14.7 B
T 0.37 14.0 B T 0.37 14.0 B
WB T 0.41 13.5 B T 0.54 14.9 B
R 0.31 12.6 B R 0.38 13.2 B
Overall Intersection - 0.42 13.3 B - 0.54 14.3 B 23. GRAND STREET AND SUFFOLK STREET
Grand Street EB T 0.31 13.3 B T 0.31 13.3 B
WB T 0.77 21.8 C T 0.84 25.5 C
Suffolk Street SB LR 0.09 19.0 B LR 0.47 25.3 C Overall Intersection - 0.49 19.4 B - 0.69 22.9 C 24. GRAND STREET AND CLINTON STREET
Grand Street
EB TR 0.41 16.1 B LTR 0.54 18.9 B LTR 0.49 15.3 B Modify signal timing: Shift 4 s from the NB phase to EB/WB [EB/WB green time shifts from 45 s to 49 s; NB green time shifts from 28 s to 24 s; LPI phase signal timing remains the same]. Install pedestrian countdown signals to accommodate signal timing modifications during the weekday PM peak period.
WB L 0.04 11.6 B L 0.05 11.7 B L 0.04 9.7 A
T 0.63 18.7 B T 0.69 20.2 C T 0.63 16.5 B
R 1.19 127.8 F R 1.30 171.7 F R 1.17 115.0 F
Clinton Street NB LTR 0.72 35.2 D LTR 0.75 36.6 D LTR 0.77 41.9 D
Overall Intersection - 1.01 49.0 D - 1.08 58.8 E - 1.04 44.6 D 25. GRAND STREET AND EAST BROADWAY
Grand Street EB T 0.12 6.8 A T 0.13 6.8 A
Mitigation not required. WB LT 0.88 19.1 B LT 0.95 26.0 C East Broadway NB R - 16.5 C R - 16.7 B Overall Intersection - 0.88 17.5 B - 0.95 23.1 C

Chapter 21: Mitigation Measures
21-65
2022 No Action vs. 2022 With Action vs. 2022 Mitigation Weekday PM Peak Hour Traffic Levels of Service (cont’d)
Intersection & Approach
2022 No Action 2022 With Action 2022 With Action with Mitigation
Mitigation Measures Mvt. V/C Control Delay LOS Mvt. V/C
Control Delay LOS Mvt. V/C
Control Delay LOS
UNSIGNALIZED INTERSECTIONS 26. STANTON STREET AND LUDLOW STREET
Stanton Street EB TR - 7.9 A TR - 8.0 A Mitigation not required. Ludlow Street SB LT - 9.7 A LT - 9.8 A Overall Intersection - - 9.4 A - - 9.4 A 27. RIVINGTON STREET AND LUDLOW STREET
Rivington Street WB LT - 11.5 B LT - 11.6 B Mitigation not required. Ludlow Street SB TR - 11.2 B TR - 11.4 B Overall Intersection - - 11.3 B - - 11.5 B 28. BROOME STREET AND LUDLOW STREET
Broome Street EB TR - 10.9 B TR - 11.1 B Mitigation not required. Ludlow Street SB LT - 7.3 A LT - 7.3 A Overall Intersection - - 5.4 A - - 5.4 A 29. BROOME STREET AND SUFFOLK STREET
Broome Street WB LT - 15.5 C LT - 15.7 C Mitigation not required. Suffolk Street SB TR - 11.9 B TR - 16.4 C Overall Intersection - - 7.6 A - - 13.2 B 30. BROOME STREET AND CLINTON STREET
Broome Street NB LTR - 8.4 A LTR - 8.5 A Mitigation not required. Overall Intersection - - 1.4 A - - 1.5 A Notes:
(1) Control delay is measured in seconds per vehicle. (2) Overall intersection V/C ratio is the critical lane groups' V/C ratio. Denotes a significant impact.

Seward Park Mixed-Use Development
21-66
2022 No Action vs. 2022 With Action vs. 2022 Mitigation Saturday Peak Hour Traffic Levels of Service
Intersection & Approach
2022 No Action 2022 With Action 2022 With Action with Mitigation
Mitigation Measures Mvt. V/C Control Delay LOS Mvt. V/C
Control Delay LOS Mvt. V/C
Control Delay LOS
SIGNALIZED INTERSECTIONS EAST HOUSTON STREET
1. EAST HOUSTON STREET AND BOWERY
East Houston Street
EB L 0.69 39.6 D L 0.69 39.8 D L 0.69 39.5 D Modify signal timing: Shift 1 s of green time from NBL / SBL lag phase to the EB / WB phase [EB / WB green time shifts from 29 s to 30 s; NBL / SBL lag phase green time shifts from 8 s to 7 s; signal timing during all other phases remain the same].
TR 0.87 33.6 C TR 0.90 35.0 D TR 0.87 32.6 C
WB L 0.85 50.0 D L 0.85 50.1 D L 0.85 49.5 D
TR 1.01 50.6 D TR 1.04 60.2 E TR 1.00 49.2 D
Bowery
NB L 0.73 37.5 D L 0.73 37.5 D L 0.77 40.1 D
TR 0.97 45.5 D TR 0.98 46.7 D TR 0.98 46.7 D
SB L 0.57 32.8 C L 0.57 32.9 C L 0.60 34.3 C
TR 1.02 54.3 D TR 1.02 54.3 D TR 1.02 54.3 D
Overall Intersection - 0.98 44.8 D - 1.00 48.1 D - 1.00 44.5 D 2. EAST HOUSTON STREET AND CHRYSTIE STREET / SECOND AVENUE
East Houston Street
EB T 0.86 35.9 D T 0.88 37.1 D T 0.85 34.6 C Modify signal timing: Shift 1 s of green time from NB phase to the EB / WB phase and 1 s of green time from NB phase to the SB phase [EB / WB green time shifts from 26 s to 27 s; NB phase green time shifts from 21 s to 19 s; and SB phase green time shifts from 20 s to 21 s].
R 0.93 56.1 E R 0.98 67.6 E R 0.95 58.0 E
WB L 0.71 55.7 E L 0.73 57.1 E L 0.73 56.5 E
T 0.92 38.7 D T 0.95 42.3 D T 0.91 37.8 D
Chrystie Street / Second Avenue
NB L 0.51 33.8 C L 0.52 34.0 C L 0.57 37.1 D
LR 0.60 37.6 D LR 0.60 37.7 D LR 0.67 42.5 D
SB L 1.29 169.0 F L 1.31 179.0 F L 1.24 146.4 F
LT 1.28 163.6 F LT 1.31 174.2 F LT 1.25 146.4 F
R 0.98 46.9 D R 0.98 46.9 D R 0.94 40.1 D
Overall Intersection - 0.94 76.2 E - 0.95 81.0 F - 0.95 70.2 E 3. EAST HOUSTON STREET AND ALLEN STREET / FIRST AVENUE
East Houston Street
EB L 0.82 40.7 D L 0.82 40.7 D L 0.82 40.6 D Modify signal timing: Shift 1 s of green time from NB phase to the EB / WB phase [EB / WB green time shifts from 29 s to 30 s; NB phase green time shifts from 25 s to 24 s].
T 0.89 32.9 C T 0.91 34.1 C T 0.88 31.8 C
R 1.27 160.2 F R 1.27 160.2 F R 1.22 137.6 F
WB L 0.44 31.9 C L 0.44 32.1 C L 0.44 31.6 C
TR 1.13 98.3 F TR 1.17 114.9 F TR 1.13 97.9 F
Allen Street NB L 0.38 27.7 C L 0.41 28.2 C L 0.43 29.2 C
T 0.82 36.0 D T 0.84 36.7 D T 0.87 39.6 D
R 0.24 26.8 C R 0.24 26.8 C R 0.26 27.8 C
Overall Intersection - 1.00 64.6 E - 1.00 70.1 E - 0.99 62.9 E

Chapter 21: Mitigation Measures
21-67
2022 No Action vs. 2022 With Action vs. 2022 Mitigation Saturday Peak Hour Traffic Levels of Service (cont’d)
Intersection & Approach
2022 No Action 2022 With Action 2022 With Action with Mitigation
Mitigation Measures Mvt. V/C Control Delay LOS Mvt. V/C
Control Delay LOS Mvt. V/C
Control Delay LOS
SIGNALIZED INTERSECTIONS EAST HOUSTON STREET
4. EAST HOUSTON STREET AND ESSEX STREET / AVENUE A
East Houston Street
EB L 0.34 15.7 B L 0.34 16.1 B L 0.32 16.6 B Modify signal timing: Shift 1 s of green time from EB / WB phase to the EBL / WBL lead phase and 1 s of green time from EB / WB phase to the NB / SB phase [EBL / WBL lead phase green time shifts from 9 s to 10 s; EB / WB green time shifts from 32 s to 30 s; NB / SB green time shifts from 27 s to 28 s; LPI remains the same].
TR 0.80 27.8 C TR 0.83 28.7 C TR 0.89 32.0 C
WB L 0.88 40.2 D L 0.90 43.7 D L 0.90 44.5 D
T 0.84 32.2 C T 0.87 34.1 C T 0.93 40.8 D
R 0.14 20.2 C R 0.15 20.2 C R 0.16 21.7 C
Essex Street / Avenue A NB LTR 0.70 32.6 C LTR 0.73 33.4 C LTR 0.69 31.6 C SB LTR 1.08 72.8 E LTR 1.14 98.1 F LTR 1.07 68.0 E
Overall Intersection - 0.90 36.4 D - 0.94 41.2 D - 0.92 40.1 D STANTON STREET
5. STANTON STREET AND ESSEX STREET Stanton Street EB LTR 0.24 22.4 C LTR 0.24 22.5 C
Mitigation not required. Essex Street NB TR 0.30 11.7 B TR 0.32 11.9 B
SB LT 0.53 14.0 B LT 0.57 14.4 B Overall Intersection - 0.42 13.8 B - 0.44 14.2 B 6. STANTON STREET AND NORFOLK STREET
Stanton Street EB LT 0.22 16.1 B LT 0.23 16.2 B Mitigation not required. Norfolk Street NB TR 0.39 18.6 B TR 0.51 20.9 C Overall Intersection - 0.30 17.7 B - 0.37 19.4 B RIVINGTON STREET
7. RIVINGTON STREET AND ESSEX STREET Rivington Street WB LTR 0.70 35.0 C LTR 0.82 43.7 D
Mitigation not required. Essex Street NB LT 0.33 11.6 B LT 0.34 11.7 B
SB TR 0.85 35.1 D TR 0.91 40.6 D Overall Intersection - 0.78 27.6 C - 0.87 32.4 C 8. RIVINGTON STREET AND NORFOLK STREET
Rivington Street WB TR 0.47 20.0 B TR 0.49 20.4 C Mitigation not required. Norfolk Street NB LT 0.42 17.8 B LT 0.60 20.4 C Overall Intersection - 0.44 18.9 B - 0.54 20.4 C
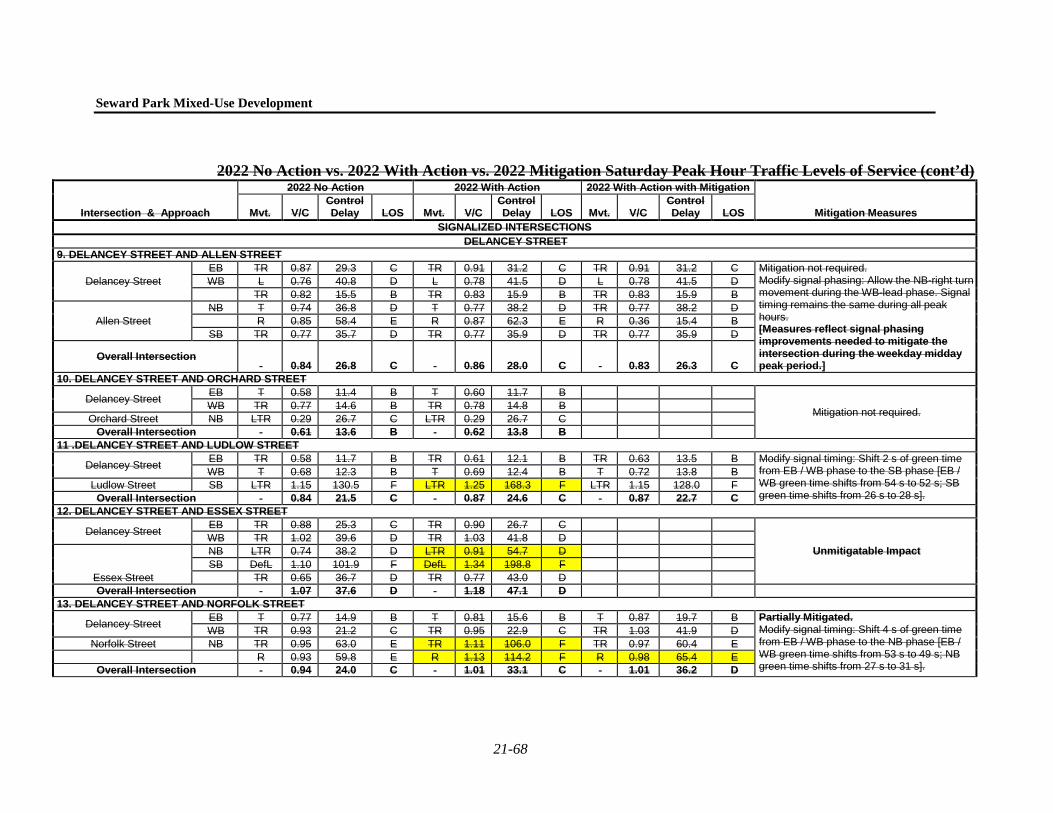
Seward Park Mixed-Use Development
21-68
2022 No Action vs. 2022 With Action vs. 2022 Mitigation Saturday Peak Hour Traffic Levels of Service (cont’d)
Intersection & Approach
2022 No Action 2022 With Action 2022 With Action with Mitigation
Mitigation Measures Mvt. V/C Control Delay LOS Mvt. V/C
Control Delay LOS Mvt. V/C
Control Delay LOS
SIGNALIZED INTERSECTIONS DELANCEY STREET
9. DELANCEY STREET AND ALLEN STREET
Delancey Street EB TR 0.87 29.3 C TR 0.91 31.2 C TR 0.91 31.2 C Mitigation not required.
Modify signal phasing: Allow the NB-right turn movement during the WB-lead phase. Signal timing remains the same during all peak hours. [Measures reflect signal phasing improvements needed to mitigate the intersection during the weekday midday peak period.]
WB L 0.76 40.8 D L 0.78 41.5 D L 0.78 41.5 D
TR 0.82 15.5 B TR 0.83 15.9 B TR 0.83 15.9 B
Allen Street NB T 0.74 36.8 D T 0.77 38.2 D TR 0.77 38.2 D
R 0.85 58.4 E R 0.87 62.3 E R 0.36 15.4 B SB TR 0.77 35.7 D TR 0.77 35.9 D TR 0.77 35.9 D
Overall Intersection - 0.84 26.8 C - 0.86 28.0 C - 0.83 26.3 C
10. DELANCEY STREET AND ORCHARD STREET
Delancey Street EB T 0.58 11.4 B T 0.60 11.7 B
Mitigation not required. WB TR 0.77 14.6 B TR 0.78 14.8 B Orchard Street NB LTR 0.29 26.7 C LTR 0.29 26.7 C Overall Intersection - 0.61 13.6 B - 0.62 13.8 B 11 .DELANCEY STREET AND LUDLOW STREET
Delancey Street EB TR 0.58 11.7 B TR 0.61 12.1 B TR 0.63 13.5 B Modify signal timing: Shift 2 s of green time from EB / WB phase to the SB phase [EB / WB green time shifts from 54 s to 52 s; SB green time shifts from 26 s to 28 s].
WB T 0.68 12.3 B T 0.69 12.4 B T 0.72 13.8 B Ludlow Street SB LTR 1.15 130.5 F LTR 1.25 168.3 F LTR 1.15 128.0 F Overall Intersection - 0.84 21.5 C - 0.87 24.6 C - 0.87 22.7 C
12. DELANCEY STREET AND ESSEX STREET
Delancey Street EB TR 0.88 25.3 C TR 0.90 26.7 C
Unmitigatable Impact WB TR 1.02 39.6 D TR 1.03 41.8 D
Essex Street
NB LTR 0.74 38.2 D LTR 0.91 54.7 D SB DefL 1.10 101.9 F DefL 1.34 198.8 F
TR 0.65 36.7 D TR 0.77 43.0 D
Overall Intersection - 1.07 37.6 D - 1.18 47.1 D 13. DELANCEY STREET AND NORFOLK STREET
Delancey Street EB T 0.77 14.9 B T 0.81 15.6 B T 0.87 19.7 B Partially Mitigated. Modify signal timing: Shift 4 s of green time from EB / WB phase to the NB phase [EB / WB green time shifts from 53 s to 49 s; NB green time shifts from 27 s to 31 s].
WB TR 0.93 21.2 C TR 0.95 22.9 C TR 1.03 41.9 D Norfolk Street NB TR 0.95 63.0 E TR 1.11 106.0 F TR 0.97 60.4 E
R 0.93 59.8 E R 1.13 114.2 F R 0.98 65.4 E
Overall Intersection - 0.94 24.0 C - 1.01 33.1 C - 1.01 36.2 D

Chapter 21: Mitigation Measures
21-69
2022 No Action vs. 2022 With Action vs. 2022 Mitigation Saturday Peak Hour Traffic Levels of Service (cont’d)
Intersection & Approach
2022 No Action 2022 With Action 2022 With Action with Mitigation
Mitigation Measures Mvt. V/C Control Delay LOS Mvt. V/C
Control Delay LOS Mvt. V/C
Control Delay LOS
SIGNALIZED INTERSECTIONS DELANCEY STREET
14. DELANCEY STREET AND SUFFOLK STREET
Delancey Street EB T 0.99 27.3 C T 1.00 29.5 C
Mitigation not required.
WB T 0.75 14.3 B T 0.75 14.4 B Delancey Street Service
Road EB TR 0.11 8.2 A TR 0.41 10.9 B Suffolk Street SB R 0.25 25.5 C R 0.33 28.0 C Overall Intersection - 0.74 21.4 C - 0.78 22.4 C 15. DELANCEY STREET AND CLINTON STREET
Delancey Street EB T 0.93 15.1 B T 0.94 15.5 B
Mitigation not required.
Williamsburg Bridge WB T 0.84 15.4 B T 0.85 15.7 B
R 0.97 54.1 D R 0.99 57.4 E
Delancey Street Service Road
EB TR 0.08 6.2 A TR 0.15 6.6 A WB TR 0.72 57.4 E TR 0.74 59.8 E Clinton Street NB R 0.09 26.7 C R 0.09 26.7 C Overall Intersection - 0.70 19.3 B - 0.70 19.8 B BROOME STREET
16. BROOME STREET AND ESSEX STREET Broome Street EB LTR 0.18 21.4 C LTR 0.25 22.6 C LTR 0.25 22.6 C Mitigation not required.
Essex Street NB TR 0.25 11.2 B TR 0.29 11.6 B TR 0.43 22.8 C Modify signal phasing: Add a new lead phase for
the SB approach. The existing signal phasing [EB phase has 31 s of green time; NB / SB phase has 49 s of green time] would be modified to the following: EB phase will have 31 s of green time, SB-lead phase will have 11 s of green time, and NB / SB phase will have 33 s of green [each phase will have 3 s amber and 2 s all red].[Measures reflect signal phasing improvements needed to mitigate the intersection during the weekday PM peak period.]
SB L 0.15 10.7 B L 0.32 13.3 B L 0.26 11.8 B
T 0.22 11.0 B T 0.22 11.0 B T 0.22 11.0 B
Overall Intersection - 0.22 12.5 B - 0.29 13.1 B - 0.39 18.7 B 17. BROOME STREET AND NORFOLK STREET
Broome Street EB L 0.12 10.3 B L 0.19 10.9 B
Mitigation not required. WB R 0.58 17.1 B R 0.62 18.1 B
Norfolk Street NB T 0.71 27.7 C T 0.88 33.3 C Overall Intersection - 0.63 21.0 C - 0.72 24.1 C

Seward Park Mixed-Use Development
21-70
2022 No Action vs. 2022 With Action vs. 2022 Mitigation Saturday Peak Hour Traffic Levels of Service (cont’d)
Intersection & Approach
2022 No Action 2022 With Action 2022 With Action with Mitigation
Mitigation Measures Mvt. V/C Control Delay LOS Mvt. V/C
Control Delay LOS Mvt. V/C
Control Delay LOS
SIGNALIZED INTERSECTIONS GRAND STREET
18. GRAND STREET AND ALLEN STREET
Grand Street EB LTR 0.96 53.4 D LTR 1.11 97.3 F LTR 0.96 49.4 D Option 1 Modify signal timing: Shift 3 s of green time from NB / SB phase to the EB / WB phase; shift 1 s from the NB / SB phase to SB-lead phase [EB / WB green time shifts from 27 s to 30 s; SB-lead phase green time shifts from 10 s to 11 s, NB / SB green time shifts from 23 s to 19 s, NB-lead phase green time remains the same].
WB LTR 0.68 36.9 D LTR 0.85 50.1 D LTR 0.76 39.0 D
Allen Street
NB L 0.55 49.7 D L 0.55 49.7 D L 0.55 49.7 D
TR 0.47 20.1 C TR 0.48 20.2 C TR 0.53 23.8 C
SB L 1.06 112.3 F L 1.08 119.4 F L 0.98 89.4 F
TR 0.60 21.9 C TR 0.60 21.9 C TR 0.66 25.0 C
Overall Intersection - 0.72 38.1 D - 0.79 48.3 D - 0.77 37.8 D
LTR 0.88 37.4 D Option 2
Modify signal phasing: The existing signal phasing [EB / WB phase has 27 s of green; SB-lead phase has 10 s of green; NBTR / SBTR phase has 23 s of green; NB-lag phase has 10 s of green] would be modified to the following: EB / WB phase will have 32 s of green time; NBL / SBL phase will have 11 s of green time; NBTR / SBTR phase will have 32 s of green time [each phase will have 3 s amber and 2 s all red]. Pedestrians are not allowed to cross during the NBL / SBL phase.
LTR 0.71 34.2 C
L 0.50 45.9 D
TR 0.57 25.8 C
L 0.98 89.4 F
TR 0.72 28.8 C
- 0.83 36.7 D
19. GRAND STREET AND ORCHARD STREET
Grand Street EB LT 0.70 22.2 C LT 0.78 24.1 C
Mitigation not required. WB TR 0.50 20.9 C TR 0.59 23.2 C Orchard Street NB LTR 0.14 15.4 B LTR 0.14 15.4 B Overall Intersection - 0.42 21.1 C - 0.46 23.1 C 20. GRAND STREET AND LUDLOW STREET
Grand Street EB TR 0.58 21.6 C TR 0.66 23.6 C
Mitigation not required. WB LT 0.35 17.8 B LT 0.47 20.0 B Ludlow Street SB LTR 0.24 16.6 B LTR 0.26 16.9 B Overall Intersection - 0.41 19.5 B - 0.46 21.2 C

Chapter 21: Mitigation Measures
21-71
2022 No Action vs. 2022 With Action vs. 2022 Mitigation Saturday Peak Hour Traffic Levels of Service (cont’d)
Intersection & Approach
2022 No Action 2022 With Action 2022 With Action with Mitigation
Mitigation Measures Mvt. V/C Control Delay LOS Mvt. V/C
Control Delay LOS Mvt. V/C
Control Delay LOS
SIGNALIZED INTERSECTIONS GRAND STREET
21. GRAND STREET AND ESSEX STREET
Grand Street
EB LTR 0.71 27.1 C LTR 0.84 35.4 D LTR 0.89 42.1 D Mitigation not required. WB LTR 0.54 18.7 B LTR 0.76 22.4 C LT 0.42 17.3 B Install "No Standing Anytime" regulation
along the north curb of the WB approach for 100-feet from the intersection to allow for two moving lanes.
- - - - - - - - R 0.34 16.7 B
Essex Street
NB LTR 0.24 16.1 B LTR 0.26 16.3 B LTR 0.26 16.3 B Restripe the WB approach from one 11-foot travel lane, one 5-foot bike lane, and one 10-foot parking lane to one 11-foot left-through lane, one 5-foot bike lane, and one 10-foot right turn lane. SB LTR 0.26 16.5 B LTR 0.29 16.9 B LTR 0.29 16.9 B
Overall Intersection - 0.49 20.4 C - 0.56 24.4 C - 0.59 24.9 C
[Measures reflect geometric improvements needed to mitigate the intersection during the weekday PM peak period.]
22. GRAND STREET AND NORFOLK STREET
Grand Street
EB L 0.15 12.1 B L 0.39 17.4 B L 0.20 12.3 B Install "No Standing Anytime" regulation along the north curb of the WB approach for 100-feet from the intersection to allow for two moving lanes.
T 0.42 14.7 B T 0.42 14.8 B T 0.42 14.8 B
WB TR 0.93 32.2 C TR 1.15 98.2 F T 0.46 14.4 B Restripe the WB approach from one 11-foot travel lane, one 5-foot bike lane, and one 10-foot parking lane to one 11-foot left-through lane, one 5-foot bike lane, and one 10-foot right turn lane.
- - - - - - - - R 0.67 18.4 B
Overall Intersection - 0.94 26.3 C - 1.15 72.1 E - 0.67 15.8 B 23. GRAND STREET AND SUFFOLK STREET
Grand Street EB T 0.41 14.7 B T 0.42 14.8 B
Mitigation not required. WB T 0.88 29.2 C T 0.96 40.7 D
Suffolk Street SB LR 0.07 18.7 B LR 0.32 22.2 C Overall Intersection - 0.54 24.5 C - 0.70 31.5 C

Seward Park Mixed-Use Development
21-72
2022 No Action vs. 2022 With Action vs. 2022 Mitigation Saturday Peak Hour Traffic Levels of Service (cont’d)
Intersection & Approach
2022 No Action 2022 With Action 2022 With Action with Mitigation
Mitigation Measures Mvt. V/C Control Delay LOS Mvt. V/C
Control Delay LOS Mvt. V/C
Control Delay LOS
SIGNALIZED INTERSECTIONS GRAND STREET
24. GRAND STREET AND CLINTON STREET
Grand Street
EB LTR 0.77 30.7 C LTR 0.92 48.8 D LTR 0.88 41.0 D Modify signal timing: Shift 1 s of green time from NB / SB phase to the EB / WB phase [EB / WB green time shifts from 45 s to 46 s; NB / SB green time shifts from 35 s to 34 s].
WB L 0.04 11.7 B L 0.05 11.7 B L 0.05 11.2 B
T 0.71 20.9 C T 0.78 23.3 C T 0.76 22.0 C
R 0.71 25.2 C R 0.83 34.9 C R 0.80 31.2 C
Clinton Street NB LTR 0.52 24.8 C LTR 0.59 27.1 C LTR 0.61 28.6 C SB LTR 0.01 16.9 B LTR 0.05 17.3 B LTR 0.05 18.0 B
Overall Intersection - 0.66 24.5 C - 0.78 31.6 C - 0.76 28.8 C 25. GRAND STREET AND EAST BROADWAY
Grand Street EB T 0.12 6.8 A T 0.13 6.9 A
Mitigation not required. WB LT 0.81 16.7 B LT 0.88 20.0 B East Broadway NB R 0.00 6.1 A R 0.00 6.1 A Overall Intersection - 0.81 15.3 B - 0.87 18.1 B UNSIGNALIZED INTERSECTIONS
26. STANTON STREET AND LUDLOW STREET Stanton Street EB TR - 8.5 A TR - 8.5 A
Mitigation not required. Ludlow Street SB LT - 10.8 B LT - 10.9 B Overall Intersection - - 10.2 B - - 10.2 B 27. RIVINGTON STREET AND LUDLOW STREET
Rivington Street WB LT - 11.8 B LT - 11.9 B Mitigation not required. Ludlow Street SB TR - 12.4 B TR - 12.5 B Overall Intersection - - 12.1 B - - 12.2 B 28. BROOME STREET AND LUDLOW STREET
Broome Street EB TR - 12.2 B TR - 12.7 B Mitigation not required. Ludlow Street SB LT - 7.3 A LT - 7.3 A Overall Intersection - - 5.6 A - - 5.6 A 29. BROOME STREET AND SUFFOLK STREET
Broome Street WB LT - 7.2 A LT - 7.2 A Mitigation not required. Suffolk Street SB TR - 11.9 B TR - 15.2 C Overall Intersection - - 0.9 A - - 4.7 A

Chapter 21: Mitigation Measures
21-73
2022 No Action vs. 2022 With Action vs. 2022 Mitigation Saturday Peak Hour Traffic Levels of Service (cont’d)
Intersection & Approach
2022 No Action 2022 With Action 2022 With Action with Mitigation
Mitigation Measures Mvt. V/C Control Delay LOS Mvt. V/C
Control Delay LOS Mvt. V/C
Control Delay LOS
UNSIGNALIZED INTERSECTIONS 30. BROOME STREET AND CLINTON STREET
Broome Street NB LTR - 10.0 B LTR - 10.2 B Mitigation not required. SB LTR - 8.1 A LTR - 8.1 A Overall Intersection - - 8.6 A - - 8.3 A Notes:
(1) Control delay is measured in seconds per vehicle. (2) Overall intersection V/C ratio is the critical lane groups' V/C ratio. Denotes a significant impact.

Seward Park Mixed-Use Development
21-74
2022 No Action vs. 2022 With Action vs. 2022 Mitigation Saturday Peak Hour Traffic Levels of Service1
Intersection & Approach
2022 No Action 2022 With Action 2022 With Action with Mitigation
Mitigation Measures Mvt. V/C Control Delay LOS Mvt. V/C
Control Delay LOS Mvt. V/C
Control Delay LOS
SIGNALIZED INTERSECTIONS EAST HOUSTON STREET
1. EAST HOUSTON STREET AND BOWERY
East Houston Street
EB L 0.69 39.7 D L 0.69 39.8 D L 0.69 39.6 D Modify signal timing: Shift 1 s of green time from NBL / SBL lag phase to the EB / WB phase [EB / WB green time shifts from 29 s to 30 s; NBL / SBL lag phase green time shifts from 8 s to 7 s; signal timing during all other phases remain the same].
TR 0.88 34.0 C TR 0.91 35.6 D TR 0.88 33.0 C
WB L 0.86 50.9 D L 0.85 51.1 D L 0.85 50.5 D
TR 1.01 52.8 D TR 1.05 62.7 E TR 1.01 51.1 D
Bowery
NB L 0.74 38.2 D L 0.74 38.2 D L 0.79 40.9 D
TR 0.98 47.0 D TR 0.98 48.1 D TR 0.98 48.1 D
SB L 0.57 32.9 C L 0.57 33.0 C L 0.60 34.5 C
TR 1.02 54.7 D TR 1.02 54.7 D TR 1.02 54.7 D
Overall Intersection - 0.99 45.9 D - 1.02 49.3 D - 1.01 45.5 D 2. EAST HOUSTON STREET AND CHRYSTIE STREET / SECOND AVENUE
East Houston Street
EB T 0.86 36.0 D T 0.88 37.3 D T 0.85 34.7 C Modify signal timing: Shift 1 s of green time from NB phase to the EB / WB phase and 1 s of green time from NB phase to the SB phase [EB / WB green time shifts from 26 s to 27 s; NB phase green time shifts from 21 s to 19 s; and SB phase green time shifts from 20 s to 21 s].
R 0.97 65.0 E R 1.03 78.4 E R 0.99 66.5 E
WB L 0.81 68.8 E L 0.81 68.8 E L 0.81 68.3 E
T 0.92 38.8 D T 0.95 42.5 D T 0.92 37.9 D
Chrystie Street / Second Avenue
NB L 0.53 34.3 C L 0.54 34.5 C L 0.62 38.7 D
LR 0.58 36.9 D LR 0.59 37.0 D LR 0.62 40.3 D
SB L 1.29 169.0 F L 1.31 179.0 F L 1.24 146.4 F
LT 1.29 164.9 F LT 1.31 175.5 F LT 1.25 147.6 F
R 0.98 46.9 D R 0.98 46.9 D R 0.94 40.1 D
Overall Intersection - 0.95 77.2 E - 0.98 82.2 F - 0.97 71.2 E 3. EAST HOUSTON STREET AND ALLEN STREET / FIRST AVENUE
East Houston Street
EB L 0.82 40.7 D L 0.82 40.8 D L 0.82 40.6 D Modify signal timing: Shift 1 s of green time from NB phase to the EB / WB phase [EB / WB green time shifts from 29 s to 30 s; NB phase green time shifts from 25 s to 24 s; signal timing during all other phases remain the same].
T 0.90 33.3 C T 0.92 34.7 C T 0.89 32.2 C
R 1.27 160.2 F R 1.27 160.2 F R 1.22 137.6 F
WB L 0.44 32.0 C L 0.44 32.2 C L 0.44 31.7 C
TR 1.14 103.6 F TR 1.18 120.0 F TR 1.14 102.2 F
Allen Street NB L 0.38 27.7 C L 0.41 28.1 C L 0.42 29.1 C
T 0.82 36.0 D T 0.84 36.7 D T 0.87 39.6 D
R 0.24 26.8 C R 0.24 26.8 C R 0.26 27.8 C
Overall Intersection - 1.08 66.3 E - 1.08 71.9 E - 0.99 64.4 E
1 This table has been revised for the FGEIS.

Chapter 21: Mitigation Measures
21-75
2022 No Action vs. 2022 With Action vs. 2022 Mitigation Saturday Peak Hour Traffic Levels of Service (cont’d)
Intersection & Approach
2022 No Action 2022 With Action 2022 With Action with Mitigation
Mitigation Measures Mvt. V/C Control Delay LOS Mvt. V/C
Control Delay LOS Mvt. V/C
Control Delay LOS
SIGNALIZED INTERSECTIONS EAST HOUSTON STREET
4. EAST HOUSTON STREET AND ESSEX STREET / AVENUE A
East Houston Street
EB L 0.34 15.8 B L 0.35 16.2 B L 0.33 16.7 B Modify signal timing: Shift 1 s of green time from EB / WB phase to the EBL / WBL lead phase and 1 s of green time from EB / WB phase to the NB / SB phase [EBL / WBL lead phase green time shifts from 9 s to 10 s; EB / WB green time shifts from 32 s to 30 s; NB / SB green time shifts from 27 s to 28 s; LPI remains the same].
TR 0.81 28.1 C TR 0.85 29.0 C TR 0.90 32.6 C
WB L 0.88 40.8 D L 0.90 44.4 D L 0.90 44.6 D
T 0.84 32.5 C T 0.88 34.5 C T 0.94 41.5 D
R 0.14 20.2 C R 0.15 20.2 C R 0.16 21.7 C
Essex Street / Avenue A NB LTR 0.70 32.6 C LTR 0.73 33.4 C LTR 0.69 31.5 C SB LTR 1.09 77.8 E LTR 1.15 103.6 F LTR 1.08 72.6 E
Overall Intersection - 0.91 37.3 D - 0.96 42.1 D - 1.01 41.1 D STANTON STREET
5. STANTON STREET AND ESSEX STREET Stanton Street EB LTR 0.24 22.4 C LTR 0.25 22.5 C
Mitigation not required. Essex Street NB TR 0.30 11.7 B TR 0.32 11.9 B
SB LT 0.53 14.0 B LT 0.57 14.5 B Overall Intersection - 0.42 13.9 B - 0.44 14.2 B 6. STANTON STREET AND NORFOLK STREET
Stanton Street EB LT 0.22 16.1 B LT 0.23 16.2 B Mitigation not required. Norfolk Street NB TR 0.39 18.7 B TR 0.52 21.1 C Overall Intersection - 0.31 17.7 B - 0.37 19.5 B

Seward Park Mixed-Use Development
21-76
2022 No Action vs. 2022 With Action vs. 2022 Mitigation Saturday Peak Hour Traffic Levels of Service (cont’d)
Intersection & Approach
2022 No Action 2022 With Action 2022 With Action with Mitigation
Mitigation Measures Mvt. V/C Control Delay LOS Mvt. V/C
Control Delay LOS Mvt. V/C
Control Delay LOS
SIGNALIZED INTERSECTIONS RIVINGTON STREET
7. RIVINGTON STREET AND ESSEX STREET Rivington Street WB LTR 0.80 40.8 D LTR 0.92 56.3 E LTR 0.86 45.2 D Shift the NB approach centerline six feet to the
east and restripe the NB approach from one 10-foot wide travel lane and one 18-foot wide travel lane with parking to one 12-foot wide travel lane and one 9-foot wide parking lane (the sidewalk along the east curb of Essex Street would be extended seven inches to the west to mitigate pedestrian impacts). Restripe the SB receiving side from one 10-foot wide travel lane and one 17-foot wide travel lane with parking to one 12-foot wide travel lane, one 11-foot wide travel lane, and one 10-foot wide parking lane. Shift the SB approach centerline six feet to the east and restripe the SB approach from one 10-foot wide travel lane and one 17-foot wide travel lane with parking to one 11-foot wide travel lane, one 12-foot wide travel lane, and one 10-foot wide parking lane (which would operate as a travel lane during the Saturday peak hour). Restripe the NB receiving side from one 10-foot wide travel lane and one 18-foot wide travel lane with parking to one 12-foot wide travel lane and one 10-foot wide parking lane. Install "No Standing 10 AM to 7 PM Saturday" regulations along the west curb of the SB approach for 250-ft. from the intersection to allow for two moving lanes. Modify signal timing: Shift 3 s of green time from NB / SB phase to the WB phase [WB green time shifts from 31 s to 34 s; NB / SB green time shifts from 49 s to 46 s].
Essex Street NB LT 0.33 11.7 B LT 0.34 11.7 B LT 0.36 13.5 B SB TR 0.92 42.2 D TR 0.98 52.6 D T 0.48 24.0 C
R 0.81 36.9 D
Overall Intersection - 0.86 32.5 C - 0.95 41.4 D - 0.83 27.8 C
8. RIVINGTON STREET AND NORFOLK STREET Rivington Street WB TR 0.57 22.4 C TR 0.60 23.2 C
Mitigation not required. Norfolk Street NB LT 0.41 17.6 B LT 0.58 20.1 C Overall Intersection - 0.49 20.3 C - 0.59 21.7 C

Chapter 21: Mitigation Measures
21-77
2022 No Action vs. 2022 With Action vs. 2022 Mitigation Saturday Peak Hour Traffic Levels of Service (cont’d)
Intersection & Approach
2022 No Action 2022 With Action 2022 With Action with Mitigation
Mitigation Measures Mvt. V/C Control Delay LOS Mvt. V/C
Control Delay LOS Mvt. V/C
Control Delay LOS
SIGNALIZED INTERSECTIONS DELANCEY STREET
9. DELANCEY STREET AND ALLEN STREET
Delancey Street EB TR 0.82 27.3 C TR 0.85 28.4 C
Mitigation not required.
WB L 0.73 38.8 D L 0.74 39.3 D
TR 0.88 17.7 B TR 0.89 18.4 B
Allen Street
NB T 0.71 34.9 C T 0.74 36.0 D
R 0.37 16.0 B R 0.37 16.1 B SB TR 0.75 34.1 C TR 0.75 34.3 C Overall Intersection - 0.84 25.1 C - 0.85 25.9 C 10. DELANCEY STREET AND ORCHARD STREET
Delancey Street EB T 0.63 14.2 B T 0.65 14.5 B
Mitigation not required. WB TR 0.77 16.9 B TR 0.78 17.1 B Orchard Street NB LTR 0.25 23.1 C LTR 0.25 23.1 C Overall Intersection - 0.58 15.9 B - 0.58 16.2 B 11 .DELANCEY STREET AND LUDLOW STREET
Delancey Street EB TR 0.63 14.5 B TR 0.66 15.0 B Unmitigatable Impact WB T 0.95 20.6 C T 0.96 21.0 C Ludlow Street SB LTR 1.15 124.3 F LTR 1.29 180.5 F Overall Intersection - 1.03 27.7 C - 1.08 33.3 C 12. DELANCEY STREET AND ESSEX STREET
Delancey Street EB TR 0.87 23.6 C TR 0.90 25.0 C
Unmitigatable Impact
WB T 1.03 41.0 D T 1.03 41.8 D
R 0.87 28.3 C R 0.97 45.2 D
Essex Street
NB LT 0.51 33.6 C LT 0.65 39.5 D
R 0.95 83.0 F R 1.46 274.0 F
SB TR 0.83 41.5 D TR 0.94 53.2 D Overall Intersection - 0.99 34.8 C - 1.12 45.3 D 13. DELANCEY STREET AND NORFOLK STREET
Delancey Street EB T 0.73 15.7 B T 0.75 16.1 B
Unmitigatable Impact WB TR 0.95 24.1 C TR 0.96 26.1 C
Norfolk Street NB TR 0.75 36.1 D TR 0.92 53.4 D
R 0.72 35.4 D R 0.93 55.1 E
Overall Intersection - 0.87 22.3 C - 0.95 26.5 C

Seward Park Mixed-Use Development
21-78
2022 No Action vs. 2022 With Action vs. 2022 Mitigation Saturday Peak Hour Traffic Levels of Service (cont’d)
Intersection & Approach
2022 No Action 2022 With Action 2022 With Action with Mitigation
Mitigation Measures Mvt. V/C Control Delay LOS Mvt. V/C
Control Delay LOS Mvt. V/C
Control Delay LOS
SIGNALIZED INTERSECTIONS DELANCEY STREET
14. DELANCEY STREET AND SUFFOLK STREET
Delancey Street EB TR 0.95 23.6 C TR 1.06 50.1 D Unmitigatable Impact WB T 0.80 17.1 B T 0.81 17.2 B Suffolk Street SB R 0.29 24.0 C R 0.38 26.7 C Overall Intersection - 0.70 20.7 C - 0.80 35.4 D 15. DELANCEY STREET AND CLINTON STREET
Delancey Street EB T 1.03 36.4 D T 1.05 43.2 D
Unmitigatable Impact
Williamsburg Bridge WB T 0.98 32.8 C T 0.99 34.5 C
R 0.78 23.1 C R 0.79 23.9 C
Delancey Street Service Road WB R 0.66 72.2 E R 0.79 101.4 F
Clinton Street NB R 1.09 97.2 F R 1.09 97.2 F Overall Intersection - 1.05 38.4 D - 1.06 42.4 D BROOME STREET
16. BROOME STREET AND ESSEX STREET Broome Street EB LTR 0.18 21.4 C LTR 0.25 22.6 C LTR 0.29 26.2 C Modify signal phasing: Add a new lead phase
for the SB approach. The existing signal phasing [EB phase has 31 s of green time; NB / SB phase has 49 s of green time] would be modified to the following: EB phase will have 27 s of green time, SB-lead phase will have 19 s of green time, and NB / SB phase will have 29 s of green [each phase will have 3 s amber and 2 s all red].
Essex Street NB TR 0.25 11.2 B TR 0.29 11.6 B TR 0.50 26.6 C SB L 1.05 73.2 E L 1.71 352.4 F L 1.04 74.4 E
T 0.26 11.6 B T 0.27 11.6 B T 0.25 9.4 A
Overall Intersection - 0.71 35.7 D - 1.15 149.0 F - 0.80 43.0 D
17. BROOME STREET AND NORFOLK STREET Broome Street EB L 0.53 15.7 B L 0.94 44.7 D
Mitigation not required.
WB R 0.14 10.5 B R 0.26 12.1 B Norfolk Street NB T 0.49 24.1 C T 0.65 26.5 C Overall Intersection - 0.52 18.1 B - 0.83 34.0 C

Chapter 21: Mitigation Measures
21-79
2022 No Action vs. 2022 With Action vs. 2022 Mitigation Saturday Peak Hour Traffic Levels of Service (cont’d)
Intersection & Approach
2022 No Action 2022 With Action 2022 With Action with Mitigation
Mitigation Measures Mvt. V/C Control Delay LOS Mvt. V/C
Control Delay LOS Mvt. V/C
Control Delay LOS
SIGNALIZED INTERSECTIONS GRAND STREET
18. GRAND STREET AND ALLEN STREET
Grand Street EB LTR 0.96 54.1 D LTR 1.11 98.8 F LTR 0.96 49.9 D Option 1 Modify signal timing: Shift 3 s of green time from NB / SB phase to the EB / WB phase and 1 s from the NB / SB phase to SB-lead phase [EB / WB green time shifts from 27 s to 30 s; SB-lead phase green time shifts from 10 s to 11 s, NB / SB green time shifts from 23 s to 19 s, NB-lead phase green time remains the same].
WB LTR 0.68 37.0 D LTR 0.86 50.8 D LTR 0.77 39.3 D
Allen Street
NB L 0.55 49.7 D L 0.55 49.7 D L 0.55 49.7 D
TR 0.47 20.1 C TR 0.48 20.2 C TR 0.53 23.8 C
SB L 1.06 112.3 F L 1.08 119.4 F L 0.98 89.4 F
TR 0.60 21.9 C TR 0.60 21.9 C TR 0.66 25.0 C
Overall Intersection - 0.73 38.2 D - 0.79 48.7 D - 0.77 38.0 D
LTR 0.88 37.6 D Option 2
Modify signal phasing: The existing signal phasing [EB / WB phase has 27 s of green; SB-lead phase has 10 s of green; NBTR / SBTR phase has 23 s of green; NB-lag phase has 10 s of green] would be modified to the following: EB / WB phase will have 32 s of green time; NBL / SBL phase will have 12 s of green time; NBTR / SBTR phase will have 31 s of green time [each phase will have 3 s amber and 2 s all red]. Pedestrians are not allowed to cross during the NBL / SBL phase.
LTR 0.72 34.5 C
L 0.45 42.9 D
TR 0.59 26.9 C
L 0.90 69.6 E
TR 0.75 30.4 C
- 0.83 35.5 D
19. GRAND STREET AND ORCHARD STREET
Grand Street EB LT 0.70 22.2 C LT 0.78 24.1 C
Mitigation not required. WB TR 0.50 21.0 C TR 0.59 23.4 C Orchard Street NB LTR 0.14 15.4 B LTR 0.14 15.4 B Overall Intersection - 0.42 21.1 C - 0.46 23.1 C 20. GRAND STREET AND LUDLOW STREET
Grand Street EB TR 0.58 21.7 C TR 0.66 23.8 C
Mitigation not required. WB LT 0.35 17.8 B LT 0.47 20.0 B Ludlow Street SB LTR 0.24 16.6 B LTR 0.26 16.9 B Overall Intersection - 0.41 19.5 B - 0.46 21.3 C

Seward Park Mixed-Use Development
21-80
2022 No Action vs. 2022 With Action vs. 2022 Mitigation Saturday Peak Hour Traffic Levels of Service (cont’d)
Intersection & Approach
2022 No Action 2022 With Action 2022 With Action with Mitigation
Mitigation Measures Mvt. V/C Control Delay LOS Mvt. V/C
Control Delay LOS Mvt. V/C
Control Delay LOS
SIGNALIZED INTERSECTIONS GRAND STREET
21. GRAND STREET AND ESSEX STREET
Grand Street EB LTR 0.78 31.4 C LTR 0.91 45.3 D LTR 0.88 40.1 D Modify signal timing: Shift 1 s of green time from NB / SB phase to the EB / WB phase [EB / WB green time shifts from 40 s to 41 s; NB/SB green time shifts from 40 s to 39 s].
WB LTR 0.54 18.7 B LTR 0.77 22.5 C LTR 0.75 21.5 C
Essex Street NB LTR 0.24 16.1 B LTR 0.26 16.3 B LTR 0.27 17.0 B SB LTR 0.26 16.5 B LTR 0.29 16.9 B LTR 0.29 17.7 B
Overall Intersection - 0.52 21.9 C - 0.60 27.6 C - 0.59 25.9 C 22. GRAND STREET AND NORFOLK STREET
Grand Street
EB L 0.10 11.2 B L 0.23 12.8 B
Mitigation not required. T 0.35 13.7 B T 0.35 13.7 B
WB T 0.34 13.0 B T 0.46 14.4 B
R 0.31 12.8 B R 0.38 13.5 B
Overall Intersection - 0.34 13.0 B - 0.46 13.8 B 23. GRAND STREET AND SUFFOLK STREET
Grand Street EB T 0.34 13.7 B T 0.34 13.7 B
Mitigation not required. WB T 0.69 19.7 B T 0.77 22.6 C Suffolk Street SB LR 0.08 18.9 B LR 0.40 23.6 C Overall Intersection - 0.44 17.8 B - 0.62 20.7 C
2022 No Action vs. 2022 With Action vs. 2022 Mitigation Saturday Peak Hour Traffic Levels of Service (cont’d)
Intersection & Approach
2022 No Action 2022 With Action 2022 With Action with Mitigation
Mitigation Measures Mvt. V/C Control Delay LOS Mvt. V/C
Control Delay LOS Mvt. V/C
Control Delay LOS
SIGNALIZED INTERSECTIONS GRAND STREET
24. GRAND STREET AND CLINTON STREET
Grand Street
EB TR 0.45 16.8 B LTR 0.57 19.5 B Unmitigatable Impact
Install pedestrian countdown signals to accommodate signal timing modifications during the weekday PM peak period.
WB L 0.05 11.7 B L 0.05 11.8 B
T 0.57 17.9 B T 0.64 19.4 B
R 1.01 63.7 E R 1.36 200.0 F Clinton Street NB LTR 0.65 33.1 C LTR 0.68 34.3 C Overall Intersection - 0.88 33.1 C - 1.10 68.2 E 25. GRAND STREET AND EAST BROADWAY

Chapter 21: Mitigation Measures
21-81
Grand Street EB T 0.12 6.8 A T 0.13 6.9 A
Mitigation not required. WB LT 0.81 16.7 B LT 0.88 20.2 C East Broadway NB R - 11.5 B R - 11.6 B Overall Intersection - 0.81 15.1 B - 0.88 18.1 B UNSIGNALIZED INTERSECTIONS
26. STANTON STREET AND LUDLOW STREET Stanton Street EB TR - 8.5 A TR - 8.6 A
Mitigation not required. Ludlow Street SB LT - 10.8 B LT - 11.0 B Overall Intersection - - 10.2 B - - 10.3 B 27. RIVINGTON STREET AND LUDLOW STREET
Rivington Street WB LT - 14.4 B LT - 14.6 B Mitigation not required. Ludlow Street SB TR - 13.4 B TR - 13.7 B Overall Intersection - - 13.9 B - - 14.2 B 28. BROOME STREET AND LUDLOW STREET
Broome Street EB TR - 12.2 B TR - 12.7 B Mitigation not required. Ludlow Street SB LT - 7.3 A LT - 7.3 A Overall Intersection - - 5.5 A - - 5.6 A 29. BROOME STREET AND SUFFOLK STREET
Broome Street WB LT - 7.7 A LT - 7.7 A Mitigation not required. Suffolk Street SB TR - 11.1 B TR - 14.9 B Overall Intersection - - 4.3 A - - 10.8 B

Seward Park Mixed-Use Development
21-82
2022 No Action vs. 2022 With Action vs. 2022 Mitigation Saturday Peak Hour Traffic Levels of Service (cont’d)
Intersection & Approach
2022 No Action 2022 With Action 2022 With Action with Mitigation
Mitigation Measures Mvt. V/C Control Delay LOS Mvt. V/C
Control Delay LOS Mvt. V/C
Control Delay LOS
UNSIGNALIZED INTERSECTIONS 30. BROOME STREET AND CLINTON STREET
Broome Street NB LTR - 8.5 A LTR - 8.5 A Mitigation not required. Overall Intersection - - 1.3 A - - 1.4 A Notes:
(1) Control delay is measured in seconds per vehicle. (2) Overall intersection V/C ratio is the critical lane groups' V/C ratio. Denotes a significant impact.