Embed Size (px)
DESCRIPTION
Chapter 3. Ecosystems: What Are They and How Do They Work?. Core Case Study: Have You Thanked the Insects Today?. Many plant species depend on insects for pollination. Insect can control other pest insects by eating them. Figure 3-1. Core Case Study: Have You Thanked the Insects Today?. - PowerPoint PPT Presentation
Citation preview

Chapter 3
Ecosystems: What Are They and How Do They
Work?

Core Case Study: Have You Thanked the Insects
Today? Many plant species depend on insects for
pollination. Insect can control other pest insects by
eating them
Figure 3-1

Core Case Study: Have You Thanked the Insects
Today? …if all insects disappeared, humanity
probably could not last more than a few months [E.O. Wilson, Biodiversity expert]. Insect’s role in nature is part of the larger
biological community in which they live.

THE NATURE OF ECOLOGY
Ecology is a study of connections in nature. How organisms
interact with one another and with their nonliving environment.
Figure 3-2

Ecology‣ Ecology: the study of the relationships between
organisms & the abiotic (nonliving) and biotic (living) environment.
The physical conditions influence the habitat in which an organism lives. These include:
substrate
humidity
sunlight
temperature
salinity
pH (acidity)
exposure
altitude
depth
Each abiotic (or physical) factor may be well suited to the organism or it may present it with problems to overcome.
O2
Nutrients
CO2

Fig. 3-2, p. 51
Communities
Subatomic Particles
Atoms
Molecules
Protoplasm
Cells
Tissues
Organs
Organ systems
Organisms
Populations
Populations
Communities
Ecosystems
Biosphere
Earth
Planets
Solar systems
Galaxies
Universe
Organisms
Realm of ecology
Ecosystems
Biosphere

‣Living organisms can be studied at different levels of complexity.
‣From least to most complex, these levels are (in an ecological context):
Individual
Population
Community
Ecosystem
Biome
Biosphere
Biological Complexity
Biosphere
Biome
Ecosystem
Community
Population
Individual

Organisms and Species Organisms, the different forms of life on
earth, can be classified into different species based on certain characteristics.
Figure 3-3

Fig. 3-3, p. 52
Insects751,000
Other animals281,000
Fungi69,000
Prokaryotes4,800
Plants248,400
Protists57,700
Known species1,412,000

Case Study: Which Species Run the World?
Multitudes of tiny microbes such as bacteria, protozoa, fungi, and yeast help keep us alive. Harmful microbes are the minority. Soil bacteria convert nitrogen gas to a usable
form for plants. They help produce foods (bread, cheese, yogurt,
beer, wine). 90% of all living mass. Helps purify water, provide oxygen, breakdown
waste. Lives beneficially in your body (intestines, nose).

Populations, Communities, and Ecosystems
Members of a species interact in groups called populations.
Populations of different species living and interacting in an area form a community.
A community interacting with its physical environment of matter and energy is an ecosystem.

Populations
A population is a group of interacting individuals of the same species occupying a specific area. The space an
individual or population normally occupies is its habitat.
Figure 3-4

Populations
Genetic diversity In most natural
populations individuals vary slightly in their genetic makeup.
Figure 3-5

Community
The population of all species living & interacting in an area.

Ecosystems Ecosystems consist of nonliving (abiotic) and
living (biotic) components.
Figure 3-10

The biosphere is the region within which all living things are found on Earth, extending from the bottom of the oceans to the upper atmosphere.
The biosphere is but one of the four separate components of the geochemical model along with the lithosphere, hydrosphere, and atmosphere.
The Gaia Hypothesis maintains that the Earth is a single self-regulating complex evolving system. An example being the exchange of elements between oceans and land.
The Biosphere

THE EARTH’S LIFE SUPPORT SYSTEMS
The biosphere consists of several physical layers that contain: Air Water Soil Minerals Life
Figure 3-6

Biosphere
Atmosphere Membrane of air around the planet.
Stratosphere Lower portion contains ozone to filter out most of
the sun’s harmful UV radiation. Hydrosphere
All the earth’s water: liquid, ice, water vapor Lithosphere
The earth’s crust and upper mantle.

Fig. 3-6, p. 54
Lithosphere (crust, top of upper mantle)
RockSoil
Vegetation and animals
Atmosphere
OceanicCrust
Continental Crust
LithosphereUpper mantle
AsthenosphereLower mantle
Mantle
Core
Biosphere
Crust
Crust (soil and rock)
Biosphere (living and dead
organisms)
Hydrosphere (water)
Atmosphere (air)

An organism’s habitat is the physical place or environment in which it lives.
Organisms show a preference for a particular habitat type, but some are more specific in their requirements than others.
Habitat
Lichens, fungi & algae or bacteria, are found on rocks, trees, and bare ground.
Most frogs, like this leopard frog, live in or near fresh water, but a few can survive in
arid habitats.

Habitat NeedsCover – shelter; trees, shrubs,
etc.WaterNutrients

Macronutrients
Chemicals organisms need in large numbers to live, grow, and reproduce.
Ex. carbon, oxygen, hydrogen, nitrogen, calcium, and iron.

Micronutrients
These are needed in small or even trace amounts.
Ex. sodium, zinc copper, chlorine, and iodine.

Habitat The ecological niche
describes the functional position of an organismin its environment.
A niche comprises:the habitat in which the organism lives.
the organism’s activity pattern: the periods of time during which it is active.
the resources it obtainsfrom the habitat.
Ecological Niche
Adaptations
Activitypatterns
Presence of other organisms
Physicalconditions
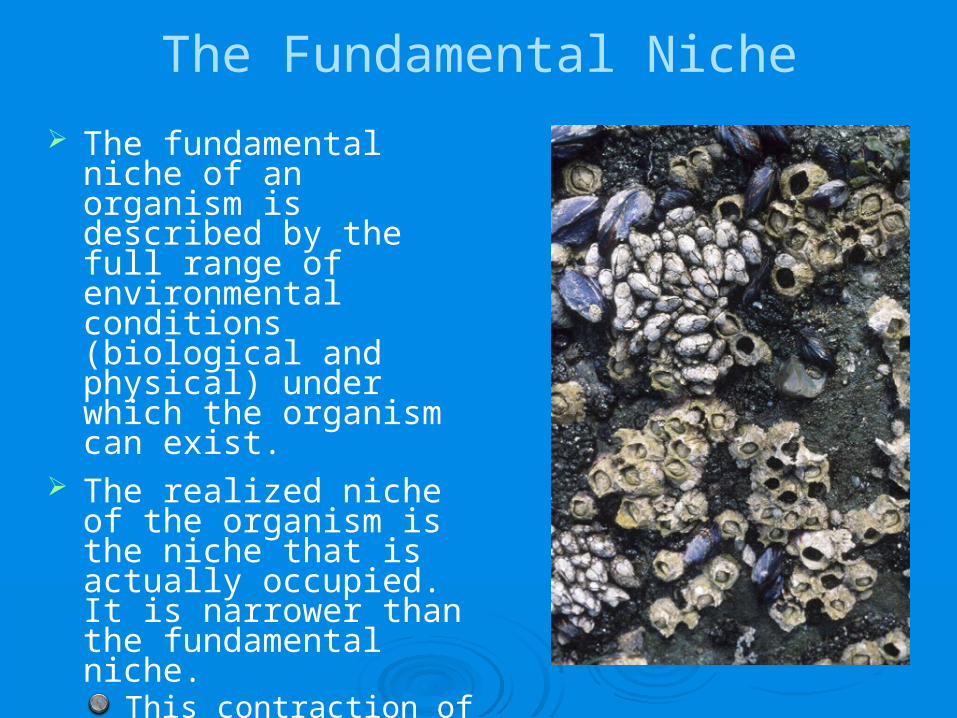
The fundamental niche of an organism is described by the full range of environmental conditions (biological and physical) under which the organism can exist.
The realized niche of the organism is the niche that is actually occupied. It is narrower than the fundamental niche.
This contraction of the realized niche is a result of pressure from, and interactions with, other organisms.
The Fundamental Niche

Factors That Limit Population Growth Availability of matter and energy resources
can limit the number of organisms in a population.
Figure 3-11

The law of tolerance states that “For each abiotic factor, an organism has a range of tolerances within which it can survive.”
Law of Tolerance
Tolerance range
Optimum range
Unavailable niche
Marginal niche
Nu
mb
er
of
org
an
ism
s
Preferred niche
Marginal niche
Unavailable niche
Examples of abiotic factors that influence size of the realized niche
Too
acidicpH Too
alkaline
Too cold Temperature Too hot

Factors That Limit Population Growth
The physical conditions of the environment can limit the distribution of a species.
Figure 3-12

Limited ResourcesA population can grow until competition
for limited resources increases & the carrying capacity (C.C.) is reached.
Population Growth Cycle

Typical Phases1. The population overshoots the C.C.2. This is because of a reproductive
time lag (the period required for the birth rate to fall & the death rate to rise).
3. The population has a dieback or crashes.
4. The carrying capacity is reached.
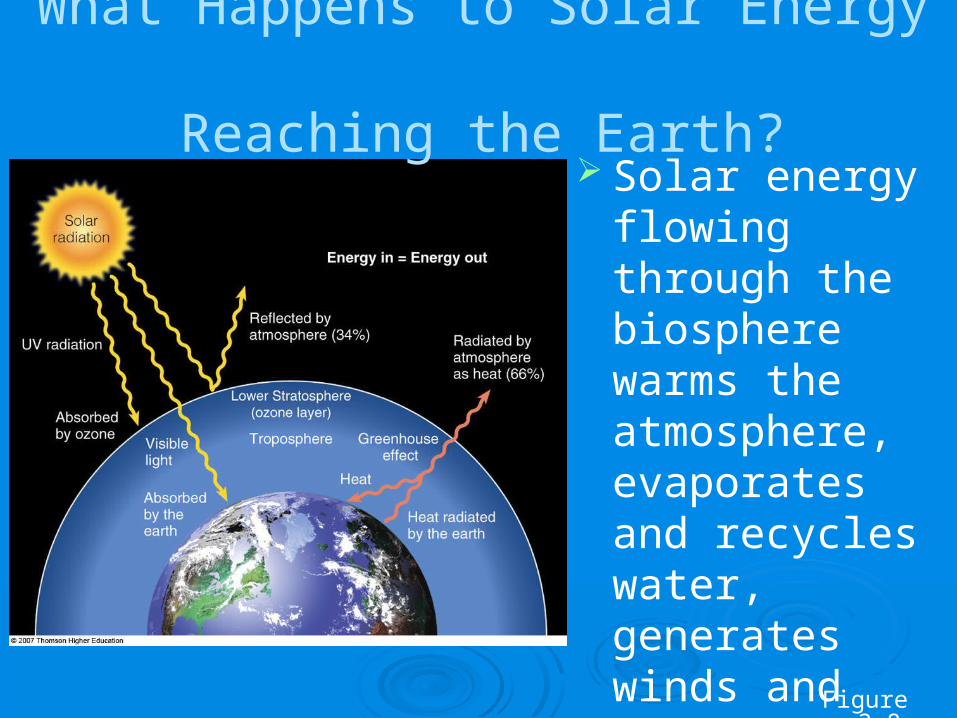
What Happens to Solar Energy Reaching the Earth?
Solar energy flowing through the biosphere warms the atmosphere, evaporates and recycles water, generates winds and supports plant growth.
Figure 3-8
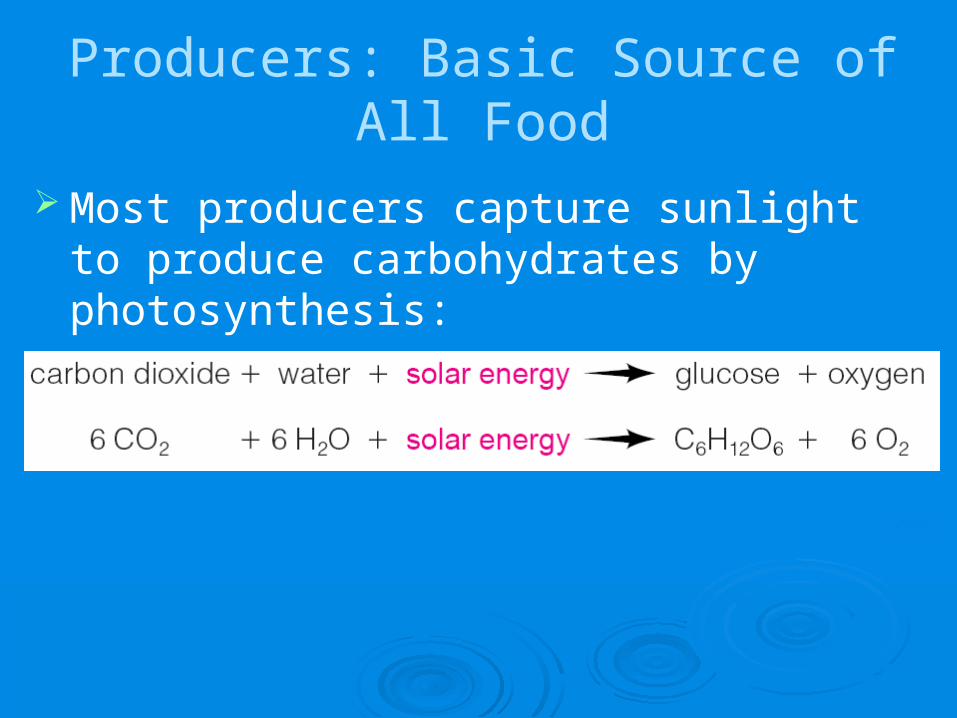
Producers: Basic Source of All Food
Most producers capture sunlight to produce carbohydrates by photosynthesis:

Producers: Basic Source of All Food
Chemosynthesis: Some organisms such as deep ocean bacteria
draw energy from hydrothermal vents and produce carbohydrates from hydrogen sulfide (H2S) gas .

Photosynthesis: A Closer Look
Chlorophyll molecules in the chloroplasts of plant cells absorb solar energy.
This initiates a complex series of chemical reactions in which carbon dioxide and water are converted to sugars and oxygen.
Figure 3-A

Fig. 3-A, p. 59
Sun
Chloroplastin leaf cell
Light-dependentReaction
Light-independent
reaction
Chlorophyll
Energy storage and release
(ATP/ADP)
Glucose
H2O
Sunlight
O2
CO2
6CO2 + 6 H2O C6H12O6 + 6 O2

Consumers: Eating and Recycling to Survive
Consumers (heterotrophs) get their food by eating or breaking down all or parts of other organisms or their remains. Herbivores
• Primary consumers that eat producers Carnivores
• Primary consumers eat primary consumers• Third and higher level consumers: carnivores that eat
carnivores. Omnivores
• Feed on both plant and animals.

Decomposers and Detrivores
Decomposers: Recycle nutrients in ecosystems. Detrivores: Insects or other scavengers that feed
on wastes or dead bodies.Figure 3-13

Fig. 3-13, p. 61
Scavengers
Powder broken down by decomposers into plant nutrients in soil
Bark beetle engraving
Decomposers
Long-horned beetle holes
Carpenter ant
galleries
Termite and
carpenter ant work Dry rot
fungus
Wood reduced to powder
Mushroom
Time progression

Aerobic and Anaerobic Respiration: Getting Energy for Survival
Organisms break down carbohydrates and other organic compounds in their cells to obtain the energy they need.
This is usually done through aerobic respiration. The opposite of photosynthesis
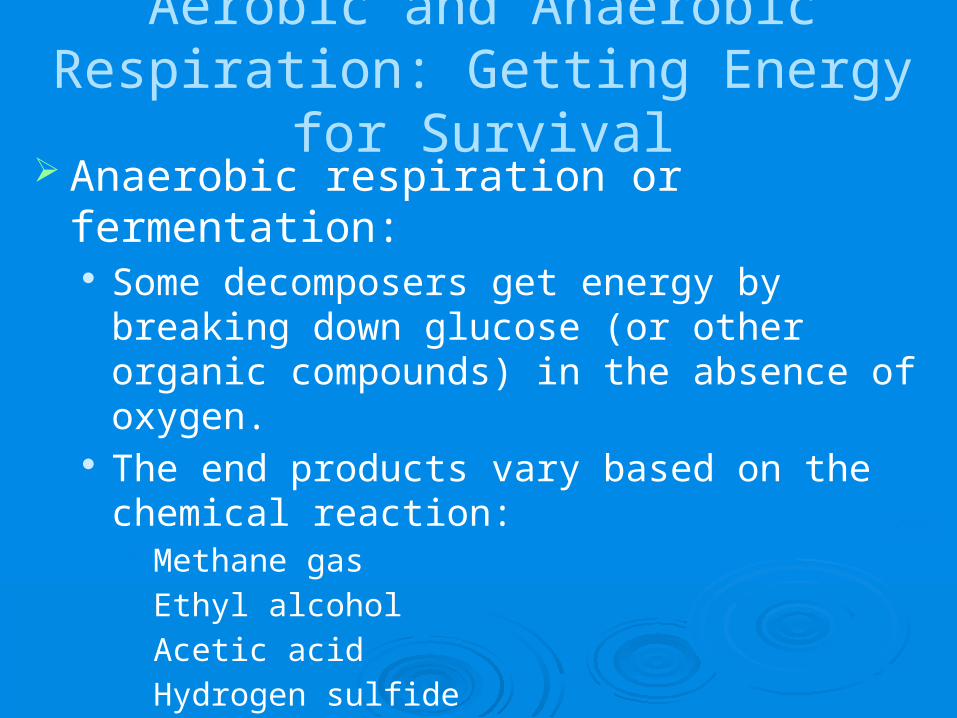
Aerobic and Anaerobic Respiration: Getting Energy for Survival
Anaerobic respiration or fermentation: Some decomposers get energy by breaking
down glucose (or other organic compounds) in the absence of oxygen.
The end products vary based on the chemical reaction:• Methane gas• Ethyl alcohol• Acetic acid• Hydrogen sulfide

Two Secrets of Survival: Energy Flow and Matter Recycle
An ecosystem survives by a combination of energy flow and matter recycling.
Figure 3-14

Decomposition
As plant or animal matter dies it will break down and return the chemicals back to the soil.
This happens very quickly in tropical rainforest which results in low-nutrient soils.
Grasslands have the deepest and most nutrient rich of all soils

BIODIVERSITY
Figure 3-15

Biodiversity Loss and Species Extinction: Remember HIPPO
H for habitat destruction and degradation I for invasive species P for pollution P for human population growth O for overexploitation

Biodiversity Loss and Species Extinction: Remember HIPPCO
H for habitat destruction and degradation I for invasive species P for pollution P for human population growth C for Climate Change O for overexploitation

Why Should We Care About Biodiversity?
Biodiversity provides us with: Natural Resources (food water, wood, energy,
and medicines) Natural Services (air and water purification, soil
fertility, waste disposal, pest control) Aesthetic pleasure

Solutions
Goals, strategies and tactics for protecting biodiversity.
Figure 3-16

ENERGY FLOW IN ECOSYSTEMS
Food chains and webs show how eaters, the eaten, and the decomposed are connected to one another in an ecosystem.
Figure 3-17

Food Webs
Trophic levels are interconnected within a more complicated food web.
Figure 3-18

Energy Flow in an Ecosystem: Losing Energy in Food Chains and Webs
In accordance with the 2nd law of thermodynamics, there is a decrease in the amount of energy available to each succeeding organism in a food chain or web.

Energy Flow in an Ecosystem: Losing Energy in Food Chains and Webs
Ecological efficiency: percentage of useable energy transferred as biomass from one trophic level to the next.
Figure 3-19

10% Rule
We assume that 90% of the energy at each energy level is lost because the organism uses the energy. (heat)
It is more efficient to eat lower on the energy pyramid. You get more out of it!
This is why top predators are few in number & vulnerable to extinction.

Productivity of Producers: The Rate Is Crucial
Gross primary production (GPP) Rate at which an
ecosystem’s producers convert solar energy into chemical energy as biomass.
Figure 3-20

Net Primary Production (NPP)
NPP = GPP – R Rate at which
producers use photosynthesis to store energy minus the rate at which they use some of this energy through respiration (R).
Figure 3-21

What are nature’s three most productive and three least productive systems?
Figure 3-22
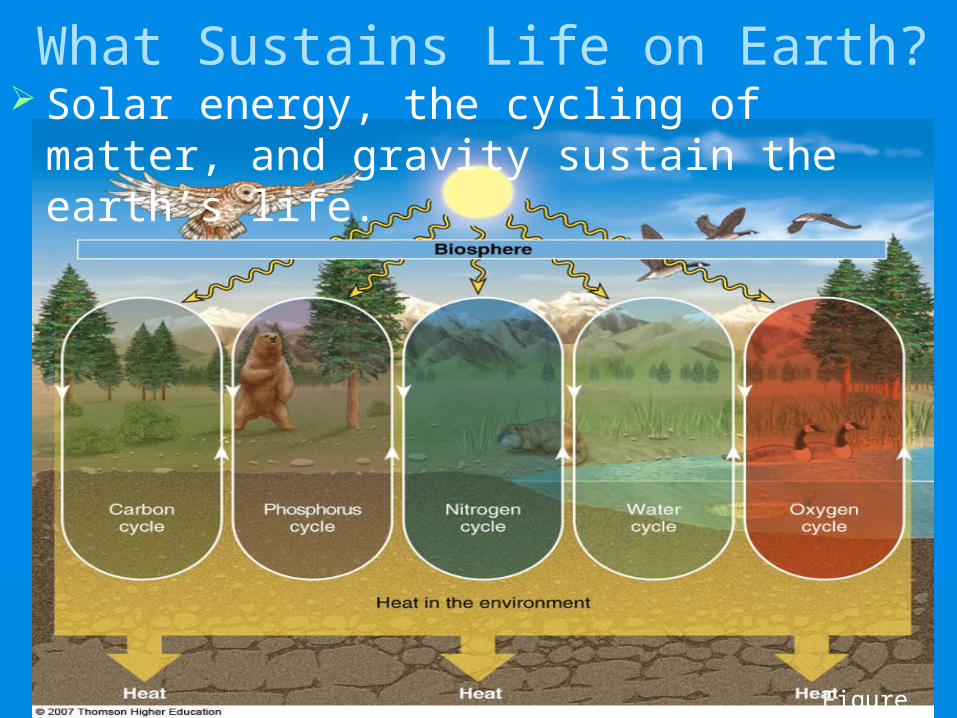
What Sustains Life on Earth? Solar energy, the cycling of matter, and gravity
sustain the earth’s life.
Figure 3-7

MATTER CYCLING IN ECOSYSTEMS
Nutrient Cycles: Global Recycling Global Cycles recycle nutrients through the
earth’s air, land, water, and living organisms. Nutrients are the elements and compounds that
organisms need to live, grow, and reproduce. Biogeochemical cycles move these substances
through air, water, soil, rock and living organisms.
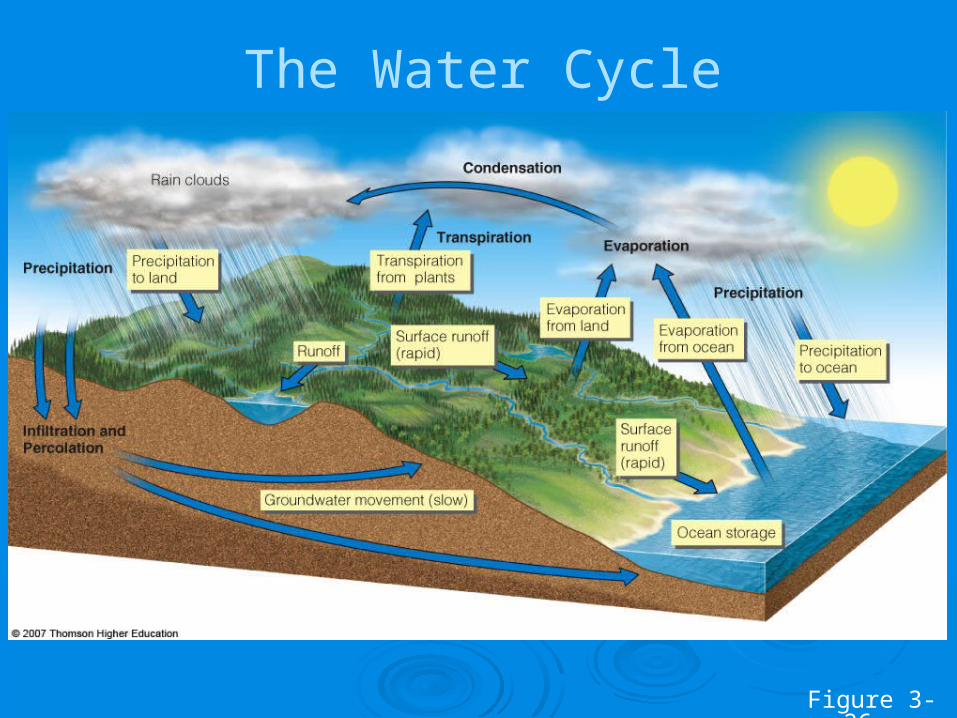
The Water Cycle
Figure 3-26

Water’ Unique Properties There are strong forces of attraction between
molecules of water. Water exists as a liquid over a wide
temperature range. Liquid water changes temperature slowly. It takes a large amount of energy for water to
evaporate. Liquid water can dissolve a variety of
compounds. Water expands when it freezes.

Effects of Human Activities on Water Cycle
We alter the water cycle by: Withdrawing large amounts of freshwater. Clearing vegetation and eroding soils. Polluting surface and underground water. Contributing to climate change.

The Carbon Cycle:Part of Nature’s Thermostat
Figure 3-27

The Carbon Cycle


Effects of Human Activities on Carbon Cycle
We alter the carbon cycle by adding excess CO2 to the atmosphere through: Burning fossil fuels. Clearing vegetation
faster than it is replaced.
Figure 3-28
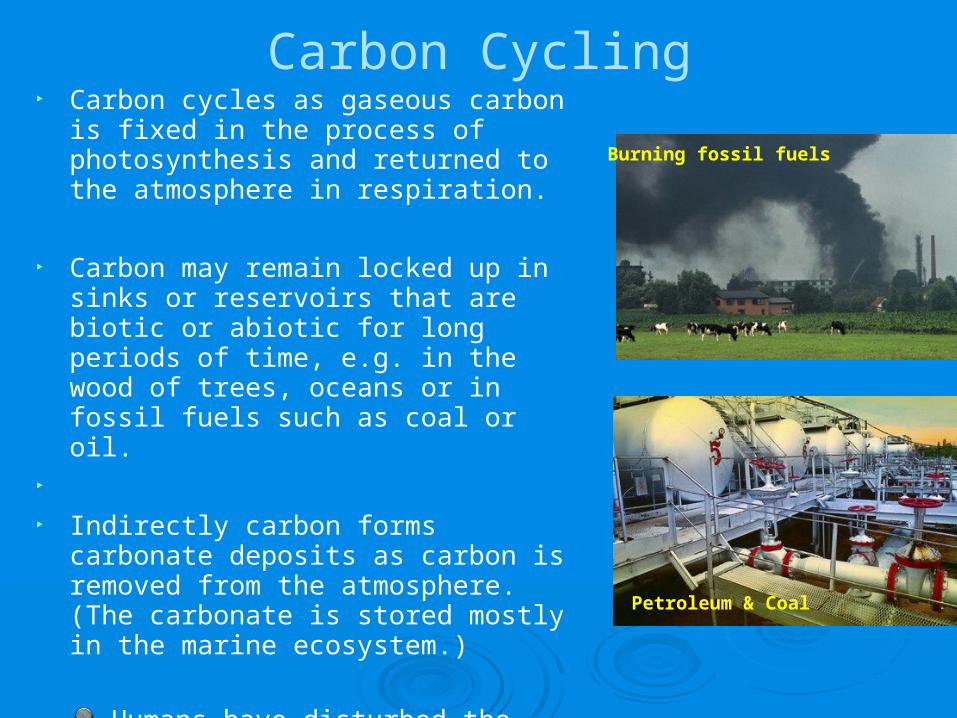
‣ Carbon cycles as gaseous carbon is fixed in the process of photosynthesis and returned to the atmosphere in respiration.
‣ Carbon may remain locked up in sinks or reservoirs that are biotic or abiotic for long periods of time, e.g. in the wood of trees, oceans or in fossil fuels such as coal or oil.
‣ ‣ Indirectly carbon forms carbonate deposits
as carbon is removed from the atmosphere. (The carbonate is stored mostly in the marine ecosystem.)
Humans have disturbed the balance of the carbon cycle through activities such as combustion and deforestation.
Carbon Cycling
Burning fossil fuels
Petroleum & Coal

The Nitrogen Cycle: Bacteria in Action
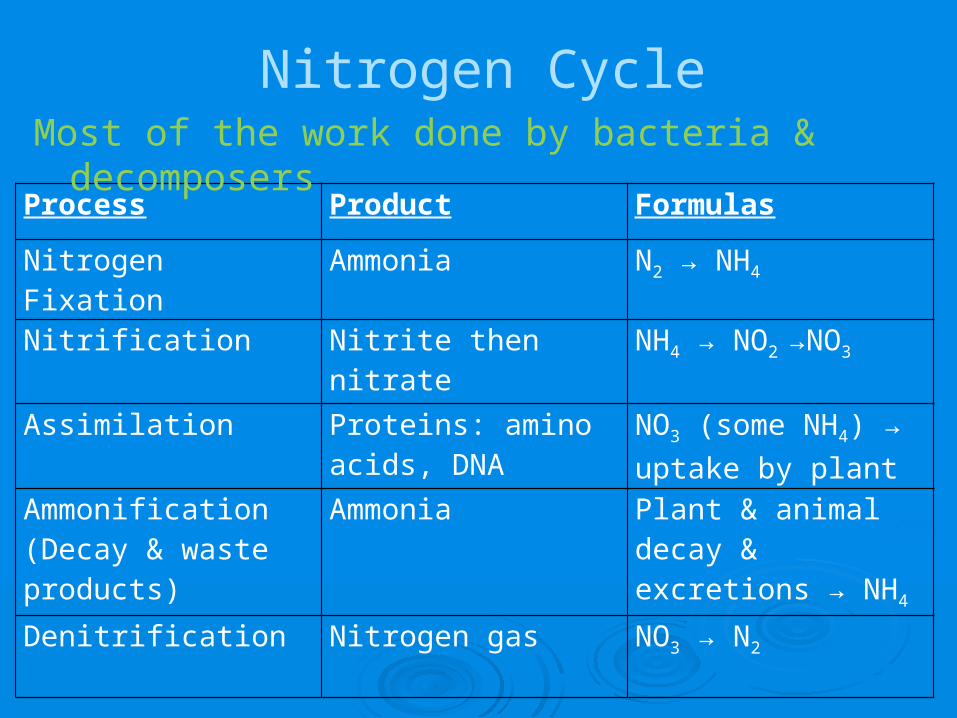
Nitrogen Cycle
Process Product Formulas
Nitrogen Fixation Ammonia N2 → NH4
Nitrification Nitrite then nitrate NH4 → NO2 →NO3
Assimilation Proteins: amino acids, DNA
NO3 (some NH4) → uptake by plant
Ammonification (Decay & waste products)
Ammonia Plant & animal decay & excretions → NH4
Denitrification Nitrogen gas NO3 → N2
Most of the work done by bacteria & decomposers

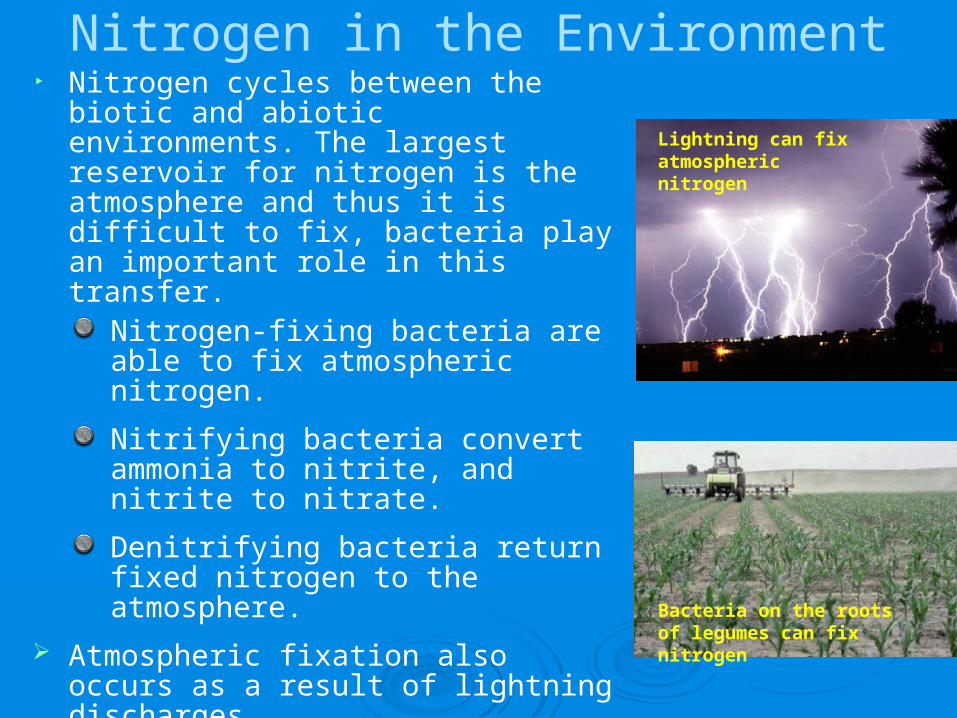
Nitrogen in the Environment‣ Nitrogen cycles between the biotic and
abiotic environments. The largest reservoir for nitrogen is the atmosphere and thus it is difficult to fix, bacteria play an important role in this transfer.
Nitrogen-fixing bacteria are able to fix atmospheric nitrogen.
Nitrifying bacteria convert ammonia to nitrite, and nitrite to nitrate.
Denitrifying bacteria return fixed nitrogen to the atmosphere.
Atmospheric fixation also occurs as a result of lightning discharges.
‣ Humans intervene in the nitrogen cycle by producing and applying nitrogen (nitrates) fertilizers which is the main cause of eutrophication.
Lightning can fix atmospheric nitrogen
Bacteria on the roots of legumes can fix nitrogen

Effects of Human Activities on the Nitrogen Cycle
We alter the nitrogen cycle by: Adding gases that contribute to acid rain. Adding nitrous oxide to the atmosphere through
farming practices which can warm the atmosphere and deplete ozone.
Contaminating ground water from nitrate ions in inorganic fertilizers.
Releasing nitrogen into the troposphere through deforestation.

Effects of Human Activities on the Nitrogen Cycle
Human activities such as production of fertilizers now fix more nitrogen than all natural sources combined.
Figure 3-30

Fig. 3-31, p. 77
Dissolvedin Ocean
Water
Marine Sediments Rocks
uplifting overgeologic time
settling out weatheringsedimentation
LandFoodWebs
Dissolvedin Soil Water,Lakes, Rivers
death,decomposition
uptake byautotrophs
agriculture
leaching, runoff
uptake byautotrophs
excretion
death,decomposition
mining Fertilizer
weathering
Guano
MarineFoodWebs
The Phosphorous Cycle

Phosphorus Cycling Phosphorus cycling is very slow and
tends to be local and stable; in aquatic and terrestrial ecosystems, phosphorous is a sedimentary cycle.
Phosphorous is lost from ecosystems through run-off, precipitation, and sedimentation.
A very small amount of phosphorus returns to the land as guano (manure of fish-eating birds). Weathering and phosphatizing bacteria return phosphorus to the soil.
Often the Limiting factor in the ecosystem
The phosphorous cycle has no real significant gas phase and under many conditions will form stable insoluble compounds
Deposition as guano…
Loss via sedimentation…
Fertilizer production

Effects of Human Activities on the Phosphorous Cycle
We remove large amounts of phosphate from the earth to make fertilizer.
We reduce phosphorous in tropical soils by clearing forests.
We add excess phosphates to aquatic systems from runoff of animal wastes and fertilizers contributing to eutrophication

The Sulfur Cycle
Figure 3-32

Fig. 3-32, p. 78
Hydrogen sulfide
Sulfur
Sulfate salts
Decaying matter
Animals
Plants
Ocean
IndustriesVolcano
Hydrogen sulfideOxygen
Dimethyl sulfide
Ammoniumsulfate
Ammonia
Acidic fog and precipitationSulfuric acid
WaterSulfurtrioxide
Sulfur dioxide
Metallicsulfidedeposits

Sulfur Cycling Sulfur is naturally occurring in rock or
mineral forms and is a sedimentary cycle.
Sulfur is an essential component of proteins and is important in determining the acidity of precipitation, surface water, and soil.
Sulfur circulates through the biosphere as:
hydrogen sulfide (H2S), sulfur dioxide (SO2), sulfate (SO4
2-), and elemental sulfur (S)
Sulfur in petrol
Molecular bridges in proteins
Elemental sulfur

Effects of Human Activities on the Sulfur Cycle
We add sulfur dioxide to the atmosphere by: Burning coal and oil Refining sulfur containing petroleum. Convert sulfur-containing metallic ores into free
metals such as copper, lead, and zinc releasing sulfur dioxide into the environment.

HOW DO ECOLOGISTS LEARN ABOUT ECOSYSTEMS?
Ecologist go into ecosystems to observe, but also use remote sensors on aircraft and satellites to collect data and analyze geographic data in large databases. Geographic Information Systems Remote Sensing
Ecologists also use controlled indoor and outdoor chambers to study ecosystems

Geographic Information Systems (GIS)
A GIS organizes, stores, and analyzes complex data collected over broad geographic areas.
Allows the simultaneous overlay of many layers of data.
Figure 3-33

Fig. 3-33, p. 79
Critical nesting sitelocations
USDA Forest ServiceUSDA
Forest ServicePrivateowner 1 Private owner 2
Topography
Habitat type
LakeWetlandForest
Grassland
Real world

Systems Analysis
Ecologists develop mathematical and other models to simulate the behavior of ecosystems.
Figure 3-34

Fig. 3-34, p. 80
SystemsMeasurement
Define objectivesIdentify and inventory variablesObtain baseline data on variables
Make statistical analysis of relationships among variables
Determine significant interactions
Objectives Construct mathematical model describing interactions among variables
Run the model on a computer, with values entered for differentVariables
Evaluate best ways to achieve objectives
DataAnalysis
SystemModeling
SystemSimulation
SystemOptimization

Importance of Baseline Ecological Data
We need baseline data on the world’s ecosystems so we can see how they are changing and develop effective strategies for preventing or slowing their degradation. Scientists have less than half of the basic
ecological data needed to evaluate the status of ecosystems in the United Sates (Heinz Foundation 2002; Millennium Assessment 2005).