Embed Size (px)
Citation preview
Sioux Falls Regional Airport – Joe Foss Field Master Plan Update
Chapter 3 - Aviation Forecasts September 26, 2014
1
Chapter 3: Aviation Forecasts
Introduction The Aviation Forecasts chapter of the Airport Master Plan analyzes current and future airport activity at the Sioux Falls Regional Airport (FSD). Forecasting provides an airport with a general idea of the magnitude of growth, as well as fluctuations in activity anticipated over a 20-year forecast period. They assist the Airport in determining existing and planned future facility needs based on airport activity level estimates and projections. Forecasts attempt to develop a realistic estimate of future changes. When conditions dramatically change, forecasts should be reviewed and updated.
FSD has experienced strong growth in passenger enplanements over the last few years as a result of new airline service and lower air fares. The forecasts developed for the Airport will be important to adequately plan, size, and sequence development of future facilities to meet future projected growth. Development at airports, however, is demand-based from actual numbers rather than forecasts.
To thoroughly analyze and develop a probable aviation forecast, a technical review has been completed using several methods to help quantify the potential aviation activity over the next 20 years. Appendix X, Aviation Forecasts contains more detail on the processes and data used to prepare the various forecast types summarized in this section.
Forecast Rationale Forecasting the demand for airport services is a critical step in the development of an airport. It allows an airport to examine its ability to satisfy the needs of the aircraft and people it serves, and to determine the approximate timing of necessary improvements by projecting airport user activity levels.
Forecasts developed for airport master plans and/or federal grants must be approved by the Federal Aviation Administration (FAA). It is the FAA’s policy, listed in Advisory Circular 150/5070-6B, Airport Master Plans, that FAA approval of forecasts at non-hub airports with commercial service should be consistent with the Terminal Area Forecasts (TAF). Master plan forecasts for operations, based aircraft and enplanements are considered to be consistent with the TAF if they meet the following criteria:
1. Forecasts differ by less than 10 percent in the five-year forecast and 15 percent in the 10-year or 20-year period, or
2. Forecasts do not affect the timing or scale of an airport project, or 3. Forecasts do not affect the role of the airport as defined in the current version of FAA
Order 5090.3, Field Formulation of the National Plan of Integrated Airport Systems.
Airport Master Plan Update Sioux Falls Regional Airport (FSD)
3-2
The TAF model used for this report is from the 2012 FAA TAF available in January 2013. This is latest data available when the forecasting effort began for this airport master plan.
Furthermore, in FAA Order 5090.3C, Field Formulation of the National Plan of Integrated Airport Systems (NPIAS), states forecasts should be:
1. Realistic 2. Based on the latest available data 3. Reflect the current conditions at the airport 4. Supported by information in the study 5. Provide an adequate justification for the airport planning and development
Factors Affecting Forecasts FAA provides general guidance in evaluating factors that affect aviation activity. FAA AC 150-5070-6B, Airport Master Plans, states:
Planners preparing forecasts of demand or updating existing forecasts should consider socioeconomic data, demographics, disposable income, geographic attributes, and external factors such as fuel costs and local attitudes towards aviation.
For purposes of this forecast, the following defining factors have been used to develop the forecast:
1. Fiscal year 2013 has been used as the base year for most of the aviation forecast projections.
2. The most recent 2013 estimates and future projections of population, employment and income trends have been utilized.
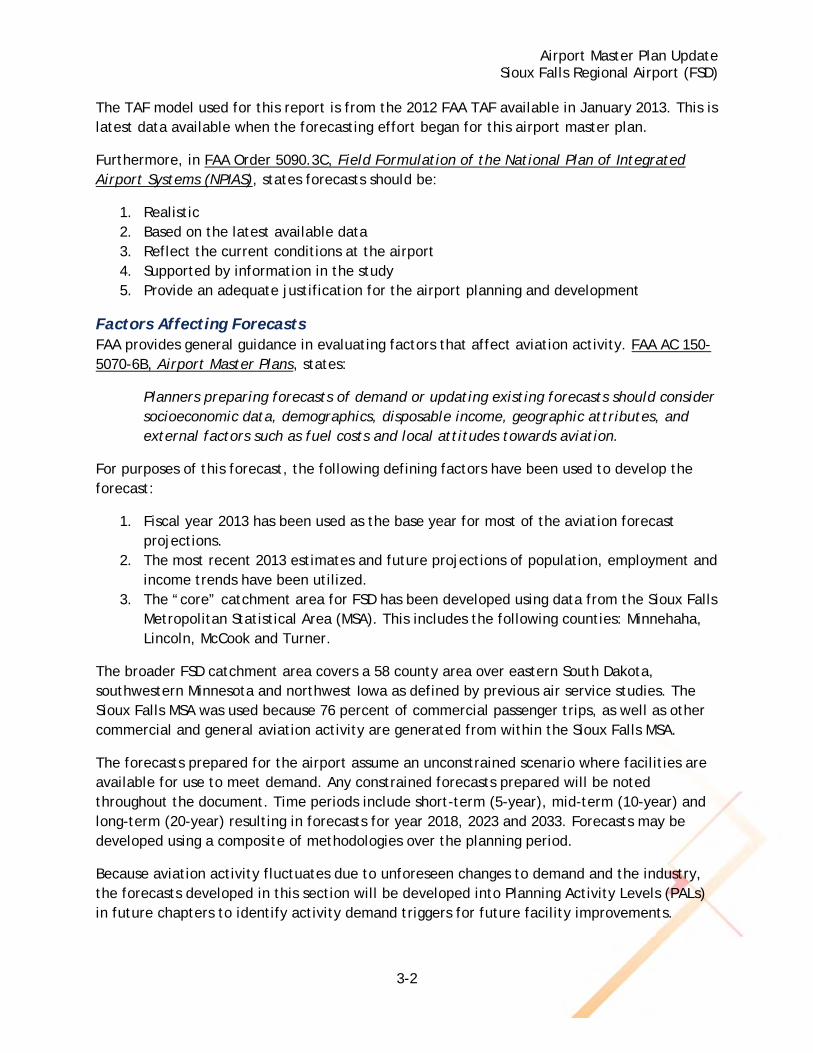
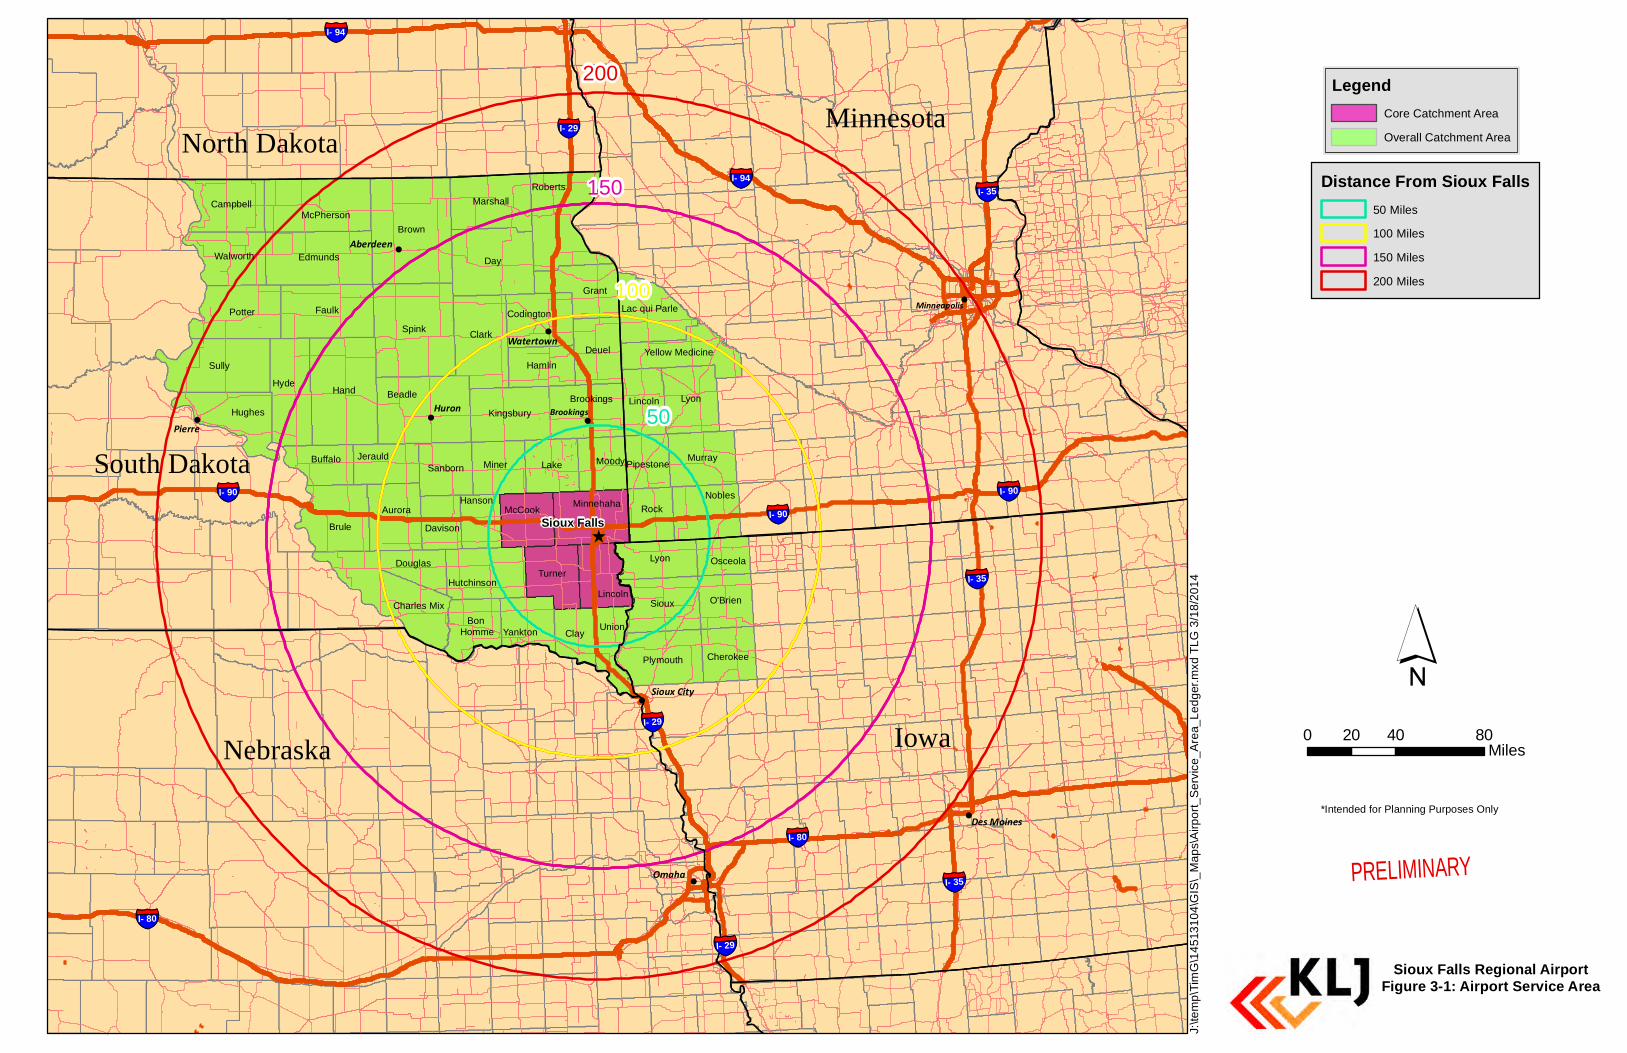
3. The “core” catchment area for FSD has been developed using data from the Sioux Falls Metropolitan Statistical Area (MSA). This includes the following counties: Minnehaha, Lincoln, McCook and Turner.
The broader FSD catchment area covers a 58 county area over eastern South Dakota, southwestern Minnesota and northwest Iowa as defined by previous air service studies. The Sioux Falls MSA was used because 76 percent of commercial passenger trips, as well as other commercial and general aviation activity are generated from within the Sioux Falls MSA.
The forecasts prepared for the airport assume an unconstrained scenario where facilities are available for use to meet demand. Any constrained forecasts prepared will be noted throughout the document. Time periods include short-term (5-year), mid-term (10-year) and long-term (20-year) resulting in forecasts for year 2018, 2023 and 2033. Forecasts may be developed using a composite of methodologies over the planning period.
Because aviation activity fluctuates due to unforeseen changes to demand and the industry, the forecasts developed in this section will be developed into Planning Activity Levels (PALs) in future chapters to identify activity demand triggers for future facility improvements.
!
!
!
!
!
!
!
^
Day
Brown
Spink
Hand
Sully
Clark
Faulk
BeadleHyde
Brule
Lyon
Potter
Roberts
Sioux
Lyon
Grant
Edmunds
Lake
Deuel
Aurora
Marshall
Hughes
Nobles
MurrayMiner
McPherson
Charles Mix
Turner
Rock
Clay
Plymouth
Kingsbury
Campbell
Lincoln
Brookings
Walworth
Union
Moody
O'Brien
Lincoln
Hamlin
Minnehaha
Hutchinson
JerauldBuffalo
Codington
McCook
Sanborn
Yankton
Lac qui Parle
Cherokee
Hanson
Davison
Douglas Osceola
Yellow Medicine
Pipestone
Bon Homme
!!
§̈¦I- 80
§̈¦I- 94
§̈¦I- 94
§̈¦I- 90
§̈¦I- 35
§̈¦I- 35
§̈¦I- 35
§̈¦I- 29
Minneapolis
Des Moines
50
100
150
200
§̈¦I- 90
§̈¦I- 29
§̈¦I- 80
§̈¦I- 90
§̈¦I- 29
Aberdeen
Watertown
BrookingsPierre
Omaha
Sioux City
IowaNebraska
Minnesota
South Dakota
Wisconsin
North Dakota
Huron
Sioux Falls
Sioux Falls Regional AirportFigure 3-1: Airport Service Area
LegendCore Catchment Area
Overall Catchment Area
Distance From Sioux Falls50 Miles
100 Miles
150 Miles
200 Miles
0 40 8020Miles
´
J:\te
mp
\Tim
G\1
45
131
04
\GIS
\_M
ap
s\A
irpo
rt_
Se
rvic
e_A
rea_
Le
dg
er.m
xd T
LG
3/1
8/2
01
4
PRELIMINARY
*Intended for Planning Purposes Only
Airport Master Plan Update Sioux Falls Regional Airport (FSD)
3-4
Commercial Aviation Forecasts Commercial aviation consists of civil aviation that involves operating an aircraft for hire to transport passengers or cargo. The forecast elements evaluated in this report applicable to FSD include:
Passenger Airline Forecasts Air Cargo Forecasts Other Commercial Forecasts
Passenger Airline Forecasts Passenger airline forecasts include passenger enplanements and operations. Passenger airline enplanements at an airport represent the number of revenue passengers boarding commercial service aircraft that depart an airport. An operation is a takeoff or a landing of an aircraft conducting a passenger carrying operation on a scheduled or unscheduled basis. As defined by FAA, passengers are carried in air carrier aircraft (scheduled service in more than 60 seat aircraft), air taxi aircraft (scheduled service of four or fewer flights per week or on-demand service, in 60 or fewer seat aircraft) or commuter “regional” aircraft (scheduled service of five or more round-trip flights per week on a route in 60 or fewer seat aircraft).
Airport Trends
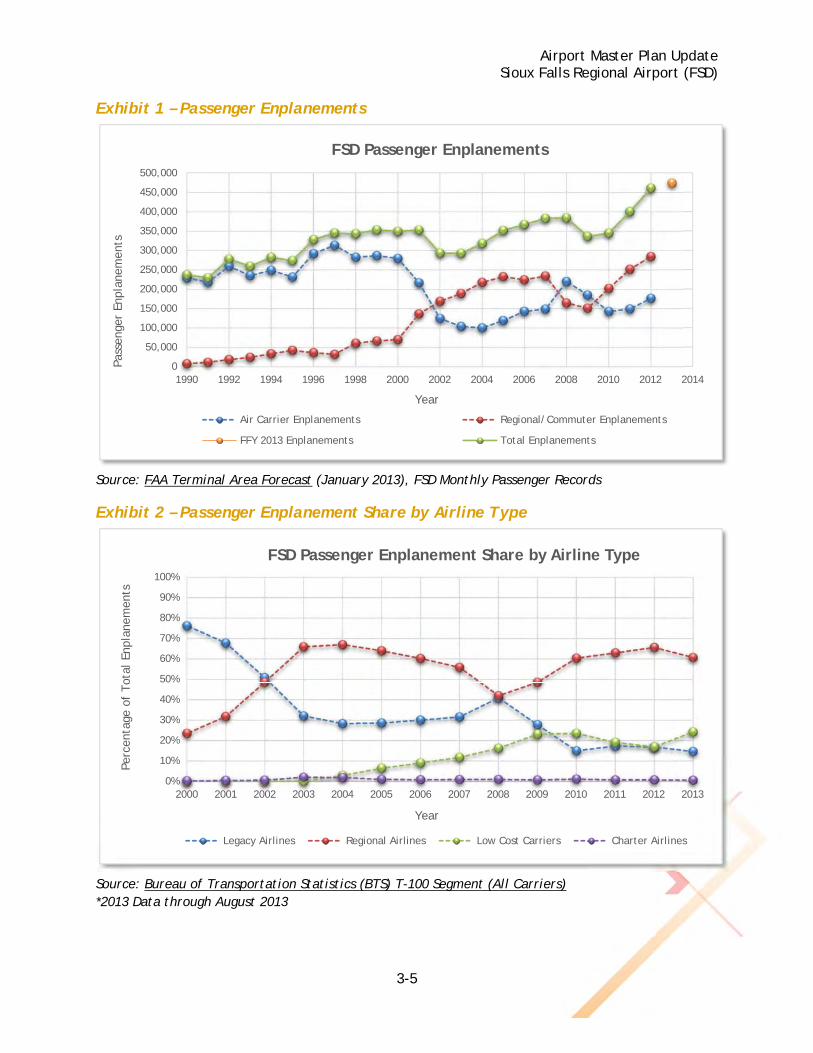
EnplanementsOn average since 1990, passenger enplanements at FSD have been increasing with two downward fluctuations in activity. These fluctuations are likely attributed to economic slowdown in the early 2000’s and most recently during the recession of 2009. Population and employment during this time has increased at a steady rate. Passenger enplanements for FY 2013 reached another all-time high of 474,118 according to airport records. Enplanements have grown by over 42 percent since 2009. The average annual growth rate since 1990 has been 3.07 percent.
Historically the passenger enplanements at FSD have been carried by air carrier aircraft operated by legacy airlines (i.e. Delta, Northwest, United, etc.). Since the advent of widespread use of regional jets, particular those with 50 seats, FSD has seen the majority of passenger enplanements carried by regional airlines (i.e. SkyWest, American Eagle) in these aircraft types. Low cost carriers such as Allegiant and Frontier Airlines have also been expanding their market presence at FSD capturing more than 24 percent of the passenger enplanements through August 2013.
Airport Master Plan Update Sioux Falls Regional Airport (FSD)
3-5
Exhibit 1 – Passenger Enplanements
Source: FAA Terminal Area Forecast (January 2013), FSD Monthly Passenger Records
Exhibit 2 – Passenger Enplanement Share by Airline Type
Source: Bureau of Transportation Statistics (BTS) T-100 Segment (All Carriers) *2013 Data through August 2013
0
50,000
100,000
150,000
200,000
250,000
300,000
350,000
400,000
450,000
500,000
1990 1992 1994 1996 1998 2000 2002 2004 2006 2008 2010 2012 2014
Pass
enge
r En
plan
emen
ts
Year
FSD Passenger Enplanements
Air Carrier Enplanements Regional/Commuter Enplanements
FFY 2013 Enplanements Total Enplanements
0%
10%
20%
30%
40%
50%
60%
70%
80%
90%
100%
2000 2001 2002 2003 2004 2005 2006 2007 2008 2009 2010 2011 2012 2013
Perc
enta
ge o
f Tot
al E
npla
nem
ents
Year
FSD Passenger Enplanement Share by Airline Type
Legacy Airlines Regional Airlines Low Cost Carriers Charter Airlines
Airport Master Plan Update Sioux Falls Regional Airport (FSD)
3-6
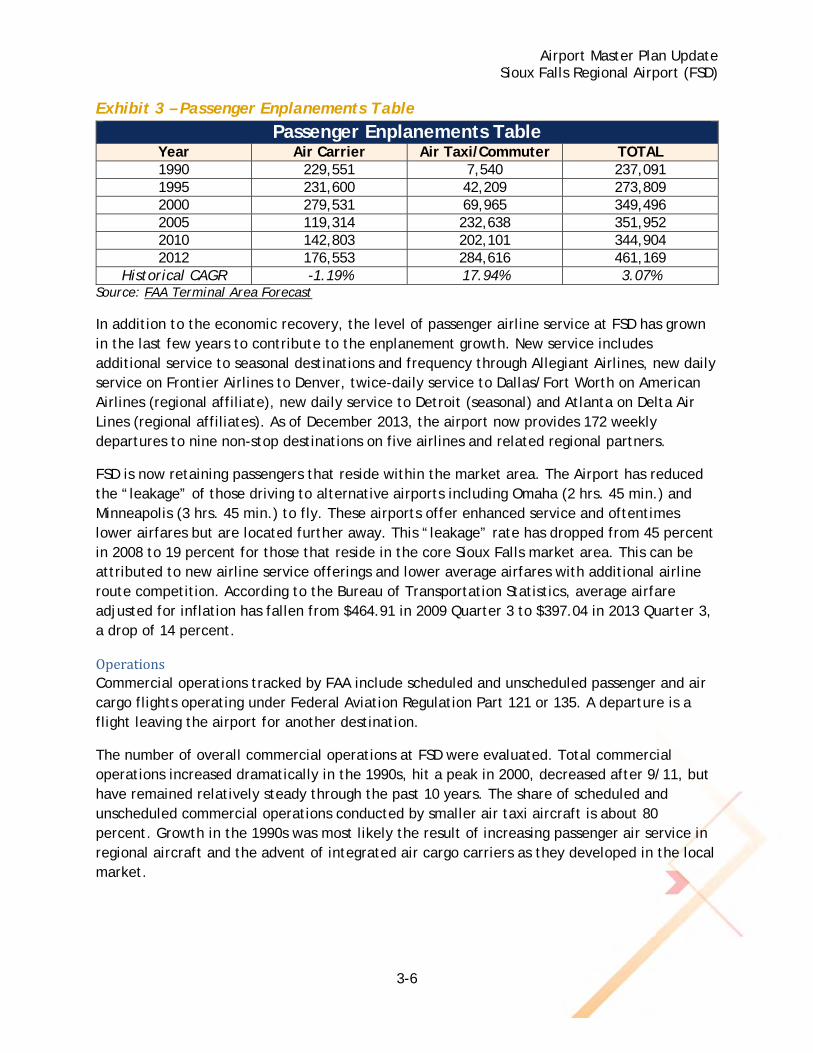
Exhibit 3 – Passenger Enplanements Table
Passenger Enplanements Table Year Air Carrier Air Taxi/Commuter TOTAL 1990 229,551 7,540 237,091 1995 231,600 42,209 273,809 2000 279,531 69,965 349,496 2005 119,314 232,638 351,952 2010 142,803 202,101 344,904 2012 176,553 284,616 461,169
Historical CAGR -1.19% 17.94% 3.07% Source: FAA Terminal Area Forecast
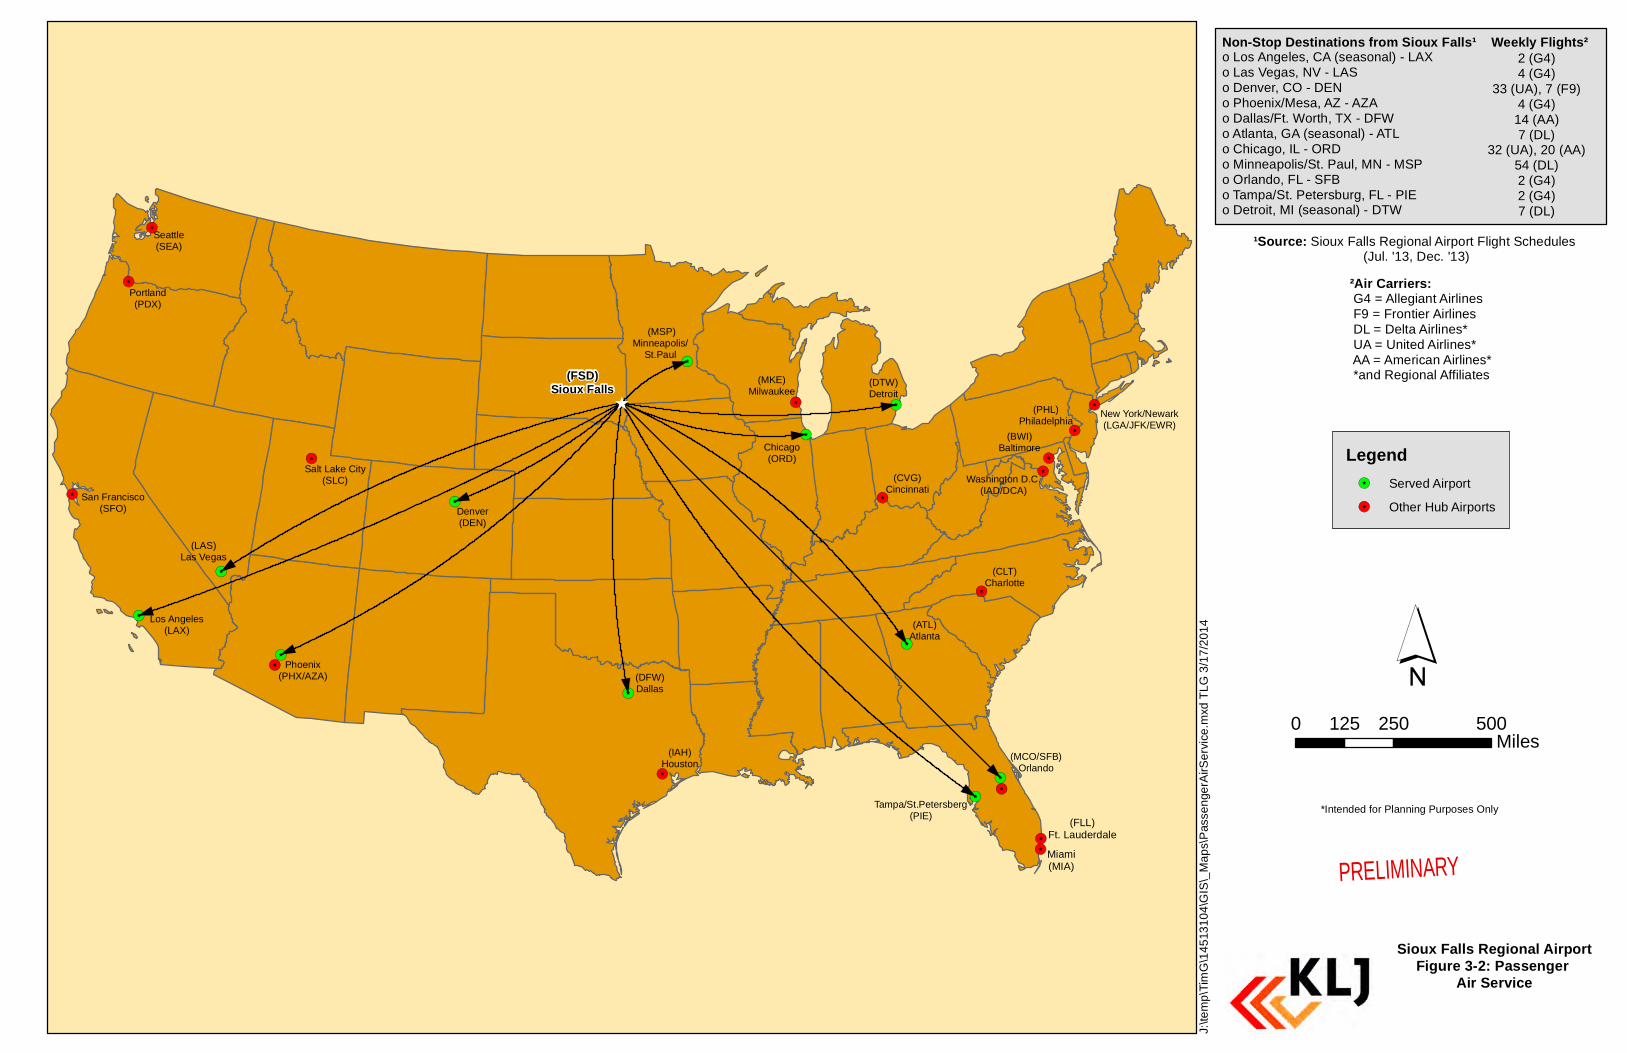
In addition to the economic recovery, the level of passenger airline service at FSD has grown in the last few years to contribute to the enplanement growth. New service includes additional service to seasonal destinations and frequency through Allegiant Airlines, new daily service on Frontier Airlines to Denver, twice-daily service to Dallas/Fort Worth on American Airlines (regional affiliate), new daily service to Detroit (seasonal) and Atlanta on Delta Air Lines (regional affiliates). As of December 2013, the airport now provides 172 weekly departures to nine non-stop destinations on five airlines and related regional partners.
FSD is now retaining passengers that reside within the market area. The Airport has reduced the “leakage” of those driving to alternative airports including Omaha (2 hrs. 45 min.) and Minneapolis (3 hrs. 45 min.) to fly. These airports offer enhanced service and oftentimes lower airfares but are located further away. This “leakage” rate has dropped from 45 percent in 2008 to 19 percent for those that reside in the core Sioux Falls market area. This can be attributed to new airline service offerings and lower average airfares with additional airline route competition. According to the Bureau of Transportation Statistics, average airfare adjusted for inflation has fallen from $464.91 in 2009 Quarter 3 to $397.04 in 2013 Quarter 3, a drop of 14 percent.
OperationsCommercial operations tracked by FAA include scheduled and unscheduled passenger and air cargo flights operating under Federal Aviation Regulation Part 121 or 135. A departure is a flight leaving the airport for another destination.
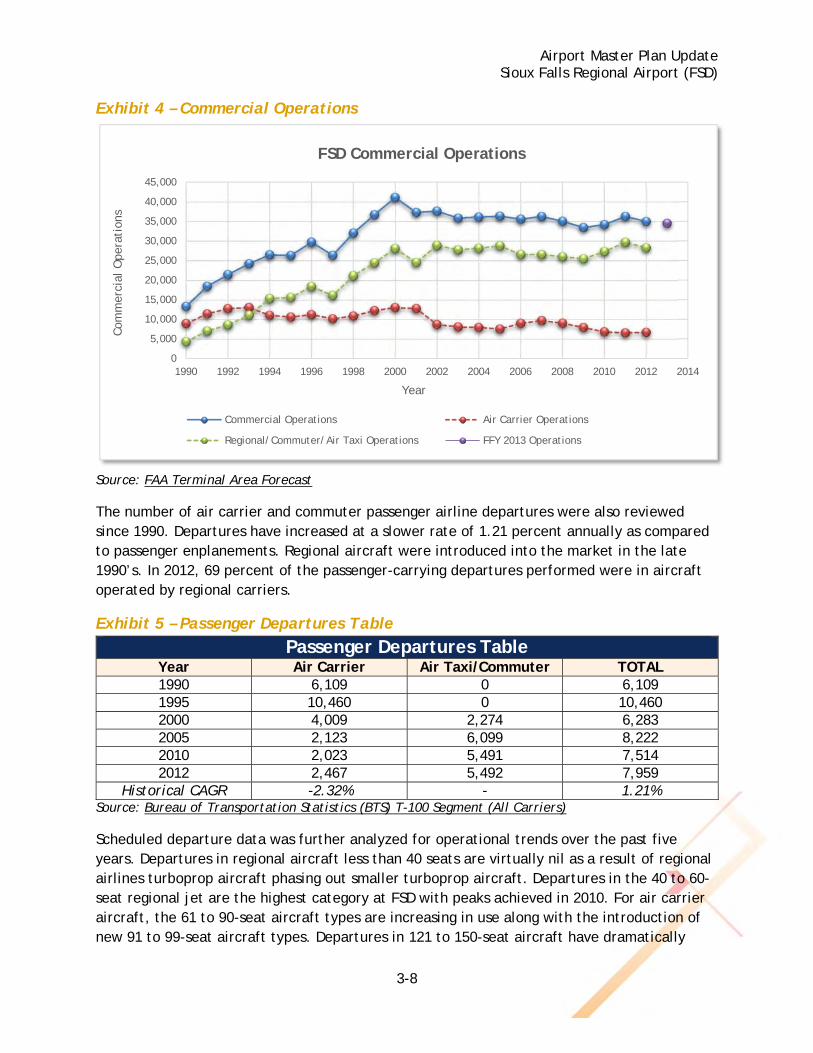
The number of overall commercial operations at FSD were evaluated. Total commercial operations increased dramatically in the 1990s, hit a peak in 2000, decreased after 9/11, but have remained relatively steady through the past 10 years. The share of scheduled and unscheduled commercial operations conducted by smaller air taxi aircraft is about 80 percent. Growth in the 1990s was most likely the result of increasing passenger air service in regional aircraft and the advent of integrated air cargo carriers as they developed in the local market.
!.
!.
Airport Master Plan Update Sioux Falls Regional Airport (FSD)
3-8
Exhibit 4 – Commercial Operations
Source: FAA Terminal Area Forecast
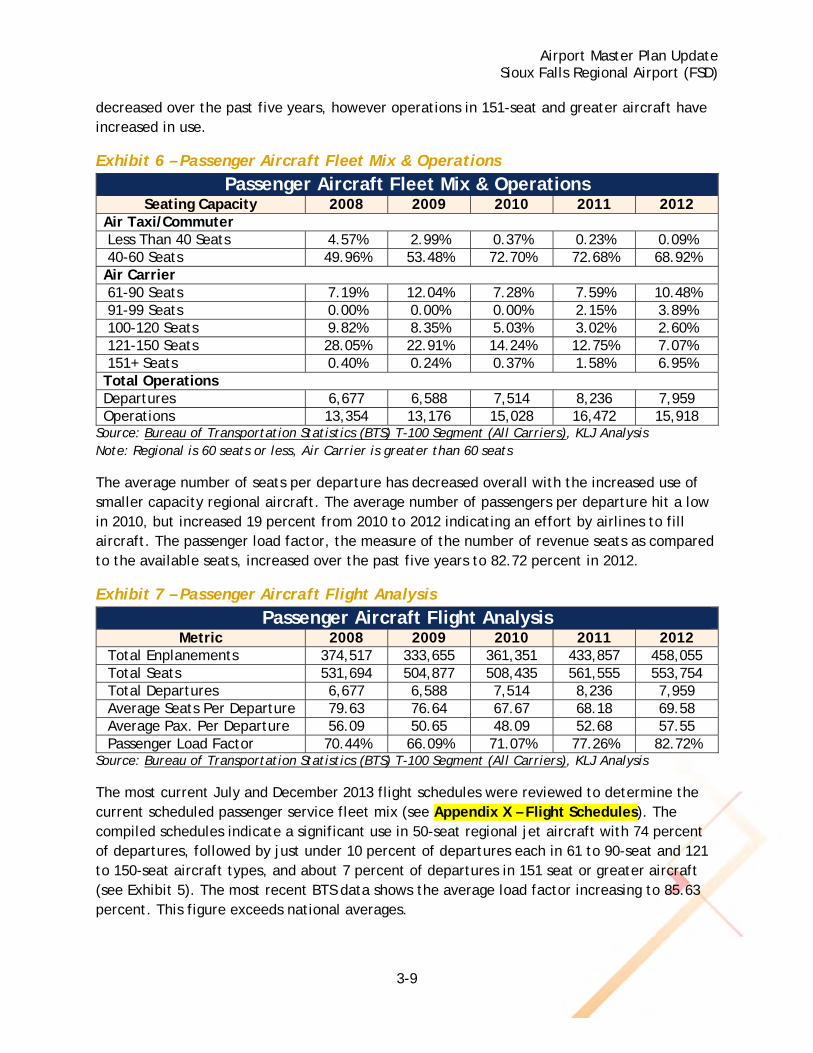
The number of air carrier and commuter passenger airline departures were also reviewed since 1990. Departures have increased at a slower rate of 1.21 percent annually as compared to passenger enplanements. Regional aircraft were introduced into the market in the late 1990’s. In 2012, 69 percent of the passenger-carrying departures performed were in aircraft operated by regional carriers.
Exhibit 5 – Passenger Departures Table
Passenger Departures Table Year Air Carrier Air Taxi/Commuter TOTAL 1990 6,109 0 6,109 1995 10,460 0 10,460 2000 4,009 2,274 6,283 2005 2,123 6,099 8,222 2010 2,023 5,491 7,514 2012 2,467 5,492 7,959
Historical CAGR -2.32% - 1.21% Source: Bureau of Transportation Statistics (BTS) T-100 Segment (All Carriers)
Scheduled departure data was further analyzed for operational trends over the past five years. Departures in regional aircraft less than 40 seats are virtually nil as a result of regional airlines turboprop aircraft phasing out smaller turboprop aircraft. Departures in the 40 to 60-seat regional jet are the highest category at FSD with peaks achieved in 2010. For air carrier aircraft, the 61 to 90-seat aircraft types are increasing in use along with the introduction of new 91 to 99-seat aircraft types. Departures in 121 to 150-seat aircraft have dramatically
0
5,000
10,000
15,000
20,000
25,000
30,000
35,000
40,000
45,000
1990 1992 1994 1996 1998 2000 2002 2004 2006 2008 2010 2012 2014
Com
mer
cial
Ope
rati
ons
Year
FSD Commercial Operations
Commercial Operations Air Carrier Operations
Regional/Commuter/Air Taxi Operations FFY 2013 Operations
Airport Master Plan Update Sioux Falls Regional Airport (FSD)
3-9
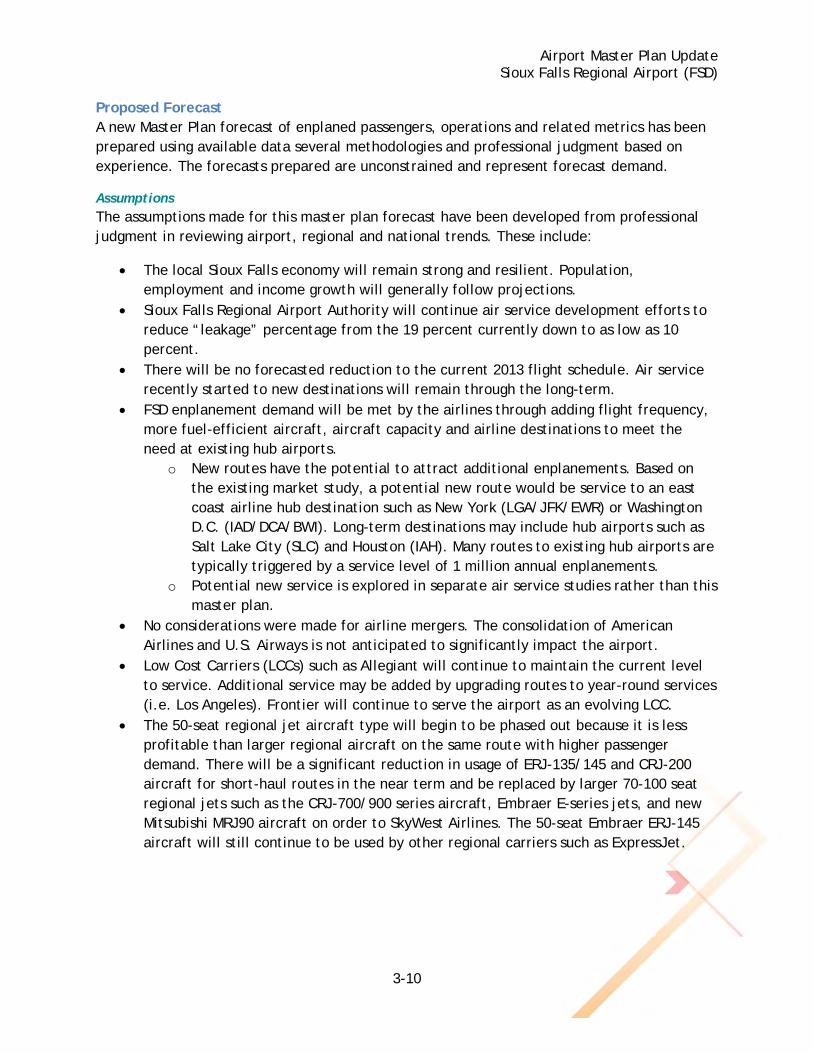
decreased over the past five years, however operations in 151-seat and greater aircraft have increased in use.
Exhibit 6 – Passenger Aircraft Fleet Mix & Operations
Passenger Aircraft Fleet Mix & Operations Seating Capacity 2008 2009 2010 2011 2012
Air Taxi/Commuter Less Than 40 Seats 4.57% 2.99% 0.37% 0.23% 0.09% 40-60 Seats 49.96% 53.48% 72.70% 72.68% 68.92% Air Carrier 61-90 Seats 7.19% 12.04% 7.28% 7.59% 10.48% 91-99 Seats 0.00% 0.00% 0.00% 2.15% 3.89% 100-120 Seats 9.82% 8.35% 5.03% 3.02% 2.60% 121-150 Seats 28.05% 22.91% 14.24% 12.75% 7.07% 151+ Seats 0.40% 0.24% 0.37% 1.58% 6.95% Total Operations Departures 6,677 6,588 7,514 8,236 7,959 Operations 13,354 13,176 15,028 16,472 15,918
Source: Bureau of Transportation Statistics (BTS) T-100 Segment (All Carriers), KLJ Analysis Note: Regional is 60 seats or less, Air Carrier is greater than 60 seats
The average number of seats per departure has decreased overall with the increased use of smaller capacity regional aircraft. The average number of passengers per departure hit a low in 2010, but increased 19 percent from 2010 to 2012 indicating an effort by airlines to fill aircraft. The passenger load factor, the measure of the number of revenue seats as compared to the available seats, increased over the past five years to 82.72 percent in 2012.
Exhibit 7 – Passenger Aircraft Flight Analysis
Passenger Aircraft Flight Analysis Metric 2008 2009 2010 2011 2012
Total Enplanements 374,517 333,655 361,351 433,857 458,055 Total Seats 531,694 504,877 508,435 561,555 553,754 Total Departures 6,677 6,588 7,514 8,236 7,959 Average Seats Per Departure 79.63 76.64 67.67 68.18 69.58 Average Pax. Per Departure 56.09 50.65 48.09 52.68 57.55 Passenger Load Factor 70.44% 66.09% 71.07% 77.26% 82.72%
Source: Bureau of Transportation Statistics (BTS) T-100 Segment (All Carriers), KLJ Analysis
The most current July and December 2013 flight schedules were reviewed to determine the current scheduled passenger service fleet mix (see Appendix X – Flight Schedules). The compiled schedules indicate a significant use in 50-seat regional jet aircraft with 74 percent of departures, followed by just under 10 percent of departures each in 61 to 90-seat and 121 to 150-seat aircraft types, and about 7 percent of departures in 151 seat or greater aircraft (see Exhibit 5). The most recent BTS data shows the average load factor increasing to 85.63 percent. This figure exceeds national averages.
Airport Master Plan Update Sioux Falls Regional Airport (FSD)
3-10
Proposed Forecast A new Master Plan forecast of enplaned passengers, operations and related metrics has been prepared using available data several methodologies and professional judgment based on experience. The forecasts prepared are unconstrained and represent forecast demand.
Assumptions The assumptions made for this master plan forecast have been developed from professional judgment in reviewing airport, regional and national trends. These include:
The local Sioux Falls economy will remain strong and resilient. Population, employment and income growth will generally follow projections.
Sioux Falls Regional Airport Authority will continue air service development efforts to reduce “leakage” percentage from the 19 percent currently down to as low as 10 percent.
There will be no forecasted reduction to the current 2013 flight schedule. Air service recently started to new destinations will remain through the long-term.
FSD enplanement demand will be met by the airlines through adding flight frequency, more fuel-efficient aircraft, aircraft capacity and airline destinations to meet the need at existing hub airports.
o New routes have the potential to attract additional enplanements. Based on the existing market study, a potential new route would be service to an east coast airline hub destination such as New York (LGA/JFK/EWR) or Washington D.C. (IAD/DCA/BWI). Long-term destinations may include hub airports such as Salt Lake City (SLC) and Houston (IAH). Many routes to existing hub airports are typically triggered by a service level of 1 million annual enplanements.
o Potential new service is explored in separate air service studies rather than this master plan.
No considerations were made for airline mergers. The consolidation of American Airlines and U.S. Airways is not anticipated to significantly impact the airport.
Low Cost Carriers (LCCs) such as Allegiant will continue to maintain the current level to service. Additional service may be added by upgrading routes to year-round services (i.e. Los Angeles). Frontier will continue to serve the airport as an evolving LCC.
The 50-seat regional jet aircraft type will begin to be phased out because it is less profitable than larger regional aircraft on the same route with higher passenger demand. There will be a significant reduction in usage of ERJ-135/145 and CRJ-200 aircraft for short-haul routes in the near term and be replaced by larger 70-100 seat regional jets such as the CRJ-700/900 series aircraft, Embraer E-series jets, and new Mitsubishi MRJ90 aircraft on order to SkyWest Airlines. The 50-seat Embraer ERJ-145 aircraft will still continue to be used by other regional carriers such as ExpressJet.
Airport Master Plan Update Sioux Falls Regional Airport (FSD)
3-11
Exhibit 8 – MRJ90 Regional Jet
Source: Mitsubishi Aircraft Corporation
Regional affiliates of Delta, United and American Airlines will, over time, shift 50-seat regional jet flying to larger aircraft. It is difficult to forecast the exact and on a route by route basis. Some 50-seat regional jets may still continue to be used especially on shorter haul routes of 500 miles or less to Chicago or Denver.
Routes currently served by mainline Airbus A319 aircraft from Delta Air Lines will see replacement with smaller 110 seat Boeing 717 aircraft in the mid-term. Allegiant Airlines will continue to utilize MD-80 (Las Vegas) or Airbus A320 (Phoenix, Orlando) series aircraft for their routes.
Airports Cooperative Research Program (ACRP) Synthesis 2: Airport Aviation Activity Forecasting demonstrates changes in the commercial airline industry have occurred in the last 25 years but have not been reflected in FAA definitions for air carrier, air taxi and commuter operations. The study notes the distinction between scheduled and unscheduled service to be most relevant. To be consistent with the industry trend of regional carriers operating larger aircraft for facility planning, a revised definition for air carriers as aircraft with 100 seats or more and regional/commuter/air taxi aircraft with less than 100 seats was proposed. This would more accurately separate traditional air carrier and regional airlines. However the traditional 60 seat definition is used for this forecast to be consistent with current FAA forecast approval guidelines.
Selected Forecast Various forecast methods and professional experience were used to develop a preferred forecast. The short-term forecast is developed assuming passenger growth trends over the past 10 years will continue to serve the market with new service added. As an example, a new daily flight on a CRJ-700 aircraft has the potential to increase enplanements by 23,000 annually with no other chance in service. The current July and December 2013 flight schedules with current load factors (85.63%) yield over 530,000 annual enplanements.
Over the mid-term growth is projected to slow due to airline market saturation and an economic market correction that occurs every 5 to 10 years. The long-term forecast projects the growth rate will decrease slightly and follow national trends. These national rates similarly correlate with the locally projected population growth for the Sioux Falls MSA.
Airport Master Plan Update Sioux Falls Regional Airport (FSD)
3-12
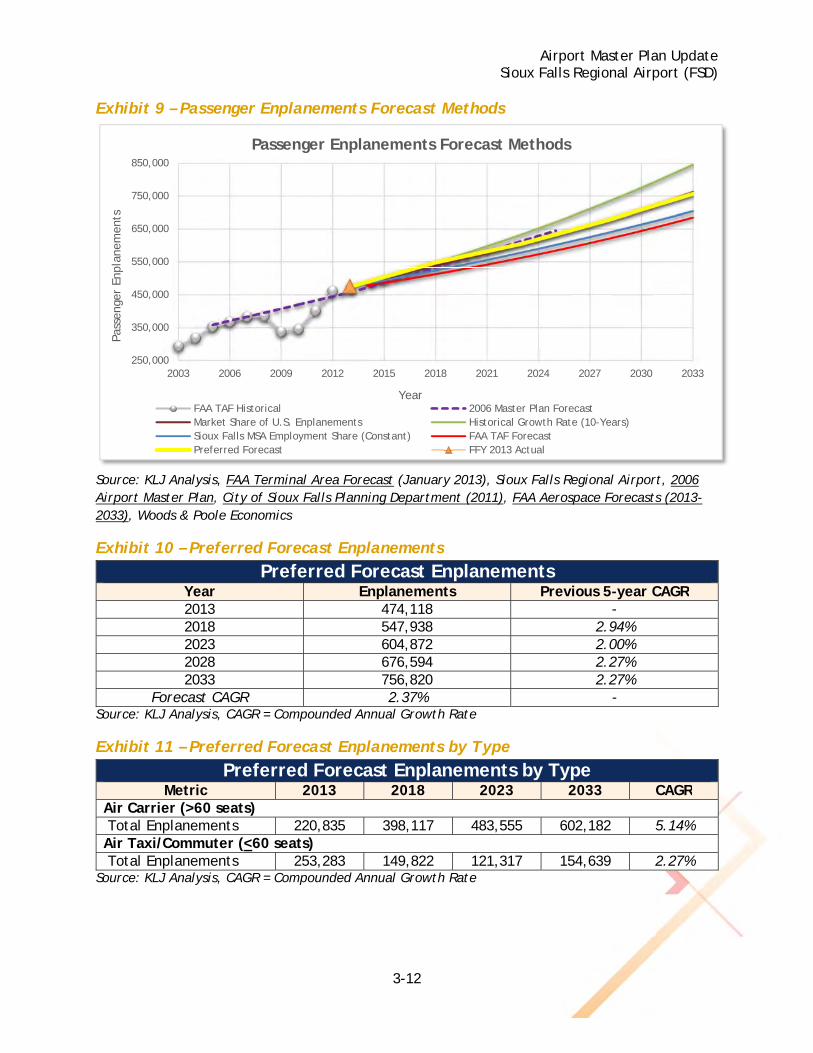
Exhibit 9 – Passenger Enplanements Forecast Methods
Source: KLJ Analysis, FAA Terminal Area Forecast (January 2013), Sioux Falls Regional Airport, 2006 Airport Master Plan, City of Sioux Falls Planning Department (2011), FAA Aerospace Forecasts (2013-2033), Woods & Poole Economics
Exhibit 10 – Preferred Forecast Enplanements
Preferred Forecast Enplanements Year Enplanements Previous 5-year CAGR 2013 474,118 - 2018 547,938 2.94% 2023 604,872 2.00% 2028 676,594 2.27% 2033 756,820 2.27%
Forecast CAGR 2.37% - Source: KLJ Analysis, CAGR = Compounded Annual Growth Rate
Exhibit 11 – Preferred Forecast Enplanements by Type
Preferred Forecast Enplanements by Type Metric 2013 2018 2023 2033 CAGR
Air Carrier (>60 seats) Total Enplanements 220,835 398,117 483,555 602,182 5.14% Air Taxi/Commuter (<60 seats) Total Enplanements 253,283 149,822 121,317 154,639 2.27%
Source: KLJ Analysis, CAGR = Compounded Annual Growth Rate
250,000
350,000
450,000
550,000
650,000
750,000
850,000
2003 2006 2009 2012 2015 2018 2021 2024 2027 2030 2033
Pass
enge
r En
plan
emen
ts
Year
Passenger Enplanements Forecast Methods
FAA TAF Historical 2006 Master Plan ForecastMarket Share of U.S. Enplanements Historical Growth Rate (10-Years)Sioux Falls MSA Employment Share (Constant) FAA TAF ForecastPreferred Forecast FFY 2013 Actual
Airport Master Plan Update Sioux Falls Regional Airport (FSD)
3-13
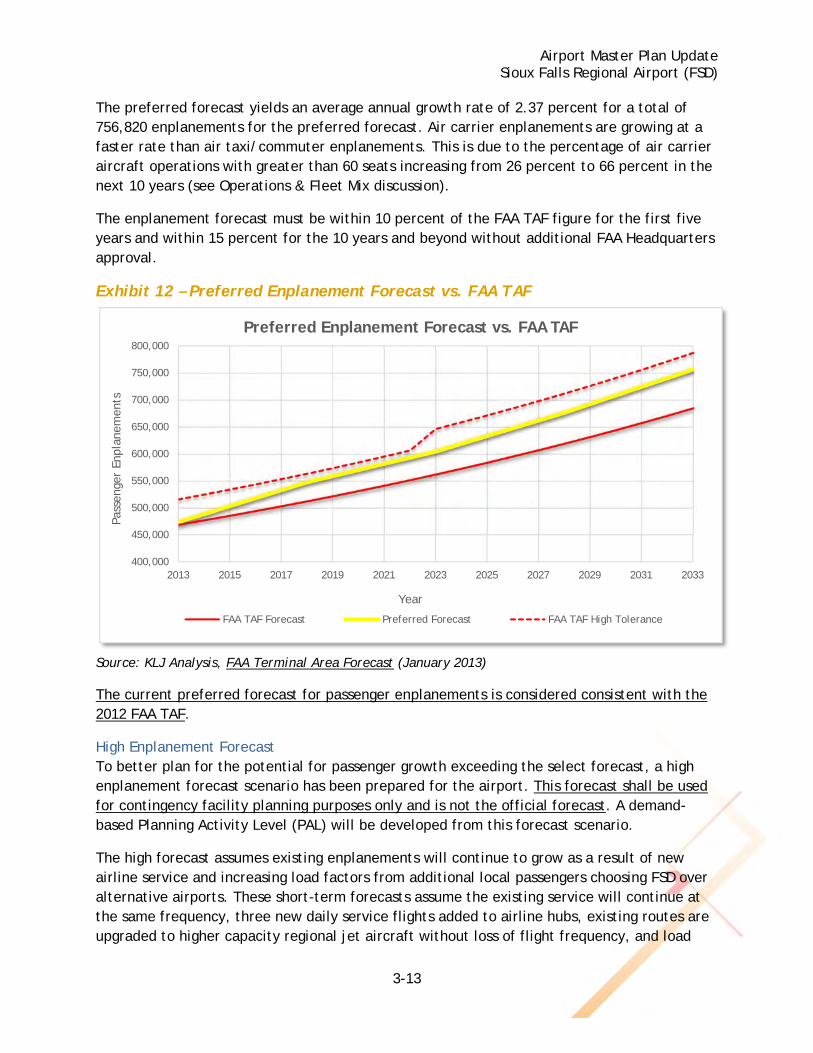
The preferred forecast yields an average annual growth rate of 2.37 percent for a total of 756,820 enplanements for the preferred forecast. Air carrier enplanements are growing at a faster rate than air taxi/commuter enplanements. This is due to the percentage of air carrier aircraft operations with greater than 60 seats increasing from 26 percent to 66 percent in the next 10 years (see Operations & Fleet Mix discussion).
The enplanement forecast must be within 10 percent of the FAA TAF figure for the first five years and within 15 percent for the 10 years and beyond without additional FAA Headquarters approval.
Exhibit 12 – Preferred Enplanement Forecast vs. FAA TAF
Source: KLJ Analysis, FAA Terminal Area Forecast (January 2013)
The current preferred forecast for passenger enplanements is considered consistent with the 2012 FAA TAF.
High Enplanement Forecast To better plan for the potential for passenger growth exceeding the select forecast, a high enplanement forecast scenario has been prepared for the airport. This forecast shall be used for contingency facility planning purposes only and is not the official forecast. A demand-based Planning Activity Level (PAL) will be developed from this forecast scenario.
The high forecast assumes existing enplanements will continue to grow as a result of new airline service and increasing load factors from additional local passengers choosing FSD over alternative airports. These short-term forecasts assume the existing service will continue at the same frequency, three new daily service flights added to airline hubs, existing routes are upgraded to higher capacity regional jet aircraft without loss of flight frequency, and load
400,000
450,000
500,000
550,000
600,000
650,000
700,000
750,000
800,000
2013 2015 2017 2019 2021 2023 2025 2027 2029 2031 2033
Pass
enge
r En
plan
emen
ts
Year
Preferred Enplanement Forecast vs. FAA TAF
FAA TAF Forecast Preferred Forecast FAA TAF High Tolerance
Airport Master Plan Update Sioux Falls Regional Airport (FSD)
3-14
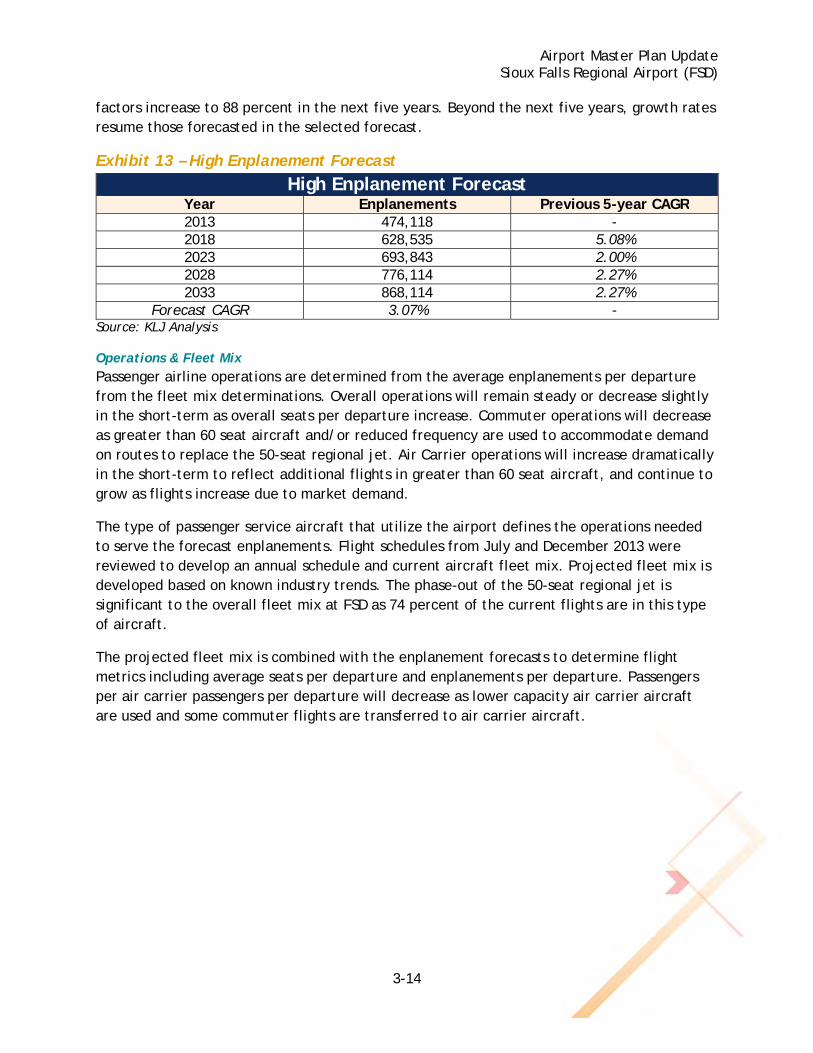
factors increase to 88 percent in the next five years. Beyond the next five years, growth rates resume those forecasted in the selected forecast.
Exhibit 13 – High Enplanement Forecast
High Enplanement Forecast Year Enplanements Previous 5-year CAGR 2013 474,118 - 2018 628,535 5.08% 2023 693,843 2.00% 2028 776,114 2.27% 2033 868,114 2.27%
Forecast CAGR 3.07% - Source: KLJ Analysis
Operations & Fleet Mix Passenger airline operations are determined from the average enplanements per departure from the fleet mix determinations. Overall operations will remain steady or decrease slightly in the short-term as overall seats per departure increase. Commuter operations will decrease as greater than 60 seat aircraft and/or reduced frequency are used to accommodate demand on routes to replace the 50-seat regional jet. Air Carrier operations will increase dramatically in the short-term to reflect additional flights in greater than 60 seat aircraft, and continue to grow as flights increase due to market demand.
The type of passenger service aircraft that utilize the airport defines the operations needed to serve the forecast enplanements. Flight schedules from July and December 2013 were reviewed to develop an annual schedule and current aircraft fleet mix. Projected fleet mix is developed based on known industry trends. The phase-out of the 50-seat regional jet is significant to the overall fleet mix at FSD as 74 percent of the current flights are in this type of aircraft.
The projected fleet mix is combined with the enplanement forecasts to determine flight metrics including average seats per departure and enplanements per departure. Passengers per air carrier passengers per departure will decrease as lower capacity air carrier aircraft are used and some commuter flights are transferred to air carrier aircraft.
Airport Master Plan Update Sioux Falls Regional Airport (FSD)
3-15
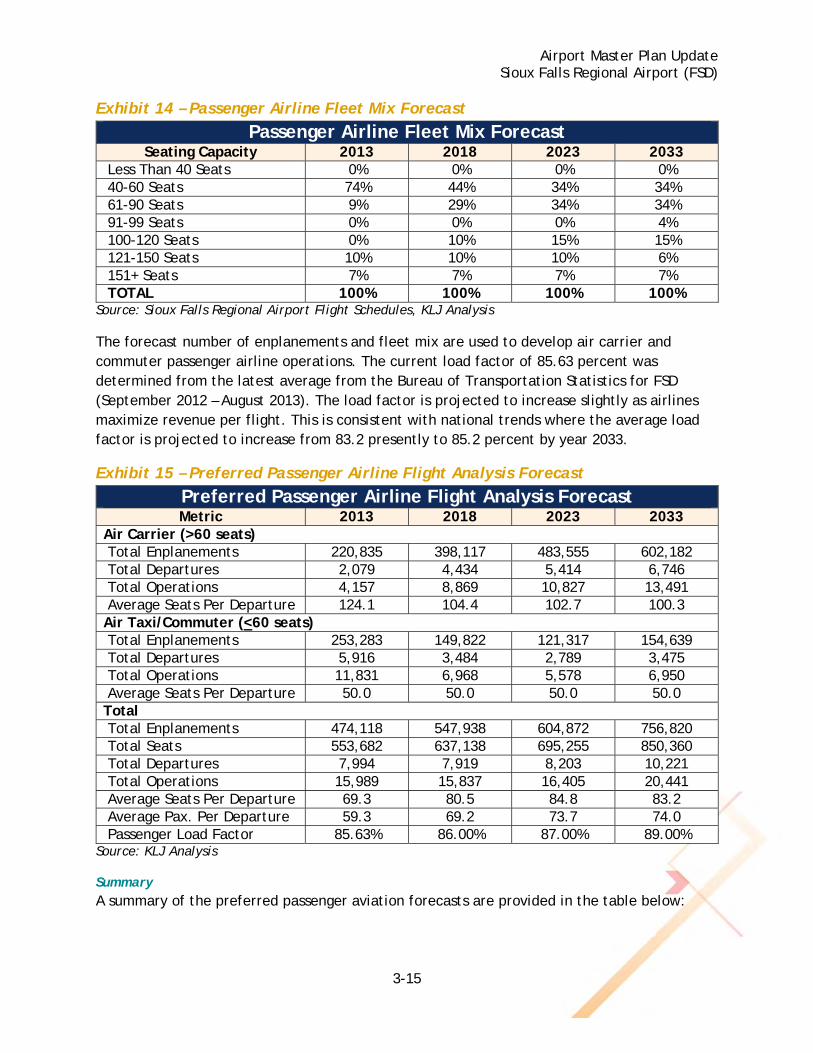
Exhibit 14 – Passenger Airline Fleet Mix Forecast
Passenger Airline Fleet Mix Forecast Seating Capacity 2013 2018 2023 2033
Less Than 40 Seats 0% 0% 0% 0% 40-60 Seats 74% 44% 34% 34% 61-90 Seats 9% 29% 34% 34% 91-99 Seats 0% 0% 0% 4% 100-120 Seats 0% 10% 15% 15% 121-150 Seats 10% 10% 10% 6% 151+ Seats 7% 7% 7% 7% TOTAL 100% 100% 100% 100%
Source: Sioux Falls Regional Airport Flight Schedules, KLJ Analysis
The forecast number of enplanements and fleet mix are used to develop air carrier and commuter passenger airline operations. The current load factor of 85.63 percent was determined from the latest average from the Bureau of Transportation Statistics for FSD (September 2012 – August 2013). The load factor is projected to increase slightly as airlines maximize revenue per flight. This is consistent with national trends where the average load factor is projected to increase from 83.2 presently to 85.2 percent by year 2033.
Exhibit 15 – Preferred Passenger Airline Flight Analysis Forecast
Preferred Passenger Airline Flight Analysis Forecast Metric 2013 2018 2023 2033
Air Carrier (>60 seats) Total Enplanements 220,835 398,117 483,555 602,182 Total Departures 2,079 4,434 5,414 6,746 Total Operations 4,157 8,869 10,827 13,491 Average Seats Per Departure 124.1 104.4 102.7 100.3 Air Taxi/Commuter (<60 seats) Total Enplanements 253,283 149,822 121,317 154,639 Total Departures 5,916 3,484 2,789 3,475 Total Operations 11,831 6,968 5,578 6,950 Average Seats Per Departure 50.0 50.0 50.0 50.0 Total Total Enplanements 474,118 547,938 604,872 756,820 Total Seats 553,682 637,138 695,255 850,360 Total Departures 7,994 7,919 8,203 10,221 Total Operations 15,989 15,837 16,405 20,441 Average Seats Per Departure 69.3 80.5 84.8 83.2 Average Pax. Per Departure 59.3 69.2 73.7 74.0 Passenger Load Factor 85.63% 86.00% 87.00% 89.00%
Source: KLJ Analysis
Summary A summary of the preferred passenger aviation forecasts are provided in the table below:
Airport Master Plan Update Sioux Falls Regional Airport (FSD)
3-16
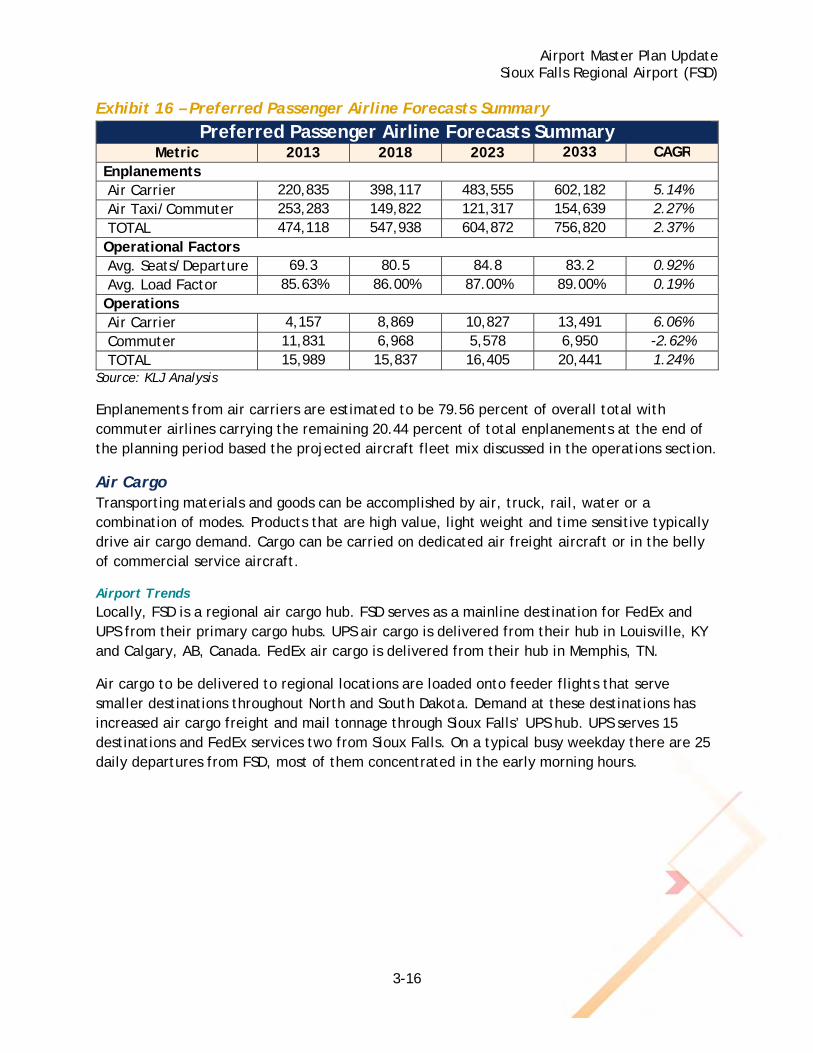
Exhibit 16 – Preferred Passenger Airline Forecasts Summary
Preferred Passenger Airline Forecasts Summary Metric 2013 2018 2023 2033 CAGR
Enplanements Air Carrier 220,835 398,117 483,555 602,182 5.14% Air Taxi/Commuter 253,283 149,822 121,317 154,639 2.27% TOTAL 474,118 547,938 604,872 756,820 2.37% Operational Factors Avg. Seats/Departure 69.3 80.5 84.8 83.2 0.92% Avg. Load Factor 85.63% 86.00% 87.00% 89.00% 0.19% Operations Air Carrier 4,157 8,869 10,827 13,491 6.06% Commuter 11,831 6,968 5,578 6,950 -2.62% TOTAL 15,989 15,837 16,405 20,441 1.24%
Source: KLJ Analysis
Enplanements from air carriers are estimated to be 79.56 percent of overall total with commuter airlines carrying the remaining 20.44 percent of total enplanements at the end of the planning period based the projected aircraft fleet mix discussed in the operations section.
Air Cargo Transporting materials and goods can be accomplished by air, truck, rail, water or a combination of modes. Products that are high value, light weight and time sensitive typically drive air cargo demand. Cargo can be carried on dedicated air freight aircraft or in the belly of commercial service aircraft.
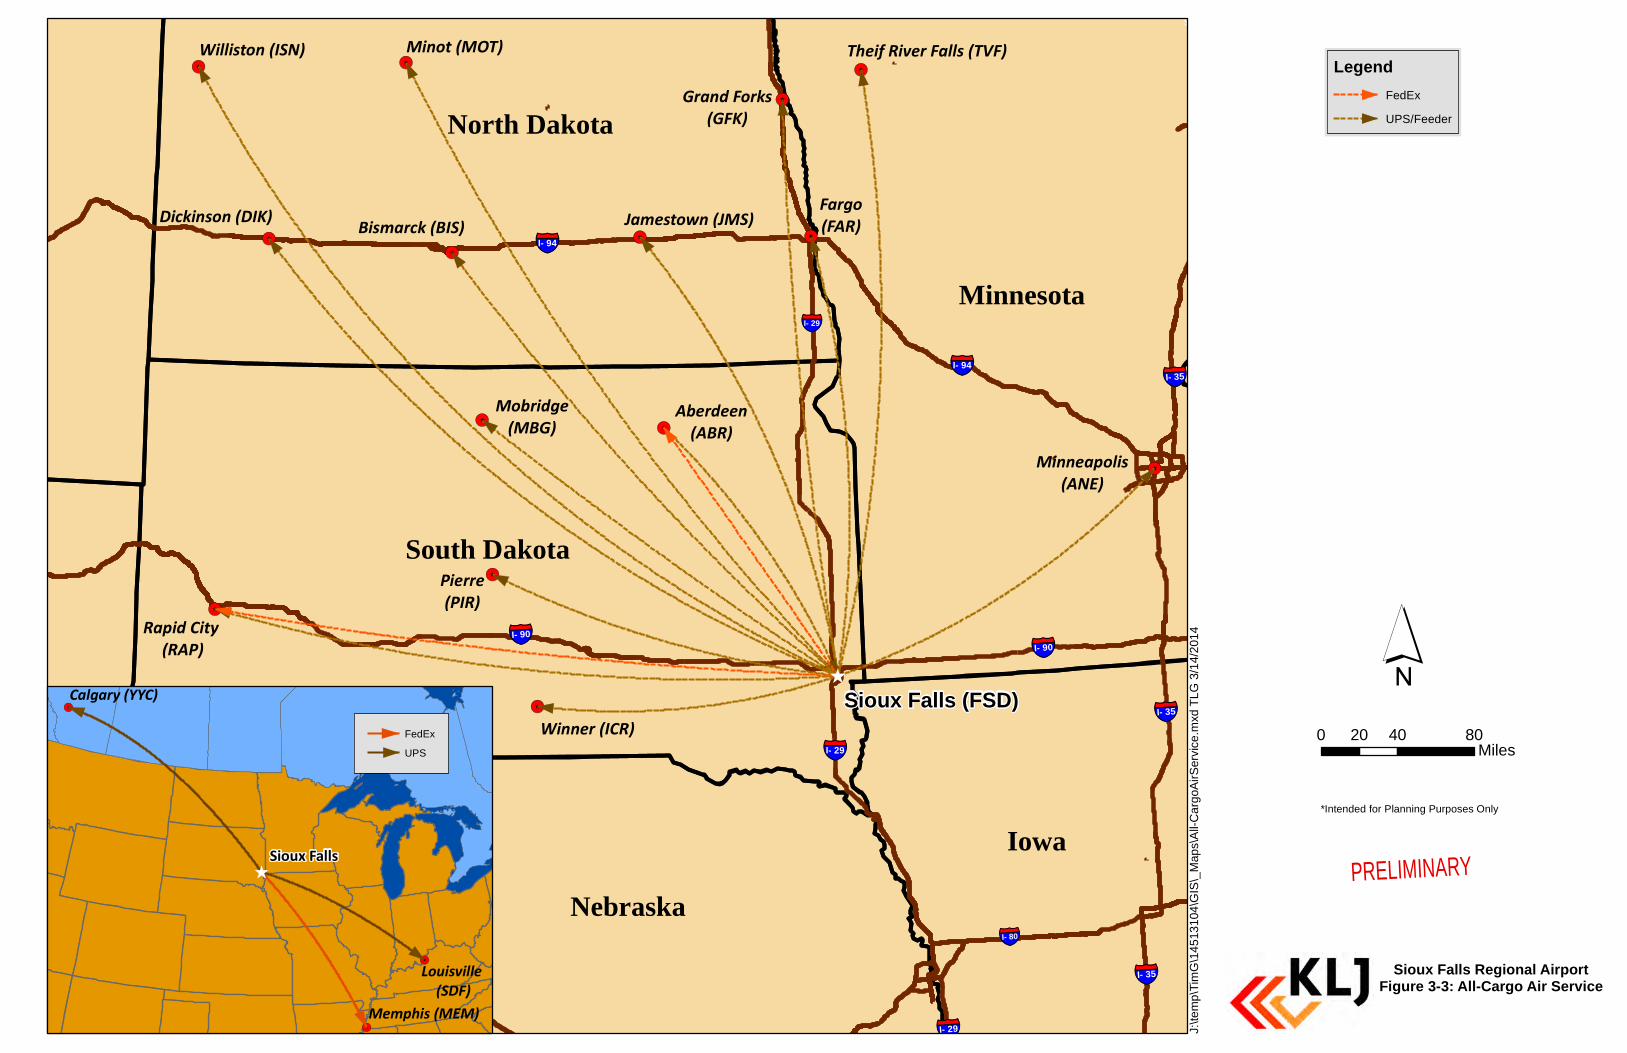
Airport Trends Locally, FSD is a regional air cargo hub. FSD serves as a mainline destination for FedEx and UPS from their primary cargo hubs. UPS air cargo is delivered from their hub in Louisville, KY and Calgary, AB, Canada. FedEx air cargo is delivered from their hub in Memphis, TN.
Air cargo to be delivered to regional locations are loaded onto feeder flights that serve smaller destinations throughout North and South Dakota. Demand at these destinations has increased air cargo freight and mail tonnage through Sioux Falls’ UPS hub. UPS serves 15 destinations and FedEx services two from Sioux Falls. On a typical busy weekday there are 25 daily departures from FSD, most of them concentrated in the early morning hours.
Airport Master Plan Update Sioux Falls Regional Airport (FSD)
3-18
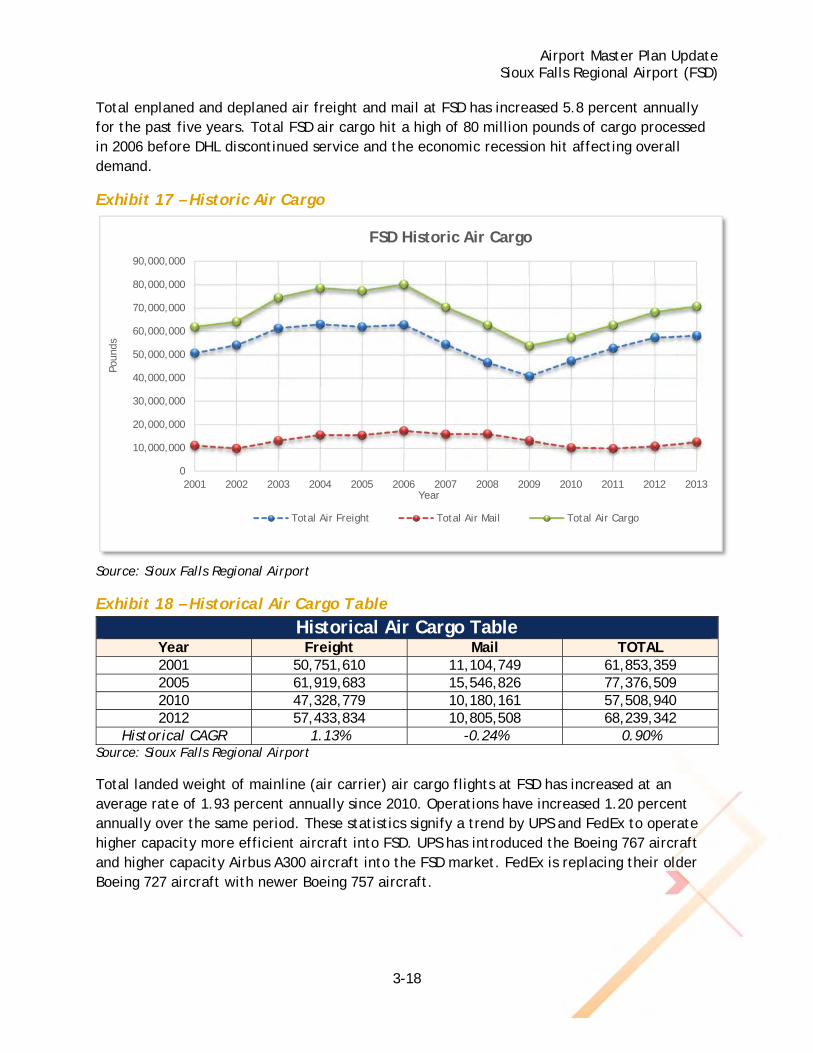
Total enplaned and deplaned air freight and mail at FSD has increased 5.8 percent annually for the past five years. Total FSD air cargo hit a high of 80 million pounds of cargo processed in 2006 before DHL discontinued service and the economic recession hit affecting overall demand.
Exhibit 17 – Historic Air Cargo
Source: Sioux Falls Regional Airport
Exhibit 18 – Historical Air Cargo Table
Historical Air Cargo Table Year Freight Mail TOTAL 2001 50,751,610 11,104,749 61,853,359 2005 61,919,683 15,546,826 77,376,509 2010 47,328,779 10,180,161 57,508,940 2012 57,433,834 10,805,508 68,239,342
Historical CAGR 1.13% -0.24% 0.90% Source: Sioux Falls Regional Airport
Total landed weight of mainline (air carrier) air cargo flights at FSD has increased at an average rate of 1.93 percent annually since 2010. Operations have increased 1.20 percent annually over the same period. These statistics signify a trend by UPS and FedEx to operate higher capacity more efficient aircraft into FSD. UPS has introduced the Boeing 767 aircraft and higher capacity Airbus A300 aircraft into the FSD market. FedEx is replacing their older Boeing 727 aircraft with newer Boeing 757 aircraft.
0
10,000,000
20,000,000
30,000,000
40,000,000
50,000,000
60,000,000
70,000,000
80,000,000
90,000,000
2001 2002 2003 2004 2005 2006 2007 2008 2009 2010 2011 2012 2013
Poun
ds
Year
FSD Historic Air Cargo
Total Air Freight Total Air Mail Total Air Cargo
Airport Master Plan Update Sioux Falls Regional Airport (FSD)
3-19
Exhibit 19 – Air Carrier Cargo Aircraft Fleet Mix & Operations
Air Carrier Cargo Aircraft Fleet Mix & Operations Aircraft Type 2010 2011 2012 2013*
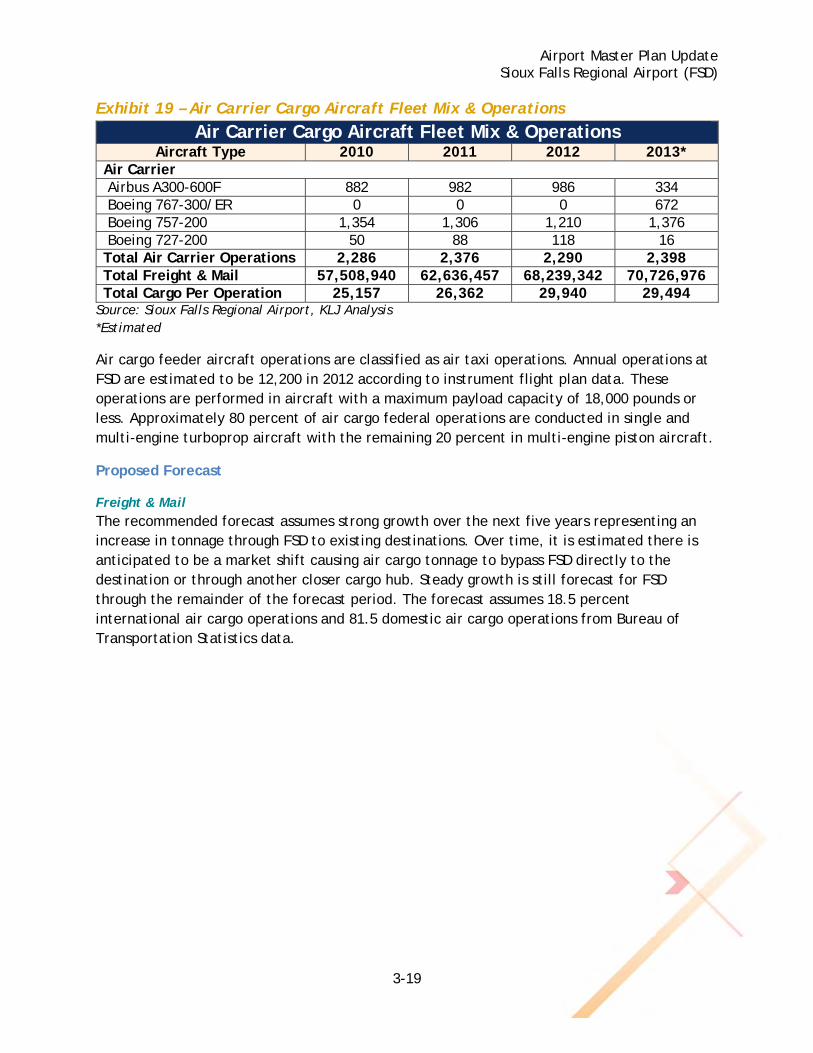
Air Carrier Airbus A300-600F 882 982 986 334 Boeing 767-300/ER 0 0 0 672 Boeing 757-200 1,354 1,306 1,210 1,376 Boeing 727-200 50 88 118 16 Total Air Carrier Operations 2,286 2,376 2,290 2,398 Total Freight & Mail 57,508,940 62,636,457 68,239,342 70,726,976 Total Cargo Per Operation 25,157 26,362 29,940 29,494
Source: Sioux Falls Regional Airport, KLJ Analysis *Estimated
Air cargo feeder aircraft operations are classified as air taxi operations. Annual operations at FSD are estimated to be 12,200 in 2012 according to instrument flight plan data. These operations are performed in aircraft with a maximum payload capacity of 18,000 pounds or less. Approximately 80 percent of air cargo federal operations are conducted in single and multi-engine turboprop aircraft with the remaining 20 percent in multi-engine piston aircraft.
Proposed Forecast
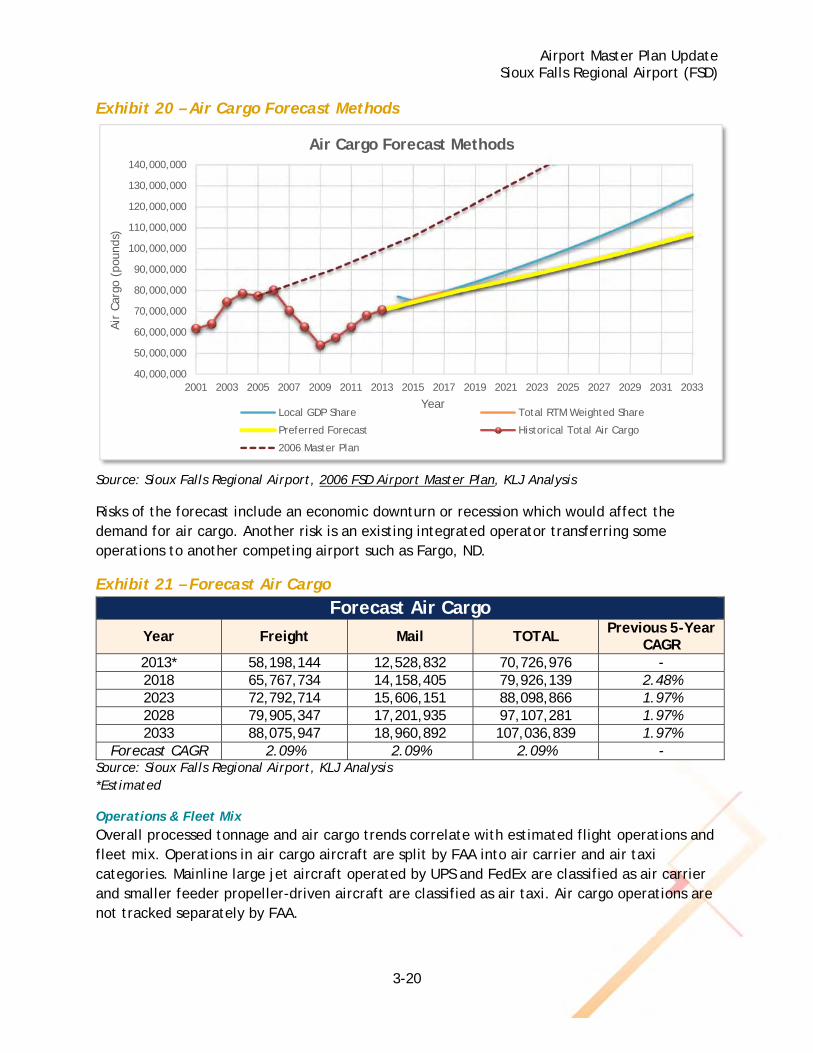
Freight & Mail The recommended forecast assumes strong growth over the next five years representing an increase in tonnage through FSD to existing destinations. Over time, it is estimated there is anticipated to be a market shift causing air cargo tonnage to bypass FSD directly to the destination or through another closer cargo hub. Steady growth is still forecast for FSD through the remainder of the forecast period. The forecast assumes 18.5 percent international air cargo operations and 81.5 domestic air cargo operations from Bureau of Transportation Statistics data.
Airport Master Plan Update Sioux Falls Regional Airport (FSD)
3-20
Exhibit 20 – Air Cargo Forecast Methods
Source: Sioux Falls Regional Airport, 2006 FSD Airport Master Plan, KLJ Analysis
Risks of the forecast include an economic downturn or recession which would affect the demand for air cargo. Another risk is an existing integrated operator transferring some operations to another competing airport such as Fargo, ND.
Exhibit 21 – Forecast Air Cargo
Forecast Air Cargo
Year Freight Mail TOTAL Previous 5-Year
CAGR 2013* 58,198,144 12,528,832 70,726,976 - 2018 65,767,734 14,158,405 79,926,139 2.48% 2023 72,792,714 15,606,151 88,098,866 1.97% 2028 79,905,347 17,201,935 97,107,281 1.97% 2033 88,075,947 18,960,892 107,036,839 1.97%
Forecast CAGR 2.09% 2.09% 2.09% - Source: Sioux Falls Regional Airport, KLJ Analysis *Estimated
Operations & Fleet Mix Overall processed tonnage and air cargo trends correlate with estimated flight operations and fleet mix. Operations in air cargo aircraft are split by FAA into air carrier and air taxi categories. Mainline large jet aircraft operated by UPS and FedEx are classified as air carrier and smaller feeder propeller-driven aircraft are classified as air taxi. Air cargo operations are not tracked separately by FAA.
40,000,000
50,000,000
60,000,000
70,000,000
80,000,000
90,000,000
100,000,000
110,000,000
120,000,000
130,000,000
140,000,000
2001 2003 2005 2007 2009 2011 2013 2015 2017 2019 2021 2023 2025 2027 2029 2031 2033
Air
Car
go (
poun
ds)
Year
Air Cargo Forecast Methods
Local GDP Share Total RTM Weighted Share
Preferred Forecast Historical Total Air Cargo
2006 Master Plan
Airport Master Plan Update Sioux Falls Regional Airport (FSD)
3-21
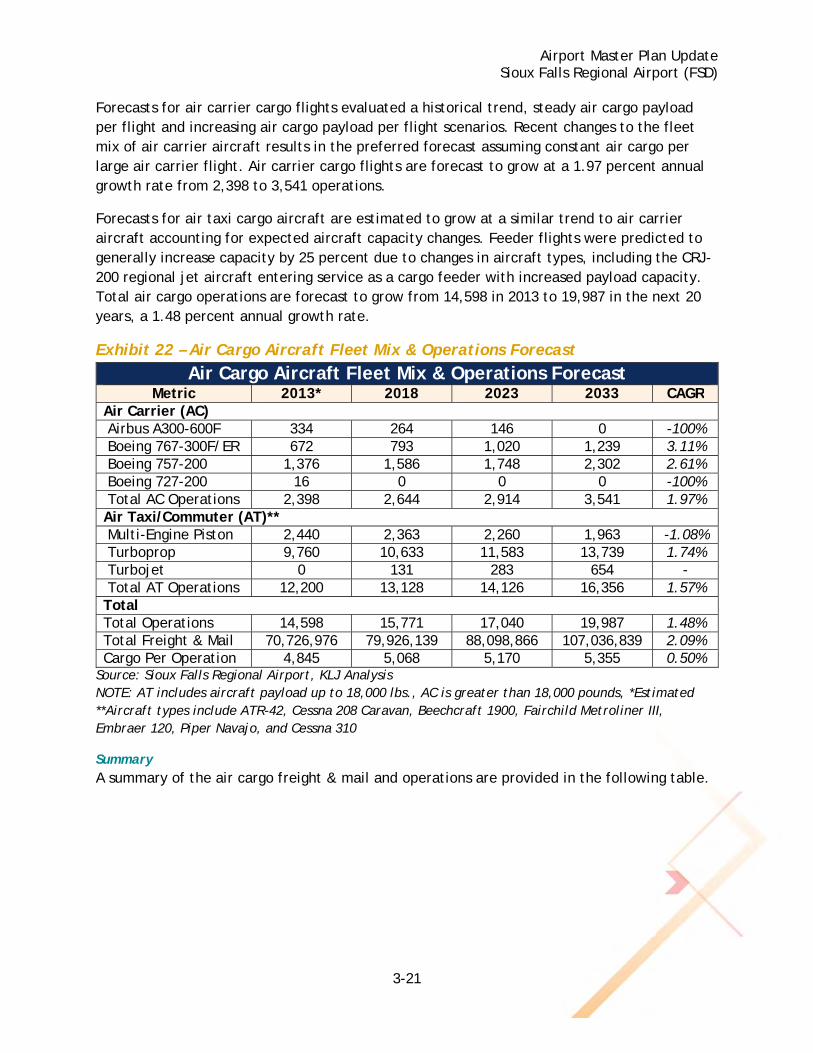
Forecasts for air carrier cargo flights evaluated a historical trend, steady air cargo payload per flight and increasing air cargo payload per flight scenarios. Recent changes to the fleet mix of air carrier aircraft results in the preferred forecast assuming constant air cargo per large air carrier flight. Air carrier cargo flights are forecast to grow at a 1.97 percent annual growth rate from 2,398 to 3,541 operations.
Forecasts for air taxi cargo aircraft are estimated to grow at a similar trend to air carrier aircraft accounting for expected aircraft capacity changes. Feeder flights were predicted to generally increase capacity by 25 percent due to changes in aircraft types, including the CRJ-200 regional jet aircraft entering service as a cargo feeder with increased payload capacity. Total air cargo operations are forecast to grow from 14,598 in 2013 to 19,987 in the next 20 years, a 1.48 percent annual growth rate.
Exhibit 22 – Air Cargo Aircraft Fleet Mix & Operations Forecast
Air Cargo Aircraft Fleet Mix & Operations Forecast Metric 2013* 2018 2023 2033 CAGR
Air Carrier (AC) Airbus A300-600F 334 264 146 0 -100% Boeing 767-300F/ER 672 793 1,020 1,239 3.11% Boeing 757-200 1,376 1,586 1,748 2,302 2.61% Boeing 727-200 16 0 0 0 -100% Total AC Operations 2,398 2,644 2,914 3,541 1.97% Air Taxi/Commuter (AT)** Multi-Engine Piston 2,440 2,363 2,260 1,963 -1.08% Turboprop 9,760 10,633 11,583 13,739 1.74% Turbojet 0 131 283 654 - Total AT Operations 12,200 13,128 14,126 16,356 1.57% Total Total Operations 14,598 15,771 17,040 19,987 1.48% Total Freight & Mail 70,726,976 79,926,139 88,098,866 107,036,839 2.09% Cargo Per Operation 4,845 5,068 5,170 5,355 0.50%
Source: Sioux Falls Regional Airport, KLJ Analysis NOTE: AT includes aircraft payload up to 18,000 lbs., AC is greater than 18,000 pounds, *Estimated **Aircraft types include ATR-42, Cessna 208 Caravan, Beechcraft 1900, Fairchild Metroliner III, Embraer 120, Piper Navajo, and Cessna 310
Summary A summary of the air cargo freight & mail and operations are provided in the following table.
Airport Master Plan Update Sioux Falls Regional Airport (FSD)
3-22
Exhibit 23 – Air Cargo Aviation Forecasts Summary
Air Cargo Aviation Forecasts Summary Metric 2013 2018 2023 2033 CAGR
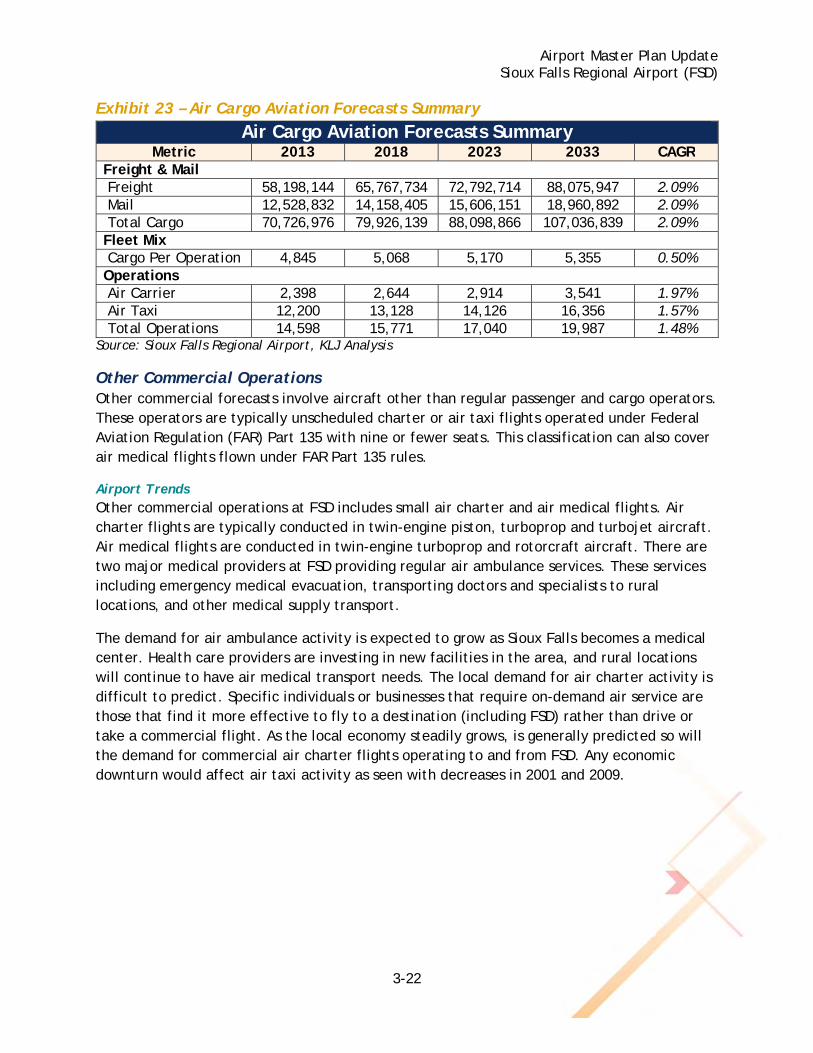
Freight & Mail Freight 58,198,144 65,767,734 72,792,714 88,075,947 2.09% Mail 12,528,832 14,158,405 15,606,151 18,960,892 2.09% Total Cargo 70,726,976 79,926,139 88,098,866 107,036,839 2.09% Fleet Mix Cargo Per Operation 4,845 5,068 5,170 5,355 0.50% Operations Air Carrier 2,398 2,644 2,914 3,541 1.97% Air Taxi 12,200 13,128 14,126 16,356 1.57% Total Operations 14,598 15,771 17,040 19,987 1.48%
Source: Sioux Falls Regional Airport, KLJ Analysis
Other Commercial Operations Other commercial forecasts involve aircraft other than regular passenger and cargo operators. These operators are typically unscheduled charter or air taxi flights operated under Federal Aviation Regulation (FAR) Part 135 with nine or fewer seats. This classification can also cover air medical flights flown under FAR Part 135 rules.
Airport Trends Other commercial operations at FSD includes small air charter and air medical flights. Air charter flights are typically conducted in twin-engine piston, turboprop and turbojet aircraft. Air medical flights are conducted in twin-engine turboprop and rotorcraft aircraft. There are two major medical providers at FSD providing regular air ambulance services. These services including emergency medical evacuation, transporting doctors and specialists to rural locations, and other medical supply transport.
The demand for air ambulance activity is expected to grow as Sioux Falls becomes a medical center. Health care providers are investing in new facilities in the area, and rural locations will continue to have air medical transport needs. The local demand for air charter activity is difficult to predict. Specific individuals or businesses that require on-demand air service are those that find it more effective to fly to a destination (including FSD) rather than drive or take a commercial flight. As the local economy steadily grows, is generally predicted so will the demand for commercial air charter flights operating to and from FSD. Any economic downturn would affect air taxi activity as seen with decreases in 2001 and 2009.
Airport Master Plan Update Sioux Falls Regional Airport (FSD)
3-23
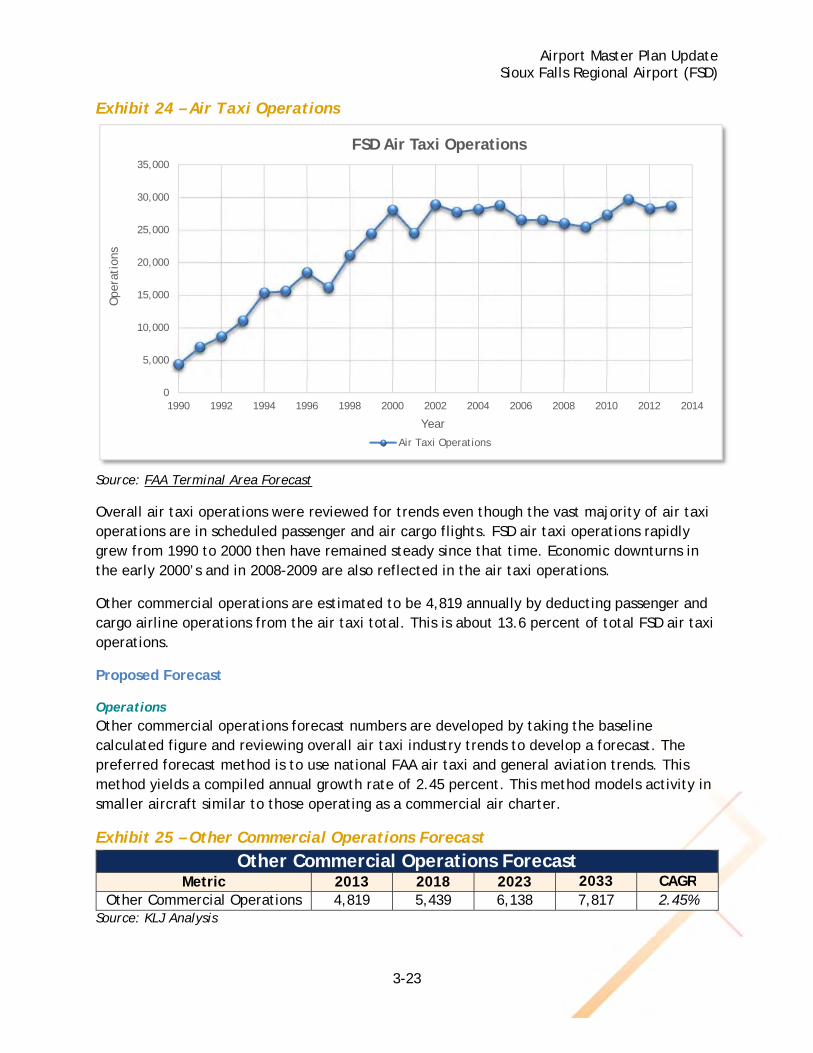
Exhibit 24 – Air Taxi Operations
Source: FAA Terminal Area Forecast
Overall air taxi operations were reviewed for trends even though the vast majority of air taxi operations are in scheduled passenger and air cargo flights. FSD air taxi operations rapidly grew from 1990 to 2000 then have remained steady since that time. Economic downturns in the early 2000’s and in 2008-2009 are also reflected in the air taxi operations.
Other commercial operations are estimated to be 4,819 annually by deducting passenger and cargo airline operations from the air taxi total. This is about 13.6 percent of total FSD air taxi operations.
Proposed Forecast
Operations Other commercial operations forecast numbers are developed by taking the baseline calculated figure and reviewing overall air taxi industry trends to develop a forecast. The preferred forecast method is to use national FAA air taxi and general aviation trends. This method yields a compiled annual growth rate of 2.45 percent. This method models activity in smaller aircraft similar to those operating as a commercial air charter.
Exhibit 25 – Other Commercial Operations Forecast
Other Commercial Operations Forecast Metric 2013 2018 2023 2033 CAGR
Other Commercial Operations 4,819 5,439 6,138 7,817 2.45% Source: KLJ Analysis
0
5,000
10,000
15,000
20,000
25,000
30,000
35,000
1990 1992 1994 1996 1998 2000 2002 2004 2006 2008 2010 2012 2014
Ope
rati
ons
Year
FSD Air Taxi Operations
Air Taxi Operations
Airport Master Plan Update Sioux Falls Regional Airport (FSD)
3-24
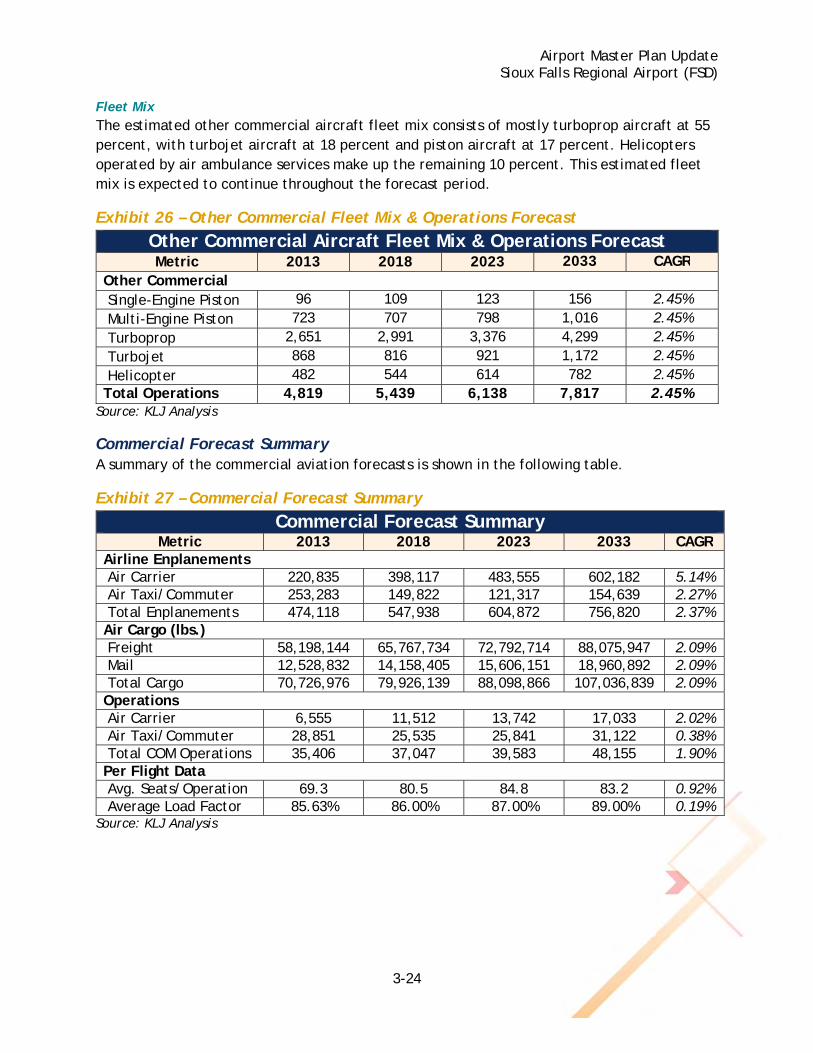
Fleet Mix The estimated other commercial aircraft fleet mix consists of mostly turboprop aircraft at 55 percent, with turbojet aircraft at 18 percent and piston aircraft at 17 percent. Helicopters operated by air ambulance services make up the remaining 10 percent. This estimated fleet mix is expected to continue throughout the forecast period.
Exhibit 26 – Other Commercial Fleet Mix & Operations Forecast
Other Commercial Aircraft Fleet Mix & Operations Forecast Metric 2013 2018 2023 2033 CAGR
Other Commercial Single-Engine Piston 96 109 123 156 2.45% Multi-Engine Piston 723 707 798 1,016 2.45% Turboprop 2,651 2,991 3,376 4,299 2.45% Turbojet 868 816 921 1,172 2.45% Helicopter 482 544 614 782 2.45% Total Operations 4,819 5,439 6,138 7,817 2.45%
Source: KLJ Analysis
Commercial Forecast Summary A summary of the commercial aviation forecasts is shown in the following table.
Exhibit 27 – Commercial Forecast Summary
Commercial Forecast Summary Metric 2013 2018 2023 2033 CAGR
Airline Enplanements Air Carrier 220,835 398,117 483,555 602,182 5.14% Air Taxi/Commuter 253,283 149,822 121,317 154,639 2.27% Total Enplanements 474,118 547,938 604,872 756,820 2.37% Air Cargo (lbs.) Freight 58,198,144 65,767,734 72,792,714 88,075,947 2.09% Mail 12,528,832 14,158,405 15,606,151 18,960,892 2.09% Total Cargo 70,726,976 79,926,139 88,098,866 107,036,839 2.09% Operations Air Carrier 6,555 11,512 13,742 17,033 2.02% Air Taxi/Commuter 28,851 25,535 25,841 31,122 0.38% Total COM Operations 35,406 37,047 39,583 48,155 1.90% Per Flight Data Avg. Seats/Operation 69.3 80.5 84.8 83.2 0.92% Average Load Factor 85.63% 86.00% 87.00% 89.00% 0.19%
Source: KLJ Analysis
Airport Master Plan Update Sioux Falls Regional Airport (FSD)
3-25
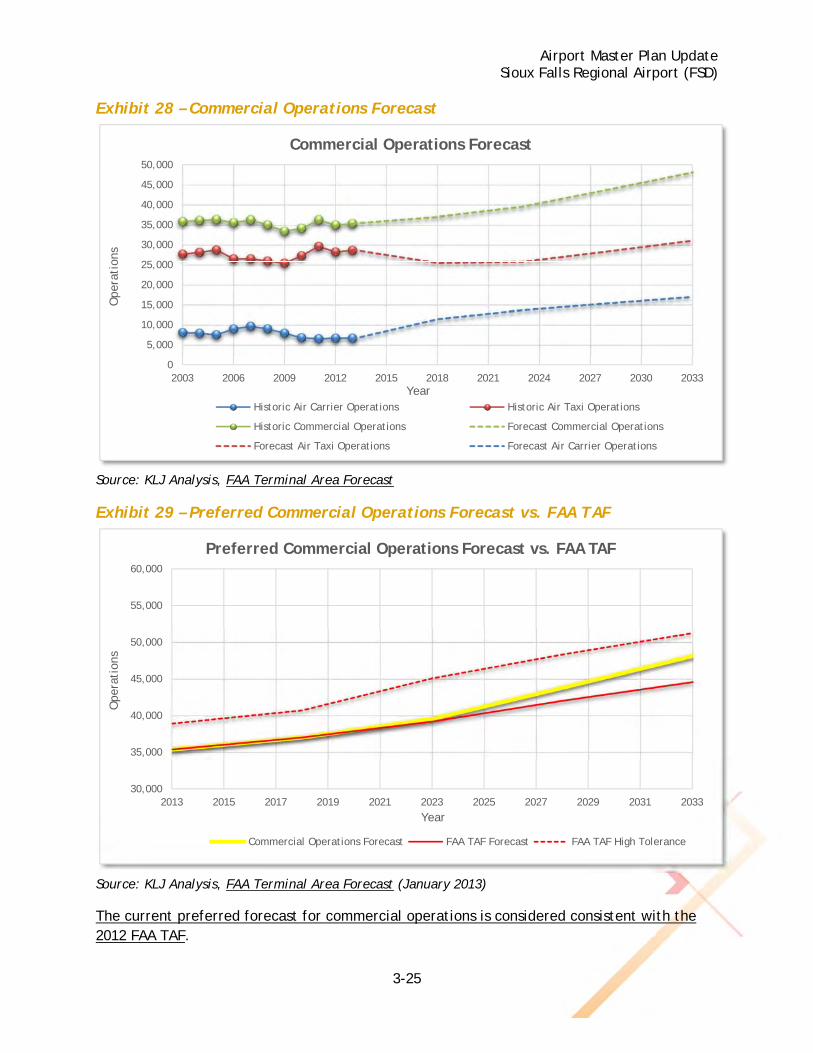
Exhibit 28 – Commercial Operations Forecast
Source: KLJ Analysis, FAA Terminal Area Forecast
Exhibit 29 – Preferred Commercial Operations Forecast vs. FAA TAF
Source: KLJ Analysis, FAA Terminal Area Forecast (January 2013)
The current preferred forecast for commercial operations is considered consistent with the 2012 FAA TAF.
0
5,000
10,000
15,000
20,000
25,000
30,000
35,000
40,000
45,000
50,000
2003 2006 2009 2012 2015 2018 2021 2024 2027 2030 2033
Ope
rati
ons
Year
Commercial Operations Forecast
Historic Air Carrier Operations Historic Air Taxi Operations
Historic Commercial Operations Forecast Commercial Operations
Forecast Air Taxi Operations Forecast Air Carrier Operations
30,000
35,000
40,000
45,000
50,000
55,000
60,000
2013 2015 2017 2019 2021 2023 2025 2027 2029 2031 2033
Ope
rati
ons
Year
Preferred Commercial Operations Forecast vs. FAA TAF
Commercial Operations Forecast FAA TAF Forecast FAA TAF High Tolerance
Airport Master Plan Update Sioux Falls Regional Airport (FSD)
3-26
Based Aircraft Forecasts A based aircraft is an operational and airworthy aircraft based at the airport for a majority of the year. These are generally non-commercial general aviation and commercial air taxi aircraft.
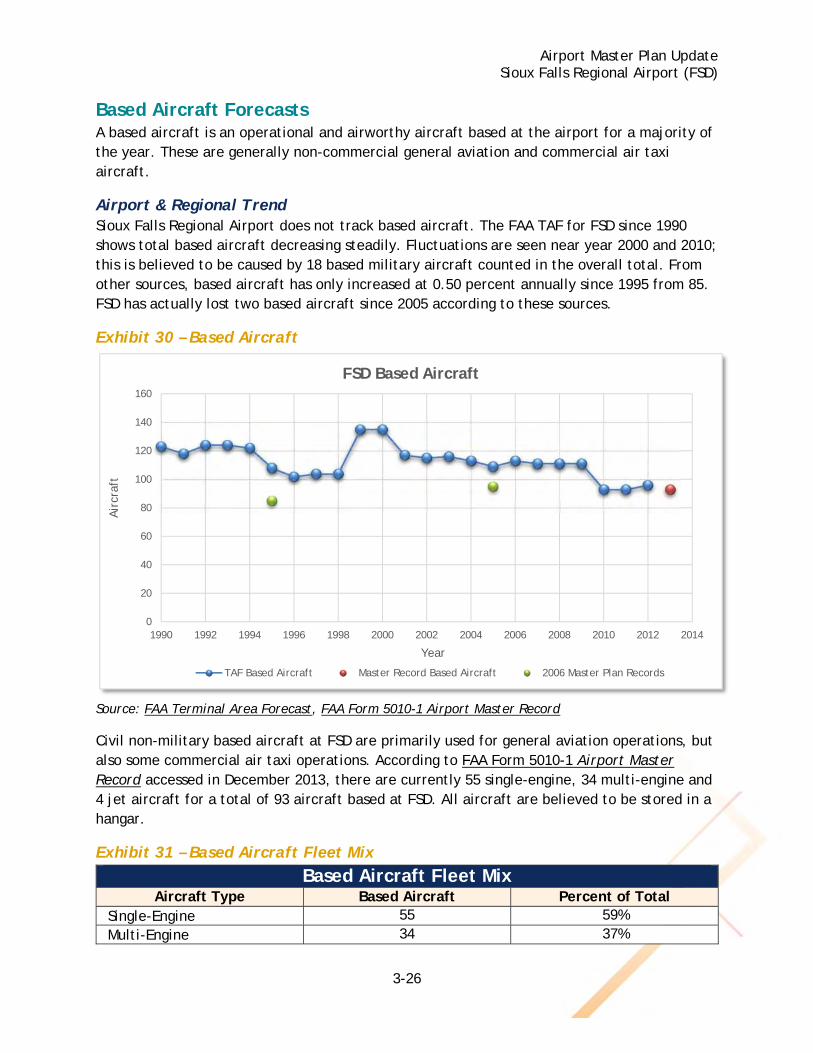
Airport & Regional Trend Sioux Falls Regional Airport does not track based aircraft. The FAA TAF for FSD since 1990 shows total based aircraft decreasing steadily. Fluctuations are seen near year 2000 and 2010; this is believed to be caused by 18 based military aircraft counted in the overall total. From other sources, based aircraft has only increased at 0.50 percent annually since 1995 from 85. FSD has actually lost two based aircraft since 2005 according to these sources.
Exhibit 30 – Based Aircraft
Source: FAA Terminal Area Forecast, FAA Form 5010-1 Airport Master Record
Civil non-military based aircraft at FSD are primarily used for general aviation operations, but also some commercial air taxi operations. According to FAA Form 5010-1 Airport Master Record accessed in December 2013, there are currently 55 single-engine, 34 multi-engine and 4 jet aircraft for a total of 93 aircraft based at FSD. All aircraft are believed to be stored in a hangar.
Exhibit 31 – Based Aircraft Fleet Mix
Based Aircraft Fleet Mix Aircraft Type Based Aircraft Percent of Total
Single-Engine 55 59% Multi-Engine 34 37%
0
20
40
60
80
100
120
140
160
1990 1992 1994 1996 1998 2000 2002 2004 2006 2008 2010 2012 2014
Air
craf
t
Year
FSD Based Aircraft
TAF Based Aircraft Master Record Based Aircraft 2006 Master Plan Records
Airport Master Plan Update Sioux Falls Regional Airport (FSD)
3-27
Jet 4 4% Helicopter 0 0% Other 0 0% Total Based Aircraft 93 100%
Source: FAA Form 5010-1 Airport Master Record
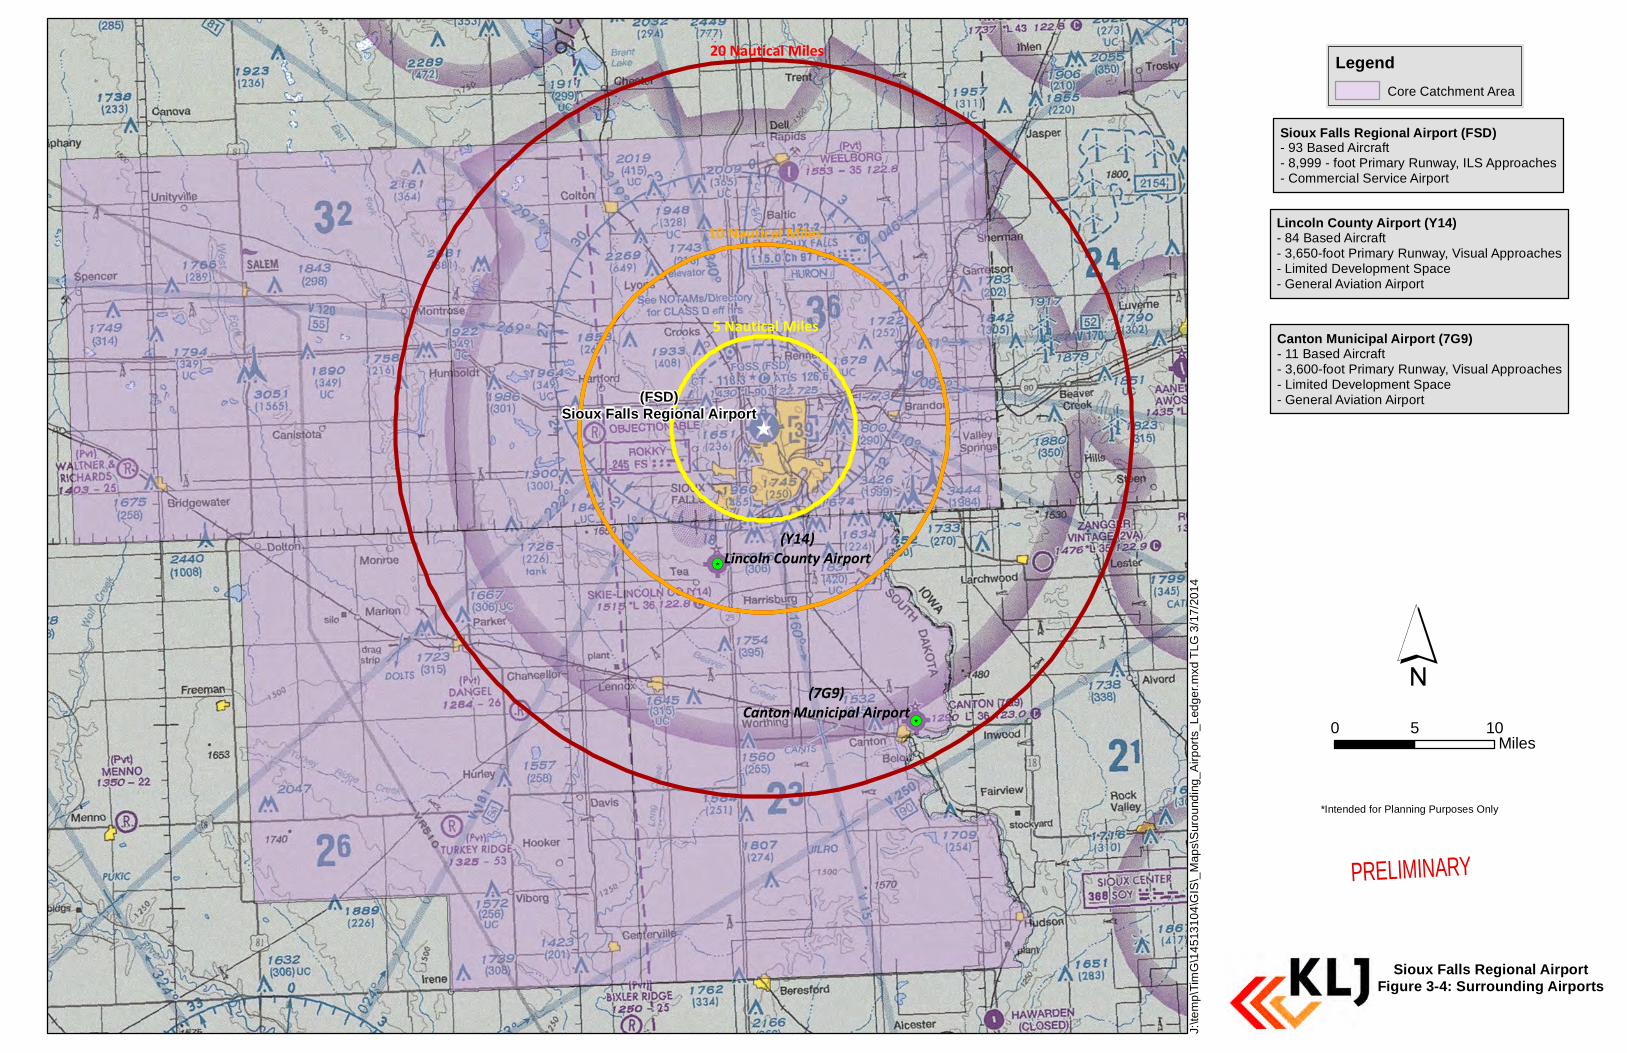
An important local and regional consideration is the evolution of FSD into a corporate and commercial aviation facility. Many of the aircraft based at FSD are small single and multi-engine general aviation aircraft used for flight training, recreational flying and business transport. Airplanes for recreational and flight training use and their resulting flight operations have been trending to other area airports if there has been available space. The loss of small aircraft has been offset by new general aviation and air taxi aircraft basing at FSD for business corporate use. FSD is home to 26 percent of the region’s registered aircraft. A detailed discussion about the surrounding airports and their effect on FSD is included in Appendix X.
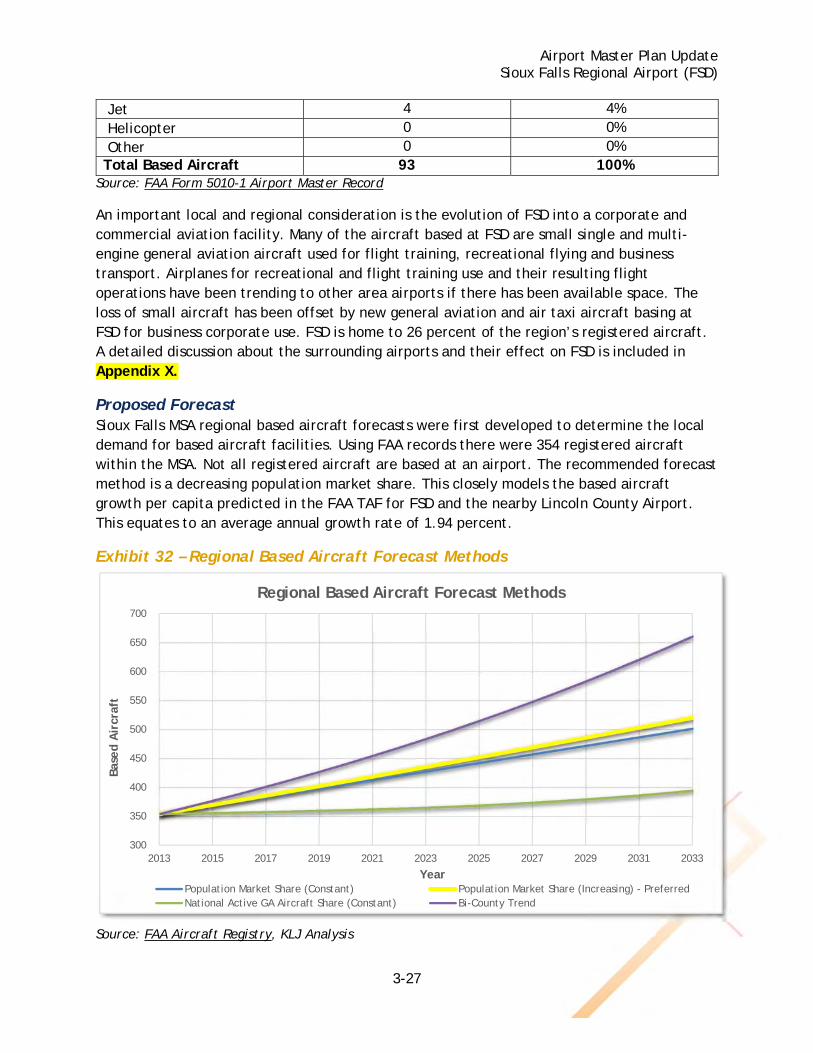
Proposed Forecast Sioux Falls MSA regional based aircraft forecasts were first developed to determine the local demand for based aircraft facilities. Using FAA records there were 354 registered aircraft within the MSA. Not all registered aircraft are based at an airport. The recommended forecast method is a decreasing population market share. This closely models the based aircraft growth per capita predicted in the FAA TAF for FSD and the nearby Lincoln County Airport. This equates to an average annual growth rate of 1.94 percent.
Exhibit 32 – Regional Based Aircraft Forecast Methods
Source: FAA Aircraft Registry, KLJ Analysis
300
350
400
450
500
550
600
650
700
2013 2015 2017 2019 2021 2023 2025 2027 2029 2031 2033
Bas
ed A
ircr
aft
Year
Regional Based Aircraft Forecast Methods
Population Market Share (Constant) Population Market Share (Increasing) - PreferredNational Active GA Aircraft Share (Constant) Bi-County Trend
Airport Master Plan Update Sioux Falls Regional Airport (FSD)
3-28
To forecast FSD based aircraft, an evaluation of the airport’s based aircraft market share within the region is performed. Various scenarios in different time periods to develop the overall recommended forecast. It is estimated FSD based aircraft will grow at a marginal growth rate for the short-term following historical trends of a rapidly decreasing market share (Scenario #1). Any new based aircraft will likely be larger corporate aircraft. Through the mid-term growth will follow regional trends and the FSD share of based aircraft will stabilize as new corporate based aircraft select FSD (Scenario #2). Small aircraft will select other airports over FSD if there is available infrastructure. Long-term forecasts estimate the market share to be constant with based aircraft growth continuing at a higher average annual growth rate (Scenario #3). FSD based aircraft is forecast to grow from 93 currently to 127 at the end of the forecast period for an average annual growth rate of 1.57 percent.
Airport Master Plan Update Sioux Falls Regional Airport (FSD)
3-30
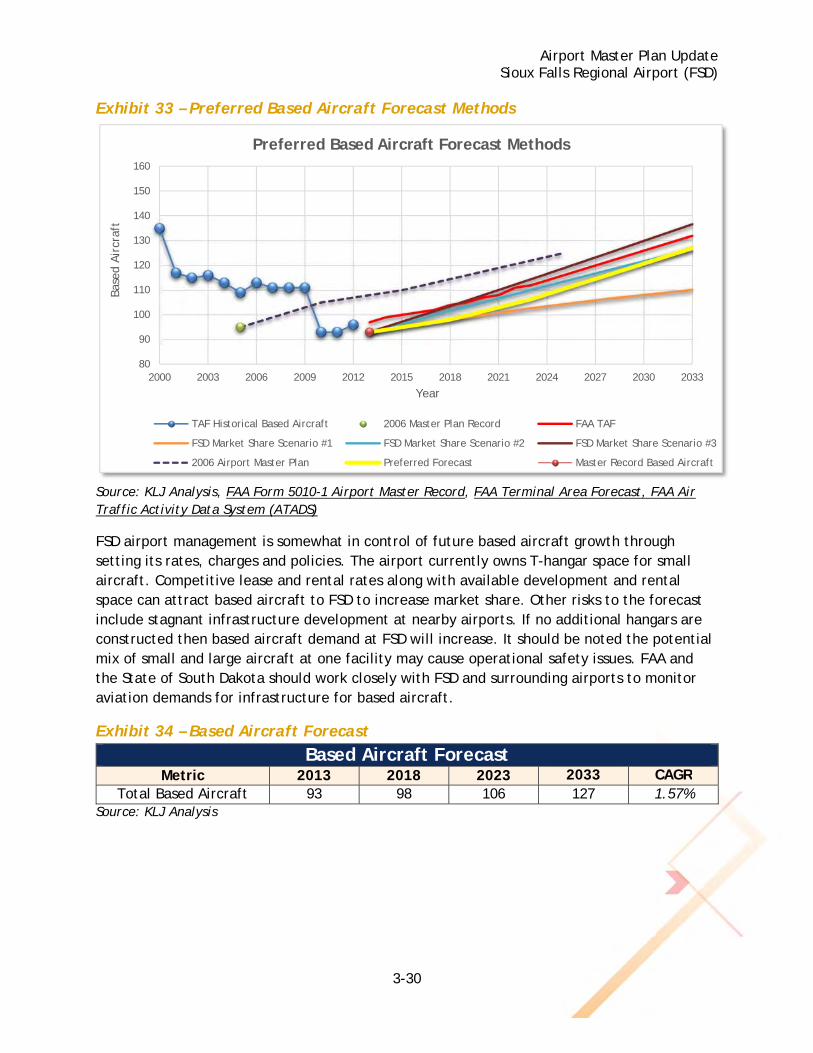
Exhibit 33 – Preferred Based Aircraft Forecast Methods
Source: KLJ Analysis, FAA Form 5010-1 Airport Master Record, FAA Terminal Area Forecast, FAA Air Traffic Activity Data System (ATADS)
FSD airport management is somewhat in control of future based aircraft growth through setting its rates, charges and policies. The airport currently owns T-hangar space for small aircraft. Competitive lease and rental rates along with available development and rental space can attract based aircraft to FSD to increase market share. Other risks to the forecast include stagnant infrastructure development at nearby airports. If no additional hangars are constructed then based aircraft demand at FSD will increase. It should be noted the potential mix of small and large aircraft at one facility may cause operational safety issues. FAA and the State of South Dakota should work closely with FSD and surrounding airports to monitor aviation demands for infrastructure for based aircraft.
Exhibit 34 – Based Aircraft Forecast
Based Aircraft Forecast Metric 2013 2018 2023 2033 CAGR
Total Based Aircraft 93 98 106 127 1.57% Source: KLJ Analysis
80
90
100
110
120
130
140
150
160
2000 2003 2006 2009 2012 2015 2018 2021 2024 2027 2030 2033
Base
d Air
craf
t
Year
Preferred Based Aircraft Forecast Methods
TAF Historical Based Aircraft 2006 Master Plan Record FAA TAF
FSD Market Share Scenario #1 FSD Market Share Scenario #2 FSD Market Share Scenario #3
2006 Airport Master Plan Preferred Forecast Master Record Based Aircraft
Airport Master Plan Update Sioux Falls Regional Airport (FSD)
3-31
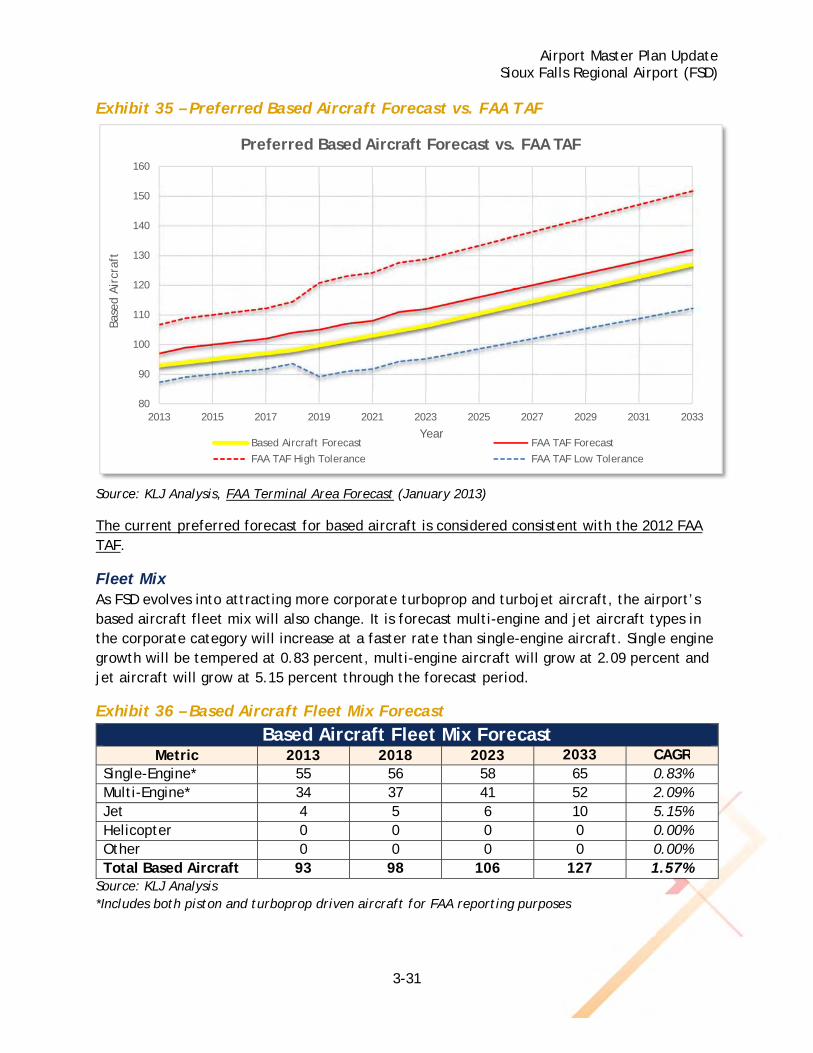
Exhibit 35 – Preferred Based Aircraft Forecast vs. FAA TAF
Source: KLJ Analysis, FAA Terminal Area Forecast (January 2013)
The current preferred forecast for based aircraft is considered consistent with the 2012 FAA TAF.
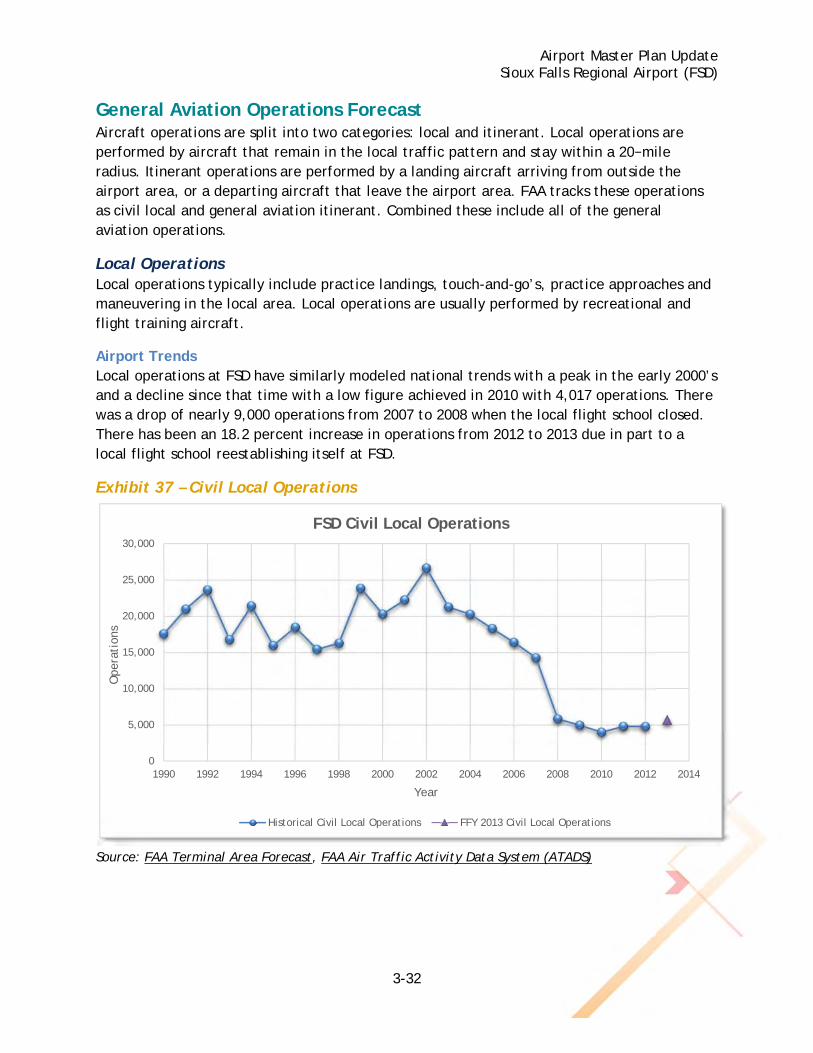
Fleet Mix As FSD evolves into attracting more corporate turboprop and turbojet aircraft, the airport’s based aircraft fleet mix will also change. It is forecast multi-engine and jet aircraft types in the corporate category will increase at a faster rate than single-engine aircraft. Single engine growth will be tempered at 0.83 percent, multi-engine aircraft will grow at 2.09 percent and jet aircraft will grow at 5.15 percent through the forecast period.
Exhibit 36 – Based Aircraft Fleet Mix Forecast
Based Aircraft Fleet Mix Forecast Metric 2013 2018 2023 2033 CAGR
Single-Engine* 55 56 58 65 0.83% Multi-Engine* 34 37 41 52 2.09% Jet 4 5 6 10 5.15% Helicopter 0 0 0 0 0.00% Other 0 0 0 0 0.00% Total Based Aircraft 93 98 106 127 1.57%
Source: KLJ Analysis *Includes both piston and turboprop driven aircraft for FAA reporting purposes
80
90
100
110
120
130
140
150
160
2013 2015 2017 2019 2021 2023 2025 2027 2029 2031 2033
Base
d Air
craf
t
Year
Preferred Based Aircraft Forecast vs. FAA TAF
Based Aircraft Forecast FAA TAF Forecast
FAA TAF High Tolerance FAA TAF Low Tolerance
Airport Master Plan Update Sioux Falls Regional Airport (FSD)
3-32
General Aviation Operations Forecast Aircraft operations are split into two categories: local and itinerant. Local operations are performed by aircraft that remain in the local traffic pattern and stay within a 20−mile radius. Itinerant operations are performed by a landing aircraft arriving from outside the airport area, or a departing aircraft that leave the airport area. FAA tracks these operations as civil local and general aviation itinerant. Combined these include all of the general aviation operations.
Local Operations Local operations typically include practice landings, touch-and-go’s, practice approaches and maneuvering in the local area. Local operations are usually performed by recreational and flight training aircraft.
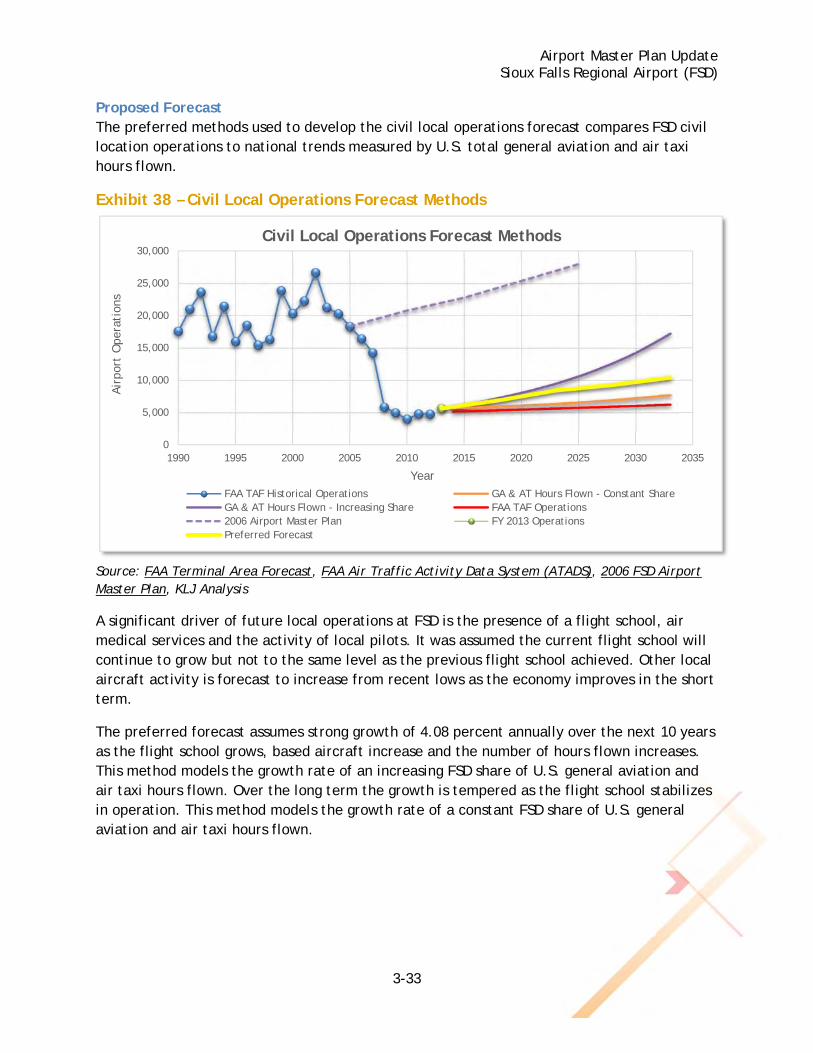
Airport Trends Local operations at FSD have similarly modeled national trends with a peak in the early 2000’s and a decline since that time with a low figure achieved in 2010 with 4,017 operations. There was a drop of nearly 9,000 operations from 2007 to 2008 when the local flight school closed. There has been an 18.2 percent increase in operations from 2012 to 2013 due in part to a local flight school reestablishing itself at FSD.
Exhibit 37 – Civil Local Operations
Source: FAA Terminal Area Forecast, FAA Air Traffic Activity Data System (ATADS)
0
5,000
10,000
15,000
20,000
25,000
30,000
1990 1992 1994 1996 1998 2000 2002 2004 2006 2008 2010 2012 2014
Ope
rati
ons
Year
FSD Civil Local Operations
Historical Civil Local Operations FFY 2013 Civil Local Operations
Airport Master Plan Update Sioux Falls Regional Airport (FSD)
3-33
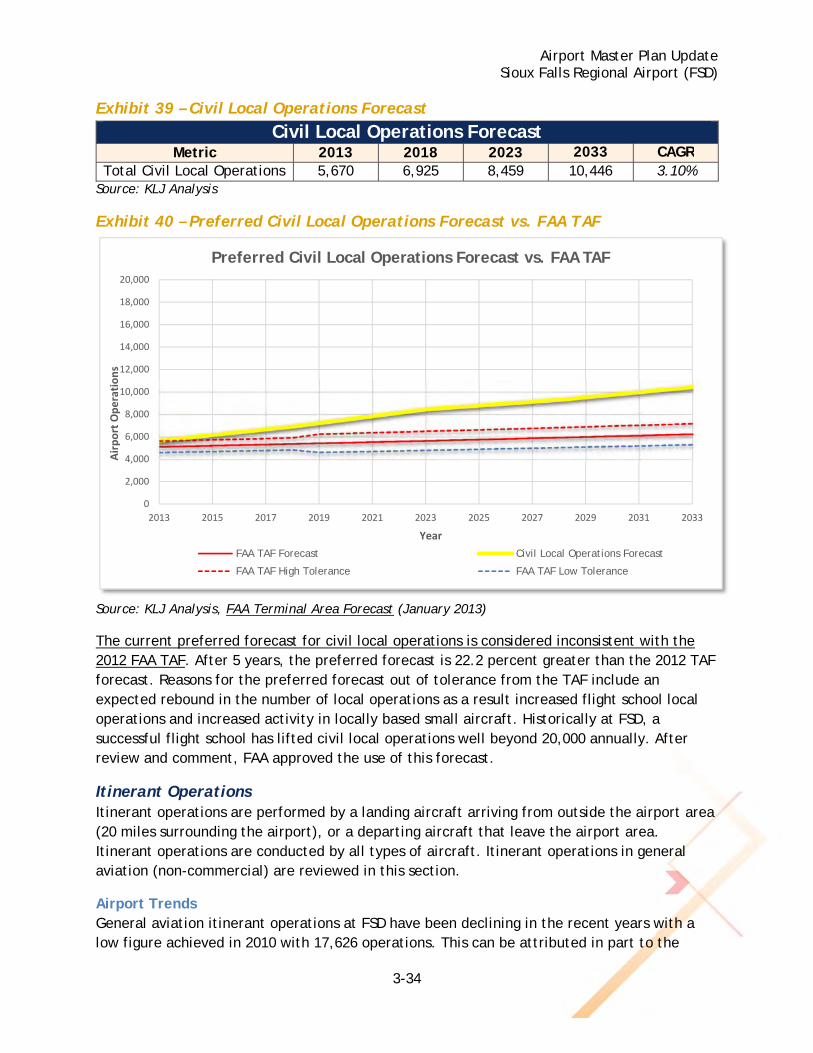
Proposed Forecast The preferred methods used to develop the civil local operations forecast compares FSD civil location operations to national trends measured by U.S. total general aviation and air taxi hours flown.
Exhibit 38 – Civil Local Operations Forecast Methods
Source: FAA Terminal Area Forecast, FAA Air Traffic Activity Data System (ATADS), 2006 FSD Airport Master Plan, KLJ Analysis
A significant driver of future local operations at FSD is the presence of a flight school, air medical services and the activity of local pilots. It was assumed the current flight school will continue to grow but not to the same level as the previous flight school achieved. Other local aircraft activity is forecast to increase from recent lows as the economy improves in the short term.
The preferred forecast assumes strong growth of 4.08 percent annually over the next 10 years as the flight school grows, based aircraft increase and the number of hours flown increases. This method models the growth rate of an increasing FSD share of U.S. general aviation and air taxi hours flown. Over the long term the growth is tempered as the flight school stabilizes in operation. This method models the growth rate of a constant FSD share of U.S. general aviation and air taxi hours flown.
0
5,000
10,000
15,000
20,000
25,000
30,000
1990 1995 2000 2005 2010 2015 2020 2025 2030 2035
Air
port
Ope
rati
ons
Year
Civil Local Operations Forecast Methods
FAA TAF Historical Operations GA & AT Hours Flown - Constant ShareGA & AT Hours Flown - Increasing Share FAA TAF Operations2006 Airport Master Plan FY 2013 OperationsPreferred Forecast
Airport Master Plan Update Sioux Falls Regional Airport (FSD)
3-34
Exhibit 39 – Civil Local Operations Forecast
Civil Local Operations Forecast Metric 2013 2018 2023 2033 CAGR
Total Civil Local Operations 5,670 6,925 8,459 10,446 3.10% Source: KLJ Analysis
Exhibit 40 – Preferred Civil Local Operations Forecast vs. FAA TAF
Source: KLJ Analysis, FAA Terminal Area Forecast (January 2013)
The current preferred forecast for civil local operations is considered inconsistent with the 2012 FAA TAF. After 5 years, the preferred forecast is 22.2 percent greater than the 2012 TAF forecast. Reasons for the preferred forecast out of tolerance from the TAF include an expected rebound in the number of local operations as a result increased flight school local operations and increased activity in locally based small aircraft. Historically at FSD, a successful flight school has lifted civil local operations well beyond 20,000 annually. After review and comment, FAA approved the use of this forecast.
Itinerant Operations Itinerant operations are performed by a landing aircraft arriving from outside the airport area (20 miles surrounding the airport), or a departing aircraft that leave the airport area. Itinerant operations are conducted by all types of aircraft. Itinerant operations in general aviation (non-commercial) are reviewed in this section.
Airport Trends General aviation itinerant operations at FSD have been declining in the recent years with a low figure achieved in 2010 with 17,626 operations. This can be attributed in part to the
0
2,000
4,000
6,000
8,000
10,000
12,000
14,000
16,000
18,000
20,000
2013 2015 2017 2019 2021 2023 2025 2027 2029 2031 2033
Airport Operations
Year
Preferred Civil Local Operations Forecast vs. FAA TAF
FAA TAF Forecast Civil Local Operations Forecast
FAA TAF High Tolerance FAA TAF Low Tolerance
Airport Master Plan Update Sioux Falls Regional Airport (FSD)
3-35
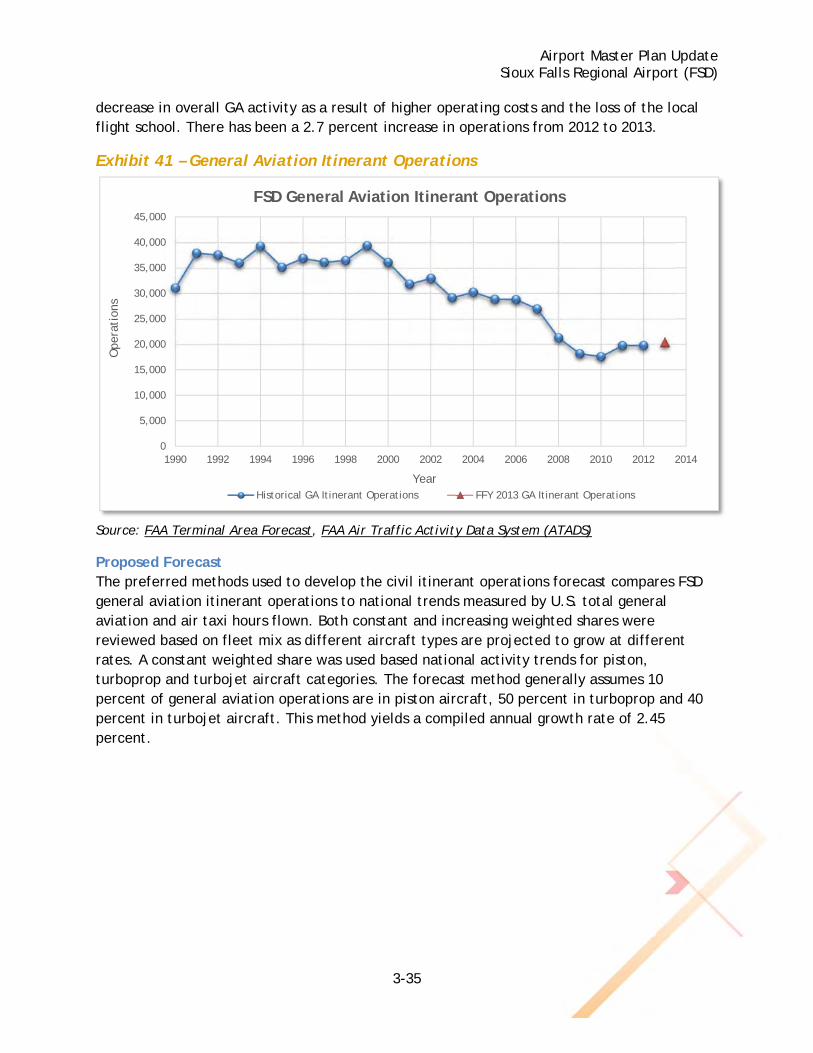
decrease in overall GA activity as a result of higher operating costs and the loss of the local flight school. There has been a 2.7 percent increase in operations from 2012 to 2013.
Exhibit 41 – General Aviation Itinerant Operations
Source: FAA Terminal Area Forecast, FAA Air Traffic Activity Data System (ATADS)
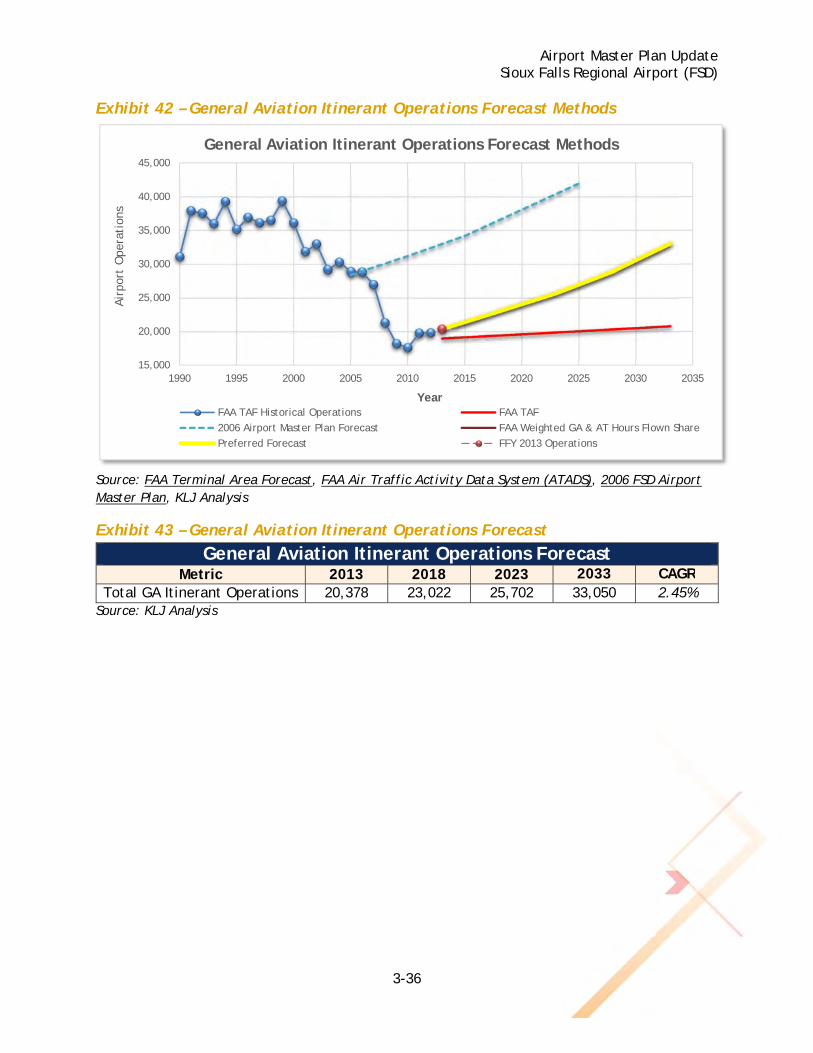
Proposed Forecast The preferred methods used to develop the civil itinerant operations forecast compares FSD general aviation itinerant operations to national trends measured by U.S. total general aviation and air taxi hours flown. Both constant and increasing weighted shares were reviewed based on fleet mix as different aircraft types are projected to grow at different rates. A constant weighted share was used based national activity trends for piston, turboprop and turbojet aircraft categories. The forecast method generally assumes 10 percent of general aviation operations are in piston aircraft, 50 percent in turboprop and 40 percent in turbojet aircraft. This method yields a compiled annual growth rate of 2.45 percent.
0
5,000
10,000
15,000
20,000
25,000
30,000
35,000
40,000
45,000
1990 1992 1994 1996 1998 2000 2002 2004 2006 2008 2010 2012 2014
Ope
rati
ons
Year
FSD General Aviation Itinerant Operations
Historical GA Itinerant Operations FFY 2013 GA Itinerant Operations
Airport Master Plan Update Sioux Falls Regional Airport (FSD)
3-36
Exhibit 42 – General Aviation Itinerant Operations Forecast Methods
Source: FAA Terminal Area Forecast, FAA Air Traffic Activity Data System (ATADS), 2006 FSD Airport Master Plan, KLJ Analysis
Exhibit 43 – General Aviation Itinerant Operations Forecast
General Aviation Itinerant Operations Forecast Metric 2013 2018 2023 2033 CAGR
Total GA Itinerant Operations 20,378 23,022 25,702 33,050 2.45% Source: KLJ Analysis
15,000
20,000
25,000
30,000
35,000
40,000
45,000
1990 1995 2000 2005 2010 2015 2020 2025 2030 2035
Air
port
Ope
rati
ons
Year
General Aviation Itinerant Operations Forecast Methods
FAA TAF Historical Operations FAA TAF
2006 Airport Master Plan Forecast FAA Weighted GA & AT Hours Flown Share
Preferred Forecast FFY 2013 Operations
Airport Master Plan Update Sioux Falls Regional Airport (FSD)
3-37
Exhibit 44 – Preferred GA Itinerant Operations Forecast vs. FAA TAF
Source: KLJ Analysis, FAA Terminal Area Forecast (January 2013)
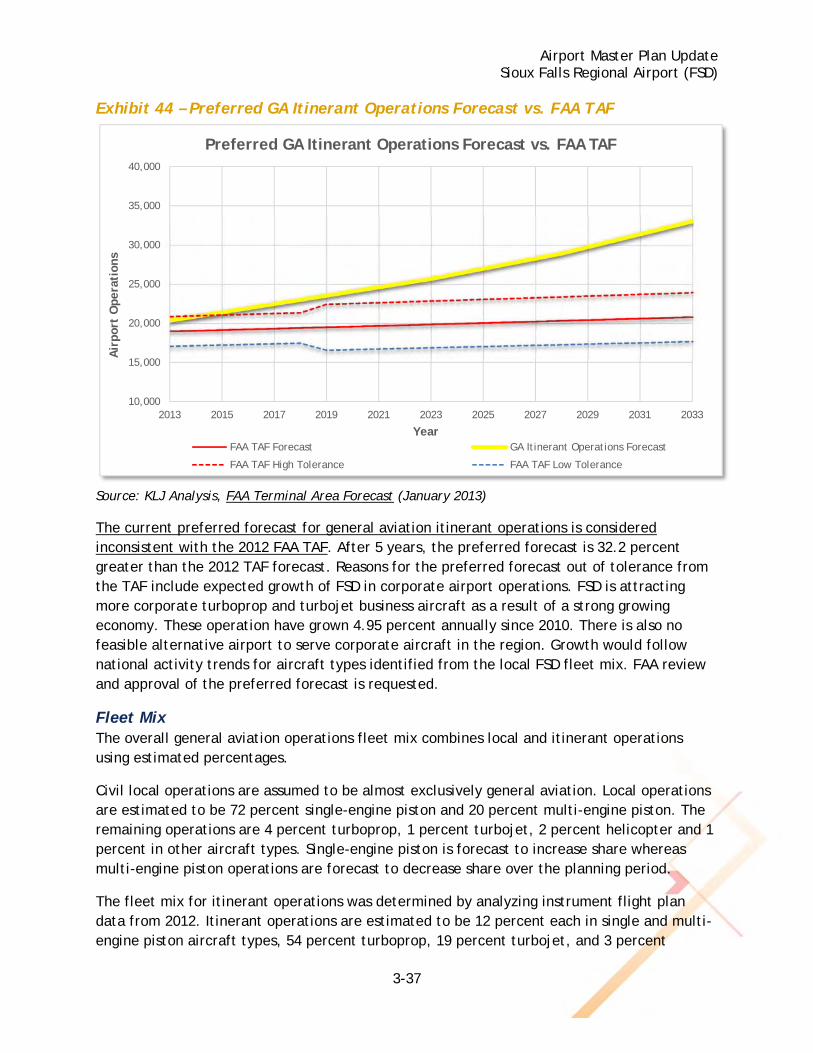
The current preferred forecast for general aviation itinerant operations is considered inconsistent with the 2012 FAA TAF. After 5 years, the preferred forecast is 32.2 percent greater than the 2012 TAF forecast. Reasons for the preferred forecast out of tolerance from the TAF include expected growth of FSD in corporate airport operations. FSD is attracting more corporate turboprop and turbojet business aircraft as a result of a strong growing economy. These operation have grown 4.95 percent annually since 2010. There is also no feasible alternative airport to serve corporate aircraft in the region. Growth would follow national activity trends for aircraft types identified from the local FSD fleet mix. FAA review and approval of the preferred forecast is requested.
Fleet Mix The overall general aviation operations fleet mix combines local and itinerant operations using estimated percentages.
Civil local operations are assumed to be almost exclusively general aviation. Local operations are estimated to be 72 percent single-engine piston and 20 percent multi-engine piston. The remaining operations are 4 percent turboprop, 1 percent turbojet, 2 percent helicopter and 1 percent in other aircraft types. Single-engine piston is forecast to increase share whereas multi-engine piston operations are forecast to decrease share over the planning period.
The fleet mix for itinerant operations was determined by analyzing instrument flight plan data from 2012. Itinerant operations are estimated to be 12 percent each in single and multi-engine piston aircraft types, 54 percent turboprop, 19 percent turbojet, and 3 percent
10,000
15,000
20,000
25,000
30,000
35,000
40,000
2013 2015 2017 2019 2021 2023 2025 2027 2029 2031 2033
Air
por
t O
per
atio
ns
Year
Preferred GA Itinerant Operations Forecast vs. FAA TAF
FAA TAF Forecast GA Itinerant Operations Forecast
FAA TAF High Tolerance FAA TAF Low Tolerance
Airport Master Plan Update Sioux Falls Regional Airport (FSD)
3-38
helicopter. Over time multi-engine piston aircraft share will decrease and turbojet will increase.
Overall, single-engine piston operations are forecast to increase share because of the return of more local operations in lieu of multi-engine piston aircraft. Turboprop operations still makeup the majority of GA itinerant operations with an estimated 43.1 percent of total operations.
Exhibit 45 – General Aviation Operations Fleet Mix Forecast
General Aviation Operations Fleet Mix Forecast Metric 2013 2018 2023 2033 CAGR
Single-Engine Piston 6,528 7,818 9,344 11,905 3.05% Multi-Engine Piston 3,579 3,963 4,350 4,976 1.66% Turboprop 11,231 12,709 14,217 18,265 2.46% Turbojet 3,929 4,559 5,225 7,045 2.96% Helicopter 725 829 940 1,200 2.56% Other 57 69 85 104 3.10% Total Operations 26,048 29,947 34,161 43,497 2.60%
Source: KLJ Analysis
Forecast Summary A summary of the civil local and general aviation itinerant forecasts is shown in the following table.
Exhibit 46 – General Aviation Operations Forecast Summary
General Aviation Operations Forecast Summary Metric 2013 2018 2023 2033 CAGR
Local Operations 5,670 6,925 8,459 10,446 3.10% Itinerant Operations 20,378 23,022 25,702 33,050 2.45% Total Operations 26,048 29,947 34,161 43,497 2.60%
Local Share 21.76% 30.08% 24.76% 24.02% - Itinerant Share 78.24% 69.92% 75.24% 75.98% -
Source: KLJ Analysis
Airport Master Plan Update Sioux Falls Regional Airport (FSD)
3-39
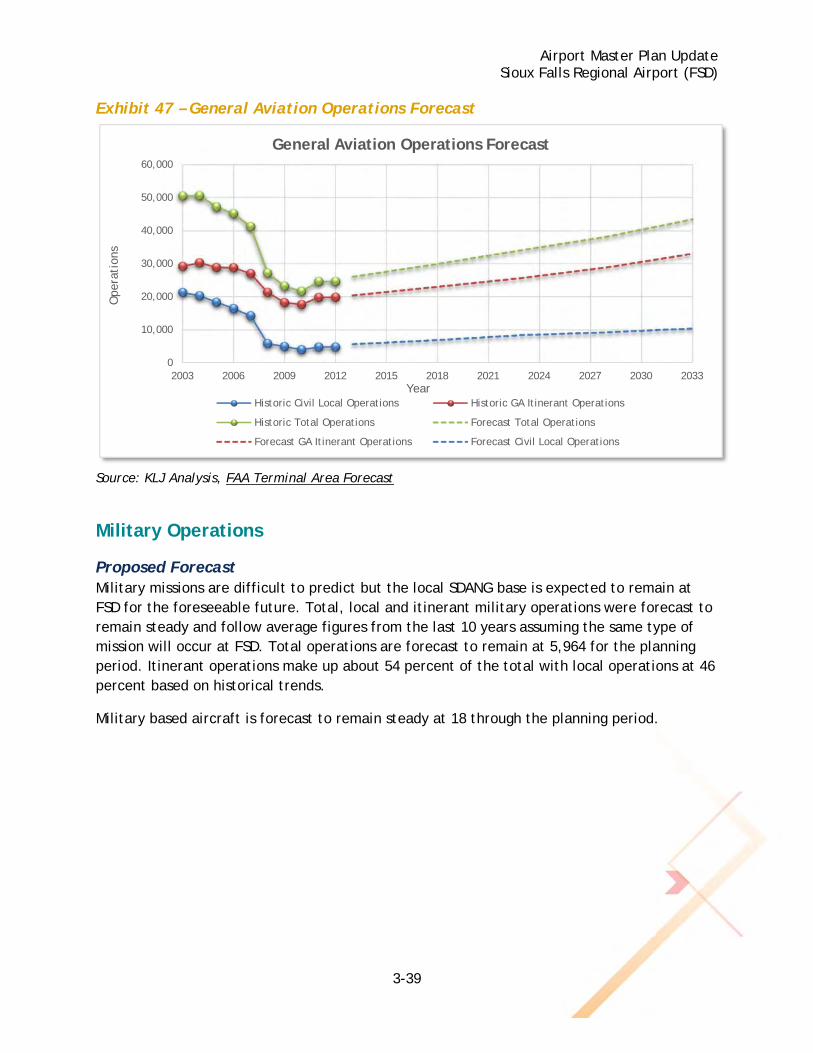
Exhibit 47 – General Aviation Operations Forecast
Source: KLJ Analysis, FAA Terminal Area Forecast
Military Operations
Proposed Forecast Military missions are difficult to predict but the local SDANG base is expected to remain at FSD for the foreseeable future. Total, local and itinerant military operations were forecast to remain steady and follow average figures from the last 10 years assuming the same type of mission will occur at FSD. Total operations are forecast to remain at 5,964 for the planning period. Itinerant operations make up about 54 percent of the total with local operations at 46 percent based on historical trends.
Military based aircraft is forecast to remain steady at 18 through the planning period.
0
10,000
20,000
30,000
40,000
50,000
60,000
2003 2006 2009 2012 2015 2018 2021 2024 2027 2030 2033
Ope
rati
ons
Year
General Aviation Operations Forecast
Historic Civil Local Operations Historic GA Itinerant Operations
Historic Total Operations Forecast Total Operations
Forecast GA Itinerant Operations Forecast Civil Local Operations
Airport Master Plan Update Sioux Falls Regional Airport (FSD)
3-40
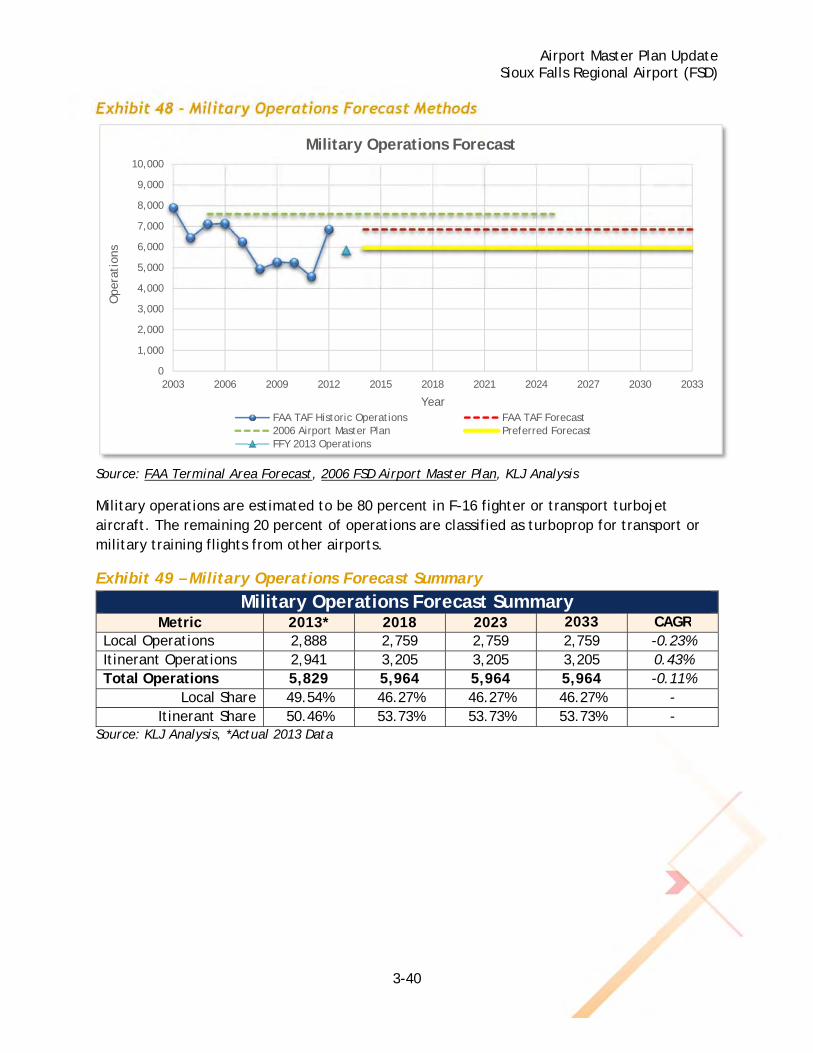
Exhibit 48 – Military Operations Forecast Methods
Source: FAA Terminal Area Forecast, 2006 FSD Airport Master Plan, KLJ Analysis
Military operations are estimated to be 80 percent in F-16 fighter or transport turbojet aircraft. The remaining 20 percent of operations are classified as turboprop for transport or military training flights from other airports.
Exhibit 49 – Military Operations Forecast Summary
Military Operations Forecast Summary Metric 2013* 2018 2023 2033 CAGR
Local Operations 2,888 2,759 2,759 2,759 -0.23% Itinerant Operations 2,941 3,205 3,205 3,205 0.43% Total Operations 5,829 5,964 5,964 5,964 -0.11%
Local Share 49.54% 46.27% 46.27% 46.27% - Itinerant Share 50.46% 53.73% 53.73% 53.73% -
Source: KLJ Analysis, *Actual 2013 Data
0
1,000
2,000
3,000
4,000
5,000
6,000
7,000
8,000
9,000
10,000
2003 2006 2009 2012 2015 2018 2021 2024 2027 2030 2033
Ope
rati
ons
Year
Military Operations Forecast
FAA TAF Historic Operations FAA TAF Forecast2006 Airport Master Plan Preferred ForecastFFY 2013 Operations
Airport Master Plan Update Sioux Falls Regional Airport (FSD)
3-41
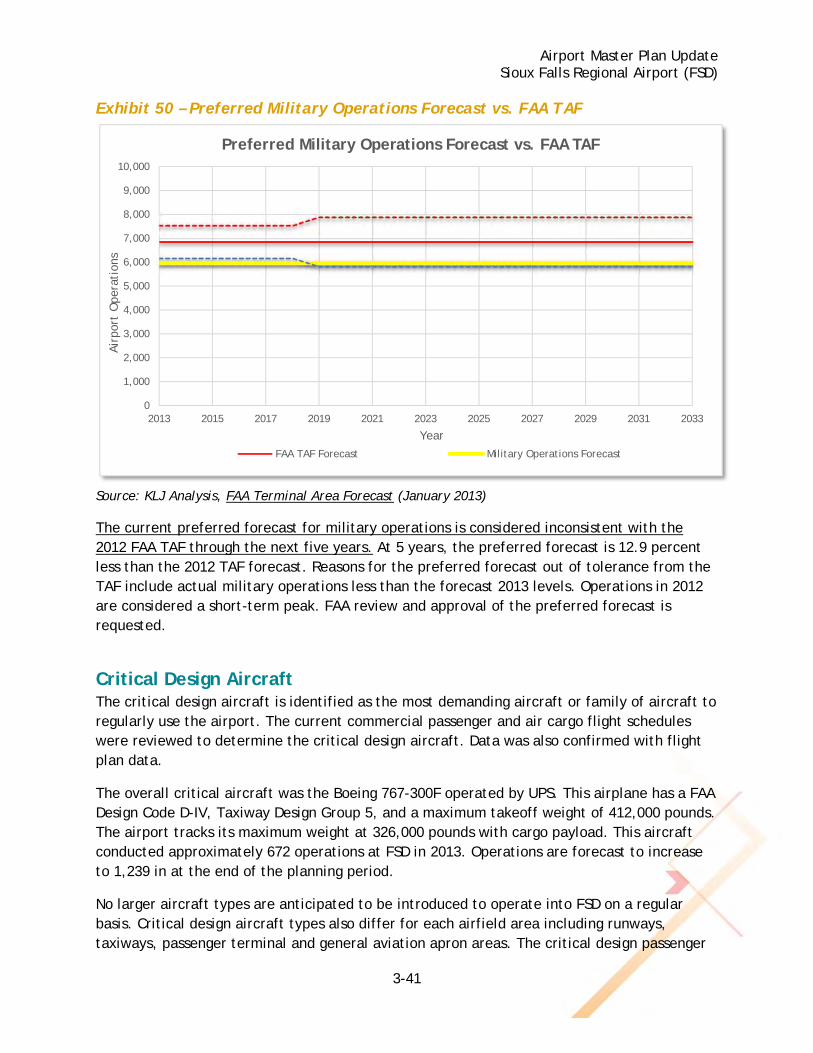
Exhibit 50 – Preferred Military Operations Forecast vs. FAA TAF
Source: KLJ Analysis, FAA Terminal Area Forecast (January 2013)
The current preferred forecast for military operations is considered inconsistent with the 2012 FAA TAF through the next five years. At 5 years, the preferred forecast is 12.9 percent less than the 2012 TAF forecast. Reasons for the preferred forecast out of tolerance from the TAF include actual military operations less than the forecast 2013 levels. Operations in 2012 are considered a short-term peak. FAA review and approval of the preferred forecast is requested.
Critical Design Aircraft The critical design aircraft is identified as the most demanding aircraft or family of aircraft to regularly use the airport. The current commercial passenger and air cargo flight schedules were reviewed to determine the critical design aircraft. Data was also confirmed with flight plan data.
The overall critical aircraft was the Boeing 767-300F operated by UPS. This airplane has a FAA Design Code D-IV, Taxiway Design Group 5, and a maximum takeoff weight of 412,000 pounds. The airport tracks its maximum weight at 326,000 pounds with cargo payload. This aircraft conducted approximately 672 operations at FSD in 2013. Operations are forecast to increase to 1,239 in at the end of the planning period.
No larger aircraft types are anticipated to be introduced to operate into FSD on a regular basis. Critical design aircraft types also differ for each airfield area including runways, taxiways, passenger terminal and general aviation apron areas. The critical design passenger
0
1,000
2,000
3,000
4,000
5,000
6,000
7,000
8,000
9,000
10,000
2013 2015 2017 2019 2021 2023 2025 2027 2029 2031 2033
Air
port
Ope
rati
ons
Year
Preferred Military Operations Forecast vs. FAA TAF
FAA TAF Forecast Military Operations Forecast
Airport Master Plan Update Sioux Falls Regional Airport (FSD)
3-42
aircraft is Allegiant’s MD-83 and MD-88 aircraft with an FAA Design Code D-III. These aircraft types operate 1,248 operations annually based on an annualized flight schedule in 2013.
It should be noted that diverted passenger aircraft from Chicago and Minneapolis also utilize FSD during irregular operations that may have larger design classifications.
Exhibit 51 – Critical Design Aircraft Characteristics
Critical Design Aircraft Characteristics Aircraft Type (Operator) FAA ARC Taxiway Design Group MTOW
Boeing 767-300F/ER (UPS) D-IV 5 412,000 Source: KLJ Analysis Note: ARC = FAA Airport Reference Code, MTOW = Maximum Takeoff Weight *Includes aircraft of 151 or more seats
Exhibit 52 – Critical Design Aircraft Operations
Critical Design Aircraft Operations
Aircraft Type (Operator) Operations
CAGR 2013 2018 2023 2033
Boeing 767-300F/ER (UPS) 672 793 1,020 1,239 3.11% Source: KLJ Analysis
The future critical design aircraft type is not anticipated to change for the overall airport. The design aircraft for particular portions of the airfield may change. These will be explored in the Facility Requirements chapter.
Annual Instrument Approaches Annual instrument approaches (AIAs) are defined as an approach to an airport conducted in actual instrument meteorological conditions. For purposes of this definition, an approach initiated when the observed visibility is less than 3 miles or the cloud ceiling is less than the final approach fix (3,100 feet mean sea level for FSD) is considered an instrument approach. AIA figures for FSD are no longer tracked by the local Air Traffic Control Tower but are required element to an FAA forecast.
To determine AIAs, the number of itinerant operations are totaled from the estimates and forecasts and compared to annual operations. The number of instrument flights are determined. Approximately 87 percent of all FSD itinerant flight operations are conducted under instrument flight rules (IFR) according to FAA records. This compares to 80 percent in 2005 when more flight training operations were present operating under visual flight rules. This figure is expected to decrease as more flight training traffic returns to FSD. Local weather conditions are then reviewed. A total of 13.49 percent of the hourly weather observations are in instrument conditions for an instrument approach.
Airport Master Plan Update Sioux Falls Regional Airport (FSD)
3-43
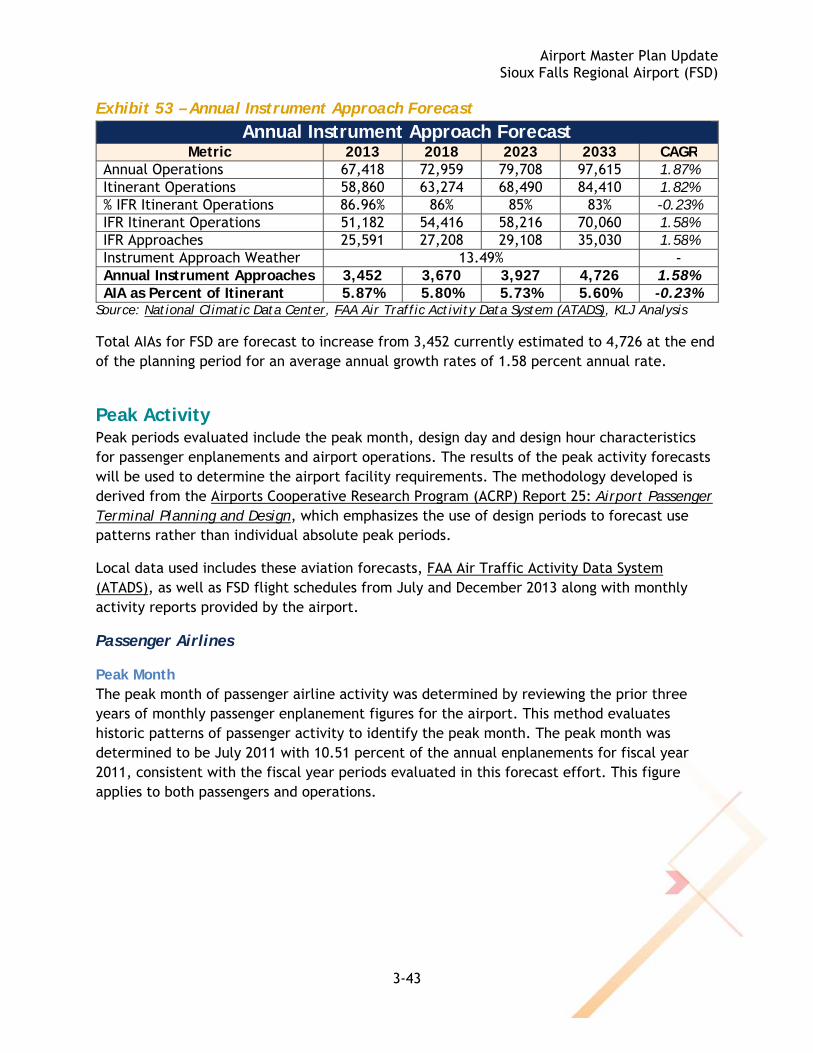
Exhibit 53 – Annual Instrument Approach Forecast
Annual Instrument Approach Forecast Metric 2013 2018 2023 2033 CAGR
Annual Operations 67,418 72,959 79,708 97,615 1.87% Itinerant Operations 58,860 63,274 68,490 84,410 1.82% % IFR Itinerant Operations 86.96% 86% 85% 83% -0.23% IFR Itinerant Operations 51,182 54,416 58,216 70,060 1.58% IFR Approaches 25,591 27,208 29,108 35,030 1.58% Instrument Approach Weather 13.49% - Annual Instrument Approaches 3,452 3,670 3,927 4,726 1.58% AIA as Percent of Itinerant 5.87% 5.80% 5.73% 5.60% -0.23%
Source: National Climatic Data Center, FAA Air Traffic Activity Data System (ATADS), KLJ Analysis
Total AIAs for FSD are forecast to increase from 3,452 currently estimated to 4,726 at the end of the planning period for an average annual growth rates of 1.58 percent annual rate.
Peak Activity Peak periods evaluated include the peak month, design day and design hour characteristics for passenger enplanements and airport operations. The results of the peak activity forecasts will be used to determine the airport facility requirements. The methodology developed is derived from the Airports Cooperative Research Program (ACRP) Report 25: Airport Passenger Terminal Planning and Design, which emphasizes the use of design periods to forecast use patterns rather than individual absolute peak periods.
Local data used includes these aviation forecasts, FAA Air Traffic Activity Data System (ATADS), as well as FSD flight schedules from July and December 2013 along with monthly activity reports provided by the airport.
Passenger Airlines
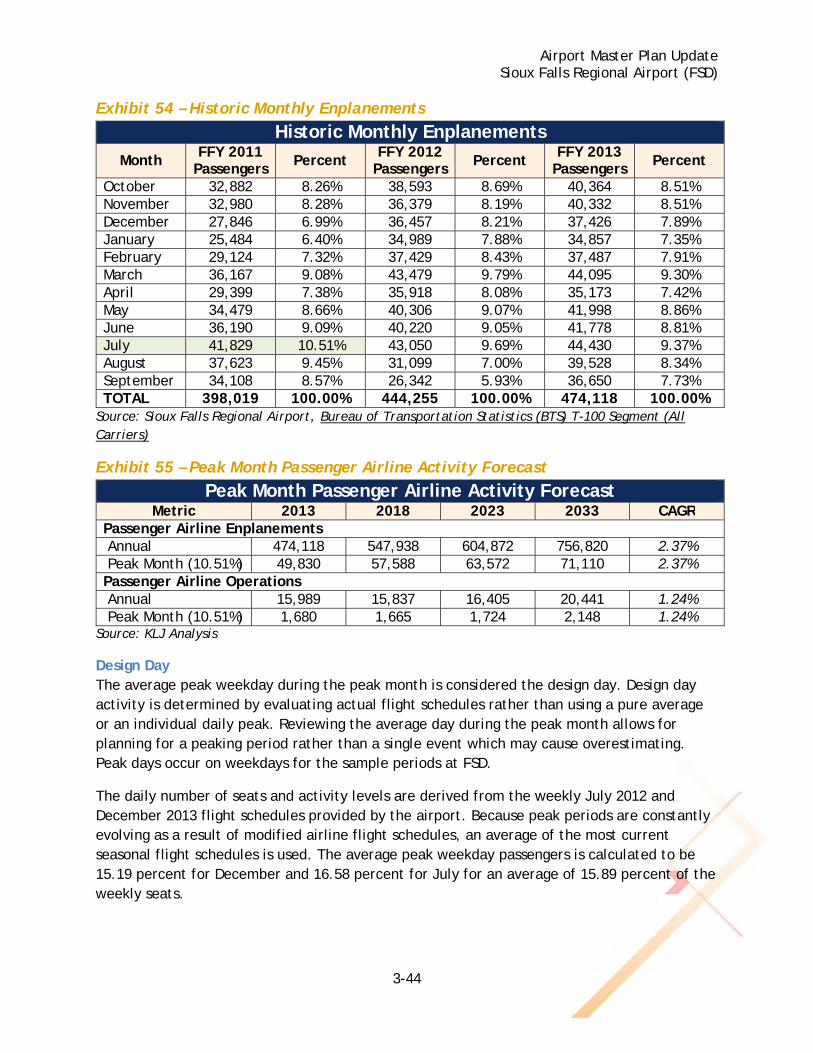
Peak Month The peak month of passenger airline activity was determined by reviewing the prior three years of monthly passenger enplanement figures for the airport. This method evaluates historic patterns of passenger activity to identify the peak month. The peak month was determined to be July 2011 with 10.51 percent of the annual enplanements for fiscal year 2011, consistent with the fiscal year periods evaluated in this forecast effort. This figure applies to both passengers and operations.
Airport Master Plan Update Sioux Falls Regional Airport (FSD)
3-44
Exhibit 54 – Historic Monthly Enplanements
Historic Monthly Enplanements
Month FFY 2011
Passengers Percent FFY 2012
Passengers Percent FFY 2013
Passengers Percent
October 32,882 8.26% 38,593 8.69% 40,364 8.51% November 32,980 8.28% 36,379 8.19% 40,332 8.51% December 27,846 6.99% 36,457 8.21% 37,426 7.89% January 25,484 6.40% 34,989 7.88% 34,857 7.35% February 29,124 7.32% 37,429 8.43% 37,487 7.91% March 36,167 9.08% 43,479 9.79% 44,095 9.30% April 29,399 7.38% 35,918 8.08% 35,173 7.42% May 34,479 8.66% 40,306 9.07% 41,998 8.86% June 36,190 9.09% 40,220 9.05% 41,778 8.81% July 41,829 10.51% 43,050 9.69% 44,430 9.37% August 37,623 9.45% 31,099 7.00% 39,528 8.34% September 34,108 8.57% 26,342 5.93% 36,650 7.73% TOTAL 398,019 100.00% 444,255 100.00% 474,118 100.00%
Source: Sioux Falls Regional Airport, Bureau of Transportation Statistics (BTS) T-100 Segment (All Carriers)
Exhibit 55 – Peak Month Passenger Airline Activity Forecast
Peak Month Passenger Airline Activity Forecast Metric 2013 2018 2023 2033 CAGR
Passenger Airline Enplanements Annual 474,118 547,938 604,872 756,820 2.37% Peak Month (10.51%) 49,830 57,588 63,572 71,110 2.37% Passenger Airline Operations Annual 15,989 15,837 16,405 20,441 1.24% Peak Month (10.51%) 1,680 1,665 1,724 2,148 1.24%
Source: KLJ Analysis
Design Day The average peak weekday during the peak month is considered the design day. Design day activity is determined by evaluating actual flight schedules rather than using a pure average or an individual daily peak. Reviewing the average day during the peak month allows for planning for a peaking period rather than a single event which may cause overestimating. Peak days occur on weekdays for the sample periods at FSD.
The daily number of seats and activity levels are derived from the weekly July 2012 and December 2013 flight schedules provided by the airport. Because peak periods are constantly evolving as a result of modified airline flight schedules, an average of the most current seasonal flight schedules is used. The average peak weekday passengers is calculated to be 15.19 percent for December and 16.58 percent for July for an average of 15.89 percent of the weekly seats.
Airport Master Plan Update Sioux Falls Regional Airport (FSD)
3-45
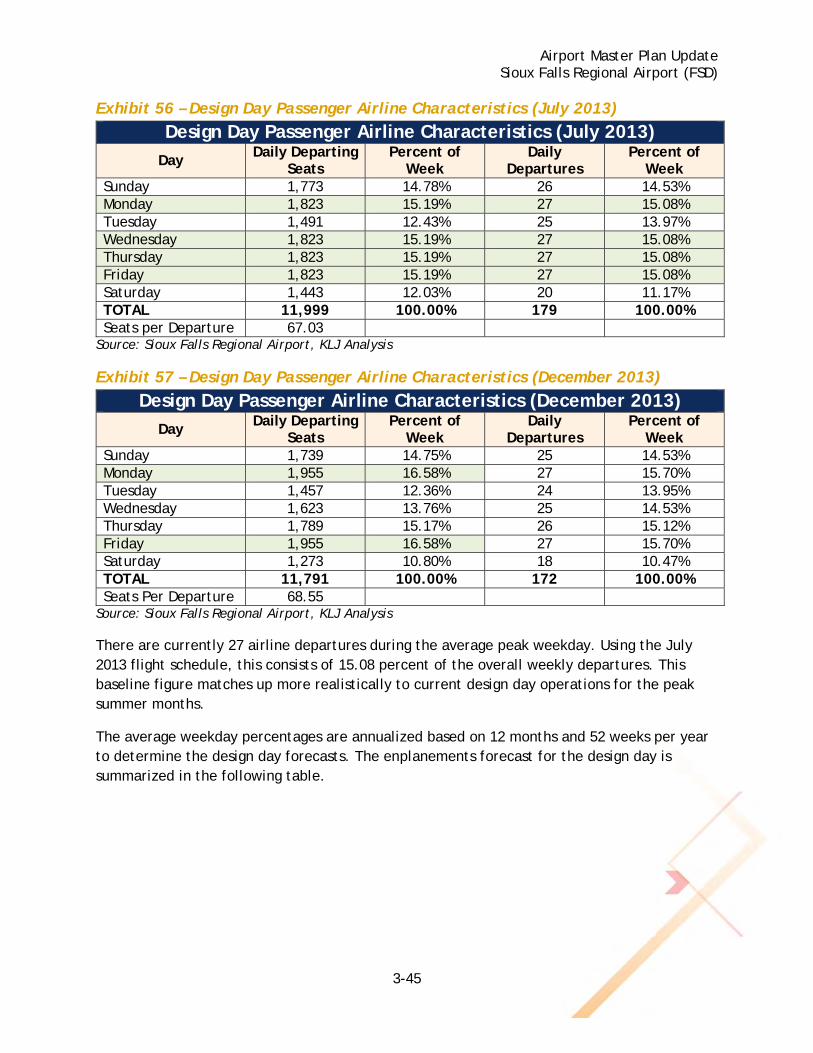
Exhibit 56 – Design Day Passenger Airline Characteristics (July 2013)
Design Day Passenger Airline Characteristics (July 2013)
Day Daily Departing
Seats Percent of
Week Daily
Departures Percent of
Week Sunday 1,773 14.78% 26 14.53% Monday 1,823 15.19% 27 15.08% Tuesday 1,491 12.43% 25 13.97% Wednesday 1,823 15.19% 27 15.08% Thursday 1,823 15.19% 27 15.08% Friday 1,823 15.19% 27 15.08% Saturday 1,443 12.03% 20 11.17% TOTAL 11,999 100.00% 179 100.00% Seats per Departure 67.03
Source: Sioux Falls Regional Airport, KLJ Analysis
Exhibit 57 – Design Day Passenger Airline Characteristics (December 2013)
Design Day Passenger Airline Characteristics (December 2013)
Day Daily Departing Seats
Percent of Week
Daily Departures
Percent of Week
Sunday 1,739 14.75% 25 14.53% Monday 1,955 16.58% 27 15.70% Tuesday 1,457 12.36% 24 13.95% Wednesday 1,623 13.76% 25 14.53% Thursday 1,789 15.17% 26 15.12% Friday 1,955 16.58% 27 15.70% Saturday 1,273 10.80% 18 10.47% TOTAL 11,791 100.00% 172 100.00% Seats Per Departure 68.55
Source: Sioux Falls Regional Airport, KLJ Analysis
There are currently 27 airline departures during the average peak weekday. Using the July 2013 flight schedule, this consists of 15.08 percent of the overall weekly departures. This baseline figure matches up more realistically to current design day operations for the peak summer months.
The average weekday percentages are annualized based on 12 months and 52 weeks per year to determine the design day forecasts. The enplanements forecast for the design day is summarized in the following table.
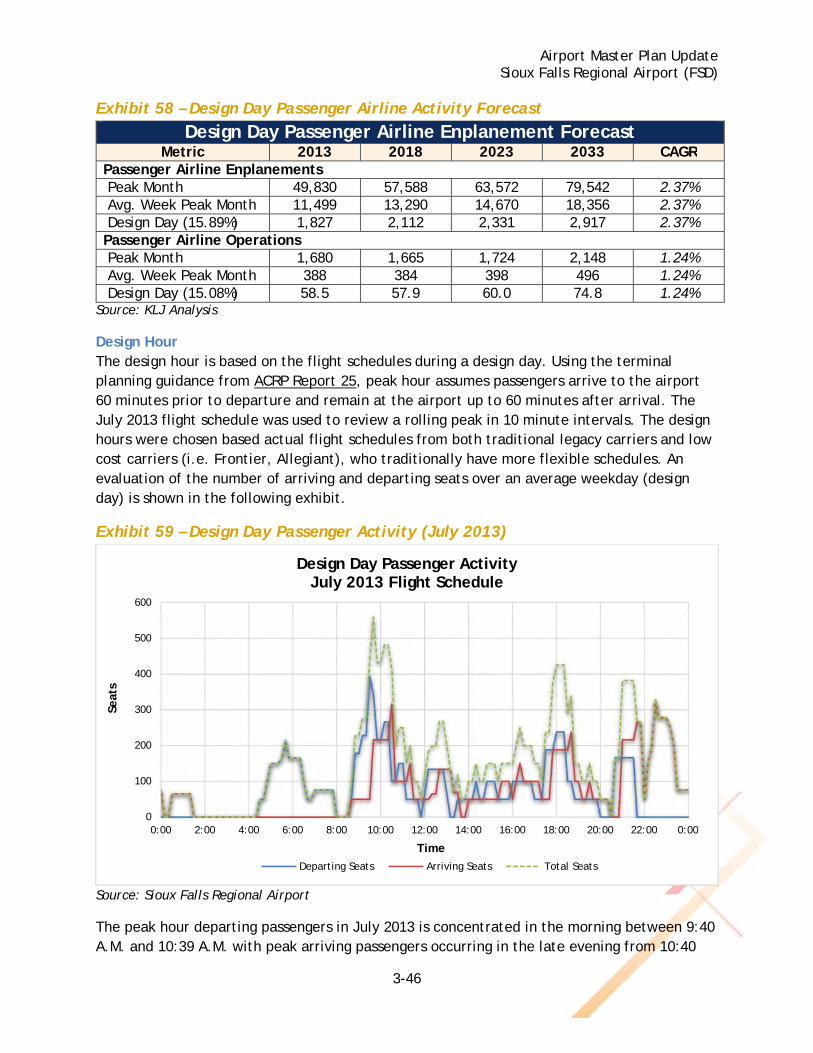
Airport Master Plan Update Sioux Falls Regional Airport (FSD)
3-46
Exhibit 58 – Design Day Passenger Airline Activity Forecast
Design Day Passenger Airline Enplanement Forecast Metric 2013 2018 2023 2033 CAGR
Passenger Airline Enplanements Peak Month 49,830 57,588 63,572 79,542 2.37% Avg. Week Peak Month 11,499 13,290 14,670 18,356 2.37% Design Day (15.89%) 1,827 2,112 2,331 2,917 2.37% Passenger Airline Operations Peak Month 1,680 1,665 1,724 2,148 1.24% Avg. Week Peak Month 388 384 398 496 1.24% Design Day (15.08%) 58.5 57.9 60.0 74.8 1.24%
Source: KLJ Analysis
Design Hour The design hour is based on the flight schedules during a design day. Using the terminal planning guidance from ACRP Report 25, peak hour assumes passengers arrive to the airport 60 minutes prior to departure and remain at the airport up to 60 minutes after arrival. The July 2013 flight schedule was used to review a rolling peak in 10 minute intervals. The design hours were chosen based actual flight schedules from both traditional legacy carriers and low cost carriers (i.e. Frontier, Allegiant), who traditionally have more flexible schedules. An evaluation of the number of arriving and departing seats over an average weekday (design day) is shown in the following exhibit.
Exhibit 59 – Design Day Passenger Activity (July 2013)
Source: Sioux Falls Regional Airport
The peak hour departing passengers in July 2013 is concentrated in the morning between 9:40 A.M. and 10:39 A.M. with peak arriving passengers occurring in the late evening from 10:40
0
100
200
300
400
500
600
0:00 2:00 4:00 6:00 8:00 10:00 12:00 14:00 16:00 18:00 20:00 22:00 0:00
Seat
s
Time
Design Day Passenger ActivityJuly 2013 Flight Schedule
Departing Seats Arriving Seats Total Seats
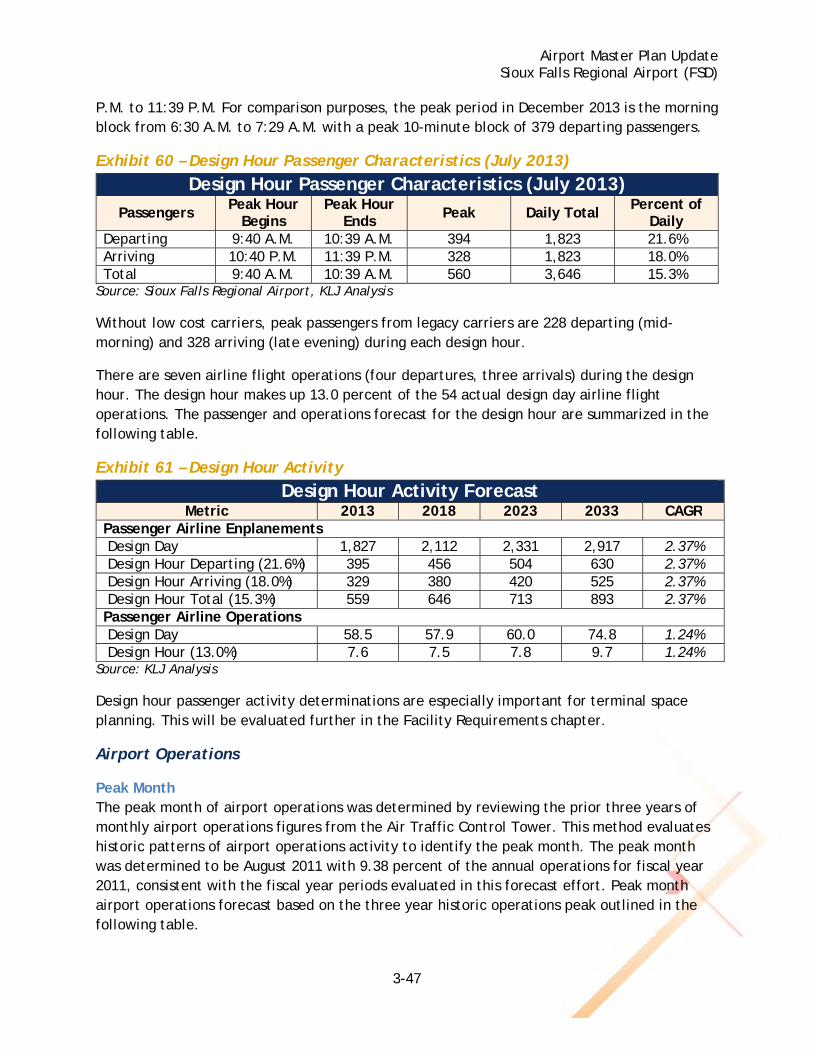
Airport Master Plan Update Sioux Falls Regional Airport (FSD)
3-47
P.M. to 11:39 P.M. For comparison purposes, the peak period in December 2013 is the morning block from 6:30 A.M. to 7:29 A.M. with a peak 10-minute block of 379 departing passengers.
Exhibit 60 – Design Hour Passenger Characteristics (July 2013)
Design Hour Passenger Characteristics (July 2013)
Passengers Peak Hour
Begins Peak Hour
Ends Peak Daily Total Percent of
Daily Departing 9:40 A.M. 10:39 A.M. 394 1,823 21.6% Arriving 10:40 P.M. 11:39 P.M. 328 1,823 18.0% Total 9:40 A.M. 10:39 A.M. 560 3,646 15.3%
Source: Sioux Falls Regional Airport, KLJ Analysis
Without low cost carriers, peak passengers from legacy carriers are 228 departing (mid-morning) and 328 arriving (late evening) during each design hour.
There are seven airline flight operations (four departures, three arrivals) during the design hour. The design hour makes up 13.0 percent of the 54 actual design day airline flight operations. The passenger and operations forecast for the design hour are summarized in the following table.
Exhibit 61 – Design Hour Activity
Design Hour Activity Forecast Metric 2013 2018 2023 2033 CAGR
Passenger Airline Enplanements Design Day 1,827 2,112 2,331 2,917 2.37% Design Hour Departing (21.6%) 395 456 504 630 2.37% Design Hour Arriving (18.0%) 329 380 420 525 2.37% Design Hour Total (15.3%) 559 646 713 893 2.37% Passenger Airline Operations Design Day 58.5 57.9 60.0 74.8 1.24% Design Hour (13.0%) 7.6 7.5 7.8 9.7 1.24%
Source: KLJ Analysis
Design hour passenger activity determinations are especially important for terminal space planning. This will be evaluated further in the Facility Requirements chapter.
Airport Operations
Peak Month The peak month of airport operations was determined by reviewing the prior three years of monthly airport operations figures from the Air Traffic Control Tower. This method evaluates historic patterns of airport operations activity to identify the peak month. The peak month was determined to be August 2011 with 9.38 percent of the annual operations for fiscal year 2011, consistent with the fiscal year periods evaluated in this forecast effort. Peak month airport operations forecast based on the three year historic operations peak outlined in the following table.
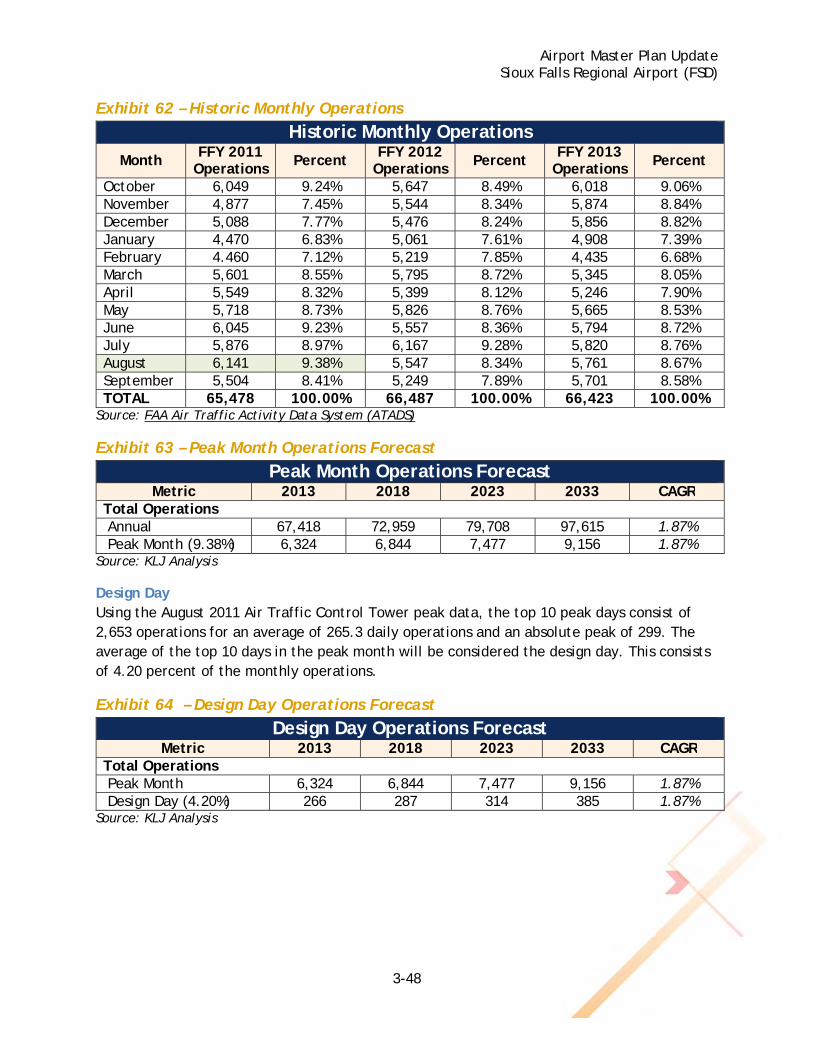
Airport Master Plan Update Sioux Falls Regional Airport (FSD)
3-48
Exhibit 62 – Historic Monthly Operations
Historic Monthly Operations
Month FFY 2011
Operations Percent FFY 2012
Operations Percent FFY 2013
Operations Percent
October 6,049 9.24% 5,647 8.49% 6,018 9.06% November 4,877 7.45% 5,544 8.34% 5,874 8.84% December 5,088 7.77% 5,476 8.24% 5,856 8.82% January 4,470 6.83% 5,061 7.61% 4,908 7.39% February 4.460 7.12% 5,219 7.85% 4,435 6.68% March 5,601 8.55% 5,795 8.72% 5,345 8.05% April 5,549 8.32% 5,399 8.12% 5,246 7.90% May 5,718 8.73% 5,826 8.76% 5,665 8.53% June 6,045 9.23% 5,557 8.36% 5,794 8.72% July 5,876 8.97% 6,167 9.28% 5,820 8.76% August 6,141 9.38% 5,547 8.34% 5,761 8.67% September 5,504 8.41% 5,249 7.89% 5,701 8.58% TOTAL 65,478 100.00% 66,487 100.00% 66,423 100.00%
Source: FAA Air Traffic Activity Data System (ATADS)
Exhibit 63 – Peak Month Operations Forecast
Peak Month Operations Forecast Metric 2013 2018 2023 2033 CAGR
Total Operations Annual 67,418 72,959 79,708 97,615 1.87% Peak Month (9.38%) 6,324 6,844 7,477 9,156 1.87%
Source: KLJ Analysis
Design Day Using the August 2011 Air Traffic Control Tower peak data, the top 10 peak days consist of 2,653 operations for an average of 265.3 daily operations and an absolute peak of 299. The average of the top 10 days in the peak month will be considered the design day. This consists of 4.20 percent of the monthly operations.
Exhibit 64 – Design Day Operations Forecast
Design Day Operations Forecast Metric 2013 2018 2023 2033 CAGR
Total Operations Peak Month 6,324 6,844 7,477 9,156 1.87% Design Day (4.20%) 266 287 314 385 1.87%
Source: KLJ Analysis
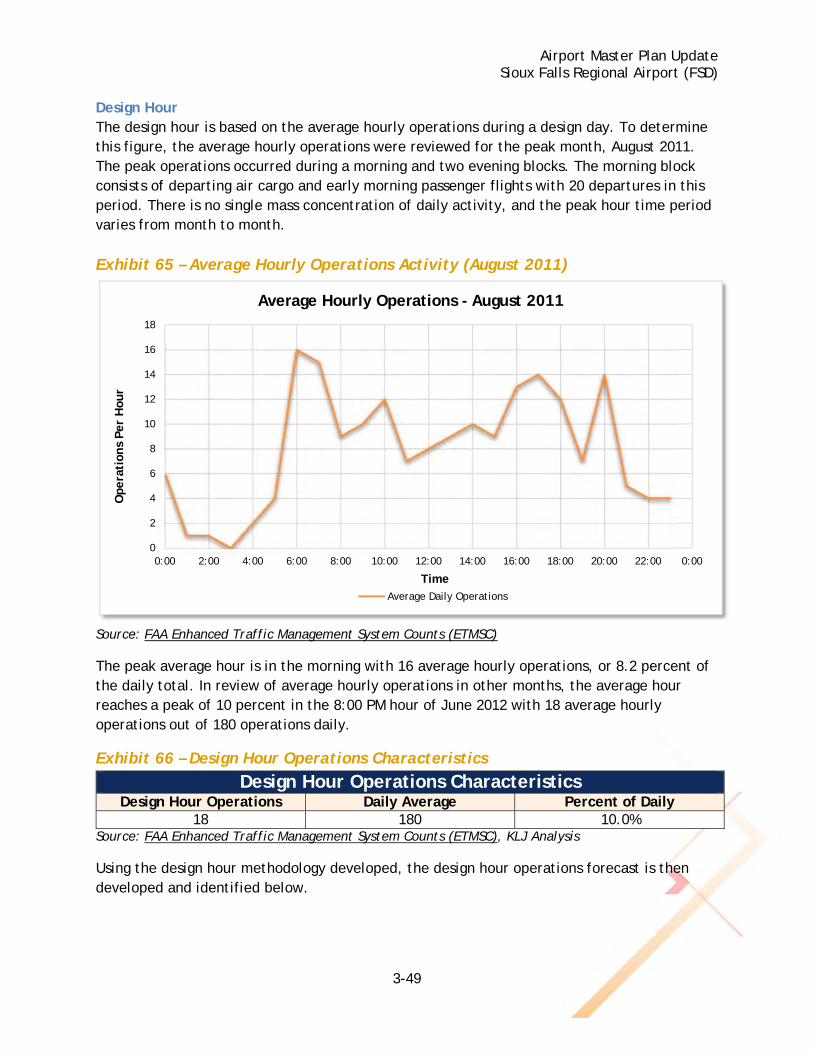
Airport Master Plan Update Sioux Falls Regional Airport (FSD)
3-49
Design Hour The design hour is based on the average hourly operations during a design day. To determine this figure, the average hourly operations were reviewed for the peak month, August 2011. The peak operations occurred during a morning and two evening blocks. The morning block consists of departing air cargo and early morning passenger flights with 20 departures in this period. There is no single mass concentration of daily activity, and the peak hour time period varies from month to month. Exhibit 65 – Average Hourly Operations Activity (August 2011)
Source: FAA Enhanced Traffic Management System Counts (ETMSC)
The peak average hour is in the morning with 16 average hourly operations, or 8.2 percent of the daily total. In review of average hourly operations in other months, the average hour reaches a peak of 10 percent in the 8:00 PM hour of June 2012 with 18 average hourly operations out of 180 operations daily.
Exhibit 66 – Design Hour Operations Characteristics
Design Hour Operations Characteristics Design Hour Operations Daily Average Percent of Daily
18 180 10.0% Source: FAA Enhanced Traffic Management System Counts (ETMSC), KLJ Analysis
Using the design hour methodology developed, the design hour operations forecast is then developed and identified below.
0
2
4
6
8
10
12
14
16
18
0:00 2:00 4:00 6:00 8:00 10:00 12:00 14:00 16:00 18:00 20:00 22:00 0:00
Oper
atio
ns
Per
Hou
r
Time
Average Hourly Operations - August 2011
Average Daily Operations
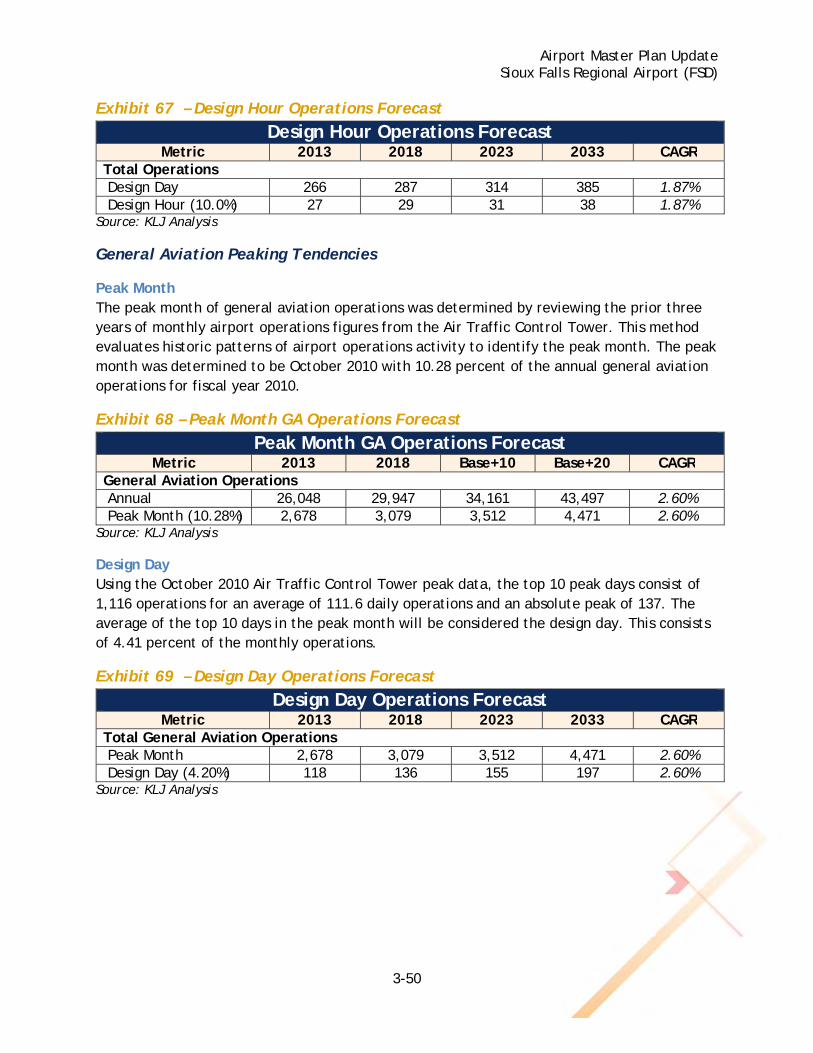
Airport Master Plan Update Sioux Falls Regional Airport (FSD)
3-50
Exhibit 67 – Design Hour Operations Forecast
Design Hour Operations Forecast Metric 2013 2018 2023 2033 CAGR
Total Operations Design Day 266 287 314 385 1.87% Design Hour (10.0%) 27 29 31 38 1.87%
Source: KLJ Analysis
General Aviation Peaking Tendencies
Peak Month The peak month of general aviation operations was determined by reviewing the prior three years of monthly airport operations figures from the Air Traffic Control Tower. This method evaluates historic patterns of airport operations activity to identify the peak month. The peak month was determined to be October 2010 with 10.28 percent of the annual general aviation operations for fiscal year 2010.
Exhibit 68 – Peak Month GA Operations Forecast
Peak Month GA Operations Forecast Metric 2013 2018 Base+10 Base+20 CAGR
General Aviation Operations Annual 26,048 29,947 34,161 43,497 2.60% Peak Month (10.28%) 2,678 3,079 3,512 4,471 2.60%
Source: KLJ Analysis
Design Day Using the October 2010 Air Traffic Control Tower peak data, the top 10 peak days consist of 1,116 operations for an average of 111.6 daily operations and an absolute peak of 137. The average of the top 10 days in the peak month will be considered the design day. This consists of 4.41 percent of the monthly operations.
Exhibit 69 – Design Day Operations Forecast
Design Day Operations Forecast Metric 2013 2018 2023 2033 CAGR
Total General Aviation Operations Peak Month 2,678 3,079 3,512 4,471 2.60% Design Day (4.20%) 118 136 155 197 2.60%
Source: KLJ Analysis
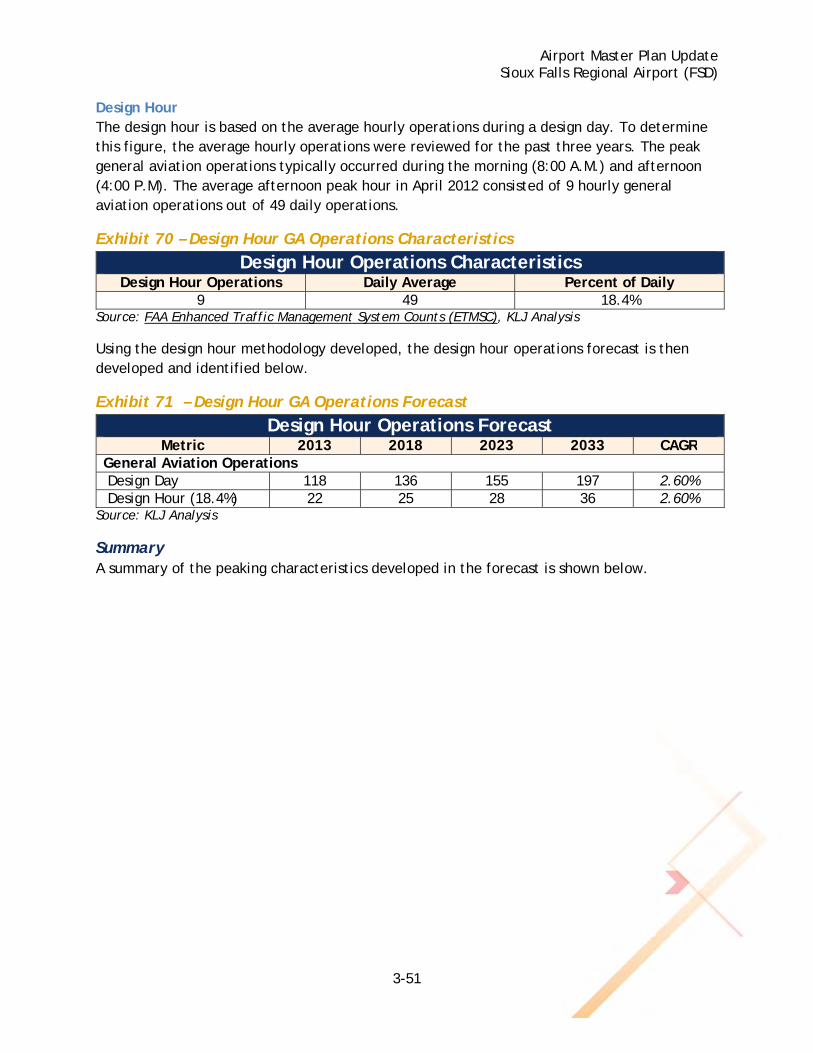
Airport Master Plan Update Sioux Falls Regional Airport (FSD)
3-51
Design Hour The design hour is based on the average hourly operations during a design day. To determine this figure, the average hourly operations were reviewed for the past three years. The peak general aviation operations typically occurred during the morning (8:00 A.M.) and afternoon (4:00 P.M). The average afternoon peak hour in April 2012 consisted of 9 hourly general aviation operations out of 49 daily operations.
Exhibit 70 – Design Hour GA Operations Characteristics
Design Hour Operations Characteristics Design Hour Operations Daily Average Percent of Daily
9 49 18.4% Source: FAA Enhanced Traffic Management System Counts (ETMSC), KLJ Analysis
Using the design hour methodology developed, the design hour operations forecast is then developed and identified below.
Exhibit 71 – Design Hour GA Operations Forecast
Design Hour Operations Forecast Metric 2013 2018 2023 2033 CAGR
General Aviation Operations Design Day 118 136 155 197 2.60% Design Hour (18.4%) 22 25 28 36 2.60%
Source: KLJ Analysis
Summary A summary of the peaking characteristics developed in the forecast is shown below.
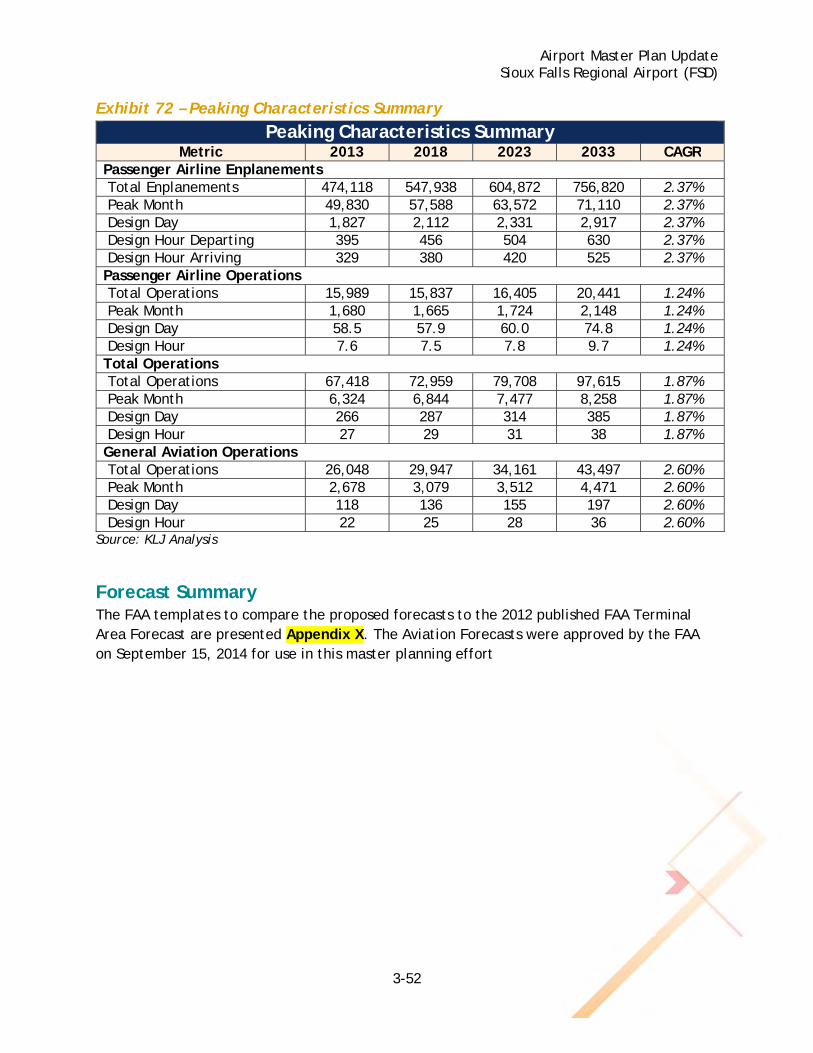
Airport Master Plan Update Sioux Falls Regional Airport (FSD)
3-52
Exhibit 72 – Peaking Characteristics Summary
Peaking Characteristics Summary Metric 2013 2018 2023 2033 CAGR
Passenger Airline Enplanements Total Enplanements 474,118 547,938 604,872 756,820 2.37% Peak Month 49,830 57,588 63,572 71,110 2.37% Design Day 1,827 2,112 2,331 2,917 2.37% Design Hour Departing 395 456 504 630 2.37% Design Hour Arriving 329 380 420 525 2.37% Passenger Airline Operations Total Operations 15,989 15,837 16,405 20,441 1.24% Peak Month 1,680 1,665 1,724 2,148 1.24% Design Day 58.5 57.9 60.0 74.8 1.24% Design Hour 7.6 7.5 7.8 9.7 1.24% Total Operations Total Operations 67,418 72,959 79,708 97,615 1.87% Peak Month 6,324 6,844 7,477 8,258 1.87% Design Day 266 287 314 385 1.87% Design Hour 27 29 31 38 1.87% General Aviation Operations Total Operations 26,048 29,947 34,161 43,497 2.60% Peak Month 2,678 3,079 3,512 4,471 2.60% Design Day 118 136 155 197 2.60% Design Hour 22 25 28 36 2.60%
Source: KLJ Analysis
Forecast Summary The FAA templates to compare the proposed forecasts to the 2012 published FAA Terminal Area Forecast are presented Appendix X. The Aviation Forecasts were approved by the FAA on September 15, 2014 for use in this master planning effort
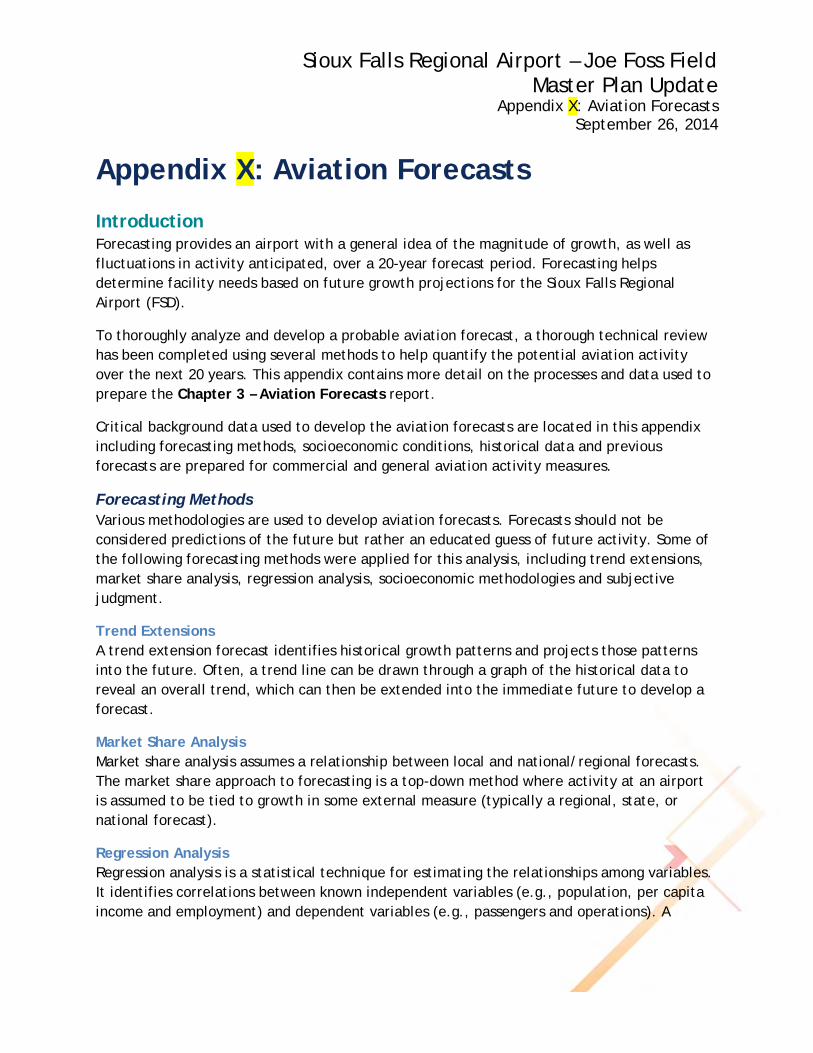
Sioux Falls Regional Airport – Joe Foss Field Master Plan Update
Appendix X: Aviation Forecasts September 26, 2014
1
Appendix X: Aviation Forecasts
Introduction Forecasting provides an airport with a general idea of the magnitude of growth, as well as fluctuations in activity anticipated, over a 20-year forecast period. Forecasting helps determine facility needs based on future growth projections for the Sioux Falls Regional Airport (FSD).
To thoroughly analyze and develop a probable aviation forecast, a thorough technical review has been completed using several methods to help quantify the potential aviation activity over the next 20 years. This appendix contains more detail on the processes and data used to prepare the Chapter 3 – Aviation Forecasts report.
Critical background data used to develop the aviation forecasts are located in this appendix including forecasting methods, socioeconomic conditions, historical data and previous forecasts are prepared for commercial and general aviation activity measures.
Forecasting Methods Various methodologies are used to develop aviation forecasts. Forecasts should not be considered predictions of the future but rather an educated guess of future activity. Some of the following forecasting methods were applied for this analysis, including trend extensions, market share analysis, regression analysis, socioeconomic methodologies and subjective judgment.
Trend Extensions A trend extension forecast identifies historical growth patterns and projects those patterns into the future. Often, a trend line can be drawn through a graph of the historical data to reveal an overall trend, which can then be extended into the immediate future to develop a forecast.
Market Share Analysis Market share analysis assumes a relationship between local and national/regional forecasts. The market share approach to forecasting is a top-down method where activity at an airport is assumed to be tied to growth in some external measure (typically a regional, state, or national forecast).
Regression Analysis Regression analysis is a statistical technique for estimating the relationships among variables. It identifies correlations between known independent variables (e.g., population, per capita income and employment) and dependent variables (e.g., passengers and operations). A
Airport Master Plan Update Sioux Falls Regional Airport (FSD)
AX-2
correlation (R-squared) value of 95 percent and above indicates a strong correlation between the independent and dependent variables.
Socioeconomic Methodologies Though trend line extrapolation and market share analysis may provide mathematical and formulaic justification for demand projections, many factors beyond historical levels of activity may identify trends in aviation and impact on aviation demand locally. Socioeconomic or correlation analysis examines the direct relationship between two or more sets of historical data. Based upon the observed and projected correlation between historical aviation activity and the socioeconomic data sets, future aviation activity projections are developed.
Professional Judgment Judgmental methods are educated estimations of future events based on the personal knowledge, experience and intuition of the forecaster. This method permits the inclusion of a broad range of relevant information into the forecasting process, and is usually used to refine the results of the other methods.
Socioeconomic Conditions Socioeconomic information within the airport service area can provide insight into factors that affect aviation activity at an airport. Commonly evaluated metrics include population, employment/gross regional product and income. Historic trends, current data and forecast estimates are evaluated in this section to identify socioeconomic trends that may affect aviation activity forecasts at FSD. Growth rates are used as a method to compare the airport service area to other regional, statewide and national trends.
Population Population is a basic indicator of the number of people who may utilize airport infrastructure. Since 1990, population have risen consistently with population growing at an average annual growth rate of 1.95 percent. These growth figures have only been affected slightly by the recent economic recession in 2010. Future population growth is projected to grow by 1.76 percent annually through the planning period. The City of Sioux Falls in 2011 estimated population growth at 2.43 percent per year through 2035.
Historical population growth rates within the Sioux Falls MSA have been, on average, more than double the historical growth rates for the State of South Dakota and the United States. This indicates a strong local economy with steady consistent growth exceeding state and national figures. This trend is forecast to continue with growth rates well exceeding state and national projections.
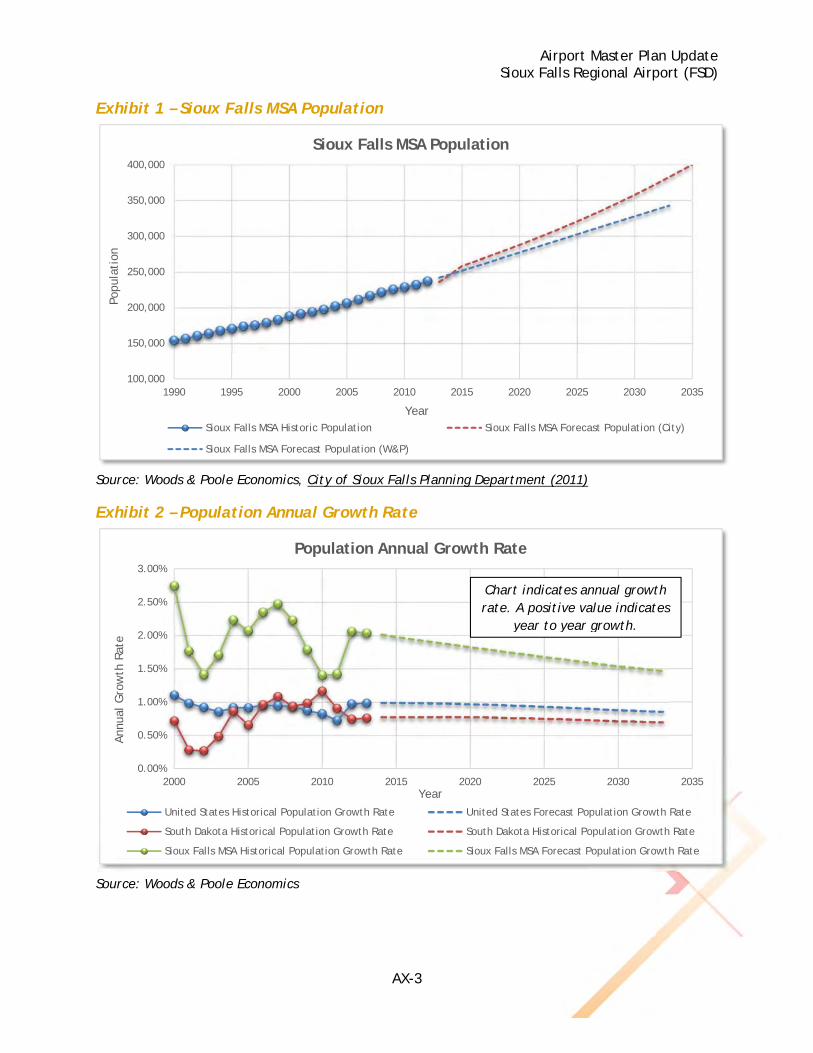
Airport Master Plan Update Sioux Falls Regional Airport (FSD)
AX-3
Exhibit 1 – Sioux Falls MSA Population
Source: Woods & Poole Economics, City of Sioux Falls Planning Department (2011)
Exhibit 2 – Population Annual Growth Rate
Source: Woods & Poole Economics
100,000
150,000
200,000
250,000
300,000
350,000
400,000
1990 1995 2000 2005 2010 2015 2020 2025 2030 2035
Popu
lati
on
Year
Sioux Falls MSA Population
Sioux Falls MSA Historic Population Sioux Falls MSA Forecast Population (City)
Sioux Falls MSA Forecast Population (W&P)
0.00%
0.50%
1.00%
1.50%
2.00%
2.50%
3.00%
2000 2005 2010 2015 2020 2025 2030 2035
Ann
ual G
row
th R
ate
Year
Population Annual Growth Rate
United States Historical Population Growth Rate United States Forecast Population Growth Rate
South Dakota Historical Population Growth Rate South Dakota Historical Population Growth Rate
Sioux Falls MSA Historical Population Growth Rate Sioux Falls MSA Forecast Population Growth Rate
Chart indicates annual growth rate. A positive value indicates
year to year growth.
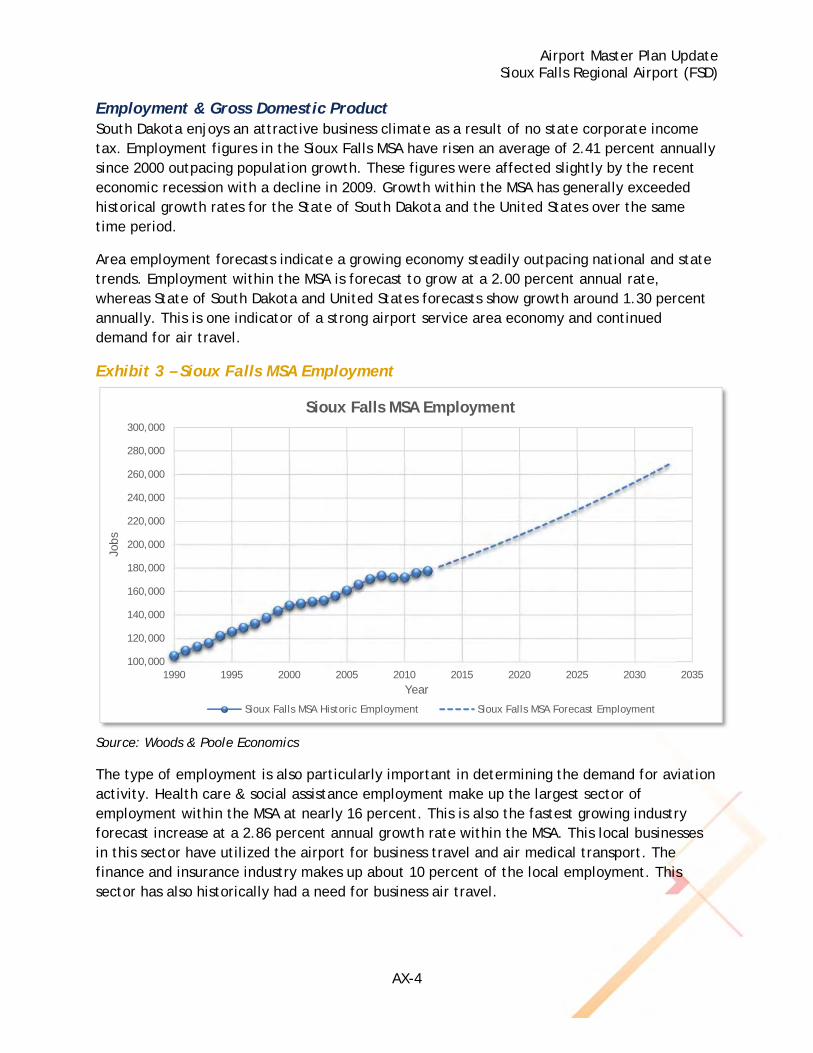
Airport Master Plan Update Sioux Falls Regional Airport (FSD)
AX-4
Employment & Gross Domestic Product South Dakota enjoys an attractive business climate as a result of no state corporate income tax. Employment figures in the Sioux Falls MSA have risen an average of 2.41 percent annually since 2000 outpacing population growth. These figures were affected slightly by the recent economic recession with a decline in 2009. Growth within the MSA has generally exceeded historical growth rates for the State of South Dakota and the United States over the same time period.
Area employment forecasts indicate a growing economy steadily outpacing national and state trends. Employment within the MSA is forecast to grow at a 2.00 percent annual rate, whereas State of South Dakota and United States forecasts show growth around 1.30 percent annually. This is one indicator of a strong airport service area economy and continued demand for air travel.
Exhibit 3 – Sioux Falls MSA Employment
Source: Woods & Poole Economics
The type of employment is also particularly important in determining the demand for aviation activity. Health care & social assistance employment make up the largest sector of employment within the MSA at nearly 16 percent. This is also the fastest growing industry forecast increase at a 2.86 percent annual growth rate within the MSA. This local businesses in this sector have utilized the airport for business travel and air medical transport. The finance and insurance industry makes up about 10 percent of the local employment. This sector has also historically had a need for business air travel.
100,000
120,000
140,000
160,000
180,000
200,000
220,000
240,000
260,000
280,000
300,000
1990 1995 2000 2005 2010 2015 2020 2025 2030 2035
Jobs
Year
Sioux Falls MSA Employment
Sioux Falls MSA Historic Employment Sioux Falls MSA Forecast Employment
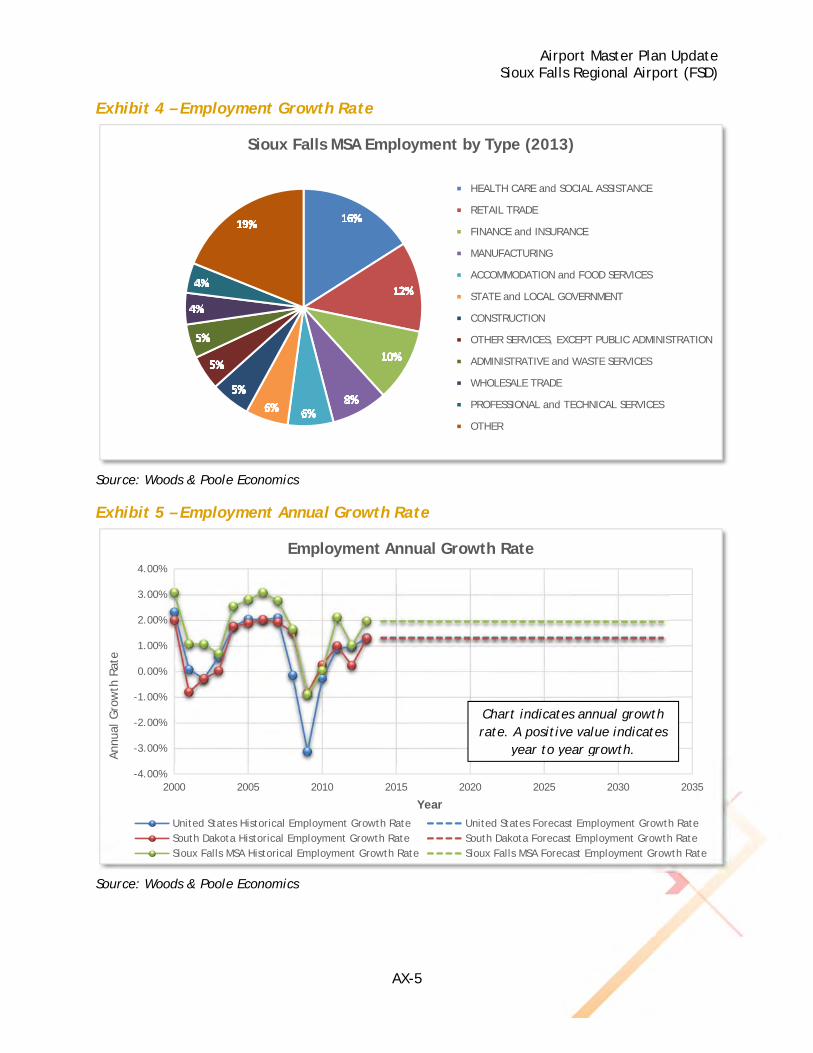
Airport Master Plan Update Sioux Falls Regional Airport (FSD)
AX-5
Exhibit 4 – Employment Growth Rate
Source: Woods & Poole Economics
Exhibit 5 – Employment Annual Growth Rate
Source: Woods & Poole Economics
Sioux Falls MSA Employment by Type (2013)
HEALTH CARE and SOCIAL ASSISTANCE
RETAIL TRADE
FINANCE and INSURANCE
MANUFACTURING
ACCOMMODATION and FOOD SERVICES
STATE and LOCAL GOVERNMENT
CONSTRUCTION
OTHER SERVICES, EXCEPT PUBLIC ADMINISTRATION
ADMINISTRATIVE and WASTE SERVICES
WHOLESALE TRADE
PROFESSIONAL and TECHNICAL SERVICES
OTHER
-4.00%
-3.00%
-2.00%
-1.00%
0.00%
1.00%
2.00%
3.00%
4.00%
2000 2005 2010 2015 2020 2025 2030 2035
Ann
ual G
row
th R
ate
Year
Employment Annual Growth Rate
United States Historical Employment Growth Rate United States Forecast Employment Growth RateSouth Dakota Historical Employment Growth Rate South Dakota Forecast Employment Growth RateSioux Falls MSA Historical Employment Growth Rate Sioux Falls MSA Forecast Employment Growth Rate
Chart indicates annual growth rate. A positive value indicates
year to year growth.
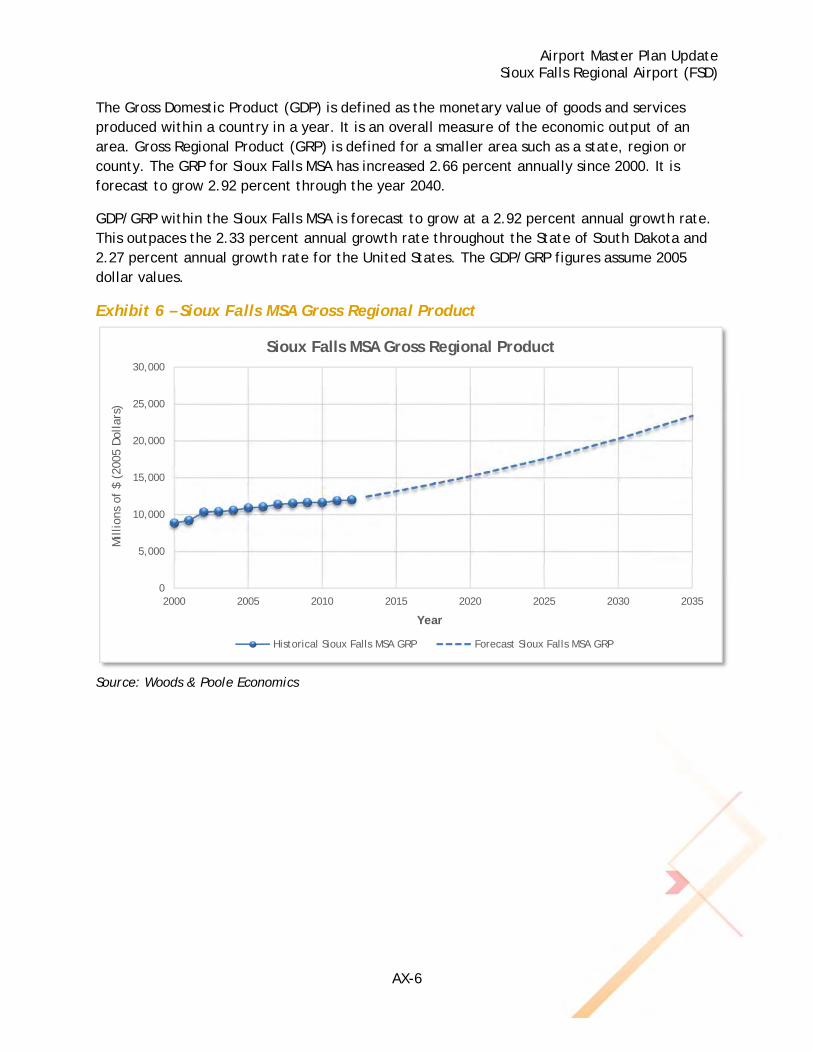
Airport Master Plan Update Sioux Falls Regional Airport (FSD)
AX-6
The Gross Domestic Product (GDP) is defined as the monetary value of goods and services produced within a country in a year. It is an overall measure of the economic output of an area. Gross Regional Product (GRP) is defined for a smaller area such as a state, region or county. The GRP for Sioux Falls MSA has increased 2.66 percent annually since 2000. It is forecast to grow 2.92 percent through the year 2040.
GDP/GRP within the Sioux Falls MSA is forecast to grow at a 2.92 percent annual growth rate. This outpaces the 2.33 percent annual growth rate throughout the State of South Dakota and 2.27 percent annual growth rate for the United States. The GDP/GRP figures assume 2005 dollar values.
Exhibit 6 – Sioux Falls MSA Gross Regional Product
Source: Woods & Poole Economics
0
5,000
10,000
15,000
20,000
25,000
30,000
2000 2005 2010 2015 2020 2025 2030 2035
Million
s of
$ (
2005
Dol
lars
)
Year
Sioux Falls MSA Gross Regional Product
Historical Sioux Falls MSA GRP Forecast Sioux Falls MSA GRP
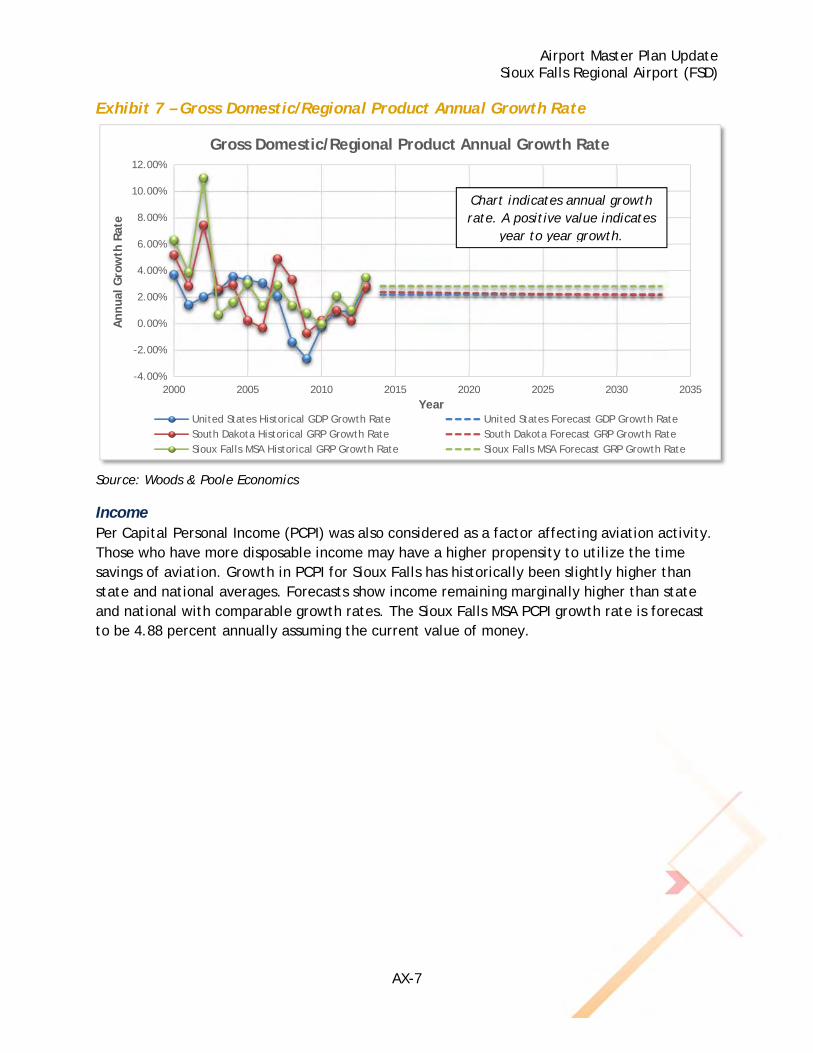
Airport Master Plan Update Sioux Falls Regional Airport (FSD)
AX-7
Exhibit 7 – Gross Domestic/Regional Product Annual Growth Rate
Source: Woods & Poole Economics
Income Per Capital Personal Income (PCPI) was also considered as a factor affecting aviation activity. Those who have more disposable income may have a higher propensity to utilize the time savings of aviation. Growth in PCPI for Sioux Falls has historically been slightly higher than state and national averages. Forecasts show income remaining marginally higher than state and national with comparable growth rates. The Sioux Falls MSA PCPI growth rate is forecast to be 4.88 percent annually assuming the current value of money.
-4.00%
-2.00%
0.00%
2.00%
4.00%
6.00%
8.00%
10.00%
12.00%
2000 2005 2010 2015 2020 2025 2030 2035
Annual
Gro
wth
Rat
e
Year
Gross Domestic/Regional Product Annual Growth Rate
United States Historical GDP Growth Rate United States Forecast GDP Growth RateSouth Dakota Historical GRP Growth Rate South Dakota Forecast GRP Growth RateSioux Falls MSA Historical GRP Growth Rate Sioux Falls MSA Forecast GRP Growth Rate
Chart indicates annual growth rate. A positive value indicates
year to year growth.
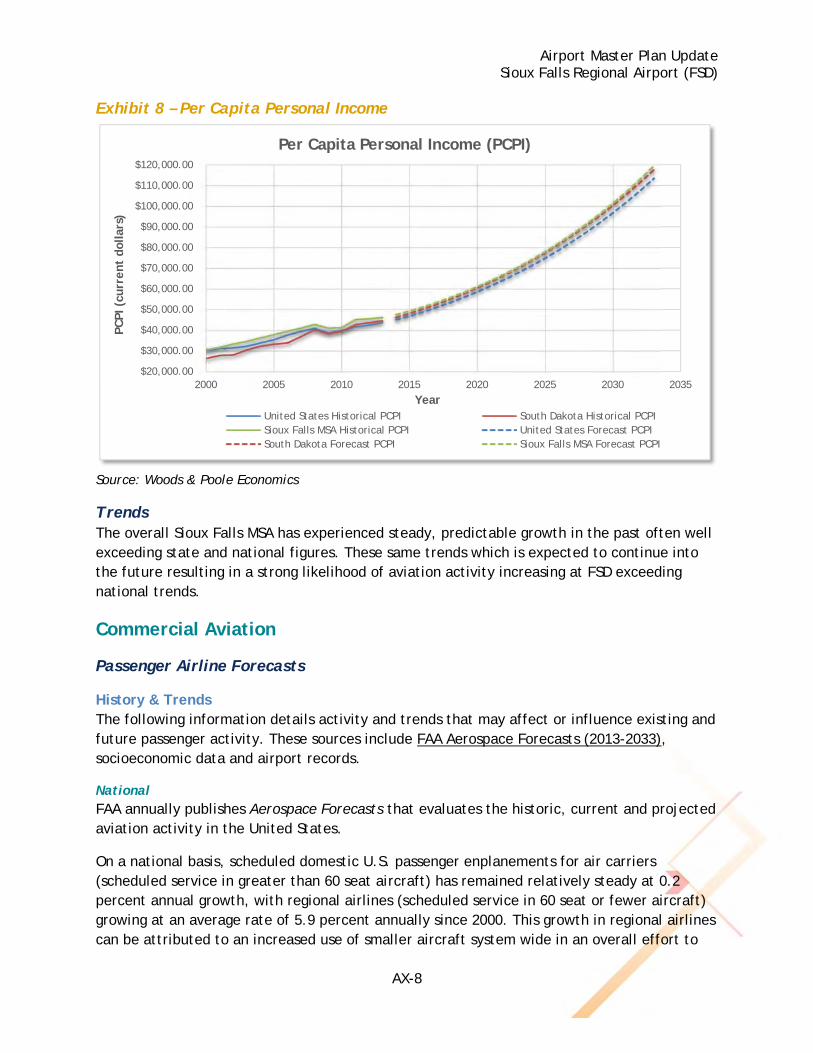
Airport Master Plan Update Sioux Falls Regional Airport (FSD)
AX-8
Exhibit 8 – Per Capita Personal Income
Source: Woods & Poole Economics
Trends The overall Sioux Falls MSA has experienced steady, predictable growth in the past often well exceeding state and national figures. These same trends which is expected to continue into the future resulting in a strong likelihood of aviation activity increasing at FSD exceeding national trends.
Commercial Aviation
Passenger Airline Forecasts
History & Trends The following information details activity and trends that may affect or influence existing and future passenger activity. These sources include FAA Aerospace Forecasts (2013-2033), socioeconomic data and airport records.
National FAA annually publishes Aerospace Forecasts that evaluates the historic, current and projected aviation activity in the United States.
On a national basis, scheduled domestic U.S. passenger enplanements for air carriers (scheduled service in greater than 60 seat aircraft) has remained relatively steady at 0.2 percent annual growth, with regional airlines (scheduled service in 60 seat or fewer aircraft) growing at an average rate of 5.9 percent annually since 2000. This growth in regional airlines can be attributed to an increased use of smaller aircraft system wide in an overall effort to
$20,000.00
$30,000.00
$40,000.00
$50,000.00
$60,000.00
$70,000.00
$80,000.00
$90,000.00
$100,000.00
$110,000.00
$120,000.00
2000 2005 2010 2015 2020 2025 2030 2035
PC
PI (
curr
ent
dol
lars
)
Year
Per Capita Personal Income (PCPI)
United States Historical PCPI South Dakota Historical PCPISioux Falls MSA Historical PCPI United States Forecast PCPISouth Dakota Forecast PCPI Sioux Falls MSA Forecast PCPI
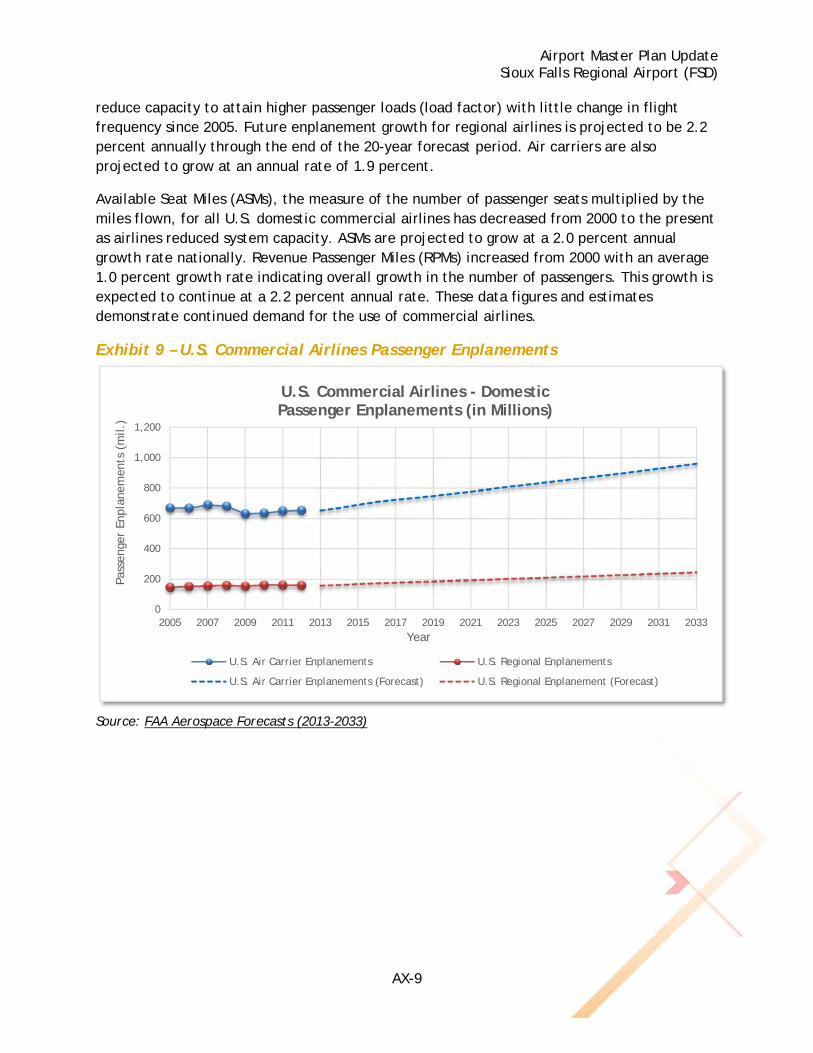
Airport Master Plan Update Sioux Falls Regional Airport (FSD)
AX-9
reduce capacity to attain higher passenger loads (load factor) with little change in flight frequency since 2005. Future enplanement growth for regional airlines is projected to be 2.2 percent annually through the end of the 20-year forecast period. Air carriers are also projected to grow at an annual rate of 1.9 percent.
Available Seat Miles (ASMs), the measure of the number of passenger seats multiplied by the miles flown, for all U.S. domestic commercial airlines has decreased from 2000 to the present as airlines reduced system capacity. ASMs are projected to grow at a 2.0 percent annual growth rate nationally. Revenue Passenger Miles (RPMs) increased from 2000 with an average 1.0 percent growth rate indicating overall growth in the number of passengers. This growth is expected to continue at a 2.2 percent annual rate. These data figures and estimates demonstrate continued demand for the use of commercial airlines.
Exhibit 9 – U.S. Commercial Airlines Passenger Enplanements
Source: FAA Aerospace Forecasts (2013-2033)
0
200
400
600
800
1,000
1,200
2005 2007 2009 2011 2013 2015 2017 2019 2021 2023 2025 2027 2029 2031 2033
Pass
enge
r En
plan
emen
ts (
mil.)
Year
U.S. Commercial Airlines - DomesticPassenger Enplanements (in Millions)
U.S. Air Carrier Enplanements U.S. Regional Enplanements
U.S. Air Carrier Enplanements (Forecast) U.S. Regional Enplanement (Forecast)
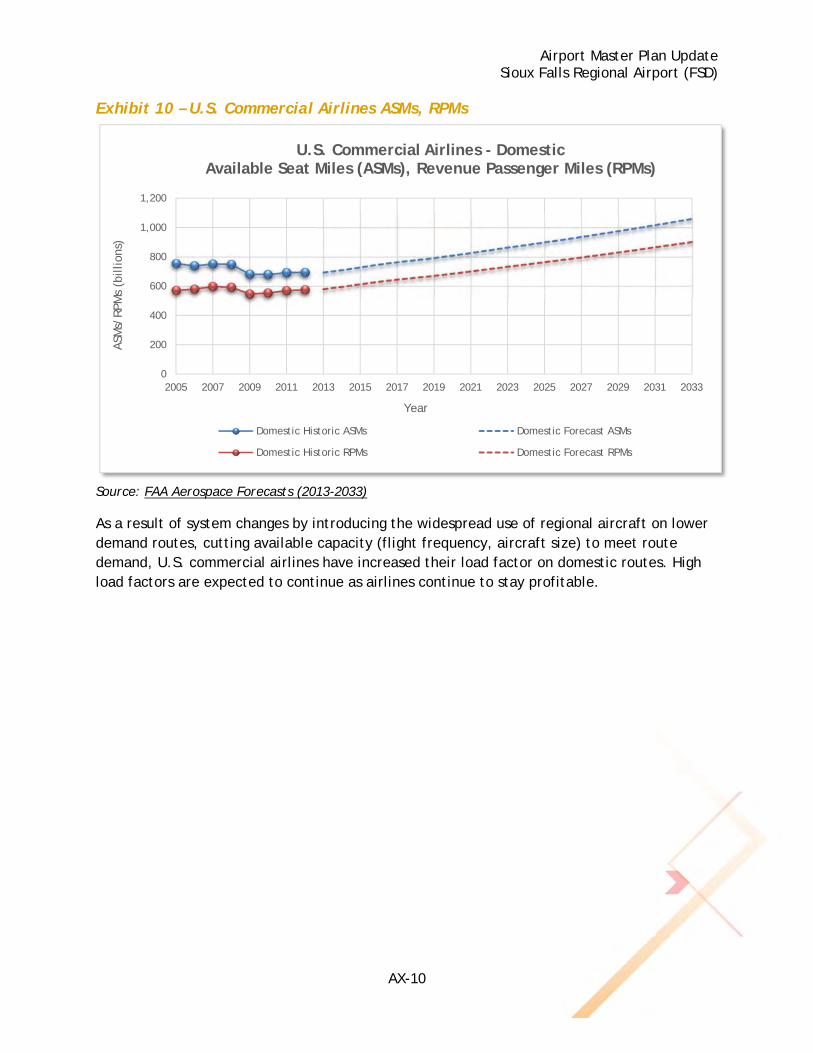
Airport Master Plan Update Sioux Falls Regional Airport (FSD)
AX-10
Exhibit 10 – U.S. Commercial Airlines ASMs, RPMs
Source: FAA Aerospace Forecasts (2013-2033)
As a result of system changes by introducing the widespread use of regional aircraft on lower demand routes, cutting available capacity (flight frequency, aircraft size) to meet route demand, U.S. commercial airlines have increased their load factor on domestic routes. High load factors are expected to continue as airlines continue to stay profitable.
0
200
400
600
800
1,000
1,200
2005 2007 2009 2011 2013 2015 2017 2019 2021 2023 2025 2027 2029 2031 2033
ASM
s/RPM
s (b
illion
s)
Year
U.S. Commercial Airlines - DomesticAvailable Seat Miles (ASMs), Revenue Passenger Miles (RPMs)
Domestic Historic ASMs Domestic Forecast ASMs
Domestic Historic RPMs Domestic Forecast RPMs
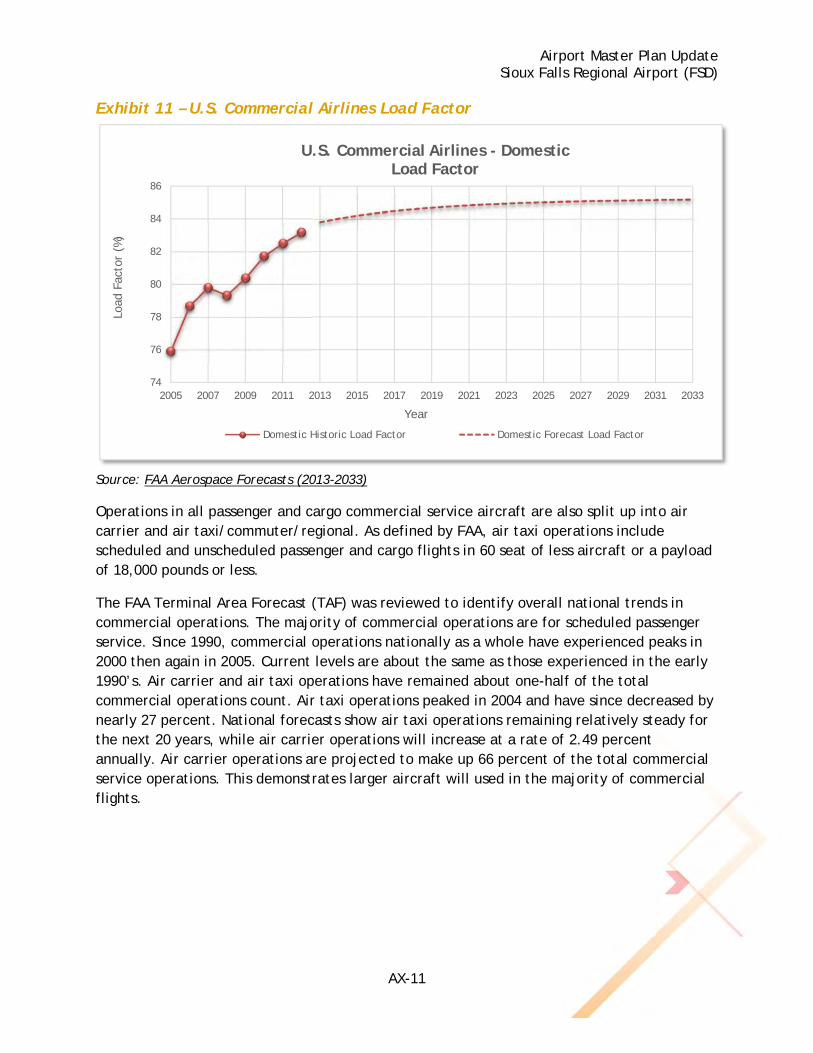
Airport Master Plan Update Sioux Falls Regional Airport (FSD)
AX-11
Exhibit 11 – U.S. Commercial Airlines Load Factor
Source: FAA Aerospace Forecasts (2013-2033)
Operations in all passenger and cargo commercial service aircraft are also split up into air carrier and air taxi/commuter/regional. As defined by FAA, air taxi operations include scheduled and unscheduled passenger and cargo flights in 60 seat of less aircraft or a payload of 18,000 pounds or less.
The FAA Terminal Area Forecast (TAF) was reviewed to identify overall national trends in commercial operations. The majority of commercial operations are for scheduled passenger service. Since 1990, commercial operations nationally as a whole have experienced peaks in 2000 then again in 2005. Current levels are about the same as those experienced in the early 1990’s. Air carrier and air taxi operations have remained about one-half of the total commercial operations count. Air taxi operations peaked in 2004 and have since decreased by nearly 27 percent. National forecasts show air taxi operations remaining relatively steady for the next 20 years, while air carrier operations will increase at a rate of 2.49 percent annually. Air carrier operations are projected to make up 66 percent of the total commercial service operations. This demonstrates larger aircraft will used in the majority of commercial flights.
74
76
78
80
82
84
86
2005 2007 2009 2011 2013 2015 2017 2019 2021 2023 2025 2027 2029 2031 2033
Load
Fac
tor
(%)
Year
U.S. Commercial Airlines - DomesticLoad Factor
Domestic Historic Load Factor Domestic Forecast Load Factor
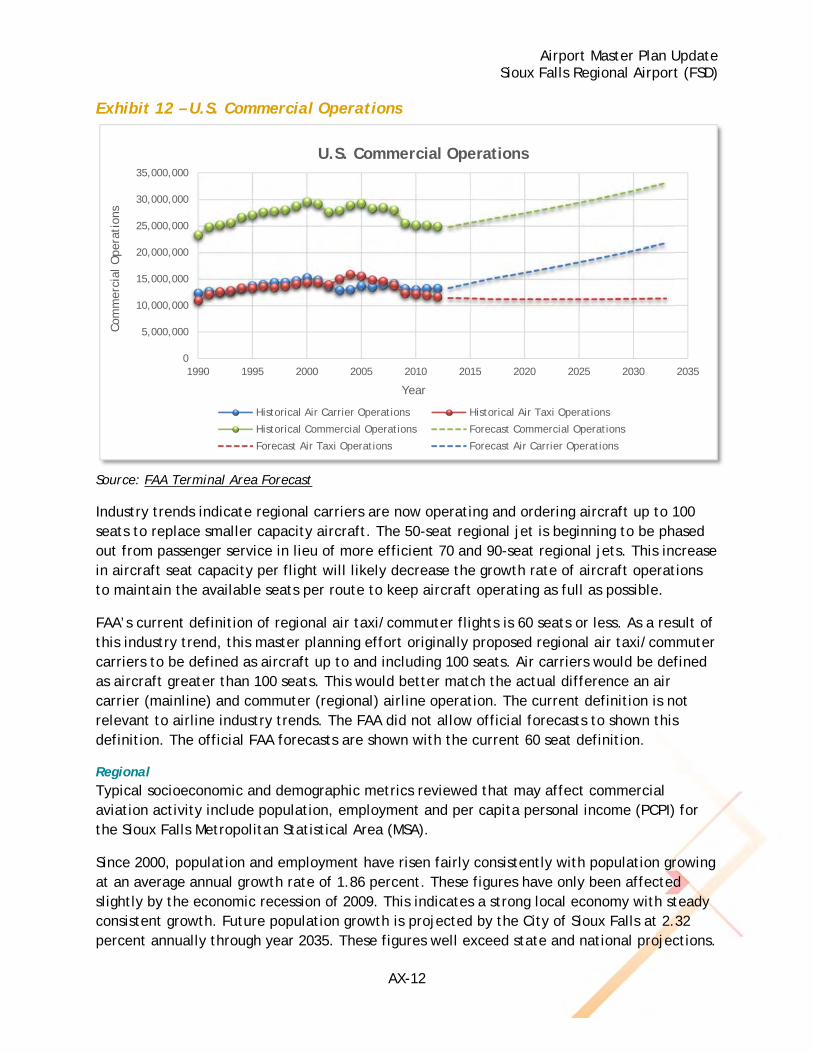
Airport Master Plan Update Sioux Falls Regional Airport (FSD)
AX-12
Exhibit 12 – U.S. Commercial Operations
Source: FAA Terminal Area Forecast
Industry trends indicate regional carriers are now operating and ordering aircraft up to 100 seats to replace smaller capacity aircraft. The 50-seat regional jet is beginning to be phased out from passenger service in lieu of more efficient 70 and 90-seat regional jets. This increase in aircraft seat capacity per flight will likely decrease the growth rate of aircraft operations to maintain the available seats per route to keep aircraft operating as full as possible.
FAA’s current definition of regional air taxi/commuter flights is 60 seats or less. As a result of this industry trend, this master planning effort originally proposed regional air taxi/commuter carriers to be defined as aircraft up to and including 100 seats. Air carriers would be defined as aircraft greater than 100 seats. This would better match the actual difference an air carrier (mainline) and commuter (regional) airline operation. The current definition is not relevant to airline industry trends. The FAA did not allow official forecasts to shown this definition. The official FAA forecasts are shown with the current 60 seat definition.
Regional Typical socioeconomic and demographic metrics reviewed that may affect commercial aviation activity include population, employment and per capita personal income (PCPI) for the Sioux Falls Metropolitan Statistical Area (MSA).
Since 2000, population and employment have risen fairly consistently with population growing at an average annual growth rate of 1.86 percent. These figures have only been affected slightly by the economic recession of 2009. This indicates a strong local economy with steady consistent growth. Future population growth is projected by the City of Sioux Falls at 2.32 percent annually through year 2035. These figures well exceed state and national projections.
0
5,000,000
10,000,000
15,000,000
20,000,000
25,000,000
30,000,000
35,000,000
1990 1995 2000 2005 2010 2015 2020 2025 2030 2035
Com
mer
cial
Ope
rati
ons
Year
U.S. Commercial Operations
Historical Air Carrier Operations Historical Air Taxi Operations
Historical Commercial Operations Forecast Commercial Operations
Forecast Air Taxi Operations Forecast Air Carrier Operations
Airport Master Plan Update Sioux Falls Regional Airport (FSD)
AX-13
PCPI in the MSA has grown at 3.4 percent annually (2013 dollars, not adjusted for inflation) and is projected to grow at a rate of 4.8 percent annually. PCPI has risen faster than the national average and is projected to be comparable to projected state and national growth rates.
Regional socioeconomic and demographic measures indicate consistent, higher than average growth within the core catchment area. These trends have yielded an increasing use for commercial air service at FSD.
Previous Forecasts Previously published forecasts of passenger enplanements and operations at FSD are identified.
2006 Airport Master Plan The recommended forecast from the 2006 Airport Master Plan identified passenger enplanements to grow from 358,450 in year 2005 to 645,000 in year 2025, for an average annual growth rate of 2.98 percent. Current passenger enplanements exceed this forecast growth rate. This Master Plan assumed a growing economy and an increasing travel propensity for those within the Sioux Falls MSA.
Airline operations are to grow at a 2.09 percent annual growth rate but aircraft load factors would hover around 50 percent. This fleet mix projects the average seats per departure would be grow to over 100 by the long-term. Fleet mix and load factor assumptions have changed significantly since the last master plan due to airline market forces.
FAA Terminal Area Forecast The FAA annually publishes the Terminal Area Forecast (TAF) to plan for the future needs at airport identified in the National Plan of Integrated Airport Systems (NPIAS). These forecasts are based on multiple input metrics with forecasts projected at a steady rate over time. Local factors such as changes in air service are not considered but should be evaluated in a local master planning effort. As a small-hub primary commercial service airport, the forecasts of activity prepared in this Master Plan for FSD must be compared with the TAF and approved by the FAA.
The 2012 FAA TAF published January 2013 projects total enplanements to grow to 684,829 at the end of the planning period in year 2033, which represents an average annual growth rate of 1.91 percent. Enplanements by air carriers are forecast to remain steady and those in Regional aircraft projected to grow at 2.80 percent annually. Enplanements by regional aircraft are forecast to consist of 74 percent of total enplanements by the end of the planning period. The FAA’s forecast has an optimistic outlook on passenger enplanement activity at FSD as compared to forecasts found at other airports. This is due to FSD airport staff involvement in annual updates to the TAF.
Airline operations include all commercial air carrier and commuter/air taxi operations. These include both scheduled and non-scheduled passenger and cargo flights operating under Federal Aviation Regulation (FAR) Part 121 or 135. The TAF forecasts air carrier flights will
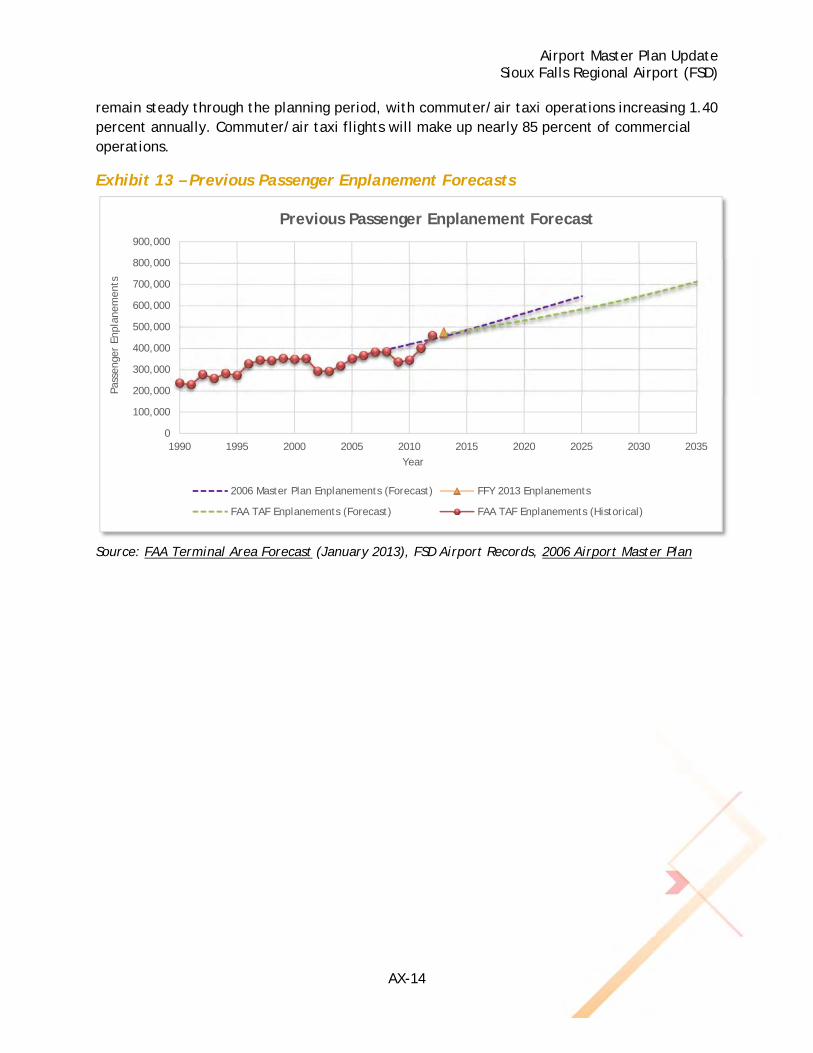
Airport Master Plan Update Sioux Falls Regional Airport (FSD)
AX-14
remain steady through the planning period, with commuter/air taxi operations increasing 1.40 percent annually. Commuter/air taxi flights will make up nearly 85 percent of commercial operations.
Exhibit 13 – Previous Passenger Enplanement Forecasts
Source: FAA Terminal Area Forecast (January 2013), FSD Airport Records, 2006 Airport Master Plan
0
100,000
200,000
300,000
400,000
500,000
600,000
700,000
800,000
900,000
1990 1995 2000 2005 2010 2015 2020 2025 2030 2035
Pass
enge
r En
plan
emen
ts
Year
Previous Passenger Enplanement Forecast
2006 Master Plan Enplanements (Forecast) FFY 2013 Enplanements
FAA TAF Enplanements (Forecast) FAA TAF Enplanements (Historical)
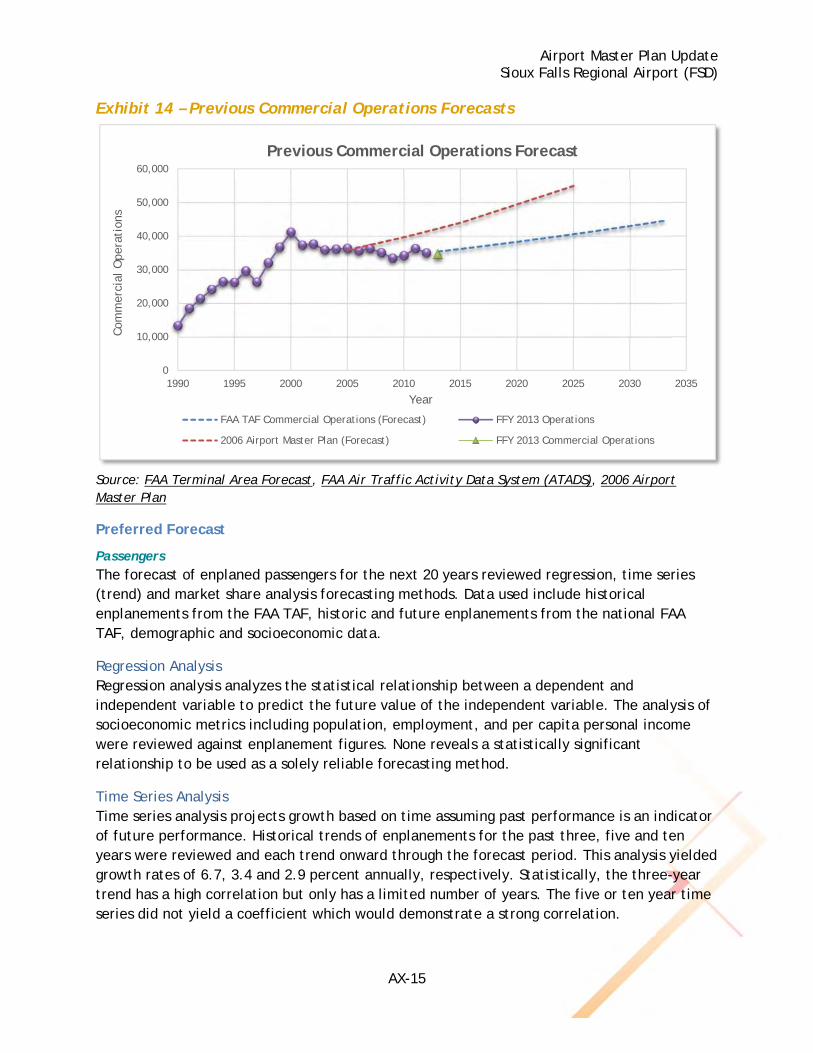
Airport Master Plan Update Sioux Falls Regional Airport (FSD)
AX-15
Exhibit 14 – Previous Commercial Operations Forecasts
Source: FAA Terminal Area Forecast, FAA Air Traffic Activity Data System (ATADS), 2006 Airport Master Plan
Preferred Forecast
Passengers The forecast of enplaned passengers for the next 20 years reviewed regression, time series (trend) and market share analysis forecasting methods. Data used include historical enplanements from the FAA TAF, historic and future enplanements from the national FAA TAF, demographic and socioeconomic data.
Regression Analysis Regression analysis analyzes the statistical relationship between a dependent and independent variable to predict the future value of the independent variable. The analysis of socioeconomic metrics including population, employment, and per capita personal income were reviewed against enplanement figures. None reveals a statistically significant relationship to be used as a solely reliable forecasting method.
Time Series Analysis Time series analysis projects growth based on time assuming past performance is an indicator of future performance. Historical trends of enplanements for the past three, five and ten years were reviewed and each trend onward through the forecast period. This analysis yielded growth rates of 6.7, 3.4 and 2.9 percent annually, respectively. Statistically, the three-year trend has a high correlation but only has a limited number of years. The five or ten year time series did not yield a coefficient which would demonstrate a strong correlation.
0
10,000
20,000
30,000
40,000
50,000
60,000
1990 1995 2000 2005 2010 2015 2020 2025 2030 2035
Com
mer
cial
Ope
rati
ons
Year
Previous Commercial Operations Forecast
FAA TAF Commercial Operations (Forecast) FFY 2013 Operations
2006 Airport Master Plan (Forecast) FFY 2013 Commercial Operations
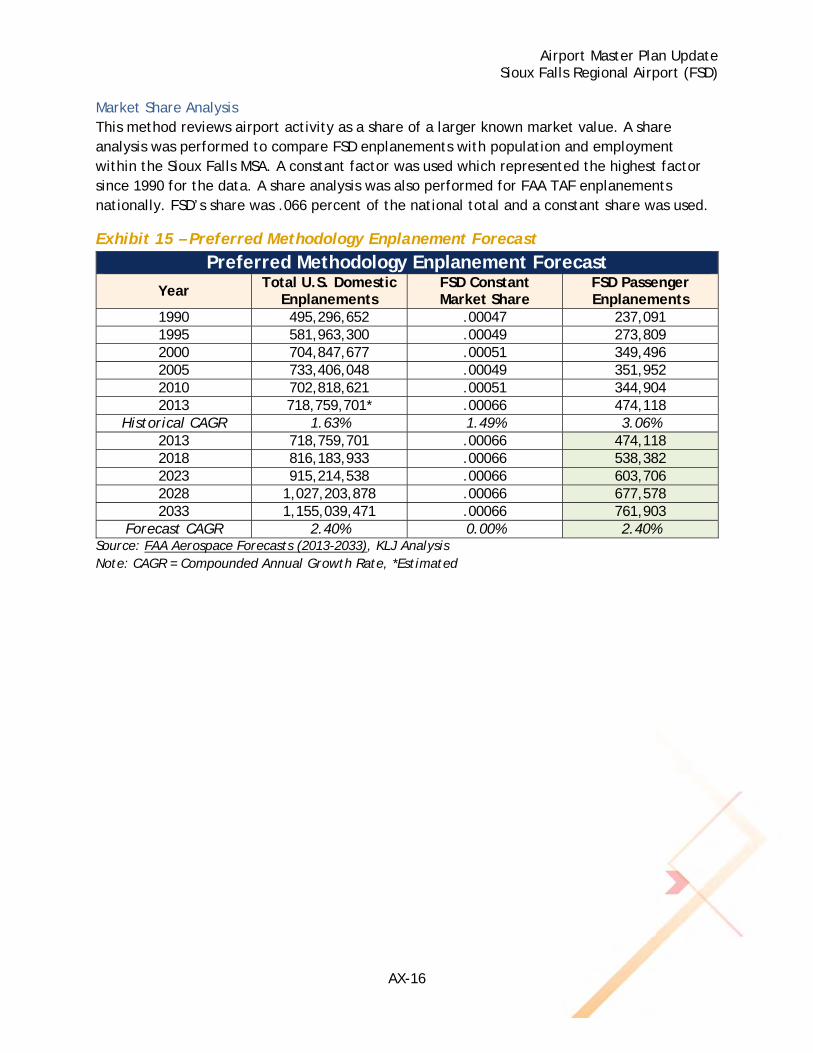
Airport Master Plan Update Sioux Falls Regional Airport (FSD)
AX-16
Market Share Analysis This method reviews airport activity as a share of a larger known market value. A share analysis was performed to compare FSD enplanements with population and employment within the Sioux Falls MSA. A constant factor was used which represented the highest factor since 1990 for the data. A share analysis was also performed for FAA TAF enplanements nationally. FSD’s share was .066 percent of the national total and a constant share was used.
Exhibit 15 – Preferred Methodology Enplanement Forecast
Preferred Methodology Enplanement Forecast
Year Total U.S. Domestic Enplanements
FSD Constant Market Share
FSD Passenger Enplanements
1990 495,296,652 .00047 237,091 1995 581,963,300 .00049 273,809 2000 704,847,677 .00051 349,496 2005 733,406,048 .00049 351,952 2010 702,818,621 .00051 344,904 2013 718,759,701* .00066 474,118
Historical CAGR 1.63% 1.49% 3.06% 2013 718,759,701 .00066 474,118 2018 816,183,933 .00066 538,382 2023 915,214,538 .00066 603,706 2028 1,027,203,878 .00066 677,578 2033 1,155,039,471 .00066 761,903
Forecast CAGR 2.40% 0.00% 2.40% Source: FAA Aerospace Forecasts (2013-2033), KLJ Analysis Note: CAGR = Compounded Annual Growth Rate, *Estimated
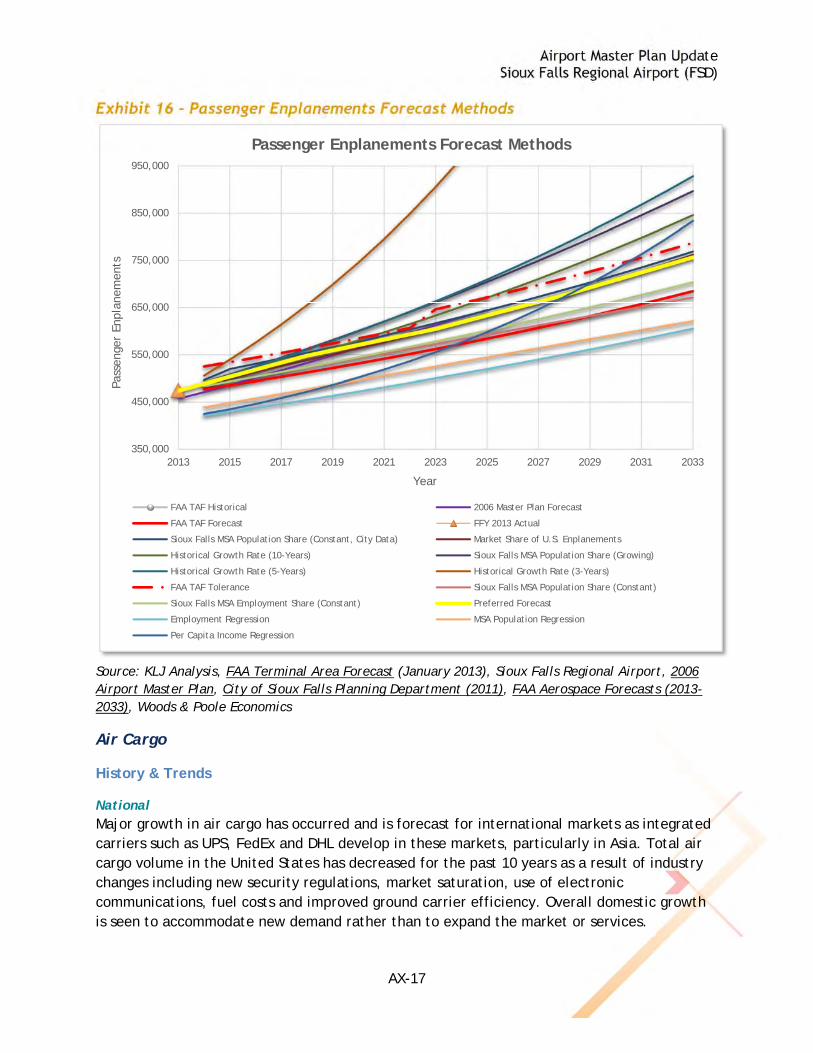
Airport Master Plan Update Sioux Falls Regional Airport (FSD)
AX-17
Exhibit 16 – Passenger Enplanements Forecast Methods
Source: KLJ Analysis, FAA Terminal Area Forecast (January 2013), Sioux Falls Regional Airport, 2006 Airport Master Plan, City of Sioux Falls Planning Department (2011), FAA Aerospace Forecasts (2013-2033), Woods & Poole Economics
Air Cargo
History & Trends
National Major growth in air cargo has occurred and is forecast for international markets as integrated carriers such as UPS, FedEx and DHL develop in these markets, particularly in Asia. Total air cargo volume in the United States has decreased for the past 10 years as a result of industry changes including new security regulations, market saturation, use of electronic communications, fuel costs and improved ground carrier efficiency. Overall domestic growth is seen to accommodate new demand rather than to expand the market or services.
350,000
450,000
550,000
650,000
750,000
850,000
950,000
2013 2015 2017 2019 2021 2023 2025 2027 2029 2031 2033
Pass
enge
r En
plan
emen
ts
Year
Passenger Enplanements Forecast Methods
FAA TAF Historical 2006 Master Plan Forecast
FAA TAF Forecast FFY 2013 Actual
Sioux Falls MSA Population Share (Constant, City Data) Market Share of U.S. Enplanements
Historical Growth Rate (10-Years) Sioux Falls MSA Population Share (Growing)
Historical Growth Rate (5-Years) Historical Growth Rate (3-Years)
FAA TAF Tolerance Sioux Falls MSA Population Share (Constant)
Sioux Falls MSA Employment Share (Constant) Preferred Forecast
Employment Regression MSA Population Regression
Per Capita Income Regression
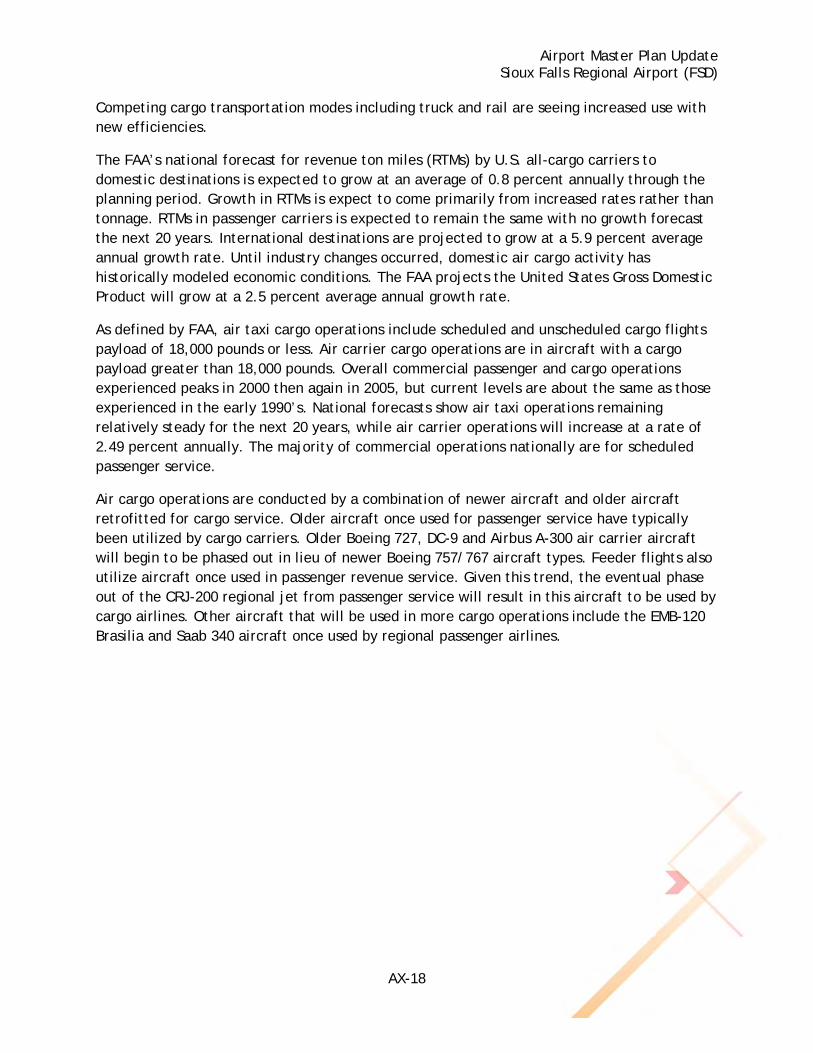
Airport Master Plan Update Sioux Falls Regional Airport (FSD)
AX-18
Competing cargo transportation modes including truck and rail are seeing increased use with new efficiencies.
The FAA’s national forecast for revenue ton miles (RTMs) by U.S. all-cargo carriers to domestic destinations is expected to grow at an average of 0.8 percent annually through the planning period. Growth in RTMs is expect to come primarily from increased rates rather than tonnage. RTMs in passenger carriers is expected to remain the same with no growth forecast the next 20 years. International destinations are projected to grow at a 5.9 percent average annual growth rate. Until industry changes occurred, domestic air cargo activity has historically modeled economic conditions. The FAA projects the United States Gross Domestic Product will grow at a 2.5 percent average annual growth rate.
As defined by FAA, air taxi cargo operations include scheduled and unscheduled cargo flights payload of 18,000 pounds or less. Air carrier cargo operations are in aircraft with a cargo payload greater than 18,000 pounds. Overall commercial passenger and cargo operations experienced peaks in 2000 then again in 2005, but current levels are about the same as those experienced in the early 1990’s. National forecasts show air taxi operations remaining relatively steady for the next 20 years, while air carrier operations will increase at a rate of 2.49 percent annually. The majority of commercial operations nationally are for scheduled passenger service.
Air cargo operations are conducted by a combination of newer aircraft and older aircraft retrofitted for cargo service. Older aircraft once used for passenger service have typically been utilized by cargo carriers. Older Boeing 727, DC-9 and Airbus A-300 air carrier aircraft will begin to be phased out in lieu of newer Boeing 757/767 aircraft types. Feeder flights also utilize aircraft once used in passenger revenue service. Given this trend, the eventual phase out of the CRJ-200 regional jet from passenger service will result in this aircraft to be used by cargo airlines. Other aircraft that will be used in more cargo operations include the EMB-120 Brasilia and Saab 340 aircraft once used by regional passenger airlines.
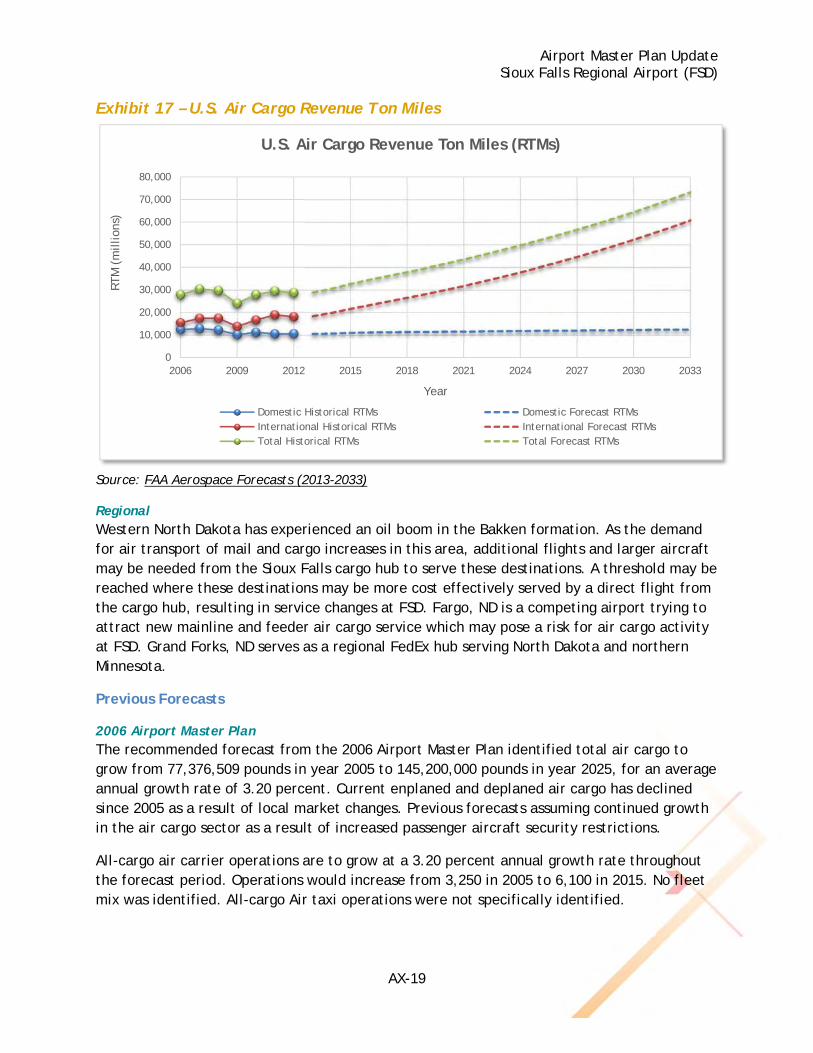
Airport Master Plan Update Sioux Falls Regional Airport (FSD)
AX-19
Exhibit 17 – U.S. Air Cargo Revenue Ton Miles
Source: FAA Aerospace Forecasts (2013-2033)
Regional Western North Dakota has experienced an oil boom in the Bakken formation. As the demand for air transport of mail and cargo increases in this area, additional flights and larger aircraft may be needed from the Sioux Falls cargo hub to serve these destinations. A threshold may be reached where these destinations may be more cost effectively served by a direct flight from the cargo hub, resulting in service changes at FSD. Fargo, ND is a competing airport trying to attract new mainline and feeder air cargo service which may pose a risk for air cargo activity at FSD. Grand Forks, ND serves as a regional FedEx hub serving North Dakota and northern Minnesota.
Previous Forecasts
2006 Airport Master Plan The recommended forecast from the 2006 Airport Master Plan identified total air cargo to grow from 77,376,509 pounds in year 2005 to 145,200,000 pounds in year 2025, for an average annual growth rate of 3.20 percent. Current enplaned and deplaned air cargo has declined since 2005 as a result of local market changes. Previous forecasts assuming continued growth in the air cargo sector as a result of increased passenger aircraft security restrictions.
All-cargo air carrier operations are to grow at a 3.20 percent annual growth rate throughout the forecast period. Operations would increase from 3,250 in 2005 to 6,100 in 2015. No fleet mix was identified. All-cargo Air taxi operations were not specifically identified.
0
10,000
20,000
30,000
40,000
50,000
60,000
70,000
80,000
2006 2009 2012 2015 2018 2021 2024 2027 2030 2033
RTM
(m
illio
ns)
Year
U.S. Air Cargo Revenue Ton Miles (RTMs)
Domestic Historical RTMs Domestic Forecast RTMsInternational Historical RTMs International Forecast RTMsTotal Historical RTMs Total Forecast RTMs
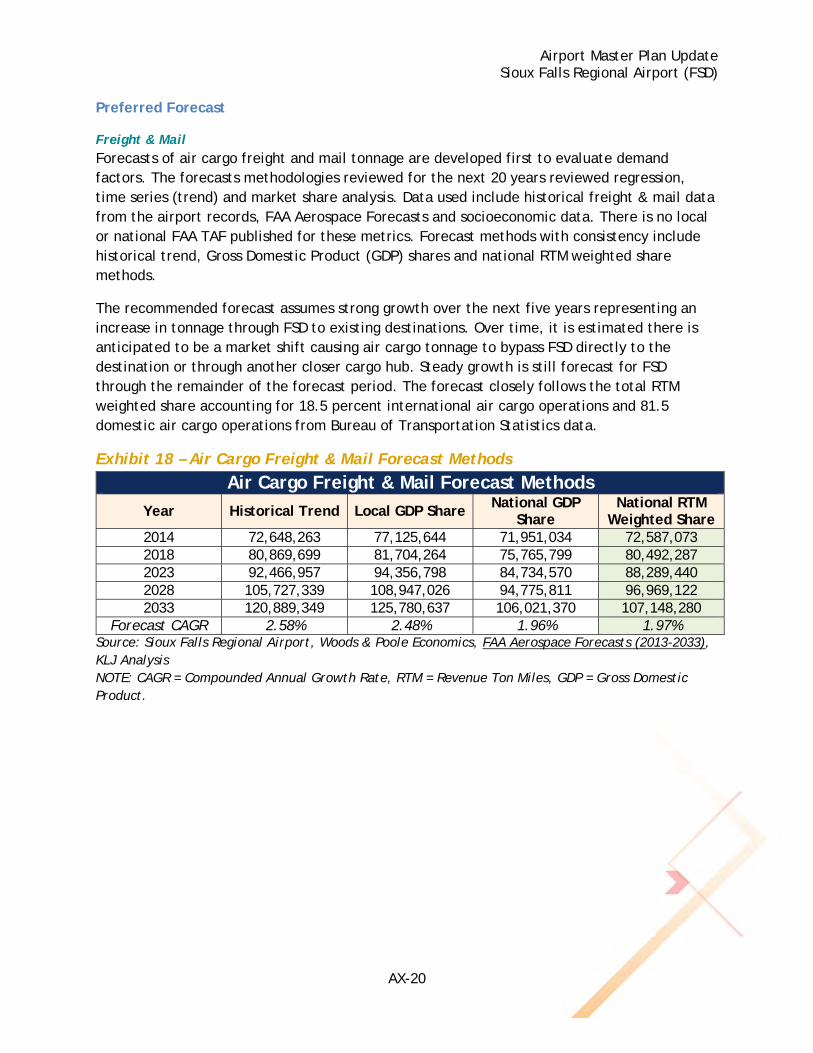
Airport Master Plan Update Sioux Falls Regional Airport (FSD)
AX-20
Preferred Forecast
Freight & Mail Forecasts of air cargo freight and mail tonnage are developed first to evaluate demand factors. The forecasts methodologies reviewed for the next 20 years reviewed regression, time series (trend) and market share analysis. Data used include historical freight & mail data from the airport records, FAA Aerospace Forecasts and socioeconomic data. There is no local or national FAA TAF published for these metrics. Forecast methods with consistency include historical trend, Gross Domestic Product (GDP) shares and national RTM weighted share methods.
The recommended forecast assumes strong growth over the next five years representing an increase in tonnage through FSD to existing destinations. Over time, it is estimated there is anticipated to be a market shift causing air cargo tonnage to bypass FSD directly to the destination or through another closer cargo hub. Steady growth is still forecast for FSD through the remainder of the forecast period. The forecast closely follows the total RTM weighted share accounting for 18.5 percent international air cargo operations and 81.5 domestic air cargo operations from Bureau of Transportation Statistics data.
Exhibit 18 – Air Cargo Freight & Mail Forecast Methods
Air Cargo Freight & Mail Forecast Methods
Year Historical Trend Local GDP Share National GDP Share
National RTM Weighted Share
2014 72,648,263 77,125,644 71,951,034 72,587,073 2018 80,869,699 81,704,264 75,765,799 80,492,287 2023 92,466,957 94,356,798 84,734,570 88,289,440 2028 105,727,339 108,947,026 94,775,811 96,969,122 2033 120,889,349 125,780,637 106,021,370 107,148,280
Forecast CAGR 2.58% 2.48% 1.96% 1.97% Source: Sioux Falls Regional Airport, Woods & Poole Economics, FAA Aerospace Forecasts (2013-2033), KLJ Analysis NOTE: CAGR = Compounded Annual Growth Rate, RTM = Revenue Ton Miles, GDP = Gross Domestic Product.
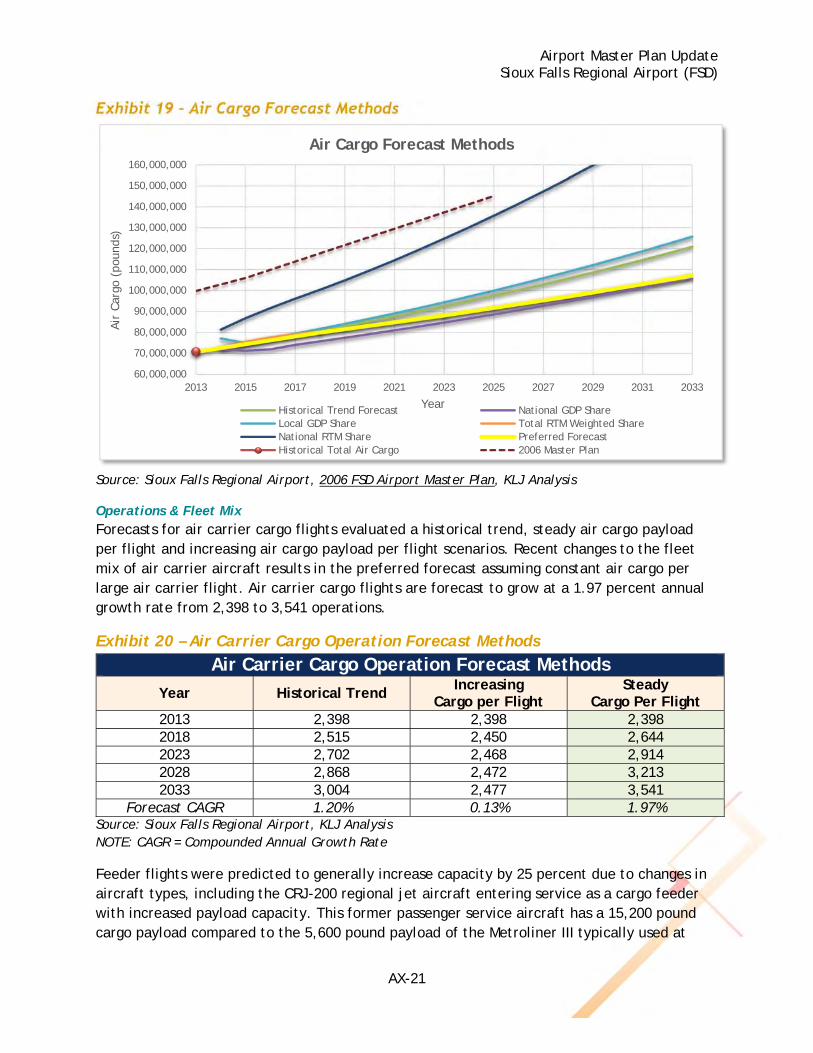
Airport Master Plan Update Sioux Falls Regional Airport (FSD)
AX-21
Exhibit 19 – Air Cargo Forecast Methods
Source: Sioux Falls Regional Airport, 2006 FSD Airport Master Plan, KLJ Analysis
Operations & Fleet Mix Forecasts for air carrier cargo flights evaluated a historical trend, steady air cargo payload per flight and increasing air cargo payload per flight scenarios. Recent changes to the fleet mix of air carrier aircraft results in the preferred forecast assuming constant air cargo per large air carrier flight. Air carrier cargo flights are forecast to grow at a 1.97 percent annual growth rate from 2,398 to 3,541 operations.
Exhibit 20 – Air Carrier Cargo Operation Forecast Methods
Air Carrier Cargo Operation Forecast Methods
Year Historical Trend Increasing Cargo per Flight
Steady Cargo Per Flight
2013 2,398 2,398 2,398 2018 2,515 2,450 2,644 2023 2,702 2,468 2,914 2028 2,868 2,472 3,213 2033 3,004 2,477 3,541
Forecast CAGR 1.20% 0.13% 1.97% Source: Sioux Falls Regional Airport, KLJ Analysis NOTE: CAGR = Compounded Annual Growth Rate
Feeder flights were predicted to generally increase capacity by 25 percent due to changes in aircraft types, including the CRJ-200 regional jet aircraft entering service as a cargo feeder with increased payload capacity. This former passenger service aircraft has a 15,200 pound cargo payload compared to the 5,600 pound payload of the Metroliner III typically used at
60,000,000
70,000,000
80,000,000
90,000,000
100,000,000
110,000,000
120,000,000
130,000,000
140,000,000
150,000,000
160,000,000
2013 2015 2017 2019 2021 2023 2025 2027 2029 2031 2033
Air
Car
go (
poun
ds)
Year
Air Cargo Forecast Methods
Historical Trend Forecast National GDP ShareLocal GDP Share Total RTM Weighted ShareNational RTM Share Preferred ForecastHistorical Total Air Cargo 2006 Master Plan
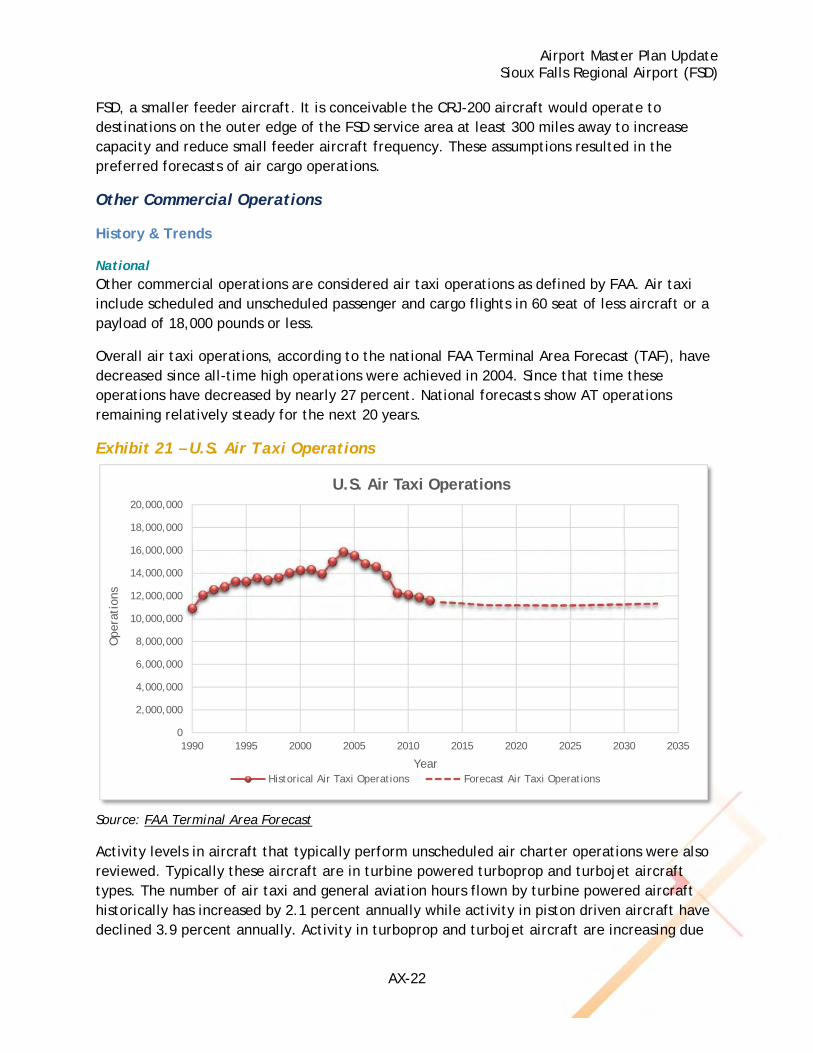
Airport Master Plan Update Sioux Falls Regional Airport (FSD)
AX-22
FSD, a smaller feeder aircraft. It is conceivable the CRJ-200 aircraft would operate to destinations on the outer edge of the FSD service area at least 300 miles away to increase capacity and reduce small feeder aircraft frequency. These assumptions resulted in the preferred forecasts of air cargo operations.
Other Commercial Operations
History & Trends
National Other commercial operations are considered air taxi operations as defined by FAA. Air taxi include scheduled and unscheduled passenger and cargo flights in 60 seat of less aircraft or a payload of 18,000 pounds or less.
Overall air taxi operations, according to the national FAA Terminal Area Forecast (TAF), have decreased since all-time high operations were achieved in 2004. Since that time these operations have decreased by nearly 27 percent. National forecasts show AT operations remaining relatively steady for the next 20 years.
Exhibit 21 – U.S. Air Taxi Operations
Source: FAA Terminal Area Forecast
Activity levels in aircraft that typically perform unscheduled air charter operations were also reviewed. Typically these aircraft are in turbine powered turboprop and turbojet aircraft types. The number of air taxi and general aviation hours flown by turbine powered aircraft historically has increased by 2.1 percent annually while activity in piston driven aircraft have declined 3.9 percent annually. Activity in turboprop and turbojet aircraft are increasing due
0
2,000,000
4,000,000
6,000,000
8,000,000
10,000,000
12,000,000
14,000,000
16,000,000
18,000,000
20,000,000
1990 1995 2000 2005 2010 2015 2020 2025 2030 2035
Ope
rati
ons
Year
U.S. Air Taxi Operations
Historical Air Taxi Operations Forecast Air Taxi Operations
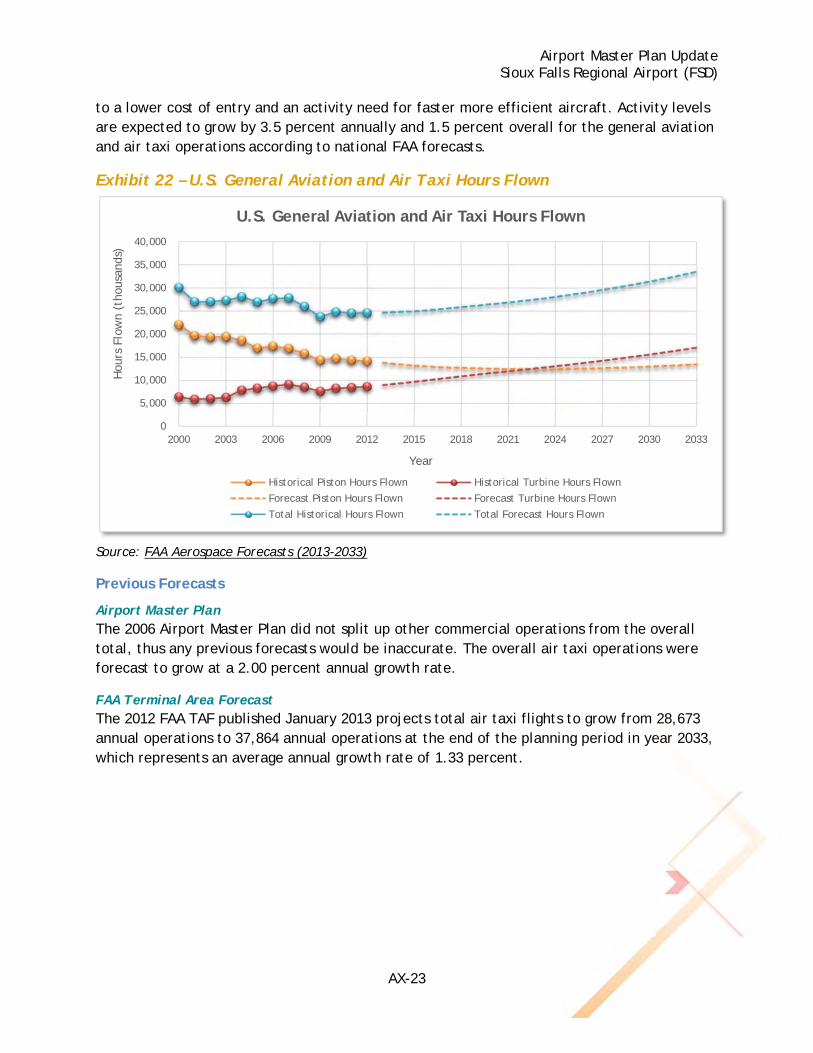
Airport Master Plan Update Sioux Falls Regional Airport (FSD)
AX-23
to a lower cost of entry and an activity need for faster more efficient aircraft. Activity levels are expected to grow by 3.5 percent annually and 1.5 percent overall for the general aviation and air taxi operations according to national FAA forecasts.
Exhibit 22 – U.S. General Aviation and Air Taxi Hours Flown
Source: FAA Aerospace Forecasts (2013-2033)
Previous Forecasts
Airport Master Plan The 2006 Airport Master Plan did not split up other commercial operations from the overall total, thus any previous forecasts would be inaccurate. The overall air taxi operations were forecast to grow at a 2.00 percent annual growth rate.
FAA Terminal Area Forecast The 2012 FAA TAF published January 2013 projects total air taxi flights to grow from 28,673 annual operations to 37,864 annual operations at the end of the planning period in year 2033, which represents an average annual growth rate of 1.33 percent.
0
5,000
10,000
15,000
20,000
25,000
30,000
35,000
40,000
2000 2003 2006 2009 2012 2015 2018 2021 2024 2027 2030 2033
Hou
rs F
low
n (t
hous
ands
)
Year
U.S. General Aviation and Air Taxi Hours Flown
Historical Piston Hours Flown Historical Turbine Hours Flown
Forecast Piston Hours Flown Forecast Turbine Hours Flown
Total Historical Hours Flown Total Forecast Hours Flown
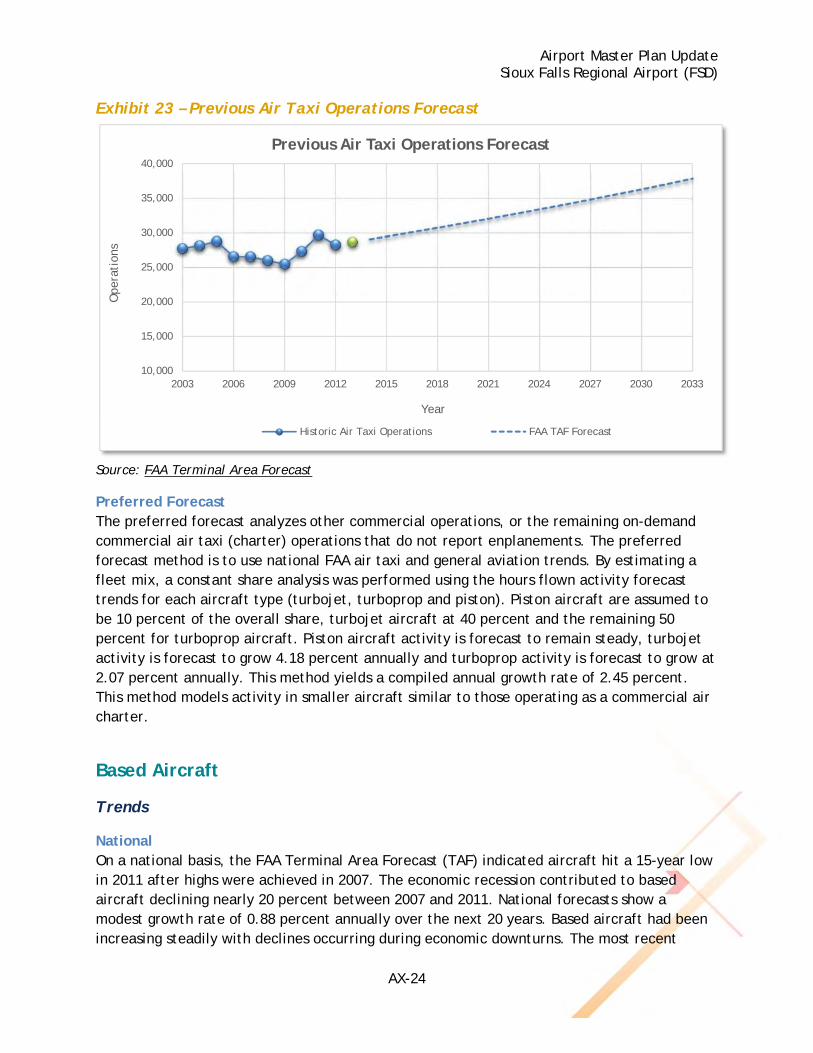
Airport Master Plan Update Sioux Falls Regional Airport (FSD)
AX-24
Exhibit 23 – Previous Air Taxi Operations Forecast
Source: FAA Terminal Area Forecast
Preferred Forecast The preferred forecast analyzes other commercial operations, or the remaining on-demand commercial air taxi (charter) operations that do not report enplanements. The preferred forecast method is to use national FAA air taxi and general aviation trends. By estimating a fleet mix, a constant share analysis was performed using the hours flown activity forecast trends for each aircraft type (turbojet, turboprop and piston). Piston aircraft are assumed to be 10 percent of the overall share, turbojet aircraft at 40 percent and the remaining 50 percent for turboprop aircraft. Piston aircraft activity is forecast to remain steady, turbojet activity is forecast to grow 4.18 percent annually and turboprop activity is forecast to grow at 2.07 percent annually. This method yields a compiled annual growth rate of 2.45 percent. This method models activity in smaller aircraft similar to those operating as a commercial air charter.
Based Aircraft
Trends
National On a national basis, the FAA Terminal Area Forecast (TAF) indicated aircraft hit a 15-year low in 2011 after highs were achieved in 2007. The economic recession contributed to based aircraft declining nearly 20 percent between 2007 and 2011. National forecasts show a modest growth rate of 0.88 percent annually over the next 20 years. Based aircraft had been increasing steadily with declines occurring during economic downturns. The most recent
10,000
15,000
20,000
25,000
30,000
35,000
40,000
2003 2006 2009 2012 2015 2018 2021 2024 2027 2030 2033
Ope
rati
ons
Year
Previous Air Taxi Operations Forecast
Historic Air Taxi Operations FAA TAF Forecast
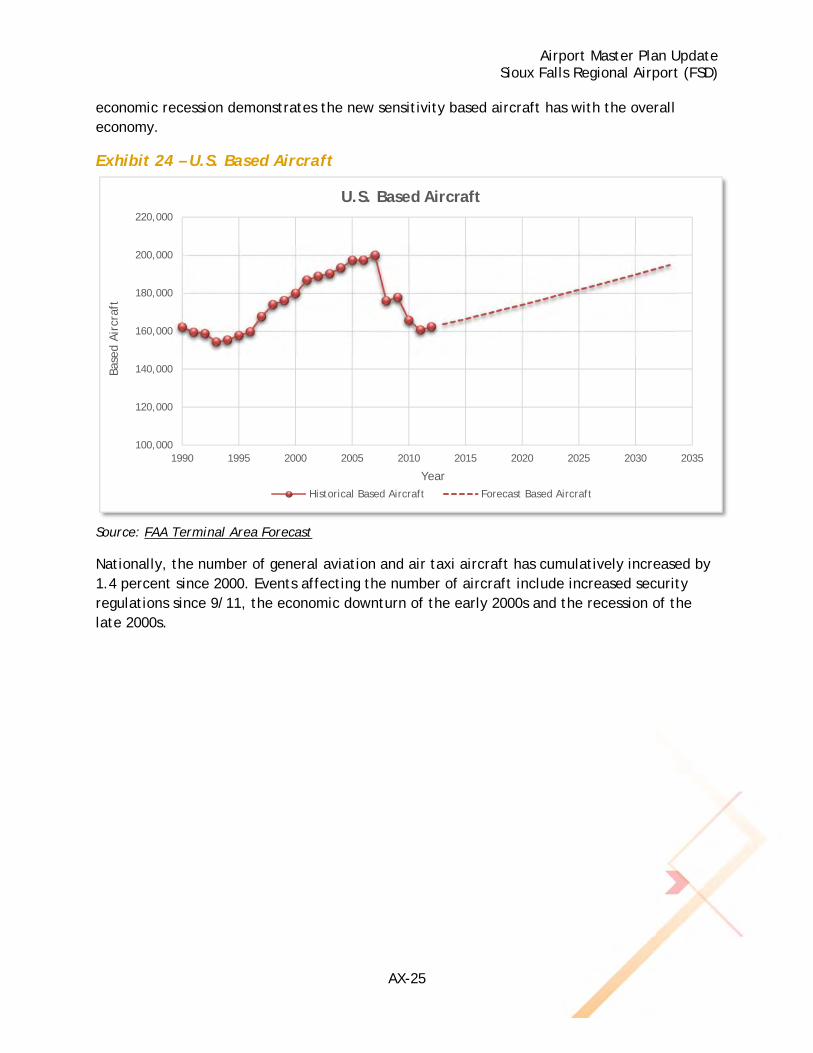
Airport Master Plan Update Sioux Falls Regional Airport (FSD)
AX-25
economic recession demonstrates the new sensitivity based aircraft has with the overall economy.
Exhibit 24 – U.S. Based Aircraft
Source: FAA Terminal Area Forecast
Nationally, the number of general aviation and air taxi aircraft has cumulatively increased by 1.4 percent since 2000. Events affecting the number of aircraft include increased security regulations since 9/11, the economic downturn of the early 2000s and the recession of the late 2000s.
100,000
120,000
140,000
160,000
180,000
200,000
220,000
1990 1995 2000 2005 2010 2015 2020 2025 2030 2035
Base
d Air
craf
t
Year
U.S. Based Aircraft
Historical Based Aircraft Forecast Based Aircraft
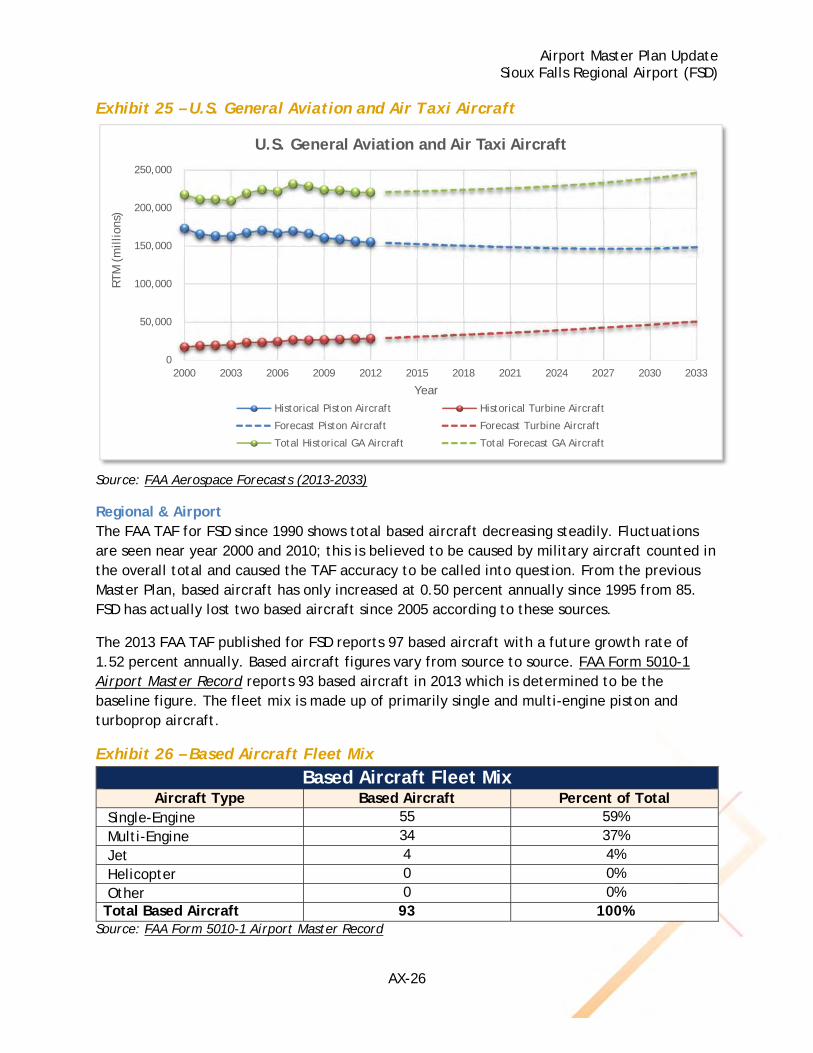
Airport Master Plan Update Sioux Falls Regional Airport (FSD)
AX-26
Exhibit 25 – U.S. General Aviation and Air Taxi Aircraft
Source: FAA Aerospace Forecasts (2013-2033)
Regional & Airport The FAA TAF for FSD since 1990 shows total based aircraft decreasing steadily. Fluctuations are seen near year 2000 and 2010; this is believed to be caused by military aircraft counted in the overall total and caused the TAF accuracy to be called into question. From the previous Master Plan, based aircraft has only increased at 0.50 percent annually since 1995 from 85. FSD has actually lost two based aircraft since 2005 according to these sources.
The 2013 FAA TAF published for FSD reports 97 based aircraft with a future growth rate of 1.52 percent annually. Based aircraft figures vary from source to source. FAA Form 5010-1 Airport Master Record reports 93 based aircraft in 2013 which is determined to be the baseline figure. The fleet mix is made up of primarily single and multi-engine piston and turboprop aircraft.
Exhibit 26 – Based Aircraft Fleet Mix
Based Aircraft Fleet Mix Aircraft Type Based Aircraft Percent of Total
Single-Engine 55 59% Multi-Engine 34 37% Jet 4 4% Helicopter 0 0% Other 0 0% Total Based Aircraft 93 100%
Source: FAA Form 5010-1 Airport Master Record
0
50,000
100,000
150,000
200,000
250,000
2000 2003 2006 2009 2012 2015 2018 2021 2024 2027 2030 2033
RTM
(m
illio
ns)
Year
U.S. General Aviation and Air Taxi Aircraft
Historical Piston Aircraft Historical Turbine Aircraft
Forecast Piston Aircraft Forecast Turbine Aircraft
Total Historical GA Aircraft Total Forecast GA Aircraft
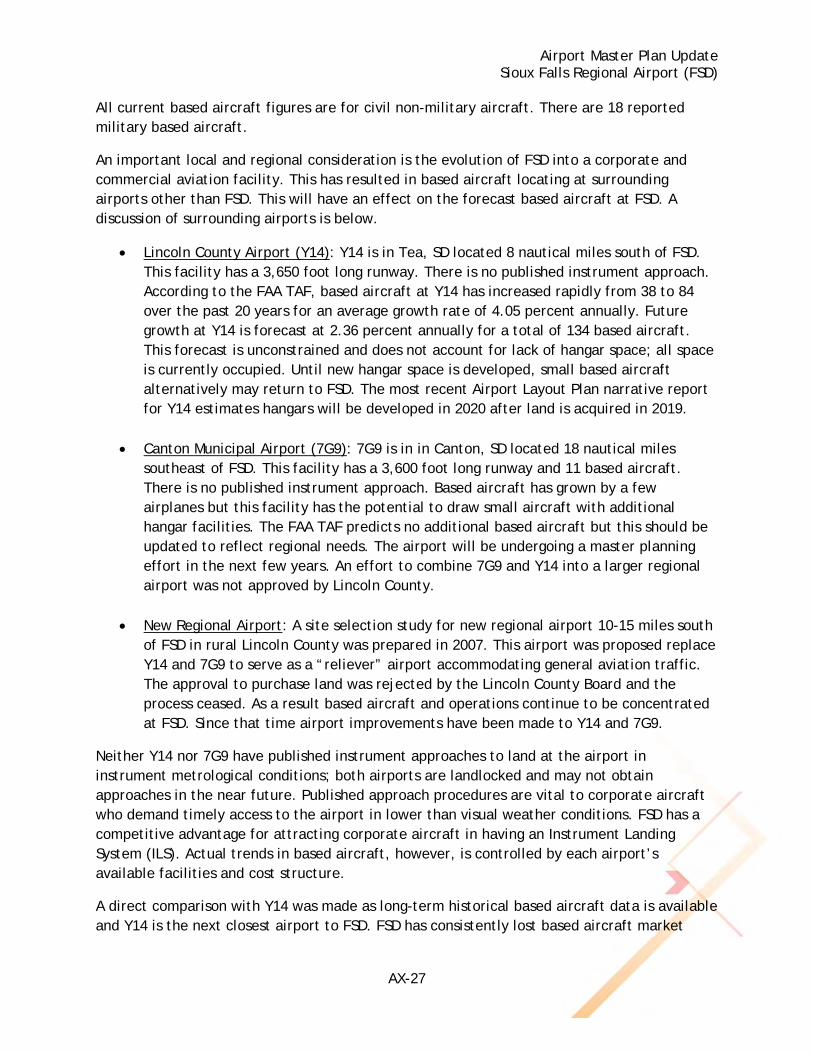
Airport Master Plan Update Sioux Falls Regional Airport (FSD)
AX-27
All current based aircraft figures are for civil non-military aircraft. There are 18 reported military based aircraft.
An important local and regional consideration is the evolution of FSD into a corporate and commercial aviation facility. This has resulted in based aircraft locating at surrounding airports other than FSD. This will have an effect on the forecast based aircraft at FSD. A discussion of surrounding airports is below.
Lincoln County Airport (Y14): Y14 is in Tea, SD located 8 nautical miles south of FSD. This facility has a 3,650 foot long runway. There is no published instrument approach. According to the FAA TAF, based aircraft at Y14 has increased rapidly from 38 to 84 over the past 20 years for an average growth rate of 4.05 percent annually. Future growth at Y14 is forecast at 2.36 percent annually for a total of 134 based aircraft. This forecast is unconstrained and does not account for lack of hangar space; all space is currently occupied. Until new hangar space is developed, small based aircraft alternatively may return to FSD. The most recent Airport Layout Plan narrative report for Y14 estimates hangars will be developed in 2020 after land is acquired in 2019.
Canton Municipal Airport (7G9): 7G9 is in in Canton, SD located 18 nautical miles southeast of FSD. This facility has a 3,600 foot long runway and 11 based aircraft. There is no published instrument approach. Based aircraft has grown by a few airplanes but this facility has the potential to draw small aircraft with additional hangar facilities. The FAA TAF predicts no additional based aircraft but this should be updated to reflect regional needs. The airport will be undergoing a master planning effort in the next few years. An effort to combine 7G9 and Y14 into a larger regional airport was not approved by Lincoln County.
New Regional Airport: A site selection study for new regional airport 10-15 miles south of FSD in rural Lincoln County was prepared in 2007. This airport was proposed replace Y14 and 7G9 to serve as a “reliever” airport accommodating general aviation traffic. The approval to purchase land was rejected by the Lincoln County Board and the process ceased. As a result based aircraft and operations continue to be concentrated at FSD. Since that time airport improvements have been made to Y14 and 7G9.
Neither Y14 nor 7G9 have published instrument approaches to land at the airport in instrument metrological conditions; both airports are landlocked and may not obtain approaches in the near future. Published approach procedures are vital to corporate aircraft who demand timely access to the airport in lower than visual weather conditions. FSD has a competitive advantage for attracting corporate aircraft in having an Instrument Landing System (ILS). Actual trends in based aircraft, however, is controlled by each airport’s available facilities and cost structure.
A direct comparison with Y14 was made as long-term historical based aircraft data is available and Y14 is the next closest airport to FSD. FSD has consistently lost based aircraft market
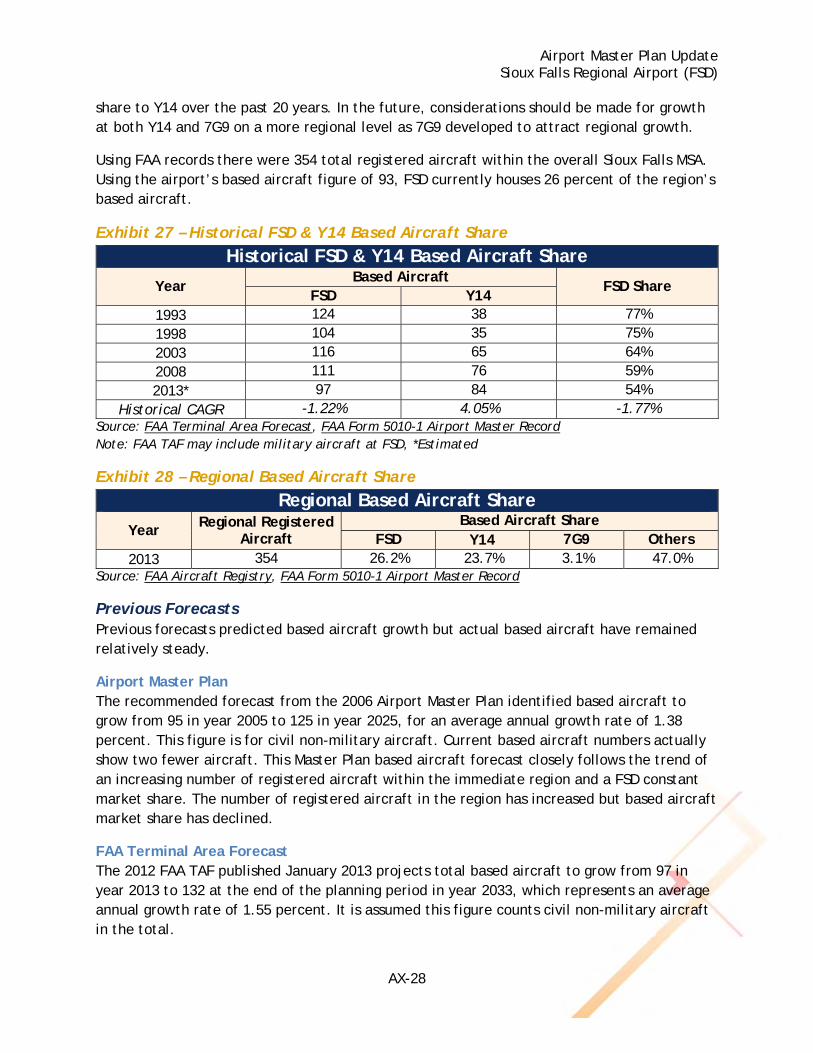
Airport Master Plan Update Sioux Falls Regional Airport (FSD)
AX-28
share to Y14 over the past 20 years. In the future, considerations should be made for growth at both Y14 and 7G9 on a more regional level as 7G9 developed to attract regional growth.
Using FAA records there were 354 total registered aircraft within the overall Sioux Falls MSA. Using the airport’s based aircraft figure of 93, FSD currently houses 26 percent of the region’s based aircraft.
Exhibit 27 – Historical FSD & Y14 Based Aircraft Share
Historical FSD & Y14 Based Aircraft Share
Year Based Aircraft
FSD Share FSD Y14
1993 124 38 77% 1998 104 35 75% 2003 116 65 64% 2008 111 76 59% 2013* 97 84 54%
Historical CAGR -1.22% 4.05% -1.77% Source: FAA Terminal Area Forecast, FAA Form 5010-1 Airport Master Record Note: FAA TAF may include military aircraft at FSD, *Estimated
Exhibit 28 – Regional Based Aircraft Share
Regional Based Aircraft Share
Year Regional Registered Aircraft
Based Aircraft Share FSD Y14 7G9 Others
2013 354 26.2% 23.7% 3.1% 47.0% Source: FAA Aircraft Registry, FAA Form 5010-1 Airport Master Record
Previous Forecasts Previous forecasts predicted based aircraft growth but actual based aircraft have remained relatively steady.
Airport Master Plan The recommended forecast from the 2006 Airport Master Plan identified based aircraft to grow from 95 in year 2005 to 125 in year 2025, for an average annual growth rate of 1.38 percent. This figure is for civil non-military aircraft. Current based aircraft numbers actually show two fewer aircraft. This Master Plan based aircraft forecast closely follows the trend of an increasing number of registered aircraft within the immediate region and a FSD constant market share. The number of registered aircraft in the region has increased but based aircraft market share has declined.
FAA Terminal Area Forecast The 2012 FAA TAF published January 2013 projects total based aircraft to grow from 97 in year 2013 to 132 at the end of the planning period in year 2033, which represents an average annual growth rate of 1.55 percent. It is assumed this figure counts civil non-military aircraft in the total.
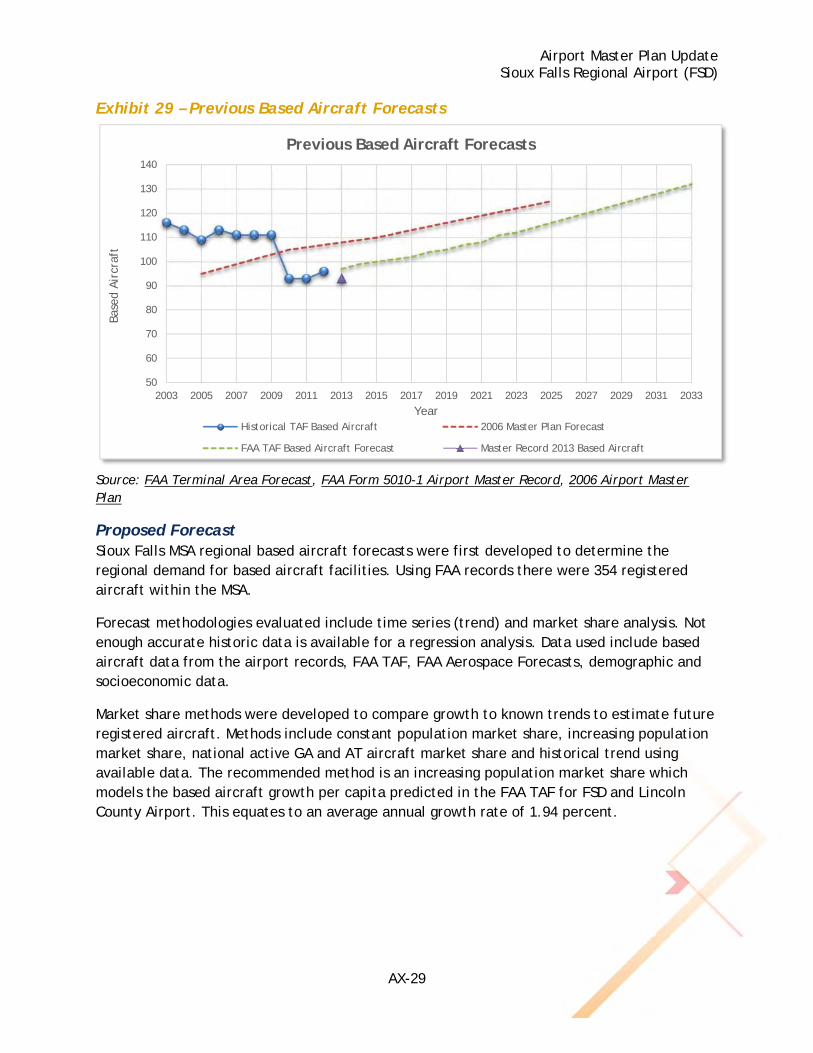
Airport Master Plan Update Sioux Falls Regional Airport (FSD)
AX-29
Exhibit 29 – Previous Based Aircraft Forecasts
Source: FAA Terminal Area Forecast, FAA Form 5010-1 Airport Master Record, 2006 Airport Master Plan
Proposed Forecast Sioux Falls MSA regional based aircraft forecasts were first developed to determine the regional demand for based aircraft facilities. Using FAA records there were 354 registered aircraft within the MSA.
Forecast methodologies evaluated include time series (trend) and market share analysis. Not enough accurate historic data is available for a regression analysis. Data used include based aircraft data from the airport records, FAA TAF, FAA Aerospace Forecasts, demographic and socioeconomic data.
Market share methods were developed to compare growth to known trends to estimate future registered aircraft. Methods include constant population market share, increasing population market share, national active GA and AT aircraft market share and historical trend using available data. The recommended method is an increasing population market share which models the based aircraft growth per capita predicted in the FAA TAF for FSD and Lincoln County Airport. This equates to an average annual growth rate of 1.94 percent.
50
60
70
80
90
100
110
120
130
140
2003 2005 2007 2009 2011 2013 2015 2017 2019 2021 2023 2025 2027 2029 2031 2033
Base
d Air
craf
t
Year
Previous Based Aircraft Forecasts
Historical TAF Based Aircraft 2006 Master Plan Forecast
FAA TAF Based Aircraft Forecast Master Record 2013 Based Aircraft
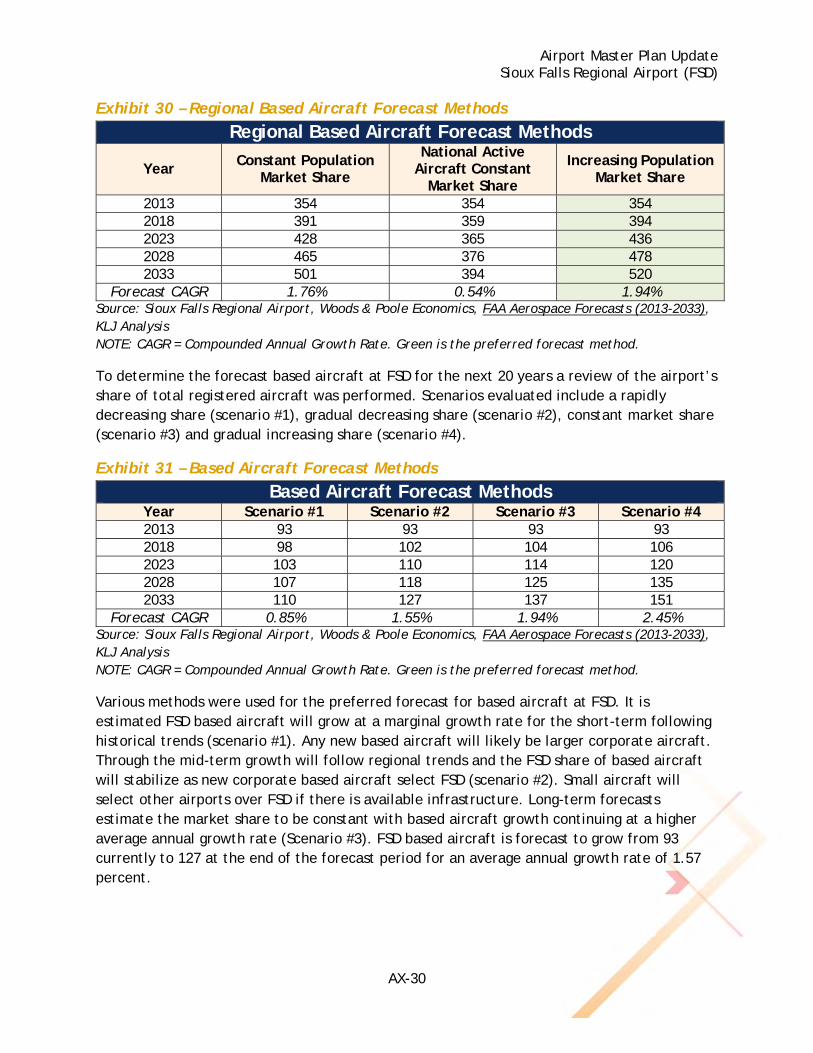
Airport Master Plan Update Sioux Falls Regional Airport (FSD)
AX-30
Exhibit 30 – Regional Based Aircraft Forecast Methods
Regional Based Aircraft Forecast Methods
Year Constant Population Market Share
National Active Aircraft Constant
Market Share
Increasing Population Market Share
2013 354 354 354 2018 391 359 394 2023 428 365 436 2028 465 376 478 2033 501 394 520
Forecast CAGR 1.76% 0.54% 1.94% Source: Sioux Falls Regional Airport, Woods & Poole Economics, FAA Aerospace Forecasts (2013-2033), KLJ Analysis NOTE: CAGR = Compounded Annual Growth Rate. Green is the preferred forecast method.
To determine the forecast based aircraft at FSD for the next 20 years a review of the airport’s share of total registered aircraft was performed. Scenarios evaluated include a rapidly decreasing share (scenario #1), gradual decreasing share (scenario #2), constant market share (scenario #3) and gradual increasing share (scenario #4).
Exhibit 31 – Based Aircraft Forecast Methods
Based Aircraft Forecast Methods Year Scenario #1 Scenario #2 Scenario #3 Scenario #4 2013 93 93 93 93 2018 98 102 104 106 2023 103 110 114 120 2028 107 118 125 135 2033 110 127 137 151
Forecast CAGR 0.85% 1.55% 1.94% 2.45% Source: Sioux Falls Regional Airport, Woods & Poole Economics, FAA Aerospace Forecasts (2013-2033), KLJ Analysis NOTE: CAGR = Compounded Annual Growth Rate. Green is the preferred forecast method.
Various methods were used for the preferred forecast for based aircraft at FSD. It is estimated FSD based aircraft will grow at a marginal growth rate for the short-term following historical trends (scenario #1). Any new based aircraft will likely be larger corporate aircraft. Through the mid-term growth will follow regional trends and the FSD share of based aircraft will stabilize as new corporate based aircraft select FSD (scenario #2). Small aircraft will select other airports over FSD if there is available infrastructure. Long-term forecasts estimate the market share to be constant with based aircraft growth continuing at a higher average annual growth rate (Scenario #3). FSD based aircraft is forecast to grow from 93 currently to 127 at the end of the forecast period for an average annual growth rate of 1.57 percent.
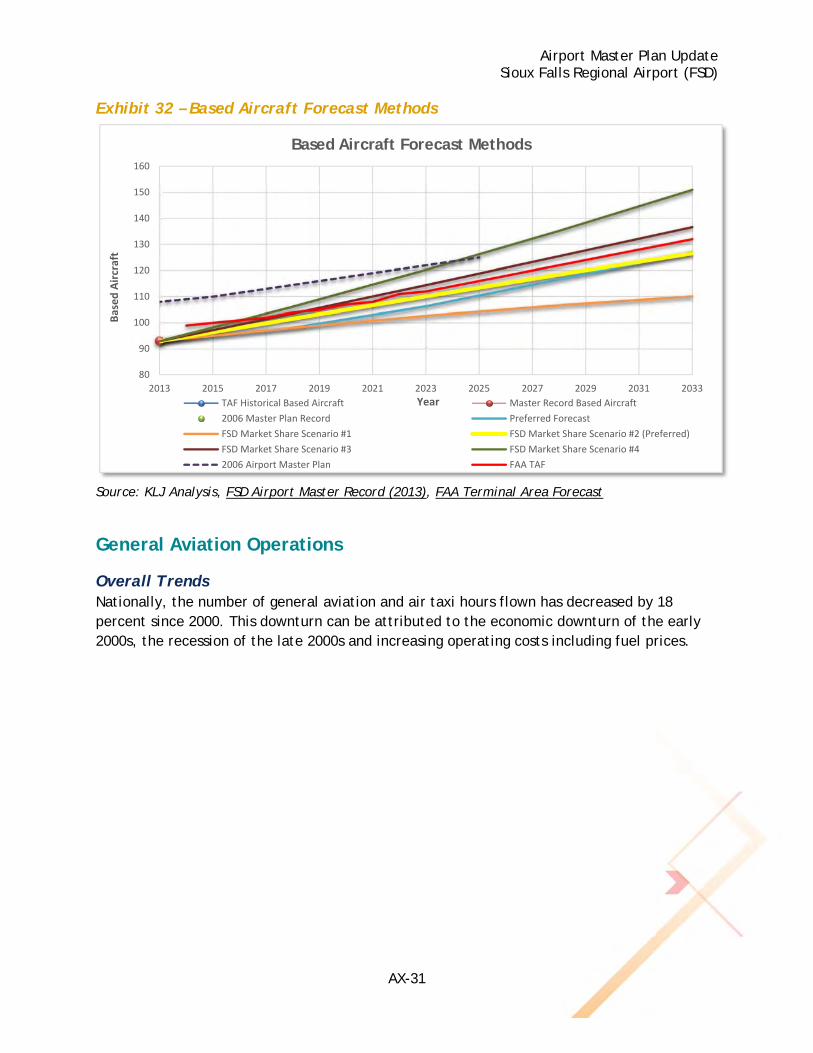
Airport Master Plan Update Sioux Falls Regional Airport (FSD)
AX-31
Exhibit 32 – Based Aircraft Forecast Methods
Source: KLJ Analysis, FSD Airport Master Record (2013), FAA Terminal Area Forecast
General Aviation Operations
Overall Trends Nationally, the number of general aviation and air taxi hours flown has decreased by 18 percent since 2000. This downturn can be attributed to the economic downturn of the early 2000s, the recession of the late 2000s and increasing operating costs including fuel prices.
80
90
100
110
120
130
140
150
160
2013 2015 2017 2019 2021 2023 2025 2027 2029 2031 2033
Based Aircraft
Year
Based Aircraft Forecast Methods
TAF Historical Based Aircraft Master Record Based Aircraft
2006 Master Plan Record Preferred Forecast
FSD Market Share Scenario #1 FSD Market Share Scenario #2 (Preferred)
FSD Market Share Scenario #3 FSD Market Share Scenario #4
2006 Airport Master Plan FAA TAF
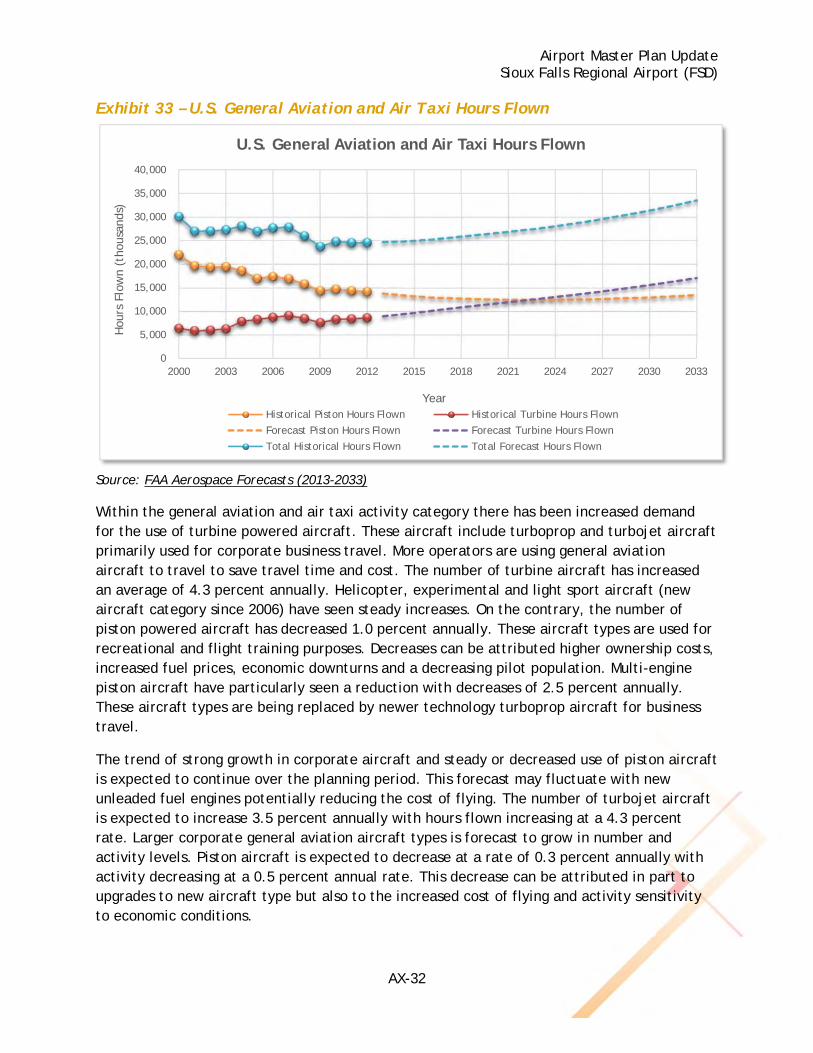
Airport Master Plan Update Sioux Falls Regional Airport (FSD)
AX-32
Exhibit 33 – U.S. General Aviation and Air Taxi Hours Flown
Source: FAA Aerospace Forecasts (2013-2033)
Within the general aviation and air taxi activity category there has been increased demand for the use of turbine powered aircraft. These aircraft include turboprop and turbojet aircraft primarily used for corporate business travel. More operators are using general aviation aircraft to travel to save travel time and cost. The number of turbine aircraft has increased an average of 4.3 percent annually. Helicopter, experimental and light sport aircraft (new aircraft category since 2006) have seen steady increases. On the contrary, the number of piston powered aircraft has decreased 1.0 percent annually. These aircraft types are used for recreational and flight training purposes. Decreases can be attributed higher ownership costs, increased fuel prices, economic downturns and a decreasing pilot population. Multi-engine piston aircraft have particularly seen a reduction with decreases of 2.5 percent annually. These aircraft types are being replaced by newer technology turboprop aircraft for business travel.
The trend of strong growth in corporate aircraft and steady or decreased use of piston aircraft is expected to continue over the planning period. This forecast may fluctuate with new unleaded fuel engines potentially reducing the cost of flying. The number of turbojet aircraft is expected to increase 3.5 percent annually with hours flown increasing at a 4.3 percent rate. Larger corporate general aviation aircraft types is forecast to grow in number and activity levels. Piston aircraft is expected to decrease at a rate of 0.3 percent annually with activity decreasing at a 0.5 percent annual rate. This decrease can be attributed in part to upgrades to new aircraft type but also to the increased cost of flying and activity sensitivity to economic conditions.
0
5,000
10,000
15,000
20,000
25,000
30,000
35,000
40,000
2000 2003 2006 2009 2012 2015 2018 2021 2024 2027 2030 2033
Hou
rs F
low
n (t
hous
ands
)
Year
U.S. General Aviation and Air Taxi Hours Flown
Historical Piston Hours Flown Historical Turbine Hours Flown
Forecast Piston Hours Flown Forecast Turbine Hours Flown
Total Historical Hours Flown Total Forecast Hours Flown
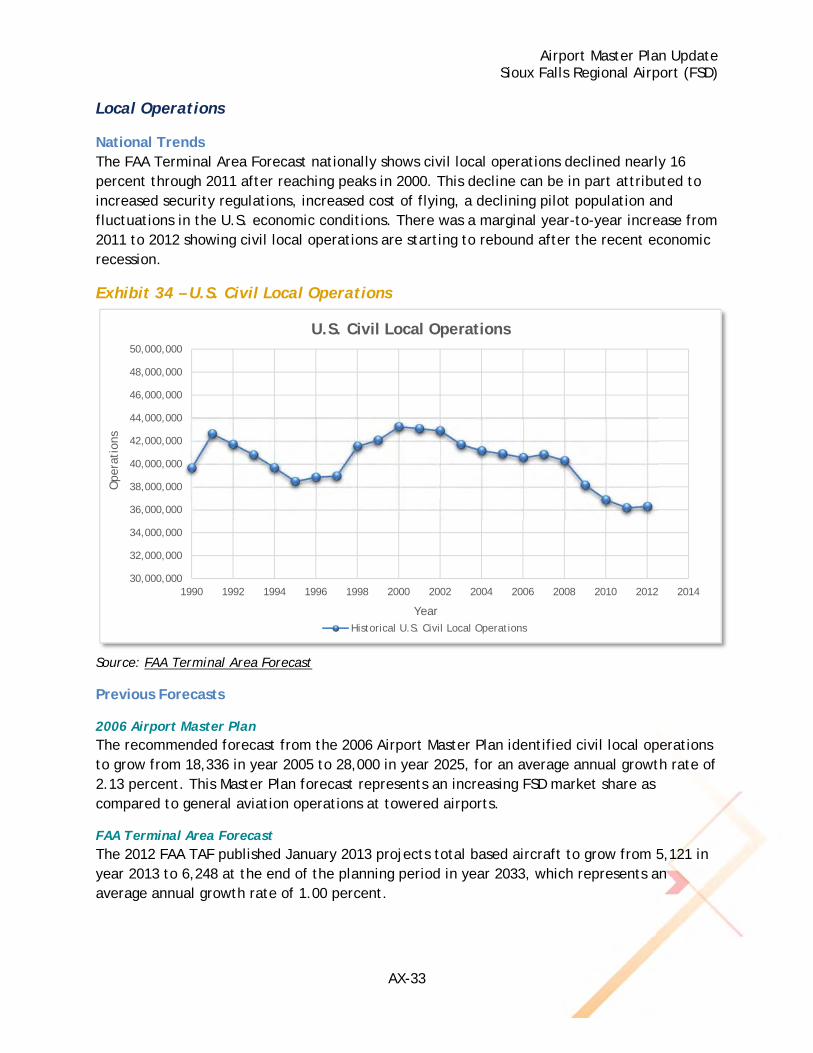
Airport Master Plan Update Sioux Falls Regional Airport (FSD)
AX-33
Local Operations
National Trends The FAA Terminal Area Forecast nationally shows civil local operations declined nearly 16 percent through 2011 after reaching peaks in 2000. This decline can be in part attributed to increased security regulations, increased cost of flying, a declining pilot population and fluctuations in the U.S. economic conditions. There was a marginal year-to-year increase from 2011 to 2012 showing civil local operations are starting to rebound after the recent economic recession.
Exhibit 34 – U.S. Civil Local Operations
Source: FAA Terminal Area Forecast
Previous Forecasts
2006 Airport Master Plan The recommended forecast from the 2006 Airport Master Plan identified civil local operations to grow from 18,336 in year 2005 to 28,000 in year 2025, for an average annual growth rate of 2.13 percent. This Master Plan forecast represents an increasing FSD market share as compared to general aviation operations at towered airports.
FAA Terminal Area Forecast The 2012 FAA TAF published January 2013 projects total based aircraft to grow from 5,121 in year 2013 to 6,248 at the end of the planning period in year 2033, which represents an average annual growth rate of 1.00 percent.
30,000,000
32,000,000
34,000,000
36,000,000
38,000,000
40,000,000
42,000,000
44,000,000
46,000,000
48,000,000
50,000,000
1990 1992 1994 1996 1998 2000 2002 2004 2006 2008 2010 2012 2014
Ope
rati
ons
Year
U.S. Civil Local Operations
Historical U.S. Civil Local Operations
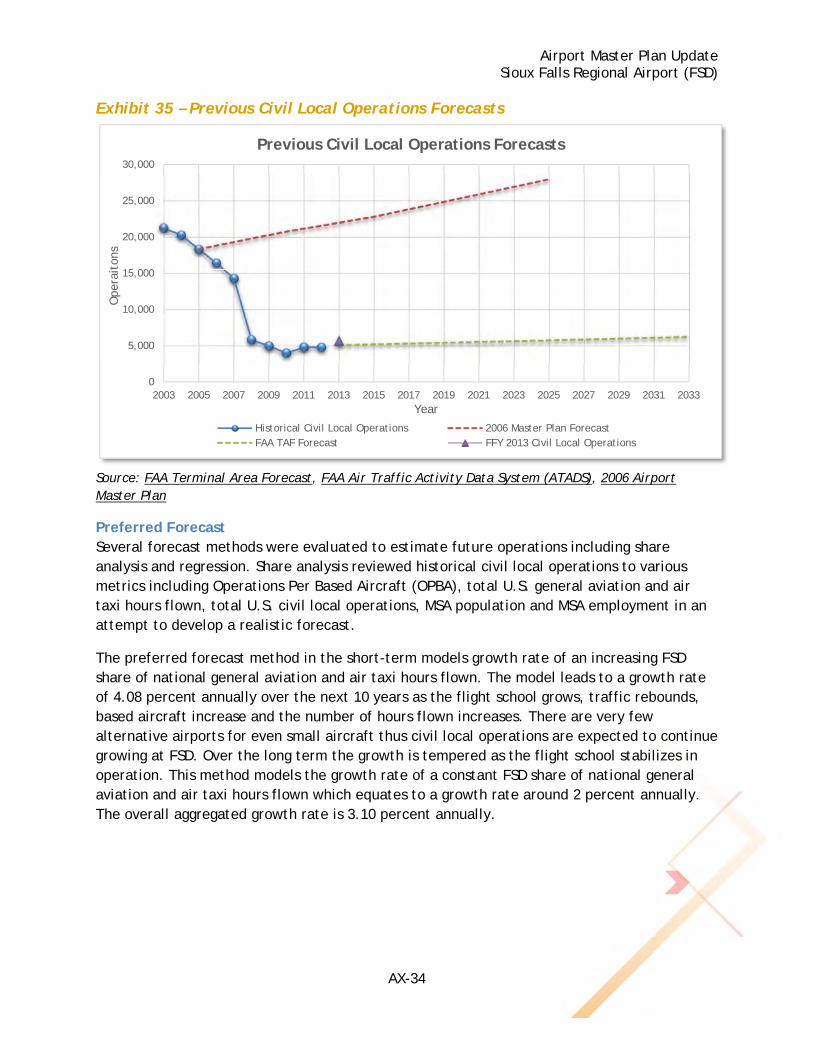
Airport Master Plan Update Sioux Falls Regional Airport (FSD)
AX-34
Exhibit 35 – Previous Civil Local Operations Forecasts
Source: FAA Terminal Area Forecast, FAA Air Traffic Activity Data System (ATADS), 2006 Airport Master Plan
Preferred Forecast Several forecast methods were evaluated to estimate future operations including share analysis and regression. Share analysis reviewed historical civil local operations to various metrics including Operations Per Based Aircraft (OPBA), total U.S. general aviation and air taxi hours flown, total U.S. civil local operations, MSA population and MSA employment in an attempt to develop a realistic forecast.
The preferred forecast method in the short-term models growth rate of an increasing FSD share of national general aviation and air taxi hours flown. The model leads to a growth rate of 4.08 percent annually over the next 10 years as the flight school grows, traffic rebounds, based aircraft increase and the number of hours flown increases. There are very few alternative airports for even small aircraft thus civil local operations are expected to continue growing at FSD. Over the long term the growth is tempered as the flight school stabilizes in operation. This method models the growth rate of a constant FSD share of national general aviation and air taxi hours flown which equates to a growth rate around 2 percent annually. The overall aggregated growth rate is 3.10 percent annually.
0
5,000
10,000
15,000
20,000
25,000
30,000
2003 2005 2007 2009 2011 2013 2015 2017 2019 2021 2023 2025 2027 2029 2031 2033
Ope
rait
ons
Year
Previous Civil Local Operations Forecasts
Historical Civil Local Operations 2006 Master Plan ForecastFAA TAF Forecast FFY 2013 Civil Local Operations
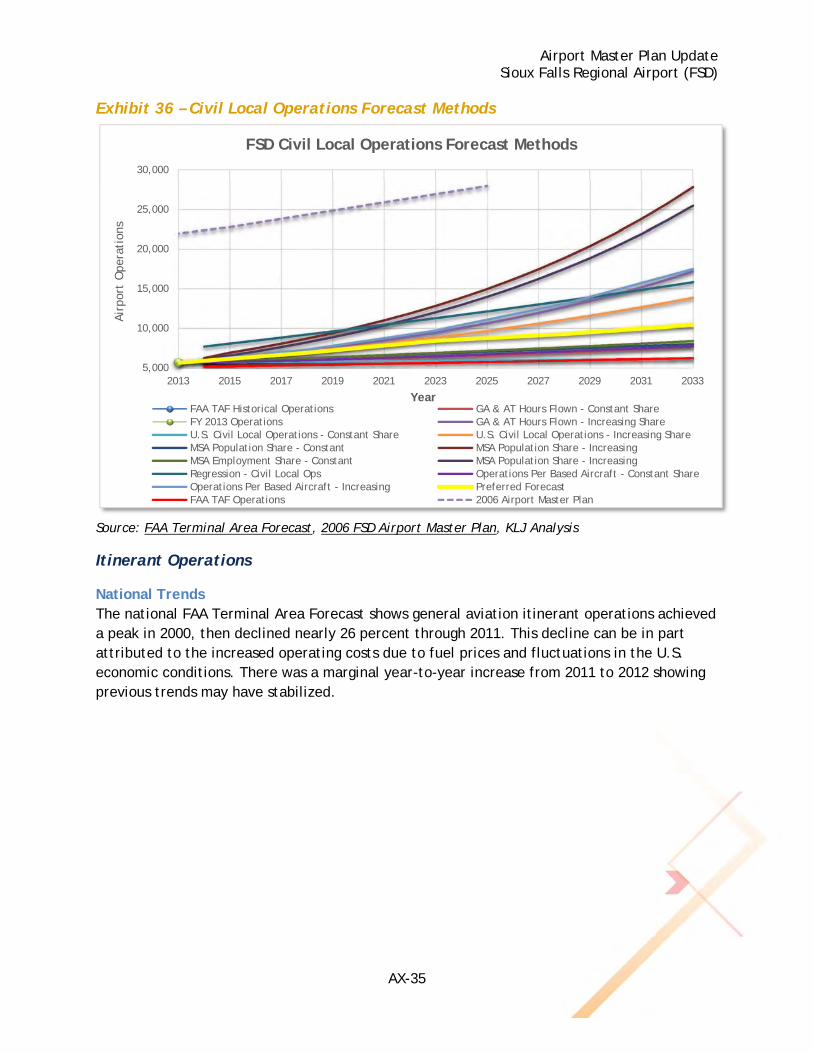
Airport Master Plan Update Sioux Falls Regional Airport (FSD)
AX-35
Exhibit 36 – Civil Local Operations Forecast Methods
Source: FAA Terminal Area Forecast, 2006 FSD Airport Master Plan, KLJ Analysis
Itinerant Operations
National Trends The national FAA Terminal Area Forecast shows general aviation itinerant operations achieved a peak in 2000, then declined nearly 26 percent through 2011. This decline can be in part attributed to the increased operating costs due to fuel prices and fluctuations in the U.S. economic conditions. There was a marginal year-to-year increase from 2011 to 2012 showing previous trends may have stabilized.
5,000
10,000
15,000
20,000
25,000
30,000
2013 2015 2017 2019 2021 2023 2025 2027 2029 2031 2033
Air
port
Ope
rati
ons
Year
FSD Civil Local Operations Forecast Methods
FAA TAF Historical Operations GA & AT Hours Flown - Constant ShareFY 2013 Operations GA & AT Hours Flown - Increasing ShareU.S. Civil Local Operations - Constant Share U.S. Civil Local Operations - Increasing ShareMSA Population Share - Constant MSA Population Share - IncreasingMSA Employment Share - Constant MSA Population Share - IncreasingRegression - Civil Local Ops Operations Per Based Aircraft - Constant ShareOperations Per Based Aircraft - Increasing Preferred ForecastFAA TAF Operations 2006 Airport Master Plan
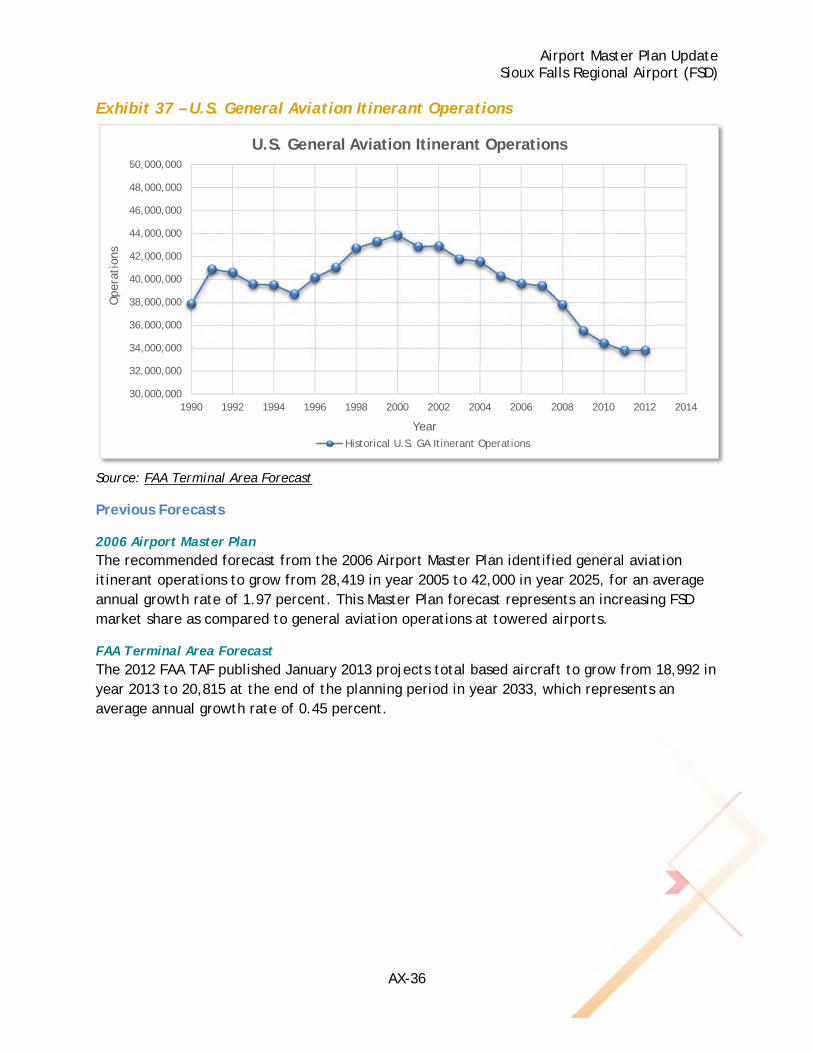
Airport Master Plan Update Sioux Falls Regional Airport (FSD)
AX-36
Exhibit 37 – U.S. General Aviation Itinerant Operations
Source: FAA Terminal Area Forecast
Previous Forecasts
2006 Airport Master Plan The recommended forecast from the 2006 Airport Master Plan identified general aviation itinerant operations to grow from 28,419 in year 2005 to 42,000 in year 2025, for an average annual growth rate of 1.97 percent. This Master Plan forecast represents an increasing FSD market share as compared to general aviation operations at towered airports.
FAA Terminal Area Forecast The 2012 FAA TAF published January 2013 projects total based aircraft to grow from 18,992 in year 2013 to 20,815 at the end of the planning period in year 2033, which represents an average annual growth rate of 0.45 percent.
30,000,000
32,000,000
34,000,000
36,000,000
38,000,000
40,000,000
42,000,000
44,000,000
46,000,000
48,000,000
50,000,000
1990 1992 1994 1996 1998 2000 2002 2004 2006 2008 2010 2012 2014
Ope
rati
ons
Year
U.S. General Aviation Itinerant Operations
Historical U.S. GA Itinerant Operations
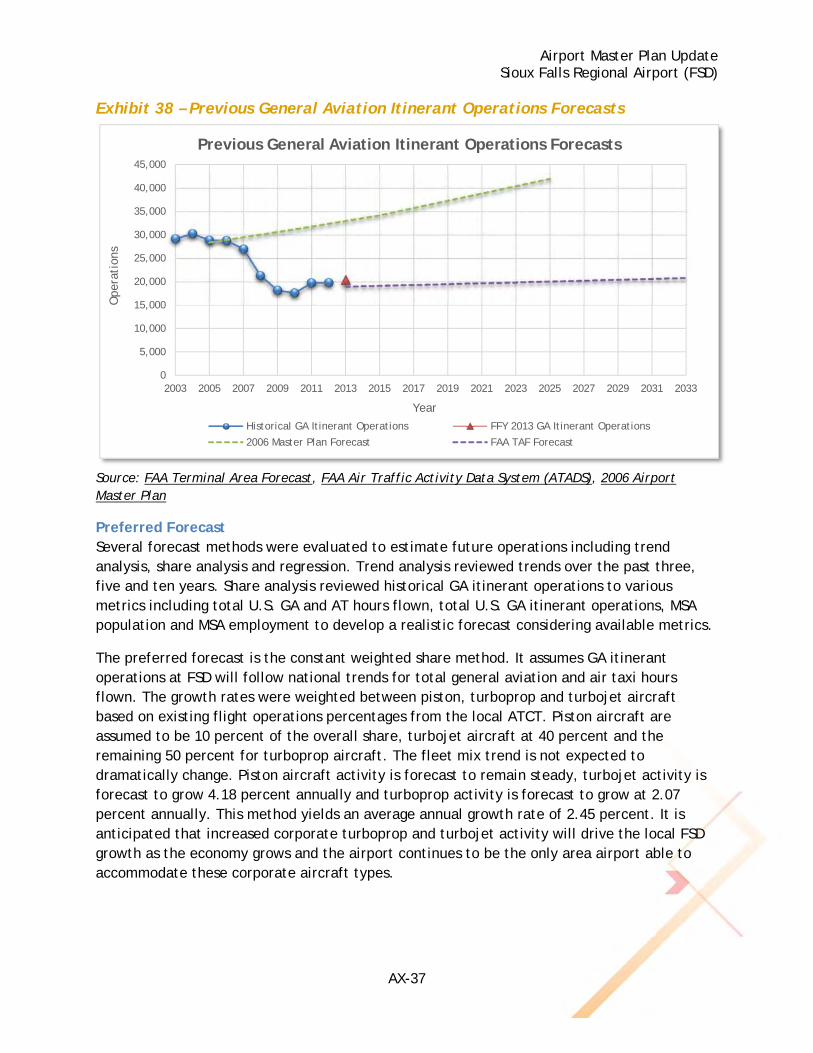
Airport Master Plan Update Sioux Falls Regional Airport (FSD)
AX-37
Exhibit 38 – Previous General Aviation Itinerant Operations Forecasts
Source: FAA Terminal Area Forecast, FAA Air Traffic Activity Data System (ATADS), 2006 Airport Master Plan
Preferred Forecast Several forecast methods were evaluated to estimate future operations including trend analysis, share analysis and regression. Trend analysis reviewed trends over the past three, five and ten years. Share analysis reviewed historical GA itinerant operations to various metrics including total U.S. GA and AT hours flown, total U.S. GA itinerant operations, MSA population and MSA employment to develop a realistic forecast considering available metrics.
The preferred forecast is the constant weighted share method. It assumes GA itinerant operations at FSD will follow national trends for total general aviation and air taxi hours flown. The growth rates were weighted between piston, turboprop and turbojet aircraft based on existing flight operations percentages from the local ATCT. Piston aircraft are assumed to be 10 percent of the overall share, turbojet aircraft at 40 percent and the remaining 50 percent for turboprop aircraft. The fleet mix trend is not expected to dramatically change. Piston aircraft activity is forecast to remain steady, turbojet activity is forecast to grow 4.18 percent annually and turboprop activity is forecast to grow at 2.07 percent annually. This method yields an average annual growth rate of 2.45 percent. It is anticipated that increased corporate turboprop and turbojet activity will drive the local FSD growth as the economy grows and the airport continues to be the only area airport able to accommodate these corporate aircraft types.
0
5,000
10,000
15,000
20,000
25,000
30,000
35,000
40,000
45,000
2003 2005 2007 2009 2011 2013 2015 2017 2019 2021 2023 2025 2027 2029 2031 2033
Ope
rati
ons
Year
Previous General Aviation Itinerant Operations Forecasts
Historical GA Itinerant Operations FFY 2013 GA Itinerant Operations
2006 Master Plan Forecast FAA TAF Forecast
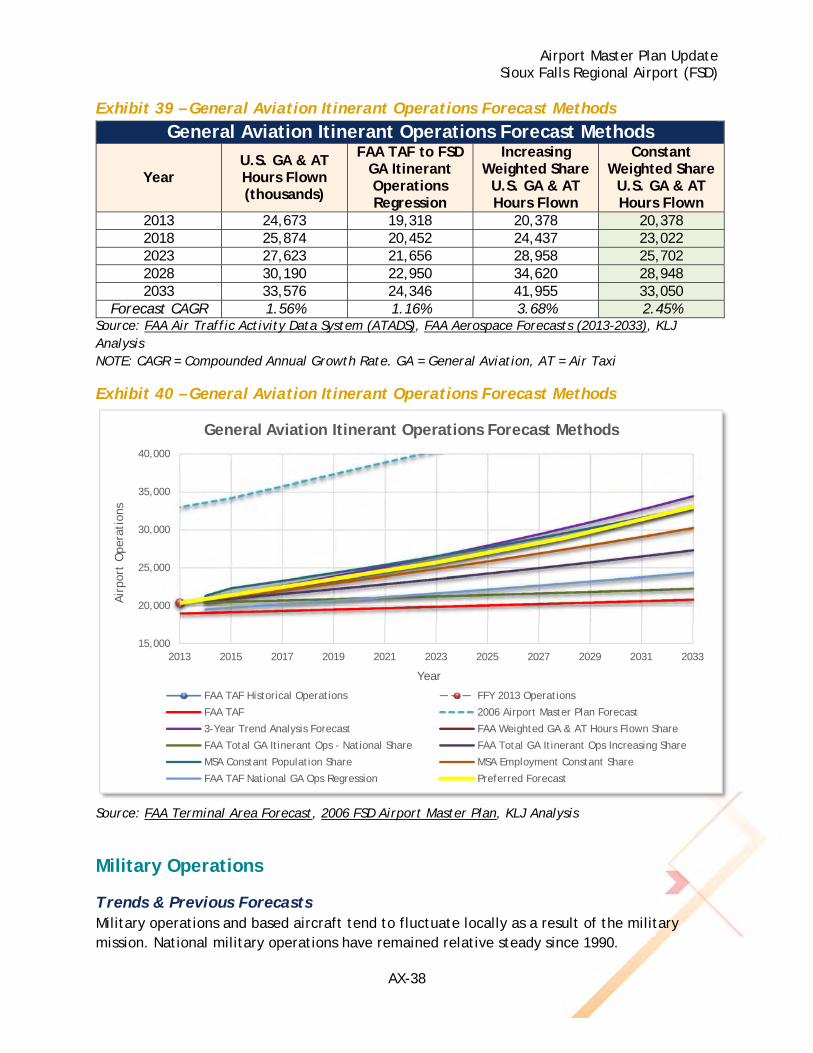
Airport Master Plan Update Sioux Falls Regional Airport (FSD)
AX-38
Exhibit 39 – General Aviation Itinerant Operations Forecast Methods
General Aviation Itinerant Operations Forecast Methods
Year U.S. GA & AT Hours Flown (thousands)
FAA TAF to FSD GA Itinerant Operations Regression
Increasing Weighted Share
U.S. GA & AT Hours Flown
Constant Weighted Share
U.S. GA & AT Hours Flown
2013 24,673 19,318 20,378 20,378 2018 25,874 20,452 24,437 23,022 2023 27,623 21,656 28,958 25,702 2028 30,190 22,950 34,620 28,948 2033 33,576 24,346 41,955 33,050
Forecast CAGR 1.56% 1.16% 3.68% 2.45% Source: FAA Air Traffic Activity Data System (ATADS), FAA Aerospace Forecasts (2013-2033), KLJ Analysis NOTE: CAGR = Compounded Annual Growth Rate. GA = General Aviation, AT = Air Taxi
Exhibit 40 – General Aviation Itinerant Operations Forecast Methods
Source: FAA Terminal Area Forecast, 2006 FSD Airport Master Plan, KLJ Analysis
Military Operations
Trends & Previous Forecasts Military operations and based aircraft tend to fluctuate locally as a result of the military mission. National military operations have remained relative steady since 1990.
15,000
20,000
25,000
30,000
35,000
40,000
2013 2015 2017 2019 2021 2023 2025 2027 2029 2031 2033
Air
port
Ope
rati
ons
Year
General Aviation Itinerant Operations Forecast Methods
FAA TAF Historical Operations FFY 2013 Operations
FAA TAF 2006 Airport Master Plan Forecast
3-Year Trend Analysis Forecast FAA Weighted GA & AT Hours Flown Share
FAA Total GA Itinerant Ops - National Share FAA Total GA Itinerant Ops Increasing Share
MSA Constant Population Share MSA Employment Constant Share
FAA TAF National GA Ops Regression Preferred Forecast
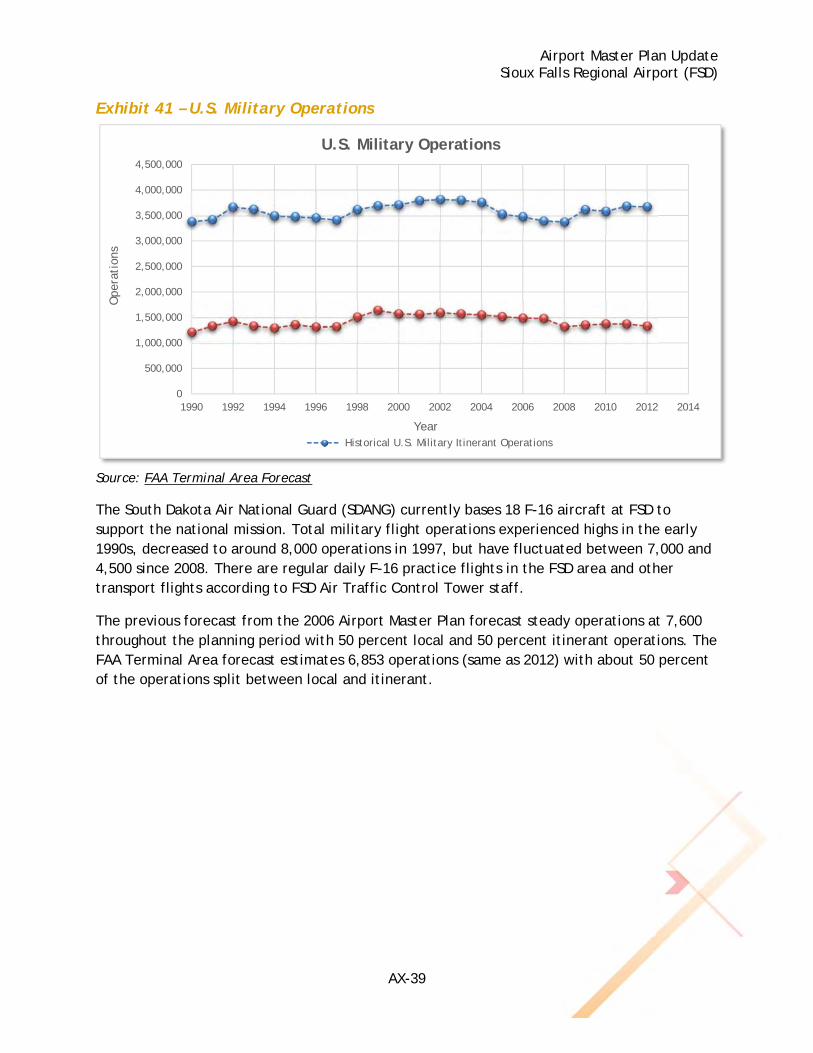
Airport Master Plan Update Sioux Falls Regional Airport (FSD)
AX-39
Exhibit 41 – U.S. Military Operations
Source: FAA Terminal Area Forecast
The South Dakota Air National Guard (SDANG) currently bases 18 F-16 aircraft at FSD to support the national mission. Total military flight operations experienced highs in the early 1990s, decreased to around 8,000 operations in 1997, but have fluctuated between 7,000 and 4,500 since 2008. There are regular daily F-16 practice flights in the FSD area and other transport flights according to FSD Air Traffic Control Tower staff.
The previous forecast from the 2006 Airport Master Plan forecast steady operations at 7,600 throughout the planning period with 50 percent local and 50 percent itinerant operations. The FAA Terminal Area forecast estimates 6,853 operations (same as 2012) with about 50 percent of the operations split between local and itinerant.
0
500,000
1,000,000
1,500,000
2,000,000
2,500,000
3,000,000
3,500,000
4,000,000
4,500,000
1990 1992 1994 1996 1998 2000 2002 2004 2006 2008 2010 2012 2014
Ope
rati
ons
Year
U.S. Military Operations
Historical U.S. Military Itinerant Operations
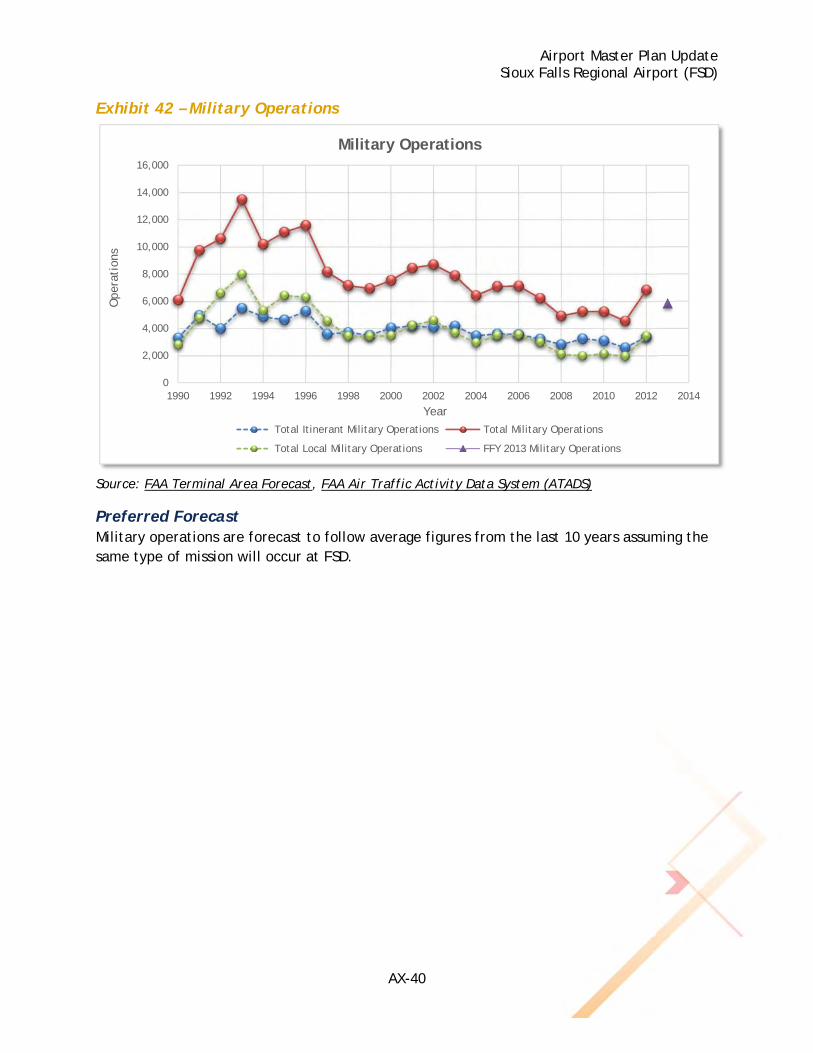
Airport Master Plan Update Sioux Falls Regional Airport (FSD)
AX-40
Exhibit 42 – Military Operations
Source: FAA Terminal Area Forecast, FAA Air Traffic Activity Data System (ATADS)
Preferred Forecast Military operations are forecast to follow average figures from the last 10 years assuming the same type of mission will occur at FSD.
0
2,000
4,000
6,000
8,000
10,000
12,000
14,000
16,000
1990 1992 1994 1996 1998 2000 2002 2004 2006 2008 2010 2012 2014
Ope
rati
ons
Year
Military Operations
Total Itinerant Military Operations Total Military Operations
Total Local Military Operations FFY 2013 Military Operations
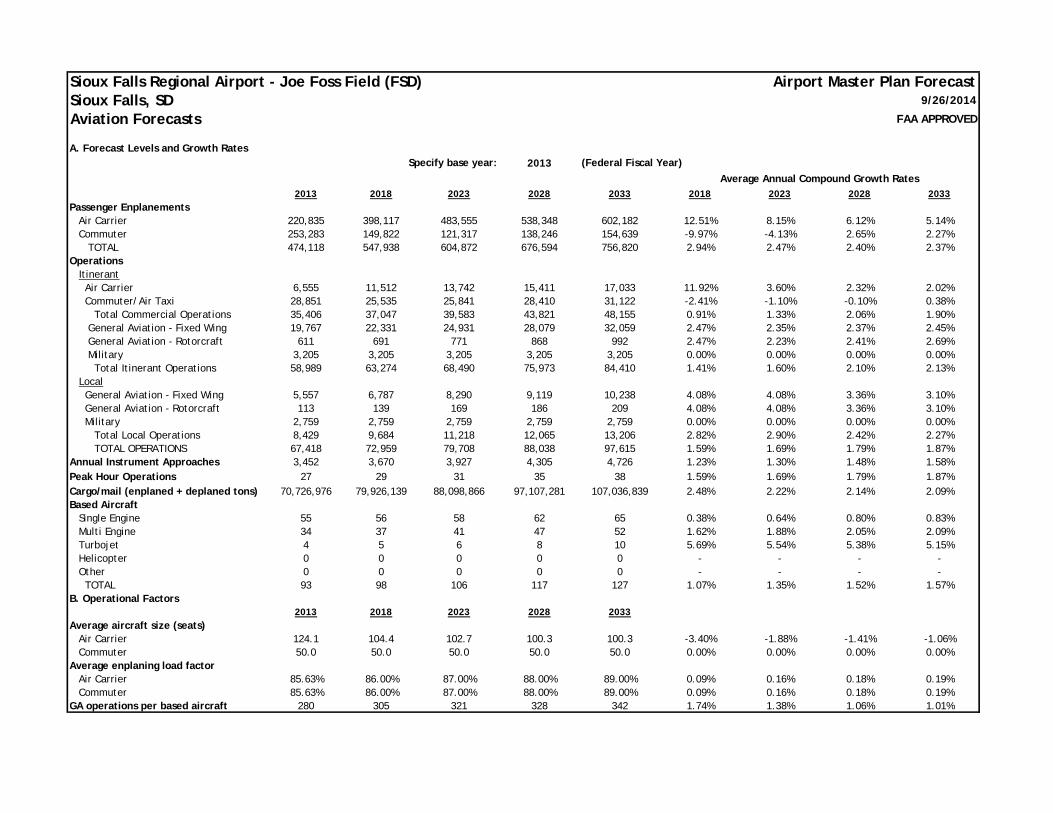
Sioux Falls Regional Airport - Joe Foss Field (FSD) Airport Master Plan ForecastSioux Falls, SD 9/26/2014
Aviation Forecasts FAA APPROVED
2013
2013 2018 2023 2028 2033 2018 2023 2028 2033
Passenger Enplanements Air Carrier 220,835 398,117 483,555 538,348 602,182 12.51% 8.15% 6.12% 5.14% Commuter 253,283 149,822 121,317 138,246 154,639 -9.97% -4.13% 2.65% 2.27% TOTAL 474,118 547,938 604,872 676,594 756,820 2.94% 2.47% 2.40% 2.37%Operations Itinerant Air Carrier 6,555 11,512 13,742 15,411 17,033 11.92% 3.60% 2.32% 2.02% Commuter/Air Taxi 28,851 25,535 25,841 28,410 31,122 -2.41% -1.10% -0.10% 0.38% Total Commercial Operations 35,406 37,047 39,583 43,821 48,155 0.91% 1.33% 2.06% 1.90% General Aviation - Fixed Wing 19,767 22,331 24,931 28,079 32,059 2.47% 2.35% 2.37% 2.45% General Aviation - Rotorcraft 611 691 771 868 992 2.47% 2.23% 2.41% 2.69% Military 3,205 3,205 3,205 3,205 3,205 0.00% 0.00% 0.00% 0.00% Total Itinerant Operations 58,989 63,274 68,490 75,973 84,410 1.41% 1.60% 2.10% 2.13% Local General Aviation - Fixed Wing 5,557 6,787 8,290 9,119 10,238 4.08% 4.08% 3.36% 3.10% General Aviation - Rotorcraft 113 139 169 186 209 4.08% 4.08% 3.36% 3.10% Military 2,759 2,759 2,759 2,759 2,759 0.00% 0.00% 0.00% 0.00% Total Local Operations 8,429 9,684 11,218 12,065 13,206 2.82% 2.90% 2.42% 2.27% TOTAL OPERATIONS 67,418 72,959 79,708 88,038 97,615 1.59% 1.69% 1.79% 1.87%Annual Instrument Approaches 3,452 3,670 3,927 4,305 4,726 1.23% 1.30% 1.48% 1.58%Peak Hour Operations 27 29 31 35 38 1.59% 1.69% 1.79% 1.87%Cargo/mail (enplaned + deplaned tons) 70,726,976 79,926,139 88,098,866 97,107,281 107,036,839 2.48% 2.22% 2.14% 2.09%Based Aircraft Single Engine 55 56 58 62 65 0.38% 0.64% 0.80% 0.83% Multi Engine 34 37 41 47 52 1.62% 1.88% 2.05% 2.09% Turbojet 4 5 6 8 10 5.69% 5.54% 5.38% 5.15% Helicopter 0 0 0 0 0 - - - - Other 0 0 0 0 0 - - - - TOTAL 93 98 106 117 127 1.07% 1.35% 1.52% 1.57%B. Operational Factors
2013 2018 2023 2028 2033
Average aircraft size (seats) Air Carrier 124.1 104.4 102.7 100.3 100.3 -3.40% -1.88% -1.41% -1.06% Commuter 50.0 50.0 50.0 50.0 50.0 0.00% 0.00% 0.00% 0.00%Average enplaning load factor Air Carrier 85.63% 86.00% 87.00% 88.00% 89.00% 0.09% 0.16% 0.18% 0.19% Commuter 85.63% 86.00% 87.00% 88.00% 89.00% 0.09% 0.16% 0.18% 0.19%GA operations per based aircraft 280 305 321 328 342 1.74% 1.38% 1.06% 1.01%
A. Forecast Levels and Growth RatesSpecify base year:
Average Annual Compound Growth Rates
(Federal Fiscal Year)
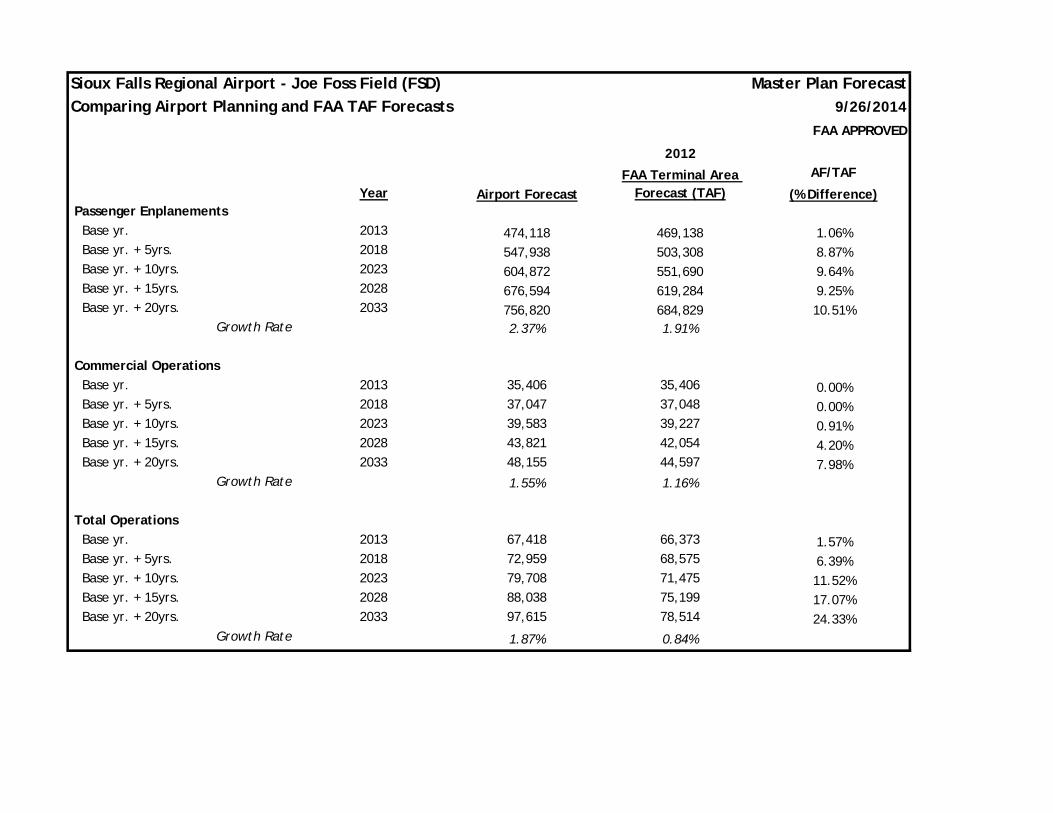
Sioux Falls Regional Airport - Joe Foss Field (FSD) Master Plan Forecast
Comparing Airport Planning and FAA TAF Forecasts 9/26/2014
FAA APPROVED
2012AF/TAF
Airport Forecast (% Difference) Passenger Enplanements
Base yr. 2013 474,118 469,138 1.06% Base yr. + 5yrs. 2018 547,938 503,308 8.87% Base yr. + 10yrs. 2023 604,872 551,690 9.64% Base yr. + 15yrs. 2028 676,594 619,284 9.25% Base yr. + 20yrs. 2033 756,820 684,829 10.51%
Growth Rate 2.37% 1.91%
Commercial Operations
Base yr. 2013 35,406 35,406 0.00% Base yr. + 5yrs. 2018 37,047 37,048 0.00% Base yr. + 10yrs. 2023 39,583 39,227 0.91% Base yr. + 15yrs. 2028 43,821 42,054 4.20% Base yr. + 20yrs. 2033 48,155 44,597 7.98%
Growth Rate 1.55% 1.16%
Total Operations
Base yr. 2013 67,418 66,373 1.57% Base yr. + 5yrs. 2018 72,959 68,575 6.39% Base yr. + 10yrs. 2023 79,708 71,475 11.52% Base yr. + 15yrs. 2028 88,038 75,199 17.07% Base yr. + 20yrs. 2033 97,615 78,514 24.33%
Growth Rate 1.87% 0.84%
YearFAA Terminal Area
Forecast (TAF)