Embed Size (px)
Citation preview
3-1
CHAPTER 3 BACKGROUND AND CONSTRAINTS IN LAO AGRICULTURE
3.1 Policy and Strategy of Agricultural Development in Lao PDR
3.1.1 Overview of Agricultural Development and Performance
Agriculture is the main economic activity in Lao PDR and covers a wide range of
activities from subsistence production to agriculture related industries. In 1999, the
sector accounted for 53% of Gross Domestic Product (GDP). Rice remains the most
important crop accounting for about 20% of national GDP and 53% of total
agricultural outputs but its share is gradually declining. Livestock rearing is the next
most important agricultural activity and in 1999 accounted for 34% of output.
Commercial crops contributed 14% of output. Over 80% of the population live in
rural areas and are engaged in agricultural activities that include livestock, forestry
and fisheries.
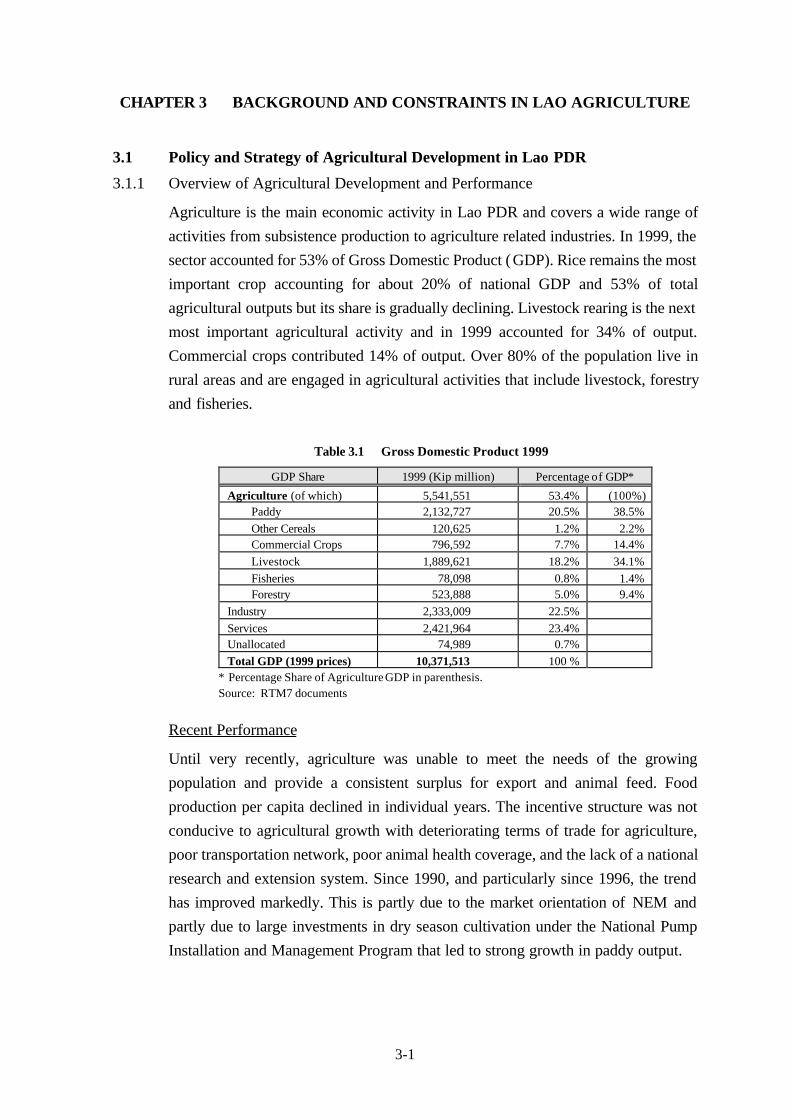
Table 3.1 Gross Domestic Product 1999
GDP Share 1999 (Kip million) Percentage of GDP*
Agriculture (of which) 5,541,551 53.4% (100%)Paddy 2,132,727 20.5% 38.5%Other Cereals 120,625 1.2% 2.2%Commercial Crops 796,592 7.7% 14.4%Livestock 1,889,621 18.2% 34.1%Fisheries 78,098 0.8% 1.4%Forestry 523,888 5.0% 9.4%
Industry 2,333,009 22.5%Services 2,421,964 23.4%Unallocated 74,989 0.7%Total GDP (1999 prices) 10,371,513 100 %
* Percentage Share of Agriculture GDP in parenthesis.Source: RTM7 documents
Recent Performance
Until very recently, agriculture was unable to meet the needs of the growing
population and provide a consistent surplus for export and animal feed. Food
production per capita declined in individual years. The incentive structure was not
conducive to agricultural growth with deteriorating terms of trade for agriculture,
poor transportation network, poor animal health coverage, and the lack of a national
research and extension system. Since 1990, and particularly since 1996, the trend
has improved markedly. This is partly due to the market orientation of NEM and
partly due to large investments in dry season cultivation under the National Pump
Installation and Management Program that led to strong growth in paddy output.
3-2
The share of agriculture in Gross Domestic Product (GDP) has fallen slowly but
steadily while agriculture’s share of GDP continues to fluctuate widely due to the
influence of weather conditions. The declining share of agriculture is to be expected
because of the relatively large rate of urbanization and the relatively high growing
rates of the manufacturing and service sectors. But the declining share of
agriculture has also been due to the relatively slow growth in many sub-sectors
within agriculture. Particularly before 1997, this has resulted in small increases or
actual decreases in per capita food availability.
Performance of Sub-Sectors
Within the agriculture sector the contribution of forestry varied widely over the past
ten years depending on the government policy relating to concessions and export
policy as well as the fluctuations in price for logs and timber products. The
contribution of forestry has actually declined since 1996. Livestock and fisheries
increased substantially due to market incentives under NEM. However, the rate of
increase has now slowed down partly due to the reported growth of unrecorded
border trade.
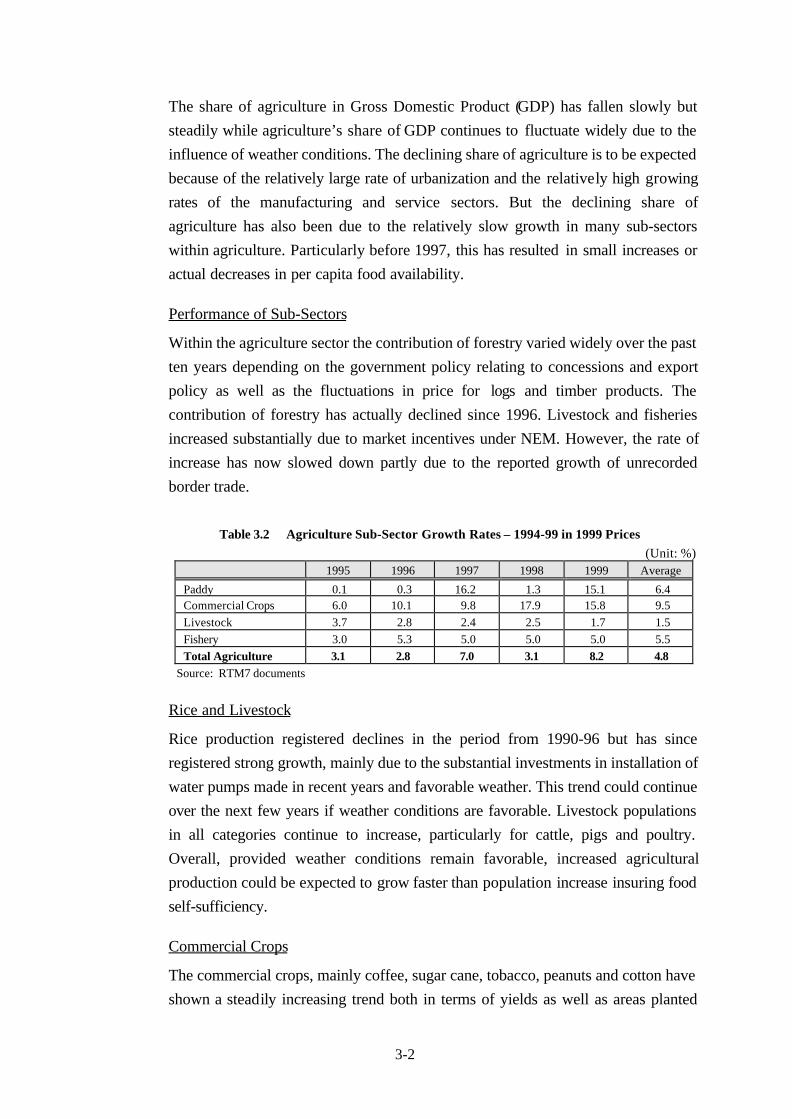
Table 3.2 Agriculture Sub-Sector Growth Rates – 1994-99 in 1999 Prices(Unit: %)
1995 1996 1997 1998 1999 Average
Paddy 0.1 0.3 16.2 1.3 15.1 6.4Commercial Crops 6.0 10.1 9.8 17.9 15.8 9.5Livestock 3.7 2.8 2.4 2.5 1.7 1.5Fishery 3.0 5.3 5.0 5.0 5.0 5.5Total Agriculture 3.1 2.8 7.0 3.1 8.2 4.8
Source: RTM7 documents
Rice and Livestock
Rice production registered declines in the period from 1990-96 but has since
registered strong growth, mainly due to the substantial investments in installation of
water pumps made in recent years and favorable weather. This trend could continue
over the next few years if weather conditions are favorable. Livestock populations
in all categories continue to increase, particularly for cattle, pigs and poultry.
Overall, provided weather conditions remain favorable, increased agricultural
production could be expected to grow faster than population increase insuring food
self-sufficiency.
Commercial Crops
The commercial crops, mainly coffee, sugar cane, tobacco, peanuts and cotton have
shown a steadily increasing trend both in terms of yields as well as areas planted
3-3
and overall have shown a rapid growth in value added over the past five years of
around 10 % per annum. Prospects for further increase in yields are favorable.
3.1.2 Government’s Strategies for the Agriculture Sector
The overarching development goal is to liberate the country from the group of least
developed countries (LLDC) by the year 2020 through sustainable and equitable
development. The GOL’s National Socioeconomic Development Plan for 1996-
2000 (4th five year plan) launched eight national priority programs within these
objectives: (i) food production ensuring food security; (ii) stabilization/reduction of
shifting cultivation; (iii) commercial production; (iv) infrastructure development;
(v) improved socio-economic management and foreign economic relations;
(vi) rural development; (vii) human resource development; and (viii) service
development. The implementation of these programs on a step-by-step basis is a
prerequisite to attain its long-term objectives. The 5th five year plan for 2001-2005
published in March 2001 also incorporates the same programs (see Section 2.2).
The agriculture sector incorporates all the eight programs, with slightly less
emphasis on national infrastructure development and national services
development. In 1998, based on the national priority programs, the MAF produced
a development strategy to the year 2020 (Vision 2020)1/ presenting six programs
which are being or will be implemented through specific plans, projects and
activities. They are: (i) food production; (ii) commodity production support;
(iii) stabilization/reduction of shifting cultivation; (iv) irrigation development;
(v) agriculture and forestry research; and (vi) human resources development.
Vision 2020 was followed by the ADB assisted “Lao Agricultural Strategy Study”
and this study provided MAF with the basis for “The Government ’s Strategic
Vision for the Agricultural Sector” (Strategic Vision) 2/ finalized in December 1999
with a review at the Donor Round Table Conference in November 1999. The
Strategic Vision is now the GOL’s agricultural strategy on which the operational
action plan is based.
The Strategic Vision presents a two distinct zone oriented approach; the flatlands
along the Mekong corridor and the sloping lands. Since 1994, both areas have
followed divergent paths of development. The Mekong corridor has entered a
period of transction to market oriented agriculture, while the mountainous areas,
occupying 80% of the country, remain basically in subsistence agriculture
1/ Summary text of Vision 2020 is presented in Appendix 2.2/ Summary text of Strategic Vision is presented in Appendix 2.
3-4
dominated by acute rural poverty. The divergence between the Mekong corridor
and the sloping land economies needs separate agricultural and rural development
strategies. However, both strategies target further market expansion and market
oriented development. The Strategic Vision gives a clear direction to the
development strategies for both zones as stated below.
For the Mekong corridor, the strategy is to maintain and accelerate the pace of
agricultural diversification and intensification with increased productivity per unit
area, improved value added processing and expanded marketing and sales. Market
forces are now driving this process. Policies and strategies should support and
maintain the pace of market integration in the flatland areas and gradually expand
the market economy to the sloping lands.
The sloping land present a different set of problems due to remoteness,
inaccessibility, endemic rural poverty, poor credit and capital accessibility and other
factors. These include all the problems of transforming shifting cultivation farming
systems away from “low-input/low-output” regimes to ones that will stabilize
communities, enhance resources productivity, improve the socio-economic
environment and minimize the degradation of the natural resource base. With
increasing population densities in the sloping land areas, the present farming
systems inevitably condemn these people to continued poverty.
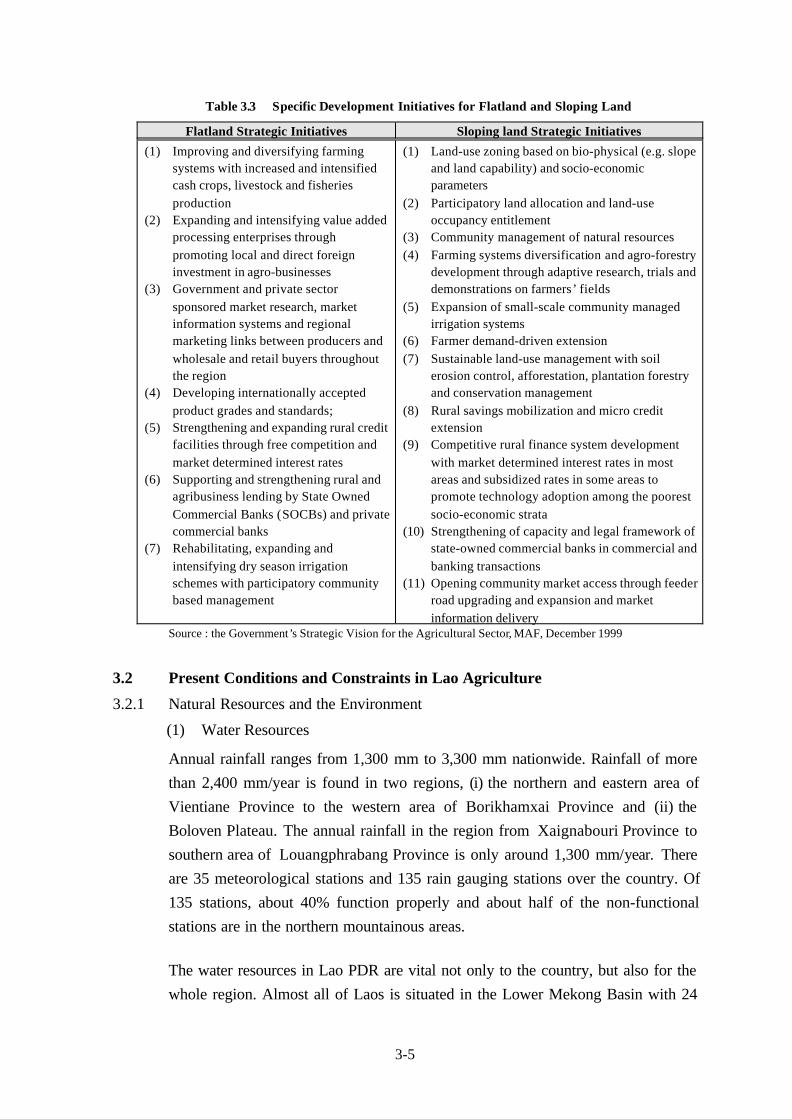
The Strategic Vision suggests the specific development initiatives for the both areas,
respectively, and these are summarized in Table 3.3. In conclusion, the Strategic
Vision developed Seven Thematic Approaches. The respective themes are directly
linked to Lao PDR National Programs3/. The Thematic Approaches are:
1) the planning approach: MAF planning and decentralization;
2) human resources development;
3) business regulatory adjustment;
4) external trade;
5) flatland transformation;
6) sustainable sloping land development and environmental management/shifting cultivation stabilization; and
7) irrigation.
3/ See Appendix 2
3-5
Table 3.3 Specific Development Initiatives for Flatland and Sloping Land
Flatland Strategic Initiatives Sloping land Strategic Initiatives
(1) Improving and diversifying farmingsystems with increased and intensifiedcash crops, livestock and fisheriesproduction
(2) Expanding and intensifying value addedprocessing enterprises throughpromoting local and direct foreigninvestment in agro-businesses
(3) Government and private sectorsponsored market research, marketinformation systems and regionalmarketing links between producers andwholesale and retail buyers throughoutthe region
(4) Developing internationally acceptedproduct grades and standards;
(5) Strengthening and expanding rural creditfacilities through free competition andmarket determined interest rates
(6) Supporting and strengthening rural andagribusiness lending by State OwnedCommercial Banks (SOCBs) and privatecommercial banks
(7) Rehabilitating, expanding andintensifying dry season irrigationschemes with participatory communitybased management
(1) Land-use zoning based on bio-physical (e.g. slopeand land capability) and socio-economicparameters
(2) Participatory land allocation and land-useoccupancy entitlement
(3) Community management of natural resources(4) Farming systems diversification and agro-forestry
development through adaptive research, trials anddemonstrations on farmers’ fields
(5) Expansion of small-scale community managedirrigation systems
(6) Farmer demand-driven extension(7) Sustainable land-use management with soil
erosion control, afforestation, plantation forestryand conservation management
(8) Rural savings mobilization and micro creditextension
(9) Competitive rural finance system developmentwith market determined interest rates in mostareas and subsidized rates in some areas topromote technology adoption among the poorestsocio-economic strata
(10) Strengthening of capacity and legal framework ofstate-owned commercial banks in commercial andbanking transactions
(11) Opening community market access through feederroad upgrading and expansion and marketinformation delivery
Source : the Government’s Strategic Vision for the Agricultural Sector, MAF, December 1999
3.2 Present Conditions and Constraints in Lao Agriculture
3.2.1 Natural Resources and the Environment
(1) Water Resources
Annual rainfall ranges from 1,300 mm to 3,300 mm nationwide. Rainfall of more
than 2,400 mm/year is found in two regions, (i) the northern and eastern area of
Vientiane Province to the western area of Borikhamxai Province and (ii) the
Boloven Plateau. The annual rainfall in the region from Xaignabouri Province to
southern area of Louangphrabang Province is only around 1,300 mm/year. There
are 35 meteorological stations and 135 rain gauging stations over the country. Of
135 stations, about 40% function properly and about half of the non-functional
stations are in the northern mountainous areas.
The water resources in Lao PDR are vital not only to the country, but also for the
whole region. Almost all of Laos is situated in the Lower Mekong Basin with 24
3-6
major rivers flowing into the Mekong, while two major river basins, occupying
about 10% of the Lao’s land, belong to the Vietnam’s river basins. Hydrological
observation stations are installed at 89 sites on the Mekong River and its main
tributaries, however about 30% stations are closed or not in operation. The
hydrological records on the Mekong tributaries are much shorter and most stations
are located in the lower reaches. At present there is no accurate estimate for the total
runoff from the country.
An attempt has been made to assess the mean annual runoff from the major rivers
based on annual runoff ratio, surface runoff to basin rainfall, estimated from
available hydrological data on nine major river basins. The average runoff ratio is
estimated to be 0.55, although it ranges widely from 0.2 to 0.8. Thus, the total mean
annual runoff of major rivers is roughly estimated at 229,900 MCM, of which the
runoff from the major Mekong’s tributaries is estimated at 214,500 MCM.
The monthly distribution of the river flows closely follows the rainfall pattern with
about 80% during the rainy season (May - October) and 20% in the dry season from
November to April. For some rivers in the central and southern parts of the country,
the flow in the dry season decrease to about 10 to 15% of the annual flow. This
results in acute shortages of irrigation water.
(2) Forest Resources.
The forest area has been gradually declining over the last 20 years with the loss of
about 1.5 million ha or 8% since 1982. This is caused by increased permanent and
rotational arable agriculture (0.5 million ha) and forest cleared for timber and
shifting cultivation (0.9 million ha). The driving forces behind these land-use
changes are population increase and poverty. Increased agricultural productivity did
not keep pace with population growth, resulting in the gathering of products to
make up the food deficit or to earn cash to buy rice. The GOL encouraged the sale
of sawlogs, timber and wood products in order to earn foreign exchange to purchase
rice.
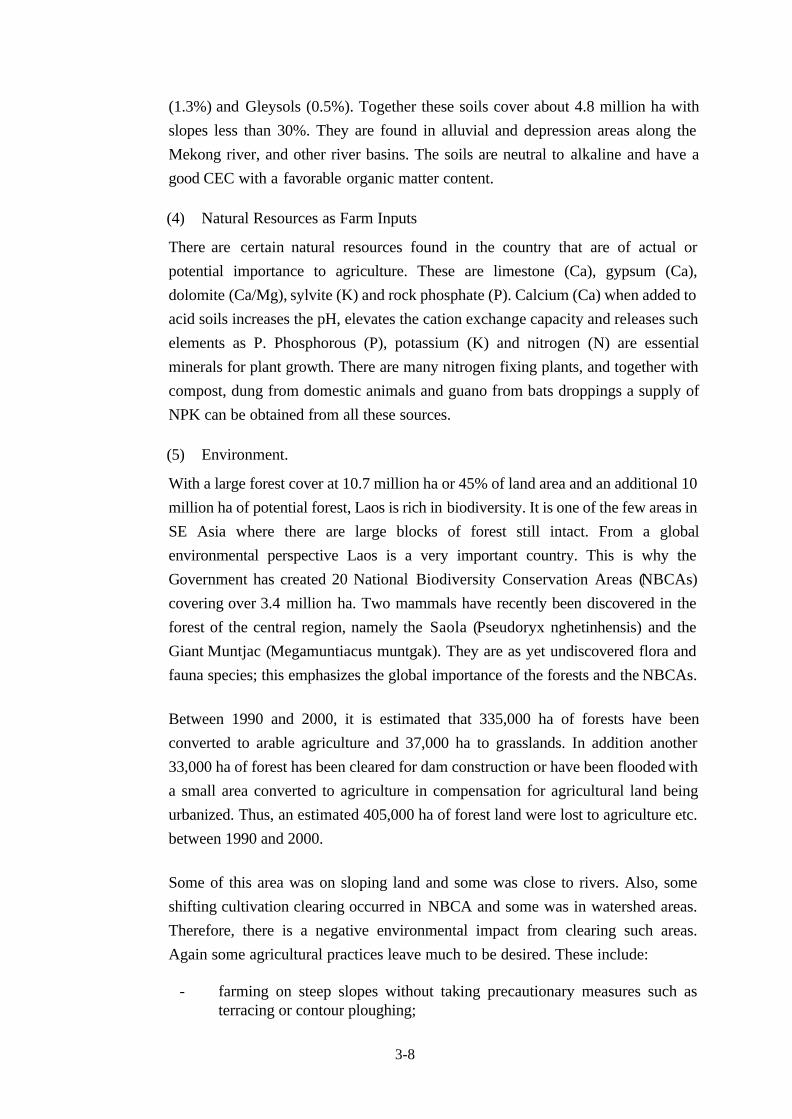
A DOF’s report in 19924/ estimated the areas under permanent agriculture and
shifting/rotational cultivation in the years 1982 and 1989 as shown in Table 3.4.
4/ Forest Cover and Land Use in Lao PDR/Final Report on the Nationwide Reconnaissance Survey” (Report No.5)
3-7
The same agricultural land use in
the year 2000 is roughly assessed
to be 1,130,000 ha and 680,000
ha, respectively, thus totaling
1,810,000 ha, taking the increase
in population, land use trends
between 1982 and 1989 and
other relevant land use surveys into consideration. These figures differ significantly
from government agricultural statistics and census figures.
Although some of the assessed shifting/rotational cultivation area (680,000 ha) may
include fallow, it is four to five time the area given in the Census and MAF’s
statistics areas (about 152,000 ha). In 2000, there were an estimated 340,000
families living in upland rural areas (2.06 million people), and while some of these
families have paddy land, the bulk grow dryland rice. The average dryland rice
holding according to Agricultural Statistics is, therefore, 0.45 ha. per farming
family. This should be compared to the paddy land holding in flatlands of 1.28 ha.
This is nearly three-times greater than for dryland rice, yet on average dryland rice
productivity is half that of paddy land. Thus, the Agricultural Statistical data on
dryland rice area seem anomalous. There is an urgent need to obtain more accurate
statistics, so that a correct diagnosis can be made and an appropriate prescription
formulated.
Most forests and potential (degraded/recovering) forest areas are important grazing
lands for cattle, buffalo and sheep and forage areas for pigs, especially after farm
residues have been exhausted. The government has ambitious plans to expand
animal numbers and some improved pastureland will come from these areas. They
also provide food and other NTFP to farming families. Therefore, the natural forests
play an important and integrated role in the farming system.
(3) Soil
Most soils in Lao PDR are acidic and poor in minerals and organic matter. In total,
38 soil types have been identified based on the FAO-UNESCO system. Five major
soil types occupy about 74% of the land, i.e. Ferric acrisols (28%), Humic acrisols
(20%), Ferric alisols (11%), Humic alisols (7%) and Ferric lixisols (8%). In general,
these major soils are acidic, with pH values 4.0 or less, have a comparatively small
cation exchange capacity (CEC) and have a shallow layer of suitable soil for
agriculture use. The soils that are appropriate for agriculture are Luvisols (10%),
Dystric cambisols (5.0%), Eutric cambisols (4.2%), Leptosols (1.9%), Fluvisols
Table 3.4 Agricultural Land Use in 1982 and 1989
Unit : 000 ha
Agricultural Land Use Year 1982 Year 1989Permanent agriculture 708.7 849.5Shifting/rotationalcultivation
597.4 625.6
Total 1,306.1 1,475.1Source : DOF in 1992
3-8
(1.3%) and Gleysols (0.5%). Together these soils cover about 4.8 million ha with
slopes less than 30%. They are found in alluvial and depression areas along the
Mekong river, and other river basins. The soils are neutral to alkaline and have a
good CEC with a favorable organic matter content.
(4) Natural Resources as Farm Inputs
There are certain natural resources found in the country that are of actual or
potential importance to agriculture. These are limestone (Ca), gypsum (Ca),
dolomite (Ca/Mg), sylvite (K) and rock phosphate (P). Calcium (Ca) when added to
acid soils increases the pH, elevates the cation exchange capacity and releases such
elements as P. Phosphorous (P), potassium (K) and nitrogen (N) are essential
minerals for plant growth. There are many nitrogen fixing plants, and together with
compost, dung from domestic animals and guano from bats droppings a supply of
NPK can be obtained from all these sources.
(5) Environment.
With a large forest cover at 10.7 million ha or 45% of land area and an additional 10
million ha of potential forest, Laos is rich in biodiversity. It is one of the few areas in
SE Asia where there are large blocks of forest still intact. From a global
environmental perspective Laos is a very important country. This is why the
Government has created 20 National Biodiversity Conservation Areas (NBCAs)
covering over 3.4 million ha. Two mammals have recently been discovered in the
forest of the central region, namely the Saola (Pseudoryx nghetinhensis) and the
Giant Muntjac (Megamuntiacus muntgak). They are as yet undiscovered flora and
fauna species; this emphasizes the global importance of the forests and the NBCAs.
Between 1990 and 2000, it is estimated that 335,000 ha of forests have been
converted to arable agriculture and 37,000 ha to grasslands. In addition another
33,000 ha of forest has been cleared for dam construction or have been flooded with
a small area converted to agriculture in compensation for agricultural land being
urbanized. Thus, an estimated 405,000 ha of forest land were lost to agriculture etc.
between 1990 and 2000.
Some of this area was on sloping land and some was close to rivers. Also, some
shifting cultivation clearing occurred in NBCA and some was in watershed areas.
Therefore, there is a negative environmental impact from clearing such areas.
Again some agricultural practices leave much to be desired. These include:
- farming on steep slopes without taking precautionary measures such asterracing or contour ploughing;
3-9
- not taking precautionary measures such as planting strips of grass and ortrees along the contours to prevent erosion and to build up a terrace;
- farming in close proximity to streams and rivers, thus exposing the riverbanks to erosion. In this regard, most gallery forests along river have beendestroyed;
- unplanned expansion of farming sometimes in pristine forest areas and withlittle salvaging of valuable tree species;
- moving into wetlands for rice production;
- inappropriate irrigation application, thus making some soils saline;
- clearing old grass in grazing areas by burning, this can set off uncontrolledfires, kill young seedling and destroy wildlife habitat; and
- shortening the shifting cultivation cycle.
There is need to draw together all the best agricultural practices and publish them in
the form of extension manuals, leaflets and poster and make them available to all
interested parties.
3.2.2 Institutions and Organizations
(1) Central Organizations
Several government agencies are involved in agriculture and rural development at
the central level. The State Planning Committee (SPC) is the secretary agency for
the council of ministers for coordinating development activities and budgeting, and
it prepares guidelines for project proposals. The Committee for Investment
Cooperation (CIC) presents aid programs for donors and is responsible for the
allocation and coordination of aid. The Central Leading Rural Development
Committee (CLRDC) is the primary organization for “the Focal Site Rural
Development” program. The MAF is responsible for making strategies and plans
for agricultural production, issuing laws and regulations on agriculture/forestry, and
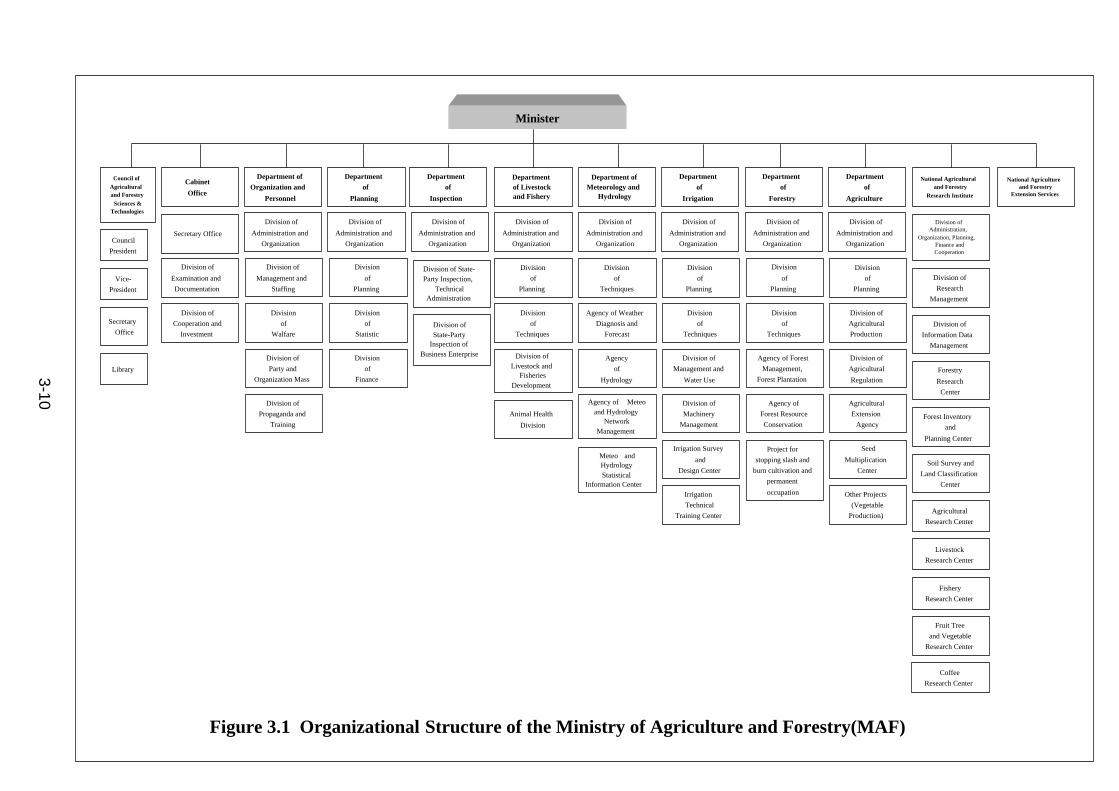
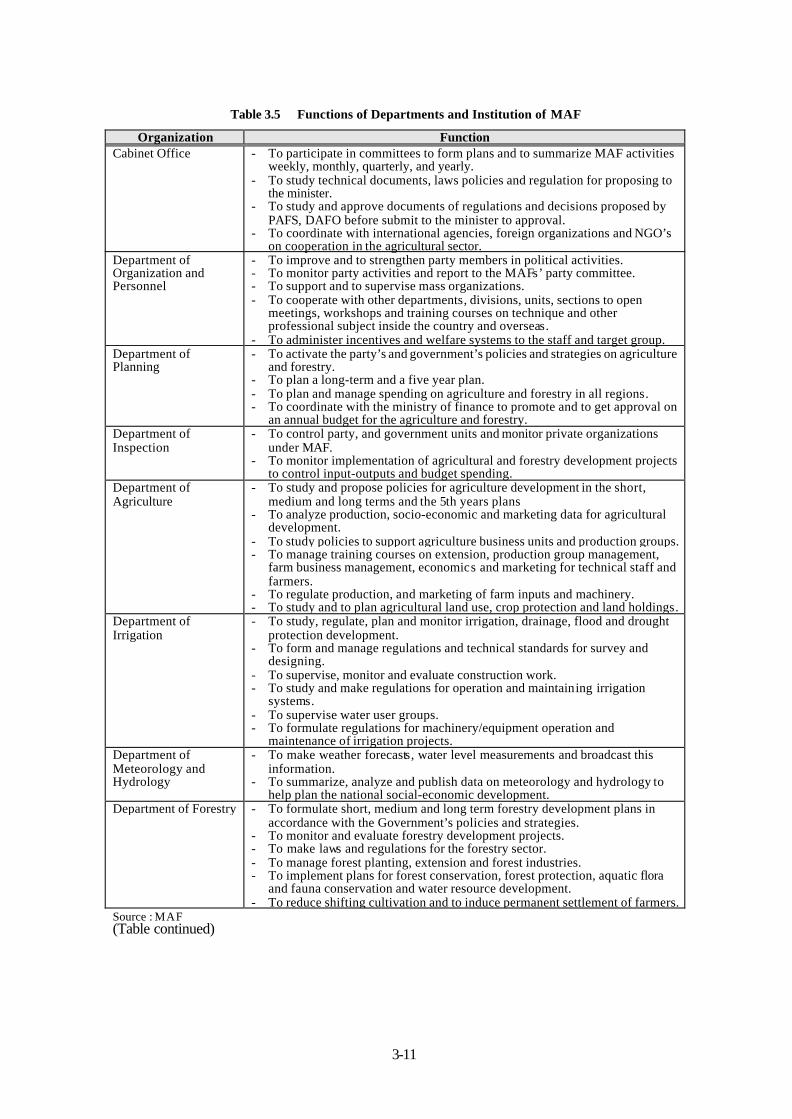
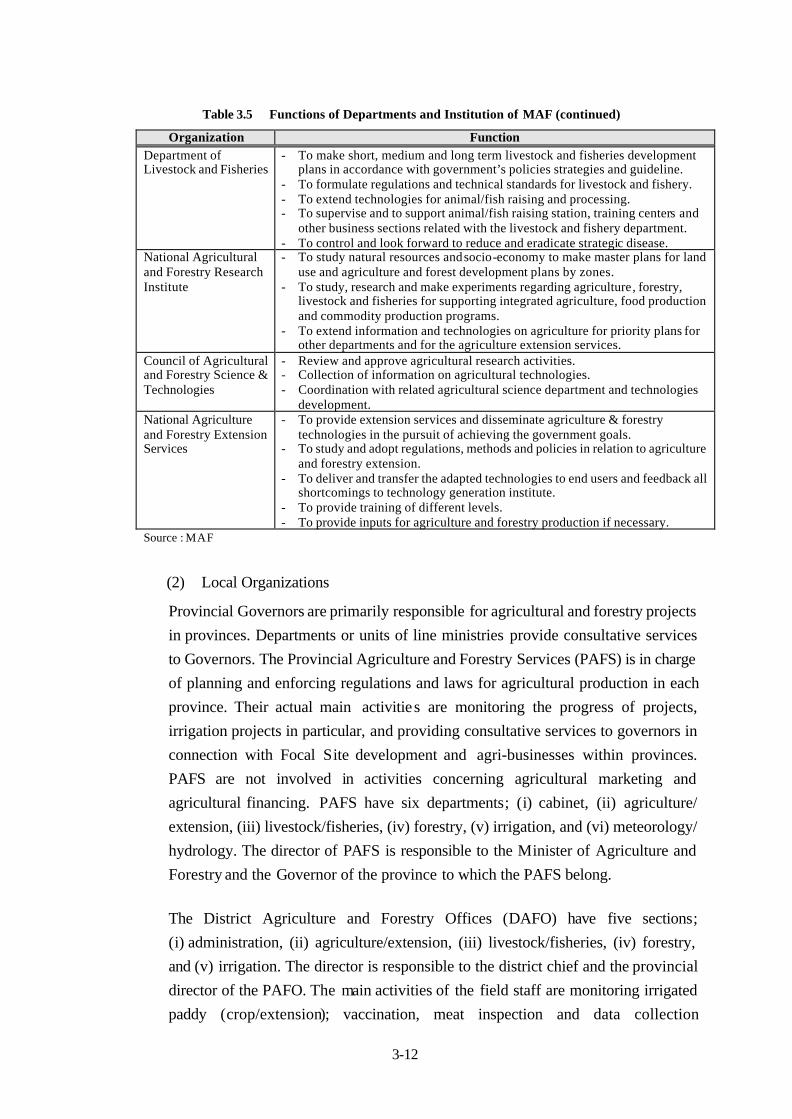
for technical and scientific agricultural research. There are 11 organizations under
the Ministry of Agriculture and Forestry as shown in Figure 3.1. The main functions
of each organization are given in Table 3.5. The Ministry of Finance (MOF) is
responsible for issuing guidelines on tax collection, for the preparation of detailed
draft state budgets, for projecting revenue and expenditure and for detailed budget
reconciliation. The Ministry of Commerce and Tourism (MCT) is in charge of
agricultural products trading both in foreign and domestic markets. The Ministry of
Industry and Handicraft (MIH) is in charge of agro-industries and handicraft such
as spinning and weaving. The Lao Women’s Union (LWU) is in charge of women’s
and gender issues and it aims to promote equality between men and women; it
implements some small projects such as of handicrafts and micro-financing in rural
areas.
Minister
Departmentof
Irrigation
Division of
Administration and
Organization
Division of
Administration and
Organization
Division of
Administration and
Organization
Division of
Administration and
Organization
Division of
Administration and
Organization
Division of
Administration and
Organization
Division of
Administration and
Organization
Division of
Administration and
Organization
Departmentof
Forestry
Departmentof
Agriculture
Department ofMeteorology and
Hydrology
Departmentof Livestockand Fishery
Departmentof
Inspection
Departmentof
Planning
Department ofOrganization and
Personnel
Division ofAdministration,
Organization, Planning,Finance andCooperation
National Agriculturaland Forestry
Research Institute
Secretary OfficeCouncil
President
Cabinet
Office
Council ofAgriculturaland Forestry
Sciences &Technologies
Division of
Cooperation and
Investment
Secretary
Office
Division of
Examination and
DocumentationVice-
President
Library
Division of
Research
Management
Division of
Information Data
Management
Fruit Tree
and Vegetable
Research Center
Forestry
Research
Center
Forest Inventory
and
Planning Center
Soil Survey and
Land Classification
Center
Agricultural
Research Center
Livestock
Research Center
Fishery
Research Center
Division
of
Planning
Division
of
Techniques
Agency of Forest
Management,
Forest Plantation
Agency of
Forest Resource
Conservation
Project for
stopping slash and
burn cultivation and
permanent
occupation
Division
of
Planning
Division
of
Techniques
Division of
Management and
Water Use
Division of
Machinery
Management
Irrigation Survey
and
Design Center
Irrigation
Technical
Training Center
Division
of
Techniques
Agency of Weather
Diagnosis and
Forecast
Agency
of
Hydrology
Agency of Meteoand Hydrology
NetworkManagement
Meteo andHydrologyStatistical
Information Center
Division
of
Planning
Division
of
Techniques
Division ofLivestock and
FisheriesDevelopment
Animal Health
Division
Division of State-Party Inspection,
TechnicalAdministration
Division ofState-Party
Inspection ofBusiness Enterprise
Division
of
Planning
Division
of
Statistic
Division
of
Finance
Division of
Management and
Staffing
Division
of
Walfare
Division of
Party and
Organization Mass
Division of
Propaganda and
Training
Division
of
Planning
Division of
Agricultural
Production
Division of
Agricultural
Regulation
Agricultural
Extension
Agency
Seed
Multiplication
Center
Other Projects
(Vegetable
Production)
National Agricultureand Forestry
Extension Services
Coffee
Research Center
Figure 3.1 Organizational Structure of the Ministry of Agriculture and Forestry(MAF)
3-10
3-11
Table 3.5 Functions of Departments and Institution of MAF
Organization FunctionCabinet Office - To participate in committees to form plans and to summarize MAF activities
weekly, monthly, quarterly, and yearly.- To study technical documents, laws policies and regulation for proposing to
the minister.- To study and approve documents of regulations and decisions proposed by
PAFS, DAFO before submit to the minister to approval.- To coordinate with international agencies, foreign organizations and NGO’s
on cooperation in the agricultural sector.Department ofOrganization andPersonnel
- To improve and to strengthen party members in political activities.- To monitor party activities and report to the MAFs’ party committee.- To support and to supervise mass organizations.- To cooperate with other departments, divisions, units, sections to open
meetings, workshops and training courses on technique and otherprofessional subject inside the country and overseas.
- To administer incentives and welfare systems to the staff and target group.Department ofPlanning
- To activate the party’s and government’s policies and strategies on agricultureand forestry.
- To plan a long-term and a five year plan.- To plan and manage spending on agriculture and forestry in all regions.- To coordinate with the ministry of finance to promote and to get approval on
an annual budget for the agriculture and forestry.Department ofInspection
- To control party, and government units and monitor private organizationsunder MAF.
- To monitor implementation of agricultural and forestry development projectsto control input-outputs and budget spending.
Department ofAgriculture
- To study and propose policies for agriculture development in the short,medium and long terms and the 5th years plans
- To analyze production, socio-economic and marketing data for agriculturaldevelopment.
- To study policies to support agriculture business units and production groups.- To manage training courses on extension, production group management,
farm business management, economics and marketing for technical staff andfarmers.
- To regulate production, and marketing of farm inputs and machinery.- To study and to plan agricultural land use, crop protection and land holdings.
Department ofIrrigation
- To study, regulate, plan and monitor irrigation, drainage, flood and droughtprotection development.
- To form and manage regulations and technical standards for survey anddesigning.
- To supervise, monitor and evaluate construction work.- To study and make regulations for operation and maintaining irrigation
systems.- To supervise water user groups.- To formulate regulations for machinery/equipment operation and
maintenance of irrigation projects.Department ofMeteorology andHydrology
- To make weather forecasts, water level measurements and broadcast thisinformation.
- To summarize, analyze and publish data on meteorology and hydrology tohelp plan the national social-economic development.
Department of Forestry - To formulate short, medium and long term forestry development plans inaccordance with the Government’s policies and strategies.
- To monitor and evaluate forestry development projects.- To make laws and regulations for the forestry sector.- To manage forest planting, extension and forest industries.- To implement plans for forest conservation, forest protection, aquatic flora
and fauna conservation and water resource development.- To reduce shifting cultivation and to induce permanent settlement of farmers.
Source : MAF(Table continued)
3-12
Table 3.5 Functions of Departments and Institution of MAF (continued)
Organization FunctionDepartment ofLivestock and Fisheries
- To make short, medium and long term livestock and fisheries developmentplans in accordance with government’s policies strategies and guideline.
- To formulate regulations and technical standards for livestock and fishery.- To extend technologies for animal/fish raising and processing.- To supervise and to support animal/fish raising station, training centers and
other business sections related with the livestock and fishery department.- To control and look forward to reduce and eradicate strategic disease.
National Agriculturaland Forestry ResearchInstitute
- To study natural resources and socio-economy to make master plans for landuse and agriculture and forest development plans by zones.
- To study, research and make experiments regarding agriculture, forestry,livestock and fisheries for supporting integrated agriculture, food productionand commodity production programs.
- To extend information and technologies on agriculture for priority plans forother departments and for the agriculture extension services.
Council of Agriculturaland Forestry Science &Technologies
- Review and approve agricultural research activities.- Collection of information on agricultural technologies.- Coordination with related agricultural science department and technologies
development.National Agricultureand Forestry ExtensionServices
- To provide extension services and disseminate agriculture & forestrytechnologies in the pursuit of achieving the government goals.
- To study and adopt regulations, methods and policies in relation to agricultureand forestry extension.
- To deliver and transfer the adapted technologies to end users and feedback allshortcomings to technology generation institute.
- To provide training of different levels.- To provide inputs for agriculture and forestry production if necessary.
Source : MAF
(2) Local Organizations
Provincial Governors are primarily responsible for agricultural and forestry projects
in provinces. Departments or units of line ministries provide consultative services
to Governors. The Provincial Agriculture and Forestry Services (PAFS) is in charge
of planning and enforcing regulations and laws for agricultural production in each
province. Their actual main activitie s are monitoring the progress of projects,
irrigation projects in particular, and providing consultative services to governors in
connection with Focal Site development and agri-businesses within provinces.
PAFS are not involved in activities concerning agricultural marketing and
agricultural financing. PAFS have six departments; (i) cabinet, (ii) agriculture/
extension, (iii) livestock/fisheries, (iv) forestry, (v) irrigation, and (vi) meteorology/
hydrology. The director of PAFS is responsible to the Minister of Agriculture and
Forestry and the Governor of the province to which the PAFS belong.
The District Agriculture and Forestry Offices (DAFO) have five sections;
(i) administration, (ii) agriculture/extension, (iii) livestock/fisheries, (iv) forestry,
and (v) irrigation. The director is responsible to the district chief and the provincial
director of the PAFO. The main activities of the field staff are monitoring irrigated
paddy (crop/extension); vaccination, meat inspection and data collection
3-13
(livestock); monitoring of irrigation construction/ rehabilitation projects
(irrigation); and in the forest sub-sector inspecting wood processing factories,
monitoring forest products and overseeing forests/wild animals.
The Village Administrative Authorities pass on to farmers instructions, regulations,
laws and information related to projects in agriculture and forestry. The village head
is responsible to the district chief and district units of the central government.
Village heads are the only officials subject to direct election by the people.
Remuneration for village administration members are minimal, and other members
work without remuneration. There is no budget for village administration, though
they have to collect various taxes from villagers such as VAT from animal and crop
sales, land tax, irrigation service fees, etc. However, the decentralization of the
budgeting and planning systems allows villages to make their own plans and
budgets under the supervision of the district authorities. This process is on-going
nationwide. Village authorities have to report various statistics weekly, monthly,
and quarterly to the district authorities. In the case of agriculture, village heads have
to collect data on irrigated crops weekly and animals or crops monthly in addition to
data for other sectors such as education, health, security etc.
(3) Farmers’ Organizations
There are many formal and non-formal farmers’ organizations established under
donor assistance projects, credit programs, and government development initiatives.
The most progressive organizations are the water users’ organizations. Non formal
organizations called “groups” have been formed under the guidance of the village
authorities or under the village organizations for specific income development
activities.
(a) Cooperatives
There are no agricultural cooperatives at present; this is mainly a result of past
experiences.5/ In early 1978, a decision was made to collectivize Lao agriculture
through the formation of village-based cooperatives. By mid 1979, the
cooperative program was brought to a halt and by the end of 1980 only 60 out of
2,500 cooperatives retained an organizational basis. Membership was to be
voluntary but, in fact, it was compulsory and members had to hand over their
land to the cooperatives. This system was in direct conflict with virtually every
aspect of traditional Lao society. In July 1979, the program was effectively
abolished due to complaints, prospects of a severe food shortage, continued
5/ TA No.2883-LAO Agriculture Strategy Study, ADB/MAF, December 1998.
3-14
movement of people to Thailand and the need to reduce opposition to the
program from peasants. A second effort was made at establishing cooperatives,
but more for the provision of inputs and marketing surplus production. The
Cooperative Department of the then Ministry of Agriculture, Irrigation and
Cooperatives was put in charge of all matters concerning agaricultural
cooperatives. However, implementation of the NEM basically halted any further
efforts at collectivization through cooperatives.
(b) Water Users’ Association (WUA)
A water users’ association (WUA) is a formal farmer organization, which acts as
a juristic entity. Despite their legal independence, the WUA is also a communal
organization. Therefore, it is governed by a steering committee representing
village administrative authorities of all the villages located in the irrigation
scheme. The WUA management committee, which is elected by the WUA’s
General Assembly, operates the irrigation scheme. In 2001, there are 453 WUAs
for 1,706 irrigation schemes in the country.
The WUA is not only responsible for the operation and maintenance of the
irrigation schemes, but is also responsible for the procurement of inputs, credit
for agriculture production of its members, and for the marketing of farm
products. With their legal status, the WUAs have the right to undertake business
ventures with the APB/SOCB and trading companies. About 10% of the WUAs
deals with marketing of inputs and produce.
Irrigation public assets (pump, headwork, canals and structures) are fully
transferred to the associations and the irrigation system is under the full
responsibility of a WUA. An Irrigation Service Fee (ISF) system is introduced
in order to recover running costs and provide capital for future investments. The
WUAs are in the process of increasing their Irrigation Service Fee ( ISF) to cover
all O&M costs, and to contribute to village revenues.
Despite the establishment of WUAs through a stepwise process developed by
the government, the associations are still young and need further strengthening.
The balance sheet and reports of these WUAs have not been properly audited
and there has been very limited support from PAFS and DAFO. APB is also
hesitating to provide medium and long term credit to the associations. Firstly,
due to the precarious legal status and lack of financial transparency of these
organizations, and secondly, because APB is lacking funds to provide credit.
3-15
(c) Water Users’ Groups (WUG)
Water users’ groups (WUG) have been established by village authorities in all
the irrigation schemes constructed with the assistance of DOI and PAFS. WUGs
are established under the directive of DOI for the operation and maintenance of
the irrigation schemes. The WUG organization is a village driven organization
headed by the chief or deputy chief of the village. For an irrigation scheme
covering more than one village, the WUG committee includes members of all
villages. The village that has most land/members takes the lead and chairman
position. The by-laws and articles of association are drafted by the PAFS of each
province. The organization chart of a WUG is similar to a WUA but with less
functions depending on the size of the scheme.
In the case of a WUG, the responsibility for the operation and maintenance of
the irrigation scheme has been transferred to the farmer’s organization. The
WUG operates and collects water charges from the farmers. Water charges in
most schemes are structured to cover electricity or fuel expenses (in case of
pump scheme), cost of mechanical operations and maintenance, and a fee for the
pump operator. In some of the schemes, fees for a water master and a premium
for the WUG committee members are also included. In the case of WUG, the
public irrigation assets still belong to the government. For major repair, WUGs
get assistance from PAFS.
In the organization chart of WUGs, the water block groups are called production
groups. However, the groups function is mainly for water management. The
function of “production grouping” is very limited. Farmers cannot obtain funds
to buy fertilizers and other inputs for production and still have to sell their own
farm products.
In the long run, WUGs that rely on the village status to manage and operate
irrigation system would not be legally reliable to undertake any obligations i.e.
to borrow from APB. This is because the function of the village authority as a
social administration does not conform to the business status of a farmers’
organization.
(d) APB Credit Groups
Credit groups have been established by APB to provide loans to groups of
farmers (5 to 10 families). The APB credit groups are formed for seasonal (short
term) loans. They are heterogeneous, therefore they are not composed of the
same persons when they are reformed again. The APB credit groups only
3-16
borrow money to cover short term requirements and pay it back at the end of
each harvest. After payment is made the groups disband.
No support is provided by APB to the credit groups in term of information about
the use of the supplies (fertilizer) and equipment. However, PAFS and DAFO
provide some limited technical information concerning the appropriate use of
fertilizers and equipment.
(e) Revolving Funds Groups
These groups are formed through revolving funds programs or credit programs
in donor assistance projects (IFAD, Lao-Swedish Forestry Program, SIRAP,
Namthan Irrigation etc.). Most of the revolving funds and credit s are targeting
village income generating activities such as weaving, chicken and pig raising,
and other small cottage industries. The funds are provided to a village and are
managed by a committee. Revolving funds groups are of small size (5 to 15
families). The loan amount is small (50,000 to 500,000 kip per families
depending on the project).
(f) DAFO’s Farmers’ Production and Contract Groups
DAFO has organized farmers into production groups for growing particular
crops or for undertaking irrigated agriculture. It is a kind of intermediate group
before encouraging the farmers to form a WUG. It is observed that these groups
are not viable and disappear as soon as support from DAFO is stopped . Contract
farming groups are organized for particular cash crops such as tobacco and
coffee. The Lao Tobacco Company makes contracts with group of farmers to
grow tobacco. Coffee groups make contracts with the Coffee Association, which
represents state and private enterprises in the coffee business. The contract-
farming groups obtain loans from APB as legal credit groups.
(g) Other Buying and Selling Groups
Livestock buying and selling groups have been established in some provinces by
the district authorities or by the Provincial Food Supply Company. A group is
contracted by the company to buy cattle, pigs and poultry from the village and
sell them to the company for specified prices. Usually, the group is formed of
three to five small village entrepreneurs who also have the right to borrow
money from APB as a credit group. Nonetheless, APB has provided few loans to
buying and selling groups. Similar organizations are organized for the
procurement of rice for the Provincial Food Supply Company. These groups are
formed by rice-mill owners and mechanical rice-threshing machine owners.
3-17
(4) Main Institutional Issues
In the market economy, the government’s role for agriculture is to provide
supporting services to farmers and consumers. There are at least three conditions
for the proper functioning of the market economy; the rule of law, a guarantee of
property rights, and free economic activities. The rule of law restricts arbitrary
government intervention in economic activities such as arbitrary taxing, forfeiture,
penalty charging, establishing monopolistic enterprises, price controls, movement
controls and canceling of land use right. In this regard, several institutional issues
need rectifying to propel the market economy and invite more investments.
(a) Unpredictable and arbitrary local taxing
Provinces have a mandate to determine detailed items to be taxed and to
determine tax or penalty rates, based upon the generic decrees or instructions
from the central government. The implementation of such decrees and laws
depend upon the local enforcement authorities. All regulations are not
necessarily enforced. The degree of economic freedom varies between
provinces. Some provinces are very liberal and some very authoritarian.
(b) Price controls
Agricultural marketing has not been fully liberalized. Prices of rice and meat are
controlled by the government. The central government sets allowable price
ranges for rice and meat. Actual prices are determined by the respective
provinces. Maximum prices are found mostly in the Vientiane municipality and
lower prices are fixed in smaller provinces.6/ There is a quota system for
livestock trading in some provinces. For example, in Louangphrabang province,
only one license per district is issued due to the limited tradable livestock. The
movement of rice and livestock between provinces is strictly controlled by local
governments through transport permits.
(c) Lack of working judicial system
The rule of law is still weak. Protection from arbitrary government actions is
supposed to be covered by law. But, the judiciary system is weak. There are only
24 attorneys at present, and each attorney handles ten to fifteen cases a year.
Only one judge is stationed in each province. Suing the government is very rare.
Court procedures are time-consuming and judicial costs are high, ranging from
0.5million to a million kip for a small case and five million kip for a large case.
Common people have difficulty in using the judicial system for solving disputes.
6/ Examples of price variations of rice and livestock are presented in Section 3.2.8.
3-18
(d) Restriction on crop selection
Crop selection is sometimes controlled. There are cases of strong guidance from
the central and local governments. For irrigated fields for example, farmers are
obliged to plant paddy regardless of its economic viability.
3.2.3 Land Tenure
(1) Background
All land belongs to the state, but since the late 1980s the Government has taken
legal steps to broaden access to land use rights. In 1991, a constitution was adopted
which enshrined the principle that land belongs to the state, but individuals are
guaranteed its use. There are legal measures to ensure access to land such as the
Forestry Law (FL) and Land Law (LL) promulgated in 1996 and 1997, respectively.
Under these laws land use rights can be inherited, transferred, or leased, all of which
are legitimately recognized by the State provided the land is registered and land tax
is paid 7/.
Traditionally, land tenure agreements were made between families or through the
village chief and there were no restrictions on how much land a farmer could claim.
Likewise, land tenure could be obtained, for example, by farmers clearing and
cultivating a piece of land with the rights remaining during the fallow period; this is
still practiced in certain villages in remote areas. Population pressure, however, has
led the government to create a legal framework to mitigate conflicts among villages
over village boundaries. At the same time, in order to establish sustainable land use,
legal land use rights are allocated to individuals through a land allocation process,
which has been underway since the early 1990s.
(2) Land Tenure and Management
Individuals and families may receive allocations of land for agricultural purposes
and this is defined as follows (LL Article 17):
i) up to 1 ha per full-time family labor unit for rice and fish farming;
ii) up to 3 ha per full-time family labor unit for commercial crops;
iii) up to 3 ha per full-time family labor unit for an orchard; and
iv) up to 15 ha per full-time family labor unit of deforested land or grasslandsfor pasture8/
7/ Purchase and selling of land use right is not legal but the transactions are virtually occurring.8/ A family labor is a person exceeding 15 years (according to the law), but 10 years in practice.
3-19
The total land area for one household could be up to 22 ha per adult laborer, but
there is insufficient land to fulfill this objective. The government assigns land
management responsibilities including Land Allocation to relevant ministries such
as MAF and the District Administrative Authority (DAA). They are responsible for
agricultural land allocation and issue Temporary Land Use Certificates (LUCs).
The Temporary Land Certificate attests the provisional use right for agricultural or
forest land and this is valid for three years (LL Article 18, 22). At the end of this
period, if the land is used as originally specified, an individual may request a Land
Title, which is the main evidence for permanent land use right. The government
obligates holders of land use rights to protect the land and the environment, not to
violate the rights and interests of other persons, to accept valid servitude, to pay
taxes and fees relevant to land use, and to comply with other land and forest
regulations. (LL Article 6 and 60, FL Article 8 and 57).
(3) Land Taxation
Tax is imposed on agricultural land with the rate ranging from 3,000 Kip/ha in
cleared grassland in mountainous areas to 20,000 Kip/ha on the fallow rice fields in
lowland areas. There is a tax incentive for stabilized land use such as sedentary rice
fields in upland rural areas are having the rate of 14 kg/ha while the rotation land is
15 kg/ha. This rate was stated in the newly announced Decree on the
Implementation of the Presidential Decree on Land Tax, dated 22 October 2000.
According to Department of Lands of MOF, the land tax collection is generally
improved at the district level since the execution of the decree (See annex 5 for
Land Tax Rate). Land tax is not imposed as long as lands are not registered. While
the land allocation is ongoing slowly, cultivated areas are under-reported since
people try to avoid payment of taxes.
(4) Present Status of Land Allocation
There is a consensus among relevant government organizations that efficient land
markets and security of land tenure are important in order to permit the allocation of
land to its most efficient use and in order to encourage land-related investments and
sustainable use of land.
The World Bank financed Land Titling Project, under the MOF, aims to provide title
to individuals, groups and companies for long-term use of rural land. The project
deals with the establishment of land registers at the provincial level and the issuing
of title documents, with the ultimate aim of creating a nation-wide, parcel-based,
land registration system. The project is working in provinces identified by the
3-20
Government as priority areas, containing high value land. So far, communities in
more distant rural areas have not been targeted for land titling.
The executing agency for land allocation in rural area is the Central Committee for
Land Management and Land & Forest Allocation under the Prime Minister’s Office
and the Shifting Cultivation Stabilization Program under Department of Forest,
MAF. The Committee was created in 1996 and has line offices at the provincial and
district levels. The shifting Cultivation Stabilization Program, as its title shows, was
established for the purpose of stabilizing shifting cultivation and it is responsible for
general land management including formulation and implementation of general
program for Land Use Planning at the village level as well as Land Allocation for
individual households. Land allocation has a multi-purpose function including
securing land tenure by formalizing land use rights, to reduce endemic land disputes
within and between villages and to enhance land tax revenues by increasing
productivity and income from better land use.
The present land ceiling is relatively generous since people can obtain land up to
22 ha per family worker by having the land on a lease basis. In practice, actual
allocations are far below the LL ceiling due to land scarcity and this is cited as one
cause of unsustainable short rotation shifting cultivation.
At the initial stage of land management undertakings including legal issues by the
government, the most important and urgent issue was the clarification of boundaries
of village and community forests. This is called Baeng din baeng paa (land zoning
or land use planning). By demarcating the land, users could be required to use the
land in an effective manner. At this stage, the more emphasized issue is Mop din
mop paa (land allocation) in which clarification of individual land use rights and
registration are required.
In this process, some sensitive issues are observed such as land redistribution, as
there are cases where well off families are persuaded to allocate some of their land
to poorer households. Also, there are cases where households possessing plots
located adjacent to water sources have to relinquish them in order to protect and
conserve the water supply. In such cases extra land is required for compensation. 9/
Likewise, it is often difficult for villages and villagers to make clear boundaries
between villages since their conventional land use is relatively complex and
sometimes overlapping. In most cases, there have been attempts to follow
9/ E. Eklind, C. Johansson (1997), Land Allocation and Land Use Planning in Rural Area in Lao PDR, Royal Institute ofTechnology (Sweden) Thesis Report Series 1997: 6, p.60
3-21
customary land rights as much as possible, but this has been difficult with swidden
fields since they are ill-defined. Moreover, with regard to traditional perceptions of
land and its use, it is often the case that people do not really understand the meaning
of land registration since it is a brand-new perception. Poor households are reluctant
to declare more swidden plots than they actually cultivate in any one year for fear of
the land tax. Thus, they do not receive the amount or quality of land for which they
would be entitled to.10/
At the central level, there is a lack of information and data on ongoing land
allocation countrywide. Due to a lack of human resources, there is also a constraint
in accelerating land allocation in an amicable manner. 11/ Now there is a risk that the
legal solution to land tenure has become very diverse throughout the country. One
reason is that many constraints are observed in villages within a certain project
where various allocation solutions are tested. Any project or activity will have to
consider land allocation and its location-specific solutions before undertaking
agricultural development activities.
3.2.4 Human Resources Development
(1) General
In general, human resource development (HRD) aims to develop national core
values, train civil servants, provide quality education and training to children, build
an efficient and skillful labor force, preserve the Lao culture, disseminate
knowledge and information and mobilize mass organizations. The HRD program of
MAF focuses on training more qualified technicians and specialists needed for
agricultural and rural development. The strategy is to have district farming systems
generalists at the grass root level to provide adaptive research-based extension
services and on the-the-job (OJT) training to farmers and shifting cultivators on
sustainable adaptive technology, particularly in the intensive rural development
areas (focal areas).
(2) Educational Level of Farmers
In 1995, Literacy in the country was as low as 60%. There are significant difference
between genders and among provinces. Female literacy was 48%, while male’s was
73%. The lowest was 20% for females in Louangnamtha. The highest was 92% in
Vientiane municipality. It is difficult to promote agricultural development without
improved literacy. Females are the main labor force for arable farming and animal
10/ ADB/MAF(1998) Agriculture Strategy Study Working Paper No.6, Some Key Issues Related to the Agriculture StrategyStudy: Upland/Highland Agriculture Systems, Ethnic Minorities and Resettlement11/ Peter Bloch(undated), Report on Planning-Land Allocation
3-22
husbandry. Therefore, rural female education is most important for agricultural
development considering their present high illiteracy rate.
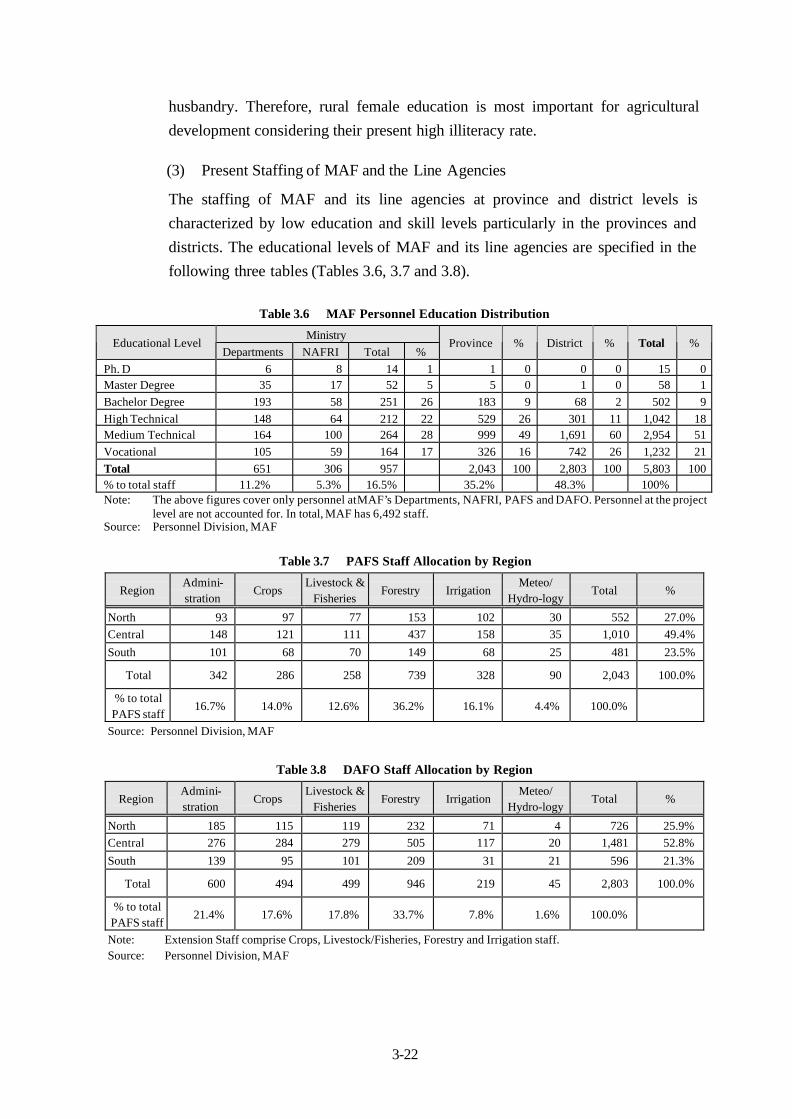
(3) Present Staffing of MAF and the Line Agencies
The staffing of MAF and its line agencies at province and district levels is
characterized by low education and skill levels particularly in the provinces and
districts. The educational levels of MAF and its line agencies are specified in the
following three tables (Tables 3.6, 3.7 and 3.8).
Table 3.6 MAF Personnel Education Distribution
MinistryEducational Level
Departments NAFRI Total %Province % District % Total %
Ph. D 6 8 14 1 1 0 0 0 15 0Master Degree 35 17 52 5 5 0 1 0 58 1Bachelor Degree 193 58 251 26 183 9 68 2 502 9High Technical 148 64 212 22 529 26 301 11 1,042 18Medium Technical 164 100 264 28 999 49 1,691 60 2,954 51Vocational 105 59 164 17 326 16 742 26 1,232 21Total 651 306 957 2,043 100 2,803 100 5,803 100% to total staff 11.2% 5.3% 16.5% 35.2% 48.3% 100%Note: The above figures cover only personnel at MAF’s Departments, NAFRI, PAFS and DAFO. Personnel at the project
level are not accounted for. In total, MAF has 6,492 staff.Source: Personnel Division, MAF
Table 3.7 PAFS Staff Allocation by Region
RegionAdmini-stration
CropsLivestock &
FisheriesForestry Irrigation
Meteo/Hydro-logy
Total %
North 93 97 77 153 102 30 552 27.0%Central 148 121 111 437 158 35 1,010 49.4%
South 101 68 70 149 68 25 481 23.5%
Total 342 286 258 739 328 90 2,043 100.0%
% to totalPAFS staff
16.7% 14.0% 12.6% 36.2% 16.1% 4.4% 100.0%
Source: Personnel Division, MAF
Table 3.8 DAFO Staff Allocation by Region
RegionAdmini-stration
CropsLivestock &
FisheriesForestry Irrigation
Meteo/Hydro-logy
Total %
North 185 115 119 232 71 4 726 25.9%Central 276 284 279 505 117 20 1,481 52.8%
South 139 95 101 209 31 21 596 21.3%
Total 600 494 499 946 219 45 2,803 100.0%
% to totalPAFS staff
21.4% 17.6% 17.8% 33.7% 7.8% 1.6% 100.0%
Note: Extension Staff comprise Crops, Livestock/Fisheries, Forestry and Irrigation staff.Source: Personnel Division, MAF
3-23
There is an uneven staff distribution in term of numbers and educational level at
MAF and its line agencies at the provincial and district levels. The districts located
in the mountainous areas are the least staffed and most uneducated. Due to budget
constraints, especially in relation to the decentralization policy, these districts will
have many difficulties increasing their staffing level as well as providing enough
incentives and support for their extension activities. There are also other factors,
which hamper the assignment of new staff to these poor and remote areas. The
major factor is the lack of accessibility, poor socio-economic conditions, and
difficulties to integrate into local communities that are strongly ethnologically
based. The concept of Farming System Extension Workers (FSEW) should further
address these issues and constraints. There is also an uneven distribution between
the number of staff in the provinces and in the districts. In almost all provinces, staff
is concentrated at the PAFS level. Many districts are understaffed and have less than
ten. To address it the M/P Study recommends strengthening the management
capacity of PAFS and DAFO. This could be done by implementing the
decentralization policy and through the development of PAFS and DAFO in
fulfillment of their administrative and regulatory functions as well as developing
their agricultural extension functions as specified earlier.
(4) Strengthening of MAF Institution
The ADB financed a series of Technical Assistance (TA) projects for developing
and strengthening MAF from 1993 to 1996. A supply/demand analysis for MAF
personnel was made under the implementation of the project, focus was given to the
demand for Subject Matter Specialist (SMS) at PAFS level and for FSEW at the
district level. According to the supply/demand analysis (1996) there is a district
deficit of 713 staff and a province surplus of 227 staff. Recommendations were
given to reshuffle personnel within MAF, the provinces and the districts in order to
rectify this imbalance. However, the status in 2000 remained the same as in 1996.
Since 1998, the MAF Personnel Department indicates that action taken to transfer
some personnel to the provinces and from the provinces to the districts.
The study found that training programs under donor assistance projects are neither
coordinated nor reviewed under any personnel career development plan. On the
other hand, overseas training projects mostly benefit staff at the ministry level
rather than at the provincial and district levels. Mainly this is due to the uneven
educational distribution within PAFS and DAFO and to the small number of staff
with English and other languages working skills. Therefore, there is need to
strengthen MAF personnel management by pursuing the activities already initiated
by the ADB projects.
3-24
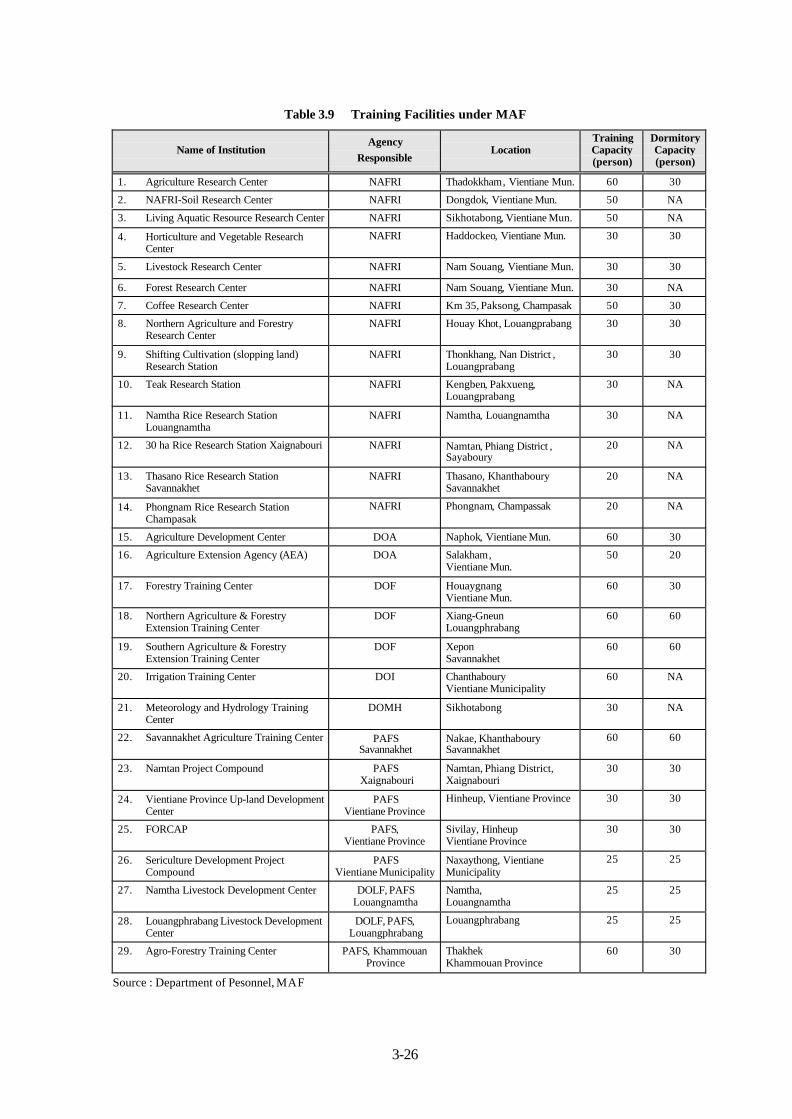
(5) Existing Training Institutions and Facilities
In relation to human resource development and the extension programs of each
sub-sector, there exists a number of training facilities under the institutional
framework of MAF. There are about 29 training centers spread throughout the
country as shown in Table 3.9. Most of them are under the responsibility of NAFRI.
It is clear that due to the lack of an integrated extension and training system, these
training facilities have not been fully utilized and tend to be abandoned after the
completion of donor assistance projects. However, the existence of these facilities is
a good basis for developing future national training programs for government staff
and farmers. It is a prerequisite to strengthen the capacity of existing training
centers in the framework of developing an integrated agricultural extension system
and of strengthening MAF’s management system.
(6) Formal Technical Education in Agriculture and Forestry
Under MAF there are 3 Regional Agriculture and Forestry Technician Schools
(AFTS) located in Louangphrabang (Northern), Borikhamxai (Central), and
Champasak (Southern). All schools are providing a three year technical education
to upper-secondary school graduates. The objective of technician training in
agriculture and forestry is to provide extension workers for the public and private
sectors. The formation of “technical generalist” in agriculture and forestry is one of
MAF’s objectives.
The curricula of the three AFTS are poor and do not match the objectives of
building extension workers. Neither are their curricula uniform nor are they linked
with formal education criteria required by the Ministry of Education12/. In addition,
in all three schools, teaching methods involve more theory that practice. Apart from
the above problems, the schools lack qualified teachers and trainers, teaching aids,
lecture notes and books, laboratories and areas for field practice (land, rice fields,
demonstration farm etc.). On the administrative and operational side, all schools are
having budget problems, have insufficient facilities (classrooms, dormitories, water
and lavatories, kitchens and refectory etc.), and have not enough vehicles and
equipment. Another burden the schools are facing is the over-intake of students
resulting from the overflow of upper-secondary school graduates all over the
country since 1998. The schools are obliged to receive more students than their
academic and management capacity. This situation further more diminishes the
academic capacity of schools and further reduce the quality of teaching as well as
the quality of the graduated students.
12/ This involves establishing a uniform curriculum that allows future bridging to the academic program of NUOL.
3-25
(7) University Education in Agriculture and Forestry
Following the establishment of the National University of Laos (NUOL) in June
1995, the Tadthong Irrigation School, the Dongdok Forestry College, and the
Nabong Agriculture College were transferred from MAF to NUOL. These three
institutions now form respectively the Department of Irrigation Engineering of the
Faculty of Architecture and Engineering, the Faculty of Forestry and the Faculty of
Agriculture. The academic program of the faculties has been developed recently
and consists of two years’ foundation studies followed by three years of
professional bachelor degree study by the faculties.
The above institutions play an important role in relation to MAF’s human resource
development, especially in building up a pool of SMS for PAFS. NUOL plans to
establish a Master’s degree starting in 2005 depending on the readiness of each
faculty. It is anticipated that a Ph.D. degree would be initiated after 2010. In the
mean time, there is a need to create university-bridging programs for technician
diploma and higher diploma holders, which comprises more that 68% of MAF staff.
The NUOL is presently analyzing the possibility of letting technician diploma
holders enter the 3rd year of the bachelor program without passing through the
School of Foundation Studies. Another bridging program for higher diploma holder
should be initiated in order to encourage MAF staff to up-grade their education in a
shorter period.
(8) Primary and Secondary Education in Agriculture and Forestry
Knowledge about agriculture and forestry is provided in the curriculum of primary
education under the subject “world around us”. Some schools initiated practical
exercises in growing vegetables and rais ing tree seedlings with the help of donor
assistance projects13/. Almost all rural primary schools are unable to provide enough
agriculture related education due to a lack of teachers, teaching materials, lecture
books and facilities. At the secondary school level, agriculture should be taught as a
subject, however, in fact no programs are accommodated.
13/ I.e. FORCAP, EU Micro Project.
3-26
Table 3.9 Training Facilities under MAF
Name of InstitutionAgency
ResponsibleLocation
TrainingCapacity(person)
DormitoryCapacity(person)
1. Agriculture Research Center NAFRI Thadokkham, Vientiane Mun. 60 30
2. NAFRI-Soil Research Center NAFRI Dongdok, Vientiane Mun. 50 NA
3. Living Aquatic Resource Research Center NAFRI Sikhotabong, Vientiane Mun. 50 NA
4. Horticulture and Vegetable ResearchCenter
NAFRI Haddockeo, Vientiane Mun. 30 30
5. Livestock Research Center NAFRI Nam Souang, Vientiane Mun. 30 30
6. Forest Research Center NAFRI Nam Souang, Vientiane Mun. 30 NA
7. Coffee Research Center NAFRI Km 35, Paksong, Champasak 50 30
8. Northern Agriculture and ForestryResearch Center
NAFRI Houay Khot, Louangprabang 30 30
9. Shifting Cultivation (slopping land)Research Station
NAFRI Thonkhang, Nan District ,Louangprabang
30 30
10. Teak Research Station NAFRI Kengben, Pakxueng,Louangprabang
30 NA
11. Namtha Rice Research StationLouangnamtha
NAFRI Namtha, Louangnamtha 30 NA
12. 30 ha Rice Research Station Xaignabouri NAFRI Namtan, Phiang District ,Sayaboury
20 NA
13. Thasano Rice Research StationSavannakhet
NAFRI Thasano, KhanthabourySavannakhet
20 NA
14. Phongnam Rice Research StationChampasak
NAFRI Phongnam, Champassak 20 NA
15. Agriculture Development Center DOA Naphok, Vientiane Mun. 60 30
16. Agriculture Extension Agency (AEA) DOA Salakham,Vientiane Mun.
50 20
17. Forestry Training Center DOF HouaygnangVientiane Mun.
60 30
18. Northern Agriculture & ForestryExtension Training Center
DOF Xiang-GneunLouangphrabang
60 60
19. Southern Agriculture & ForestryExtension Training Center
DOF XeponSavannakhet
60 60
20. Irrigation Training Center DOI ChanthabouryVientiane Municipality
60 NA
21. Meteorology and Hydrology TrainingCenter
DOMH Sikhotabong 30 NA
22. Savannakhet Agriculture Training Center PAFS Savannakhet
Nakae, KhanthabourySavannakhet
60 60
23. Namtan Project Compound PAFS Xaignabouri
Namtan, Phiang District,Xaignabouri
30 30
24. Vientiane Province Up-land DevelopmentCenter
PAFSVientiane Province
Hinheup, Vientiane Province 30 30
25. FORCAP PAFS,Vientiane Province
Sivilay, HinheupVientiane Province
30 30
26. Sericulture Development ProjectCompound
PAFSVientiane Municipality
Naxaythong, VientianeMunicipality
25 25
27. Namtha Livestock Development Center DOLF, PAFSLouangnamtha
Namtha,Louangnamtha
25 25
28. Louangphrabang Livestock DevelopmentCenter
DOLF, PAFS,Louangphrabang
Louangphrabang 25 25
29. Agro-Forestry Training Center PAFS, KhammouanProvince
ThakhekKhammouan Province
60 30
Source : Department of Pesonnel, MAF
3-27
3.2.5 Crop
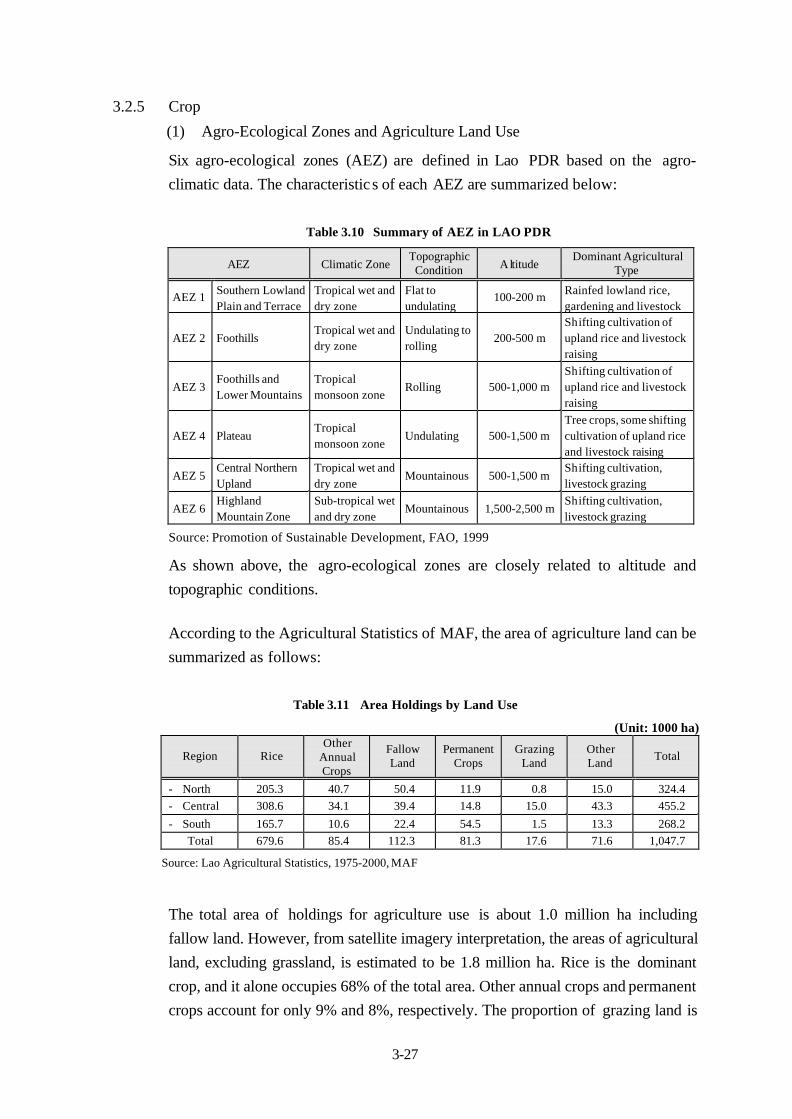
(1) Agro-Ecological Zones and Agriculture Land Use
Six agro-ecological zones (AEZ) are defined in Lao PDR based on the agro-
climatic data. The characteristic s of each AEZ are summarized below:
Table 3.10 Summary of AEZ in LAO PDR
AEZ Climatic ZoneTopographicCondition Altitude
Dominant AgriculturalType
AEZ 1Southern LowlandPlain and Terrace
Tropical wet anddry zone
Flat toundulating
100-200 mRainfed lowland rice,gardening and livestock
AEZ 2 FoothillsTropical wet anddry zone
Undulating torolling
200-500 mShifting cultivation ofupland rice and livestockraising
AEZ 3Foothills andLower Mountains
Tropicalmonsoon zone
Rolling 500-1,000 mShifting cultivation ofupland rice and livestockraising
AEZ 4 PlateauTropicalmonsoon zone
Undulating 500-1,500 mTree crops, some shiftingcultivation of upland riceand livestock raising
AEZ 5Central NorthernUpland
Tropical wet anddry zone
Mountainous 500-1,500 mShifting cultivation,livestock grazing
AEZ 6HighlandMountain Zone
Sub-tropical wetand dry zone
Mountainous 1,500-2,500 mShifting cultivation,livestock grazing
Source: Promotion of Sustainable Development, FAO, 1999
As shown above, the agro-ecological zones are closely related to altitude and
topographic conditions.
According to the Agricultural Statistics of MAF, the area of agriculture land can be
summarized as follows:
Table 3.11 Area Holdings by Land Use
(Unit: 1000 ha)
Region RiceOther
AnnualCrops
FallowLand
PermanentCrops
GrazingLand
OtherLand
Total
- North 205.3 40.7 50.4 11.9 0.8 15.0 324.4- Central 308.6 34.1 39.4 14.8 15.0 43.3 455.2
- South 165.7 10.6 22.4 54.5 1.5 13.3 268.2Total 679.6 85.4 112.3 81.3 17.6 71.6 1,047.7
Source: Lao Agricultural Statistics, 1975-2000, MAF
The total area of holdings for agriculture use is about 1.0 million ha including
fallow land. However, from satellite imagery interpretation, the areas of agricultural
land, excluding grassland, is estimated to be 1.8 million ha. Rice is the dominant
crop, and it alone occupies 68% of the total area. Other annual crops and permanent
crops account for only 9% and 8%, respectively. The proportion of grazing land is
3-28
very small, 2% of the total area of holdings. It is only able to support a small
fraction of the more than 2 million ruminants.
(2) Farming Systems in Lao PDR
The major farming systems are identified as: i) lowland rainfed, ii) lowland
irrigated, iii) upland and mountain, and iv) plateau. The lowland rainfed and
irrigated farming systems are located mainly in AEZ 1. Upland and mountain
farming systems are observed in AEZ 2, AEZ 3, AEZ 5 and AEZ 6. The plateau
farming system is in AEZ 4.
The lowland rainfed and irrigated farming systems are seen in the five plain areas,
i.e. the Vientiane plain (58,000 ha), the Pecan plain (12,000 ha), the Xebang Fai
plain (49,000 ha), the Xebang Hegh plain (83,800 ha) and the Xedong plain
(42,500 ha). In the plains, all cultivated land is used for lowland rice production in
the wet season and for livestock grazing in the dry season. On the other hand, for
irrigated farming, a two-crop system is developed, and many farmers grow irrigated
rice in the wet season and irrigated rice or other crops in the dry season.
The upland and mountain farming systems are dominated by single wet season crop
production in hilly or mountainous areas. The most important crop is upland rice
prevailing in shifting cultivation areas. Other important annual crops include maize,
sweet potato, cassava, ginger, groundnut, soybean, cotton and sugarcane. In this
farming system, small irrigation areas are developed in valley bottoms for the
production of paddy. Perennial crops are also grown in the fields, usually in
scattered formations.
In the plateau farming system, commercial crops are increasingly produced, while
the shifting cultivation area has been reduced. The major commercial crops
including coffee, tea, cardamom, fruit and vegetables are cultivated under rainfed
conditions. The farming system is being developed in various topographic and
climatic conditions. The soil fertility is also favorable compared to other zones.
(3) Overview of Crop Production
The harvested area, yield and production of major crops from 1996 to 2000 are
summarized in Table 3.12:
3-29
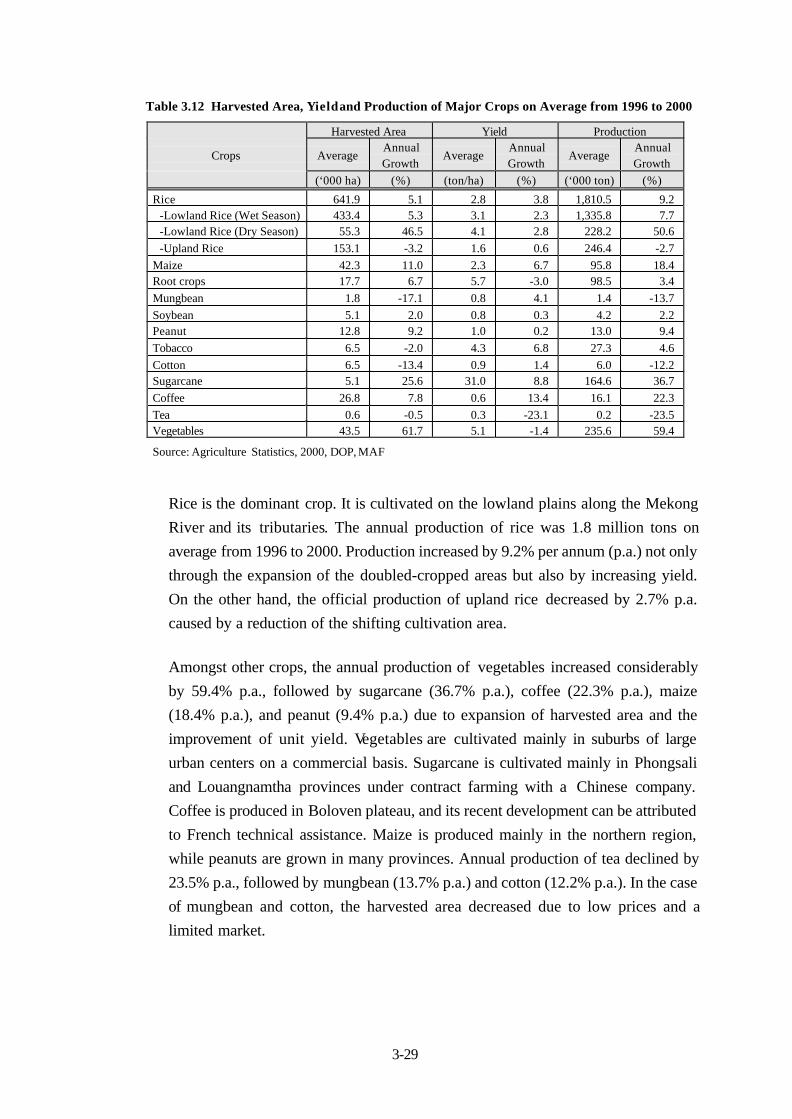
Table 3.12 Harvested Area, Yield and Production of Major Crops on Average from 1996 to 2000
Harvested Area Yield Production
Crops AverageAnnualGrowth
AverageAnnualGrowth
AverageAnnualGrowth
(‘000 ha) (%) (ton/ha) (%) (‘000 ton) (%)
Rice 641.9 5.1 2.8 3.8 1,810.5 9.2-Lowland Rice (Wet Season) 433.4 5.3 3.1 2.3 1,335.8 7.7-Lowland Rice (Dry Season) 55.3 46.5 4.1 2.8 228.2 50.6-Upland Rice 153.1 -3.2 1.6 0.6 246.4 -2.7
Maize 42.3 11.0 2.3 6.7 95.8 18.4Root crops 17.7 6.7 5.7 -3.0 98.5 3.4Mungbean 1.8 -17.1 0.8 4.1 1.4 -13.7Soybean 5.1 2.0 0.8 0.3 4.2 2.2Peanut 12.8 9.2 1.0 0.2 13.0 9.4Tobacco 6.5 -2.0 4.3 6.8 27.3 4.6Cotton 6.5 -13.4 0.9 1.4 6.0 -12.2Sugarcane 5.1 25.6 31.0 8.8 164.6 36.7Coffee 26.8 7.8 0.6 13.4 16.1 22.3Tea 0.6 -0.5 0.3 -23.1 0.2 -23.5Vegetables 43.5 61.7 5.1 -1.4 235.6 59.4
Source: Agriculture Statistics, 2000, DOP, MAF
Rice is the dominant crop. It is cultivated on the lowland plains along the Mekong
River and its tributaries. The annual production of rice was 1.8 million tons on
average from 1996 to 2000. Production increased by 9.2% per annum (p.a.) not only
through the expansion of the doubled-cropped areas but also by increasing yield.
On the other hand, the official production of upland rice decreased by 2.7% p.a.
caused by a reduction of the shifting cultivation area.
Amongst other crops, the annual production of vegetables increased considerably
by 59.4% p.a., followed by sugarcane (36.7% p.a.), coffee (22.3% p.a.), maize
(18.4% p.a.), and peanut (9.4% p.a.) due to expansion of harvested area and the
improvement of unit yield. Vegetables are cultivated mainly in suburbs of large
urban centers on a commercial basis. Sugarcane is cultivated mainly in Phongsali
and Louangnamtha provinces under contract farming with a Chinese company.
Coffee is produced in Boloven plateau, and its recent development can be attributed
to French technical assistance. Maize is produced mainly in the northern region,
while peanuts are grown in many provinces. Annual production of tea declined by
23.5% p.a., followed by mungbean (13.7% p.a.) and cotton (12.2% p.a.). In the case
of mungbean and cotton, the harvested area decreased due to low prices and a
limited market.
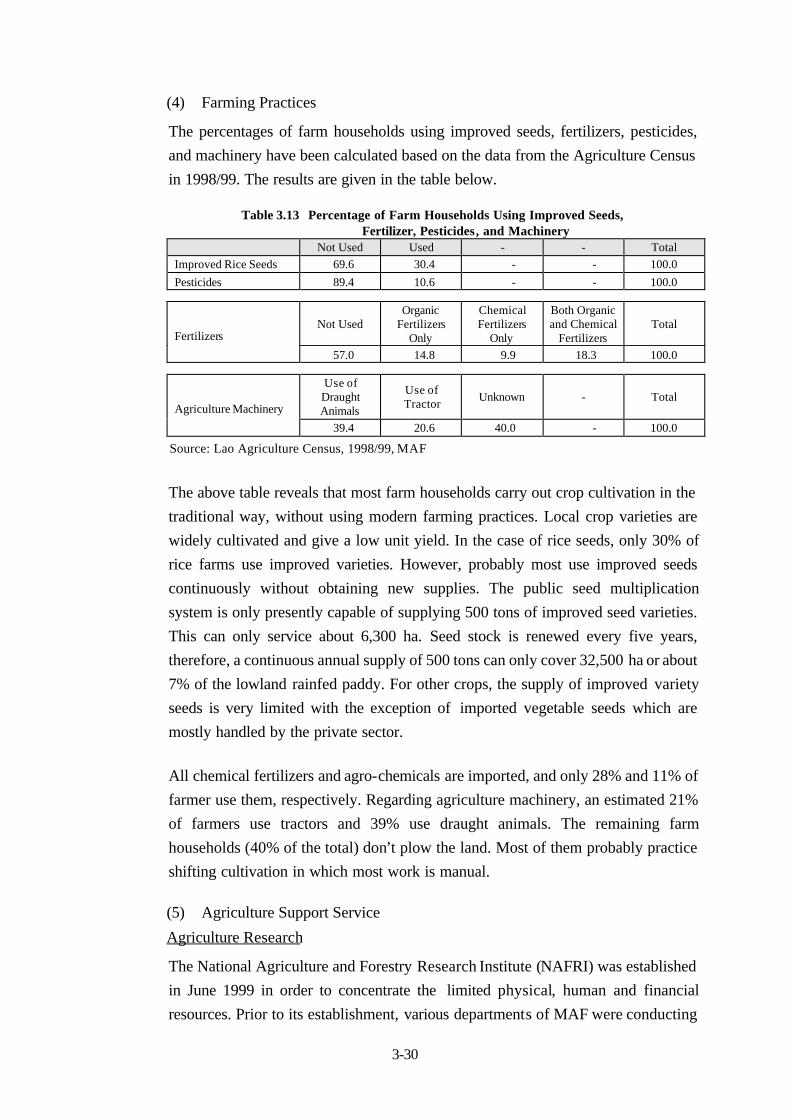
3-30
(4) Farming Practices
The percentages of farm households using improved seeds, fertilizers, pesticides,
and machinery have been calculated based on the data from the Agriculture Census
in 1998/99. The results are given in the table below.
Table 3.13 Percentage of Farm Households Using Improved Seeds,Fertilizer, Pesticides, and Machinery
Not Used Used - - TotalImproved Rice Seeds 69.6 30.4 - - 100.0
Pesticides 89.4 10.6 - - 100.0
Not UsedOrganic
FertilizersOnly
ChemicalFertilizers
Only
Both Organicand Chemical
FertilizersTotal
Fertilizers
57.0 14.8 9.9 18.3 100.0
Use ofDraughtAnimals
Use ofTractor
Unknown - TotalAgriculture Machinery
39.4 20.6 40.0 - 100.0
Source: Lao Agriculture Census, 1998/99, MAF
The above table reveals that most farm households carry out crop cultivation in the
traditional way, without using modern farming practices. Local crop varieties are
widely cultivated and give a low unit yield. In the case of rice seeds, only 30% of
rice farms use improved varieties. However, probably most use improved seeds
continuously without obtaining new supplies. The public seed multiplication
system is only presently capable of supplying 500 tons of improved seed varieties.
This can only service about 6,300 ha. Seed stock is renewed every five years,
therefore, a continuous annual supply of 500 tons can only cover 32,500 ha or about
7% of the lowland rainfed paddy. For other crops, the supply of improved variety
seeds is very limited with the exception of imported vegetable seeds which are
mostly handled by the private sector.
All chemical fertilizers and agro-chemicals are imported, and only 28% and 11% of
farmer use them, respectively. Regarding agriculture machinery, an estimated 21%
of farmers use tractors and 39% use draught animals. The remaining farm
households (40% of the total) don’t plow the land. Most of them probably practice
shifting cultivation in which most work is manual.
(5) Agriculture Support Service
Agriculture Research
The National Agriculture and Forestry Research Institute (NAFRI) was established
in June 1999 in order to concentrate the limited physical, human and financial
resources. Prior to its establishment, various departments of MAF were conducting
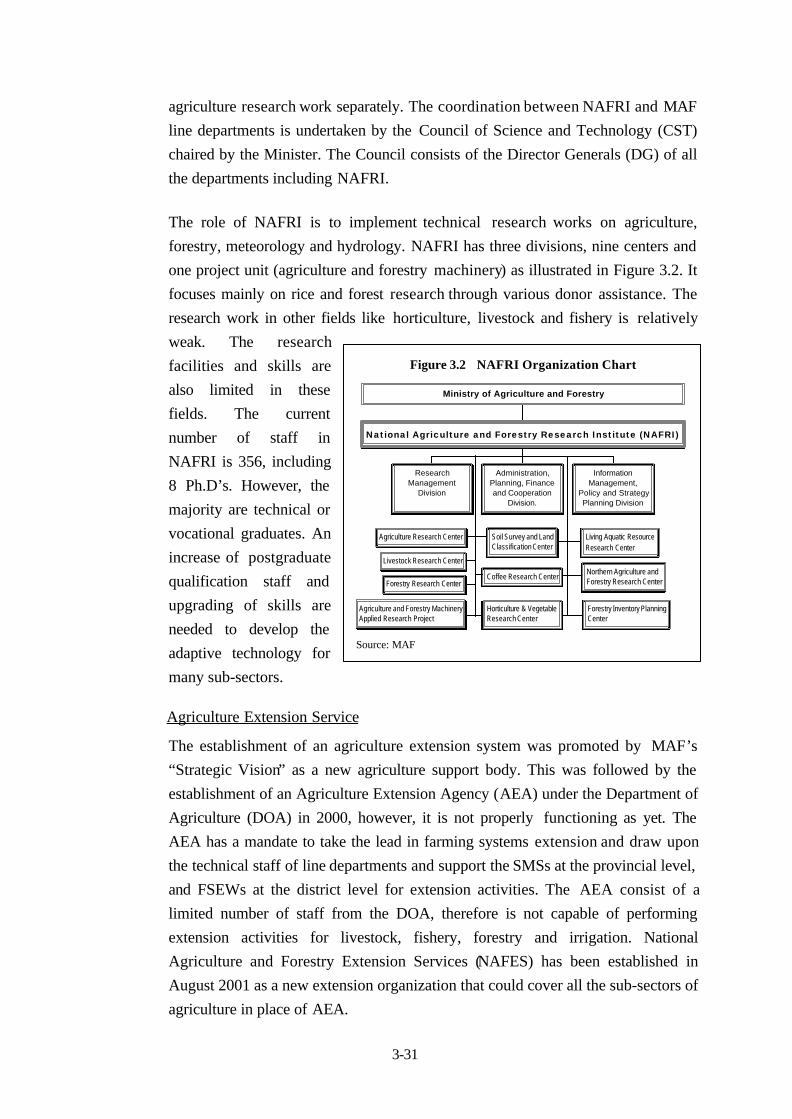
3-31
Figure 3.2.5.1 NAFRI Organization Chart
Soil Survey and LandClassification Center
Agriculture Research Center
Horticulture & VegetableResearch Center
Livestock Research Center
Living Aquatic ResourceResearch Center
Coffee Research Center Northern Agriculture andForestry Research CenterForestry Research Center
Forestry Inventory PlanningCenter
Agriculture and Forestry MachineryApplied Research Project
ResearchManagement
Division
Administration,Planning, Financeand Cooperation
Division.
InformationManagement,
Policy and StrategyPlanning Division
National Agriculture and Forestry Research Institute (NAFRI)
Ministry of Agriculture and Forestry
agriculture research work separately. The coordination between NAFRI and MAF
line departments is undertaken by the Council of Science and Technology (CST)
chaired by the Minister. The Council consists of the Director Generals (DG) of all
the departments including NAFRI.
The role of NAFRI is to implement technical research works on agriculture,
forestry, meteorology and hydrology. NAFRI has three divisions, nine centers and
one project unit (agriculture and forestry machinery) as illustrated in Figure 3.2. It
focuses mainly on rice and forest research through various donor assistance. The
research work in other fields like horticulture, livestock and fishery is relatively
weak. The research
facilities and skills are
also limited in these
fields. The current
number of staff in
NAFRI is 356, including
8 Ph.D’s. However, the
majority are technical or
vocational graduates. An
increase of postgraduate
qualification staff and
upgrading of skills are
needed to develop the
adaptive technology for
many sub-sectors.
Agriculture Extension Service
The establishment of an agriculture extension system was promoted by MAF’s
“Strategic Vision” as a new agriculture support body. This was followed by the
establishment of an Agriculture Extension Agency (AEA) under the Department of
Agriculture (DOA) in 2000, however, it is not properly functioning as yet. The
AEA has a mandate to take the lead in farming systems extension and draw upon
the technical staff of line departments and support the SMSs at the provincial level,
and FSEWs at the district level for extension activities. The AEA consist of a
limited number of staff from the DOA, therefore is not capable of performing
extension activities for livestock, fishery, forestry and irrigation. National
Agriculture and Forestry Extension Services (NAFES) has been established in
August 2001 as a new extension organization that could cover all the sub-sectors of
agriculture in place of AEA.
Figure 3.2 NAFRI Organization ChartFigure 3.2 NAFRI Organization Chart
Source: MAF
3-32
The proposed extension system is to be based on farming group training and on-
farm demonstration activities through participatory planning with regular visits to
villages by FSEWs and SMSs. However, its system is not working well due to a
serious shortage of operation funds, equipment and qualified staff. In reality, the
FSEWs and SMSs are engaged only in administrative work.
Agricultural Statistics
Agricultural statistics are published annually by the MAF. The raw data are
collected by village chiefs under the guidance of DAFO’s staff and finally
processed by the DOP, MAF. The statistics include various data on crops, livestock,
forestry, meteorology and hydrology, irrigation, GDP, prices, exports and imports,
public and foreign investment. However, available data are still limited, for
example, the data detailed on horticulture crops are not included except as an
aggregated vegetable data. Various donors’ reports point out the existence of
considerable discrepanc ies between actual survey results and the statistics data.
There is a possibility of data being distorted through political bias at the local level.
For proper agriculture development planning, the supply of accurate data covering
wider fields is a prerequisite.
(6) Major Constraints and Development Potentials
The Study found considerable constraints to agricultural development. However, it
identified various development potentials, which augurs well for agriculture’s
future when these potentials are fully exploited and sustainably managed. These
constraints and potentials are briefly summarized below.
(a) Constraints to rice production
Lowland area :- farmers’ reluctance and/or insufficient extension in using improved
variety of rice seed;
- lack of knowledge about improved technologies including cropmaintenance, pest control, irrigation water management and poorextension services being only at the development stage;
- flood and inundation damage during the wet season in lowland areas;
- lack of access to credit for new investment and to obtain farm inputs;and
- predominance of low productivity labor-intensive farming.
Upland and mountain Area :- insufficient distribution of credit and fertilizer, especially in remote
areas;
3-33
- poor road access for purchasing inputs and selling products;
- low soil fertility in terms of physical and chemical properties;
- lack of technology for cultivating upland rice or alternative cropsincluding land preparation, crop maintenance, pests, and weed controlbecause of poor extension services;
- insufficient development of adaptive research for upland and mountainareas;
- lower productivity of upland rice under shifting cultivation;
- declining soil fertility, increasing water runoff and soil erosion undershifting cultivation; and
- large labor inputs due to manual practices in shifting cultivation.
(b) Constraints of commercial crop production- insufficient quality control and a lack of grading and classification
systems for commercial crop production;
- unavailability of improved varieties/hybrid seeds and plantingmaterials;
- lack of knowledge about improved technology including cropmaintenance, insect and pest control, irrigation water management ;
- insufficient development of adaptive research for integrated agriculturerelated to horticulture, livestock and fisheries;
- lack of access to credit and new investment;
- farmers’ reluctance to use fertilizers and agro-chemicals due to highcost compared to crop income;
- limited market channels and market information;
- decreasing price incentive for commercial crop cultivation due tofrequent oversupply in the domestic market and low internationalprices;
- limited or insufficient post harvest and agro-processing facilities forcommercial crops;
- limited availability of manpower or agriculture machinery for intensiveagriculture; and
- limited information on suitable crops to be introduced based on area-specific natural conditions.
(c) Development potential for rice production- improved varieties of rice have been developed by the Lao-IRRI
project;
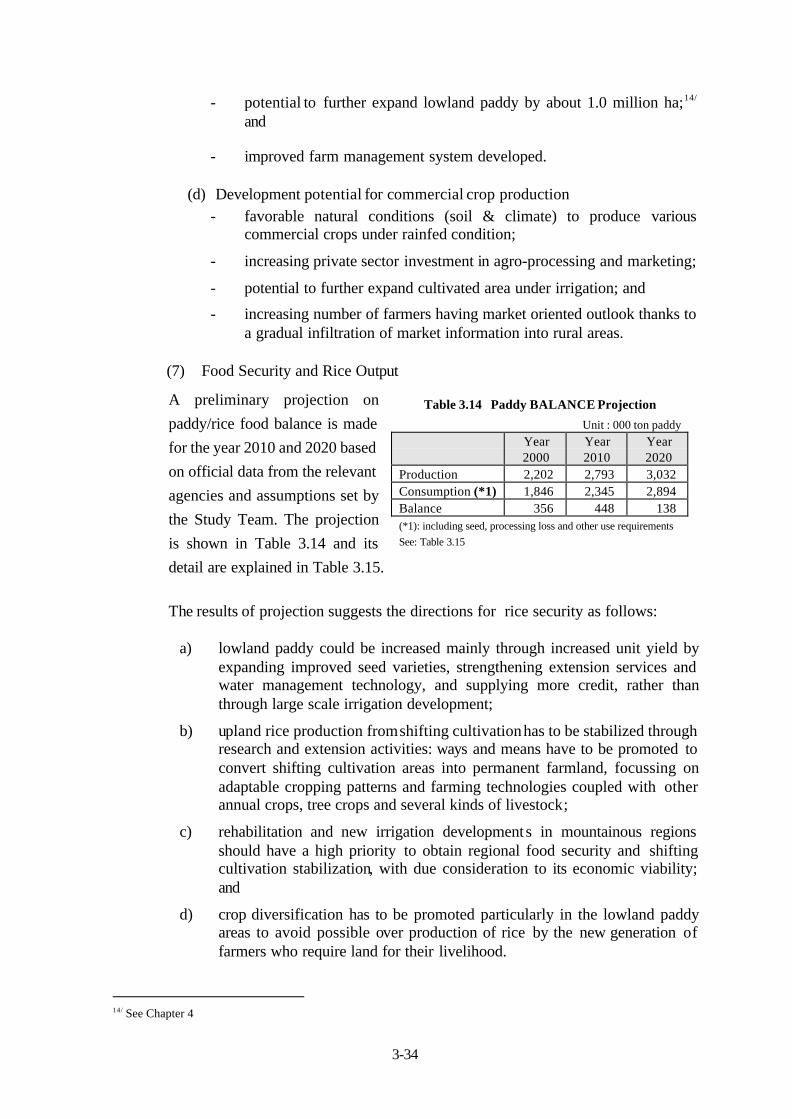
3-34
- potential to further expand lowland paddy by about 1.0 million ha;14/
and
- improved farm management system developed.
(d) Development potential for commercial crop production- favorable natural conditions (soil & climate) to produce various
commercial crops under rainfed condition;
- increasing private sector investment in agro-processing and marketing;
- potential to further expand cultivated area under irrigation; and
- increasing number of farmers having market oriented outlook thanks toa gradual infiltration of market information into rural areas.
(7) Food Security and Rice Output
A preliminary projection on
paddy/rice food balance is made
for the year 2010 and 2020 based
on official data from the relevant
agencies and assumptions set by
the Study Team. The projection
is shown in Table 3.14 and its
detail are explained in Table 3.15.
The results of projection suggests the directions for rice security as follows:
a) lowland paddy could be increased mainly through increased unit yield byexpanding improved seed varieties, strengthening extension services andwater management technology, and supplying more credit, rather thanthrough large scale irrigation development;
b) upland rice production from shifting cultivation has to be stabilized throughresearch and extension activities: ways and means have to be promoted toconvert shifting cultivation areas into permanent farmland, focussing onadaptable cropping patterns and farming technologies coupled with otherannual crops, tree crops and several kinds of livestock;
c) rehabilitation and new irrigation developments in mountainous regionsshould have a high priority to obtain regional food security and shiftingcultivation stabilization, with due consideration to its economic viability;and
d) crop diversification has to be promoted particularly in the lowland paddyareas to avoid possible over production of rice by the new generation offarmers who require land for their livelihood.
14/ See Chapter 4
Table 3.14 Paddy BALANCE Projection
Unit : 000 ton paddyYear2000
Year2010
Year2020
Production 2,202 2,793 3,032Consumption (*1) 1,846 2,345 2,894Balance 356 448 138(*1): including seed, processing loss and other use requirements
See: Table 3.15
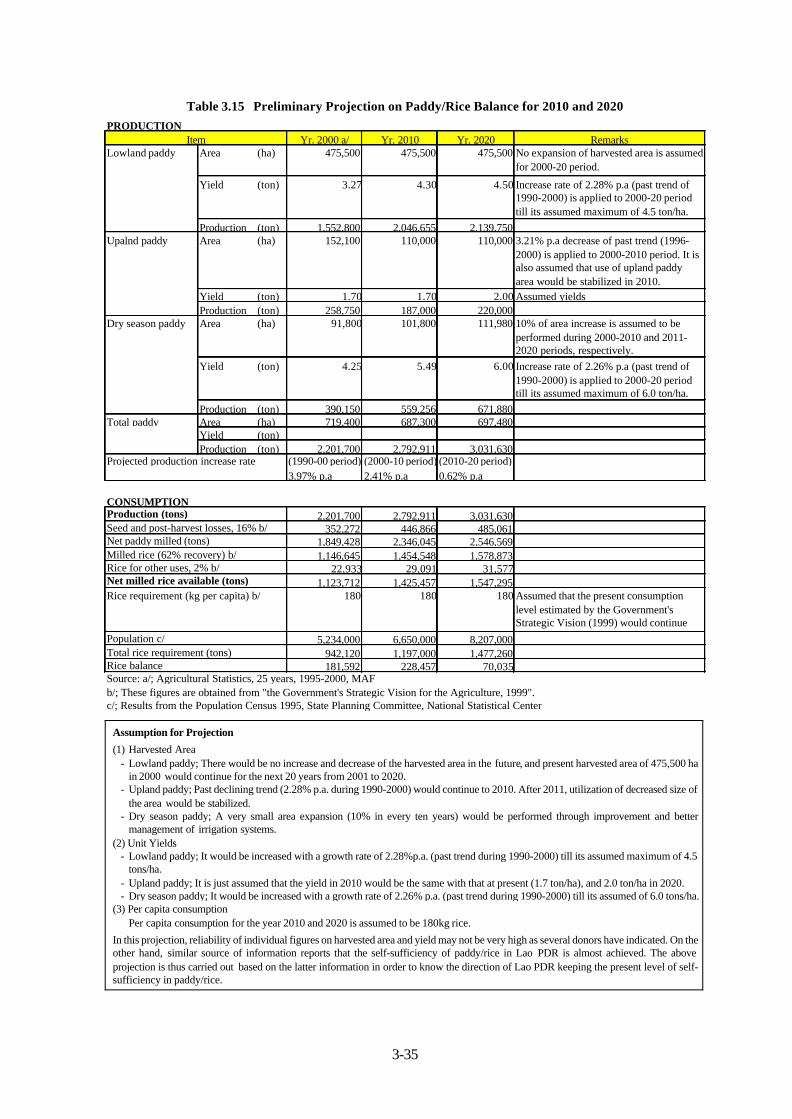
3-35
Table 3.15 Preliminary Projection on Paddy/Rice Balance for 2010 and 2020
Assumption for Projection
(1) Harvested Area- Lowland paddy; There would be no increase and decrease of the harvested area in the future, and present harvested area of 475,500 ha
in 2000 would continue for the next 20 years from 2001 to 2020.- Upland paddy; Past declining trend (2.28% p.a. during 1990-2000) would continue to 2010. After 2011, utilization of decreased size of
the area would be stabilized.- Dry season paddy; A very small area expansion (10% in every ten years) would be performed through improvement and better
management of irrigation systems.(2) Unit Yields
- Lowland paddy; It would be increased with a growth rate of 2.28%p.a. (past trend during 1990-2000) till its assumed maximum of 4.5tons/ha.
- Upland paddy; It is just assumed that the yield in 2010 would be the same with that at present (1.7 ton/ha), and 2.0 ton/ha in 2020.- Dry season paddy; It would be increased with a growth rate of 2.26% p.a. (past trend during 1990-2000) till its assumed of 6.0 tons/ha.
(3) Per capita consumptionPer capita consumption for the year 2010 and 2020 is assumed to be 180kg rice.
In this projection, reliability of individual figures on harvested area and yield may not be very high as several donors have indicated. On theother hand, similar source of information reports that the self-sufficiency of paddy/rice in Lao PDR is almost achieved. The aboveprojection is thus carried out based on the latter information in order to know the direction of Lao PDR keeping the present level of self-sufficiency in paddy/rice.
PRODUCTIONYr. 2000 a/ Yr. 2010 Yr. 2020 Remarks
Lowland paddy Area (ha) 475,500 475,500 475,500 No expansion of harvested area is assumedfor 2000-20 period.
Yield (ton) 3.27 4.30 4.50 Increase rate of 2.28% p.a (past trend of1990-2000) is applied to 2000-20 periodtill its assumed maximum of 4.5 ton/ha.
Production (ton) 1,552,800 2,046,655 2,139,750Upalnd paddy Area (ha) 152,100 110,000 110,000 3.21% p.a decrease of past trend (1996-
2000) is applied to 2000-2010 period. It isalso assumed that use of upland paddyarea would be stabilized in 2010.
Yield (ton) 1.70 1.70 2.00 Assumed yieldsProduction (ton) 258,750 187,000 220,000
Dry season paddy Area (ha) 91,800 101,800 111,980 10% of area increase is assumed to beperformed during 2000-2010 and 2011-2020 periods, respectively.
Yield (ton) 4.25 5.49 6.00 Increase rate of 2.26% p.a (past trend of1990-2000) is applied to 2000-20 periodtill its assumed maximum of 6.0 ton/ha.
Production (ton) 390,150 559,256 671,880Total paddy Area (ha) 719,400 687,300 697,480
Yield (ton)Production (ton) 2,201,700 2,792,911 3,031,630
Projected production increase rate (1990-00 period) (2000-10 period) (2010-20 period)3.97% p.a 2.41% p.a 0.62% p.a
CONSUMPTIONProduction (tons) 2,201,700 2,792,911 3,031,630Seed and post-harvest losses, 16% b/ 352,272 446,866 485,061Net paddy milled (tons) 1,849,428 2,346,045 2,546,569Milled rice (62% recovery) b/ 1,146,645 1,454,548 1,578,873Rice for other uses, 2% b/ 22,933 29,091 31,577Net milled rice available (tons) 1,123,712 1,425,457 1,547,295Rice requirement (kg per capita) b/ 180 180 180 Assumed that the present consumption
level estimated by the Government'sStrategic Vision (1999) would continueuntil 2020.Population c/ 5,234,000 6,650,000 8,207,000
Total rice requirement (tons) 942,120 1,197,000 1,477,260Rice balance 181,592 228,457 70,035Source: a/; Agricultural Statistics, 25 years, 1995-2000, MAFb/; These figures are obtained from "the Government's Strategic Vision for the Agriculture, 1999".c/; Results from the Population Census 1995, State Planning Committee, National Statistical Center
Item
3-36
(8) Prospects of Development of Commercial Crop
The Study supports the Strategic Vision’s approach to commercial agriculture. In
the flatlands, the approach is to improve and diversify farming systems with
increased and intensified cash crops, livestock and fishery production. While in the
sloping lands, farming systems diversification and agro-forestry should be
developed through adaptive research, trials and demonstrations on farmers’ fields.
The most important step for commercial agriculture is to promote crop
diversification in both flat and sloping lands. The main potential crops for
diversification identified through the M/P Study are as follows:
Field Crop
The recent high growth rate of the production reveals that maize, peanuts, soybean
and some root crops are strong candidates for diversification. In addition, the FAO
indicates15/ that sesame, soybean, sunflower, sorghum and safflower have a
comparative advantage. It is noted that some field crops are not only used as food
crops, but also as supplemental feed for livestock since the number of livestock is
increasing rapidly.
Fruit
A previous study pointed out that 50 fruit species can grow in Lao PDR (SIDA,
1998). However, Lao PDR is importing grapes, mandarin, apples, sapodilla,
oranges, durian, pummelo, lichee, rambutan, mangosteen, jujube, cashew, longan,
and tamarind. Most of these imported fruits can be produced in Lao PDR except
apple and should have a comparative advantage. Mango especially should be very
competitive, and DOA intends to promote it for export.
Vegetables
Various vegetables are cultivated mainly in the vicinity of large cities and town, and
production has been increasing rapidly. However, because the domestic market is
small, seasonal over supply and hence low market prices are widely observed. This
is because many farmers cultivate vegetables using home gardens, the river side and
irrigated areas. Therefore, the introduction of new techniques, especially the
adjustment of cropping patterns is necessary to stabilize the supply of vegetables all
year-round.
15/ Promoting Sustainable Rural Development - A Review of the Rural Sector, FAO, December 1999.
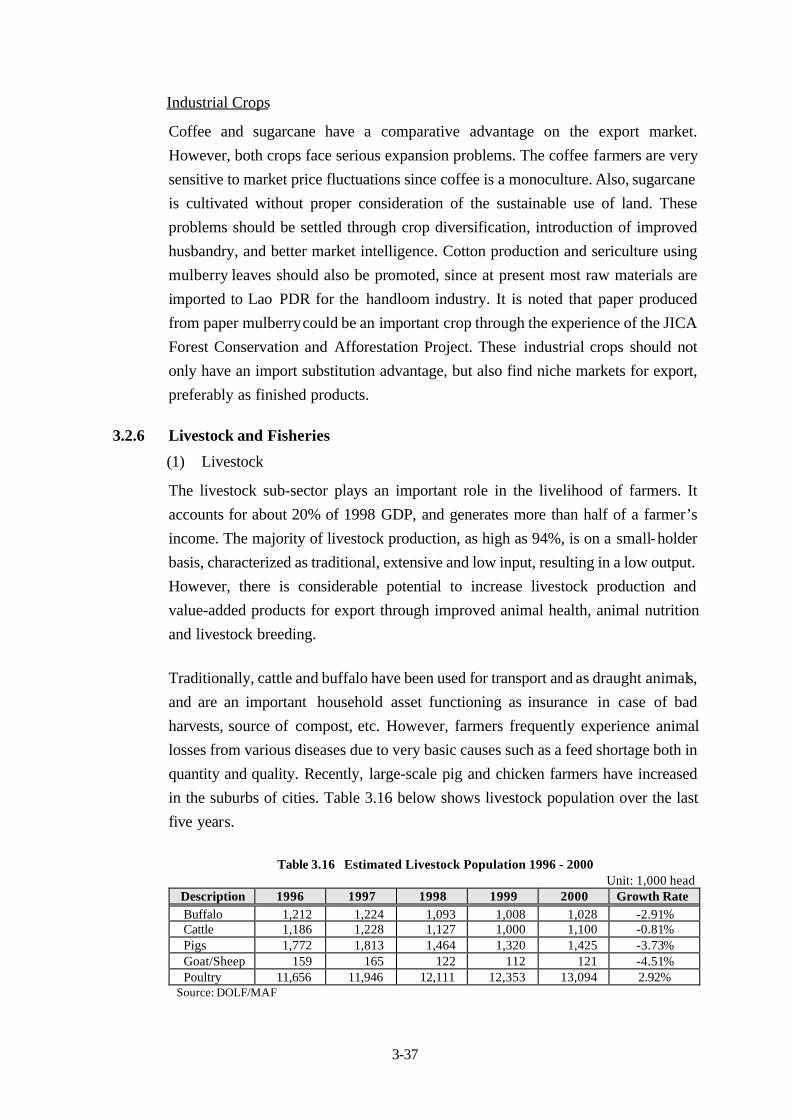
3-37
Industrial Crops
Coffee and sugarcane have a comparative advantage on the export market.
However, both crops face serious expansion problems. The coffee farmers are very
sensitive to market price fluctuations since coffee is a monoculture. Also, sugarcane
is cultivated without proper consideration of the sustainable use of land. These
problems should be settled through crop diversification, introduction of improved
husbandry, and better market intelligence. Cotton production and sericulture using
mulberry leaves should also be promoted, since at present most raw materials are
imported to Lao PDR for the handloom industry. It is noted that paper produced
from paper mulberry could be an important crop through the experience of the JICA
Forest Conservation and Afforestation Project. These industrial crops should not
only have an import substitution advantage, but also find niche markets for export,
preferably as finished products.
3.2.6 Livestock and Fisheries
(1) Livestock
The livestock sub-sector plays an important role in the livelihood of farmers. It
accounts for about 20% of 1998 GDP, and generates more than half of a farmer’s
income. The majority of livestock production, as high as 94%, is on a small-holder
basis, characterized as traditional, extensive and low input, resulting in a low output.
However, there is considerable potential to increase livestock production and
value-added products for export through improved animal health, animal nutrition
and livestock breeding.
Traditionally, cattle and buffalo have been used for transport and as draught animals,
and are an important household asset functioning as insurance in case of bad
harvests, source of compost, etc. However, farmers frequently experience animal
losses from various diseases due to very basic causes such as a feed shortage both in
quantity and quality. Recently, large-scale pig and chicken farmers have increased
in the suburbs of cities. Table 3.16 below shows livestock population over the last
five years.
Table 3.16 Estimated Livestock Population 1996 - 2000Unit: 1,000 head
Description 1996 1997 1998 1999 2000 Growth RateBuffalo 1,212 1,224 1,093 1,008 1,028 -2.91%Cattle 1,186 1,228 1,127 1,000 1,100 -0.81%Pigs 1,772 1,813 1,464 1,320 1,425 -3.73%Goat/Sheep 159 165 122 112 121 -4.51%Poultry 11,656 11,946 12,111 12,353 13,094 2.92%
Source: DOLF/MAF
3-38
The decrease in animal population except poultry from 1998 to 1999 compared to
1996 and 1997 was caused by an increased export to Thailand. This was because of
favorable export prices due to the devaluation of the kip.
Forty eight percent of farmers raise buffaloes with an average of 3.1 head per
household. For cattle and pigs, the respective figures are 31% of farmers with 4.8
head and 49% of farmers with 4.0 head. Animal feeding is traditional foraging
except for a few large-scale livestock farms near cities. Cattle, buffalo and goat feed
mainly on natural meadows, forests and the paddy fields after harvest. Ample
fodder is available in the rainy season, but it is lacking in the dry season, resulting in
poor nutrition, weight loss and deteriorating physical conditions as the dry season
proceeds. Thus, resistance to disease decreases. Poultry and pigs are raised nearly in
the wild state, but are fed with agricultural by-products and kitchen waste from time
to time.
Though there is no information on animal morbidity by disease, its rate is relatively
large. The Department of Livestock and Fisheries (DOLF), MAF, provides animal
health services through provincial and district livestock and fisheries offices. At the
village level, the district staff perform veterinary services in cooperation with
Village Veterinary Workers (VVWs). VVWs are not civil servants, and they receive
a fee from farmers for medicine, vaccination and treatment. Although Lao PDR has
an animal health service system, it is poorly financed and weak with respect to
(i) insufficient basic laws and regulations, (ii) lack of trained technicians, and
(iii) inadequate knowledge by farmers of animal health.
In addition, livestock hygienic legislation is inadequate in terms of the law
concerning the farm animal health, quarantine for importing and exporting farm
animals, and meat inspection. This will hamper future livestock expansion in future.
In this context, the DOLF has initiated improvement to farm animal health service
through a project entitled: “The Strengthening of Livestock Services and Extension
Activities” assisted by the EU, targeting the northern region. The MAF has a plan to
increase livestock production by 300% by the year 2020. This can be achieved in
two ways, one is to increase livestock raising by small holders. The other is to
expand and strengthen medium to large-scale production systems by overcoming
existing constraints and optimally utilizing Lao PDR’s competitive advantage as
outlined below.
Producer constraints
(a) High mortality rate from ordinary and epidemic diseases due to:
3-39
- lack of farmers’ knowledge on epidemic disease and a reluctance tohave animals vaccinated; and
- lack of feed in the dry season, resulting in a low resistance againstdisease.
(b) Low livestock productivity due to:
- extensive livestock raising without securing dry season feed; and
- lack of breeding systems.
Supporting services constraints
(c) Insufficient legal framework and related regulations on livestock such asveterinary laws, resulting in poor control systems for preventing epidemicdiseases, enforcing quarantines, controlling meat hygiene, and handlingveterinary drugs.
(d) Insufficient medical services against disease prevention and medicaltreatment due to:
- insufficient veterinary staff (Village Veterinary Workers : VVWs)combined with a lack of mobility;
- low technical level of VVWs; and
- insufficient supplies of veterinary drugs and equipment includingvaccines.
(e) Insufficient livestock extension staff, coupled with lack of competentextension professionals to demonstrate feeding control, grazing landmanagement, cultivation of fodder crops, feed storage, etc.
(f) Poor marketing and processing systems lacking market informationservices.
Competitive advantage
(g) Considerable potential grazing land suitable for livestock raising, especiallyin the Boloven and other plateaus.
(h) Many farmers familiar with animal feeding, though their present technicallevels are low.
(i) Sufficient grass and fodder grown in the rainy season for all year roundfeeding if it is properly stored.
(j) Large markets in the neighboring countries, demonstrated by theunauthorized trading of livestock from Lao PDR to neighboring countries.
(2) Fisheries
Fish are a major animal protein source for the Lao people, accounting for about
40% of total animal protein. However, there are few reliable statistics on the fishing
industry, and this is one of the constraints to fisheries development. Fish production
is increasing and it was assessed at 46,000 tons in 1998, consisting of 28,000 tons
(60%) of captured fish from the Mekong River and its tributaries, and the remaining
3-40
18,000 tons (40%) from aquaculture.16/ This production figure does not include all
the fish captured by individual farmers for self-consumption and its production
must be larger than 46,000 tons estimated above. Although data are unreliable, fish
production is increasing.
Inland aquaculture is classified into three types: (i) extensive aquaculture with low
fish density and no feeding; (ii) semi-intensive aquaculture with a small amount of
feeding; and (iii) intensive aquaculture with high fish density with feeding. Most
aquaculture, as much as 90%, is of the extensive and semi-intensive types. In recent
years, aquaculture has developed remarkably in the suburbs of major cities and
towns including Vientiane. Advanced aquaculture technologies, such as the cage
type in large-scale reservoirs and the pond type in irrigated paddy fields, are also
being introduced.
There are 22 national hatcheries in the country. Out of these, DOLF assigns the role
of “Central Fish Breeding Farm” to Nonteng Fish Breeding Farm in Vientiane. The
Farm not only produces and distributes fish fry, but also trains farmers, the private
sector, students and local government staff. These local government staff provide
farmers with technical guidance on aquaculture at the local level, but their
productivity remains low due to an absolute shortage of extension workers and their
proficiency.
The 1996 statistics indicates that the demand for fingerlings was 52 million, but the
actual supply was only 16 million or 30% of demand produced at 14 provincial and
private hatcheries. The deficit was made up by imports from Vietnam, China and
Thailand. Furthermore, the survival rate is low, being estimated at 15% from
hatcheries to farm gates, i.e. the survival rate from fries to fingerling is 30% and
then half of those that survive die during transportation to farm gate. It has been
estimated that improvements to technology etc. may make it possible to meet 90%
of requirements from existing public and private hatcheries. MAF has a plan to
increase fish production by 360% by the year 2020. In February 2001, the DOLF
started a project entitled “Aquaculture Improvement and Extension Project” with
technical assistance from JICA from February 2001. The project is based in the
newly established aquaculture center at Namxuoang in Vientiane. The project’s
main component are to improve seed production and train local extension workers.
16/ Mr. N. Morimoto, JICA Expert in Vientiane, 2000
3-41
Fisheries will be developed as a combination of rural based fish production for
self-consumption with commercial fish production mainly based in peri-urban areas.
However, there are many problems to be solved; these are:
- lack of DOLF promotion capacity due to a poor database, few staff, and alimited budget;
- lack of extension workers;
- poor economic infrastructure (road, communication and electricity) andlimited market;
- low technical level at hatcheries; and
- lack of a constant water supply due to deteriorated environmentalconditions in hilly and mountainous areas.
There are many limiting factors to expanding fish production as mentioned above
and it will take time to overcome such constraints. However, Lao PDR has various
comparative advantages, which should encourage the development of inland fish
production. These are:
- ample water resources;
- rural fish production integrated fully into the natural production cycle;
- increased consumption and market demand; and
- many farmers having considerable experience in rural based fishproduction.
3.2.7 Shifting Cultivation
(1) Current Conditions.
Shifting cultivation is a traditional upland cropping system whereby a piece of
primary or secondary forest, bamboo or bush is cleared and farmed until the soil
fertility is depleted, reducing labor productivity below a worthwhile level. The land
is then left to fully or partially regain its fertility through regeneration of the original
and/or new cover species. After this resting period, ranging from about 5 to 20 years,
the cycle is repeated. There are three types of shifting cultivation.
(1) A traditional swidden rotational system: In this system, the cycle rangesfrom about fifteen to twenty years. The cleared upland sloping area isfarmed for two to three years, either under rice or rice and maize etc. withthe last crop sometimes being cassava. This system is sustainable at lowpopulation densities with sufficient time in bush fallow to ameliorate soilfertility depleted in the cropping phase. As population densities increase,the rotation shortens to the point where the system may not be sustainable.
(2) A pioneering exploitive system: This pioneering form of shiftingcultivation is practiced in former opium poppy production areas. In these
3-42
areas the cleared land is continuously cropped until severely degraded afterwhich it is abandoned. The cultivators then move to a completely new forestarea to continue the cropping cycle. Imperata and other aggressive weedsand grasses invade abandoned areas. The land generally remains underthese species without the usual succession to bamboo, bush and then trees.
(3) A transitional shortening rotational system: This is a transition system tosedentary agriculture. In many areas because of the land allocation, tax andthe delineation of forest boundaries with village agreements, the shiftingcultivation cycle has been truncated to between four and six years. Thus, theland is cleared after only a three to five year’s rest and then put under riceand maize etc. for one or two years. Productivity is declining in these areasthrough soil degradation and erosion. Unless steps are taken, productivitywill continue to decline presenting serious livelihood problems for thecommunities in these areas.
The major shifting cultivation areas are in the northern provinces and in the eastern
parts of the southern provinces close to the Vietnamese border. Nationwide, the
current area under shifting cultivation, including some recently abandoned land, has
been estimated to be 680,000 ha i.e. about 3% of the country area. This does not
include the majority of fallow scrub and bush land within the shifting cultivation
cycle, which could amount to about an additional 2.5 million ha. Thus, the total area
being utilized for all forms of shifting cultivation is about 3.2 million ha. or 13% of
the land area.
The number of families practicing shifting cultivation in 2000 was about 340,000 or
2.06 million. This is 39% of the total population and 48% of the rural population.
Table 3.17 gives the 1982 and 1989 land use, by region with estimates for 2000.
From the above table it can be seen that cropland per capita is relatively constant in
each region, with a slight decline over time. However, changes over the last 10
years are leading to permanent and an increasing reduction in the length of fallow
period and a decline in the access to new forest land. These changes are due to:
increasing population pressure; establishment of NBCAs; Government rules and
regulations about fallow period duration; higher land taxes per unit area on shifting
cultivation land compared to permanent upland fields; and progressive land
allocation and village agreements on land use, forest boundaries and forest
conservation and management.
A number of past and on-going programs have been designed and implemented to
facilitate the stabilization of shifting cultivation through the development of
sustainable land-use systems incorporating conservation measures and a variety of
agro-forestry systems. The goal is to facilitate transformation from shifting
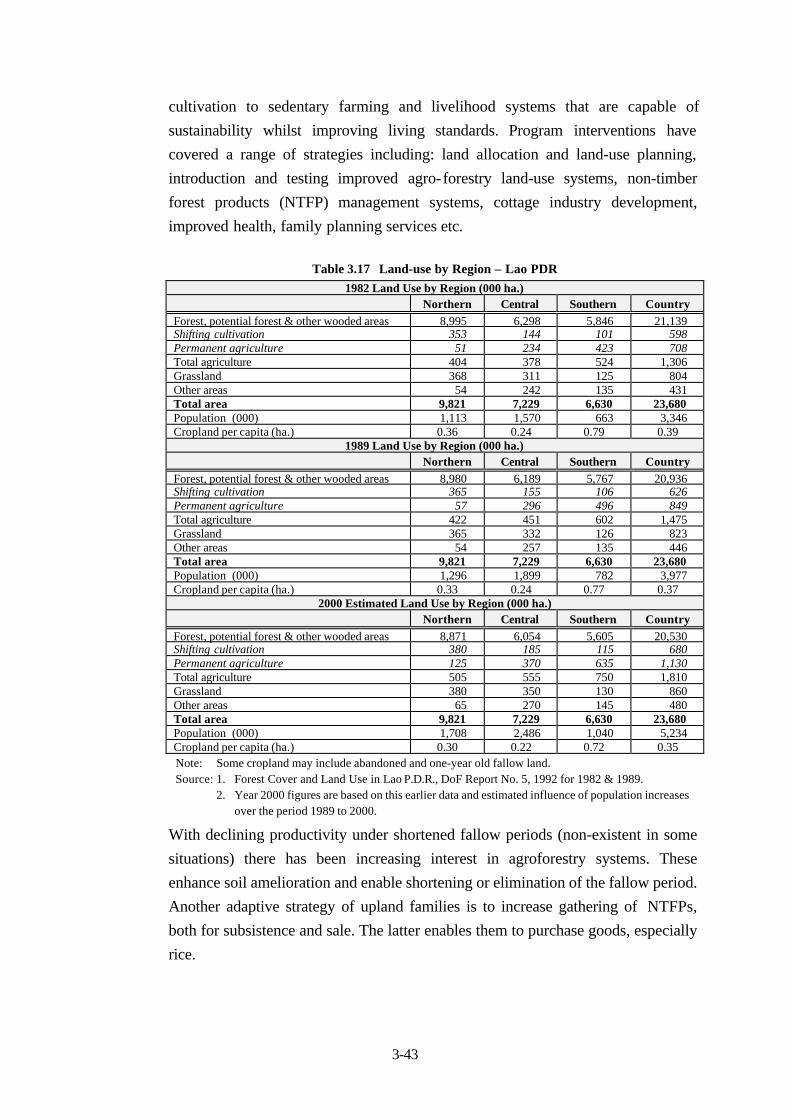
3-43
cultivation to sedentary farming and livelihood systems that are capable of
sustainability whilst improving living standards. Program interventions have
covered a range of strategies including: land allocation and land-use planning,
introduction and testing improved agro-forestry land-use systems, non-timber
forest products (NTFP) management systems, cottage industry development,
improved health, family planning services etc.
Table 3.17 Land-use by Region – Lao PDR1982 Land Use by Region (000 ha.)
Northern Central Southern CountryForest, potential forest & other wooded areas 8,995 6,298 5,846 21,139Shifting cultivation 353 144 101 598Permanent agriculture 51 234 423 708Total agriculture 404 378 524 1,306Grassland 368 311 125 804Other areas 54 242 135 431Total area 9,821 7,229 6,630 23,680Population (000) 1,113 1,570 663 3,346Cropland per capita (ha.) 0.36 0.24 0.79 0.39
1989 Land Use by Region (000 ha.)Northern Central Southern Country
Forest, potential forest & other wooded areas 8,980 6,189 5,767 20,936Shifting cultivation 365 155 106 626Permanent agriculture 57 296 496 849Total agriculture 422 451 602 1,475Grassland 365 332 126 823Other areas 54 257 135 446Total area 9,821 7,229 6,630 23,680Population (000) 1,296 1,899 782 3,977Cropland per capita (ha.) 0.33 0.24 0.77 0.37
2000 Estimated Land Use by Region (000 ha.)Northern Central Southern Country
Forest, potential forest & other wooded areas 8,871 6,054 5,605 20,530Shifting cultivation 380 185 115 680Permanent agriculture 125 370 635 1,130Total agriculture 505 555 750 1,810Grassland 380 350 130 860Other areas 65 270 145 480Total area 9,821 7,229 6,630 23,680Population (000) 1,708 2,486 1,040 5,234Cropland per capita (ha.) 0.30 0.22 0.72 0.35Note: Some cropland may include abandoned and one-year old fallow land.Source: 1. Forest Cover and Land Use in Lao P.D.R., DoF Report No. 5, 1992 for 1982 & 1989.
2. Year 2000 figures are based on this earlier data and estimated influence of population increasesover the period 1989 to 2000.
With declining productivity under shortened fallow periods (non-existent in some
situations) there has been increasing interest in agroforestry systems. These
enhance soil amelioration and enable shortening or elimination of the fallow period.
Another adaptive strategy of upland families is to increase gathering of NTFPs,
both for subsistence and sale. The latter enables them to purchase goods, especially
rice.
3-44
(2) Agro-forestry Land-uses/Systems
Agroforestry techniques have been employed in Laos throughout a range of
situations in both the traditional and later developed farming systems.
(a) Arable Systems - Woody perennial / annual crop associations
The swidden rotational shifting cultivation is a form of agro-forestry since crops
(predominately rice) are planted in rotation, over time, with bush fallow periods
of varying lengths. Improved fallow and/or alley cropping systems provide
potential to accelerate soil amelioration benefits from shortened fallow periods.
Without such systems mono-cropping on shortened rotation is not sustainable.
Examples are demonstrated at the Agro-forestry Research Station at Tong
Khang, Luang Prabang, which include cover crops of legumes after rice, alley
cropping within tree legumes along contours to control erosion and provide
mulching material to improve the soil.
(b) Taunga Systems - Tree crop/annual crop associations
These permanent systems are capable of stabilizing steeper slopes in shifting
cultivation areas and also have the potential to provide opportunities in other
agro-ecological areas. There are now many examples of these agroforestry
associations particularly in northern upland areas, such as: rice or maize/paper
mulberry and rattan; rice or maize/bamboo; rice or maize/styrax for resin &
wood production; rice or maize/teak; and pineapple/teak or fruit trees.
Within these systems there are many variations on the form of associations.
Some strategies seek to maintain the association continuously over time with
widely spaced rows or clumps of the woody species. Other systems, through
optimal planting of the woody species may only enable annual cropping for a
limited number of years. In these, crop yields decline as result of root
competition and canopy shading.
Styrax and Paper Mulberry/Crop associations in Houaphan and elsewhere are
established by encouraging the paper mulberry or styrax trees existing naturally
in fallow land. This is simply achieved by not cutting and burning them during
land preparation for rice or other crops.
(c) Pastoral systems
Transformation in shifting cultivation areas also involves improving livestock
forage and feed supply systems. Increasing population and animal protein
nutrition will increase demands for feed grains and crops. Ruminants will
3-45
require improved forages and non-ruminants will require more maize and other
feed. Thus to provide sufficient future feed, forage systems also need to be
developed.
Pastoral agroforestry systems provide benefits through increasing production
and nutritional value of forages for ruminants. This expands the foraging
capacity that can be sustained in grazing areas, and feed for non-ruminant
forests and fallow lands. Pasture legumes of stylo and centrocaema can be
seeded into grassland and bush lands along with introduction of bushy forage
species such as gliricidia, leucaena and calliandra.
(3) Non-Timber Forest Products (NTFPs)
A very diverse range of NTFPs are gathered and utilized for a variety of family
needs and also for sale. These form a major part of the overall livelihood system in
upland shifting cultivation areas. Up to 80% of family subsistence needs are
supplied by NTFPs. NTFPs also provide a large proportion of family cash income,
up to 55% in some cases. In addition, the forest is a major source of browse and
grazing for the animals owned by farmers, estimated to cover 5 to 10 million ha or
one-quarter to one-half of the total woody area.
In many locations, NTFPs are being over-exploited and depleted. Project work has
demonstrated the ability to improve management of NTFPs through participatory
extension and by involving village networks, where several villages access
common forest areas for NTFPs. Several NTFPs including: - paper mulberry,
mulberry (for silk production), cardamom, styrax resin (benzoin), rattan and
bamboo are being grown on farm with improved husbandry, providing increased
production and benefits. In addition to these, some wildlifes, fish and other water
animals, plant exudates, medical plants, spices/condiments and tree bark etc. are
also important NTFPs.
(4) Trees and their Importance and Potentials for Farm Families
As mentioned above, trees and forests are important components of the farming
system and are essential to livelihoods in shifting cultivation areas. They supply
fuel, building materials, food and many other NTFPs. They also contribute the bulk
of grazing and browse to farm animals and are a significant source of non-farm
income for rural people.
Many forests are in areas of outstanding natural beauty with many rural people
living in or near these areas. There is a considerable tourist potential to develop
3-46
these areas, especially the 20 NBCAs. This may be one of the best ways to protect
the NBCAs as the local people will be involved in managing them for their own
economic benefit. While forest trees supply most of the products that farmers
require, trees outside the forest, especially trees on-farm, are becoming more
important. Most arable and pastoral farming systems have trees as an integral
component, the exception being lowland paddy production.
Through the efforts of many projects and several other private and public initiatives,
planting trees on farm has increased. Agro-forestry initiatives are dealt with
elsewhere in this report, but the planting of trees, bamboo and bushes for food, fruit,
nuts, raw silk, paper bark, poles and timber is gaining momentum, especially where
there is a developed market for these products. The Government and donors are
encouraging tree planting. In the Forest Laws tree planting is promoted through
various incentives, regulations. There is also an annual National Tree Planting Day
on the first of June every year, when tree planting is encouraged by all the
population. On the other hand, there are regulations in the Forest Laws, which
inhibit the planting of trees through controls and other requirements. These laws,
whilst principally established to cover the harvesting of forest trees and products are
also affect farmer initiated plantings on-farm.
The government program to encourage planting the equivalent of 0.5 million ha by
2020 provides opportunities to involve farm families in both the seedling
production and tree planting for the program. This is a long term effort which could
provide an increased income generating potential to farm families. About 50
million seedling will be required each year to fulfil this target. While there will be
some large government nurseries, there is also considerable scope for farmers to
participate. They could grow tree seedlings, on their own land, for sale to the
program. Additionally they could undertake seed and cuttings collection from
valuable indigenous trees for direct sale to the government program, or to grow in
their own nursery for later sale.
As discussed earlier, farm and forest trees also provide opportunities to establish
cottage industries. Some of these include sericulture, bamboo weaving, and paper-
making. There are many more cottage industries that have potential including:
apiculture (honey, wax and royal jelly), wooden handicraft products, lime burning,
brick/tile making, ceramic manufacture, food, fruit and fish processing etc. The
potential for all such small-scale industries requires investigation through
marketing studies and extension where promising opportunities are identified.
3-47
3.2.8 Marketing and Agro-processing
(1) Marketing
The present marketing of agricultural products still follows the traditional sales
pattern. The small-scale farmers bring fresh products to the local markets
immediately after harvesting. For medium to large-scale farmers, middlemen visit
individual households during the harvesting period and buy products including
paddy. Marketing of agricultural products is regionally confined and inter-regional
distribution is very rare except for certain kinds of fish and fruit. Therefore, market
prices vary significantly from region to region. Such regional unbalance is caused
by the fact that most farming families are engaged in subsistence agriculture in
fairly inaccessible areas. No large demand can be expected from urban areas, and
additionally there is lack of transportation, poor access roads, high transport costs,
and inter-regional transportation taxes.
Marketing of agricultural products
The State Foodstuff Company (SFC) or private middlemen visit farmers and
purchase paddy. Paddy is stored and milled as necessary before being shipped to
market, or supplied to military, police stations, and hospitals. The SFC, having a
large collecting capacity with storage facilities and rice mills, handles major part of
the rice in the market and the private middlemen share the rest. Rice is graded at the
milling stage and then it is shipped to market. Both the glutinous and non-glutinous
rice are classified into three grades.
Coffee is a representative commercial crop in Lao PDR. At present, about 15,000
tons are produced annually, and most of it is exported to the European and
Singapore markets (14,300 tons in 1999) through middlemen who are members of
“Laos Coffee Exporters’ Association” based in Pakse, Champassak Province.
However, its export price is about 10% lower than the international market price
due to poor quality and limited supplies. Other food crops are collected by traders
directly from farmers and sold to the retailers.
Marketing of livestock and fishes
Live cattle, buffalo, and pigs are collected from farmers by the SFC or individual
middlemen and transported to slaughterhouses. The SFC and individuals sell the
meat to the retail market, hotels, restaurants, hospitals, armed forces, and police
agencies. The 1999 statistics indicates that more than 13,000 live buffaloes and
cattle and 500 live pigs were exported to Thailand, however, it is said that 100,000
to 200,000 large animals were unofficially exported. Such large unofficial export is
considered to be caused by: a monopoly by a few traders who have exporting
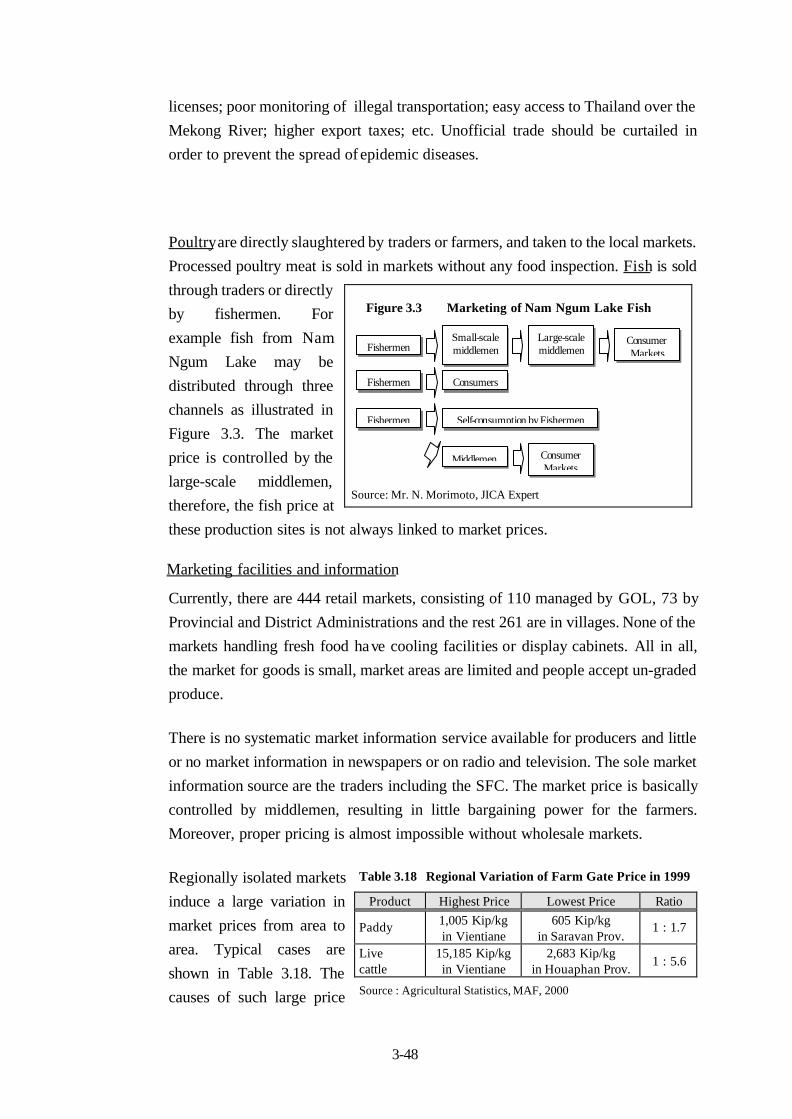
3-48
licenses; poor monitoring of illegal transportation; easy access to Thailand over the
Mekong River; higher export taxes; etc. Unofficial trade should be curtailed in
order to prevent the spread of epidemic diseases.
Poultry are directly slaughtered by traders or farmers, and taken to the local markets.
Processed poultry meat is sold in markets without any food inspection. Fish is sold
through traders or directly
by fishermen. For
example fish from Nam
Ngum Lake may be
distributed through three
channels as illustrated in
Figure 3.3. The market
price is controlled by the
large-scale middlemen,
therefore, the fish price at
these production sites is not always linked to market prices.
Marketing facilities and information
Currently, there are 444 retail markets, consisting of 110 managed by GOL, 73 by
Provincial and District Administrations and the rest 261 are in villages. None of the
markets handling fresh food have cooling facilities or display cabinets. All in all,
the market for goods is small, market areas are limited and people accept un-graded
produce.
There is no systematic market information service available for producers and little
or no market information in newspapers or on radio and television. The sole market
information source are the traders including the SFC. The market price is basically
controlled by middlemen, resulting in little bargaining power for the farmers.
Moreover, proper pricing is almost impossible without wholesale markets.
Regionally isolated markets
induce a large variation in
market prices from area to
area. Typical cases are
shown in Table 3.18. The
causes of such large price
Fishermen
Fishermen Consumers
Middlemen
Fishermen Self-consumption by Fishermen
ConsumerMarkets
Small-scalemiddlemen
Large-scalemiddlemen
ConsumerMarkets
Figure 3.3 Marketing of Nam Ngum Lake Fish
Table 3.18 Regional Variation of Farm Gate Price in 1999
Product Highest Price Lowest Price Ratio
Paddy 1,005 Kip/kgin Vientiane
605 Kip/kgin Saravan Prov.
1 : 1.7
Livecattle
15,185 Kip/kgin Vientiane
2,683 Kip/kgin Houaphan Prov.
1 : 5.6
Source : Agricultural Statistics, MAF, 2000
Source: Mr. N. Morimoto, JICA Expert
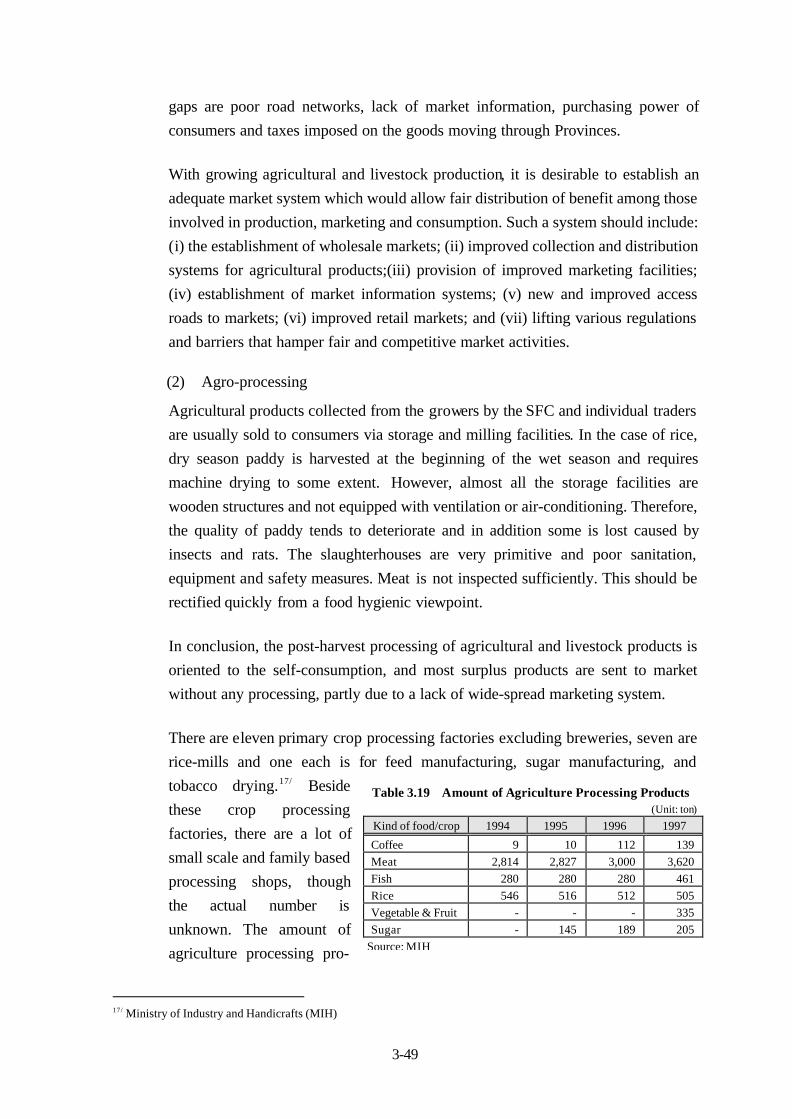
3-49
gaps are poor road networks, lack of market information, purchasing power of
consumers and taxes imposed on the goods moving through Provinces.
With growing agricultural and livestock production, it is desirable to establish an
adequate market system which would allow fair distribution of benefit among those
involved in production, marketing and consumption. Such a system should include:
(i) the establishment of wholesale markets; (ii) improved collection and distribution
systems for agricultural products;(iii) provision of improved marketing facilities;
(iv) establishment of market information systems; (v) new and improved access
roads to markets; (vi) improved retail markets; and (vii) lifting various regulations
and barriers that hamper fair and competitive market activities.
(2) Agro-processing
Agricultural products collected from the growers by the SFC and individual traders
are usually sold to consumers via storage and milling facilities. In the case of rice,
dry season paddy is harvested at the beginning of the wet season and requires
machine drying to some extent. However, almost all the storage facilities are
wooden structures and not equipped with ventilation or air-conditioning. Therefore,
the quality of paddy tends to deteriorate and in addition some is lost caused by
insects and rats. The slaughterhouses are very primitive and poor sanitation,
equipment and safety measures. Meat is not inspected sufficiently. This should be
rectified quickly from a food hygienic viewpoint.
In conclusion, the post-harvest processing of agricultural and livestock products is
oriented to the self-consumption, and most surplus products are sent to market
without any processing, partly due to a lack of wide-spread marketing system.
There are eleven primary crop processing factories excluding breweries, seven are
rice-mills and one each is for feed manufacturing, sugar manufacturing, and
tobacco drying.17/ Beside
these crop processing
factories, there are a lot of
small scale and family based
processing shops, though
the actual number is
unknown. The amount of
agriculture processing pro-
17/ Ministry of Industry and Handicrafts (MIH)
Table 3.19 Amount of Agriculture Processing Products(Unit: ton)
Kind of food/crop 1994 1995 1996 1997
Coffee 9 10 112 139Meat 2,814 2,827 3,000 3,620Fish 280 280 280 461Rice 546 516 512 505Vegetable & Fruit - - - 335Sugar - 145 189 205
Source: MIH
3-50
ducts is shown in Table 3.19.
As for the handicraft industry sector, traditional products such as silk, cotton,
bamboo work, etc. enjoy increasing demand as souvenirs by tourists. Silk products,
particularly dyed with natural materials, appeals to tourist with its simple but exotic
design. Such silk products can be produced in slack periods and provide valuable
cash income to farmers. However, the domestic production of silk yarn is in short
supply, and weavers have to rely on imported material from Vietnam and Thailand,
reducing their profit margin. Thus, production of sufficient raw material is a key
issue for this sector.
At present, household industries predominate in the processing of agricultural, fish
and livestock products. The introduction of large scale processing is constrained by
difficulties of a stable supply of materials through the year. Such large scale
processing industries should be considered in parallel with the development of
markets for products and establishment of production areas for raw materials. For
the time being, small scale and rural agro-processing industry, should be promoted.
3.2.9 Rural Finance
(1) Overall Situation
The UNDP/UNCDF Rural Household Finance Survey conducted in 1996 was the
first attempt to gain an understanding of the financial practices in urban, rural and
semi rural areas. It also provided a comprehensive understanding of the state of
savings and loan activities throughout rural areas.
Rural households are engaged in a range of creative techniques for rural savings but
were virtually uninvolved in access to formal and informal depository services.
While over 9 out of 10 households had some financial savings, only one percent had
depository accounts. At the same time, only 11% of rural households were engaged
in any form of borrowing, despite evident needs for working capital. There is
therefore a problem of the un-monetized status of the bulk of the rural poor. The
large number of projects has not addressed this problem of the inability of the
economy to convert the widely distributed savings into capital as they lack deposit
mobilization mechanisms.
In the formal financial sector, the State Owned Commercial Banks (SOCBs) are
neither extending large services to the rural areas nor providing products tailored to
the needs of the farming population. While most farmers in rural areas had some
level of assets for collateral, activities to convert assets into loan security remain
3-51
extremely limited, with the value of outstanding loans in rural areas averaging only
10% of household physical asset values.
Donors and NGO’s are practicising a range of unsustainable financial activities.
Each project has its own largely unsustainable approach to lending. Most of these
programs lack monitoring and information management systems for their
portfolios; introduce loan interest and deposit rates (if any) that deplete capital
resources; and include only infrequent activities to generate financial resources by
encouraging financial savings deposits. In addition, there is a low level of financial
skills and accountability.
(2) Rural Savings and Non-Institutional Credit
The Household Finance Survey revealed that there is a very broad distribution of
savings throughout the rural population. Savings strategies are both financial and
non-financial and about 91% of all households had financial savings, while 92% of
all households had non-financial savings (mainly in the form of non-producing
livestock and precious metals). There is a very low level of depository mobilization
by both formal and informal sectors and these savings are rarely converted into
deposits. The survey also revealed that less than 1% of rural households held bank
deposits, 1% is held in informal group deposits, 11% is held in cash, 14% as
precious metals and 74% of savings was represented as the net value of livestock.
The total rural savings was estimated at about US$ 55.0 million in 1996.
An informal credit market finances the rural sector, like in many other developing
countries. The primary source of credit to rural households was family, friends and
lending households (33%), especially for those far from roads and more remote
areas. The loan size is small with many of the loans for consumption purposes
between planting and harvesting and this accounted for almost one half of
household debt. Many of these loans do not carry an explicit interest rate and were
obtained without collateral for short-term purposes. Informal institutions accounted
for only 15% of lending. Suppliers of inputs and moneylenders are an unimportant
source of loans for farmers. Where they operate, interest charged range from 42-
73% per annum. Farmers approach these sources mainly for household emergencies
and day to day survival needs. Banks are often located in provincial capitals and are
often very distant from most villages. The survey revealed a low level of debt to
assets and that 11% of rural households had some form of debt and the debt to assets
ratio was about 9.5%. About 8% of rural households borrowed to buy fixed assets
and 13% borrowed for working capital.
3-52
Village Revolving Funds (VRFs)
Informal and semi-informal institutions also includes ‘Village Revolving Fund’
(VRF) and rotating fund groups. VRF are local village institutions and VRF loans
cover about 15% of all rural villages and have grown rapidly in the last ten years.
They operate outside the formal financial sector and are not taxed or regulated.
There are about 1,640 VRFs throughout Lao PDR. In general, these locally
implemented funds are rooted in some form of financial or commodity (non-
financial) lending with a plan for repayment, and support either income generation,
food security or improved production for consumption or sale. This is mainly in
keeping with the non-monetized nature of the rural economic activity. VRFs are
locally managed groups and operate between social and financial organizations.
VRFs are generally financed by donors or NGO’s and include over 1000 “rice
banks” (mainly from World Food Program (WFP) resources channeled through
international NGO’s). There are also many ‘livestock banks’ and revolving credit
funds that lend money, set up under integrated rural development projects. The Lao
Women’s Union is a frequently used intermediary by international donors and
NGO’s. Terms, conditions and other criteria and methods of loan disbursement vary
widely from one scheme to another and between donor and NGO operations.
Repayments are made in kind or cash, with or without interest, full or partial
principal repayment etc., Credit funds or commodities are often provided by donors
to Government and transferred to Provinces, then to districts and then to individual
VRFs.
Shortcomings of VRFs
Although they have assisted community development, VRFs do not provide
financial intermediation necessary to mobilize domestic resources. They do not
have a continued existence and are normally confined to the life of the project.
There is negligible financial reporting. Interest rates are well below market rates
with a high subsidy element. They are not conceived of as a financial institution and
lack the capacity, experience or trained personnel for financial intermediation.
Often, essential structural problems make VRFs financially unsustainable.
Deterioration of their financial positions result from asset atrophy, in part because
interest rates are below inflation rate and do not cover all costs. Capital depreciation
occurs faster if credit discipline is weak. Lack of financial reporting and monitoring
means, remedial action is difficult because potential losses are not detected at an
early stage. Despite these shortcomings, there are some promising VRFs that are
able to reach small borrowers because of their rural location, local ownership and
familiarity with village residents. There is a significant need to selectively upgrade
VRFs as potential credit and savings village banks.
3-53
The UNDP/CDF survey also inquired whether existing financial services met the
effective demand for credit. In respect of the rural areas, only 5% indicated that it
did. The primary reason for taking a loan was to cover emergencies or unforeseen
expenditure, while business was the next most important reason.
(3) Institutional Credit
There is limited bank outreach in relation to the number of rural households. Banks
tend to be fairly uniform in their loan terms and conditions. Interest is charged at
market rates except for agricultural loans by APB that are subsidized by
government. Banks generally require collateral, most often in the form of land or
housing. The process of expanding credit in the rural areas is not independent of the
formal banking system. Banks provide the mechanisms through which rural savings
are converted into financial deposits that become the capital base for investment.
This process of financial deepening and monetisation are two central components
of a sustainable financial (and microfinancial) service sector that can grow
independently over the long term. The SOCBs do not operate in the rural areas and
have no branch network to service the farming community. Furthermore, the APB
has also not successfully penetrated the rural sector as the coverage is limited. The
process of mobilization and re-circulation can be met by village banks or credit
unions models, but these have yet to evolve.
(4) The Banking Sector
The formal financial system consists of: (i) the Bank of Lao PDR (BOL); (ii) three
State Owned Commercial Banks (SOCBs); (iii) one specialized government-owned
bank (APB); (iv) two joint venture banks (Joint Development Bank & Vientiane
Commercial Bank); and (v) branches of several foreign banks.
Institutional credit has a relatively recent history and is in its early development
stage. Prior to 1988, the State Bank of Laos carried out both central bank and
commercial bank functions. The two tier-banking system was introduced in 1988
comprising the Bank of Lao PDR (BOL) and SOCBs.
SOCBs have now been in operation since 1993 and are in a weak financial position;
have limited expertise and staff; and a low level of savings and time deposits.
Commercial banking capacity, in particular credit and risk assessment skills, is
limited and weaknesses in central banking supervision and accounting standards
imply that information on the financial system is not readily available. Lack of
transparency, management deficiencies and weaknesses in corporate governance
contributed to a decline in confidence. SOCBs have been provided with technical
3-54
assistance and project loans by World Bank and ADB for a number of years. While
some progress has been made, fundamental changes are needed in several areas
such as: (i) corporate governance of SOCBs; (ii) substantive upgrading of
accounting standards and supervision capacity of the central bank; and (iii) changes
in regulatory policy to increase competition.
The BOL continues to play a very close participatory role in all the decisions of the
SOCBs including the appointment of managerial positions, the preparation of
financial statements and the finalization of annual reports. SOCBs are given greater
autonomy by Decree, however, the current status of SOCBs does not equip them to
play an effective role in providing credit to the commercial sectors or act as
intermediaries for a rural based micro-finance system. There are several reasons for
this predicament such as high transaction costs, limited outreach, lack of service
orientation, limited commercial banking skills and indirect control of interest rates,
all of which limit the formal banking system’s ability to support rural financial
system development.
(5) Agricultural Promotion Bank (APB)
The Government set up in June, 1993 the Agricultural Promotion Bank (APB) by
consolidating the agricultural loan portfolios and the staff of three of the seven
commercial banks. The Bank was initially set up with capital fixed at 1.0 billion Kip
with 80% held by the State and the remainder to be sold to the public. The sale has
yet to take place. Its capital including reserves at the end of 1999 is estimated at 9.1
billion Kip. APB is the main provider of rural finance apart from bilateral,
multilateral and international NGO funded projects. It is a specialized
government-owned bank, and is reported to serve 15% of all villages (about 3000)
containing 14% of all households (about 70,000).
The APB commenced lending in 1994, using group loan methodology with group
guarantee as collateral, which was a significant departure from the practice of the
SOCBs that required tangible assets. APB’s total outstanding loans in 1999 were
estimated at 92.0 billion Kip with short-term loans accounting for 60%. Of this, the
short-term loans for paddy accounted for 29% benefiting 15% of all villages.
Demand for cheaper loans outstrips supply and unsuccessful applicants turn to the
informal market.
The depository base of the Bank is quite low (around 40 billion Kip) and most of the
resources it on-lends (approximately 80%) is mainly provided by BOL and to a
smaller extent by other donor credit lines. These two sources account for over 90%
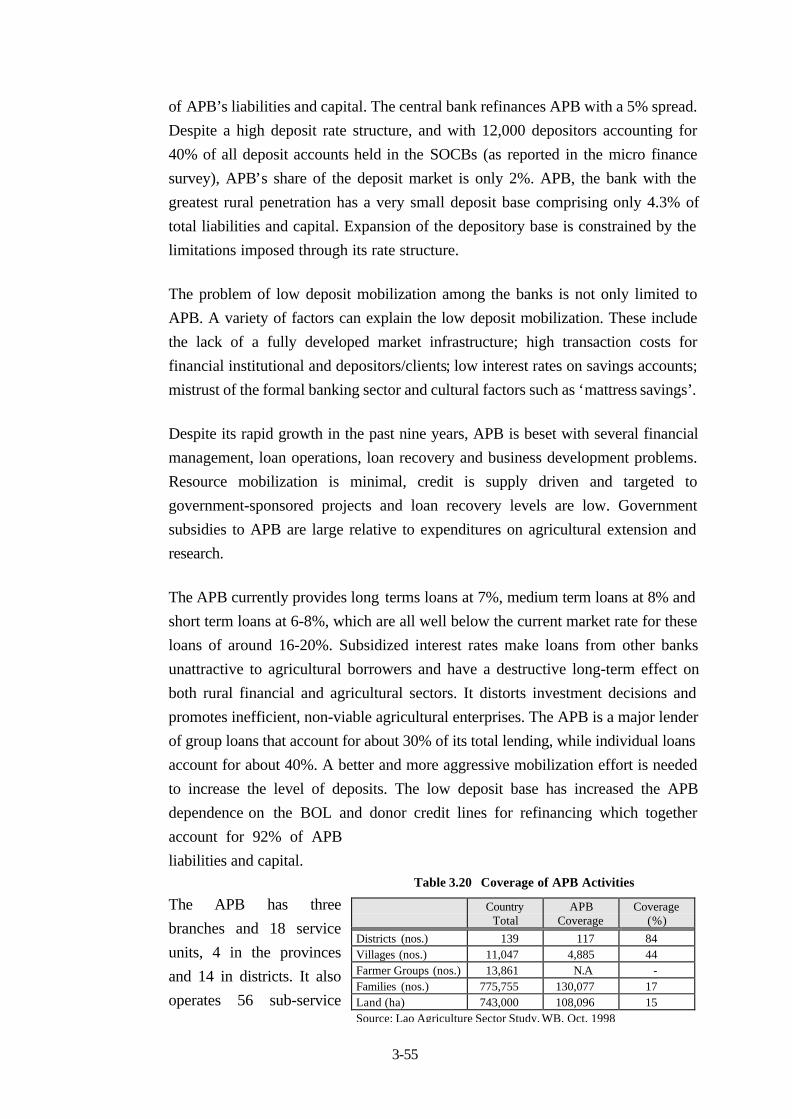
3-55
of APB’s liabilities and capital. The central bank refinances APB with a 5% spread.
Despite a high deposit rate structure, and with 12,000 depositors accounting for
40% of all deposit accounts held in the SOCBs (as reported in the micro finance
survey), APB’s share of the deposit market is only 2%. APB, the bank with the
greatest rural penetration has a very small deposit base comprising only 4.3% of
total liabilities and capital. Expansion of the depository base is constrained by the
limitations imposed through its rate structure.
The problem of low deposit mobilization among the banks is not only limited to
APB. A variety of factors can explain the low deposit mobilization. These include
the lack of a fully developed market infrastructure; high transaction costs for
financial institutional and depositors/clients; low interest rates on savings accounts;
mistrust of the formal banking sector and cultural factors such as ‘mattress savings’.
Despite its rapid growth in the past nine years, APB is beset with several financial
management, loan operations, loan recovery and business development problems.
Resource mobilization is minimal, credit is supply driven and targeted to
government-sponsored projects and loan recovery levels are low. Government
subsidies to APB are large relative to expenditures on agricultural extension and
research.
The APB currently provides long terms loans at 7%, medium term loans at 8% and
short term loans at 6-8%, which are all well below the current market rate for these
loans of around 16-20%. Subsidized interest rates make loans from other banks
unattractive to agricultural borrowers and have a destructive long-term effect on
both rural financial and agricultural sectors. It distorts investment decisions and
promotes inefficient, non-viable agricultural enterprises. The APB is a major lender
of group loans that account for about 30% of its total lending, while individual loans
account for about 40%. A better and more aggressive mobilization effort is needed
to increase the level of deposits. The low deposit base has increased the APB
dependence on the BOL and donor credit lines for refinancing which together
account for 92% of APB
liabilities and capital.
The APB has three
branches and 18 service
units, 4 in the provinces
and 14 in districts. It also
operates 56 sub-service
Table 3.20 Coverage of APB Activities
CountryTotal
APBCoverage
Coverage(%)
Districts (nos.) 139 117 84Villages (nos.) 11,047 4,885 44Farmer Groups (nos.) 13,861 N.A -Families (nos.) 775,755 130,077 17Land (ha) 743,000 108,096 15Source: Lao Agriculture Sector Study, WB, Oct. 1998
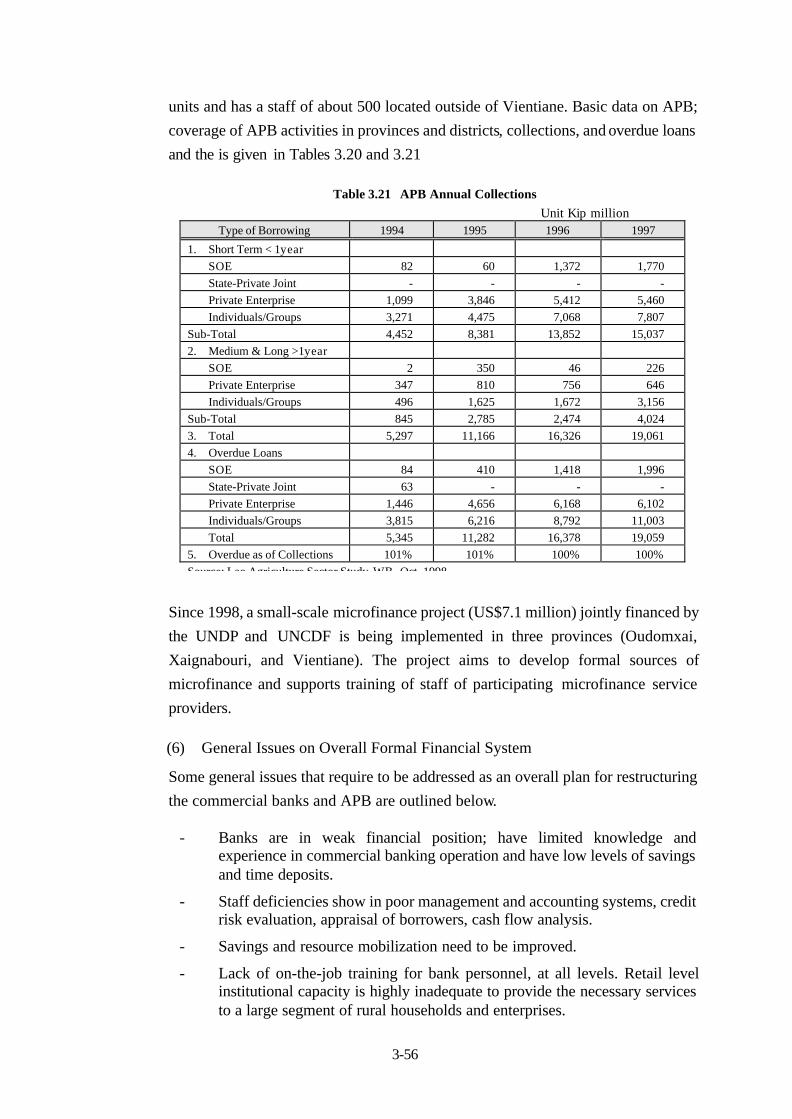
3-56
units and has a staff of about 500 located outside of Vientiane. Basic data on APB;
coverage of APB activities in provinces and districts, collections, and overdue loans
and the is given in Tables 3.20 and 3.21
Since 1998, a small-scale microfinance project (US$7.1 million) jointly financed by
the UNDP and UNCDF is being implemented in three provinces (Oudomxai,
Xaignabouri, and Vientiane). The project aims to develop formal sources of
microfinance and supports training of staff of participating microfinance service
providers.
(6) General Issues on Overall Formal Financial System
Some general issues that require to be addressed as an overall plan for restructuring
the commercial banks and APB are outlined below.
- Banks are in weak financial position; have limited knowledge andexperience in commercial banking operation and have low levels of savingsand time deposits.
- Staff deficiencies show in poor management and accounting systems, creditrisk evaluation, appraisal of borrowers, cash flow analysis.
- Savings and resource mobilization need to be improved.
- Lack of on-the-job training for bank personnel, at all levels. Retail levelinstitutional capacity is highly inadequate to provide the necessary servicesto a large segment of rural households and enterprises.
Table 3.21 APB Annual CollectionsUnit Kip million
Type of Borrowing 1994 1995 1996 1997
1. Short Term < 1yearSOE 82 60 1,372 1,770State-Private Joint - - - -Private Enterprise 1,099 3,846 5,412 5,460Individuals/Groups 3,271 4,475 7,068 7,807
Sub-Total 4,452 8,381 13,852 15,0372. Medium & Long >1year
SOE 2 350 46 226Private Enterprise 347 810 756 646Individuals/Groups 496 1,625 1,672 3,156
Sub-Total 845 2,785 2,474 4,0243. Total 5,297 11,166 16,326 19,0614. Overdue Loans
SOE 84 410 1,418 1,996State-Private Joint 63 - - -Private Enterprise 1,446 4,656 6,168 6,102Individuals/Groups 3,815 6,216 8,792 11,003Total 5,345 11,282 16,378 19,059
5. Overdue as of Collections 101% 101% 100% 100%Source: Lao Agriculture Sector Study. WB, Oct. 1998
3-57
- Government subsidizes agricultural credit, thus reducing budget deficitsand inflation.
- Lack of an institutional framework for non-bank intermediaries.
- Reforms required to drastically change APB policies and operations.
- Legal structures for bank transactions, contracts, collateral and securitiesare incomplete.
- Non-performing loans are eroding the capital base of SOCBs.
(7) Previous Assistance for Reform of the Banking System
Since the introduction of the two tier banking system, the ADB has been closely
associated with the reform of the financial system and has made many project loans
and provided 16 financial sector related technical assistance grants. The first
technical assistance grant was in 1988 and the First Financial Sector Program Loan
was in 1990. Following this, there were several technical assistance programs both
for the financial system in general, for reform or strengthening of SOCBs and the
APB. The World Bank too, assisted in improving the operational performance of
SOCBs and to improve the capacity of BOL to supervise and regulate SOCBs
through the Financial Sector Reform Project in 1998.
3.2.10 Rural Development
(1) Focal Site Approach to Rural Development
The National Rural Development Program (1996-2000) is now under
implementation through the focal site approach that was adopted in 1994 by the
government. Focal sites can be defined as “centers of change and learning” for the
rural development. The ultimate goal of rural development (through the focal site
approach) is poverty alleviation in remote and isolated areas. A bottom-up
participatory planning and implementation process was adopted for its development.
In order to achieve coordinated and cooperative joint programs between line
agencies at the national and provincial levels, a Central Leading Committee for
Rural Development (CLCRD) was established under the Prime Minister’s Office,
and in 1994 a Provincial Leading Committee for Rural Development (PLCRD) was
established in each province. The mandate and authority of PLCRD cover all
aspects of rural development in each province. The PLCRD is responsible for
overall rural development in the province, and in particular for the focal site areas.
The PLCRD coordinates the work of line ministries, while planning and
coordination outside the focal sites continue to be under the purview of the
Provincial Socio-Economic Plan, administered by the SPC. A Rural Development
Office at the central level and in each province has been established to assist
CLCRD and PLCRD in their work.
3-58
For focal site development, provinces submitted lists of potential areas (focal sites)
that were selected based on criteria proposed by the central government as follows:
(a) Urgency for poverty alleviation;- areas with isolated communities,- remote areas with difficult access,
- presence of malnutrition and illness,
- soil conservation problems, and- need to counter land degradation due to high incidence of slash-and-
burn agriculture,
(b) Potential areas justifying investments in view of creation of developmentpoles;
- availability of land resources, and
- possibility for irrigation accessibility,
(c) Risk areas with;- opium fields,
- UXO, and- flood hazards.
The 1996-2000 Rural Development Program planned to establish 87 focal sites
with an expected investment of kip 154 billion (kip 30.8 billion per year on average).
However, it is reported that the actual expenditure was quite small. All the works
for the focal site development were carried out by the CLCRD initiatives with only
local funds. Due mainly to this funding shortage, the focal sites were insufficiently
developed and only 59 focal sites are now operational as of February 2001. The
number of villages involved in the 59 focal sites is 948 with a population of 321,800
as shown in Table 3.22.
Major works for the focal site establishment were rural infrastructure
development/improvement. Based on area specific conditions, these include
irrigation facilities, school buildings, health facilities, feeder roads, water supply
facilities, etc. However, it is likely that the bottom up participatory planning process
and capacity building of relevant staff have not been fully adopted in the
implementation process.
Beside the above 59 focal sites, similar rural development activities are being
carried out directly by provincial governments using their own funds or funds
allocated from central government. Foreign assistance, including from NGOs, is of
considerable importance in these types of rural development activities.
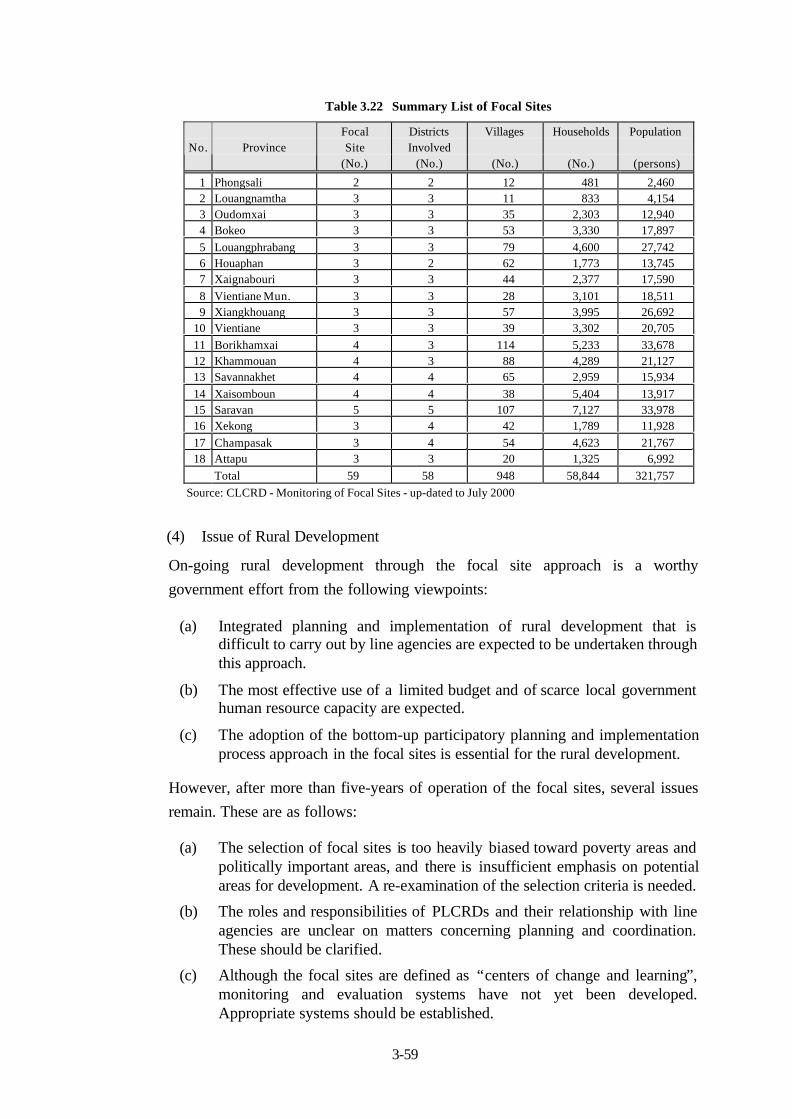
3-59
Table 3.22 Summary List of Focal Sites
FocalSite
DistrictsInvolved
Villages Households PopulationNo. Province
(No.) (No.) (No.) (No.) (persons)
1 Phongsali 2 2 12 481 2,4602 Louangnamtha 3 3 11 833 4,1543 Oudomxai 3 3 35 2,303 12,9404 Bokeo 3 3 53 3,330 17,8975 Louangphrabang 3 3 79 4,600 27,7426 Houaphan 3 2 62 1,773 13,7457 Xaignabouri 3 3 44 2,377 17,5908 Vientiane Mun. 3 3 28 3,101 18,5119 Xiangkhouang 3 3 57 3,995 26,692
10 Vientiane 3 3 39 3,302 20,70511 Borikhamxai 4 3 114 5,233 33,67812 Khammouan 4 3 88 4,289 21,12713 Savannakhet 4 4 65 2,959 15,93414 Xaisomboun 4 4 38 5,404 13,91715 Saravan 5 5 107 7,127 33,97816 Xekong 3 4 42 1,789 11,92817 Champasak 3 4 54 4,623 21,76718 Attapu 3 3 20 1,325 6,992
Total 59 58 948 58,844 321,757Source: CLCRD - Monitoring of Focal Sites - up-dated to July 2000
(4) Issue of Rural Development
On-going rural development through the focal site approach is a worthy
government effort from the following viewpoints:
(a) Integrated planning and implementation of rural development that isdifficult to carry out by line agencies are expected to be undertaken throughthis approach.
(b) The most effective use of a limited budget and of scarce local governmenthuman resource capacity are expected.
(c) The adoption of the bottom-up participatory planning and implementationprocess approach in the focal sites is essential for the rural development.
However, after more than five-years of operation of the focal sites, several issues
remain. These are as follows:
(a) The selection of focal sites is too heavily biased toward poverty areas andpolitically important areas, and there is insufficient emphasis on potentialareas for development. A re-examination of the selection criteria is needed.
(b) The roles and responsibilities of PLCRDs and their relationship with lineagencies are unclear on matters concerning planning and coordination.These should be clarified.
(c) Although the focal sites are defined as “centers of change and learning”,monitoring and evaluation systems have not yet been developed.Appropriate systems should be established.
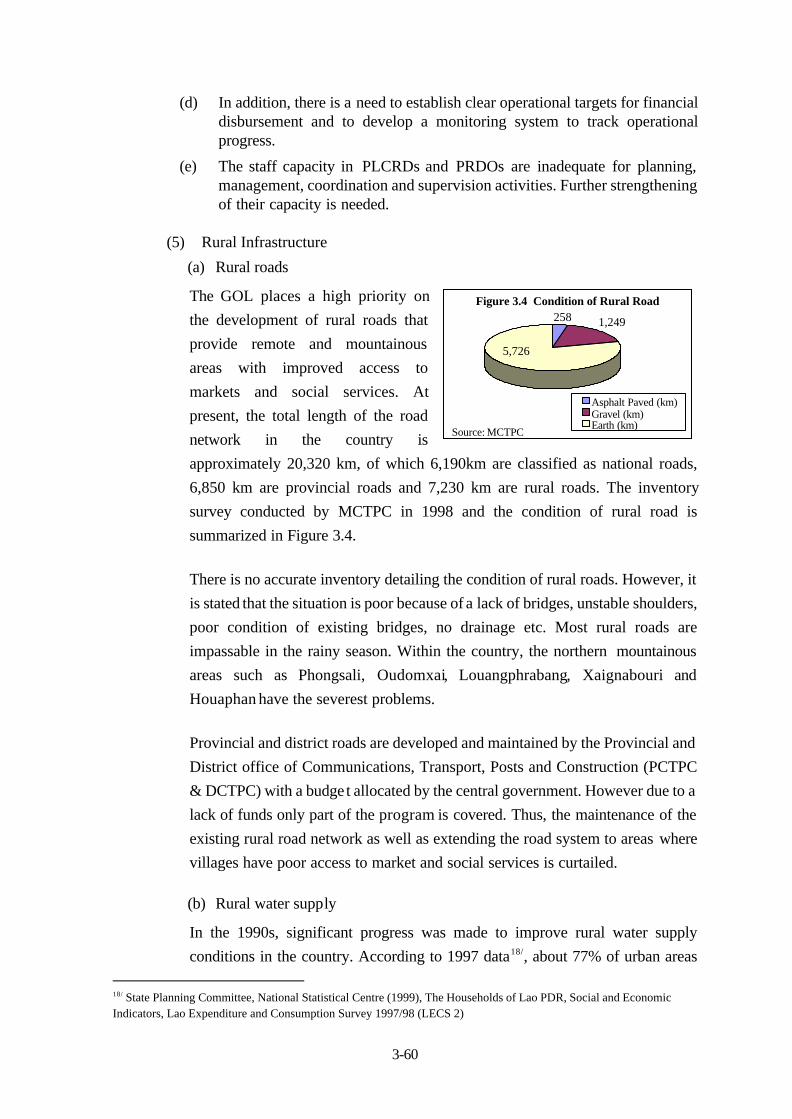
3-60
(d) In addition, there is a need to establish clear operational targets for financialdisbursement and to develop a monitoring system to track operationalprogress.
(e) The staff capacity in PLCRDs and PRDOs are inadequate for planning,management, coordination and supervision activities. Further strengtheningof their capacity is needed.
(5) Rural Infrastructure
(a) Rural roads
The GOL places a high priority on
the development of rural roads that
provide remote and mountainous
areas with improved access to
markets and social services. At
present, the total length of the road
network in the country is
approximately 20,320 km, of which 6,190km are classified as national roads,
6,850 km are provincial roads and 7,230 km are rural roads. The inventory
survey conducted by MCTPC in 1998 and the condition of rural road is
summarized in Figure 3.4.
There is no accurate inventory detailing the condition of rural roads. However, it
is stated that the situation is poor because of a lack of bridges, unstable shoulders,
poor condition of existing bridges, no drainage etc. Most rural roads are
impassable in the rainy season. Within the country, the northern mountainous
areas such as Phongsali, Oudomxai, Louangphrabang, Xaignabouri and
Houaphan have the severest problems.
Provincial and district roads are developed and maintained by the Provincial and
District office of Communications, Transport, Posts and Construction (PCTPC
& DCTPC) with a budge t allocated by the central government. However due to a
lack of funds only part of the program is covered. Thus, the maintenance of the
existing rural road network as well as extending the road system to areas where
villages have poor access to market and social services is curtailed.
(b) Rural water supply
In the 1990s, significant progress was made to improve rural water supply
conditions in the country. According to 1997 data18/, about 77% of urban areas
18/ State Planning Committee, National Statistical Centre (1999), The Households of Lao PDR, Social and EconomicIndicators, Lao Expenditure and Consumption Survey 1997/98 (LECS 2)
Figure 3.4 Condition of Rural Road
5,726
1,249258
Asphalt Paved (km)Gravel (km)Earth (km)
Source: MCTPC
3-61
and 62% of rural areas can get safe drinking water. However, it is clear that the
condition of the rural water supply is inadequate in several areas. In urban and
easily accessible areas the supply situation is comparatively advanced, but in
such areas as the northern mountainous areas it is retarded.
The National Center for Environment Health and Water Supply (NEW), under
the Ministry of Public Health, called “Nam Saat”, has direct responsibility for
promoting rural water supply. At present due to a weakness in the organizational
structure, the practical responsibilities for rural water supply lie with each
village authority and Nam Saat only provides partial assistance, when requested.
(c) Rural electrification
To achieve enhanced living conditions in remote areas through expanding
electrification, the GOL has adopted a two-dimensional approach to increase
distribution. One is to expand the grid to comparatively easily accessible areas
and the other is providing off-grid supply to remote areas, where grid expansion
is virtually impossible due to environmental or cost aspects. Presently 21 % of
households are provided with electricity from the grid. Specifically 10 % in rural
areas and 74% in urban areas are provided with grid electricity. A basic strategy
of GOL is to prioritize district headquarters followed by prioritized rural areas
for grid expansion. Much of the country’s economic activities are on the grid
and rural remote areas are left out. Therefore, in parallel with grid expansion,
sustainable electrification by off-grid systems will be promoted to improve rural
socio-economic conditions.
In 1999 a Rural Electrification Division was established under the Ministry of
Industry and Handicraft (MIH) to be administratively responsible for rural
electrification while Electricite du Lao (EDL) is practically in charge of rural
electrification development as a national enterprise.
(d) Development constraints
As in the irrigation sector, decentralization is under way. However decision-
making and budget allocations are inadequate. For instance, in the case of the
rural road sector, budget allocations are made from the central government
based on requests from local government for road construction, rehabilitation
and maintenance. Additionally there are no taxation rights given to the PCTPC
and DCTPC. Local government needs fiscal and administrative authority to
allocate public expenditure for rural roads, especially for maintenance. Lack of
technical staff in the rural administration is a common feature of the rural
3-62
infrastructure sector, hampering sustainable development and operations and
maintenance by local government and beneficiaries.
3.2.11 Irrigation
(1) Background
The history of Lao’s irrigation can be traced back some hundred years in the
northern mountainous areas. These irrigation systems are based on primitive water
intakes made by logs, soil and/or stones, and have been well managed by
communities. From the 1960’s, modern irrigation systems with concrete weirs and
well designed canals have been rapidly constructed with technical and financial
assistance from foreign donors. The irrigation developments in Lao PDR are
regionally classified into three types: (i) community managed gravity type
irrigation in northern mountainous areas with a range of service areas from 1 ha to
more than 300 ha; (ii) pump irrigation in the Vientiane plain; and (iii) recently
introduced pump irrigation along the Mekong River where most of the plain is
flood-prone.
In the 1990s the ADB and the Government of the Netherlands played an influential
role in the irrigation sector. Irrigation & water-related laws and strategy were
established through a series of assistance programs, which are now being followed
by GOL. Strengthening and Restructuring of Irrigation Development (SRIDP) and
Sustainable Irrigated Agriculture Project (SIRAP) aided by both agencies have
virtually established the present irrigation development policy. Basically, the
projects aimed to develop the irrigation sector through a combination of
institutional strengthening and rehabilitation of facilities by beneficiaries’
participation. The conclusion of both SRIDP and SIRAP are assimilated as part of
the Irrigation Management Transfer (IMT) program, which is now a key policy of
GOL in the irrigation sector. IMT is to transfer ownership of irrigation schemes so
that all the responsibility of operation and maintenance (O&M) activities are taken
over by beneficiary farmers, reducing the Government’s expenditure.
The irrigation sector has been given an important mandate to achieve national food
security. In 1997, the Government initiated a drastic measure to increase rice
production by distributing a number of irrigation pumps in the lowland paddy areas,
called “National Pump Installation and Management Project” (NPIMP). The pumps
installed by 2000 amounted to more than 7,000 units. This project boosted the
paddy production remarkably, from about 1.4 million tons in 1996 to 2.2 million
tons in 2000, thanks to the increased irrigated crops in the dry season. The
Government declared food self-sufficiency in 2000.
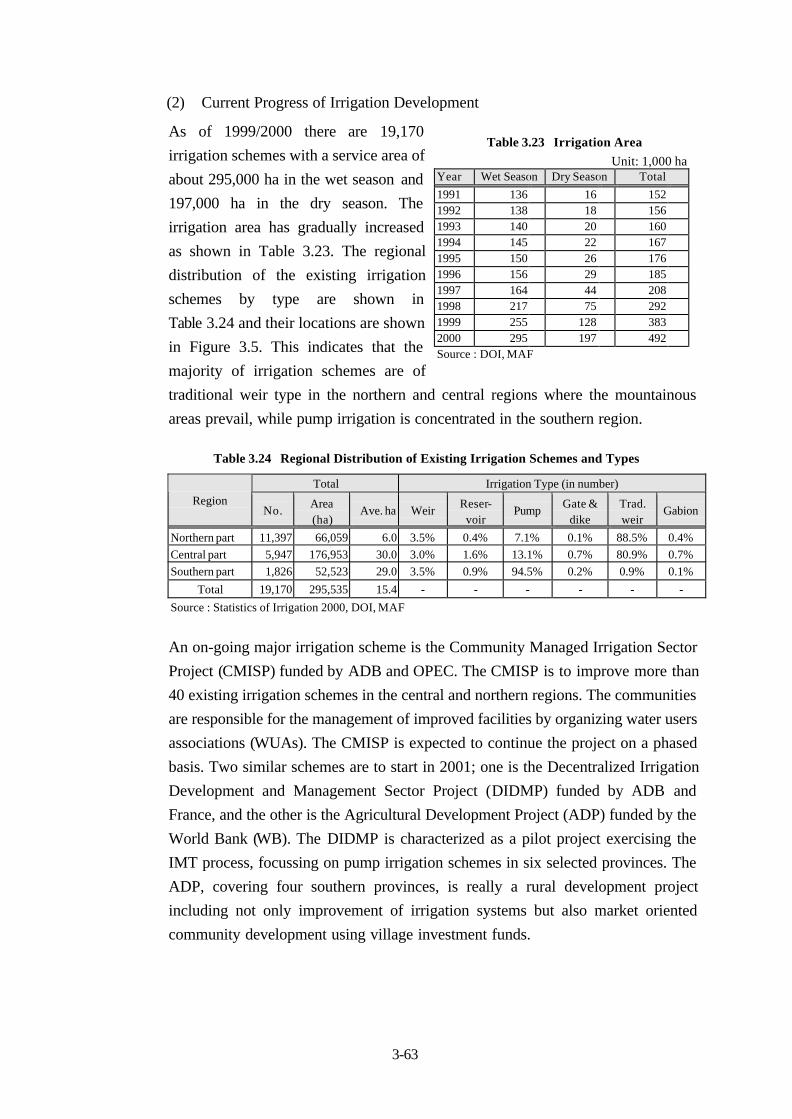
3-63
(2) Current Progress of Irrigation Development
As of 1999/2000 there are 19,170
irrigation schemes with a service area of
about 295,000 ha in the wet season and
197,000 ha in the dry season. The
irrigation area has gradually increased
as shown in Table 3.23. The regional
distribution of the existing irrigation
schemes by type are shown in
Table 3.24 and their locations are shown
in Figure 3.5. This indicates that the
majority of irrigation schemes are of
traditional weir type in the northern and central regions where the mountainous
areas prevail, while pump irrigation is concentrated in the southern region.
Table 3.24 Regional Distribution of Existing Irrigation Schemes and Types
Total Irrigation Type (in number)Region
No.Area(ha)
Ave. ha WeirReser-voir
PumpGate &
dikeTrad.weir
Gabion
Northern part 11,397 66,059 6.0 3.5% 0.4% 7.1% 0.1% 88.5% 0.4%Central part 5,947 176,953 30.0 3.0% 1.6% 13.1% 0.7% 80.9% 0.7%Southern part 1,826 52,523 29.0 3.5% 0.9% 94.5% 0.2% 0.9% 0.1%
Total 19,170 295,535 15.4 - - - - - -
Source : Statistics of Irrigation 2000, DOI, MAF
An on-going major irrigation scheme is the Community Managed Irrigation Sector
Project (CMISP) funded by ADB and OPEC. The CMISP is to improve more than
40 existing irrigation schemes in the central and northern regions. The communities
are responsible for the management of improved facilities by organizing water users
associations (WUAs). The CMISP is expected to continue the project on a phased
basis. Two similar schemes are to start in 2001; one is the Decentralized Irrigation
Development and Management Sector Project (DIDMP) funded by ADB and
France, and the other is the Agricultural Development Project (ADP) funded by the
World Bank (WB). The DIDMP is characterized as a pilot project exercising the
IMT process, focussing on pump irrigation schemes in six selected provinces. The
ADP, covering four southern provinces, is really a rural development project
including not only improvement of irrigation systems but also market oriented
community development using village investment funds.
Table 3.23 Irrigation AreaUnit: 1,000 ha
Year Wet Season Dry Season Total
1991 136 16 1521992 138 18 1561993 140 20 1601994 145 22 1671995 150 26 1761996 156 29 1851997 164 44 2081998 217 75 2921999 255 128 3832000 295 197 492Source : DOI, MAF
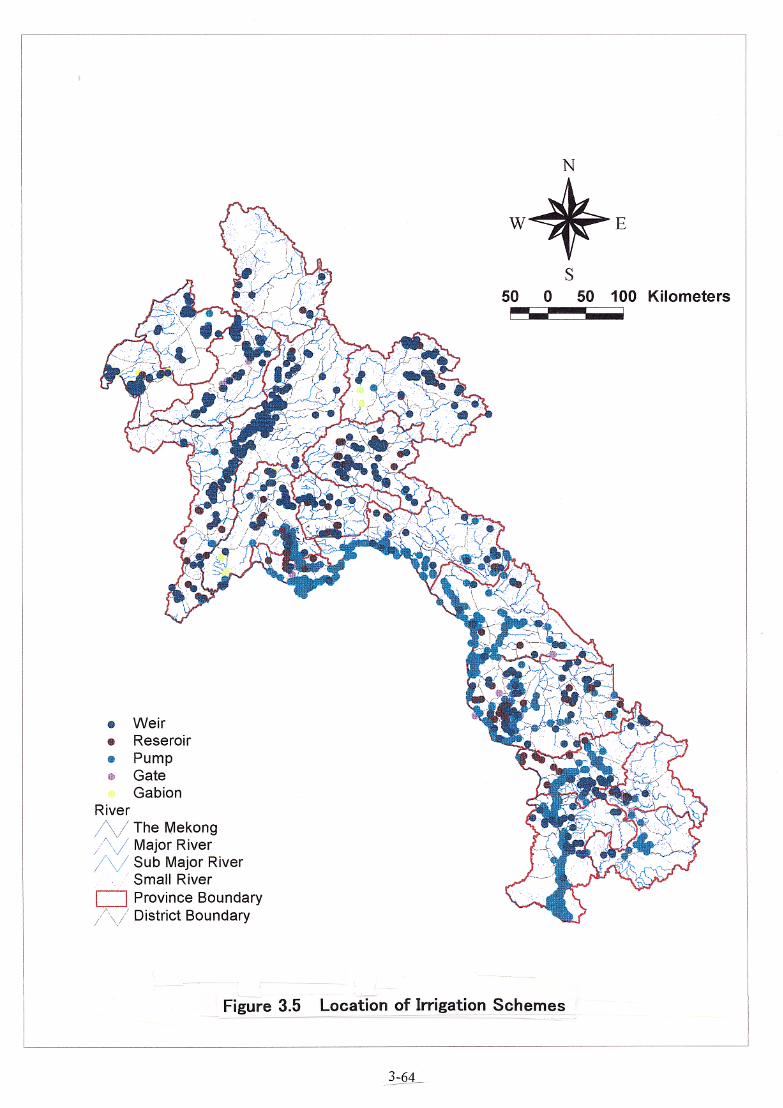
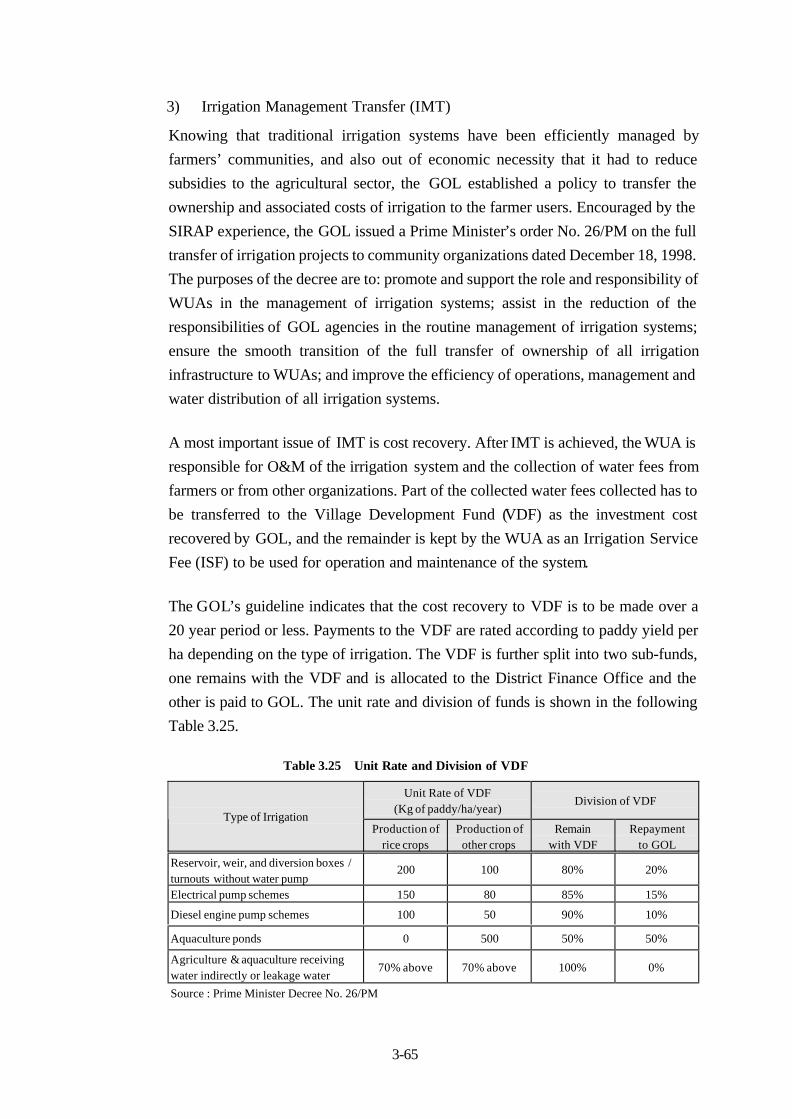
3-65
3) Irrigation Management Transfer (IMT)
Knowing that traditional irrigation systems have been efficiently managed by
farmers’ communities, and also out of economic necessity that it had to reduce
subsidies to the agricultural sector, the GOL established a policy to transfer the
ownership and associated costs of irrigation to the farmer users. Encouraged by the
SIRAP experience, the GOL issued a Prime Minister’s order No. 26/PM on the full
transfer of irrigation projects to community organizations dated December 18, 1998.
The purposes of the decree are to: promote and support the role and responsibility of
WUAs in the management of irrigation systems; assist in the reduction of the
responsibilities of GOL agencies in the routine management of irrigation systems;
ensure the smooth transition of the full transfer of ownership of all irrigation
infrastructure to WUAs; and improve the efficiency of operations, management and
water distribution of all irrigation systems.
A most important issue of IMT is cost recovery. After IMT is achieved, the WUA is
responsible for O&M of the irrigation system and the collection of water fees from
farmers or from other organizations. Part of the collected water fees collected has to
be transferred to the Village Development Fund (VDF) as the investment cost
recovered by GOL, and the remainder is kept by the WUA as an Irrigation Service
Fee (ISF) to be used for operation and maintenance of the system.
The GOL’s guideline indicates that the cost recovery to VDF is to be made over a
20 year period or less. Payments to the VDF are rated according to paddy yield per
ha depending on the type of irrigation. The VDF is further split into two sub-funds,
one remains with the VDF and is allocated to the District Finance Office and the
other is paid to GOL. The unit rate and division of funds is shown in the following
Table 3.25.
Table 3.25 Unit Rate and Division of VDF
Unit Rate of VDF(Kg of paddy/ha/year)
Division of VDFType of Irrigation
Production ofrice crops
Production ofother crops
Remainwith VDF
Repaymentto GOL
Reservoir, weir, and diversion boxes /turnouts without water pump
200 100 80% 20%
Electrical pump schemes 150 80 85% 15%
Diesel engine pump schemes 100 50 90% 10%
Aquaculture ponds 0 500 50% 50%
Agriculture & aquaculture receivingwater indirectly or leakage water
70% above 70% above 100% 0%
Source : Prime Minister Decree No. 26/PM
3-66
The above guidelines are still in draft form and are subject to further amendment.
The announcement by the Politburo in December 1999 suggested that for the time
being, all VDF collected by WUAs should remain at the local level and for the
exclusive use of the WUA.
ISF is to support the full funding of routine operations and maintenance costs. The
amount payable to ISF will vary from system to system depending on the type of
irrigation and site conditions. The WUA will set the rate of ISF on an annual basis
with the assistance of DAFO. The draft final report on the DIDMP estimates that
the ISF required ranges from US$25 to US$65 per ha per year, corresponding to
paddy of 270 kg/ha to 700 kg/ha per year. Thus, the maximum water fee levied on a
farmer is calculated to be about 1,000 kg/ha per year including VDF.
IMT is at a very initial stage at present. Considerable constraints and risks are
identified in carrying out the IMT process. A recent JICA assisted field
investigation on farmers’ capacity for IMT also found several constraints to
carrying out the IMT process. These are identified as follows:
- insufficient promulgation of IMT into local authorities as well as farmers;
- lack of accountability in management of VDF and controversial use offunds;
- inflexible rating of IMT fees;
- lack of data base on physical and institutional conditions of existingirrigation schemes that require rehabilitation and upgrading before/duringthe IMT process;
- delay in land tenure registration, resulting in reducing farmers’ incentive toinvest in farming;
- lack of design standard for construction and rehabilitation of facilities;
- slow progress in forming WUAs; and
- lack of agricultural support services (research, extension, credit, etc.) as aprerequisite for the sustainable IMT process.
(4) Flood Damages and Mitigation
The lowlying lands along the Mekong River and its tributary suffer flood and
inundation damages more or less every wet season. The flood prone areas are
shown in Figure 3.6. Though the floods provide positive impact to natural systems
like feeding soil fertility, adverse effects are widely observed such as damage to
agricultural production, housing and health, together with loss of life and
infrastructure including irrigation facilities. The DOI is responsible for monitoring
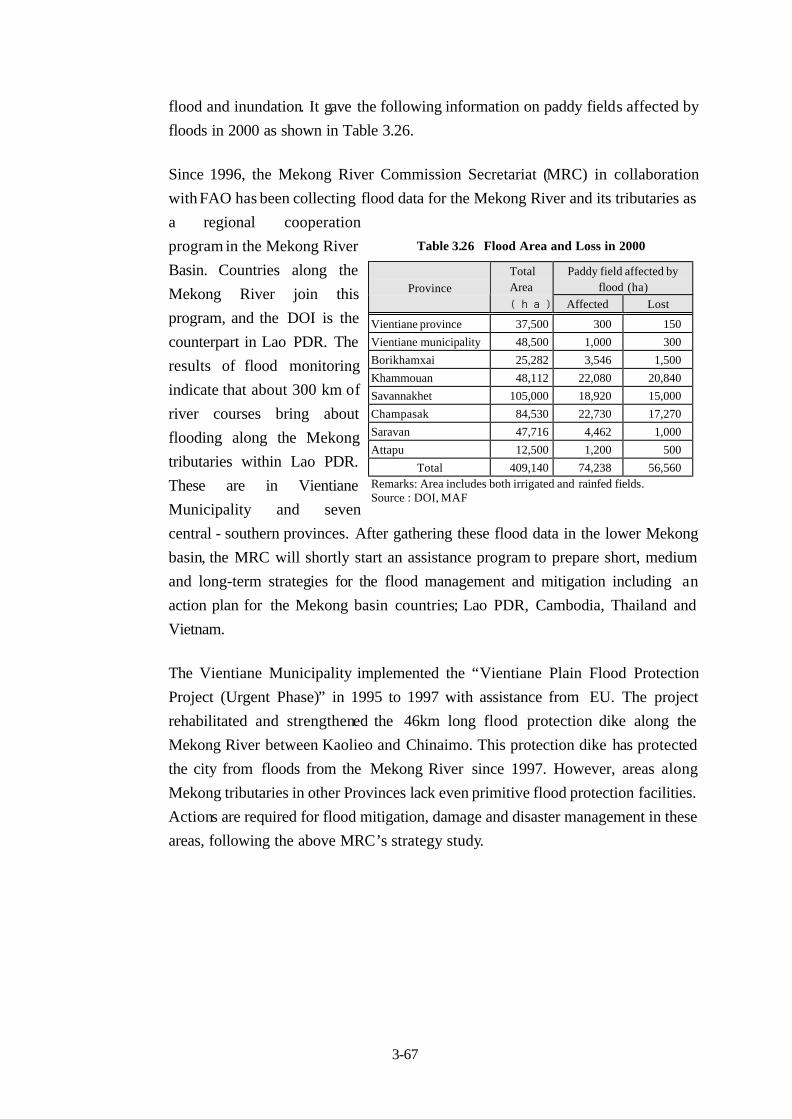
3-67
flood and inundation. It gave the following information on paddy fields affected by
floods in 2000 as shown in Table 3.26.
Since 1996, the Mekong River Commission Secretariat (MRC) in collaboration
with FAO has been collecting flood data for the Mekong River and its tributaries as
a regional cooperation
program in the Mekong River
Basin. Countries along the
Mekong River join this
program, and the DOI is the
counterpart in Lao PDR. The
results of flood monitoring
indicate that about 300 km of
river courses bring about
flooding along the Mekong
tributaries within Lao PDR.
These are in Vientiane
Municipality and seven
central - southern provinces. After gathering these flood data in the lower Mekong
basin, the MRC will shortly start an assistance program to prepare short, medium
and long-term strategies for the flood management and mitigation including an
action plan for the Mekong basin countries; Lao PDR, Cambodia, Thailand and
Vietnam.
The Vientiane Municipality implemented the “Vientiane Plain Flood Protection
Project (Urgent Phase)” in 1995 to 1997 with assistance from EU. The project
rehabilitated and strengthened the 46km long flood protection dike along the
Mekong River between Kaolieo and Chinaimo. This protection dike has protected
the city from floods from the Mekong River since 1997. However, areas along
Mekong tributaries in other Provinces lack even primitive flood protection facilities.
Actions are required for flood mitigation, damage and disaster management in these
areas, following the above MRC’s strategy study.
Table 3.26 Flood Area and Loss in 2000
TotalArea
Paddy field affected byflood (ha)Province
(ha) Affected Lost
Vientiane province 37,500 300 150
Vientiane municipality 48,500 1,000 300
Borikhamxai 25,282 3,546 1,500
Khammouan 48,112 22,080 20,840
Savannakhet 105,000 18,920 15,000
Champasak 84,530 22,730 17,270
Saravan 47,716 4,462 1,000
Attapu 12,500 1,200 500
Total 409,140 74,238 56,560Remarks: Area includes both irrigated and rainfed fields.Source : DOI, MAF
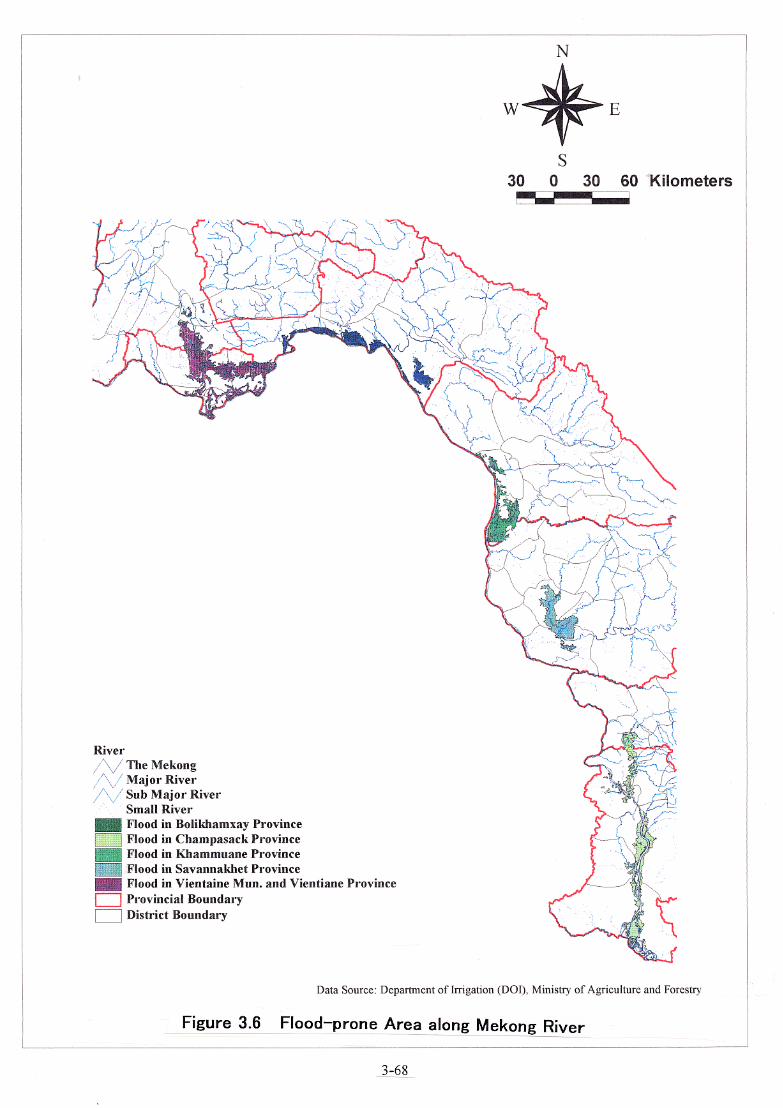
3-69
3.3 International Partnership in Agriculture and Rural Development
3.3.1 International Cooperation and Assistance
(1) Overview of Policies and Strategies of External Donors
The total external assistance for the period 1997-2000 was US$ 1,106 million
consisting of US$ 697 million in grants and US$ 409 million in loans according to
data prepared by the Committee for Planning and Cooperation (CPC). This means
that the annual average was around US$ 277 million. The highest share of external
assistance is from Japan (US$ 367 million), followed by ADB (US$ 353 million),
World Bank (US$ 120 million), EU (US$ 47 million), Australia (US$ 43 million),
Germany (US$ 41 million), Sweden (US$ 41 million), and UNDP (US$ 56
million).
According to the UNDP Development Co-operation Report 1999, external
assistance for the agriculture, forestry and fishery sectors in 1998 was US$ 29
million, around 10 % of the total external assistance. This amount is the third
largest sector share, following transportation (24%) and human resource
development (11%). The highest contributor of external assistance for agriculture,
forestry and fishery sectors in 1998 was Japan (US$ 9.1 million), followed by ADB
(US$ 3.3 million), EU (US$ 3.1 million), FAO (US$ 1.5 million), UNCDF (US$ 1.5
million), Sweden (US$ 3.8 million), and Germany (US$ 2.0 million).
The policies and strategies of major donors for overall assistance as well as the
agriculture sector is summarized below:
Japan
Since 1991, Japan has been the top-ranking donor, cooperating mainly inthe area of human resource development, basic human needs, agricultureand forestry and industrial infrastructure. Japan will continue to givepriority to assistance in the same areas.
For agriculture and forest sectors, emphasis is made in the followingspecific agriculture-related areas: a) planning and formulation ofagriculture policy, b) improvement of irrigation facilities, c) improvementof post-harvest measures, d) curbing slash-and-burn agriculture andpreserving forests, and e) rural development. It is also noted that theassistance is necessary to improve Lao PDR ability to formulatedevelopment plans, propose and implement policies, and to strengthen itslegal and institutional infrastructure.
ADBADB sets strategic directions for Lao PDR assistance, i.e. i) increasingefficiency of development activities through continued structural reforms
3-70
and enhanced governance related activities; ii) the need for greateremphasis on rural development, especially the need to increase ruralproductivity and to reduce poverty in remote and rural areas;iii) development of human capital through initiative in the education andhealth sectors; iv) sustainable natural resources management andenvironmental protection; v) geographical and integrated planning focus ofproject intervention in order to build synergies between its own activitiesand increase development impact; and vi) greater community participationin the selection and design of ADB interventions.
For the agriculture sector, ADB will help the Lao Government to implementthe Strategic Vision for Agriculture Sector. Further agriculture marketexpansion and market development throughout the country will beemphasized. Crosscutting issues related to rural poverty, gender, massorganization, rural community and possible NGO involvement, andenvironmental protection are specifically to be addressed in ADBoperations in the agriculture sector.
EUEU initiated development projects throughout the country. The projectsfocus mainly on rural development, encouraging the permanent settlementof rural communities, increasing food security, improving access to safewater, providing health care services and primary education, sustainabledevelopment of forest resource, reintegration of former refugees, economiccooperation.
For rural development, EU has funded several rural development projectsincluding activities such as irrigation development, crop production,livestock, aquaculture and household income generation. The projects willprovide training and institution capacity building to encourage farmers. Themajority of projects adopted an “integrated approach”, combining activitiesin many areas in order to achieve balanced and optimum results. Moreover,all projects place emphasis on promoting farmers’ organizations.
UN GroupPoverty eradication is the ultimate development objective of the entire UNsystem in Lao PDR. Human resource development and rural developmentare identified as key target areas for poverty eradication. The UN emphasison the role of government to the development process, namely: nationalownership of the development process, to ensure sustainability; aidcoordination, for prompt, efficient, and effective use of external assistance;resource mobilization, to ensure adequate financing of capital and technicalassistance requirements for national priority programs; the programapproach, to be applied to the external feasibility; United Nations systemcooperation and collaboration, to ensure complementarily and maximumdevelopment impact of assistance; and the integration of gender concernsinto all programs and projects.
For rural development, UNDP assistance at the community level will focuson income generation activities and the provision of micro-financeactivities. At the central level, UNDP and other UN agencies will supportthe Government in the formulation of a National Rural Development
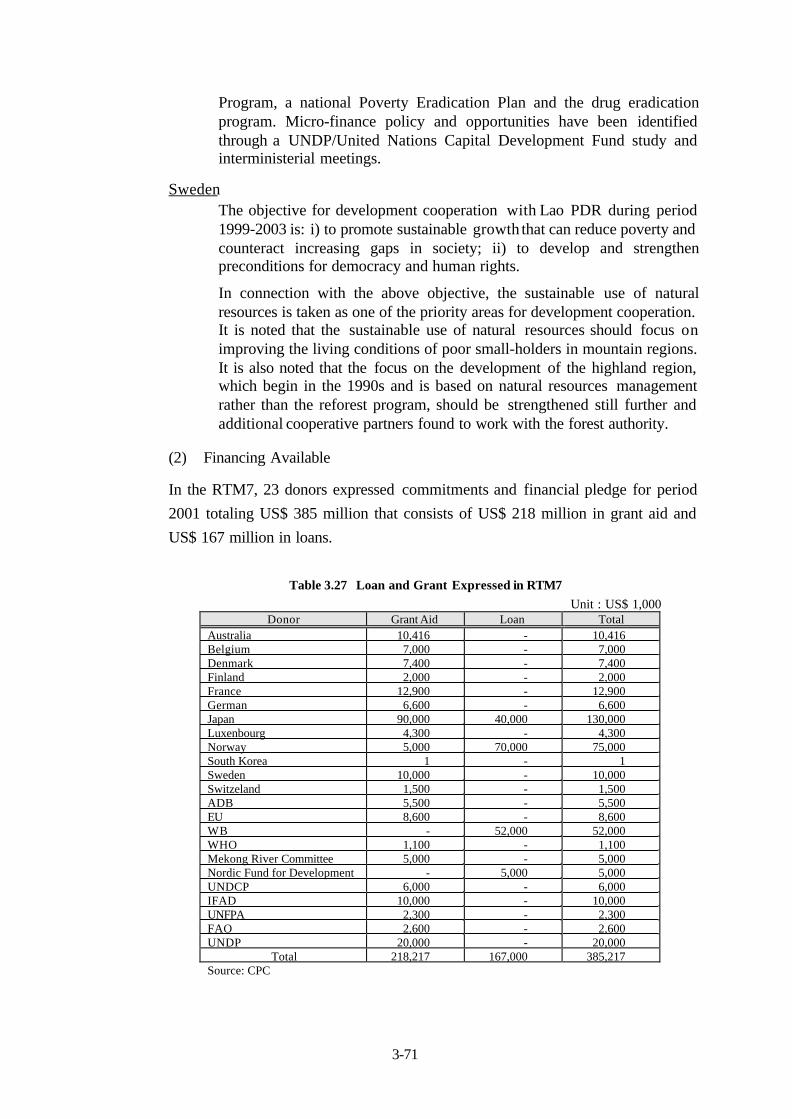
3-71
Program, a national Poverty Eradication Plan and the drug eradicationprogram. Micro-finance policy and opportunities have been identifiedthrough a UNDP/United Nations Capital Development Fund study andinterministerial meetings.
SwedenThe objective for development cooperation with Lao PDR during period1999-2003 is: i) to promote sustainable growth that can reduce poverty andcounteract increasing gaps in society; ii) to develop and strengthenpreconditions for democracy and human rights.
In connection with the above objective, the sustainable use of naturalresources is taken as one of the priority areas for development cooperation.It is noted that the sustainable use of natural resources should focus onimproving the living conditions of poor small-holders in mountain regions.It is also noted that the focus on the development of the highland region,which begin in the 1990s and is based on natural resources managementrather than the reforest program, should be strengthened still further andadditional cooperative partners found to work with the forest authority.
(2) Financing Available
In the RTM7, 23 donors expressed commitments and financial pledge for period
2001 totaling US$ 385 million that consists of US$ 218 million in grant aid and
US$ 167 million in loans.
Table 3.27 Loan and Grant Expressed in RTM7Unit : US$ 1,000
Donor Grant Aid Loan TotalAustralia 10,416 - 10,416Belgium 7,000 - 7,000Denmark 7,400 - 7,400Finland 2,000 - 2,000France 12,900 - 12,900German 6,600 - 6,600Japan 90,000 40,000 130,000Luxenbourg 4,300 - 4,300Norway 5,000 70,000 75,000South Korea 1 - 1Sweden 10,000 - 10,000Switzeland 1,500 - 1,500ADB 5,500 - 5,500EU 8,600 - 8,600WB - 52,000 52,000WHO 1,100 - 1,100Mekong River Committee 5,000 - 5,000Nordic Fund for Development - 5,000 5,000UNDCP 6,000 - 6,000IFAD 10,000 - 10,000UNFPA 2,300 - 2,300FAO 2,600 - 2,600UNDP 20,000 - 20,000
Total 218,217 167,000 385,217Source: CPC
3-72
These commitments are slightly lower than the total commitments of US$ 400
million made in the RTM6 in 1997. Actual external assistance is US$ 284 million
on average for the period 1997-2000 or 70 % of the commitment in the RTM6. If the
same trend is continued, around US$ 270 million (US$ 385million x 70%) of
average annual external assistance will be expected for the period 2001-2004.
(3) Aid Coordination
For prompt, efficient, and effective use of external assistance, aid coordination
amongst donors and government agencies is essential. In principal, the coordination
of external assistance is the responsibility of the Lao government. In this regard, the
government defined the role and responsibility of CPC in August 2000 for
coordination of all foreign assistance and monitoring of its progress with the
principal of “one-stop-shop”. The CPC is coordinating aid at both central and
province levels. At the central level, the role of CPC is to: i) implement and solve all
issues related to foreign and domestic investment as well as international
cooperation; ii) approve foreign and domestic investment projects and all grant aid;
iii) supervise and promote foreign and domestic investment projects as well as
international cooperation; and iv) coordinate with all parties including ministries
and local authorities. At the local level, the CPC directly manages foreign and
domestic investment projects as well as international cooperation. The CPC
established an aid coordination and monitoring system in May 2000 under the
technical assistance of the ADB to improve aid coordination and standardize
monitoring outcomes of international aid projects.
The RTM of development partners is also an important mechanism for aid
coordination in Lao PDR. The sixth RTM was held in Geneva in June 1997 and the
seventh RTM was held in Vientiane in November 2000. Over 250 representatives of
development partner countries, the European Commission, multilateral financial
institutions, UN agencies, and NGOs attended the seventh RTM. The meeting
confirmed that the crucial importance of aid coordination and aid management was
to enable the Government to make the best use of resources. The establishment of
CPC to streamline project appraisal and approval was welcome.
The main objectives of the above system are to: i) avoid overlapping of external
assistance amongst donors; and ii) monitor the progress of external assistance. It is,
however, observed that the sharing of experience or lessons learned is rather weak
amongst donors. For enhancement of project impact and improvement of project
sustainability, a system of sharing experience or lessons learned will be required. In
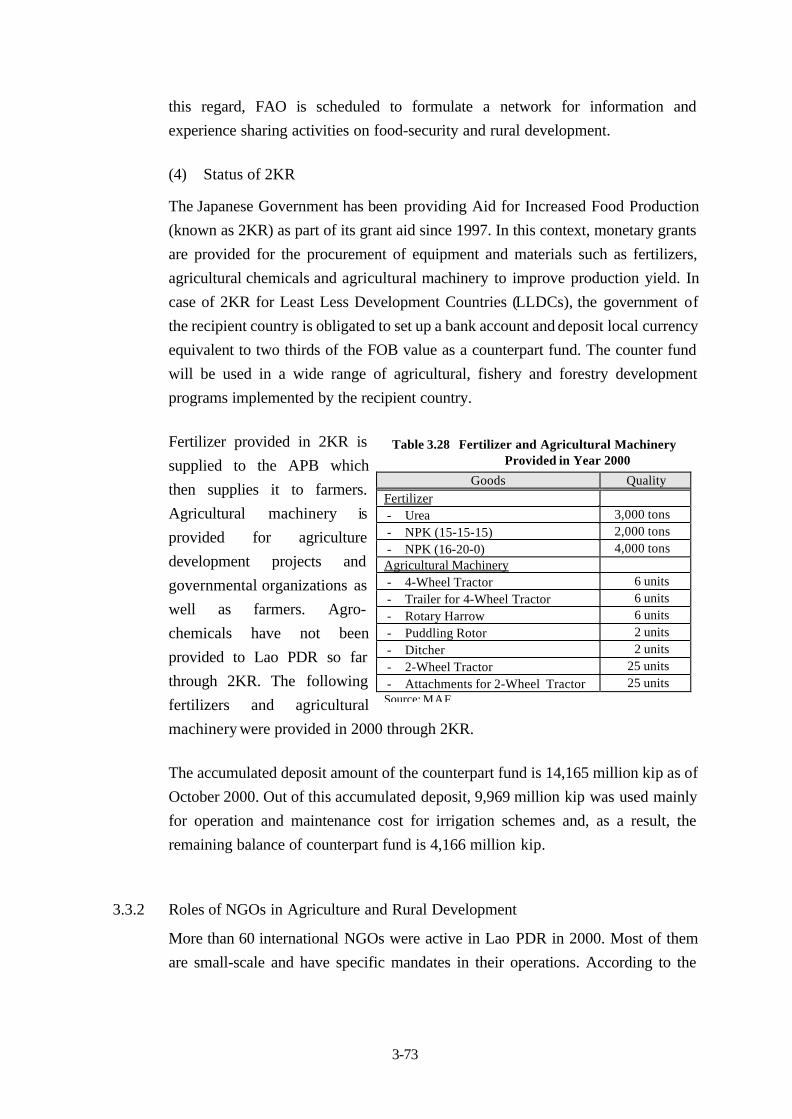
3-73
this regard, FAO is scheduled to formulate a network for information and
experience sharing activities on food-security and rural development.
(4) Status of 2KR
The Japanese Government has been providing Aid for Increased Food Production
(known as 2KR) as part of its grant aid since 1997. In this context, monetary grants
are provided for the procurement of equipment and materials such as fertilizers,
agricultural chemicals and agricultural machinery to improve production yield. In
case of 2KR for Least Less Development Countries (LLDCs), the government of
the recipient country is obligated to set up a bank account and deposit local currency
equivalent to two thirds of the FOB value as a counterpart fund. The counter fund
will be used in a wide range of agricultural, fishery and forestry development
programs implemented by the recipient country.
Fertilizer provided in 2KR is
supplied to the APB which
then supplies it to farmers.
Agricultural machinery is
provided for agriculture
development projects and
governmental organizations as
well as farmers. Agro-
chemicals have not been
provided to Lao PDR so far
through 2KR. The following
fertilizers and agricultural
machinery were provided in 2000 through 2KR.
The accumulated deposit amount of the counterpart fund is 14,165 million kip as of
October 2000. Out of this accumulated deposit, 9,969 million kip was used mainly
for operation and maintenance cost for irrigation schemes and, as a result, the
remaining balance of counterpart fund is 4,166 million kip.
3.3.2 Roles of NGOs in Agriculture and Rural Development
More than 60 international NGOs were active in Lao PDR in 2000. Most of them
are small-scale and have specific mandates in their operations. According to the
Table 3.28 Fertilizer and Agricultural MachineryProvided in Year 2000
Goods QualityFertilizer- Urea 3,000 tons- NPK (15-15-15) 2,000 tons- NPK (16-20-0) 4,000 tonsAgricultural Machinery- 4-Wheel Tractor 6 units- Trailer for 4-Wheel Tractor 6 units- Rotary Harrow 6 units- Puddling Rotor 2 units- Ditcher 2 units- 2-Wheel Tractor 25 units- Attachments for 2-Wheel Tractor 25 unitsSource: MAF
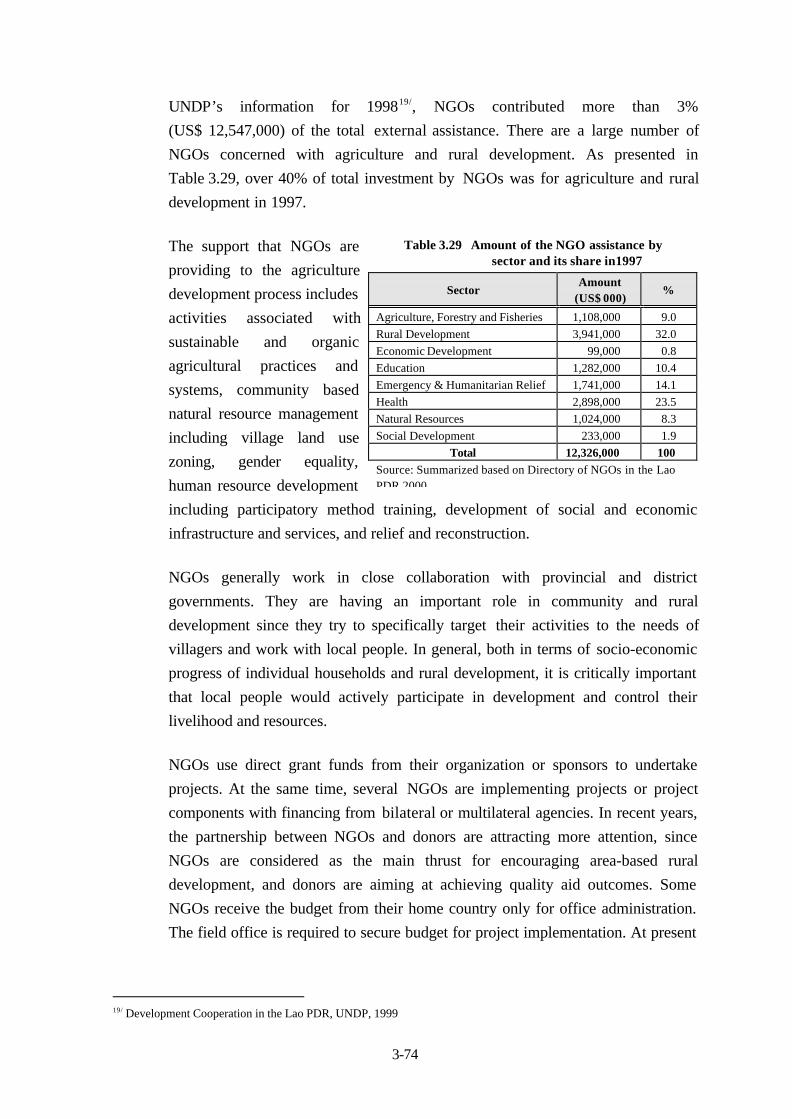
3-74
UNDP’s information for 199819/, NGOs contributed more than 3%
(US$ 12,547,000) of the total external assistance. There are a large number of
NGOs concerned with agriculture and rural development. As presented in
Table 3.29, over 40% of total investment by NGOs was for agriculture and rural
development in 1997.
The support that NGOs are
providing to the agriculture
development process includes
activities associated with
sustainable and organic
agricultural practices and
systems, community based
natural resource management
including village land use
zoning, gender equality,
human resource development
including participatory method training, development of social and economic
infrastructure and services, and relief and reconstruction.
NGOs generally work in close collaboration with provincial and district
governments. They are having an important role in community and rural
development since they try to specifically target their activities to the needs of
villagers and work with local people. In general, both in terms of socio-economic
progress of individual households and rural development, it is critically important
that local people would actively participate in development and control their
livelihood and resources.
NGOs use direct grant funds from their organization or sponsors to undertake
projects. At the same time, several NGOs are implementing projects or project
components with financing from bilateral or multilateral agencies. In recent years,
the partnership between NGOs and donors are attracting more attention, since
NGOs are considered as the main thrust for encouraging area-based rural
development, and donors are aiming at achieving quality aid outcomes. Some
NGOs receive the budget from their home country only for office administration.
The field office is required to secure budget for project implementation. At present
19/ Development Cooperation in the Lao PDR, UNDP, 1999
Table 3.29 Amount of the NGO assistance bysector and its share in1997
SectorAmount
(US$ 000)%
Agriculture, Forestry and Fisheries 1,108,000 9.0Rural Development 3,941,000 32.0Economic Development 99,000 0.8Education 1,282,000 10.4Emergency & Humanitarian Relief 1,741,000 14.1Health 2,898,000 23.5Natural Resources 1,024,000 8.3Social Development 233,000 1.9
Total 12,326,000 100Source: Summarized based on Directory of NGOs in the LaoPDR 2000
3-75
it seems there are competition among NGOs to obtain project funds from donors.
Australia, Canada, Denmark, Japan and Sweden are the main fund suppliers.
All NGOs are required to register with the Department of International
Organizations of the Ministry of Foreign Affairs. In 1998, the Prime Minister’s
decree on NGOs’ administration was issued in order to present the government ’s
regulations pertaining to the NGO operations, rights and obligations. According to
this decree, NGOs are required to have an operation permit, project office permit,
and representative office permit from the government. To set up a representative
office, the budget of minimum US$ 500,000 per project is required20/. NGOs are
also required to submit semi-annual and annual reports on the joint implementation
of assistance projects with the relevant Lao agencies to the Ministry of Foreign
Affairs.
3.4 Past and Current Agriculture Development Activities
3.4.1 Agriculture Development Project under MAF
MAF prepared a list of agricultural development projects as of fiscal year 1998/99.
The listed projects are categorized according to the responsible departments and
institutions in MAF. The Study Team further classified them into four types:
1) on-going projects being operated beyond the year 2001, classified as ‘On-going Projects’;
2) projects being or having been identified for future implementation,classified as ‘Planned Project’;
3) projects completed or to be completed by the end of the year 2000 with anexternal fund amounting to more than US$ 1 million, classified as ‘MajorProject Completed’; and
4) project completed and regarded as strategically important, although theexternal fund is less than US$ 1 million, classified as “Major ProjectCompleted”.
The list of past and current agriculture development projects that were screened by
the above classification is summarized in Table 3.30.
20/ Excluding salaries, office, travel and insurance expenses.
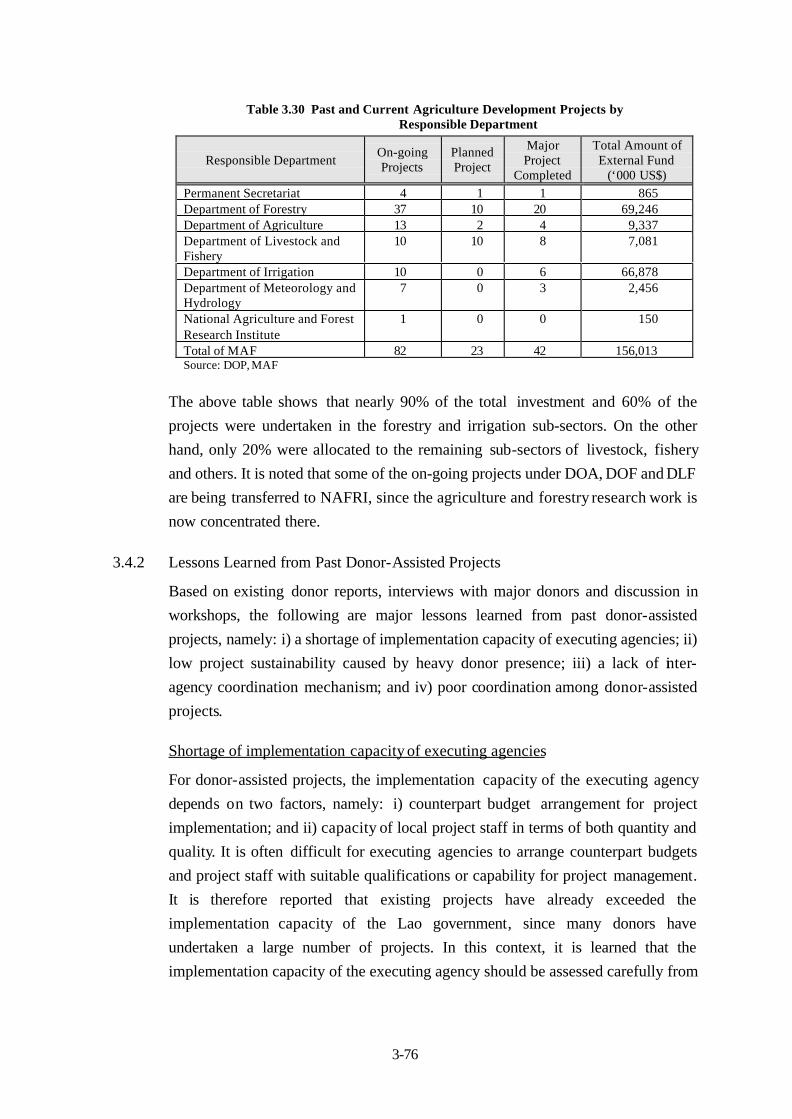
3-76
Table 3.30 Past and Current Agriculture Development Projects byResponsible Department
Responsible DepartmentOn-goingProjects
PlannedProject
MajorProject
Completed
Total Amount ofExternal Fund
(‘000 US$)Permanent Secretariat 4 1 1 865Department of Forestry 37 10 20 69,246Department of Agriculture 13 2 4 9,337Department of Livestock andFishery
10 10 8 7,081
Department of Irrigation 10 0 6 66,878Department of Meteorology andHydrology
7 0 3 2,456
National Agriculture and ForestResearch Institute
1 0 0 150
Total of MAF 82 23 42 156,013Source: DOP, MAF
The above table shows that nearly 90% of the total investment and 60% of the
projects were undertaken in the forestry and irrigation sub-sectors. On the other
hand, only 20% were allocated to the remaining sub-sectors of livestock, fishery
and others. It is noted that some of the on-going projects under DOA, DOF and DLF
are being transferred to NAFRI, since the agriculture and forestry research work is
now concentrated there.
3.4.2 Lessons Learned from Past Donor-Assisted Projects
Based on existing donor reports, interviews with major donors and discussion in
workshops, the following are major lessons learned from past donor-assisted
projects, namely: i) a shortage of implementation capacity of executing agencies; ii)
low project sustainability caused by heavy donor presence; iii) a lack of inter-
agency coordination mechanism; and iv) poor coordination among donor-assisted
projects.
Shortage of implementation capacity of executing agencies
For donor-assisted projects, the implementation capacity of the executing agency
depends on two factors, namely: i) counterpart budget arrangement for project
implementation; and ii) capacity of local project staff in terms of both quantity and
quality. It is often difficult for executing agencies to arrange counterpart budgets
and project staff with suitable qualifications or capability for project management.
It is therefore reported that existing projects have already exceeded the
implementation capacity of the Lao government, since many donors have
undertaken a large number of projects. In this context, it is learned that the
implementation capacity of the executing agency should be assessed carefully from
3-77
the viewpoint of financial capability and staff availability prior to project
implementation.
Low project sustainability caused by heavy donor presence
In general, the sustainability of projects assisted by donors in Lao PDR is
vulnerable due to the extremely high rate of dependency on external financial
assistance. This is closely related to the shortage of implementation capacity
mentioned above. Donors sometimes pay for most of the project operation costs,
including allowances for the government staff, or even allowances for beneficiaries,
during the implementation period. In other cases, donors directly or indirectly
employ many local staff for project management and implementation instead of
government counterpart staff. After the donor’s withdrawal from the project, the
executing agency or beneficiaries cannot cover the operation cost or do not continue
to employ such experienced local staff. As a result of this heavy donor presence
during the project implementation period, there have been many cases where
projects were suspended or even stopped right after termination.
In this context, it is learned that: i) sharing the burden amongst stakeholders for
project operation or project income should be assessed from the financial
viewpoint; ii) capacity building of the executing agency should be prioritized; and
iii) the presence of the donor should be minimized as much as possible and,
accordingly, the government or people should take the ownership of the project.
Lack of inter agency coordination mechanism
Several programs/projects need to involve multiple agencies because of the target
area and sequence of programs/projects. Some donors claim that if you want to
implement a project successfully, multiple agencies should not be involved in the
project. In workshops, many Lao agencies expressed difficulties in coordination
between it and other agencies due to sectionalism amongst the concerned agencies.
This is also closely related to a shortage of implementation capacity of the
executing agency. In this context, it is learned that: i) establishing a working unit to
coordinate activities of all agencies responsible for implementation should be
considered; ii) capacity building of the executing agency for coordination should be
promoted; and iii) budgetary allocations in agencies with project responsibility
other than the executing agency should be secured.
Poor coordination of donor assisted projects
Donors are showing increasing concern about the overlap of projects whenever a
project is formulated. At the same time, sharing of past experience or
3-78
data/information in the project has never functioned well, since no donor has taken
the initiative to do so. In the agricultural sector, however, the FAO is scheduled to
establish a network for information and experience sharing activities on food
security and rural development amongst donors including NGOs.
It is also observed that poor coordination of donor-assisted projects results in
conflicting Lao government policies being pursued in different districts and
provinces. For example, the service delivery system is fragmented as shown by the
fact that the service fee is different from project to project.
In this context, it is learned that: i) donors should put more resources into sharing
past experience and data/information; and ii) the government should coordinate
policies of donor-assisted projects carefully, including the preparation of guidelines
to ensure that all donor-assisted project components are in conformity with
government policies.