Embed Size (px)
Citation preview

31
Abstract The device physics and technology issues for III-V transistors are exam-ined from a simulation perspective. To examine device physics, an InGaAs HEMT structure similar to those being explored experimentally is analyzed. The physics of this device is explored using detailed, quantum mechanical simulations based on the non-equilibrium Green’s function formalism. In this chapter, we: (1) elucidate the essential physics of III-V HEMTs, (2) identify key technology challenges that need to be addressed, and (3) estimate the expected performance advantage for III-V transistors.
3.1 Introduction
Driven by tremendous advances in lithography, the semiconductor industry has fol-lowed Moore’s law by shrinking transistor dimensions continuously for the last 40 years. The big challenge going forward is that continued scaling of planar, silicon, CMOS transistors will be more and more difficult because of both fundamental limitations and practical considerations as the transistor dimensions approach ten nanometers. The issues at small gate lengths are many fold. First, transistor scaling increases the number of gates on a chip and the operating frequency. To prevent the chip from overheating, the power dissipation should be limited, which requires lowering the power supply voltage while maintaining the ability to deliver high on-currents for each new generation of technology. Secondly, the drain bias decreases the energy barrier height between the source and channel in a transistor due to 2D electrostatics. Degraded short channel effects become more significant as the gate length gets shorter, and the increased off-state leakage has pushed the stand-by power to its practical limit. Thirdly, the accompanying scaled oxide thickness provides better gate control of the channel potential, but this inevitably increases
S. Oktyabrsky, P. D. Ye (eds.), Fundamentals of III-V Semiconductor MOSFETs, DOI 10.1007/978-1-4419-1547-4_3, © Springer Science+Business Media LLC 2010
Chapter 3Device Physics and Performance Potential of III-V Field-Effect Transistors
Yang Liu, Himadri S. Pal, Mark S. Lundstrom, Dae-Hyun Kim, Jesús A. del Alamo and Dimitri A. Antoniadis
Y. Liu ()Department of Electrical and Computer Engineering, Purdue University, West Lafayette, Indiana, USAe-mail: [email protected]
32 Y. Liu et al.
the gate leakage and makes it very difficult to obtain both high on-currents and low off-currents at lowered supply voltage. Lastly, the parasitic resistance and capaci-tance have become comparable to, or even larger than the continuously decreasing intrinsic channel capacitance and resistance, which may provide a practical limit to scaling [1]. A 45 nm process based on high-k, metal gate, and strained silicon was introduced in 2007 [2]. With such technologies, scaling will continue to the 32 nm node and beyond [3]. Conventional silicon-based CMOS scaling will, how-ever, become very difficult at the 15 nm node and beyond. Further improvements in transistor speed and performance may have to come from new channel materials.
To address the scaling challenge, both industry and academia have been investi-gating alternative device architectures and materials, among which III-V compound semiconductor transistors stand out as promising candidates for future logic appli-cations because their light effective masses lead to high electron mobilities and high on-currents, which should translate into high device performance at low supply voltage. Recent innovations on III-V transistors include sub-100 nm gate-length, high performance InGaAs buried channel [4, 5] and surface channel MOSFETs [6], sub-80 nm E-mode InGaAs/InAs HEMTs [7–10], and InSb p-channel HEMTs [11] with outstanding logic performance at short channel lengths and low sup-ply voltages. At the same time, theoretical work has predicted the performance of III-V transistors with respect to Si at near future technology nodes with the focus on device design, bandstructure effects, source engineering, etc [12–21].
In this chapter, we will examine device physics issues of III-V transistors from a simulation perspective by addressing a very specific question: how would an In-rich, InGaAs MOSFET operate if the technological challenges identified in other chap-ters of this volume are solved. To examine device physics, we will use an InGaAs HEMT structure similar to that being used by the MIT and Intel groups [10, 22]. We will begin by examining the device physics using detailed quantum mechanical simulations based on the non-equilibrium Green’s function formalism [23]. Our objectives are threefold: (1) to elucidate the physics of III-V HEMTs, (2) to identify key technology challenges that need to be addressed, and (3) to determine what the performance advantage (if any) for III-V transistors would be.
3.2 InGaAs HEMTs
3.2.1 Device Structure
The HEMT structure for logic applications studied in this chapter is shown in Fig. 3.1a [22]. The high-mobility channel consists of In0.53Ga0.47As/In0.7Ga0.3As/In0.53Ga0.47As quantum well of 2 nm/8 nm/3 nm in thickness and is sandwiched between two In0.52Al0.48As barrier layers on the top and bottom with thickness of 4 nm and 500 nm respectively. The gate length of these devices ranges from 40 to 130 nm.
A silicon δ-doped layer of 5 × 1012 cm−2 is placed 3 nm away from the channel in the upper barrier layer to provide carriers for the source and drain. In real devices,

333 Device Physics and Performance Potential of III-V Field-Effect Transistors
the current flow is 2D from the raised source to the drain through the doped heter- ostructure stack and then laterally to the channel. Rather than attempting to simulate the contacts and the associated metal semiconductor contact resistance, we place ideal contacts at the two ends of the channel to simplify the structure. The simulated “intrinsic” device structure, where quantum ballistic transport is expected to domi-nate, is indicated by the dashed square in Fig. 3.1a. The effects of the heterostructure contact stack on the intrinsic device are approximated by simply adding two series resistance RS and RD to both ends. This approach neglects some source design issues such as source access [24] and so-called source starvation [14] that may be impor-tant in practice. Nevertheless, it is a reasonable starting point and should provide us with upper limit projections. The comparisons with experiment to be discussed later show that neglecting source design issues is acceptable at this stage of technology development.
Fig. 3.1 a The structure of the MIT InGaAs HEMTs designed for logic applica-tion (after [22]). The simula-tion domain is indicated by the dashed square which is modeled with quantum ballistic transport. The het-erostructure stack is simply replaced with two series resistances. b The simplified device structure with proper boundary conditions. The delta-doped layer is indicated by the white dashed line
Source
n+ Cap n+ Cap
InP etch stop
4nm
13nm
500nm
S.I. InP substrate
In0.52Al0.48As
In0.52Al0.48As 3nm
RDRS
-dopedlayer
LG
Lside
simulationregion
Lside
InGaAs QW
Gate
Drain
Gate
D
b
a
A × b
A2 × b
barrier
barrier
S
z
x Lside LsideLg
channel
a
b
δ

34 Y. Liu et al.
3.2.2 Simulation Approach
The 2D simulation program used for these studies evolved from the nanoMOS simu-lation program [25]. The Poisson equation is first solved with the charge from an initial flat band profile as the estimated potential. To compute the carrier density, the uncoupled mode space approach is then used to solve the quantum transport prob-lem assuming ballistic transport. The resulting spatial charge distribution from the 2D charge density weighed by the wavefunction in the quantum well is inserted in the Poisson equation, and the new charge distribution leads to a new potential profile. This process continues until the desired convergence is achieved (typically when the maximum difference in potential for the last two iterations is under 0.1 meV). The quantum ballistic current is then readily calculated for each subband within the mode space NEGF formalism. Final post-processing steps utilize the two fitting parameters (the metal work function and the series resistance) to fit the simulation results to the experimental data. The simulation procedure was discussed in detail in [26]. Note that different from [26], we adopt an embedded gate structure to capture the fringing effects which become important in short gate length devices. Figure 3.1b shows the simplified device structure in the simulation with the following boundary conditions: (1) the potential of the embedded gate region is fixed according to the gate bias and workfunction, (2) the bottom layer of the substrate is grounded, and (3) zero normal electrical field boundary conditions are applied for the rest of the boundary.
3.2.3 Materials Parameters
Non-parabolicity effects are important in the conduction band of III-V materials, and the use of bulk effective masses would lead to significant errors for ultra-thin-body structures [27]. Before simulating the HEMTs, we extract the channel effective masses of the III-V HEMT devices from atomistic sp3d5s* tight-binding simulations using the NEMO-3D program [28]. The bandstructure calculated with the atomistic tight-binding model incorporates the non-parabolicity effects as well as the strain effects due to the lattice mismatch between the In0.53Ga0.47As/In0.7Ga0.3As layers. The tight-binding bandstructure calculation also shows that higher valleys are well above the Γ valley subbands and therefore make a negligible contribution to the carrier and current density. The effective mass is extracted from the first subband by fitting a parabola from the band bottom to up to 0.1 eV higher. The extracted equivalent effective masses for the quantum well channel are 0.053m0 for transport and transverse directions, and 0.067m0 for the confinement direction, in contrast with the value of 0.041m0 obtained from a linear interpolation of the bulk effective masses of InAs and GaAs [29]. The confinement effective mass of In0.52Al0.48As barrier is 0.075m0. The dielectric constant of the InGaAs channel used in the simu-lation is assumed to be ε = 14.3 and that of the In0.52Al0.48As barrier is 12.7 [29]. The conduction band discontinuity between In0.53Ga0.47As/In0.52Al0.48As layers is assumed to be ΔEC = 0.50 eV [30, 31].

353 Device Physics and Performance Potential of III-V Field-Effect Transistors
3.2.4 Results
We compare the simulation results with experimental data by examining the I–V characteristics. Two fitting parameters are used: (1) the workfunction of the gate metal and (2) the series resistance. The gate workfunction is first determined by tun-ing its value so that the subthreshold regime of the intrinsic logId–VGS overlaps that of the experimental data. Below subthreshold, the current is so small that the I–V characteristics are not affected by the series resistance. Once we fit the subthresh-old regime by determining the gate workfunction, we choose an appropriate series resistance to include in the ballistic intrinsic I–V and adjust to best match the linear region within the above-threshold Id regime (low VDS and high VGS).
Figure 3.2 compares the simulation with the experimental data [32] in logId–VGS and linear Id–VDS plots for nominal gate lengths of Lg = 40 nm and Lg = 130 nm InGaAs HEMTs after tuning the workfunction and including the series resistance. Good quantitative agreement is achieved with adjustment of the nominal gate length and insulator thickness by about 10%. For the device with a nominal gate length of Lg = 40 nm and tins= 4 nm, the best fit was obtained with Lg = 45 nm and tins = 3.6 nm. For the device with a nominal gate length of 130 nm a tins = 4 nm, the best fit was obtained with Lg = 125 nm and tins = 4.6 nm. These values are within the measurement error and reasonable [33]. The fitted series resistance RS = RD = 220 Ω µm is identical to the value quoted from the measurement [34]. We also observe that the difference in current between experimental data and simulation
Fig. 3.2 Comparison of the I–V characteristics between experimental ( square symbols) and simu-lation results ( solid and dash lines) for 40 nm ( left) and 130 nm ( right) HEMTs shows quantita-tively good agreement by adjusting the gate length and insulator thickness in a reasonable range
103
102
101
100
I d [µ
A/µ
m]
I d [µ
A/µ
m]
I d [µ
A/µ
m]
I d [µ
A/µ
m]
8007006005004003002001000
10–1
10–2
103
102
101
100
10–1
10–2
I d [µ
A/µ
m]
I d [µ
A/µ
m]
800
700
600
500
400
300
200
100
0
800700600500400300200100
00 0.1 0.2 0.3 0.4 0.5
800700600500400300200100
00 0.1 0.2 0.3 0.4 0.5
–0.2 –0.1 0 0.1 0.2 0.3 0.4 0.5 –0.2 –0.1 0 0.1 0.2 0.3 0.4 0.5
VGS [V] VGS [V]
VDS [V] VDS [V]
VDS = 0.50 V
VDS = 0.05 V
Lg = 40 nm Lg = 130 nm
Lg = 130 nm
VDS = 0.50 V
VDS = 0.05 V
VGS:0∼0.50 VVGS:0∼0.50 V
ExperimentSimulation
Lg = 40 nmExperimentSimulation

36 Y. Liu et al.
results at high VDS increases as both VGS and Lg increases, which might be due to three reasons. First, the assumed constant series resistance used in the simulation might not hold when the current becomes large. Second, as the gate length increases from 40 to 130 nm the device may become less ballistic. Finally the source may not be able to supply the desired on-current. Nevertheless, the simulation demonstrates that the ballistic model with attached series resistance is a good first order descrip-tion of the HEMTs’ I–V characteristics.
Note that the series resistance in these transistors is quite large, and it presents a significant limit on device performance. This is shown in Fig. 3.3, where the simu-lated Id–VDS for Lg = 45 nm at VGS = 0.5 V is compared for different assumed val-ues of RSD (the square symbols are experimental data for the nominal Lg = 40 nm device). It is observed that the predicted on-current could be improved by 100% if the series resistance in III-V HEMTs could be reduced to the typical value for good Si transistors ( RSD ~ 150 Ω µm). Note also that even the fully ballistic simulation displays a channel resistance of about 80 Ω µm.
3.3 Discussion
3.3.1 Gate Capacitance
The gate capacitance of the HEMTs can be determined from the charge in the quantum well channel. Figure 3.4a shows the simulated carrier density (half-way between the source and drain) vs. the gate bias at VDS = 0 when Lg = 45 nm and tins = 3.6 nm; the slope of the curve gives a gate capacitance of 1.41 µF/cm2 at VGS = 0.5 V. The gate capacitance is the upper barrier layer insulator capacitance in series with the semiconductor capacitance:
1
CG=
1
Cins+
1
CS, (3.1)
Fig. 3.3 Id–VDS of 45 nm HEMTs at VGS = 0.5 V with different series resistance; the square symbols are experimental data. The on-current is expected to be improved by about 100% with reduced series resistance matched to Si transistors
2500Lg = 45 nm
VGS = 0.5 V
RSD = 0
RSD = 150 Ω-µm
RSD = 440 Ω-µm
2000
1500
1000
500
00 0.1 0.2
VDS [V]
I d [µ
A/µ
m]
0.3 0.4 0.5

373 Device Physics and Performance Potential of III-V Field-Effect Transistors
where Cins =εins
tins= 3.12 µF/cm2. The semiconductor capacitance CS can be
expressed as [35]:
CS =
q2m∗
π h2 ·
i
f (Ei; EF) · (1− ∂Ei/∂ψS),
(3.2)
where CQ = q2m*/πћ2 is the so called quantum capacitance at 0 K in a 2D system, f (Ei; EF) is the Fermi function for subband i, and ∂Ei/∂ψS is the change of
the ith subband energy Ei with respect to the surface potential ψS. Equation (3.2) may be viewed as the product of CQ and a factor that depends on how the shape of the quantum well changes with gate bias. The second factor is often inter-preted as describing how the centroid of the charge changes with gate voltage. At VGS = 0.5 V only two subbands are occupied in the quantum well, and Fig. 3.4b shows the two subband energies as a function ofψS . The semiconductor capac-itance is then readily calculated from Eq. (3.2) as CS = 3.05 µF/cm2, which is, close to the quantum capacitance CQ = 3.53 µF/cm2. Using Eq. (3.1) we find CG = 1.54 µF/cm2, close to CG = 1.41 µF/cm2 as calculated directly from the charge in the quantum well. An independent determination of the gate capacitance obtained by de-embedding the capacitance from S-parameter measurements yields a some-what lower value of CG = 1.08 µF/cm2. The reason for this discrepancy is still not understood.
Our calculations show that CS is comparable to Cins for this transistor. We also find that CG < Cins. This occurs because of the small density of states effective mass in III-V materials [14, 16]. The result is a significant degradation of the total gate capacitance. One can describe this effect as an effective increase of the insulator thickness according to
CG =εins
tins +tins.
(3.3)
Fig. 3.4 a The charge density in the quantum well gives CG = 1.41 µF/cm2 at VGS = 0.5 V. b The 1st and 2nd subband energy as a function of the surface potential of the quantum well
3.5
a b
CG = 1.41 µF/cm2
E2
E1
x 1012
3
2
1
0–0.3 –0.2 –0.1 0
VGS [V] ψS [V]0.1 0.2 0.3 0.4 0.5
2.5
1.5
NS [c
m–2
]
0.5
0.25
0.2
0.15
0.1
0.05
–0.05
–0.1–0.4 –0.2 0 0.2 0.4
0E1/
E2
[eV
]

38 Y. Liu et al.
For the device being studied here, tins = 3.6 nm and Δtins = 4.4 nm, so the low density-of- states seriously degrades the gate capacitance.
3.3.2 Charge Control in a Nanoscale HEMT
The current of nanoscale MOSFETs can be accurately described by a virtual source model as [1]
ID/W = Qi(x0) · υ (x0) (3.4a)
where ID is the drain current, W is the device width, and Qi(x0) is the charge per unit area at the virtual source. In the ballistic limit, the virtual source model becomes the top-of-the-barrier ballistic model [36, 37] and for on-current conditions,
ION/W = Qi(x0) · υinj (3.4b)
where υ (x0) = υinj is the so-called ballistic injection velocity and is a key figure of merit for nanoscale MOSFETs [1].
When analyzing experimental results, the charge at the virtual source (top of the barrier) and injection velocity at the same location are estimated. Consider first the charge at the virtual source. It can be estimated from experiment C−V (long chan-nel) from [38, 39]
Qi(x0) = V ∗
gs
0C
gsd
Vds=(long-chan.)
dVgs,
(3.5)
where V ∗gs = Vgs +VT − IonRS accounts for the correction of VT roll-off, DIBL,
and series resistance.For the 45 nm HEMTs studied here, the simulated on current at VGS = VDS =
0.5 V is ION /W = 813 µA/µm, the intrinsic biases are VGS,in = 0.32 V, VDS,in = 0.14 V with RS = RD = 220 Ω µm. Figure 3.5 plots the first subband profile vs. position along with the electron density vs. position as a function of position along the
Fig. 3.5 The sheet charge density at the virtual source is determined from the spatial sheet charge density at the top of the potential barrier
–150 –100
Barrier Top
VGS = VDS = 0.5V
–50 0X [nm]
50 100 150
5–0.1
–0.15
–0.2
–0.25
EC [e
V]
x 1012
4
Ele
ctro
n de
nsity
[cm
–2]
3
2
1

393 Device Physics and Performance Potential of III-V Field-Effect Transistors
device channel. From this plot, we find the charge at the virtual source (top of the potential barrier) to be 1.60 × 1012 cm−2. From Eq. (3.5) and the intrinsic simulated C−V of a long channel device ( Lg = 125 nm), the electron density extracted at VGS = VDS = 0.5 V is about 1.90 × 1012 cm−2, which is reasonably close to the charge den-sity obtained directly from the top of the potential barrier. As will be discussed in Sect. 3.3.7, the charge at the top of the barrier under high drain bias is less than the equilibrium charge because the semiconductor capacitance is reduced under high drain bias.
3.3.3 Velocity at the Virtual Source
The ballistic injection velocity υinj is of particular interest in MOSFETs, and can be evaluated at the top of the source-channel potential barrier ( x = x0):
ID/W = Qi(x0) · υinj (3.6)where ID, W, and Qi( x0) have the same meaning as in Eq. (3.4a). For the 40 nm HEMTs studied, the on current at VGS = VDS = 0.5 V is ION /W = 813 µA/µm, the intrinsic biases are VGS,in = 0.32 V, VDS,in = 0.14 V with RS = RD = 220 Ω µm. Figure 3.6 plots the first subband profile and average velocity as a function of position along the device channel. The ballistic injection velocity is readily read from the average velocity at the top of the barrier, which gives υinj = 3.17× 107cm/s, and is close to the exper-imental reported value [40]. In comparison, the injection velocity extracted with the simulated on-current (813 µA/µm) and the charge from the integration of the long channel device C–V as in last section (1.90 × 1012 cm−2) is υinj = 2.67× 107cm/s . Note that the III-V HEMTs have much larger ballistic injection velocity than that of the strained Si MOSFETs in spite of the small intrinsic gate and drain biases in III-V HEMTs that result from the large series resistance.
Fig. 3.6 The ballistic injec-tion velocity is the average velocity at the top of the potential barrier
–150 –100
Barrier Top
VGS = VDS = 0.5V
–0.15 x 10⁷
4
3
2
Ave
rage
vel
ocity
[cm
/s]
EC [e
V]
1
–0.15
–0.2
–0.25
–50 0X [nm]
50 100 150

40 Y. Liu et al.
3.3.4 Ballistic Mobility
The “ballistic mobility” is a reflection of the ballistic quantum contact conductance, and imposes severe limitation on the apparent channel mobility in III-V transistors when the gate length scales down to ballistic regime. The apparent channel mobility µapp is defined from the linear region of the Id–VDS as
Id ≡W
LgµappCG (VGS − VT )VDS .
(3.7)
Since the current in a ballistic FET is independent of channel length, it is clear that the apparent mobility must be a channel length dependent quantity. The apparent channel mobility µapp is the combination of the “ballistic mobility” µB and the bulk mobility µ0 through the Mathiessen’s rule [41]:
1
µapp=
1
µB+
1
µ0.
(3.8)
From ballistic theory, µB can be calculated from
µB =
υT · Lg
VDS
i
1/2(ηFS,i)− 1/2(ηFD,i)
i
0(ηFS,i)+ 0(ηFD,i)
, (3.9)
where υT =
2kBT/πmc, mc is the transport effective mass; Lg is the gate length; VDS is the intrinsic drain bias; and 1/2(x),0(x), are the Fermi-Dirac integrals of order 1/2 and 0, with ηFS,i = (EFS − Ei)/kBT , ηFD,i = ηFS,i − q0VDS/kBT . Assuming VDS kBT/q0, and only one subband occupied, Eq. (3.9) reduces to [42, 43]:
µB =υT · Lg
2kBT/q0·−1/2(ηFS,1)
0(ηFS,1).
(3.10)
In the nondegenerate limit, the ratio of Fermi-Dirac integrals reduces to unity.Equation (3.8) can well explain the mobility of the transistors in both ballistic
and diffusive limit; when the gate length Lg is so short that the transistor is in the ballistic limit, the apparent channel mobility is just the ballistic mobility. When Lg is much longer than the mean-free-path, the device is in the diffusive limit, and Lg in Eq. (3.9) is replaced with the carrier’s mean free path, λ0, so the apparent channel mobility will be largely determined by the bulk mobility.
The ballistic mobility can also be obtained from the simulated linear ballistic Id–VDS:
Id = Qi · µB · VDS/Lg , (3.11)

413 Device Physics and Performance Potential of III-V Field-Effect Transistors
where Qi is the charge density at the top of the barrier. Figure 3.7a compares µB vs. VGS as obtained from Eqs. (3.9) and (3.11) respectively for the 45 and 125 nm HEMTs; the two methods give very close results. Note that the gate-length depend-ent µB is much smaller than the bulk mobility (~10,000 cm2/V s), and therefore it degrades the apparent mobility significantly. This effect is shown in Fig. 3.7b, where µapp is calculated from Eq. (3.8) with µ0 = 10,000 cm2/V s10,000 cm2/V s, and plotted as a function of VGS for 45 and 125 nm HEMTs. The point is that the large bulk mobilities of III-V materials will not be reflected in the apparent mobility that describes the linear region of a FET.
3.3.5 Source Design Issues
Fischetti and Laux have pointed out the importance of source design considera-tions such as access geometry and source starvation for III-V transistors [14, 18, 19]. The first issue refers to the fact that the source access geometry may restrict the flow of carriers into the channel. Source starvation refers to the condition when the source is unable to inject electrons into longitudinal momentum states in the channel—these states become depleted, or “starved”. In addition, a third effect may also occur.
Transistors operate by modulating potential energy barriers [44, 45]. As the gate voltage increases, the potential energy barrier decreases, and the charge in the channel increases. When the gate voltage increases to the point where the bar-rier is removed and the channel charge is equal to the charge in the source, the transistor drops. In other words, there can’t be more charge in the channel than in the source. This effect has been called “source exhaustion” [46, 47]. Its effect on the transistor’s IV characteristics is similar to that produced by the “source starvation” effect discussed by Fischetti [14, 19], but it is simply consequence of electrostatics.
Fig. 3.7 a The ballistic mobilities µB determined from Eqs. (3.9) and (3.11) are almost identical for 45 nm and 125 nm HEMTs respectively. b The apparent channel mobility µapp is gate length dependent and significantly degraded from the bulk mobility µ0 (= 10,000 cm2/V s) due to the small µB. The series resistance is RS = RD = 220 Ω µm
5000
4000
Eq. (9)Eq. (11)
3000
2000
10000 0.1 0.2
VGS [V]
VDS = 50 mV VDS = 50 mV
Lg = 125nm
Lg = 45 nm
Lg = 125 nm
Lg = 45 nm
0.3 0.4 0.5 0ba
0.1 0.2VGS [V]
0.3 0.4 0.5
µ B [c
m2 /V
-s]
5000
4000
3000
2000
1000
µ app [c
m2 /V
-s]

42 Y. Liu et al.
Our simulations do not capture the source access and source starvation effects, but they do include the possibility of source exhaustion. Source exhaustion is illus-trated in Fig. 3.8a, where the first subband profiles along the channel for delta-dop-ing equal to 2 × 1012 cm−2 and 5 × 1012 cm−2 at VGS = 0.38 V, VDS = 0.50 V (intrinsic) are compared for the Lg = 45 nm HEMT. For lower delta-doping, the barrier in the channel is smaller and reaches the same level as the “source” region beyond the gate at VGS = 0.38 V, while for the higher doping the barrier still exists. The electron sheet density at the almost flat potential barrier is 1.7 × 1012 cm−2, which is very close to the delta doping density, and the transistor begins to lose transconductance as the channel barrier vanishes. In ballistic simulations, this effect in simulation results in non-convergent results if VGS continues to increase (the effect is, however, simply a matter of electrostatics and is observed in drift/diffusion simulations as well.). In comparison, with a higher delta-doping of 5 × 1012 cm−2, the carrier sheet density at the top of the barrier is 2.3 × 1012 cm−2 at the same VGS = 0.38 V, and the larger barrier in the channel ensures the proper function of the transistor at increased gate bias. The doping effect on the HEMT’s Id–VDS characteristics is further shown in Fig. 3.8b, where it is noted that with other conditions remaining the same, higher delta-doping HEMT has larger current than that of the lower doping one. These sim-ulations illustrate the importance of achieving high carrier densities in the source of III-V FETs.
3.3.6 Role of S/D Tunneling
Source-drain tunneling degrades transistor performance by increasing the off-current and sub-threshold swing. It is an important limiting factor in devices with low transport effective mass and short gate lengths. The S/D tunneling effect in III-V HEMTs is explored by examining the energy-resolved current density for a
Fig. 3.8 a The first subband profile of the HEMT transistor indicates that the potential barrier of the low doping HEMT vanishes at smaller gate bias than the high doping HEMT. b The Id–VDS plot shows low delta-doping HEMT has smaller current than the one with higher delta doping at the same gate bias
0
a b
1600
VGS = 0.38 V
VDS = 0.50 V
VGS = 0.38 VEFS
δ doping: 2×10¹²/cm2
δ doping: 5×10¹²/cm2
δ doping: 2×10¹²/cm2
δ doping: 5×10¹²/cm2
EFD
1400
1200
1000
I d [µ
A/µ
m]
800
600
400
200
00 0.1 0.2
VDS [V]0.3 0.4 0.5
–0.1
–0.2
–0.4
–0.3
EC
[eV
]
–0.5
–0.6
–100 –50 0
X [nm]50 100

433 Device Physics and Performance Potential of III-V Field-Effect Transistors
long ( Lg = 125 nm) and a short ( Lg = 45 nm) gate length HEMT under both off and on states. Figure 3.9 plots the energy-resolved current density for the HEMTs at off ( VGS = 0 V, VDS = 0.5 V, intrinsic) and on ( VGS = VDS = 0.5 V, intrinsic) states. The first subband along the device is also shown. The S/D tunneling current component is the fraction of the current contributed by carriers with energy below the top of the bar-rier for each subband. It is observed that under on state conditions, S/D tunneling is an insignificant fraction of the total current for both HEMTs—the current is mainly contributed by carriers with energy larger than the small barrier under high gate bias. Under off state conditions, the S/D tunneling current accounts a larger fraction of the total current than in the on state for Lg = 45 nm device, and the fractional contribution is more in the Lg = 45 nm device than in the Lg = 125 nm device. The tunneling distance in shorter gate length HEMT is further reduced under off state conditions due to the larger drain-induced barrier lowering (DIBL) in the shorter devices, which is indicated by the Fermi level, top of the potential barrier, and the barrier thickness in this energy range in Fig. 3.9. For the III-V HEMTs being examined here, S/D tunneling is not significant; but it can be foreseen that as a target device with superior performance over Si at the 15 nm gate length regime and beyond, the III-V compound semiconductor channel transistors will have a larger S/D tunneling besides the gate leakage at off-state.
Fig. 3.9 The S/D tunneling is illustrated by the energy-resolved current density in the short and long gate length HEMTs at off and on states. The S/D tunneling effect is larger in shorter HEMTs at off state due to short gate length and larger DIBL
0
–0.1
–0.2
–0.3
–0.4
–0.5
–0.6
0
–0.1
–0.2
–0.3
–0.4
–0.5
–0.6
Ene
rgy
[eV
]E
nerg
y [e
V]
–100 –50 0 50 100X [nm]
–100 –50 0 50 100X [nm]
EFS
EFD
EFD
Id,tunnel
Id,OFF
EFS 1st subband
1st subband
OFF
ON
Lg = 45 nm
0
–0.2
–0.6
–150 –100 –50 0 50 100 150
–0.4Ene
rgy
[eV
]
X [nm]
EFS
EFD
OFF
Id,tunnel= 2.1%
Id,OFF
1st subband
Lg = 125 nm
0
–0.1
–0.2
–0.3
–0.4
–0.5
–0.6
Ene
rgy
[eV
]
–150 –100 –50 0 50 100 150X [nm]
EFS
EFD
1st subbandON
Id,tunnel = 2.9%Id,ON
Id,tunnel= 2.1%
Id,ON
= 8.2%

44 Y. Liu et al.
3.3.7 Back of the Envelope Calculations
As device dimensions continue to scale well into the nanoscale regime, rigorous treatment of transport using quantum mechanical simulations is necessary to quan-titatively predict and benchmark their performance. Simple theoretical calculations, however, often provide a more intuitive understanding of the device operations and estimates of key figures of merit like charge, mobility, and velocity at the top of the barrier. In this section, we analyze the performance of the Lg = 45 nm intrinsic ballistic HEMT using analytical calculations, and compare them with NEGF simu-lation results discussed in the previous sections. We will use a top of the barrier model with a single parabolic band in these equations, and assume temperature T = 0 K to keep the mathematics as simple as possible.
The charge at the top of the barrier can be expressed as Qi = CG(VGS − VT ), where CG is the gate capacitance. The gate capacitance consists of the insulator (dielectric) capacitance (Cins = εins/tins) and semiconductor (channel) capacitance (CS = −dQi/dψs) in series (see Eq. (3.1)). The semiconductor capacitance has con-tributions from the density of states (quantum capacitance CQ) and the modulation of subband energies (Eq. (3.2)). In general, a numerical simulation is required. For our back of the envelope estimate, however, we will replace CS by its upper limit CQ which at T = 0 K, can be expressed as
CQ =q2m∗
π h2 =εins
tins
(3.12)
Using the material parameters provided in Sect. 3.2.3, Δtins and CG are calculated to be 3.2 nm and 1.66 µF/cm2, reasonably close to the Δtins = 4.4 nm CG = 1.41 μF/cm2 obtained from the simulations. The result is actually closer than expected. From simulation, we know that two subbands are occupied. But we also know that the subband-modulation term in Eq. (3.2) is approximately 0.5 at high VGS for both sub-bands from Fig. 3.4b. The two factor-of-two errors cancel, which is why the final result is rather close to the simulations.
With this CG and an estimated threshold voltage VT = 0.057 V (at VDS = 0.05 V), the carrier density at the top of the barrier is NS = 4.5 × 1012 cm−2 at VGS = 0.5 V, compared with simulation results of NS = 3.1 × 1012 cm−2 mainly due to the differ-ence in the capacitance. Under on-current conditions ( VDS = 0.5 V), the density of states at the top of the barrier is only filled by carriers with positive momentum (going from source to drain), thus reducing CQ by half, and the corresponding gate capacitance decreases to CG = 1.1 μF/cm2. The threshold voltage is also reduced to VT = –0.008 V due to effects of 2D electrostatics ( DIBL = 145 mV/V). The charge under on-state conditions ( VGS = VDS = 0.5 V) is 3.5 × 1012 cm−2, compared to 3.2 × 1012 cm−2 from the simulations. The conclusion is that estimating the inversion charge in the on state by integrating the equilibrium C–V curve as in Eq. (3.5) will over-estimate the charge because the semiconductor capacitance decreased under high drain bias.
453 Device Physics and Performance Potential of III-V Field-Effect Transistors
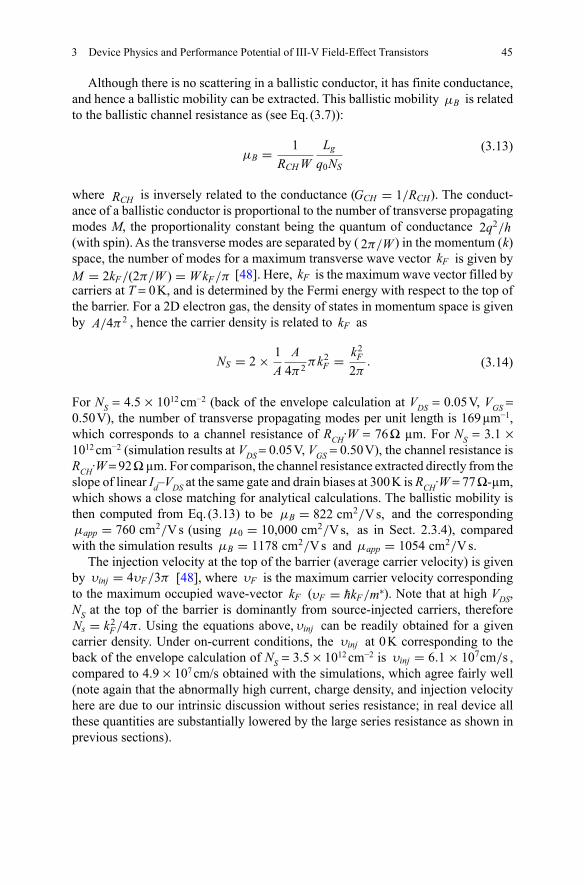
Although there is no scattering in a ballistic conductor, it has finite conductance, and hence a ballistic mobility can be extracted. This ballistic mobility µB is related to the ballistic channel resistance as (see Eq. (3.7)):
µB =1
RCH W
Lg
q0NS
(3.13)
where RCH is inversely related to the conductance (GCH = 1/RCH). The conduct-ance of a ballistic conductor is proportional to the number of transverse propagating modes M, the proportionality constant being the quantum of conductance 2q2/h (with spin). As the transverse modes are separated by ( 2π/W ) in the momentum ( k) space, the number of modes for a maximum transverse wave vector kF is given by M = 2kF/(2π/W ) = W kF/π [48]. Here, kF is the maximum wave vector filled by carriers at T = 0 K, and is determined by the Fermi energy with respect to the top of the barrier. For a 2D electron gas, the density of states in momentum space is given by A/4π2 , hence the carrier density is related to kF as
NS = 2×1
A
A
4π2πk2
F =k2
F
2π.
(3.14)
For NS = 4.5 × 1012 cm−2 (back of the envelope calculation at VDS = 0.05 V, VGS = 0.50 V), the number of transverse propagating modes per unit length is 169 µm−1, which corresponds to a channel resistance of RCH·W = 76 Ω µm. For NS = 3.1 × 1012 cm−2 (simulation results at VDS = 0.05 V, VGS = 0.50 V), the channel resistance is RCH·W = 92 Ω µm. For comparison, the channel resistance extracted directly from the slope of linear Id–VDS at the same gate and drain biases at 300 K is RCH·W = 77 Ω-µm, which shows a close matching for analytical calculations. The ballistic mobility is then computed from Eq. (3.13) to be µB = 822 cm2/V s, and the corresponding µapp = 760 cm2/V s (using µ0 = 10,000 cm2/V s, as in Sect. 2.3.4), compared with the simulation results µB = 1178 cm2/V s and µapp = 1054 cm2/V s.
The injection velocity at the top of the barrier (average carrier velocity) is given by υinj = 4υF/3π [48], where υF is the maximum carrier velocity corresponding to the maximum occupied wave-vector kF (υF = hkF/m∗). Note that at high VDS, NS at the top of the barrier is dominantly from source-injected carriers, thereforeNs = k2
F/4π.. Using the equations above, υinj can be readily obtained for a given carrier density. Under on-current conditions, the υinj at 0 K corresponding to the back of the envelope calculation of NS = 3.5 × 1012 cm−2 is υinj = 6.1× 107cm/s , compared to 4.9 × 107 cm/s obtained with the simulations, which agree fairly well (note again that the abnormally high current, charge density, and injection velocity here are due to our intrinsic discussion without series resistance; in real device all these quantities are substantially lowered by the large series resistance as shown in previous sections).
46 Y. Liu et al.
3.4 Conclusions
In this chapter we have investigated the performance as well as the device physics of recently reported InGaAs HEMTs by using a self-consistent quantum ballistic NEGF model based on effective masses in mode space. Good quantitative agree-ment between simulation and experimental data indicates that the III-V HEMTs with gate length ~40 nm operate rather close to the ballistic limit. Compared to the simulation results, the smaller drive current reported from experiments at either higher gate bias or longer gate length devices is probably due to phonon scattering degradation. Note that the large series resistance severely limits the III-V HEMTs performance; optimizing the source/drain contacts structure to minimize the series resistance will be critical for future III-V transistors designing, and may amplify the difference between theory and experiment under high gate bias.
The small effective mass in the III-V compound semiconductors has both posi-tive and negative effects on the device performance. The direct positive effect is that the III-V HEMTs ballistic injection velocity is as high as ~3 × 107 cm/s, as deter-mined from both simulation and experiments. The DOS bottle-neck is a negative effect that degrades the gate capacitance by effectively increasing the upper barrier layer thickness by almost 100%. The resulting electron density at the virtual source is comparably small at on-state, which limits the drive current.
We also found that the apparent channel mobility in III-V HEMT devices is significantly degraded from its very large bulk mobility due to the comparably very small “ballistic mobility”, which becomes important as the device channel length scales down to the ballistic limit regime. The δ-doping effects on the source design-ing were also investigated. Lower δ-doping will improve S and DIBL, but the cur-rent is smaller due to the smaller energy range between the source Fermi level and the top of the barrier. Besides, the top of the barrier tends to disappear at relatively smaller intrinsic gate bias, after which the device will become dysfunctional. Next the S/D tunneling in III-V HEMTs was found insignificant at gate length of 40 nm; it is however, foreseen to become severe when the gate length approaches 15 nm and beyond. Finally, the intrinsic simulation results can be well explained by theoretical calculations with simple device physics based on a top-of-the-barrier model, which helps the understanding of the device operational mechanism as a reference to the 2D simulation.
The next challenge to address is the lowering of the series resistance, because Fig. 3.3 shows that if the series resistance can be decreased to values typical of sili-con MOSFETs, then III-V FETs would offer high drive current at power supply of one-half of silicon.
Acknowledgement This work was supported by the Focus Center Research Program (FCRP) through the center for Materials, Structures, and Devices (MSD). Computational support was pro-vided by the Network for Computational Nanotechnology which is supported by the National Science Foundation under Grant No. EEC—0634750. One of the authors (MSL) acknowledges illuminating discussions with M.V. Fischetti at the University of Massachusetts and T. Rakshit at Intel.

473 Device Physics and Performance Potential of III-V Field-Effect Transistors
References
1. D. A. Antoniadis and A. Khakifirooz, “MOSFET performance scaling: Limitations and future options,” IEEE International Electron Devices Meeting 2008, Technical Digest, pp. 253–256, 2008.
2. K. Mistry, C. Allen, C. Auth, B. Beattie, D. Bergstrom, M. Bost, M. Brazier, M. Buehler, A. Cappellani, R. Chau, C. H. Choi, G. Ding, K. Fischer, T. Ghani, R. Grover, W. Han, D. Hanken, M. Hatttendorf, J. He, J. Hicks, R. Huessner, D. Ingerly, P. Jain, R. James, L. Jong, S. Joshi, C. Kenyon, K. Kuhn, K. Lee, H. Liu, J. Maiz, B. McIntyre, P. Moon, J. Neirynck, S. Pei, C. Parker, D. Parsons, C. Prasad, L. Pipes, M. Prince, P. Ranade, T. Reynolds, J. Sand-ford, L. Schifren, J. Sebastian, J. Seiple, D. Simon, S. Sivakumar, P. Smith, C. Thomas, T. Troeger, P. Vandervoorn, S. Williams, and K. Zawadzki, “A 45 nm logic technology with high-k plus metal gate transistors, strained silicon, 9 Cu interconnect layers, 193 nm dry patterning, and 100% Pb-free packaging,” 2007 IEEE International Electron Devices Meeting, vol. 1 and 2, pp. 247–250, 2007.
3. S. Natarajan, M. Armstrong, M. Bost, R. Brain, M. Brazier, C.-H. Chang, V. Chikarmane, and M. Childs, “A 32 nm logic technology featuring 2nd-generation High-k+Metal-Gate transis-tors, enhanced channel strain and 0.171 um2 SRAM cell size in a 291 Mb array,” 2008 IEEE International Electron Devices Meeting, pp. 941–943, 2008.
4. M. Passlack, P. Zurcher, K. Rajagopalan, R. Droopad, J. Abrokwah, M. Tutt, Y. B. Park, E. Johnson, O. Hartin, A. Zlotnicka, P. Fejes, R. J. W. Hill, D. A. J. Moran, X. Li, H. Zhou, D. Macintyre, S. Thoms, A. Asenov, K. Kalna, and I. G. Thayne, “High mobility III-V MOS-FETs for RF and digital applications,” 2007 IEEE International Electron Devices Meeting, vol. 1 and 2, pp. 621–624, 2007.
5. Y. Sun, E. W. Kiewra, J. P. de Souza, J. J. Bucchignano, and K. E. Fogel, “Scaling of In_0.7Ga_0.3As buried-channel MOSFETs,” 2008 IEEE International Electron Devices Meeting, pp. 367–370, 2008.
6. Y. Xuan, T. Shen, M. Xu, Y. Q. Wu, and P. D. Ye, “High-performance surface channel in-rich In_0.75Ga_0.25As MOSFETs with ALD High-k as gate dielectric,” 2008 IEEE Interna-tional Electron Devices Meeting, pp. 371–374, 2008.
7. D. H. Kim and J. A. del Alamo, “Scaling behavior of In0.7Ga0.3AsHEMTs for logic,” 2006 IEEE International Electron Devices Meeting, vol. 1 and 2, pp. 587–590, 2006.
8. D. H. Kim and J. A. del Alamo, “Logic performance of 40 nm InAsHEMTs,” 2007 IEEE Inter-national Electron Devices Meeting, vol. 1 and 2, pp. 629–632, 2007.
9. D. H. Kim and J. A. del Alamo, “30 nm E-mode InAs PHEMTs for THz and future logic appli-cations,” 2008 IEEE International Electron Devices Meeting, pp. 719–722, 2008.
10. G. Dewey, M. K. Hudait, K. Lee, R. Pillarisetty, W. Rachmady, M. Radosavljevic, T. Rakshit, and R. Chau, “Carrier transport in high-mobility III-V quantum-well transistors and perform-ance impact for high-speed low-power logic applications,” IEEE Electron Device Letters, vol. 29, pp. 1094–1097, Oct 2008.
11. M. Radosavljevic, T. Ashley, A. Andreev, S. D. Coomber, G. Dewey, and M. T. Emeny, “High-performance 40 nm gate length InSb P-Channel compressively strained quantum well field effect transistors for low-power (Vcc = 0.5 V) logic applications,” 2008 IEEE International Electron Devices Meeting, pp. 727–730, 2008.
12. A. Pethe, T. Krishnamohan, D. Kim, S. Oh, H.-S. P. Wong, Y. Nishi, and K. C. Saraswat, “Investigation of the performance limits of III-V double-gate n-MOSFETs,” IEEE IEDM Technical Digest, pp. 605–608, 2005.
13. K. D. Cantley, Y. Liu, H. S. Pal, T. Low, S. S. Ahmed, and M. S. Lundstrom, “Performance analysis of III-V materials in a double-gate nano-MOSFET,” 2007 IEEE International Elec-tron Devices Meeting, vol. 1 and 2, pp. 113–116, 2007.
14. M. V. Fischetti, L. Wang, B. Yu, C. Sachs, P. M. Asbeck, Y. Taur, and M. Rodwell, “Simula-tion of electron transport in high-mobility MOSFETs: Density of states bottleneck and source

48 Y. Liu et al.
starvation,” 2007 IEEE International Electron Devices Meeting, vol. 1 and 2, pp. 109–112, 2007.
15. M. Luisier, N. Neophytou, N. Kharche, and G. Klimeck, “Full-band and atomistic simula-tion of realistic 40 nm InAs HEMT,” 2008 IEEE International Electron Devices Meeting, pp. 887–890, 2008.
16. M. V. Fischetti and S. E. Laux, “Monte-Carlo simulation of transport in technologically sig-nificant semiconductors of the diamond and zincblende structures. II. Submicrometer MOS-FETs,” IEEE Transactions on Electron Devices, vol. 38, pp. 650–660, Mar 1991.
17. P. M. Solomon and S. E. Laux, “The ballistic FET: Design, capacitance and speed limit,” 2001 IEEE International Electron Devices Meeting, pp. 5.1.1–5.1.4, 2001.
18. S. E. Laux, “A simulation study of the switching times of 22-and 17-nm gate-length SOI nFETs on high mobility substrates and Si,” IEEE Transactions on Electron Devices, vol. 54, pp. 2304–2320, Sep 2007.
19. M. V. Fischetti, T. P. O’Regan, S. Narayanan, C. Sachs, S. Jin, J. Kim, and Y. Zhang, “Theo-retical study of some physical aspects of electronic transport in nMOSFETs at the 10-nm gate-length,” IEEE Transactions on Electron Devices, vol. 54, pp. 2116–2136, Sep 2007.
20. N. Neophytou, T. Rakshit, and M. Lundstrom, “Performance analysis of 60-nm gate-length III-V InGaAs HEMTs: Simulations versus experiments,” IEEE Transactions on Electron Devices, vol. 56, pp. 1377–1387, 2009.
21. H. S. Pal, T. Low, and M. S. Lundstrom, “NEGF analysis of InGaAs Schottky barrier dou-ble gate MOSFETs,” IEEE International Electron Devices Meeting 2008, Technical Digest, pp. 891–894, 2008.
22. D. H. Kim and J. A. del Alamo, “Lateral and vertical scaling of In0.7Ga0.3As HEMTs for Post-Si-CMOS logic applications,” IEEE Transactions on Electron Devices, vol. 55, pp. 2546–2553, Oct 2008.
23. S. Datta, “Nanoscale device modeling: The Green’s function method,” Superlattices and Microstructures, vol. 28, pp. 253–278, Oct 2000.
24. R. Venugopal, S. Goasguen, S. Datta, and M. S. Lundstrom, “Quantum mechanical analysis of channel access geometry and series resistance in nanoscale transistors,” Journal of Applied Physics, vol. 95, pp. 292–305, Jan 2004.
25. Z. B. Ren, R. Venugopal, S. Goasguen, S. Datta, and M. S. Lundstrom, “nanoMOS 2.5: A two-dimensional simulator for quantum transport in double-gate MOSFETs,” IEEE Transactions on Electron Devices, vol. 50, pp. 1914–1925, Sep 2003.
26. Y. Liu and M. Lundstrom, “Simulation of III-V HEMTs for high-speed low-power logic appli-cations,” ECS Transactions, vol. 19, pp. 331–342, 2009.
27. Y. Liu, N. Neophytou, G. Klimeck, and M. S. Lundstrom, “Band-structure effects on the per-formance of III-V ultrathin-body SOI MOSFETs,” IEEE Transactions on Electron Devices, vol. 55, pp. 1116–1122, May 2008.
28. G. Klimeck, S. S. Ahmed, H. Bae, N. Kharche, R. Rahman, S. Clark, B. Haley, S. H. Lee, M. Naumov, H. Ryu, F. Saied, M. Prada, M. Korkusinski, and T. B. Boykin, “Atomistic simu-lation of realistically sized nanodevices using NEMO 3-D—Part I: Models and benchmarks,” IEEE Transactions on Electron Devices, vol. 54, pp. 2079–2089, Sep 2007.
29. I. Vurgaftman, J. R. Meyer, and L. R. Ram-Mohan, “Band parameters for III-V compound semiconductors and their alloys,” Journal of Applied Physics, vol. 89, pp. 5815–5875, Jun 2001.
30. D. F. Welch, G. W. Wicks, and L. F. Eastman, “Calculation of the conduction-band disconti-nuity for Ga0.47In0.53As-Al0.48In0.52As heterojunction,” Journal of Applied Physics, vol. 55, pp. 3176–3179, 1984.
31. C. K. Peng, A. Ketterson, H. Morkoc, and P. M. Solomon, “Determination of the conduc-tion-band discontinuity between In0.53Ga0.47As,” Journal of Applied Physics, vol. 60, pp. 1709–1712, Sep 1986.
32. D. H. Kim and J. A. del Alamo, “Scalability of sub-100 nm thin-channel InAs PHEMTs,” IEEE International Conference on Indium Phosphide & Related Materials, pp. 132–135, 2009.
33. D. A. Antoniadis and D. H. Kim, Private Communication, 2009.

493 Device Physics and Performance Potential of III-V Field-Effect Transistors
34. D. H. Kim and J. A. del Alamo, “30 nm InAs pseudomorphic HEMTs on an InP substrate with a current-gain cutoff frequency of 628 GHz,” IEEE Electron Device Letters, vol. 29, pp. 830–833, Aug 2008.
35. W. Y. Quan, D. M. Kim, and H. D. Lee, “Quantum C−V modeling in depletion and inversion: Accurate extraction of electrical thickness of gate oxide in deep submicron MOSFETs,” IEEE Transactions on Electron Devices, vol. 49, pp. 889–894, May 2002.
36. A. Rahman, J. Guo, S. Datta, and M. S. Lundstrom, “Theory of ballistic nanotransistors,” IEEE Transactions on Electron Devices, vol. 50, pp. 1853–1864, Sep 2003.
37. K. Natori, “Ballistic metal-oxide-semiconductor field-effect transistor,” Journal of Applied Physics, vol. 76, pp. 4879–4890, Oct 1994.
38. A. Lochtefeld and D. A. Antoniadis, “On experimental determination of carrier velocity in deeply scaled NMOS: How close to the thermal limit?,” IEEE Electron Device Letters, vol. 22, pp. 95–97, Feb 2001.
39. A. Lochtefeld, I. J. Djomehri, G. Samudra, and D. A. Antoniadis, “New insights into carrier transport in n-MOSFETs,” IBM Journal of Research and Development, vol. 46, pp. 347–357, Mar–May 2002.
40. J. A. del Alamo, FCRP e-Workshop, Apr 2009.41. M. S. Shur, “Low ballistic mobility in submicron HEMTs,” IEEE Electron Device Letters, vol.
23, pp. 511–513, Sep 2002.42. J. Wang and M. Lundstrom, “Ballistic transport in high electron mobility transistors,” IEEE
Transactions on Electron Devices, vol. 50, pp. 2185, Oct 2003.43. M. Zilli, D. Esseni, P. Palestri, and L. Selmi, “On the apparent mobility in nanometric n-MOS-
FETs,” IEEE Electron Device Letters, vol. 28, pp. 1036–1039, Nov 2007.44. E. O. Johnson, “Insulated-gate field-effect transistor—Bipolar transistor in disguise,” Rca
Review, vol. 34, pp. 80–94, 1973.45. M. Lundstrom and Z. B. Ren, “Essential physics of carrier transport in nanoscale MOSFETs,”
IEEE Transactions on Electron Devices, vol. 49, pp. 133–141, Jan 2002.46. T. J. Walls, V. A. Sverdlov, and K. K. Likharev, “MOSFETs below 10 nm: Quantum theory,”
Physica E-Low-Dimensional Systems & Nanostructures, vol. 19, pp. 23–27, Jul 2003.47. Y. Naveh and K. K. Likharev, “Modeling of 10-nm-scale ballistic MOSFET’s,” IEEE Electron
Device Letters, vol. 21, pp. 242–244, May 2000.48. M. Lundstrom and J. Guo, “Nanoscale transistors: Device physics, modeling and simulation,”
Springer, New York, 2005.