Embed Size (px)
Citation preview
43Chapter title
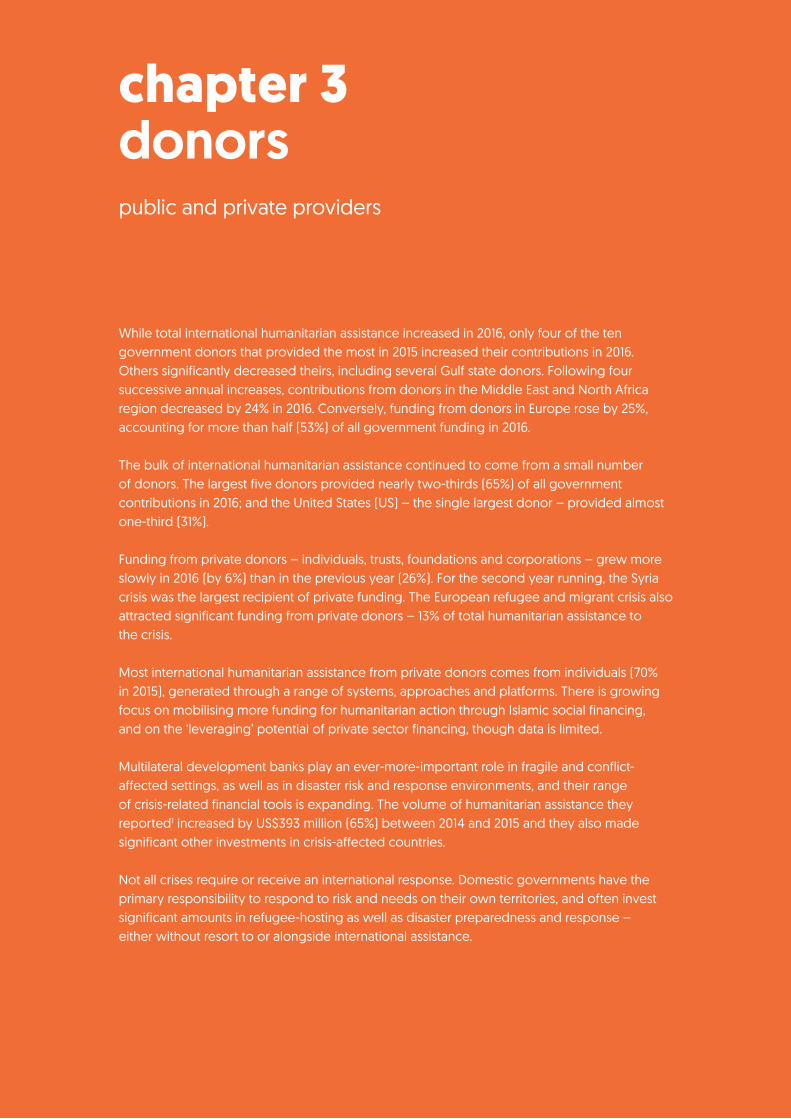
While total international humanitarian assistance increased in 2016, only four of the ten government donors that provided the most in 2015 increased their contributions in 2016. Others significantly decreased theirs, including several Gulf state donors. Following four successive annual increases, contributions from donors in the Middle East and North Africa region decreased by 24% in 2016. Conversely, funding from donors in Europe rose by 25%, accounting for more than half (53%) of all government funding in 2016.
The bulk of international humanitarian assistance continued to come from a small number of donors. The largest five donors provided nearly two-thirds (65%) of all government contributions in 2016; and the United States (US) – the single largest donor – provided almost one-third (31%).
Funding from private donors – individuals, trusts, foundations and corporations – grew more slowly in 2016 (by 6%) than in the previous year (26%). For the second year running, the Syria crisis was the largest recipient of private funding. The European refugee and migrant crisis also attracted significant funding from private donors – 13% of total humanitarian assistance to the crisis.
Most international humanitarian assistance from private donors comes from individuals (70% in 2015), generated through a range of systems, approaches and platforms. There is growing focus on mobilising more funding for humanitarian action through Islamic social financing, and on the ‘leveraging’ potential of private sector financing, though data is limited.
Multilateral development banks play an ever-more-important role in fragile and conflict-affected settings, as well as in disaster risk and response environments, and their range of crisis-related financial tools is expanding. The volume of humanitarian assistance they reported1 increased by US$393 million (65%) between 2014 and 2015 and they also made significant other investments in crisis-affected countries.
Not all crises require or receive an international response. Domestic governments have the primary responsibility to respond to risk and needs on their own territories, and often invest significant amounts in refugee-hosting as well as disaster preparedness and response – either without resort to or alongside international assistance.
chapter 3donors public and private providers
44chapter 3: donors
International government funding: largest donors
International humanitarian assistance from public donors – including governments and the EU institutions – rose from US$19.2 billion in 2015 to US$20.3 billion in 2016, its fourth consecutive annual increase. However, at 6%, growth was significantly lower than in the previous three years, which saw rises of 8%, 26% and 20% respectively.
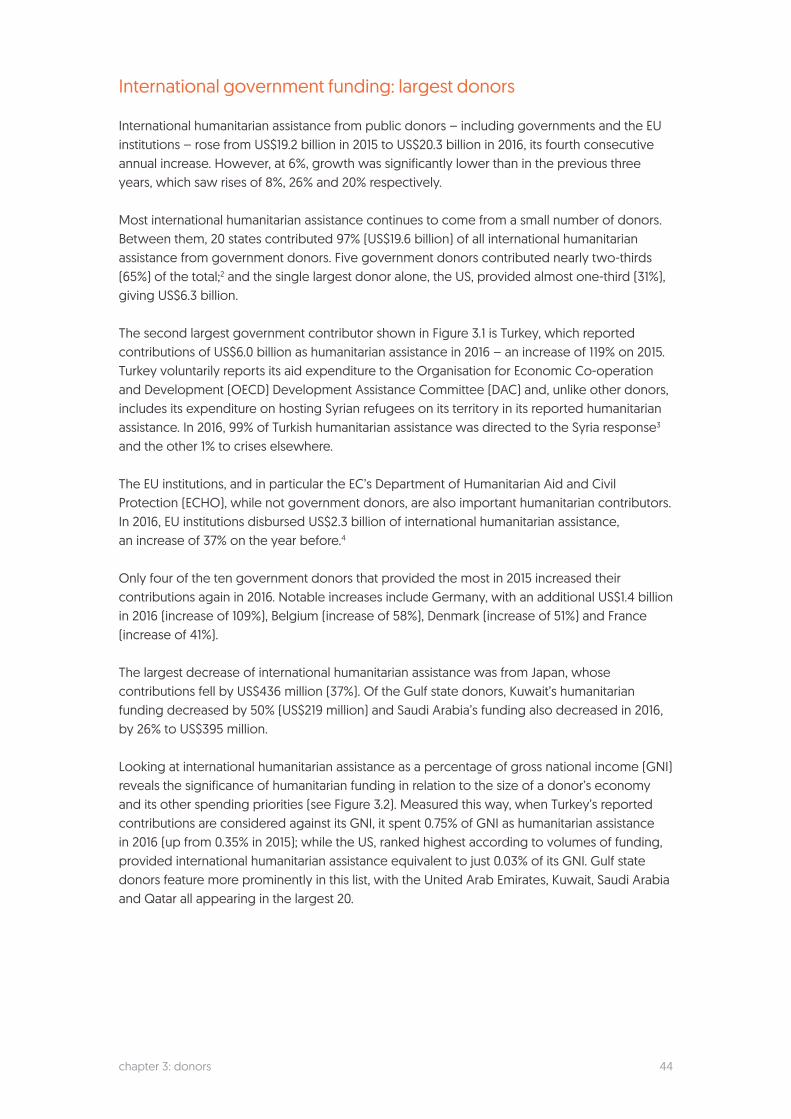
Most international humanitarian assistance continues to come from a small number of donors. Between them, 20 states contributed 97% (US$19.6 billion) of all international humanitarian assistance from government donors. Five government donors contributed nearly two-thirds (65%) of the total;2 and the single largest donor alone, the US, provided almost one-third (31%), giving US$6.3 billion.
The second largest government contributor shown in Figure 3.1 is Turkey, which reported contributions of US$6.0 billion as humanitarian assistance in 2016 – an increase of 119% on 2015. Turkey voluntarily reports its aid expenditure to the Organisation for Economic Co-operation and Development (OECD) Development Assistance Committee (DAC) and, unlike other donors, includes its expenditure on hosting Syrian refugees on its territory in its reported humanitarian assistance. In 2016, 99% of Turkish humanitarian assistance was directed to the Syria response3 and the other 1% to crises elsewhere.
The EU institutions, and in particular the EC’s Department of Humanitarian Aid and Civil Protection (ECHO), while not government donors, are also important humanitarian contributors. In 2016, EU institutions disbursed US$2.3 billion of international humanitarian assistance, an increase of 37% on the year before.4
Only four of the ten government donors that provided the most in 2015 increased their contributions again in 2016. Notable increases include Germany, with an additional US$1.4 billion in 2016 (increase of 109%), Belgium (increase of 58%), Denmark (increase of 51%) and France (increase of 41%).
The largest decrease of international humanitarian assistance was from Japan, whose contributions fell by US$436 million (37%). Of the Gulf state donors, Kuwait’s humanitarian funding decreased by 50% (US$219 million) and Saudi Arabia’s funding also decreased in 2016, by 26% to US$395 million.
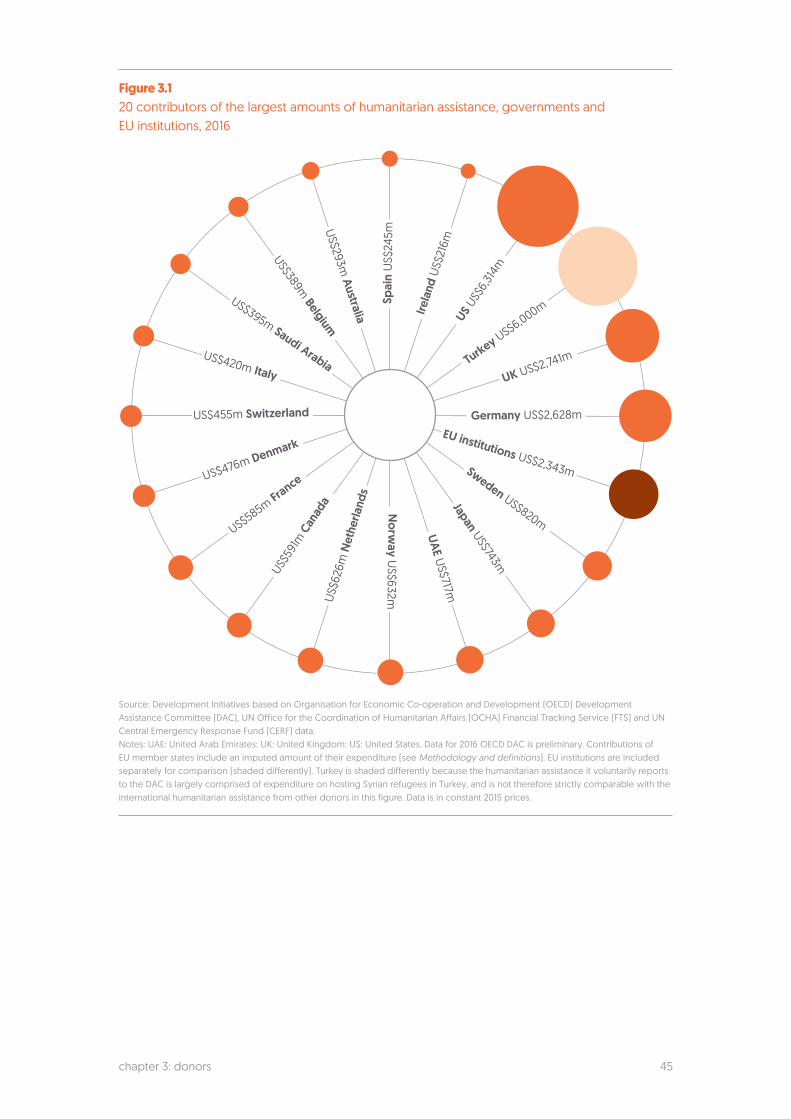
Looking at international humanitarian assistance as a percentage of gross national income (GNI) reveals the significance of humanitarian funding in relation to the size of a donor’s economy and its other spending priorities (see Figure 3.2). Measured this way, when Turkey’s reported contributions are considered against its GNI, it spent 0.75% of GNI as humanitarian assistance in 2016 (up from 0.35% in 2015); while the US, ranked highest according to volumes of funding, provided international humanitarian assistance equivalent to just 0.03% of its GNI. Gulf state donors feature more prominently in this list, with the United Arab Emirates, Kuwait, Saudi Arabia and Qatar all appearing in the largest 20.
45chapter 3: donors
Figure 3.120 contributors of the largest amounts of humanitarian assistance, governments and EU institutions, 2016
Source: Development Initiatives based on Organisation for Economic Co-operation and Development (OECD) Development Assistance Committee (DAC), UN Office for the Coordination of Humanitarian Affairs (OCHA) Financial Tracking Service (FTS) and UN Central Emergency Response Fund (CERF) data. Notes: UAE: United Arab Emirates: UK: United Kingdom: US: United States. Data for 2016 OECD DAC is preliminary. Contributions of EU member states include an imputed amount of their expenditure (see Methodology and definitions). EU institutions are included separately for comparison (shaded differently). Turkey is shaded differently because the humanitarian assistance it voluntarily reports to the DAC is largely comprised of expenditure on hosting Syrian refugees in Turkey, and is not therefore strictly comparable with the international humanitarian assistance from other donors in this figure. Data is in constant 2015 prices.
Spai
n U
S$24
5m
US$293m
Australia
US$389m Belgium
US$395m Saudi ArabiaUS$420m Italy
US$455m Switzerland
US$476m Denmark
US$585m France
US$59
1m C
anad
a U
S$62
6m N
ethe
rland
sUAE U
S$717mJapan US$743m
Sweden US$820m
EU institutions US$2,343m
Germany US$2,628m
UK US$2,741m Turkey US$6,000m
US U
S$6,
314m
Irel
and
US$
216m
Norw
ay US$632m
46chapter 3: donors
Figure 3.220 donors providing the most humanitarian assistance as percentage of GNI, 2016
Source: Development Initiatives based on OECD DAC, UN OCHA FTS, UN CERF. World Bank World Development Indicators and International Monetary Fund World Economic Outlook data. Notes: UAE: United Arab Emirates: UK: United Kingdom: US: United States. Data for 2016 OECD DAC is preliminary. GNI data for 2016 has been estimated using historical data on GNI and real GDP growth rates for 2016. Turkey is shaded differently because the humanitarian assistance it voluntarily reports to the DAC is largely comprised of expenditure on hosting Syrian refugees in Turkey, and is not therefore strictly comparable with the international humanitarian assistance from other donors in this figure.
Cana
da 0
.03%
0.03% U
S
0.04% Iceland
0.04% Nauru0.05% Saudi Arabia
0.06% Finland
0.06% Switzerland
0.07% Germany
0.07%
Net
herla
nds
0.08
% B
elgi
umU
K 0.09%Kuw
ait 0.13%
Norway 0.13%
Denmark 0.14%
Sweden 0.14%
Luxembourg 0.15%
UAE 0.18%
Turk
ey 0
.75%
Qat
ar 0
.02%
Ireland 0.08%
47chapter 3: donors
International government funding: donor regions
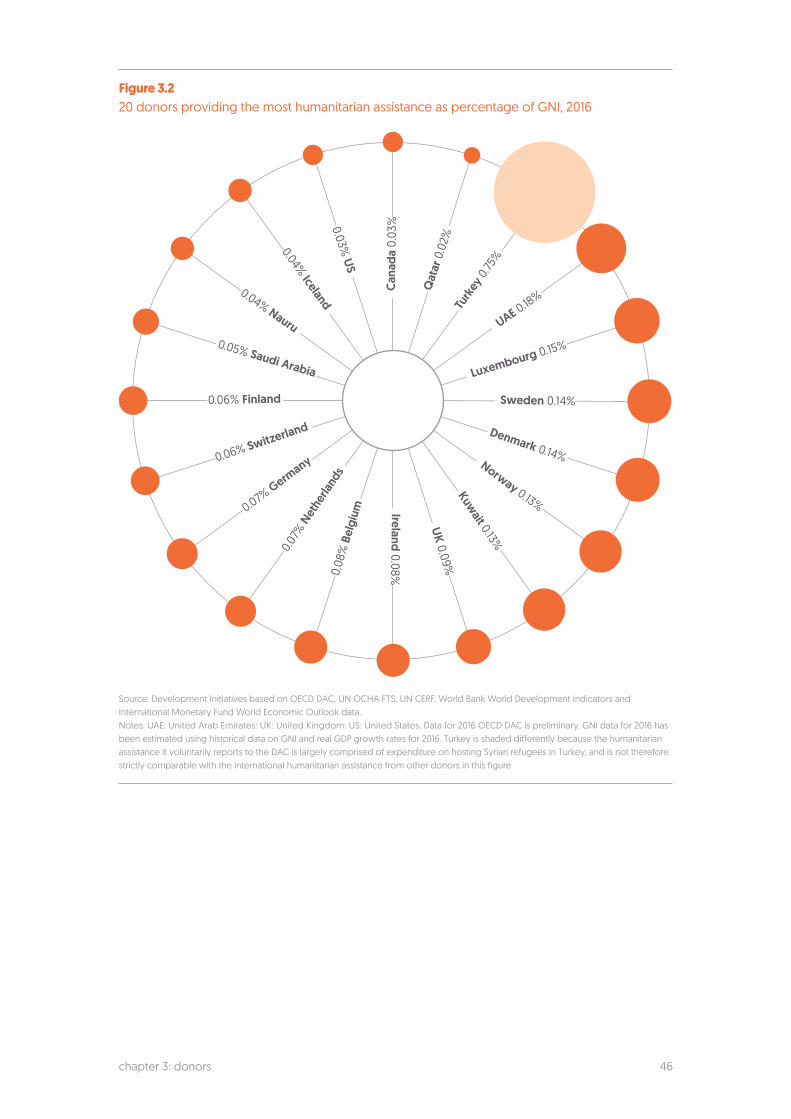
Figure 3.3International humanitarian assistance from governments by donor region, 2012–2016
Source: Development Initiatives based on OECD DAC, UN CERF and UN OCHA FTS data. Notes: OECD DAC data for 2016 is preliminary. Funding from OECD DAC donors includes contributions from EU institutions. OECD country naming has been used for regions, except the Middle East and North of Sahara, which have been combined. 'Other regions' includes the combined total of regions where funding was below US$1 billion over the 5-year period. Calculations only include humanitarian assistance spent internationally, not in-country. See Methodology and definitions. Data is in constant 2015 prices.
More than half (53%) of funding from government donors came from countries in Europe in 2016. Their contributions increased by 25% from the previous year and almost doubled in the five years between 2012 and 2016 (see Figure 3.3). Data from UN Office for the Coordination of Humanitarian Affairs (OCHA) Financial Tracking Service (FTS) suggests that growth from European governments was driven by large increases to countries such as Iraq, Syria, Nigeria and Ethiopia.
Conversely, funding from governments in the Middle East and North of Sahara region decreased by 24% in 2016. This follows successive increases in funding from donors in the Middle East over the previous four years. In 2016, the region’s contributions accounted for around 7% of total government funding (compared with 9% the previous year). Decreases were largely driven by a 50% reduction in contributions from the Government of Kuwait and reduced funding from Qatar (down 57%) and Saudi Arabia (down 26%). FTS data shows that funding from Middle East donors to many countries in the region fell, with Yemen experiencing a particularly sharp drop, as well as funding to Lebanon, Turkey and Jordan.
Government donor funding in the Far East Asia region was also down by 35% from 2015 to 2016. Relatively steady compared with other regions, contributions from donors in North and Central America (almost entirely from the US and Canada) decreased by 2% – the first fall in the last five years. These accounted for approximately 34% of funding from government donors in 2016.
0
2
4
6
8
10
12
2012 2013 2014 2015 2016
US$
billi
ons
Oceania
Europe
Middle East and North of Sahara
North and Central America
Far East Asia
Other
48chapter 3: donors
Multilateral development banks
Multilateral development banks (MDBs) are increasingly prominent in crisis financing, building on a portfolio of well-established engagement and instruments. For example, in 2009, the Asian Development Bank launched its Disaster Response Fund, the Inter-American Development Bank set up the Contingent Credit Facility for Natural Disasters and in the same year, the World Bank agreed the facility that later became the Crisis Response Window.
In 2016, new momentum generated a scale up in volumes of financing and the range of MDB mechanisms to tackle crisis risk, response and recovery. MDBs stated their commitments on protracted displacement at the World Humanitarian Summit (WHS),5 and the Grand Bargain also called for new humanitarian–development partnerships with MDBs.6
The World Bank in particular has prioritised its focus on crisis, recognising that climate change, fragility and conflict threaten progress towards the Sustainable Development Goals (SDGs) and risk pushing more people into extreme poverty (see Chapter 1).7 In September 2016, it launched the Global Crisis Response Platform, bringing together current and emerging crisis-related financial tools from across the Bank.8 Instruments include the refugee-related Concessional Financing Facility and Global Concessional Financing Facility (see Figure 2.11), and the nascent Pandemic Emergency Financing Facility (see Figure 2.10).9 New approaches were further bolstered by record levels of investment in the IDA18 Replenishment. Of the US$75 billion committed, the Bank agreed to dedicate nearly a fifth (US$14 billion) to address fragility, conflict and violence – double the previous amount.10
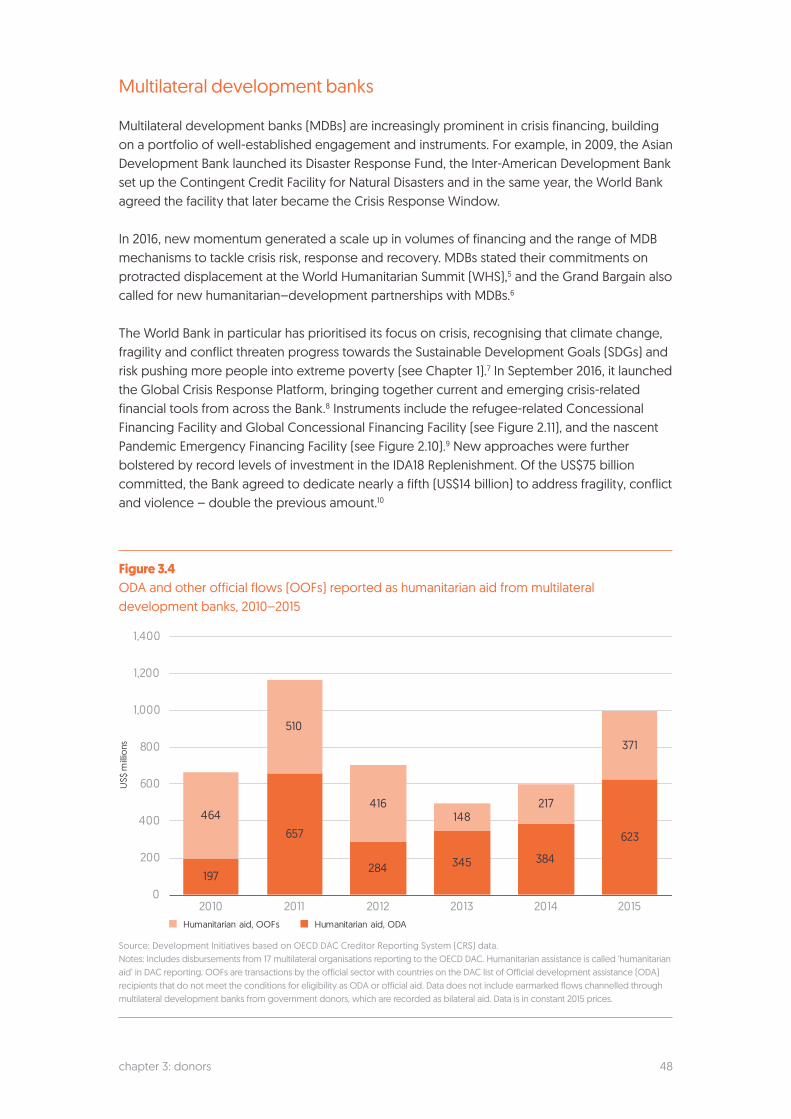
Figure 3.4ODA and other official flows (OOFs) reported as humanitarian aid from multilateral development banks, 2010–2015
Source: Development Initiatives based on OECD DAC Creditor Reporting System (CRS) data. Notes: Includes disbursements from 17 multilateral organisations reporting to the OECD DAC. Humanitarian assistance is called ‘humanitarian aid’ in DAC reporting. OOFs are transactions by the official sector with countries on the DAC list of Official development assistance (ODA) recipients that do not meet the conditions for eligibility as ODA or official aid. Data does not include earmarked flows channelled through multilateral development banks from government donors, which are recorded as bilateral aid. Data is in constant 2015 prices.
197
657
284 345 384
623
464
510
416148
217
371
0
200
400
600
800
1,000
1,200
1,400
2010 2011 2012 2013 2014 2015
US$
milli
ons
Humanitarian aid, OOFs Humanitarian aid, ODA
49chapter 3: donors
The volume of humanitarian assistance reported from MDBs as official development assistance (ODA) and other official flows (OOFs) both increased significantly between 2014 and 2015 to reach a total of US$994 million. Humanitarian assistance provided as ODA increased by 62%, reaching US$623 million, and within OOFs it increased by 71% to US$371 million (Figure 3.4). MDBs also provide considerable funding to crisis-affected countries beyond humanitarian assistance. However, with so many instruments and institutions involved, spanning crisis prevention to reconstruction, it is hard to put a total on these crisis-related investments.
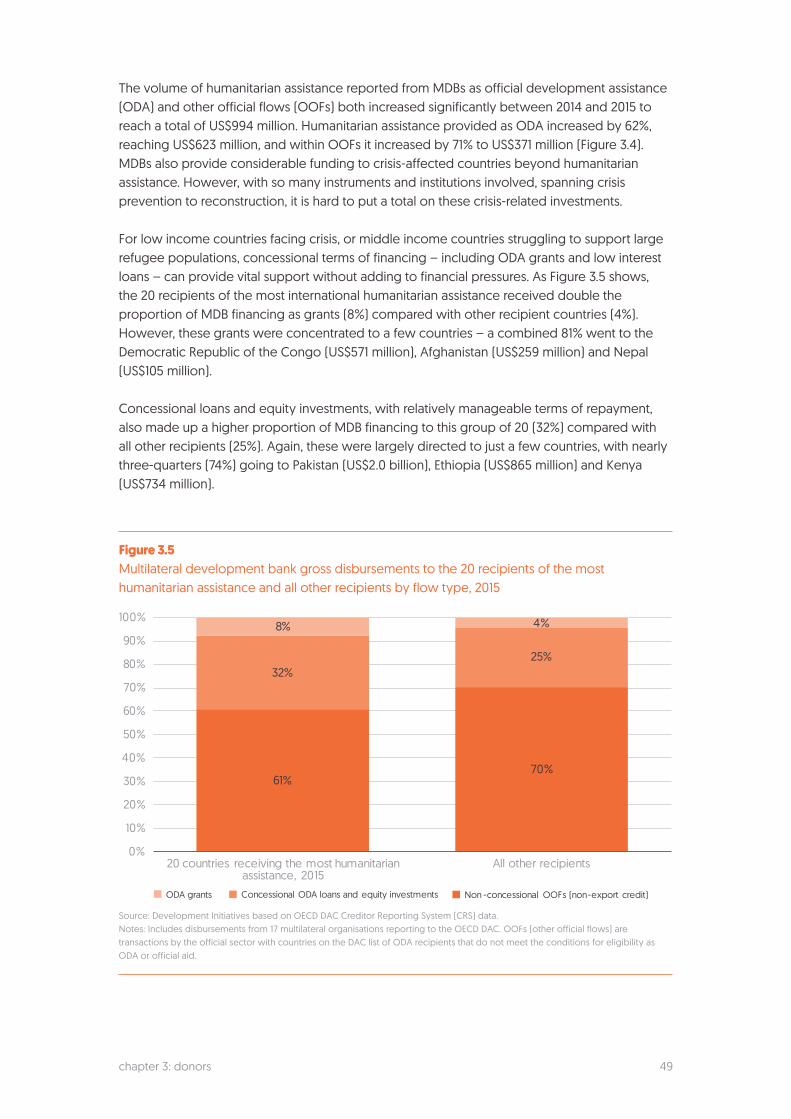
For low income countries facing crisis, or middle income countries struggling to support large refugee populations, concessional terms of financing – including ODA grants and low interest loans – can provide vital support without adding to financial pressures. As Figure 3.5 shows, the 20 recipients of the most international humanitarian assistance received double the proportion of MDB financing as grants (8%) compared with other recipient countries (4%). However, these grants were concentrated to a few countries – a combined 81% went to the Democratic Republic of the Congo (US$571 million), Afghanistan (US$259 million) and Nepal (US$105 million).
Concessional loans and equity investments, with relatively manageable terms of repayment, also made up a higher proportion of MDB financing to this group of 20 (32%) compared with all other recipients (25%). Again, these were largely directed to just a few countries, with nearly three-quarters (74%) going to Pakistan (US$2.0 billion), Ethiopia (US$865 million) and Kenya (US$734 million).
Figure 3.5Multilateral development bank gross disbursements to the 20 recipients of the most humanitarian assistance and all other recipients by flow type, 2015
Source: Development Initiatives based on OECD DAC Creditor Reporting System (CRS) data. Notes: Includes disbursements from 17 multilateral organisations reporting to the OECD DAC. OOFs (other official flows) are transactions by the official sector with countries on the DAC list of ODA recipients that do not meet the conditions for eligibility as ODA or official aid.
32%25%
61%70%
0%
10%
20%
30%
40%
50%
60%
70%
80%
90%
100%
20 countries receiving the most humanitarian assistance, 2015
All other recipients
Non -concessional OOFs (non-export credit)Concessional ODA loans and equity investmentsODA grants
8% 4%
50chapter 3: donors
Private donors
As humanitarian requirements continue to outstrip available resources (see Chapter 2), private donors remain a critical source of additional funding. Contributions from private donors – from individuals, trusts and foundations, companies and corporations, as well as funding generated by national societies – are an important source of financing and means of ‘increasing and diversifying the resource base’, as called for at the World Humanitarian Summit.11
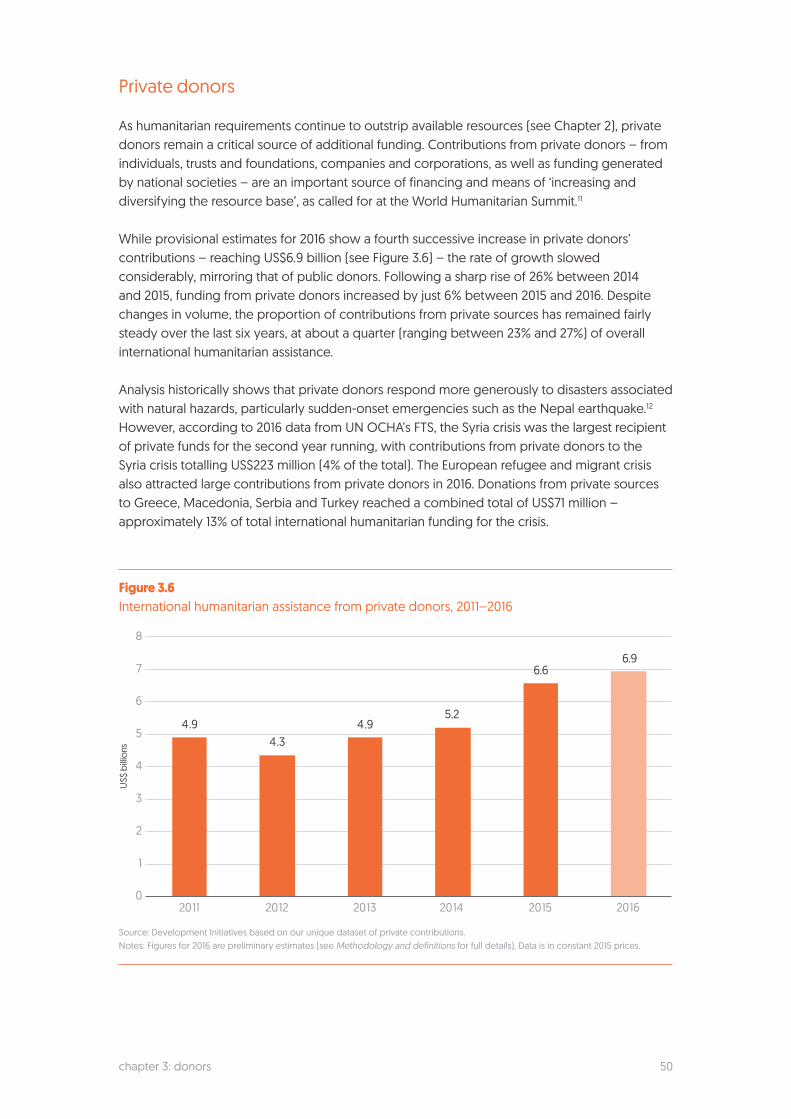
While provisional estimates for 2016 show a fourth successive increase in private donors’ contributions – reaching US$6.9 billion (see Figure 3.6) – the rate of growth slowed considerably, mirroring that of public donors. Following a sharp rise of 26% between 2014 and 2015, funding from private donors increased by just 6% between 2015 and 2016. Despite changes in volume, the proportion of contributions from private sources has remained fairly steady over the last six years, at about a quarter (ranging between 23% and 27%) of overall international humanitarian assistance.
Analysis historically shows that private donors respond more generously to disasters associated with natural hazards, particularly sudden-onset emergencies such as the Nepal earthquake.12 However, according to 2016 data from UN OCHA’s FTS, the Syria crisis was the largest recipient of private funds for the second year running, with contributions from private donors to the Syria crisis totalling US$223 million (4% of the total). The European refugee and migrant crisis also attracted large contributions from private donors in 2016. Donations from private sources to Greece, Macedonia, Serbia and Turkey reached a combined total of US$71 million – approximately 13% of total international humanitarian funding for the crisis.
Figure 3.6International humanitarian assistance from private donors, 2011–2016
Source: Development Initiatives based on our unique dataset of private contributions. Notes: Figures for 2016 are preliminary estimates (see Methodology and definitions for full details). Data is in constant 2015 prices.
4.9 4.3
4.9 5.2
6.6 6.9
0
1
2
3
4
5
6
7
8
2011 2012 2013 2014 2015 2016
US$
billi
ons
51chapter 3: donors
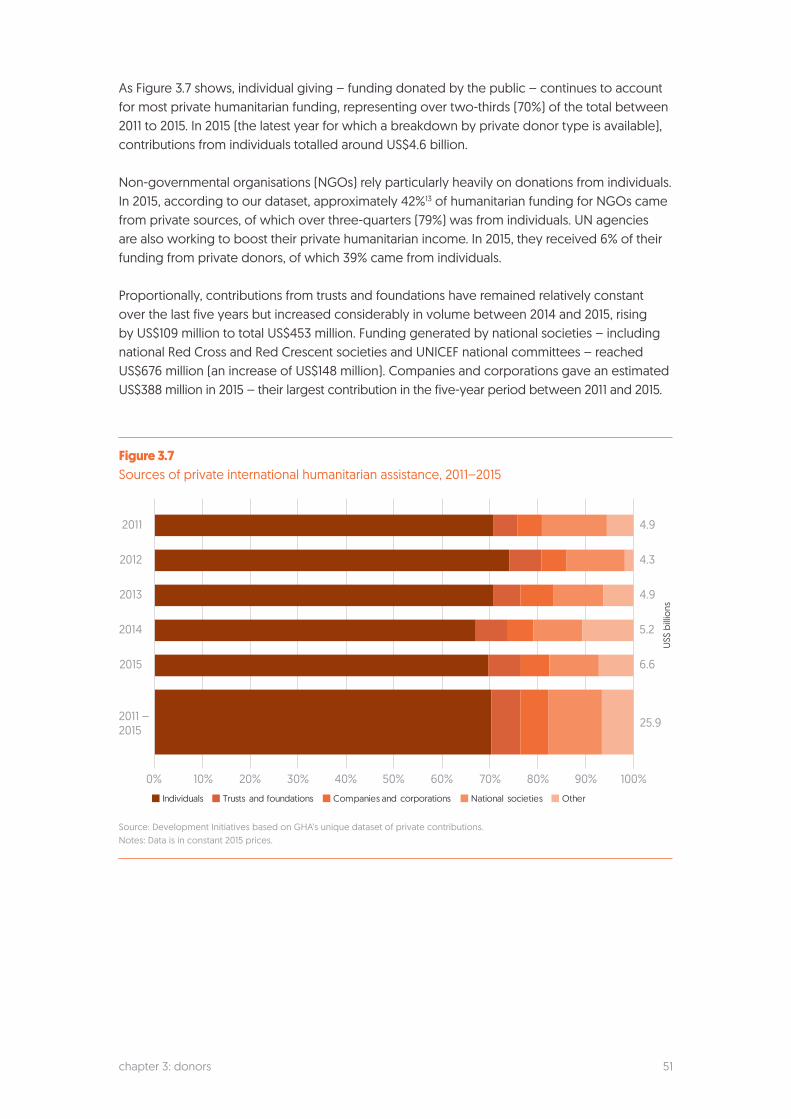
As Figure 3.7 shows, individual giving – funding donated by the public – continues to account for most private humanitarian funding, representing over two-thirds (70%) of the total between 2011 to 2015. In 2015 (the latest year for which a breakdown by private donor type is available), contributions from individuals totalled around US$4.6 billion.
Non-governmental organisations (NGOs) rely particularly heavily on donations from individuals. In 2015, according to our dataset, approximately 42%13 of humanitarian funding for NGOs came from private sources, of which over three-quarters (79%) was from individuals. UN agencies are also working to boost their private humanitarian income. In 2015, they received 6% of their funding from private donors, of which 39% came from individuals.
Proportionally, contributions from trusts and foundations have remained relatively constant over the last five years but increased considerably in volume between 2014 and 2015, rising by US$109 million to total US$453 million. Funding generated by national societies – including national Red Cross and Red Crescent societies and UNICEF national committees – reached US$676 million (an increase of US$148 million). Companies and corporations gave an estimated US$388 million in 2015 – their largest contribution in the five-year period between 2011 and 2015.
Figure 3.7Sources of private international humanitarian assistance, 2011–2015
Source: Development Initiatives based on GHA’s unique dataset of private contributions. Notes: Data is in constant 2015 prices.
US$
bill
ions
Individuals Trusts and foundations Companies and corporations National societies Other
2011
2012
2013
2014
2015
2011 –2015
4.9
4.3
4.9
5.2
6.6
25.9
0% 10% 20% 30% 40% 50% 60% 70% 80% 90% 100%
52chapter 3: donors
Private donors: faith-based giving
All major world religions include some element of charitable giving.14 Islamic social finance, referring to any financial system, practice or mechanism that complies with Islamic or Shariah law, has attracted particular attention over recent years as a source of financing for domestic and international humanitarian response.
The potential of Islamic social finance to help fill the humanitarian funding gap was identified by the UN High-Level Panel on Humanitarian Financing in its 2016 report to the UN Secretary-General.15 Islamic social finance went on to feature prominently in discussions leading up to and during the WHS, with several announcements at the Summit itself of new instruments and commitments. These include a humanitarian waqf16 announced by Maybank Islamic and the Norwegian Refugee Council, and a Global Islamic Finance and Impact Investing Platform by the UN Development Programme and the Islamic Development Bank to support the SDGs.17
There are no precise or reliable figures for the global value of Islamic social finance, though our own approximate estimate puts the global amount of Zakat18 collected annually through formal mechanisms in the tens of billions of dollars at the very least.19 More accurate approximations are possible for individual countries with Muslim-majority populations where Zakat is collected and distributed by the state.
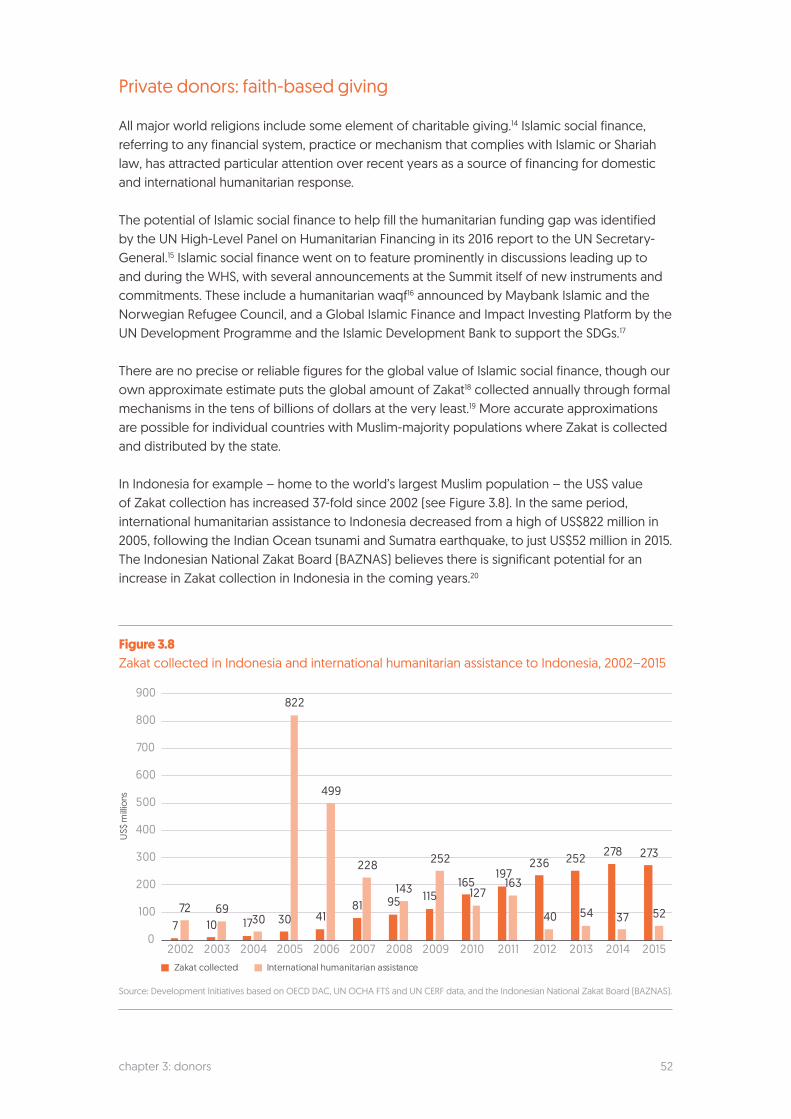
In Indonesia for example – home to the world’s largest Muslim population – the US$ value of Zakat collection has increased 37-fold since 2002 (see Figure 3.8). In the same period, international humanitarian assistance to Indonesia decreased from a high of US$822 million in 2005, following the Indian Ocean tsunami and Sumatra earthquake, to just US$52 million in 2015. The Indonesian National Zakat Board (BAZNAS) believes there is significant potential for an increase in Zakat collection in Indonesia in the coming years.20
Figure 3.8Zakat collected in Indonesia and international humanitarian assistance to Indonesia, 2002–2015
Source: Development Initiatives based on OECD DAC, UN OCHA FTS and UN CERF data, and the Indonesian National Zakat Board (BAZNAS).
7 10 17 30 4181 95 115
165197
236 252 278 273
72 6930
822
499
228
143
252
127163
40 54 37 52
0
100
200
300
400
500
600
700
800
900
2002 2003 2004 2005 2006 2007 2008 2009 2010 2011 2012 2013 2014 2015
US$
milli
ons
Zakat collected International humanitarian assistance
53chapter 3: donors
Private donors: crowdfunding
Advances in technology and a proliferation of platforms for online giving provide new opportunities for individuals to directly support humanitarian action. Crowdfunding is a broad term that encompasses a variety of related models of direct giving (see Definitions, Chapter 6).
In 2015, according to one recent report, an estimated US$430 million was raised through crowdfunding platforms for projects in developing countries, of which ‘disaster relief’ was the 8th largest category with approximately US$27 million of funding.21 Other analysis indicates that the largest regional growth in crowdfunding in 2015 was in Asia, where there was a 210% increase from the previous year, mainly from India; this was followed by Africa with a 101% increase.22 As access to banking services grows, the global potential for crowdfunding will increase further. The World Bank estimates that US$96 billion could be raised through crowdfunding in developing countries by 2025.23
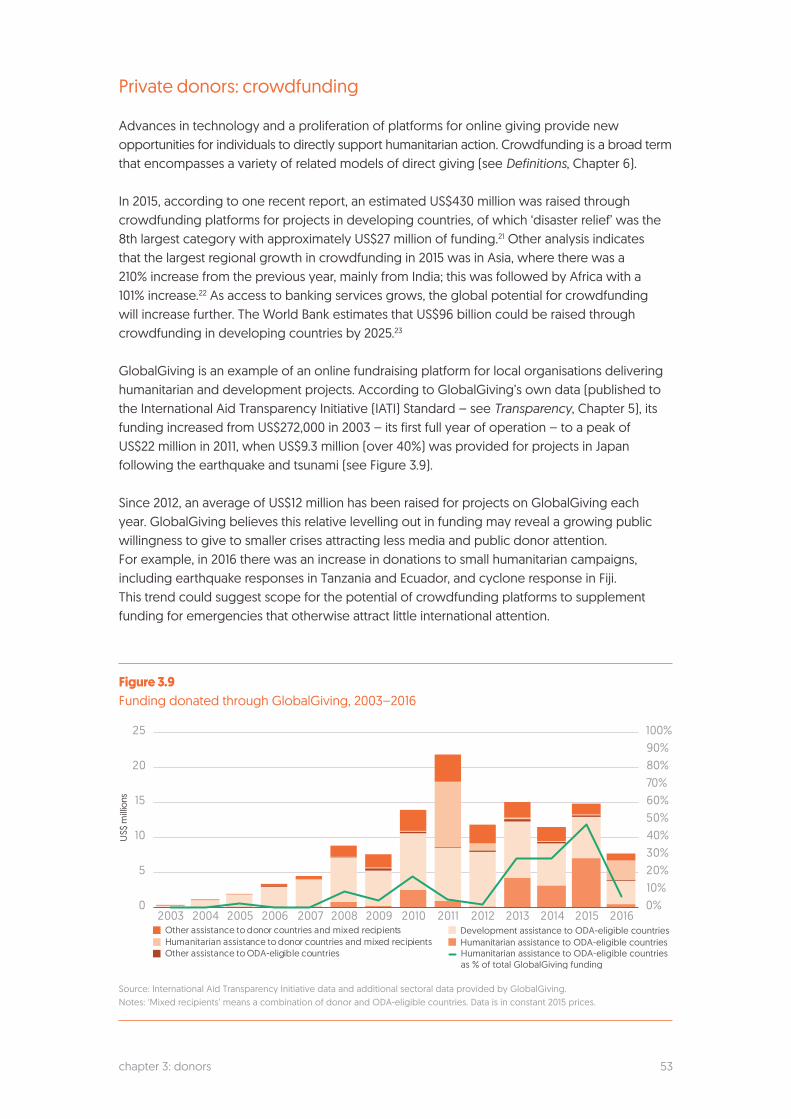
GlobalGiving is an example of an online fundraising platform for local organisations delivering humanitarian and development projects. According to GlobalGiving’s own data (published to the International Aid Transparency Initiative (IATI) Standard – see Transparency, Chapter 5), its funding increased from US$272,000 in 2003 – its first full year of operation – to a peak of US$22 million in 2011, when US$9.3 million (over 40%) was provided for projects in Japan following the earthquake and tsunami (see Figure 3.9).
Since 2012, an average of US$12 million has been raised for projects on GlobalGiving each year. GlobalGiving believes this relative levelling out in funding may reveal a growing public willingness to give to smaller crises attracting less media and public donor attention. For example, in 2016 there was an increase in donations to small humanitarian campaigns, including earthquake responses in Tanzania and Ecuador, and cyclone response in Fiji. This trend could suggest scope for the potential of crowdfunding platforms to supplement funding for emergencies that otherwise attract little international attention.
Figure 3.9Funding donated through GlobalGiving, 2003–2016
Source: International Aid Transparency Initiative data and additional sectoral data provided by GlobalGiving. Notes: ‘Mixed recipients’ means a combination of donor and ODA-eligible countries. Data is in constant 2015 prices.
0%10%20%30%40%50%60%70%80%90%100%
0
5
10
15
20
25
2003 2004 2005 2006 2007 2008 2009 2010 2011 2012 2013 2014 2015 2016
US$
milli
ons
Other assistance to donor countries and mixed recipientsHumanitarian assistance to donor countries and mixed recipientsOther assistance to ODA-eligible countries
Development assistance to ODA-eligible countriesHumanitarian assistance to ODA-eligible countriesHumanitarian assistance to ODA-eligible countriesas % of total GlobalGiving funding
54chapter 3: donors
Private donors: private sector investments
The potential of private sector investments is gaining increasing attention as donors struggle to fill humanitarian and development funding gaps. This includes innovative financing mechanisms such as impact bonds and guarantees (see Tools for crisis financing, Chapter 2), as well as what is sometimes referred to as ‘blended finance’ – using public funds (ODA and philanthropic funding) to mobilise private investments.
Interest in this area manifested itself in several WHS commitments24 and in the joint paper of the MDBs on forced displacement.25 It was articulated again at the 2016 conference Supporting Syria and the Region, where participants endorsed commitments by refugee-hosting governments to strengthen labour markets and improve investment climates, as well as donor support enabling them to do so.26
Results thus far have been limited, though this is not unique to humanitarian settings. A 2016 study by Development Initiatives shows that while support for ‘blended finance’ is growing, its potential to fill the SDG funding gap is not yet based on clear evidence. Even in contexts where it is being used, the long chain of causation involved in ‘blending’ means that results may not be realised for many years.27
The limitations of private investment-related instruments are clearly greater in high-risk and crisis-affected settings. However, some mechanisms are in development or operation in a few fragile, crisis-affected and refugee-hosting settings. They include:
• Impact bonds: Investors providing upfront financing to a service provider to deliver an identified outcome. If the outcome is achieved, the investor is paid back with interest by the outcome funder – usually a government or donor. At the World Economic Forum in 2015, the International Committee of the Red Cross (ICRC) launched the first Humanitarian Impact Bond. While still in its planning phase, the Belgian government has already pledged €10 million to the bond in support of ICRC’s physical rehabilitation programme.28
• Guarantees: Reducing the risk of private investment in high-risk contexts by providing guarantees for repayment if a public entity fails to meet the contractual obligations of a private sector project. In 2015, the Hashemite Kingdom of Jordan announced US$1.5 billion in sovereign bonds guaranteed by the US. Proceeds have reportedly been used to provide critical services to communities in Jordan, which is host to large numbers of Syrian refugees.29
• Political risk insurance: Reducing the risk of private investment in high-risk contexts by providing insurance against political, default and currency risks. For example, the Multilateral Investment Guarantee Agency (an arm of the World Bank Group) issued a record US$4.3 billion in political risk and credit enhancement guarantees in 2016; 10% of this was for countries affected by conflict and fragility.30
It is hard to know the exact magnitude of these types of finance, and too early to evaluate their impact. Tracking and learning from them will be important, however, to know if, where and how they can feasibly be replicated and scaled up.
55chapter 3: donors
Domestic government funding: disaster financing
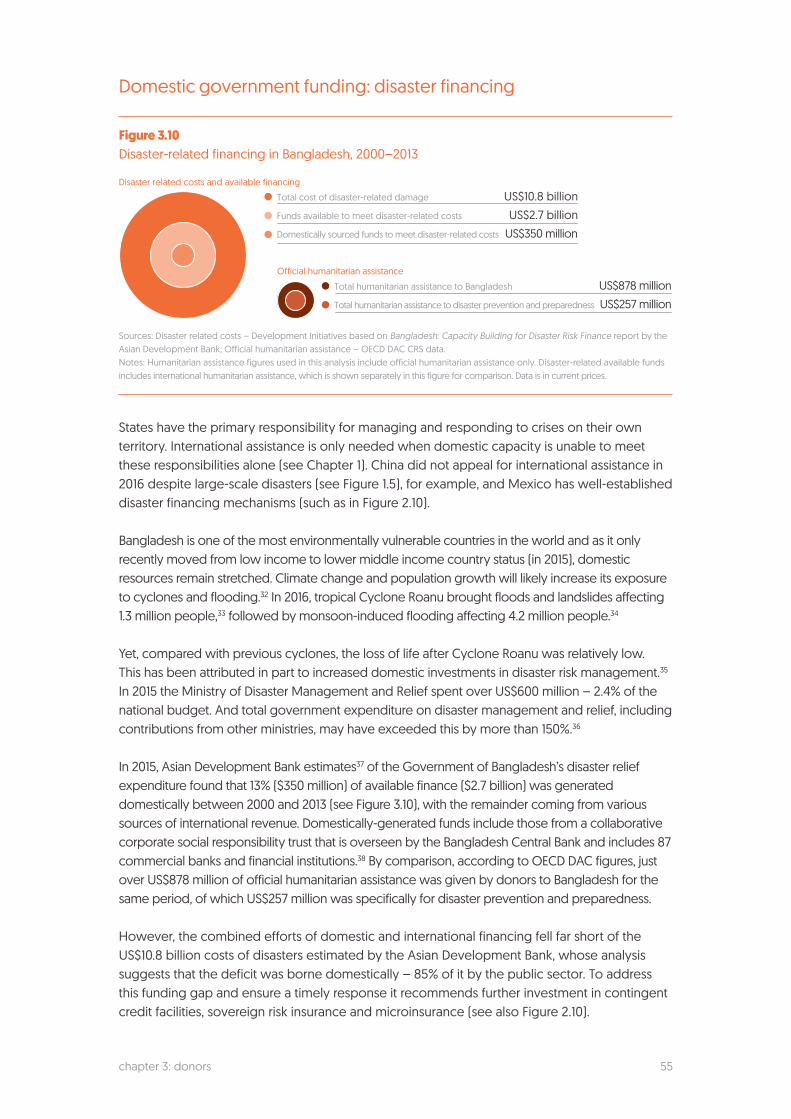
Figure 3.10Disaster-related financing in Bangladesh, 2000–2013
Sources: Disaster related costs – Development Initiatives based on Bangladesh: Capacity Building for Disaster Risk Finance report by the Asian Development Bank; Official humanitarian assistance – OECD DAC CRS data. Notes: Humanitarian assistance figures used in this analysis include official humanitarian assistance only. Disaster-related available funds includes international humanitarian assistance, which is shown separately in this figure for comparison. Data is in current prices.
States have the primary responsibility for managing and responding to crises on their own territory. International assistance is only needed when domestic capacity is unable to meet these responsibilities alone (see Chapter 1). China did not appeal for international assistance in 2016 despite large-scale disasters (see Figure 1.5), for example, and Mexico has well-established disaster financing mechanisms (such as in Figure 2.10).
Bangladesh is one of the most environmentally vulnerable countries in the world and as it only recently moved from low income to lower middle income country status (in 2015), domestic resources remain stretched. Climate change and population growth will likely increase its exposure to cyclones and flooding.32 In 2016, tropical Cyclone Roanu brought floods and landslides affecting 1.3 million people,33 followed by monsoon-induced flooding affecting 4.2 million people.34
Yet, compared with previous cyclones, the loss of life after Cyclone Roanu was relatively low. This has been attributed in part to increased domestic investments in disaster risk management.35 In 2015 the Ministry of Disaster Management and Relief spent over US$600 million – 2.4% of the national budget. And total government expenditure on disaster management and relief, including contributions from other ministries, may have exceeded this by more than 150%.36
In 2015, Asian Development Bank estimates37 of the Government of Bangladesh’s disaster relief expenditure found that 13% ($350 million) of available finance ($2.7 billion) was generated domestically between 2000 and 2013 (see Figure 3.10), with the remainder coming from various sources of international revenue. Domestically-generated funds include those from a collaborative corporate social responsibility trust that is overseen by the Bangladesh Central Bank and includes 87 commercial banks and financial institutions.38 By comparison, according to OECD DAC figures, just over US$878 million of official humanitarian assistance was given by donors to Bangladesh for the same period, of which US$257 million was specifically for disaster prevention and preparedness.
However, the combined efforts of domestic and international financing fell far short of the US$10.8 billion costs of disasters estimated by the Asian Development Bank, whose analysis suggests that the deficit was borne domestically – 85% of it by the public sector. To address this funding gap and ensure a timely response it recommends further investment in contingent credit facilities, sovereign risk insurance and microinsurance (see also Figure 2.10).
Total cost of disaster-related damage US$10.8 billion
Funds available to meet disaster-related costs US$2.7 billion
Domestically sourced funds to meet disaster-related costs US$350 million
Total humanitarian assistance to Bangladesh US$878 million
Total humanitarian assistance to disaster prevention and preparedness US$257 million
Disaster related costs and available financing
Official humanitarian assistance

56chapter 3: donors
Domestic government funding: refugee hosting
Figure 3.11In-donor refugee-hosting costs reported to the OECD DAC, 2014–2016
Source: Development Initiatives based on OECD DAC data. Notes: In-donor refugee costs are only those reported under this ODA category code. Other expenditure on refugee hosting in these countries that is not reported to this code is not included. Data is in constant 2015 prices.
State contributions to hosting refugees can be significant but hard to estimate in financial terms. Turkey reports its significant contributions to hosting Syrian refugees in 2016 within its total humanitarian assistance (see Figure 3.1). However, in the cases of Lebanon and Jordan, host to 0.7 million and 1 million refugees respectively, estimates of economic impact exist39 but not of government refugee-related expenditure. Moreover, requirements and contributions go beyond the monetary: legal protection, socioeconomic inclusion and in-kind support are also vital.
There are no standardised reporting systems for comparing state contributions to refugee hosting. Figures are reported in national, federal and local government budgets using different provision categories and costing models.40
Governments reporting to the OECD DAC may report some refugee-hosting contributions within their ODA under a specific ‘in-donor’ category, which can cover the first year’s costs of hosting a refugee or an asylum seeker. However, there is considerable variation between what and how different governments choose to report.41 As numbers of refugees and asylum seekers in many DAC reporting countries have grown, so has scrutiny of the reported costs.42
Analysis of in-donor costs shows a significant increase in the past three years. Reported costs more than doubled between 2014 and 2015 – from nearly US$6 billion to over US$12 billion, followed by a smaller rise of 28% in 2016, bringing the total to nearly US$16 billion (see Figure 3.11).
Germany reported the highest levels of in-donor costs in 2016 (US$6.2 billion), more than double 2015’s amount, pushing its total significantly higher than the next largest donors, US and Italy, which both reported nearly US$1.7 billion. Turkey reported US$100 million as in-donor costs, separate to contributions to hosting Syrian refugees that it includes under the DAC humanitarian assistance category (see International government funding: largest donors, page 44).
0
1
2
3
4
5
6
7
US$
billi
ons
2014 2015 2016
Ger
man
y
US
Italy
Nor
way
Swed
en
Switz
erla
nd UK
Aus
tria
Net
herla
nds
Fran
ce
Den
mar
k
Can
ada
Belg
ium
Finl
and
Turk
ey
18 o
ther
don
ors
notes
notes
chapter 31 Our analysis of funding from the multilateral development banks includes the following multilateral
organisations reporting to the OECD DAC Creditor Reporting System: African Development Bank, (including African Development Fund), Arab Bank for Economic Development in Africa, Arab Fund for Economic and Social Development, Asian Development Bank (including Asian Development Bank Special Funds), Caribbean Development Bank, Council of Europe Development Bank, European Bank for Reconstruction and Development, Inter-American Development Bank (including Inter-American Development Bank Special Fund), International Monetary Fund Concessional Trust Funds, Islamic Development Bank, Nordic Development Fund, OPEC Fund for International Development, World Bank (including International Development Association, and International Bank for Reconstruction and Development).
2 Turkey and the EU institutions are not included in these calculations. The five government donors that contributed 65% of the total are the US, the United Kingdom, Germany, Sweden and Japan.
3 Figures are not currently available to show how much of this total directed to the Syria response was spent in Turkey and how much in other countries in the region, but information for previous years suggests that most may have been spent in Turkey. In 2015, 97% of Turkey’s DAC reported humanitarian assistance was spent on supporting Syrian refugees in Turkey.
4 Assistance provided by the EU derives from contributions made by member states and is also captured in our calculations of international humanitarian assistance provided by individual EU member state governments. For more information on how we calculate international humanitarian assistance from governments see Methodology and definitions.
5 Multilateral development banks at the World Humanitarian Summit, 2016. Joint Statement by the Multilateral Development Banks at the World Humanitarian Summit Responding to the Forced Displacement Crisis. 23 May 2016. Available at: http://www.worldbank.org/en/news/press-release/2016/05/23/joint-statement-by-the-multilateral-development-banks-at-the-world-humanitarian-summit
6 Grand Bargain signatories, 2016. The Grand Bargain – A shared commitment to better serve people in need. Available at: http://www.agendaforhumanity.org/initiatives/3861
7 World Bank, 2017. IDA18: Report from the Executive Directors of the International Development Association to the Board of Governors. Available at: http://documents.worldbank.org/curated/en/348661486654455091/pdf/112728-correct-file-PUBLIC-Rpt-from-EDs-Additions-to-IDA-Resources-2-9-17-For-Disclosure.pdf
8 World Bank Group. World Bank Group Global Crisis Response Platform, 2016. Available at: http://documents.worldbank.org/curated/en/334721474058771487/pdf/WBG-Global-Crisis-Response-Platform-08252016.pdf
9 World Bank, 2017. Brief: Pandemic Emergency Financing Facility: Frequently Asked Questions. Available at: http://www.worldbank.org/en/topic/pandemics/brief/pandemic-emergency-facility-frequently-asked-questions
10 World Bank, 2016. Press release: Global Community Makes Record $75 Billion Commitment to End Extreme Poverty. Available at: http://www.worldbank.org/en/news/press-release/2016/12/15/global-community-commitment-end-poverty-ida18
11 UN, 2016. Report of the Secretary General for the World Humanitarian Summit, 2016. Available at: http://sgreport.worldhumanitariansummit.org/
12 Development Initiatives, 2016. Global Humanitarian Assistance Report 2016. Available at: http://devinit.org/post/global-humanitarian-assistance-report-2016/
13 This figure refers to the proportion of total humanitarian income of the NGOs included in our unique dataset of private contributions.
14 Development Initiatives (Stirk, C), 2015. An act of faith: Humanitarian financing and Zakat. Available at: http://devinit.org/post/humanitarian-financing-and-zakat/
notes
15 High-Level Panel on Humanitarian Financing, 2016. Too important to fail: Addressing the humanitarian financing gap. Available at http://www.un.org/news/WEB-1521765-E-OCHA-Report-on-Humanitarian-Financing.pdf
16 Waqf is a type of endowment and form of Islamic social finance.
17 Announcements at the WHS on Islamic social financing also included the launch of an international standards setting body by the Central Bank of Indonesia in collaboration with the Islamic Research and Training Institute of the Islamic Development Bank. More information on related discussions is available here: https://www.worldhumanitariansummit.org/sites/default/files/keydocuments/SS03IslamicFinance.pdf
18 Zakat in this case is defined as a form of Islamic social financing through which all Muslims whose wealth falls above a certain threshold are required by the Qur’an to give 2.5% of their assets each year to help people in need.
19 See note 14.
20 Center of Strategic Studies, The Indonesian National Zakat Board (BAZNAS), 2016. 2017 Indonesia Zakat Outlook. Available at: http://www.puskasbaznas.com/images/outlook/Indonesia%20Zakat%20Outlook2017EN_PUSKASBAZNAS.pdf
21 Allied Crowds, 2016. Developing World Crowdfunding: Prosperity through Crowdfunding. Allied Crowds Annual Report, January 2016. Available at: https://cdn.filestackcontent.com/kNfFQ9IgT2ObxzjhGqUU
22 See CrowdExpert for more information: http://crowdexpert.com/crowdfunding-industry-statistics/
23 Information for Development Program (infoDev) and World Bank, 2013. Crowdfunding’s Potential for the Developing World. Available at: http://www.infodev.org/infodev-files/wb_crowdfundingreport-v12.pdf
24 More than 100 individual/joint commitments recognise the general role of the private sector and less than 10 individual/joint commitments focus on innovative finance mechanisms – including those from the governments of Belgium, Germany and Finland, ICRC, Catholic Relief Services and the Malteser Foundation. See: http://www.agendaforhumanity.org/explore-commitments/indv-commitments?combine=faith
25 Group of Multilateral Development Banks, 2016. The Forced Displacement Crisis: A Joint Paper by Multilateral Development Banks. See: http://pubdocs.worldbank.org/en/870431464026133311/Joint-MDB-paper-displacement-final.pdf
26 Supporting Syria & the Region conference, 2016. Co-hosts declaration from the Supporting Syria & the Region Conference, London 2016. Available at: https://www.supportingsyria2016.com/news/co-hosts-declaration-of-the-supporting-syria-and-the-region-conference-london-2016/
27 Development Initiatives, 2016. Blended finance: understanding its potential for the 2030 agenda. Available at: http://devinit.org/post/blended-finance-understanding-its-potential/
28 IRIN, 2016. Three notable innovations in humanitarian aid in 2016. Available at: https://www.irinnews.org/analysis/2016/12/28/three-notable-innovations-humanitarian-aid-2016
29 Reuters (Gervitz, G), 2015. U.S Treasury Guarantees Bond Issue by Jordan, Rare Form Of Aid. Available at: http://www.reuters.com/article/us-jordan-bonds-refugees-idUSKCN0PD1PZ20150703
30 Multilateral Investment Guarantee Agency, 2016. Available at: https://www.miga.org/Documents/Annual_Report_2016.pdf
31 Asian Development Bank, 2015. Bangladesh: Capacity Building for Disaster Risk Finance. Available at: https://www.adb.org/sites/default/files/project-document/173391/42249-013-tacr-1.pdf
32 Global Facility for Disaster Reduction and Recovery (GFDRR). See: https://www.gfdrr.org/bangladesh
33 International Institute for Environment and Development, 2016. Cyclone Roanu hits Bangladesh: a story of loss and damage avoided. Available at: https://www.iied.org/cyclone-roanu-hits-bangladesh-story-loss-damage-avoided
34 IRIN, 2016. Environment and Disasters Bangladeshi farmers drown in debt as floods destroy crops. Available at: https://www.irinnews.org/news/2016/09/08/bangladeshi-farmers-drown-debt-floods-destroy-crops
35 International Institute for Environment and Development, 2016. Cyclone Roanu hits Bangladesh: a story of loss and damage avoided. Available at: https://www.iied.org/cyclone-roanu-hits-bangladesh-story-loss-damage-avoided
36 Based on ministry budgets for Ministry of Disaster Management and Relief, Ministry of Forest and Environment, Ministry of Water Resources, Finance Division, Ministry of Education, Planning Division. Available at: http://mof.gov.bd/en/index.php?option=com_content&view=article&id=356&Itemid=1
37 Asian Development Bank, 2016. Disaster Risk Financing in Bangladesh. Available at: https://www.adb.org/sites/default/files/publication/198561/sawp-046.pdf; Asian Development Bank, 2015. Bangladesh: Capacity Building for Disaster Risk Finance. Available at: https://www.adb.org/sites/default/files/project-document/173391/42249-013-tacr-1.pdf
38 Together these institutions contributed around US$64.3 million in the 2014 financial year for post-disaster response, disaster risk management and capacity building. See: https://www.bb.org.bd/pub/annual/anreport/ar1314/chap6.pdf
notes
39 World Bank, 2013. Lebanon: Economic and Social Impact Assessment of the Syrian Conflict. Available at: http://documents.worldbank.org/curated/en/925271468089385165/Lebanon-Economic-and-social-impact-assessment-of-the-Syrian-conflict; Hashemite Kingdom of Jordan, Ministry of Planning and International Cooperation, UN, 2015. Jordan: Response Plan for the Syria Crisis 2016–2017. Available at: http://reliefweb.int/sites/reliefweb.int/files/resources/JRP16_18_Document-final+draft.pdf
40 See for example, a recent analysis of refugee hosting costs in Europe: ODI, 2016. Untangling the data: Assessing the accuracy of official refugee-related costs in Europe. Available at: https://www.odi.org/sites/odi.org.uk/files/resource-documents/10853.pdf
41 OECD DAC Secretariat, 2016. ODA Reporting of in-donor country refugee costs: Members’ methodologies for calculating costs. See https://www.oecd.org/dac/stats/RefugeeCostsMethodologicalNote.pdf
42 In 2016, the DAC conducted a survey of its members to understand different reporting practices, and is expected to issue guidance in 2017 with a view to improving consistency and comparability. See: DAC Secretariat, 2016. ODA Reporting of in-donor country refugee costs: Members’ methodologies for calculating costs. Available at: www.oecd.org/dac/stats/RefugeeCostsMethodologicalNote.pdf