Embed Size (px)
Citation preview

Chapter 3Ecosystem Ecology
Tuesday, September 19, 17

Reversing Deforestation in Haiti
Answers the following:
• Why is deforestation in Haiti so common?
• What the negative impacts of deforestation?
• Name three actions intended counteract the deforestation.
• What is the president’s goal?
Tuesday, September 19, 17

Module 6 The Movement of Energy
After reading this module you should be able to
• explain the concept of ecosystem boundaries.
• describe the processes of photosynthesis and respiration.
• distinguish among the trophic levels that exist in food chains and food webs.
• quantify ecosystem productivity.
• explain energy transfer efficiency and trophic pyramids.
Tuesday, September 19, 17

Ecosystem boundaries are not clearly defined
• Some ecosystems, such as a caves and lakes, have very distinctive boundaries. However, in most ecosystems it is difficult to determine where one ecosystems stops and the next begins.
• Even though it is helpful to distinguish between two different ecosystems, ecosystems interact with other ecosystems.
• Biosphere The region of our planet where life resides; the combination of all ecosystems on Earth.
Tuesday, September 19, 17
Ecosystem Boundaries
Large and small ecosystems. (a) The Greater Yellowstone Ecosystem includes the land within Yellowstone National Park and many adjacent properties. (b) Some ecosystems are very small, such as a rain-filled tree hole that houses a diversity of microbes and aquatic insects.
See Activity
Tuesday, September 19, 17
What is Photosynthesis?
Why is it important?
What is Cell Respiration?
Why is it important?
In your own words, keep it simple
Tuesday, September 19, 17

Photosynthesis captures energy and respiration releases energy
• Producer An organism that uses the energy of the Sun to produce usable forms of energy. Also known as Autotroph.
• Photosynthesis The process by which producers use solar energy to convert carbon dioxide and water into glucose.
• Cellular respiration The process by which cells unlock the energy of chemical compounds.
• Aerobic respiration The process by which cells convert glucose and oxygen into energy, carbon dioxide, and water.
• Anaerobic respiration The process by which cells convert glucose into energy in the absence of oxygen.
Tuesday, September 19, 17

Photosynthesis and Respiration
Photosynthesis and respiration. Photosynthesis is the process by which producers use solar energy to convert carbon dioxide and water into glucose and oxygen.
Respiration is the process by which organisms convert glucose and oxygen into water and carbon dioxide, releasing the energy needed to live, grow, and reproduce. All organisms, including producers, perform respiration.
*Tuesday, September 19, 17

Energy captured by producers moves through many trophic levels
• Consumer An organism that is incapable of photosynthesis and must obtain its energy by consuming other organisms. Also known as Heterotroph.
• Herbivore A consumer that eats producers. Also known as Primary consumer.
• Carnivore A consumer that eats other consumers.
• Secondary consumer A carnivore that eats primary consumers.
• Tertiary consumer A carnivore that eats secondary consumers.
• Trophic levels The successive levels of organisms consuming one
Tuesday, September 19, 17

Trophic Levels
Simple food chains. A simple food chain that links producers and consumers in a linear fashion illustrates how energy and matter move through the trophic levels of an ecosystem. (a) An example of a terrestrial food chain. (b) An example of an aquatic food chain.
Tuesday, September 19, 17

Trophic levels
• Food web A complex model of how energy and matter move between trophic levels.
• Scavenger An organism that consumes dead animals.
• Detritivore An organism that specializes in breaking down dead tissues and waste products into smaller particles.
• Decomposers Fungi and bacteria that convert
Tuesday, September 19, 17

Trophic Levels
A simplified food web. Food webs are more realistic representations of trophic relationships than simple food chains. They include scavengers, detritivores, and decomposers, and they recognize that some species feed at multiple trophic levels. Arrows indicate the direction of energy movement. This is a real but somewhat simplified food web; in an actual ecosystem, many more organisms are present. In addition, there are many more energy movements.
Tuesday, September 19, 17

Some ecosystems are more productive than others
• Gross primary productivity (GPP) The total amount of solar energy that producers in an ecosystem capture via photosynthesis over a given amount of time.
• Net primary productivity (NPP) The energy captured by producers in an ecosystem minus the energy producers respire.
Tuesday, September 19, 17

Ecosystem Productivity
Gross and net primary productivity. Producerstypically capture only about 1 percent of available solar energy via photosynthesis. This is known as gross primary productivity, or GPP. About 60 percent of GPP is typically used for respiration. The remaining 40 percent of GPP is used for the growth and reproduction of the producers. This is known as net primary productivity, or NPP.
Tuesday, September 19, 17

Lake and stream
Open oceanContinental shelf
Estuary
Algal beds and reefs
Upwelling zones
Extreme desert, rock, sand, ice
Desert and semidesert scrub
Tropical rain forestSavanna
Cultivated land
Boreal forest (taiga)
Temperate grassland
Tundra
Tropical seasonal forest
Temperate deciduous forest
Temperate evergreen forest
Swamp and marsh
Woodland and shrubland
0 10 20 30 40 50 60 0 500 1,000 1,500 2,000 2,500 0 5 10 15 20 25
Percentage of Earth’s netprimary production
Key
Marine
Freshwater (on continents)
Terrestrial
5.2
0.3
0.1
0.1
4.7
3.5
3.3
2.9
2.7
2.4
1.8
1.7
1.6
1.5
1.3
1.0
0.4
0.4
125
360
1,500
2,500
500
3.0
90
2,200
900
600
800
600
700
140
1,600
1,200
1,300
2,000
250
5.6
1.2
0.9
0.1
0.04
0.9
22
7.9
9.1
9.6
5.4
3.5
0.6
7.1
4.9
3.8
2.3
0.3
65.0 24.4
*Tuesday, September 19, 17

Calculating GPP
A forest has NPP of... 1.4 kilogram Carbon/meters2/year
The rate of cellular respiration of...2.4 kilogram Carbon/meters2/year
and
NPP = GPP - cellular respiration
Tuesday, September 19, 17

Microorganismsand other
detritivores
Detritus
Primary producers
Primary consumers
Secondaryconsumers
Tertiary consumers
Heat
Sun
Key
Chemical cycling
Energy flow
Energy Flow Through Ecosystems& Matter Cycles Within Ecosystems
*
Tuesday, September 19, 17

The efficiency of energy transfer affects the energy present in each trophic level• Biomass The total mass of all living matter in a
specific area.
• Standing crop The amount of biomass present in an ecosystem at a particular time.
• Ecological efficiency The proportion of consumed energy that can be passed from one trophic level to another. (usually 5-20%, average 10%)
• Trophic pyramid A representation of the distribution of biomass, numbers, or energy among trophic levels.
Tuesday, September 19, 17

Using the Pyramid of Energy, complete the table below
Between Trophic Levels
Percentage of Energy Efficiency
Energy in kcals that moves to the next trophic level?
Energy in kcals that moves to the next trophic level?
Calculation Rounded Answer
Grass to Rabbits
12% Energy Efficiency
Rabbits to Foxes 1,680
Foxes to Hawks
8% Energy Efficiency
HawksFoxesRabbits
Grass 100,000 kcal
Tuesday, September 19, 17

Ecosystem Efficiency
Trophic pyramid for the Serengeti ecosystem. The amount of energy that is present at each trophic level is shown in joules (J). The pyramid assumes 10 percent ecological efficiency, but efficiencies can range from 5 to 20 percent across different ecosystems. For most ecosystems, graphing the numbers of individuals or biomass within each trophic level would produce a similar pyramid.
Most Susceptible to Extinction?
Tuesday, September 19, 17

Module 6
Do Module 6 AP Review Questions
Discuss
Tuesday, September 19, 17

Module 7 The Movement of Matter
Microorganismsand other
detritivores
Detritus
Primary producers
Primary consumers
Secondaryconsumers
Tertiary consumers
Heat
SunKey
Chemical cyclingEnergy flow
Tuesday, September 19, 17
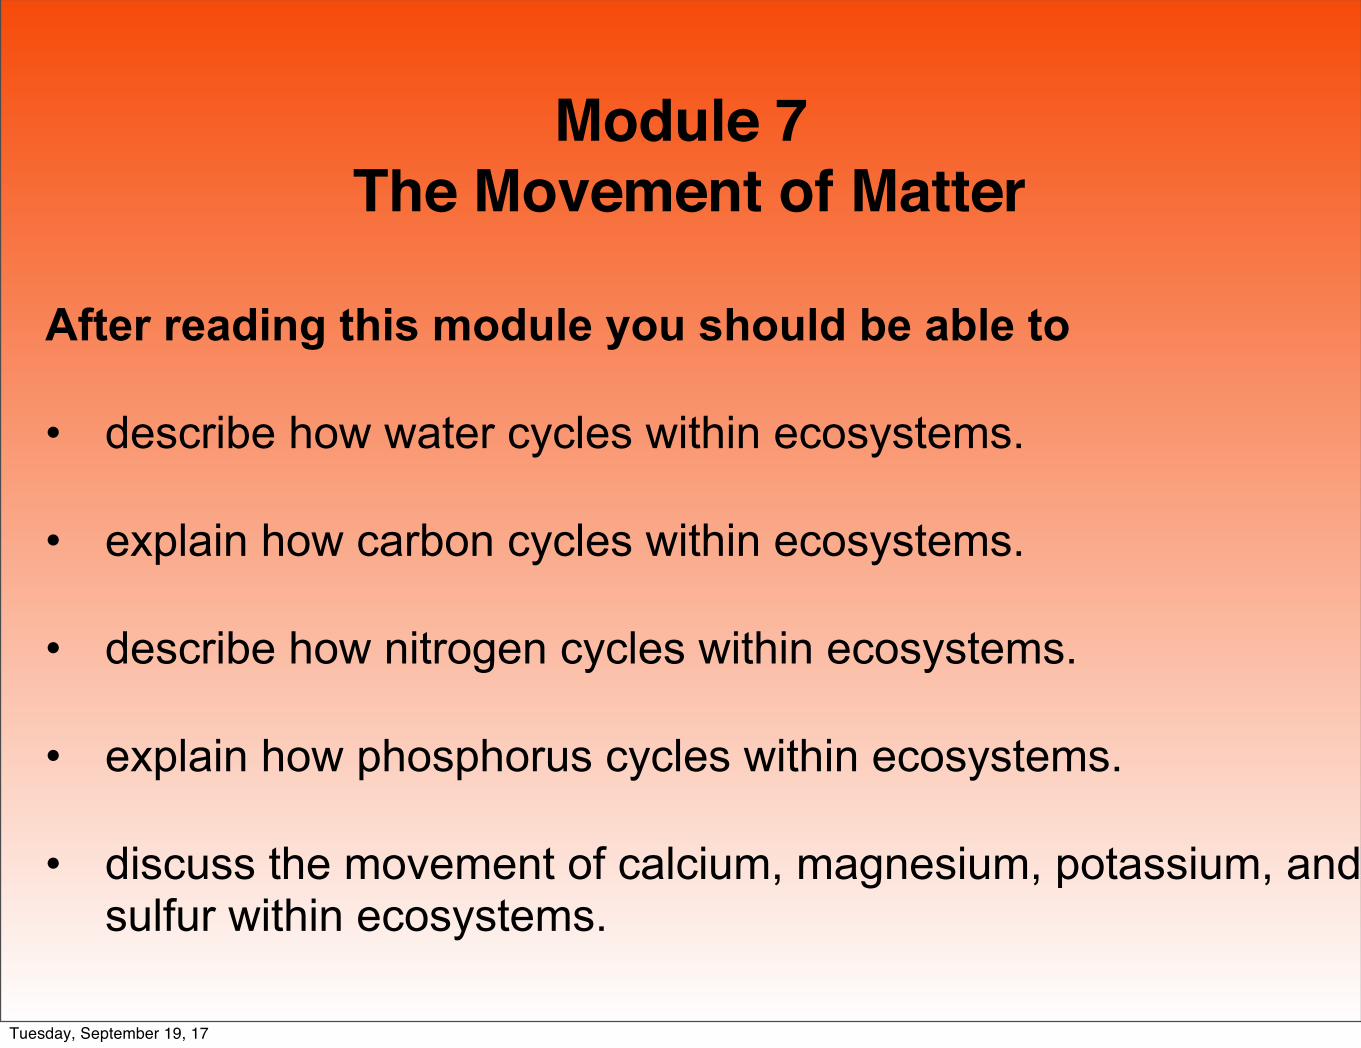
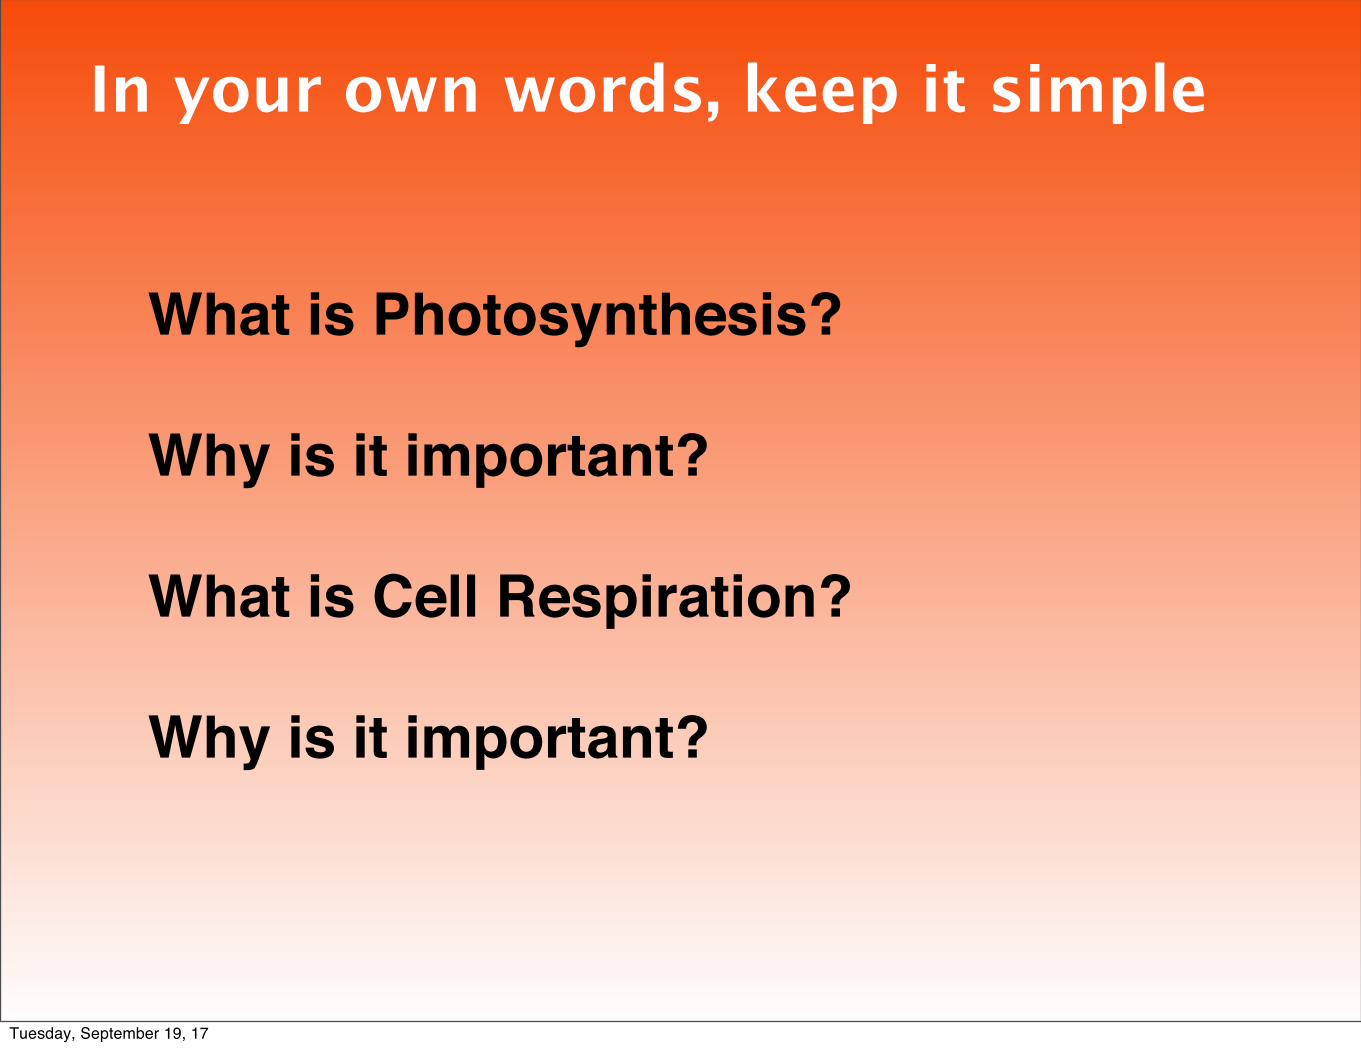
Module 7 The Movement of Matter
After reading this module you should be able to
• describe how water cycles within ecosystems.
• explain how carbon cycles within ecosystems.
• describe how nitrogen cycles within ecosystems.
• explain how phosphorus cycles within ecosystems.
• discuss the movement of calcium, magnesium, potassium, and sulfur within ecosystems.
Tuesday, September 19, 17

The hydrologic cycle moves water through the biosphere
• Biogeochemical cycle The movements of matter within and between ecosystems.
• Hydrologic cycle or Water Cycle The movement of water through the biosphere.
Tuesday, September 19, 17
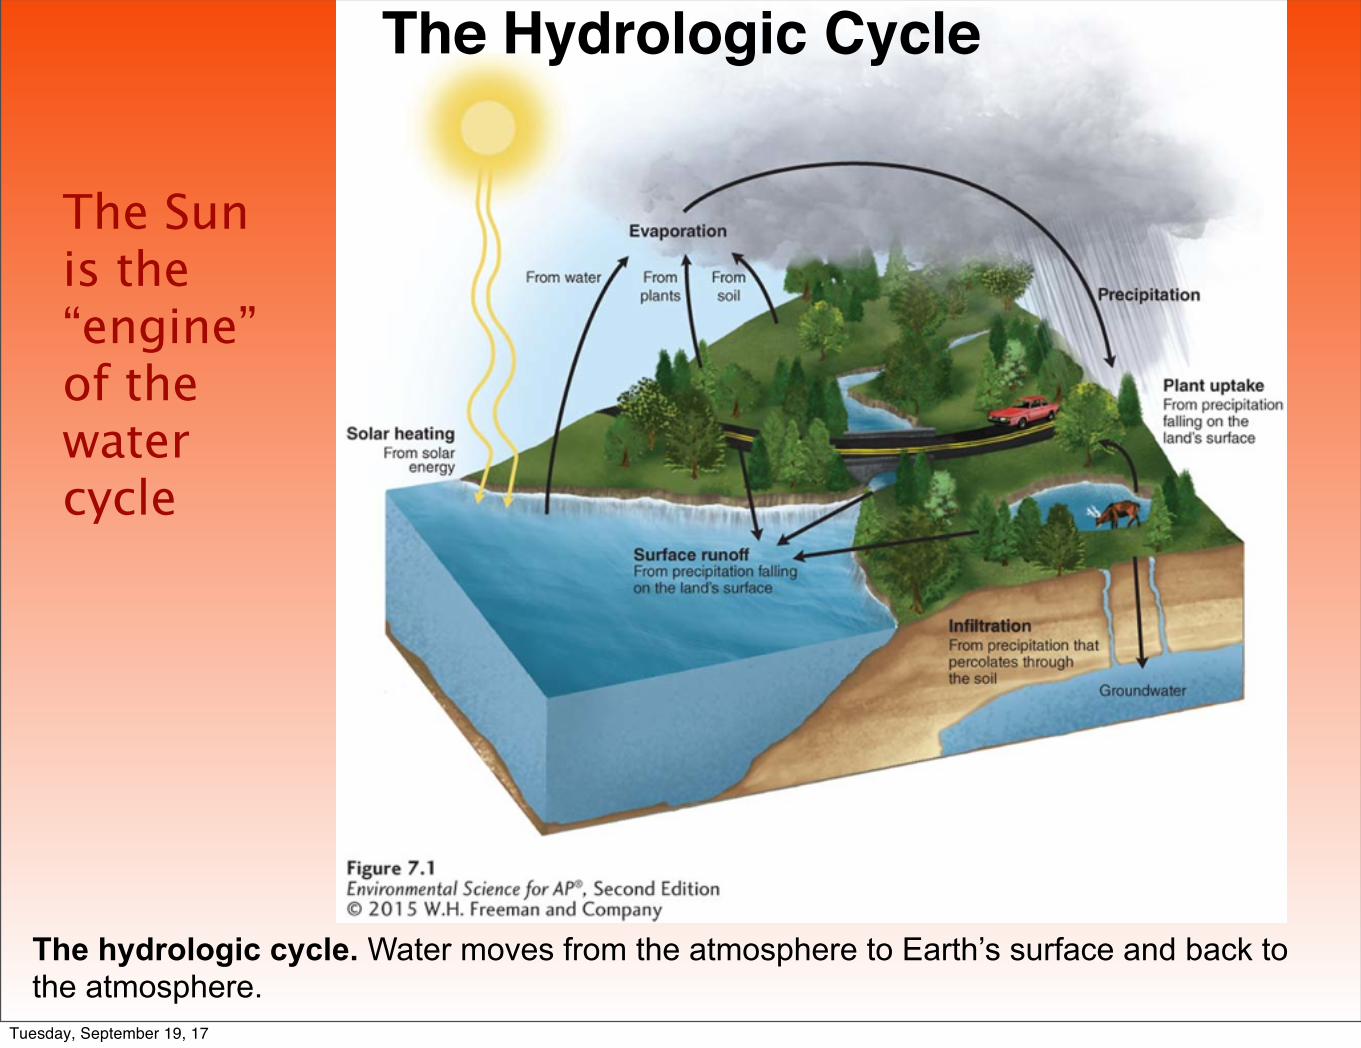
The hydrologic cycle. Water moves from the atmosphere to Earth’s surface and back to the atmosphere.
The Hydrologic Cycle
The Sun is the “engine” of the water cycle
Tuesday, September 19, 17

• Transpiration The release of water from leaves during photosynthesis.
• Evapotranspiration The combined amount of evaporation and transpiration.
• Runoff Water that moves across the land surface and into streams and rivers.
The Hydrologic Cycle
Human activities effect the water cycle!Tuesday, September 19, 17

Do The Math
Tuesday, September 19, 17

The carbon cycle moves water between air, water, and land
• Carbon cycle The movement of carbon around the biosphere.
Tuesday, September 19, 17

The Carbon CycleThe carbon cycle. Producers take up carbon from the atmosphere via photosynthesis and pass it on to consumers and decomposers. Some inorganic carbon sediments out of the water to form sedimentary rock while some organic carbon may be buried and become fossil fuels. Respiration by organismsreturns carbon to the atmosphere and water. Combustion of fossil fuels and other organic matter returns carbon to the atmosphere.
Tuesday, September 19, 17

The nitrogen cycle includes many chemical transformations
• Macronutrient One of six key elements that organisms need in relatively large amounts: nitrogen, phosphorus, potassium, calcium, magnesium, and sulfur.
• Limiting nutrient A nutrient required for the growth of an organism but available in a lower quantity than other nutrients.
• Nitrogen cycle The movement of nitrogen
Tuesday, September 19, 17

• Nitrogen fixation A process by which some organisms can convert nitrogen gas molecules directly into ammonia.
• Nitrification The conversion of ammonia (NH4
+) into nitrite (NO2– ) and then into nitrate
(NO3– ).
• Assimilation The process by which producers incorporate elements into their tissues.
The Nitrogen Cycle
Tuesday, September 19, 17

The Nitrogen Cycle
• Mineralization The process by which fungal and bacterial decomposers break down the organic matter found in dead bodies and waste products and convert it into inorganic compounds.
• Ammonification The process by which fungal and bacterial decomposers break down the organic nitrogen found in dead bodies and waste products and convert it into inorganic ammonium (NH4
+).
• Denitrification The conversion of nitrate (NO3– ) in a series
of steps into the gases nitrous oxide (N2O) and, eventually, nitrogen gas (N2), which is emitted into the atmosphere.
Tuesday, September 19, 17

The Nitrogen CycleThe nitrogen cycle. The nitrogen cycle moves nitrogen from the atmosphere and into soilsthrough several fixation pathways, including the production of fertilizers by humans. In the soil, nitrogen can exist in several forms. Denitrifying bacteria release nitrogen gas back into the atmosphere.
Tuesday, September 19, 17

The phosphorus cycle moves between land and water
• Phosphorus cycle The movement of phosphorus around the biosphere.
• Algal bloom A rapid increase in the algal population of a waterway.
• Hypoxic Low in oxygen.
Tuesday, September 19, 17

The Phosphorus CycleThe phosphorus cycle. The phosphorus cycle begins with the weathering or mining of phosphate rocks and use of phosphate fertilizer, which releases phosphorus into the soiland water. This phosphorus can be used by producers and subsequently moves through the food web. In water, phosphorus can precipitate out of solution and form sediments, which over time are transformed into new phosphate rocks.
Tuesday, September 19, 17

Calcium, magnesium, potassium, and sulfur also cycle in ecosystems
• Sulfur cycle The movement of sulfur around the biosphere.
Tuesday, September 19, 17

The Sulfur CycleThe sulfur cycle. Most sulfur exists as rocks. As these rocks are weathered over time, they release sulfate ions (SO4
2− ) that producers can take up and assimilate. This assimilated sulfur then passes through the food web. Volcanoes, the burning of fossil fuels, and the mining of copper put sulfur dioxide (SO2) into the atmosphere. In the atmosphere, sulfur dioxide combines with water to form sulfuric acid (H2SO4). Thissulfuric acid is carried back to Earth when it rains or snows.
Tuesday, September 19, 17

Module 8 Responses to Disturbances
After reading this module you should be able to
• distinguish between ecosystem resistance and ecosystem resilience.
• explain the insights gained from watershed studies.
• explain the intermediate disturbance hypothesis.
Tuesday, September 19, 17

Ecosystems are affected differently by disturbance and in how well they bounce back after the disturbance • Disturbance An event, caused by physical, chemical,
or biological agents, resulting in changes in population size or community composition.
• Resistance A measure of how much a disturbance can affect flows of energy and matter in an ecosystem.
• Resilience The rate at which an ecosystem returns to its original state after a disturbance.
• Restoration ecology The study and implementation
Tuesday, September 19, 17
Watershed studies help us understand how disturbances affect ecosystem processes
• Watershed All land in a given landscape that drains into a particular stream, river, lake, or wetland.
Tuesday, September 19, 17

Watershed Studies
Watershed. A watershed is the area of land that drains into a particular body of water.
Tuesday, September 19, 17
Intermediate levels of disturbance favor high species diversity
• Intermediate disturbance hypothesis The hypothesis that ecosystems experiencing intermediate levels of disturbance are more diverse than those with high or low disturbance levels.
Tuesday, September 19, 17

Intermediate disturbancehypothesis. (a) In general, we expect to see the highest species diversity at intermediate levelsof disturbance. Rare disturbances favor the best competitors, which outcompete other species. Frequent disturbances eliminate most species except those that have evolved to live under such conditions. At intermediate levels of disturbance, species fromboth extremes can persist. (b) An example of the intermediate disturbance in the number of algalspecies observed in response to different amounts of herbivory by marine snails. When few or manysnails are present, there is a low diversity of algal species, but when an intermediate density of snails are consuming algae, the snails cause an intermediateamount of disturbance and a higher diversity of algal species can persist in the ecosystem.
Tuesday, September 19, 17