Embed Size (px)
Citation preview

31
CHAPTER 3
EDUCATION AND EMPLOYMENT OPPORTUNITIES
A. EDUCATION 18 The Midterm Philippine Development Plan for education for 2004 to 2010 for the country aims to provide free primary and secondary education to all, eradicate illiteracy and develop vocational skills that meet the needs of the Philippine economy. The three agencies of the Department of Education, Culture and Sports (DECS), the Commission for Higher Education (CHED) and Technical Education Skills Development Authority (TESDA) share responsibility for policy making, planning, monitoring and evaluating education at their respective basic, tertiary and vocational levels. Basic education is predominantly provided by public institutions, whereas tertiary education is largely given by private institutions. While access remains an important educational issue, the quality of educational services and facilities is far from uniform in the Philippines, with variations in enrollment in many rural areas and low standards of education faced across the nation. The government has made education a priority by aligning education policy with the national economic development plan. Nonetheless, the educational curricula require further strengthening, to improve the reach to and quality of education, as well as to make education more relevant to industry needs. I. The Education System 19 The Philippines has long been a leader in Southeast Asia with respect to coverage in education. By 1970, the country achieved universal primary enrollment. This success, however, masks a long term deterioration in quality and the national figures obscure wide regional disparities. In Manila, close to all of the students finish primary school, whereas in Mindanao and Eastern Visayas, less than 30 percent complete primary education. Scores of Filipino children between 9 and 14 years of age in mathematics, science and reading were two standard deviations below the international average.
Education is offered through formal and non-formal systems. The number of years of formal schooling is one of the shortest in the world. The educational ladder has a 6+4+4 structure, (i.e., six years of elementary education, four years of secondary education and typically four years to gain a bachelor’s degree).
The academic school year in the Philippines starts in June and ends in March, covering a period of 40 weeks. Institutions of higher education operate on a semester system with an optional summer semester. Education is compulsory from age seven to twelve years, covering the first six grades of schooling.
English was the official language of instruction from 1935 to 1987. The Constitution of 1987 prescribed that both Filipino and English was to be used as the official languages of communication and instruction. English continues to be widely used from the higher primary level onwards.
The administration and supervision of the school system is the responsibility of the Department of Education (DOE), which has an office in each of the 13 regions of the country.

32
Historically, the government has been unable to fund the education system and has concentrated resources on the primary sector. Consequently, over 90 percent of enrollments at the primary level are in public schools; whereas, at secondary institutions the number is less than 70 percent and at the tertiary level, over 88 percent of institutions are private, representing 73 percent of enrollments. The quality of programs ranges from marginal to high.
1. Primary Education Primary education is compulsory and is six years in duration divided into a four year primary cycle and a two year intermediate cycle. Children generally begin first grade at seven years of age. Private schools often operate a seven year curriculum starting a year earlier. Students are annually promoted from one grade to the next provided they meet the achievement standards set for the grade. Students are rated in every subject four times during the year.
2. Secondary Education Private schools enroll a much higher percentage of students at the secondary level than at the elementary level. Approximately 40 percent of the nation’s secondary schools are private enrolling about 32 percent of all high school students. There are two main types of secondary schools: the general secondary school, which enroll more than 90 percent of high school students and the vocational secondary school. In addition, there are also science secondary schools for students who have demonstrated a particular gift in science at the elementary level. Vocational high schools differ from general high schools in that they have a heavier concentration in vocational training and practical arts. As in primary school, secondary school students are rated four times a year. If a student fails to get a final rating of lower than 75 percent in a particular subject, he or she repeats the subject in the next year. A certificate is issued to secondary school graduates.
3. Higher Education
In academic year 2002/03, there were 1,479 institutions of higher education registered in the Philippines, of which 1,305 (88%) were in the private sector. In academic year 2000/01 total post-secondary enrollment reached 2,637,039 students (of whom 73.1% were in the private sector). Public institutions of higher education include 111 chartered state universities and colleges, 44 local universities and colleges, 12 government schools that are usually technical, vocational and education training institutions offering higher education programs, five special institutions that mainly provide training in areas such as military science or national defense and two CHED-supervised post-secondary education institutions. Prior to 1994, the supervision of tertiary schools was the responsibility of the Bureau of Higher Education, a division of the former DECS. With the passage of the Higher Education Act in 1994, an independent government agency, CHED was created to exercise general supervision and control over all colleges and universities, both public and private, in the country. The commission regulates the establishment or closure of private higher education institutions, their program offerings, curricular development, building specifications and tuition fees. Private universities and colleges follow the regulations and orders of CHED, although a select few are granted autonomy or deregulated in recognition of their service to quality education and research. In 1995, legislation was passed providing for the transfer of supervision of all non-degree, technical and vocational education programs from the Bureau of Vocational Education, also under the control of the Department of Education, to an independent agency, the Technical Education and Skills Development Authority (TESDA). The establishment of TESDA has increased emphasis on and support for non-degree vocational education programs.

33
Box 2. Academic Credit System
Degree programs at all colleges and universities are weighted according to a system of instructional units based on class hours where one unit of instruction equals one hour of lectures or three hours of lab work per week. Typically, courses are three units in value and require 54 hours of classroom instruction over an 18 week semester. Four year bachelor degree programs in the arts and sciences require a minimum of 120 units for graduation, although the minimum at many schools is likely to be 140 to 160 units. Some programs may require as many as 185 units. Source: Nick Clark, Education in the Philippines
In addition to regulating higher education, CHED is also responsible for developing policies to support quality improvement in higher education. CHED encourages institutions to seek accreditation and provides a number of incentives in the form of progressive deregulation, grants and subsidies to institutions with accredited programs. However, all educational programs operate legally if they have government recognition in the form of a grant of authority and official recognition to operate. Government recognition is not confused with accreditation.
4. University Education The structure of the tertiary system in the Philippines in terms of style of programs offered at Philippine universities strongly resembles the US higher education structure. Entrance to universities and other institutions of higher education requires a high school certificate of graduation and in some cases, the results of the National Secondary Achievement Test (NSAT), or in many colleges and universities, their own entrance examination. NSAT is administered to fourth year high school students to gauge the quality of the individual institutions they are attending. It is not designed or intended as an admission test, but has nonetheless served that purpose for some institutions. Privately administered testing programs through the Center for Educational Measurement (CEP) are adopted by colleges for admissions purposes. The two most common ones are the College Scholastic Aptitude Test (CSAT) and the Admission Test for Colleges and Universities (ATCU). From 1973 to 1994, the National College Entrance Examination (NCEE) was used for admission to post-secondary degree programs. It was abolished and replaced by the NSAT because it was considered by many not to be discriminative. The Philippine Education Placement Test (PEPT) is a national examination designed to evaluate the grade level of students returning to school or seeking admission to college based on knowledge and skills gained through formal and non-formal methods.
a. Programs and Degrees
Stage I: Bachelor’s (Batsilyer) degree programs are a minimum of four years in length. During the first two years of study, students are required to take general education courses (63 credits), with courses counting towards the major usually being undertaken in the last two years of the program. Some institutions offer five year programs in science, pharmacy and agriculture (200 credits). Engineering, architecture (226 credits) and music programs normally require five years of study. Some institutions offer a two year (generally 70 credit) Associate (Asosyado) degree program, usually in arts, science or commerce. Graduates of these programs can, if desired, transfer into the last two years of a bachelor degree program. An increasingly popular associate and certificate program is midwifery and the sole tertiary level credential in the field is the two year Graduate in

34
Midwifery certificate. A four year Bachelor of Science in Nursing (BSN) is the sole entry-level degree for nursing. Graduates are required to take licensure examinations. The post-secondary programs leading to the Doctor of Dental Medicine and Doctor of Veterinary Medicine normally require six years of study, involving two years of appropriate preliminary studies and four years of specialized courses. Stage II: Master of Arts/Science (Masterado, Dalubhasa, or Kadalubhasaan) degrees usually require two years of full time study and a minor thesis or comprehensive examinations. The entrance requirement for most master degree programs is a bachelor degree in an appropriate discipline, with an average grade equal to or better than 2.00, 85 percent or B.
Some professional degrees, such as law and medicine are pursued following a first bachelor degree. The first degree awarded in medicine is the Doctor of Medicine (M.D.), which generally requires that students study basic medical sciences for the first two years followed by two years in clinical rotation. This is generally followed by a one year internship, after which graduates take the licensing examination and, as appropriate, three to five years’ residency (for specialization). All students seeking admission to medical programs must attain a passing score on the National Medical Admission Test (NMAT) as established by each institution. The Bachelor of Laws (LL.B or L.I.B) also requires four years of study following the first degree. The Juris Doctor (J.D.) requires an additional eight units (2-4 classes) of coursework and a thesis beyond the requirements for the LL.B. Students of both programs are expected to complete an internship of not more than 12 months, completion of which combined with completion of the LL.B/J.D., qualifies them to take the bar examination administered by the Supreme Court. A few universities offer four year master’s programs that build on a four year bachelor’s degree for veterinary medicine, rather than the usual six year program (see above). Stage III: Doctor of Philosophy (Doktor sa Pilospiya) programs often involve a substantial amount of coursework, while the dissertation may comprise as little as a quarter or a fifth of the total credits. Ph.D programs usually require two or three years of full-time study beyond the master's degree. Programs that require primarily coursework without original research emphasis and usually without a major dissertation, award professional degrees identified specifically as Doctor of the program’s disciplinary field, such as Doctor of Education (Ed.D.), Public Health (D.P.H.) and others. The entrance requirement is usually a master degree, with an average grade of 2.00 or B. Two academic degrees in law are offered in addition to the first professional degrees: the two year Master of Law (LL.M) and the three years Doctor of Civil Laws (D.C.L). Both require a J.D. or LL.B for admission.
5. Non-University Higher Education Technical and vocational schools and institutes offer programs in a variety of fields, including agriculture, fisheries, technical trades, trade technical education, hotel and restaurant management, crafts, business studies, secretarial studies and interior and fashion design. The entry requirement is a high school diploma and entrance examinations are generally not required. Postsecondary programs lead to either a certificate (often entitled a Certificate of Proficiency) or a diploma. The Professional Regulation Commission (PRC) regulates programs for 38 different professions and administers their respective licensure examinations.
a. Programs and Degrees Credentials are awarded by individual institutions and authorized by TESDA. It has (recently) established a process called the Technical Occupation Qualification and Certification System (TOQCS) through which standards are set for a specific set of craft/trade level qualifications based upon the type of program and occupational skill level involved. All technical credentials are

35
referred to as certificates and are awarded after the passing of standardized examinations administered by TESDA. The national certificates generally require a program of study of between one and two years. There are a series of tests that lead to certifications on a four step ladder (Level I, II, III and Technician or Master Craftsman). All four levels do not exist in all occupational categories. Technical and vocational institutions label their credentials by a wide variety of titles in a particular field; these include diploma, associate, graduate or craftsman. Some technical institutes are authorized to award bachelor degrees in a similar range of subjects as those of technical and vocational schools. Community colleges offer two year programs leading to an Associate Degree in a range of vocational areas. II. Educational Reform 20 Educational reforms currently underway in the Philippines have been influenced by many events. Several important ones are discussed below.
a. The Constitution of 1987 The promulgation of the new Constitution of 1987 enshrined a high commitment to education by the government. The new Constitution was promulgated shortly after the Aquino government came to power, in the wake of the People led revolution that took place in 1986. Section 17 of Article II of the Constitution stipulates that:
“The State shall give priority to education, science and technology, arts, culture and sports to foster patriotism and nationalism accelerate social progress and promote total human liberation and development.”
Also, Section 1 of Article XIV states that:
“The State shall protect and promote the right of all citizens to quality education at all levels and shall take appropriate steps to make such education accessible to all.”
Section 5 further stipulates that the State shall assign the highest budgetary priority to education and ensure that teaching will attract and retain the best available talents. The Constitution reflects several major issues in education for youth in the Philippines. These include the provision of free public elementary and high school education, parental and community support, the quality of education, the role of private institutions in higher education and the encouragement of non-formal, informal and indigenous learning systems.
i. Access to education
Free public elementary and high school education and compulsory elementary education for children of school age are enshrined in Section 2 of Article XIV of the Constitution. Section 5 stipulates the need for the State to take regional and sectoral needs and conditions into account when developing educational policies and programs.
ii. Parental and community support
A system of scholarship grants, student loan programs, subsidies and other incentives are prescribed in the Constitution under Section two of Article XIV. Section 4 of Article XIV prescribes tax exemptions for all grants, endowments, donations, or contributions used, actually, directly and exclusively for educational purposes.

36
iii. Quality of education
Section 5 of Article XIV of the Constitution stipulates that “teaching will attract and retain its rightful share of the best available talents through adequate remuneration and other means of job satisfaction and fulfillment”.
iv. Role for private institutions
Section 4 of Article XIV recognizes the complementary role of public and private institutions and charges the State with the duty of supervising the regulation of all education institutions.
v. Importance of non-formal, informal and indigenous learning systems
Encouragement of non-formal, informal and indigenous learning systems and the provision of civic, vocational and other skills for adult citizens, the disabled and out-of-school youth are enshrined in Section 2 of Article XIV.
Many of the reforms in the education system in the Philippines have occurred since the new Constitution put in place mechanisms to address issues highlighted in the Constitution.
b. Free Secondary Education Act of 1988
The provision of universal primary education was stipulated in the 1935 Constitution and the 1973 Constitution broadened this to include, where finances permitted, free secondary education (NYC 1997a). However, free secondary education was not provided by the State until 1988 with the promulgation of the “Free Secondary Education” Act (Republic Act 6655), by the Philippine Congress. Unfortunately, the Act was not accompanied by continued budgetary support, so free secondary education eludes many Filipino youth, particularly those living in remote areas.
c. Presidential declaration of “Decade for Educatio n for All” 1990-1999 In 1989, the President proclaimed 1990-1999 as the “Decade of Education for All” (EFA). In 1991 the government released the Philippine Plan of Action for Education for All (PPA). Under the PPA, the EFA was operationalized with the goal of providing elementary education (Grades 1 to 6) to all Filipinos by the year 2000. The EFA project would be jointly implemented by the education and non-education sectors. Four major interventions were to be undertaken: institutionalisation of early childhood care and development; provision of universal, quality primary education; eradication of illiteracy; and continuing educational development for adults and out-ofschool youth (OSY) (National Committee on EFA and the Republic of the Philippines, forthcoming). A review of the EFA decade is being undertaken in 2000 to measure actual results against the targets set a decade ago.
d. Congressional Commission of Education As a follow-up to the Congressional Commission on Education (EDCOM) held in 1994, the Philippine Congress enacted a legislation to overhaul the administration of education in the Philippines. It created the Commission of Higher Education (CHED) through the Higher Education Act (Republic Act 7722), bestowing to CHED the responsibility of overseeing higher education in the country. The Department of Education, Culture and Sport (DECS) will focus on basic education. In addition, Republic Act 7796 established the Technical Education and Skills Development Agency (TESDA) to oversee technical and vocational education in the country. In the findings of the EDCOM report, higher education was characterized by large enrolment, imbalanced geographical distribution, under-investment and poor quality of instruction. There was

37
also a mismatch between programs and graduates; between employment and societal needs; as well as limited and underdeveloped graduate education. The principles of the reform could reflect the decision to separate basic education from higher education so that public money could be concentrated on basic education while tertiary education be made more self-sustaining. The separation was aimed at addressing the need for increased enrolments in basic education, while simultaneously ensuring that tertiary education becomes more relevant to the needs of the industrial sector. The Technical Education Skills Development Agency (TESDA) law prescribed that the State shall “provide relevant, accessible, high quality and efficient technical education and skills development in support of the development of high quality Filipino middle-level manpower responsive to and in accordance with, Philippine development goals and priorities”. The TESDA law also aimed to strengthen private participation in higher education, “being direct participants and immediate beneficiaries of a trained and skilled workforce”.
e. Master Plan for Basic Education (MPBE), 1996-200 5
After the restructuring of the education sector in line with the recommendations of EDCOM, the Department of Education, Culture and Sports (DECS) focused on elementary and secondary education. Pursuant to this new mandate, DECS prepared the Master Plan for Basic Education: 1996 to 2005 (MPBE) to guide the future direction of this education sub-sector, with the EFA program as its centre-piece (NCEFA and the Republic of the Philippines forthcoming).
f. Introduction of the dual training system
The enactment of the Dual Training Act (Republic Act 7686), mandated the adoption of a dual training system for vocational and technical education. This law declared the adoption of the dual training system in duly accredited vocational and technical schools, in cooperation with accredited agricultural, industrial and business establishments as a “preferred means of producing a dependable pool of well-trained operators, craftsmen and technicians for the economy”.
g. Abolition of National College Entrance Examinati ons
Republic Act 7731 abolished the National College Entrance Examination (NCEE) to remove the barrier to poor students from remote barangay high schools seeking tertiary education. While the law removes an artificial barrier, enactment of a law alone cannot solve the complex issues associated with access and equity in education in the Philippines.
h. Medium-Term Youth Development Plan 1999-2004
The Youth in Nation-Building Act (Republic Act No. 8044 of 1995) established the National Youth Commission (NYC) and charged it with the functions of youth policy formulation and program development and promotion. Education policy forms a key element of the Medium-Term Youth Development Plan 1999-2004 (MTDYP), which is the major policy document and plan for youth in the medium-term. The MTDYP addressed youth issues according to four sub-sectors: in-school youth; out-of-school youth; working youth; and those with special needs. For in-school youth, the MTDYP notes the increasing school participation of students, the establishment of additional schools, improved resource allocation for the education sector and the passage of landmark laws and legislation affecting in-school youth. Although achievements have been made, important policy issues, such as the poor performance indicators for secondary schools, the low success rate in professional examinations, inadequate number of secondary and tertiary schools, social selectivity of tertiary institutions and increasing proportion of educated among the unemployed,

38
have been identified. While in-school youth is the sub-sector with the most direct links to youth education policy, the MTYDP identified numerous education issues that also impact upon out-of-school youth, working youth and youth with special needs. Other laws have affected education policy in the Philippines. These include Republic Act 7784 (Centre for Excellence in Teacher Education), aimed at strengthening the education and training of teachers nationwide through teacher education and Republic Act 7791, which lengthened the school year from 185 to 200 days.*
THE POLICY FRAME FOR EDUCATION, DEVELOPMENT IN THE PHILIPPINES Philippine Medium Term Development Plan (MTDP) 2001 -2004
The 2001-2004, MTDP indicate that raising the country’s human capital through investments in education and training is important in at least two ways. One, this supports economic growth over the long term; and two, it helps break the transmission of poverty from one generation to another. On one level, the government can create a climate that encourages individuals and families to allocate their own funds for education. Policies that encourage the formation of partnerships between the government and the private sector for the provision of school buildings and other education facilities and the emergence of loan markets for higher education are illustrative of these. On another level, the government can take a direct hand in the provision of education and training. Examples are public spending for early childhood education programs that enable children from low-income families to overcome learning disadvantages in first grade; for quality basic education aimed at enhancing science, mathematics and information technology skills; and for state run vocational and technical training institutes, colleges and universities. Financing Education Services
Government spending on education services increased in 1999-2000, although its share in total expenditures slightly declined. Nevertheless, allocation for education, culture and manpower development accounts for the bulk of total government spending. In view of the government’s deficit reduction strategy, spending across all sectors continues to be rationalized. Some agencies have started phasing out activities that are better implemented by the private sector. However, equity considerations led to cautious cutbacks of subsidies on basic services for the poor. III. Education Situation 21
Basic education bore the effects of continuing rapid population growth, estimated at 2.3 percent annually. The public school system is hard-pressed to cope with the requirements of an expanding student population, particularly at the secondary level, due to, among others, the implementation of free public secondary education. Severe budgetary constraints have led to under-investment in basic education, as evidenced by the decline in real spending per student. Government spending for basic education in 2000-2004 grew at an annual average of 4.5 percent. While this appears generous, 89 percent of the budget of the Department of Education (DepEd) went to salaries and other personnel benefits while expenditures for developmental purposes (e.g., attendance to training programs, conduct of instructional supervision and purchase of instructional materials/aids/devices) are derived from its maintenance and other operating expenses (MOOE) budget at seven percent. On the other hand, classrooms and
* This was later increased to 220 days.

39
instructional equipment, including computers for teaching and learning purposes are obtained from the capital outlay of four percent. Based on the 2000 Census of Population and Housing, basic or simple literacy† rate stood at 92.28 percent, so far one of the highest in Southeast Asia. On the other hand, functional literacy‡ was 83.79 percent (81.7% for males and 85.9% for females. The performance of the basic education sector in SY 2002-2003 is summarized in Table 13. Elementary school participation rate was 90 percent and for secondary school, 58 percent levels were higher among female cohort survival rates were 69.8 percent at the elementary and 65.8 percent at the secondary levels. Completion rate was 67 percent at the elementary level and 60 percent at the secondary level. As of school year (SY) 2003-2004, actual enrolment stood at 19.2 million in both public and private schools (67% for elementary and 33% for secondary levels), of which 17 million were in the public school system (71% for elementary and 29% secondary levels). Net participation rate was at 90.1 percent for elementary and 58.03 percent for secondary schools. Participation at the elementary level was almost the same for boys and girls but at the secondary level, there were more girls than boys in school. Similarly, with respect to survival, retention and completion, girls were doing much better than boys. In terms of learning achievement, the DepEd also adopted a shift in student assessment policy beginning SY 2002-2003, including diagnostic testing at the start of the school year for Grade IV pupils and Year I students in public schools. Initial results showed that students had very poor competencies in math, science and English. But far more alarming were the results of the testing conducted for incoming first year students in SY 2004-2005, where only about half of a percent of the examinees obtained scores within the 79 - 94 percent range and less than 20 percent got 50 percent scores, which is the start of mastery level. Majority of the students garnered scores of 49 percent or below. However, concrete improvements have been registered in the provinces with projects under the official development assistance (ODA). These are the World Bank (WB) assisted Third Elementary Education Project (TEEP), AusAID assisted Basic Education Assistance in Mindanao (BEAM), Educational Facilities Improvement Projects (EFIP), the United Nations Children’s Fund or UNICEF-assisted Fifth Country Program for Children and the School Based Training Program. Actual pupil performance in 21 TEEP-supported provinces generally showed scores significantly higher (56%) than the national mean of 44 percent. For the government’s part, it has the Government Assistance to Students and Teachers in Private Education (GASTPE) Program. Some 277,000 high school students enrolled in high school.
† Basic/Simple Literacy is the ability of a person to read and write and understand a simple message in any language or dialect. ‡ Functional Literacy is simple literacy + numeracy and the ability of the person to use these skills for sell-improvement.

40
Table 13. Basic Education Key Indicators, SY 2002 - 2003 (in percent)
Particulars Male Female Overall Participation Rate Elementary Secondary
89.26 53.80
90.87 62.35
90.05 58.03
Cohort Survival Rate Elementary Secondary
66.01 58.72
74.06 73.13
69.84 65.83
Drop-out Rate Elementary Secondary
8.44 16.26
6.15 9.96
7.34 13.10
Completion Rate Elementary Secondary
62.94 52.38
71.18 67.46
66.85 59.79
1. Data cover both public and private schools. Data on private based on 82.5 percent of processed school profiles.
2. Participation rate refers to the proportion of 7-12 age group (elementary) and 13-16 years old (secondary) who are in school against total population for the same age group. Beginning SY 2002-2003, however, the age groups consist of the 6-11 years old (elementary) and 12-15 years old (secondary) who are in school against total population of the same age group. Source: Department of Education Annual Report, 2002-2003
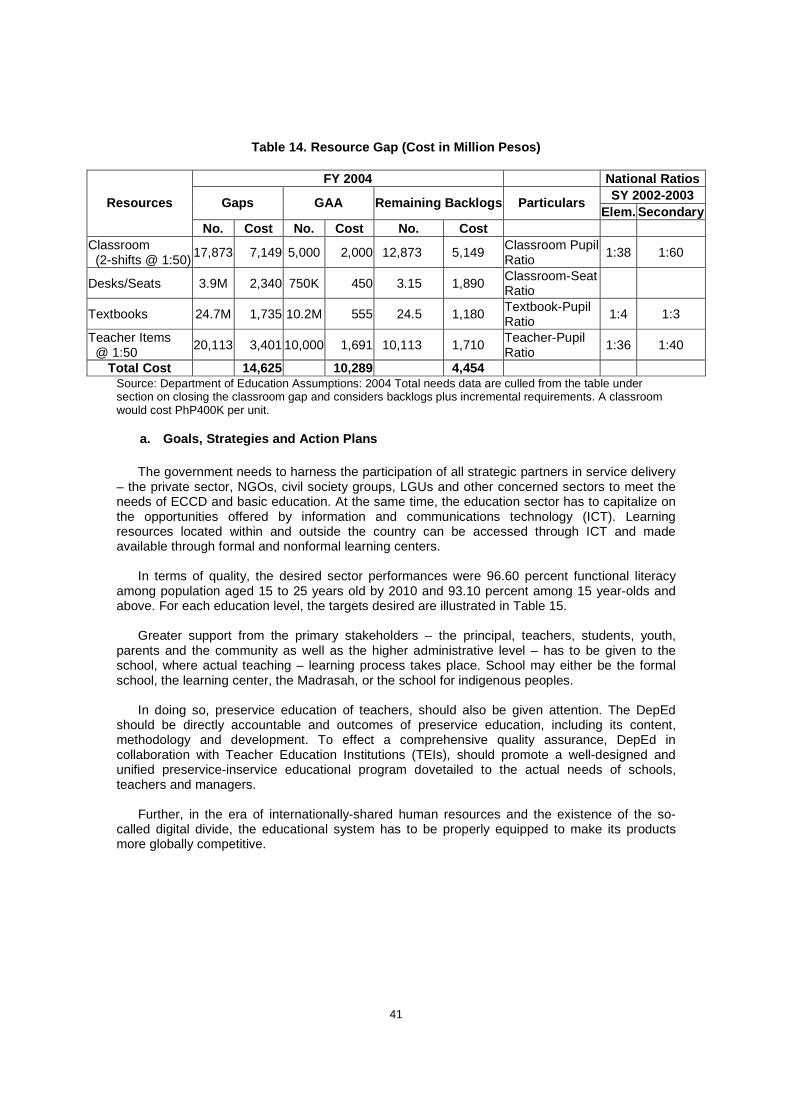
Subsidy increased from PhP 2,500 to PhP 4,000 per student in SY 2003-2004. An additional 166,000 students also benefited from Tuition Fee Supplement (TFS) scheme in 2002, which was phased out in SY 2003-2004 due to limited budget. Thus, for SY 2003-2004, only second to fourth year qualified students were accepted as grantees under the TFS while for SY 2004-2005, only the third and fourth year TFS grantees will remain in the program. Other critical school resources for delivering quality education include classrooms, desks/seats, teachers and textbooks. The resource gap, however, remains wide (Table 14), while in terms of school less barangays, only 118 of the total 1,617 identified in 2001 had no access to elementary education. While the national ratios may appear sound, the data when disaggregated by division/province showed serious gaps such as classrooms being used by more than 100 children, a two seater desk shared by three to four children and a teacher holding a class of 100 or more pupils. In addition, excess teachers in some areas cannot be redeployed to areas with severe shortage because of the Magna Carta for Public School Teachers. Teacher qualifications remained an issue, especially at the secondary level, both in terms of content and pedagogy. As of SY 2004-2005, only 80 percent of the public secondary teachers teaching math were math majors. In the sciences, 44 percent of Biology teachers were majors in the subject, compared with 34 percent in Chemistry and 27 in Physics. The other teachers are science generalists. Remedial measures like training in these subject areas were given to non-major teachers who handled science or math classes in the public secondary schools. However, even for teachers who were specialists in these subject areas, the level and quality of subject competency appeared to be wanting.
41
Table 14. Resource Gap (Cost in Million Pesos)
FY 2004 National Ratios SY 2002-2003 Gaps GAA Remaining Backlogs Particulars
Elem. Secondary Resources
No. Cost No. Cost No. Cost Classroom (2-shifts @ 1:50)
17,873 7,149 5,000 2,000 12,873 5,149 Classroom Pupil Ratio
1:38 1:60
Desks/Seats 3.9M 2,340 750K 450 3.15 1,890 Classroom-Seat Ratio
Textbooks 24.7M 1,735 10.2M 555 24.5 1,180 Textbook-Pupil Ratio
1:4 1:3
Teacher Items @ 1:50
20,113 3,401 10,000 1,691 10,113 1,710 Teacher-Pupil Ratio
1:36 1:40
Total Cost 14,625 10,289 4,454 Source: Department of Education Assumptions: 2004 Total needs data are culled from the table under section on closing the classroom gap and considers backlogs plus incremental requirements. A classroom would cost PhP400K per unit.
a. Goals, Strategies and Action Plans The government needs to harness the participation of all strategic partners in service delivery – the private sector, NGOs, civil society groups, LGUs and other concerned sectors to meet the needs of ECCD and basic education. At the same time, the education sector has to capitalize on the opportunities offered by information and communications technology (ICT). Learning resources located within and outside the country can be accessed through ICT and made available through formal and nonformal learning centers. In terms of quality, the desired sector performances were 96.60 percent functional literacy among population aged 15 to 25 years old by 2010 and 93.10 percent among 15 year-olds and above. For each education level, the targets desired are illustrated in Table 15. Greater support from the primary stakeholders – the principal, teachers, students, youth, parents and the community as well as the higher administrative level – has to be given to the school, where actual teaching – learning process takes place. School may either be the formal school, the learning center, the Madrasah, or the school for indigenous peoples. In doing so, preservice education of teachers, should also be given attention. The DepEd should be directly accountable and outcomes of preservice education, including its content, methodology and development. To effect a comprehensive quality assurance, DepEd in collaboration with Teacher Education Institutions (TEIs), should promote a well-designed and unified preservice-inservice educational program dovetailed to the actual needs of schools, teachers and managers. Further, in the era of internationally-shared human resources and the existence of the so-called digital divide, the educational system has to be properly equipped to make its products more globally competitive.

42
Table 15. Basic Education Plan Targets, 2005 and 20 10 (in percent)
Indicative Target Indicator Baseline
2002 2005 2010 Formal Basic Education 1. Net Intake Rate in Grade I Public (6 yrs old) Private (7 yrs old) Public & Private (6 yrs old)
n.a. n.a.
47.10
n.a. n.a.
52.38
n.a. n.a.
61.19 2. Net Enrolment Ratio Elementary (6-11 yrs old) Secondary (12-15 yrs old)
90.05 58.03
91.02 67.48
93.01 83.73
3. Cohort Survival Ratio Elementary (Grade 6) Secondary (Year 4)
69.84 65.83
73
67.96
78
71.51 4. Drop Out Rate (School leavers Rate) Elementary Secondary
7.34 13.10
5.52 11.24
4.32 8.14
Source: Department of Education, 2005. IV. TECHNICAL VOCATIONAL EDUCATION AND TRAINI NG (TVET) Technical Vocational Education and Training (TVET) are carried out through both formal and non-formal means. Data in 2003 showed that the provision of TVET through formal means is dominated by the private sector (82%). The opposite could be observed in terms of non-school based training with publicly funded institutions accounting for 40 percent of all providers. There were about 2,045 private institutions/centers and 1,353 publicly funded TVET. These comprise the total TVET delivery network that includes higher education institutions, industry-based training centers, NGO based training centers, LGU based training centers as well as schools and training centers supervised by the Technical Education and Skills Development Authority (TESDA). (Table 16) Private institutions account for about 80 percent of total enrolment in formal TVET financed almost exclusively by tuition fees and endowment income, with minimal government subsidy. From more than 286,000 in 2001, school based TVET enrolment rose to about 439,000 in 2002 and reached almost 492,000 in 2003. Enrolment of community based training programs also accounted for the bulk of training outputs. The program registered close to 600,000 enrollees the past two years. Following the envisioned devolution to the private sector, many industrial associations and large firms provide training for their members as well as “work experience” to a vast number of graduates of TVET. While this is helpful, the work experience is often not well-related to the occupation for which trainees have been trained.

43
Table 16. Middle-Level Skills Development Indicator s, 2003 Programs Indicators Male Female Total
A. TVET Enrolment and Graduates • School based Programs Enrolment Graduates • Center-Based Enrolment Graduates • Community-Based Enrolment Graduates • Enterprise-Based Enrolment Graduates • Others Enrolment Graduates
249,071 121,433
46,184 46,314
236,760 227,937
23,437 17,286
57,986 59,927
242,775 114,793
16,973 14,677
331,018 313,383
42,018 25,294
71,866 65,517
491,846 236,226
63,157 60,991
567,778 541,927
65,455 42,580
129,852 215,444
B. Assessment and Certification Number of Persons Assessed Number of Persons Certified Certification Rate (in%)
138,109 66,223
47.9
55,052 19,843
36.0
232,062 109,468
47.2 C. Number of TVET Providers Public Private
3,397 1,352 2,045
D. Number of TVET Programs Registered 10,786 TVET programs E. Scholarship and Other Student Assistance Programs PESFA Scholar TESDAP-ADB Iskolar ng Mahirap ng Pamilya
13,780 filled slots for SY 2003-2004 5,109 slot for SY 2003-2004
1,979 Certificates of Educational Assistance (CEAs) awarded for use in SY 2005-2006
Source: TESDA Report, 2004 Data are cumulative from 2000 to 1st semester 2004 In terms of performance and job absorption of TVET graduates, the 2002 Graduate Tracer Study conducted by TESDA revealed the following: (a) employment rate of graduates was at 58.28 percent for training center graduates, 67.73 percent for TESDA schools and 57.6 percent for private institutions; (b) In terms of skills utilization rate or proportion of trainees actually employed in jobs related to their training, training centers registered 80.04 percent, TESDA schools, 83.24 percent and private Technical Vocational Institutes (TVIs), 77.46 percent; and (c) assessment and certification aimed to measure the acquired competencies of workers in terms of skills, knowledge, attitudes and values went down to 49 percent in 2002 from a record high of almost 80 percent and 47 percent in 2001 and 2003, respectively. V. HIGHER EDUCATION22
a. Situation Social demand for higher education remains high but minimal increases were experienced based on 2000 to 2003 date (Table 17). The total number of graduates increased annually by about five percent across all disciplines and by 15.4 percent in the priority disciplines, namely, Science, Maritime, Medicines and Health-related, Engineering and Technology, Agriculture Engineering, Forestry and Veterinary Medicine and Teacher Education.

44
Enrolment in higher education programs of state universities and Colleges (SUCs) increased by 5.3 percent from 700,199 in 2000 to 737,150 in 2003. Overall. SUCs served approximately 30 percent of the total number of higher education students. Graduates produced by SUCs also increased from 106,083 in 2000 to 145,300 in 2003, an increase of 37 percent for the four year period. The increase is evident in priority programs such as Teacher Education, Engineering and Technology and Agricultural. It is also worth noting that females consistently accounted for the bigger percentage of enrolment and graduates across all disciplines, in the priority disciplines and in the SUCs. To address the access and equity as well as gender and development issues, CHED implemented various student scholarship and financial assistance programs, which resulted in a substantial increase in the number of recipients from both public and private HEIs from 44,868 in 2000 to 52,510 in 2003. Another program of CHED, the Expanded Tertiary Education Equivalency and Accreditation Program (ETEEAP), provides accreditation and equivalency of learning and competencies outside the formal education system. The number of graduates under ETEEAP reached 270 in 2003.
On the quality assurance part, the number of HEIs with accredited programs increased from 160 (11.35% of total HEIs) in 2000 to 193 (12.67% of total HEIs) in 2003. Faculty qualifications have improved in terms of percentage of collegiate faculty with masters degrees from 25.7 percent in 2000 to 29.88 percent in 2003. Faculty with doctorate degrees likewise increased from 7.5 percent to 9.21 percent for the same period. Barriers to Accessing Higher Education Barriers to higher education can be measured by the number of institutions relative to students and the distribution of tertiary institutions across the country. Access may also be assessed according to the financial requirements. Although schools may be available, high tuition fees often prevent poor students from enrolling. The concentration of tertiary institutions in certain regions presents barriers to access for many students who live in rural and remote regions. A large proportion of tertiary schools are located in the National Capital Region and adjacent Regions III and IV. In 1996-1997, tertiary institutions located in these regions accounted for more than 38 percent of the total number of tertiary institutions. The ownership of tertiary institutions can also present barriers to access and participation of students. In contrast to secondary schools, tertiary institutions remain largely private. The proportion of government tertiary institutions has never reached above 30 percent. Vocational and technical schools appear to be following the same ownership and enrolment rate as tertiary institutions. The high level of private ownership and enrolment rate in Philippine tertiary institutions results in adverse social selectivity, whereby only well-off and well-prepared students are accepted. The education system thus reinforces the prevailing social inequities. The high fees often exclude children from poor families from participation, regardless of whether places are available. In summary, the core challenge for tertiary education is to make it relevant to the needs of the national and international market, as well as making it accessible to qualified students.

45
Table 17. Higher Education Indicators, 2000-2003
ACCOMPLISHMENTS 2000 2003
INDICATOR
Male Female Total Enrolment (All Disciplines) 2,430,842 1,095,311 1,363,079 2,458,390 Graduates (All Disciplines) 363,640 167,550 251,522 419,072 Enrolment (Priority Programs) 1,440,286 706,038 774,876 1,480,914 Graduates (Priority Programs) 209,265 105,741 135,794 241,535 No. of SUCs 108 Enrolment (SUCs) 700,199 314,289 422,861 737,150 Graduates (SUCs) 106,083 57,453 87,848 145,301 Average Passing Rate in Board Exams 45.35 n.a. n.a. 41.71 ETEEAP with Applicants 35 n.a. n.a. 270 Graduates 160 n.a. n.a. 193 HEIs with Accredited Programs 152 208 Accredited Programs by Level Level I 445 602 Level II 146 161 Level III - 11 Level IV - - Scholars 44,868 n.a. n.a. 52,510 Faculty % with MA/MS 26 n.a. n.a. 29.88 % with PhD 7.5 n.a. n.a. 9.21 ICT Facilities % of HEIs with internet connection 72 % of HEIs with computers for Academic use 85 Operation use 89 1 Preliminary data 2 Priority disciplines are Sciences, Maritime, Medicine and Health related disciplines, Engineering and Technology, Agriculture and Agricultural Engineering, Forestry, Veterinary Medicine and Teacher Education. 3 Based on 2003 Survey of HEIs n.a. – no data available Source: Commission of Higher Education, education system. The number of graduates under, ETEEAP reached 270 in 2003.

46
B. YOUTH EMPLOYMENT23
The Constitution of 1987, the National Labor Code and other recent legislation provide a strong framework for the support and regulation of youth employment in the Philippines. A plethora of government departments at the national, provincial and local levels is also involved in implementing labor market initiatives to increase skills development among Filipino youth. Despite these efforts, the Philippine Medium-Term Youth Development Plan (PMTYDP) 1999-2004 identified for policy makers many challenges that remain in the area of youth employment. The Philippine labor force suffers from an oversupply of labor. The economy is unable to absorb the large number of new entrants into the labor market each year. It is particularly difficult for young workers to find employment and even more difficult for them to find well-paid, secure and safe jobs. This situation contributes to the internal and international migration of labor. Many migrants are young workers, who leave the Philippines in search of improved economic circumstances. There is currently a mismatch between the skills that graduates from vocational and tertiary education are obtaining and those required by industry. There is also a favoring of training urban youth over their rural counterparts and an imbalance between training for traditionally male dominated occupational areas and traditionally female occupations. As a result, the Philippine education and training systems reinforce discrimination agricultural workers facing many barriers to employment and training opportunities. Other issues such as low wages, unsafe working conditions, prevalence of child labor and poor access of youth to social security protection make Filipino youth extremely vulnerable in both the domestic and international labor markets. Despite this, there are very few employment and training programs that specifically target Filipino youth. Labor force participation The National Labor Code defines the legal minimum working age as 15 years and in 2000, the total labor force in the Philippines was estimated at 31.85 million people. From this total labor force, some 3 million were in the age range of 15 to 19 years, 4.1 million were in the age range of 20 to 24 years and a further 7.5 million were in the age range of 25 to 34 years. In 1996, about 12 million youth were either employed or actively seeking employment, representing 60 percent of the age-eligible youth population with an average labor force participation rate of 59.3 percent for youth between 15 and 30 years. In October 2002, 49.1 percent of the youth were in the labor force comprised by 58.7 percent male and 38.2 percent females. In the urban areas, 46.5 percent were in the labor force while in rural areas it was 51.8 percent (Table 18). In 2002, the youth comprised one-third of the 45.3 million working age population (15-64 years old). About half of them were already in the labor force, either employed or still looking for work (unemployed).

47
Table 18. Labor Force Characteristics of the Youth by Sex and Residence, October 2002
Number (in thousands)* Rate (in percent)* Both Sexes Male Female Both Sexes Male Female Philippines 15390 8166 7224 100.00 100.00 100.00 In the labor force 7553 4790 2763 49.1 58.7 38.2 Employed 5937 3845 2092 78.6 80.3 75.7 Unemployed 1616 945 671 21.4 19.7 24.3 Not in the labor force 7837 3376 4461 50.9 41.3 61.8 Urban 7856 3938 3918 100.00 100.00 100.00 In the labor force 3653 2057 1596 46.5 52.2 40.7 Employed 2649 1446 1203 72.5 70.3 75.4 Unemployed 1004 611 393 27.5 29.7 24.6 Not in the labor force 4203 1881 2322 53.5 47.8 59.3 Rural 7533 4228 3305 100.00 100.00 100.00 In the labor force 3900 2733 1167 51.8 64.6 35.3 Employed 3287 2399 889 84.3 87.8 76.2 Unemployed 613 334 279 15.7 12.2 23.9 Not in the labor force 3634 1495 2139 48.2 35.4 64.7
Source: NSO, Labor Force Survey as cited by Ericta. 2003. Note: Details may not add up to totals due to rounding Labor force participation rates by sex The participation rates of female youth, across age groups, are substantially lower than those of male youth (see Fig. 10). Ordinarily, this would be considered a healthy sign under the assumption that many of them are in school. It is probable, however, that the lower rate is attributable to the fact that females at these ages serve as unpaid family labor. (Table 19)
Fig. 10. Youth Labor Force Participation Rate, 1997 -2002
48.5
5049.1
47.2
52.4
49.1
44454647484950515253
Labo
r F
orce
Par
ticip
atio
n R
ate
1997 1998 1999 2000 2001 2002
Source: NSO, Third Quarter Labor Force Surveys as cited in Ericta, 2003

48
Table 19. Trends of Selected Labor Force Indicators , 1997-2002
Year Indicators 1997 1998 1999 2000 2001 2002
Labor Force Participation Rate (15-24 years) 48.5 50.0 49.1 47.2 52.4 49.1 Proportion of Employed Person Ages 15-24 to Total Employed Persons 20.8 20.7 19.7 19.8 21.2 20.2
Employment Rate (15-24 years) 83.4 80.3 79.6 78.8 81.0 79.1 Proportion of Unemployed Person Ages 15-24 to Total Unemployed Persons 45.9 44.8 47.8 47.2 45.6 47.2
Unemployment Rate of Population Ages (15-24 years)
16.1 19.7 20.4 21.2 19.0 21.4
(15-19 years old) 15.5 19.6 19.6 20.1 17.4 19.9 (20-24 years old) 16.6 19.8 21.0 22.0 20.1 22.4 Source: NSO, Third Quarter Labor Force Surveys The working youth accounted for 20 percent of the total number of employed persons. On the other hand, 1.48 million or nearly half (47%) of the 3.13 million unemployed persons in the country in 2002 were youths, indicating the lack of job opportunities for the young entrants to the labor force. Unemployment rate of the youth has gradually increased for the past six years (Fig. 11).
Fig. 11. Unemployed Rate of Youth for the Past Six Years
16.6
19.821
2220.1
22.4
0
5
10
15
20
25
Rat
e
1997 1998 1999 2000 2001 2002
Survey Years
15-19 years old
20-24 years old
Source: NSO, Third Quarter Labor Force Surveys as cited in Ericta, 2003. This is a drop from the 2001 figure of 52%, the highest labor force participation rate or LFPR in five years. Young women registered a lower labor force participation rate or LFPR (38%) than young men (58.7%). This gender disparity is more pronounced in the rural areas, where young women’s LFPR was 35 percent as against young men’s LFPR of 64 percent. The October round of the Labor Force Survey (2002) shows that unemployment rates among the youth were higher in urban areas than in rural areas. Almost three in 10 urban males and more than one in 10 rural males were unemployed (Fig. 12).

49
Women Men
There is also an observed increase in youth’s participation in overseas work particularly for young females.
Fig. 12. Percentage Distribution of Youth Labor For ce Characteristic by Sex and Residence, October 2002
87.8
12.2
70.3
29.7
76.2
23.9
75.4
24.6
0
20
40
60
80
100
120
Per
cent
Rural Urban Rural Urban
Employed
Unemployed
Source: NSO, Third Quarter Labor Force Surveys as cited in Ericta, 2003. Legislation, policies and plans relevant to youth e mployment 24
(a) Constitution of 1987
The Constitution of 1987 enshrines the promotion of full employment in Section 9 of Article II. Section 18 states that “the State affirms labor as a primary social economic force” and that it (the State) “shall protect the rights of workers and promote their welfare”. Section 3 of Article XIII, Social Justice and Human Rights, also stipulates that:
The State shall afford full protection of labor, local and overseas, organized and unorganized and promote full employment and equality of employment opportunities for all ….. They shall be entitled to security of tenure, humane conditions of work and a living wage.
Section 8 of Article XIII provides for incentives to promote employment creation for farmers, farm workers and subsistence fishermen. As these categories of workers form a large proportion of the national labor forces and in particular, the youth labor force, this provision in the Constitution provides a basis for funding agricultural employment and training initiatives.
(b) Major labor legislation The basic state policy on labor is substantiated by the Labor Code of the Philippines, which states that “the State shall afford protection to labor, promote full employment, ensure equal work opportunities regardless of sex, race or creed and regulate the relations between workers and employers”. It further states that “it (the State) shall assure the rights of workers to self organization, collective bargaining, security of tenure and just and humane working conditions”.

50
Apart from the International Labor Organization (ILO) Conventions that have been ratified by the Philippines, there are four main types of domestic legislation in place that have an impact upon youth employment. They relate to:
• the minimum working age; • the protection of youth in the workplace; • the terms and conditions of employment of youth; • special rights and privileges for youth (see Table IV.10 for a list of relevant legislation,
codes and conventions).
In terms of enforcing labor standards, efforts have been made to comply with all local and international commitments, particularly in relation to labor inspections. The government continues to review the applicability and sufficiency of its legislation. In the working youth chapter of the Philippines Medium Term Youth Development Program 1999-2004 the following employment related strategies were identified for the medium term.
• Simultaneous promotion of appropriate development policies and expansion of the
demand for labor to absorb the unemployed youth; • Strengthened skills training programs and ensuring wider access by young workers; • Strict enforcement of labor laws and standards; • Promotion and protection of the rights and welfare of young women workers; • Elimination of child labor; • Promotion of the rights and welfare of youth workers who end up in contingent
employment situations; and • Reduction of migration pressures among the youth and protection of the rights of migrant
workers.
In the out-of-school youth chapter of the PMTYDP, the following employment related strategies were identified for the medium term (NYC 1999):
• Increasing the opportunities for skills training by:
� Expanding the dual training system (DTS); � Developing training and capability-building schemes tailored specifically for women to
encourage enrolment of female out-of-school youth; and � Providing training incentive packages to qualified out-of-school youth.
• Enhancing the capability of government training institutions and strengthening the participation of the private sector and local government units (LGUs) in technical and vocational education.
• Developing a labor market information system to serve as a guide for individual career decisions.
• Increasing livelihood opportunities by:
� Ensuring the effective implementation of existing regional development plans to increase employment opportunities in rural areas;
� Developing better agricultural training methods to make agriculture a more viable option to youth in rural areas;
� Providing additional/alternative livelihood opportunities to the rural youth, particularly during off-farm periods; and
� Rationalizing and expanding entrepreneurship development programs to enable more out-of-school youth to become self-employed.

51
While the PMTYDP goes a long way towards identifying the problems that exist for youth in the area of employment, it fails to elucidate how these strategies will be funded or coordinated. The devolution of many social services to the local government level was identified as one major barrier to the successful implementation of youth employment programs. Similarly, the lack of specific funding for youth employment programs in government department budgets was also highlighted as a major difficulty. These two problems present major barriers for youth and youth policy makers. Government budget allocation to youth employment Youth employment initiatives cut across many different government departments. Therefore, it is difficult to estimate the total budget allocated to youth employment in the Philippines. The Department of Labor and Employment (DOLE) is the only national government agency with a specific budget for youth employment initiatives. Other agencies have no appropriation specific to the needs of youth and must therefore finance programs from their national budgets. Government initiatives on youth employment
(a) Responsible government agencies
The main agencies involved in the provision of employment and training assistance for youth are:
(i) Department of Labor and Employment
Based on the mandate of facilitating employment of workers through maintenance of industrial peace, enforcement of labor standards and promoting the welfare of workers, the Department of Labor and Employment (DOLE) is engaged in programs that target youth by providing various capability and work-related training opportunities. Three sub-sectors are targeted: in school youth (ISY), out of school youth (OSY) and the unemployed. (ii) Department of Education, Culture and Sports The Department of Education, Culture and Sports (DECS) is mainly concerned with providing educational opportunities to in-school youth (ISY) and out of school youth (OSY) to prepare them for formal or non-formal employment. (iii) Technical Education Skills and Development Authority The Technical Education Skills Development Authority (TESDA) formulates policies to develop and implement skills development with active participation from industry groups, trade associations, employers and workers themselves.
Major TESDA programs currently being accessed by youth include:
• Technical and Vocational Education Training (TVET) for workers to address skills and employment mismatches;
• Industry-focused skills testing and certification; • Dual Training System (DTS) that is concerned with integrated in-school training
and pilot training to enable trainees to develop skills and proficiency under actual work conditions; and
• Apprenticeship Program whereby prospective trainees are enrolled by employers to undertake practical employment at the same time as gaining theoretical instruction.

52
(iv) Department of Social Welfare and Development The Department of Social Welfare and Development (DSWD) assists youth in skills development and by way of providing financial assistance. The Filipino government is committed to expanding opportunities and productivity for youth despite the fact that few agencies focus on youth employment. Lack of financial resources, however, has been the primary barrier effecting government efforts. While many industrial firms undertake their own skills development and vocational training programs and NGOs also conduct training programs for youth, a significant number of small and medium-sized enterprises depend on government agencies to provide and enhance the skills of their workforce. Other agencies that provide employment and training assistance to youth include the Department of Agriculture (DOA), the Department of Science and Technology (DOST), the Department of Trade and Industry (DTI), the Department of Interior and Local Government (DILG), the Civil Service Commission (CSC) and the National Economic Development Authority (NEDA).
(b) Capability-building programs for youth
There are currently five major capability-building programs for youth:
(i) Farm Youth Development Program
The Farm Youth Development Program (FYDP) aims to develop young farm entrepreneurs by offering both training and livelihood support. It is undertaken by the DOA and the 4-H Club of the Philippines and involves training on integrated farming, entrepreneurial and cooperative management skills training, as well as other activities including international exchange programs and demonstration farms. The livelihood support is provided through the Department of Agriculture’s National Agriculture and Fishery Council and is focused on micro-enterprise and mini-enterprise projects with credit assistance. Between 1989 and 1992, a total of 2,436 farm youth were trained and 156 micro-enterprises in 78 provinces were given financial support under this program (NYC 1998). (ii) Working Youth Centre
The Working Youth Centre (WYC) is run by the Department of Labor and Employment (DOLE). The aim of the program is to strengthen working youth organizations, to increase their level of awareness on issues and matters affecting workers and to develop their skills to equip them for employment. Between the WYC’s inception in 1985 and the first quarter of 1997, the 20 centres located in 9 regions in rural areas and less urbanized centres have served more than 41,325 young workers though livelihood projects and facilitated the functioning of 1,551 youth organizations. Other figures indicate that apprenticeship and leadership projects trained 19,830 youth nationwide and placed 14,709 of the trainees in jobs. A further 323 livelihood programs catered for 1,733 youth beneficiaries (NYC 1998).
(iii) Young Filipino Entrepreneur
The Young Filipino Entrepreneur (YFE) program is carried out by the Department of Trade and Industry (DTI). The program funds enterprise training through industry immersion and on-the-job training in Taiwan. It also provides seed funding for trainees to start small enterprises on completion of training.

53
(iv) Working Street Youth
The Working Street Youth (WSY) program is carried out by the Department of Social Welfare and Development (DSWD). This program aims to rescue working children from exploitative and hazardous occupations and to reintegrate them with their families and communities.
(v) Kabataan 2000
Through the Kabataan 2000 program, in school and out of school youth aged between 15 and 25 years can actively participate in productive and sustainable community development efforts. The provision of employment opportunities along with the enhancement of skills and preparation for employment and economic empowerment form part of the basic strategies in the Kabataan 2000 program. One of the main components of Kabataan 2000 is the President’s Youth Work Program where numerous government agencies are involved in training and skills development initiatives. The Department of Labor and Employment (DOLE), Department of Social Welfare and Development (DSWD), Public Information Agency (PIA), the Department of Tourism (DOT), Department of Health (DOH), Department of Public Works and Highways (DPWH), Department of Environment and Natural Resources (DENR), Department for Education, Culture and Sports (DECS) and Department of Agriculture (DOA) are all involved in the President’s Youth Work Program. The beneficiaries of the President’s Summer Youth Program totalled 583,684 between 1995 and 1997, with more than half of those participating in the Special Program for Employment of Students (SPES). The Weekend Youth Brigade (WYB) is another Kabataan 2000 program component, which involves the Department of Public Works and Highways (DPWH), the Department of Labor and Employment (DOLE), Department of Environment and Natural Resources (DENR) and the Department of Social Welfare and Development (DSWD). By 1998, the collection of summer youth programs implemented by various national agencies had placed 992,717 youth in various summer programs since launching the program in 1994. Despite so many placements being made, a survey of the youth group was undertaken in July 1996 found only 4 percent of youth surveyed were aware of the summer job programs.
(c) Technical education and skills training Apart from the capability building programs of the various government departments, the Technical Education Skills Development Authority (TESDA) provides direct training services with youth as one of its target groups. In 1994, TESDA provided human resources guidance services to 104,000 out of school youth and high school students. Many more were trained in livelihood skills. Some of the training courses provide training in medium-level skills such as technicians and crafts-making, with a focus on developing trade skills. There were very few agricultural training programs, despite the fact that a large number of unemployed youth originate from rural areas (Table 20).
Table 20. Graduates of TESDA Human Resources Traini ng Programs, 1993
Major course group Number of graduates
Training for government officials, specialist-interest organization, corporate executives, managers and supervisors
1,729

54
Training for professionals 5,718 Training for technicians 748 Clerical training programs 1,263 Service courses; shop and market salesmanship courses 11,697 Farming, forestry and fishing courses 1,557 Trade skills development 84,522 Operative skills 10,727 Unclassified courses 187 Not indicated 871
Total 119,019 Source: National Youth Commission. Second National Study.
Despite the above achievements, skills development programs for young workers and the out of school youth reach only a small proportion of youth. Industry still relied heavily on the government to enhance the skills and capabilities of workers, particularly among small and medium enterprises, farm enterprises and cottage industries. Many of the available skills development programs were add ons to existing youth development programs, with no specific funding made available for youth employment programs. Many of the government run programs were costly and they often turned out graduates for occupations for which there is insufficient labor market demand. This indicates a need for greater involvement of the private sector, particularly industry, to improve the match between the supply and demand of skills.
Moreover, many of the training programs did not focus on some of the most vulnerable youth sub-sectors such as young women, indigenous groups and young rural dwellers. As such, they only reached a minority of the youth labor force. In summary, while the Filipino government is committed to providing employment and training opportunities to youth, there remains a major lack of coordination between the various government agencies. There is a need for the focus of strategies to be more clearly defined and a further need for a more equitable distribution of resources.
(d) Youth unemployment initiatives in response to t he economic crisis The Philippine labor market suffered a slump in 1998 after the twin effects of El Nino and the financial crisis on the national economy. The agricultural, construction, manufacturing and financial sectors were the most adversely affected. Although the labor force grew at 2.3 percent in 1998 to reach 31.05 million, total employment registered a new zero growth rate of 0.7 percent. The official unemployment rate reached a two digit level of 10.1 percent, whereas it had been declining in the previous years. Youth in the 15 to 24 year age group suffered greatly as a result of the struggling economy, with unemployment among this age group increasing to 21.2 percent in 1998, up 3.1 percent from 1997 figures.
Closure, retrenchment and lay-offs occurred mostly in the National Capital Region (NCR) that posted 58.7 percent of all reported establishment closures and retrenchment in the country. Most of these establishments were engaged in manufacturing and wholesale and retail trade. Micro-establishments with less than 20 workers were most affected and one third of the displaced workers were those with either elementary level education or vocational graduates.

55
Child Labor
Child labor in the Philippines refers to work among individuals less than 15 years of age, who labor for persons other than their parents or guardians, to the detriment of their normal development. It also encompasses work of minors between the ages of 15 to 17 years in hazardous ventures, where employees under the age of 18 years shall be registered and shall not performed night work and other specified tasks, for example, work with radiation, poisons, heavy machinery or in mines25.
In 1993, Republic Act 7658 was enacted to amend Section 12, Article VII of the Republic Act 7610. This amendment still allows the employment of children under the age of 15 years. However it provides strict conditions under which children may be employed. Specifically, it limits hiring of children below 15 years of age to activities that are directly under the sole responsibility of their parents or legal guardians and where other family members are employed; and to cinema, theatre, radio and television where their participation is essential. It also states that the work performed by children should neither endanger their lives, safety, health and morals, nor provide the children with the prescribed primary and secondary education26.
Child labor is one of the many concerns in the Philippines and, most disturbingly, one of the most rampant problems we face. In the endeavor to create an awareness of an already existing law that is evidently not properly implemented, child labor clearly falls within this category. Every child has the right to the most basic of necessities in life like a healthy environment, formal education and most importantly, a loving family to come home to. Yet, poverty hinders the child to any of these things and forces labor in farming fields, mining shafts and peddling in the busy and dangerous streets of the country27. (See Table 21)
Child labor… - Refers to any work performed by a child that subjects the child to economic
exploitation, or that is likely to be hazardous for the child or that interferes with the child’s education, or that is harmful to the child’s health or physical, mental, spiritual, moral, or social development.
- Is when children are compelled to work on a regular basis?
- Refers to work where children are separated from their families.
- Refers to work where children are forced to lead prematurely adult lives.

56
Table 21. Difference Between Child Work and Child L abor
Child Work
Child Labor
� Work is appropriate to child’s age and mental capabilities
� Work burdens the child; too heavy for child’s age and capabilities
� Supervised by responsible and caring adults � Child work unsupervised or supervised by abusive adults
� Limited hours of work, does not hinder the child from going to school, playing or resting
� Very long hours of work, child has limited or no time for school, play or rest
� Workplace is kept safe and child-friendly, does not pose hazards to health and life of the child
� Workplace poses hazard to child’s health and life
� Child’s physical, emotional and mental well-being are nourished even in the work environment
� Child is subjected to psychological, verbal, or physical/sexual abuse
� Child works voluntarily to participate in the family responsibility of maintaining the household, developing the family enterprise, augment family income, or even as main family income earner
� Child is forced by circumstances or by coercive individuals to work
� Child is justly compensated materially and psychologically
� Limited or no positive rewards for the child
� Child's work is regulated by law or governed by family/community norms and values
� Child’s work is excluded from legislation, social security and benefits
� Child work serves as vehicle for social advancement and improvement in child’s quality of life
� Child’s work is utilized for exploitative, subversive or clandestine operations, or disguised illegal activities
Source: The Child Labor Situation in the Philippines

57
2001 NSO Survey on Working Children 28 One out of six children works...(See Fig. 17)
� Four million (16.2%) of 24.8 million children 5-17 years old were economically active. This percentage was slightly higher than the proportion (16% or 3.6 million) of economically active children that was reported in 1995.
� The highest percentage of working children came from Southern Tagalog (11.5%), followed by Central Visayas (9.7%) and Eastern Visayas (8.7%).
� The working children were composed of children aged 10-14 years old (1.9 million or 48%) and 15-17 years old (1.8 million or 46%). The median age was 10 years old.
� There were more male working children (2.5 million or 63.4%) than female working children (1.5 million or 36.6%); seven out of every ten working children resided in the rural areas.
Fig. 13. Percentage of Working Children, by Region, October 2001
4.2
1.6
3.9
5
6.5
11.5
8.68.2
9.7
8.7
4.1
7.1
8.5
5.8
4.4
2.1
0
2
4
6
8
10
12
14
NCRCAR I II III IV V VI
VIIVIII IX X XI
XIIXIII
ARMM
Source: NSO Survey, 2001
� More than fifty percent of the working children (2.1 million or 53%) were engaged in agriculture, hunting and forestry. Notable percentage could also be found in wholesale and retail, repair of motor vehicles and personal and household goods (18.6%), in private households with employed persons (5.7%), fishing (5.2%) and manufacturing (4.6%). (See Fig. 14)
� Most of the working children were unpaid workers in their own household operated farm or business (59%). However, one fifth were found to be working in private establishments and about 9 percent worked in private households.
� Three out of every five working children did not receive any payment. If others got paid, it was on a daily basis (578 thousand or 14.4%) or monthly basis (6.3%), per task or “pakyaw” basis (3.8%).
� Of the 4 million working children 5-17 years old, 25.1 percent worked in the evening or during night time. The proportion of working children working during night time in the urban areas (39%) was greater than that in the rural areas (19%); more males than females.

58
Fig. 14. Number of Working Children 5-17 Years Old. By Type of Business/Industry,
October 2001
Source: NSO Survey, 2001
Fig. 15. Venn Diagram of Number of Working Children 5-17 Years Old in Hazardous Environment, October 2001
Source: NSO Survey, 2001

59
Exposure to hazardous environment 29
The harsh conditions of the childrens’ workplace lead to health and psychological effects, including communicable diseases, malnutrition, injuries, accidents and antisocial behavior. (See Fig. 15)
Most work related problems are lack of clean water supply, prolonged working time of as much as 10 hours (in 42% of those surveyed), unsanitary and hazardous work environment and low salaries. Another major problem is bonded labor. It is any form of focused employment (usually being kept a prisoner within the workplace until one’s debt is paid off) resulting from the pressure to repay debt incurred by the child worker from an employer, often through an illegal recruitment system.
Sixty percent of working children were exposed to h azardous environment… 30
� About 2.4 million were exposed to hazardous environment. Of those exposed, seven out of ten were males. The proportion of rural working children exposed to physical/chemical/biological hazards (62%) was higher than their urban counterparts (52%).
� Among the hazardous environment, hazards the physical environment was the most common. Around 1.1 million (44.4%) were exposed to physical hazards only, 382 thousand (16%) were in danger of physical and chemical hazards and another 352 thousand (14.7%) were in physical and biologically hazardous working places. Around 237 thousand (9.9%) were exposed to the three forms of hazardous environment.
� Out of the 2.4 million working children exposed to hazardous environment, about 2 million (85.1%) were exposed to physical hazards such as temperature or humidity (1.4 million), slip/trip fall hazards (345 thousand), noise (316 thousand), radiation/ultraviolet/microwave (178 thousand), pressure (110 thousand), etc. Children in agriculture, hunting and forestry (65%) were greatly exposed to physical hazards.
� One out of every five working children (833 thousand) were exposed to chemical elements; dust which include silica and saw dust, among others, were the most common affecting 542 thousand working children, followed by mist/fumes (261 thousand).
� Almost one in every five working children (or 0.8 million) was in danger of biological infections, such as fungal (429 thousand), bacterial (419 thousand), parasitic (186 thousand) and viral (158 thousand).
� More than 2.4 million working children used tools/equipment in their work; about 683 thousand working children (or 35.3%) using tools/equipment is provided with safety/protective device/equipment.
� The number of children who experienced any injuries while at work was estimated at 23.4 percent (or 942 thousand). Of this, about 60 percent suffered cuts, 46 percent got wounds and/or punctures and 22 percent had contusions, bruises, hematoma and abrasion.

60
Some Causes of
Child Labour
• Poverty
• Parent’s attitude and traditions / other psycho-social factors
• Lack of access to quality education and facilities
PUSH factorPUSH factor
• Easy exploitation of children
• Product demand and seasonality
• Lack of law enforcement
PULL factorPULL factor
Fig. 16. Percentage of Working Children 5-17 Years Old, By School-Related Problems Encountered, October 2001
Source: NSO Survey, 2001
One third of working children did not attend school …
� Seven in every ten working children (65.9% or 2.6 million) attended school.
� 1.2 million or 44.8 percent of those who attended school encountered problems including difficulty in catching up with the lesson (23.4%), high cost of school supplies/books/transportation (21.5%), far distance of the school from residence (18%), unsupportive teachers (3.6%) and lack of time to study (2.9%).
� Two in every five working children stopped/dropped out of school. The ratio of male working children to female working children in terms of dropouts was 2:1. Reasons given for dropping out of school include loss of interest (31.4% or 461 thousand) and high cost of schooling (28.3%). (See Fig. 16)
Fig. 17. Causes of Child Labor

61
Education for Reducing Child Labor 31
Increasing access to education is an effective means to reduce child labor and to improve the overall economic and social livelihood of families and communities. While many initiatives to reduce child labor are already underway across Asia, there is considerably more that could be done to explicitly integrate education interventions into such programming. Traditional education services often do not reach child laborers who live in rural areas and/or follow incompatible work schedules. Even the formal school systems in many areas are ill equipped to meet the most basic learning objectives. Fortunately, technology now exists to bring effective instruction to children at times when they can use it. This brief overview addresses education and dissemination strategies. Effective and appropriate educational strategies to reduce child labor include services targeted at child laborers, their parents and the community as a whole. Child laborers. The provision of non-formal, nontraditional educational alternatives for child laborers is critical to a population that faces numerous barriers to formal education. Non-formal education available close to home and adjusted to meet child laborers’ daily or seasonal work schedules will make it easier for these students to increase their knowledge and develop practical livelihood skills. This learning can not only open up new opportunities for the future, it will also increase the likelihood that these children will successfully reintegrate into the formal educational system. Parents. Poor families are more likely to send their children to work rather than school because the need for children to contribute to household income or assist with the family business is seen as more important than the benefits to be derived from their regular school attendance. Educating and training parents on the hazards associated with child labor and on the possibilities for alternative livelihoods is key to reducing child labor as well. Parents who receive appropriate vocational training not only become more supportive of children’s education, they also acquire marketable skills that make them less reliant on the economic contributions of their children to the household income. Communities. Educating communities about the detrimental long-term effects of child labor is critical. Community outreach and public awareness campaigns can mobilize communities to reduce or prevent child labor by establishing and strengthening partnerships, leveraging resources with community organizations, pressuring employers to not hire children and providing needed support to children and families.

62
References 18 National Economic and Development Authority (NEDA). 2005. Education Sector, Philippine Medium Term Development Plan (MTPDP) 2004-2010. Retrieved from http://www.neda.gov.ph/ads/mtpdp/MTPDP 2004-2010/PDF/MTPDP%202004-2010%20NEDA_Chapterx18_Education.pdf ,last accessed 16 June 2006 19 Nick Clark. 2004. Education in the Philippines. Retrieved from http://www.wes.org/ewenr/04Nov/Practical.htm, last accessed 29 June 2007. 20 United Nations Economic and Social Commission for Asia and the Pacific (UNESCAP). 2000. Youth in the Philippines: A Review of the Youth Situation and National Policies and Programs. New York. pp. 18. Retrieved from http://www.unescap.org/esid/hds/youth/youth_philippines.pdf, last accessed 27 June 2007. 21 NEDA. 2005, loc. cit. 22 Ibid. 23 Commission on Population, Philippines (POPCOM). 2003. State of the Philippine Population Report, 2nd ed. Retrieved from http://www.popcom.gov.ph/sppr/sppr02/chap02a.html 4 July 2006 24 UNESCAP. 2000, loc. cit. 25 Institute for Labor Studies (ILS). 1996. Monograph Series No.: Effects of Globalization on Child Work in Selected Philippine Industries. Retrieved from http://www.ilsdole.gov.ph/Publication/Monograph/monograph_5.htm and http://www.flickr.com/photos/2rokbotoy/95800304/, last accessed 29 June 2007. 26 Bureau of Women and Young Workers, Department of Labor and Employment (BWYW-DOLE). 2002. The Child Labor Situation in the Philippines. Retrieved from http://www.bwyw.dole.gov.ph/CL%20Situation.htm#_Difference_Between_Child, last accessed 19 June 2006. DEAD LINK 27 Ibid. 28 Ibid. 29 ILS, loc. cit. 30 BWYW-DOLE. 2002, loc. cit. 31 Allen, Robert andrew Kerr, Christine Obester. 2004. Pacific Resources for Education and Learning. Reducing Child Labor Through Education: Innovative Uses of Technology. In Research Into Practice. Hawaii. Retrieved from http://www.prel.org/products/pr_/compendium04/AllenKerrObester.htm, last accessed 29 June 2007.