Embed Size (px)
Citation preview

Chapter 3: External Analysis:
Industry Structure, Competitive Forces, and Strategic Groups

Copyright © 2017 by McGraw-Hill Education. This is proprietary material solely for authorized instructor use. Not authorized for sale or distribution in any manner. This document may not be copied, scanned, duplicated, forwarded, distributed, or posted on a website, in whole or part.
Chapter Case 3:Tesla Motors and the U.S. Automobile Industry

Copyright © 2017 by McGraw-Hill Education. This is proprietary material solely for authorized instructor use. Not authorized for sale or distribution in any manner. This document may not be copied, scanned, duplicated, forwarded, distributed, or posted on a website, in whole or part.
Chapter Case 3: Tesla Motors and the U.S. Automobile Industry
• GM, Ford, and Chrysler – “The Big Three”
– Ruled the U.S. car market for the 20th century
– Protected by high entry barriers
• 1980’s: foreign entrants intensified competition
– U.S. Congress passed import restrictions.
• No new car manufacturers have emerged.
– Cars are complex to build.
– Large scale production is necessary
to be cost competitive.
3

Copyright © 2017 by McGraw-Hill Education. This is proprietary material solely for authorized instructor use. Not authorized for sale or distribution in any manner. This document may not be copied, scanned, duplicated, forwarded, distributed, or posted on a website, in whole or part.
Chapter Case 3: Tesla Motors and the U.S. Automobile Industry
• Elon Musk
– Designed early version of Google maps & PayPal
– Sale of these was $2B
• Enabled him to pursue his passions
• One of his largest ventures: Tesla Motors
– Produces electric cars with small motors
– Sold 2,500 Roadster Sports Coupes ($110,000 each)
– Model S: $71,000 but also eligible for tax credits
• Appeals to larger market
• 2013 Motor Trend Car of the Year
• Highest score of any car: Consumer Reports

Copyright © 2017 by McGraw-Hill Education. This is proprietary material solely for authorized instructor use. Not authorized for sale or distribution in any manner. This document may not be copied, scanned, duplicated, forwarded, distributed, or posted on a website, in whole or part.
Chapter Case 3: Tesla Motors and the U.S. Automobile Industry
• Tesla Motors:
– Successfully entered U.S. automotive market
– Uses innovative new technology
• Future success will depend on industry forces
– Lowered profit potential
– Reduced economic attractiveness
• Other non-traditional competitors
– Google and Apple
5

Copyright © 2017 by McGraw-Hill Education. This is proprietary material solely for authorized instructor use. Not authorized for sale or distribution in any manner. This document may not be copied, scanned, duplicated, forwarded, distributed, or posted on a website, in whole or part.
Chapter Case 3: Tesla Motors and the U.S. Automobile Industry
• Factor 1: price for crude oil dropped steeply
• Factor 2: tax credits for alternative vehicles being
phased out
• Factor 3: Lithium-ion battery packs
– Are in short supply
– Are very expensive
– Tesla initiating a lithium-ion battery production facility
• Why do you think that Tesla’s market capitalization
is roughly 50% of General Motors, while
GM’s revenues are more than 50 times
larger than Tesla?

Copyright © 2017 by McGraw-Hill Education. This is proprietary material solely for authorized instructor use. Not authorized for sale or distribution in any manner. This document may not be copied, scanned, duplicated, forwarded, distributed, or posted on a website, in whole or part.
The Firm within Its External Environment, Industry, and Strategic Group, Subject to PESTEL Factors
7
Exhibit 3.1

PESTEL Framework
• Political➢ Government pressures
➢ Subsidies and incentives
➢ Lobbying
➢ Differences in countries, states,
and regions
• Economic➢ Growth rates
➢ Interest rates
➢ Employment levels
➢ Currency exchange
• Sociocultural➢ Norms, culture, values
➢ Demographics
➢ Lifestyle changes❖ Subway, Whole Foods benefit
• Technological➢ Innovation in products
and processes
➢ Diffusion
➢ Research & development
• Ecological➢ Global warming
➢ Sustainability
➢ Pollution (e.g., BP's oil spill)
• Legal➢ Court system
➢ Legislation
➢ Hiring laws
➢ (De-)regulation

Copyright © 2017 by McGraw-Hill Education. This is proprietary material solely for authorized instructor use. Not authorized for sale or distribution in any manner. This document may not be copied, scanned, duplicated, forwarded, distributed, or posted on a website, in whole or part.
Blackberry’s Decline
• Blackberry
– Pioneer in smartphones
– Increased productivity
– A status symbol
• Market capitalization of Blackberry:
– In 2008: $75 Billion; In 2015: $8 Billion
• Consider two PESTEL factors, sociocultural and
technological. Explain how each of these
environmental factors contributed to the erosion
of Blackberry’s undisputed dominance in
the early 2000s in cell phones.
9

Copyright © 2017 by McGraw-Hill Education. This is proprietary material solely for authorized instructor use. Not authorized for sale or distribution in any manner. This document may not be copied, scanned, duplicated, forwarded, distributed, or posted on a website, in whole or part.
Blackberry’s Decline
• Lacked awareness of Sociocultural Factors
– People began to use their own phones at work for
communication.
– IT departments had to incorporate other devices.
• Lacked awareness of Technological Factors
– Apple’s release in ‘07 included a camera, touch-
screen, and had Wi-Fi.
– Was dismissed as a toy with
low security features

Industry Structures along the Continuum

Efficient Markets
• The efficient market hypothesis, in financial markets,
is one in which prices reflect information instantaneously
and one in which extra-ordinary profit opportunities are
thus rapidly dissipated by the action of profit-seeking
individuals in the market.
• How well does the efficient market hypothesis for capital
markets apply to product markets?
➢ If the efficient market hypothesis applied fully to product markets
then we should see over time equalization in risk-adjusted rates
of return across industries.
➢ What do the data support?

13© 2005 Mara Lederman, Rotman School of Management
0
10
20
30
40
50
60
70
80
90
100
2%
4%
6%
8%
10
%
12
%
14
%
16
%
18
%
20
%
22
%
24
%
26
%
28
%
30
%
32
%
Average Return on Equity in US Industries, 1982-1993
Number
of
Industries
First Quartile
Average
22.2%
Fourth Quartile
Average
9.3%
Note: Return on Equity = Net Income / Year End Shareholders’ Equity; Analysis based on sample of 593 industries
Source: Silverman 2000
Average = 14.7%
Median = 13.8%
11.7
%
13.8
%
16.5
%
Return on Equity (Percent)
Differences in Profitability Across Industries

14
Some Industries Are More Profitable Than Others
ROE & ROA - Selected Industries, 1989
0%
5%
10%
15%
20%
25%
30%
Pharmaceuticals Tires / Rubber Home Appliances
ROE
ROA
© 2005 Mara Lederman, Rotman School of Management
Differences in Profitability Across Selected Industries
-5 0 5 10 15 20 25
Scheduled air transport
Cable television service
Engineering services
Race track operations
Drug stores
Dental equipment
Semiconductors
Pharmaceuticals
Operating income / assets, 1988-95 (%)
Source: Pankaj Ghemawat and Jan W. Rivkin, “Creating Competitive Advantage”

15
Within Industries, Some Competitors Perform Better than Others.
ROE - Pharmaceutical Industry 1989
0%
10%
20%
30%
40%
50%
60%
Amgen AMP Eli Lilly Merck Mylan Pfizer
© 2005 Mara Lederman, Rotman School of Management
Differences in Profitability Within Selected Industries
Semiconductor Industry
-5 0 5 10 15 20 25
National Semiconductor
Analog Devices
AMD
Motorola
Texas Instruments
Intel
Operating income / assets, 1988-95 (%)
Source: Pankaj Ghemawat and Jan W. Rivkin, “Creating Competitive Advantage”

165-22Copyright © 2005 by The McGraw-Hill Companies, Inc. All rights reserved.
The U.S. Auto Industry’s Profit Pool
Exhibit 5.7 The U.S. Auto Industry’s Profit Pool
Source: Adapted by permission of Harvard Business Review. Exhibit from “A Fresh Look at Strategy” by O. Gadiesh
and J. L. Gilbert, Harvard Business Review 76, no. 3 (1998), pp. 139-48. Copyright © 1998 by the Harvard Business
School Publishing Corporation, all rights reserved.

17© 2005 Mara Lederman, Rotman School of Management
Decomposition of Variance in Profitability
Year
2% Industry
18%
Corporate
parent
4%
Business
segment
30%
Transient
46%
Source: Anita M. McGahan and Michael E. Porter, “How Much Does Industry Matter Really?” Strategic Management Journal, 1997

18
Three Factors Determining Company Performance
• Industry Context
➢ e.g., during the last t decades, companies in the airlines industry have been persistently less profitable than those in the pharmaceutical industry
• National Context
➢ e.g., world’s most successful consumer electronics firms are in Japan
• Company Capabilities and Strategies
➢ e.g., Wal-mart and Southwest Airlines

19
Structure-Conduct-PerformanceStructure-Conduct-Performance
Industry Structure• Number of buyers
and sellers• Degree of product
differentiation• Barriers to entry• Cost structures• Vertical integration• Alliances
Industry Structure• Number of buyers
and sellers• Degree of product
differentiation• Barriers to entry• Cost structures• Vertical integration• Alliances
Firm Conduct• Pricing • Advertising• R&D• Investment inplant andequipment
Firm Conduct• Pricing • Advertising• R&D• Investment inplant andequipment
Performance• Econ profits• Accountingprofits (ratios)
• NPV/DCF
• MVA/EVA• Tobin’s Q
Performance• Econ profits• Accountingprofits (ratios)
• NPV/DCF
• MVA/EVA• Tobin’s Q

20Clarke Modifications of Baye Chapter 7 4
The Structure-Conduct-Performance Paradigm
• The Causal ViewMarket
StructureConduct Performance
The Feedback Critique◼ No one-way causal link.
◼ Conduct can affect market structure.
◼ Market performance can affect conduct as well as market structure.
Copyright © 2017 by McGraw-Hill Education. This is proprietary material solely for authorized instructor use. Not authorized for sale or distribution in any manner. This document may not be copied, scanned, duplicated, forwarded, distributed, or posted on a website, in whole or part.
Industry Structure and Firm Strategy: The Five Forces Model
21

Copyright © 2017 by McGraw-Hill Education. This is proprietary material solely for authorized instructor use. Not authorized for sale or distribution in any manner. This document may not be copied, scanned, duplicated, forwarded, distributed, or posted on a website, in whole or part.
The Five Forces Model
The following five forces determine the profit potential of an
industry and shape a firm’s competitive strategy:
SOURCE: Michael E. Porter, “The five competitive forces that shape strategy,” Harvard Business
Review, January 2008.
Exhibit 3.2

Competitive Forces and Firm Strategy
• The Five Forces Model
➢ The classic industry analysis model --- designed to explain
variance in industry-level performance.
• Threat of Entry/Barriers to Entry
➢ Note: High barriers to entry means threat of new entry is low
• Power of Suppliers
• Power of Buyers
• Threat of Substitutes
• Rivalry Among Existing Competitors

Barriers To Entry
• The free entry and free exit assumption that works
reasonably well for describing financial markets seems
to be a premise that strays so far from our world of
experience that the assumption impedes our
understanding of real-world product competition.
• Thus, empirical evidence suggests
that (risk-adjusted) ROE does
NOT equalize in the long run.

A Taxonomy of Barriers to Entry
• (1) Economies of scale
➢ Product-specific economies of scale
❖ Lower setup costs as a percentage of total costs
❖ More specialized machinery and tooling (e.g., Honda)
➢ Plant-specific economies of scale
❖ Engineers’ 2/3 rule: Since the area of a sphere or cylinder varies as
two-thirds power of volume, the cost of constructing process industry
plants can be expected to rise as two thirds power of their output
capacity. (This rule applies to petroleum refining, cement making,
iron ore reduction and steel conversion).
❖ “Economies of massed reserves” – fewer backup machines needed

A Taxonomy of Barriers to Entry
• Economies of scale
➢Multi-product economies of scale
(“economies of scope”)
❖ Example: Cost (Iron, Steel) < Cost (Iron) + Cost (Steel)
❖ Key idea: Shareable input (In this case, thermal
economies in the production of iron and steel)
❖ Modern examples: Aircraft, Automobiles,
Consumer electronics, Household Appliances;
Personal Computers, Software, Power Tools
➢Multi-plant economies of scale
❖ Economies of multi-plant production, investment, and
physical distribution.
27
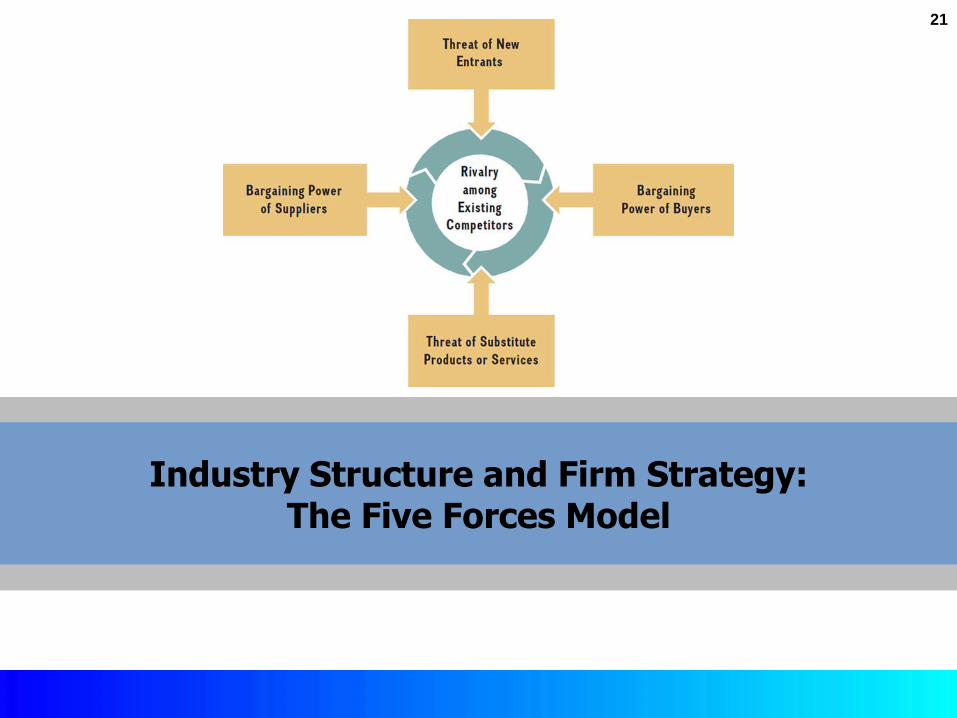
Examples of Economies of Scope
• Aircraft: Common wing, nose, and tail components allow several models to be leveraged using different numbers of fuselage modules to create aircraft of different lengths and passenger capacities by Boeing and Airbus Industries.
• Automobiles: For example, the Honda Civic and the Honda CR-V share the same platform.
• Consumer Electronics: Over 160 variations of the early Sony Walkman were leveraged by “mixing and matching” modular components in a few basic system designs. (“Legos”)

A Taxonomy of Barriers to Entry
• (2) Experience curve advantages
➢Marvin Lieberman, a management professor at UCLA, found that in the chemical industry, on average, each doubling of plant scale over time was accomplished by an 11% reduction in unit costs. Thus, there is an “89% learning curve.”
❖ (Note: The mere presence of an experience curve does not insure an entry barrier. Another critical prerequisite is that the experience be kept proprietary, and not be made available to competitors and potential entrants.)

A Taxonomy of Barriers to Entry
• (3) Intended excess capacity (to discourage entry by other firms)
➢ Building extra capacity for the intended
purpose of deterring entrants from
entering the industry.
(Note: potential free-rider problems)
➢ Excess capacity deters entry by increasing the credibility of price cutting as an entry response by incumbents (e.g., Dupont in the production of Titanium Dioxide for paint)
❖“Innocent” excess capacity: Demand is cyclical; Demand falls short of expectations; Demand is expected to grow.

A Taxonomy of Barriers to Entry
• (4) Reputation (for cutting prices when other firms enter)
➢ A history of incumbent firms reacting aggressively to entrants may play a role in current market interactions.
• (5) Product differentiation
➢ Brand identification and customer loyalty to incumbent products may be a barrier to potential entrants (e.g., Coca-Cola). Product differentiation appears to be an important entry barrier in the market for over-the counter drugs and in the brewing industry.

A Taxonomy of Barriers to Entry
• (6) Capital requirements
• (7) High switching costs
of buyers
➢ For example, changing may
require employee retraining
(e.g., computer software).

A Taxonomy of Barriers To Entry
(8) Access to distribution channels
➢ The manufacturer of a new food product,
for example, must persuade the retailer to
give it space on the fiercely competitive
supermarket shelf via promises of
promotion, and intense selling efforts to
retailers.
(9) Favorable access to raw materials
and to markets
❖ Alcoa --> bauxite
❖ Exclusive dealing arrangements
❖ Favorable geographic locations

A Taxonomy of Barriers To Entry
• (10) Proprietary technology
➢ Product know how
➢ Low cost product design
➢ Patents (and other government restrictions)
• (11) Exit barriers (of incumbents) can be entry barriers (to potential entrants)

A Taxonomy of Barriers To Entry
• High exit costs:
➢High exogenous and endogenous sunk costs (not just high fixed costs!)
➢High asset specificity
➢Highly illiquid assets
➢ Low salvage value if exit occurs
➢High switching costs
➢ Low mobility of assets
➢Credible commitments
➢ Irreversible investmente.g., Alaskan pipeline built in 1977 at
a cost of $10 billion

Power of Suppliers – HIGH IF:
• Dominated by a few
companies
• No substitutes for supplier
products
• Suppliers products are
differentiated
• Incumbents face high
switching costs
• Product is important input
to buyer
• Forward Integration is a
credible threat
Suppliers exert power in
the industry by:
threatening to raise
prices or to reduce
quality.
Powerful suppliers can
squeeze industry
profitability.

Power of Buyers – HIGH IF:
• A few large buyers
(potential collusion)
• Large buyers relative to a seller
(e.g., HMO power buying
pharmaceuticals)
• Products are standardized and
undifferentiated
• Buyers face few switching costs
• High switching costs for sellers
• Backward Integration is credible
(buyer has full information)
Buyers compete with the
supplying industry by:
Bargaining down prices
Forcing higher quality
Playing firms off of each
other
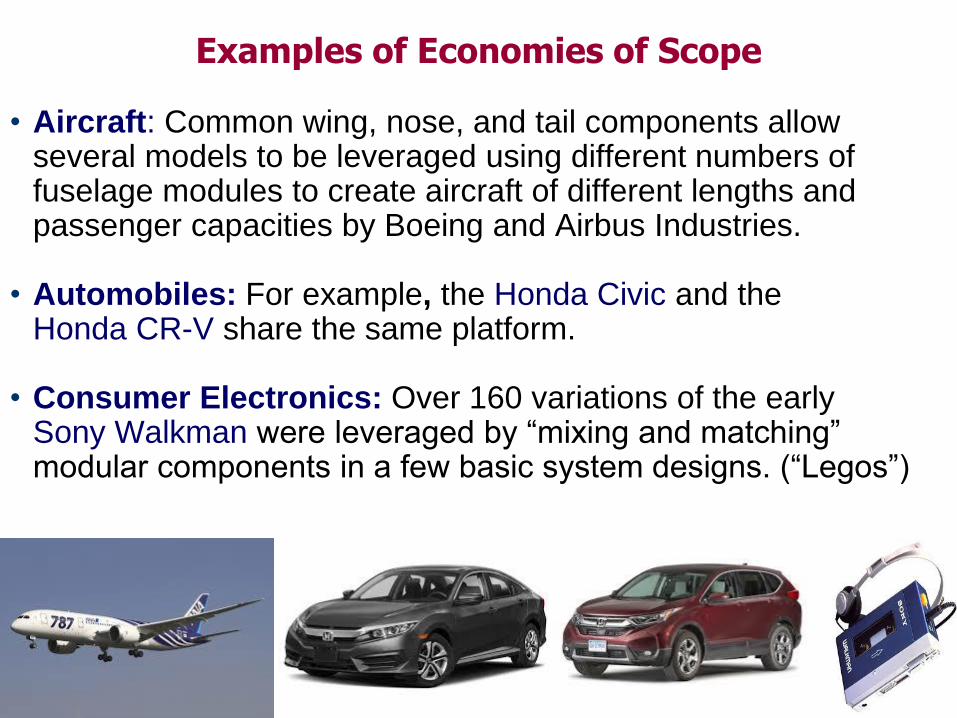
Threat of Substitutes – HIGH IF:
• Substitute is good price-
performance trade-off
• Buyers switching costs to
substitute is low
Products with
similar
functions limit
the prices
firms can
charge

Incumbent Rivalry– HIGH IF:
• Many competitors in the industry
(industry concentration is low)
• Firms are of equal size
• Industry growth is slow or shrinking
(over-capacity is high)
• Exit barriers are high➢ Contractual obligations
➢ Geographic or historical attachments
• Products and services are direct substitutes
(product differentiation is low)

Degree of Rivalry
• Advertising battles, on the
other hand, may well expand
or enhance the level of product
differentiation in the industry
for the benefit of all firms.
• In other words, advertising is
not necessarily a “zero-sum”
game. It can be a "positive sum"
game

Copyright © 2017 by McGraw-Hill Education. This is proprietary material solely for authorized instructor use. Not authorized for sale or distribution in any manner. This document may not be copied, scanned, duplicated, forwarded, distributed, or posted on a website, in whole or part.
Porter’s 5 Forces Analysis
Five Forces in the Airline Industry
• Barriers to entry: low (Threat of entry: high)
– Example: Virgin America entered in 2007
• Power of suppliers: high
– Providers are highly specialized (e.g., Pratt & Whitney)
• Power of buyers: high
– Switching costs are low.
– Large corporate contracts
40
Copyright © 2017 by McGraw-Hill Education. This is proprietary material solely for authorized instructor use. Not authorized for sale or distribution in any manner. This document may not be copied, scanned, duplicated, forwarded, distributed, or posted on a website, in whole or part.
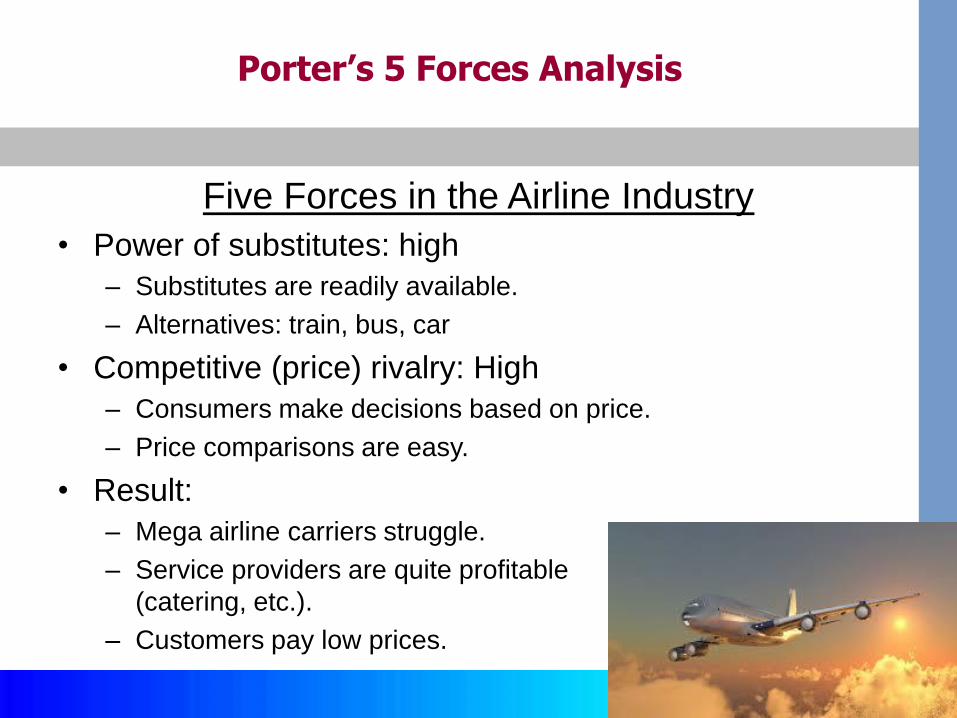
Porter’s 5 Forces Analysis
Five Forces in the Airline Industry
• Power of substitutes: high
– Substitutes are readily available.
– Alternatives: train, bus, car
• Competitive (price) rivalry: High
– Consumers make decisions based on price.
– Price comparisons are easy.
• Result:
– Mega airline carriers struggle.
– Service providers are quite profitable
(catering, etc.).
– Customers pay low prices.

Copyright © 2017 by McGraw-Hill Education. This is proprietary material solely for authorized instructor use. Not authorized for sale or distribution in any manner. This document may not be copied, scanned, duplicated, forwarded, distributed, or posted on a website, in whole or part.
Changes over Time: Industry Dynamics
42

Industries Evolve over Time as the Relationships Between the Five Forces Change
• Dynamic 5-Forces Analysis
time
dem
and

44

Substitutes and Complements
• Substitute: An alternative from outside the given industry for
its product or service. When its performance increases or its
price falls, industry demand decreases.
➢ Plastic vs. aluminium containers
➢ Video conference vs. business travel
• Complement: A product or service or competency that adds
value to original product. When its performance increases or
its price falls, industry demand increases.➢ Google complements Samsung’s smartphones when it comes with
Google’s Android System.
• Complementor: If customers value your product
more when combined with another firm’s product
or service.➢ Michelin tires for Ford & GM cars 3–45

A Sixth Force -- Complementors
• The biggest benefit of considering complementors is that they add a cooperative dimension to Porter’s (1980) “competitive forces” model.
• “Thinking [about] complements is a different way of thinking about business. It’s about finding ways to make the pie bigger rather than fighting with competitors over a fixed pie. To benefit from this insight, think about how to expand the pie by developing new complements or making existing complements more affordable.”
• Brandenburger and Nalebuff
Copyright © 2017 by McGraw-Hill Education. This is proprietary material solely for authorized instructor use. Not authorized for sale or distribution in any manner. This document may not be copied, scanned, duplicated, forwarded, distributed, or posted on a website, in whole or part.
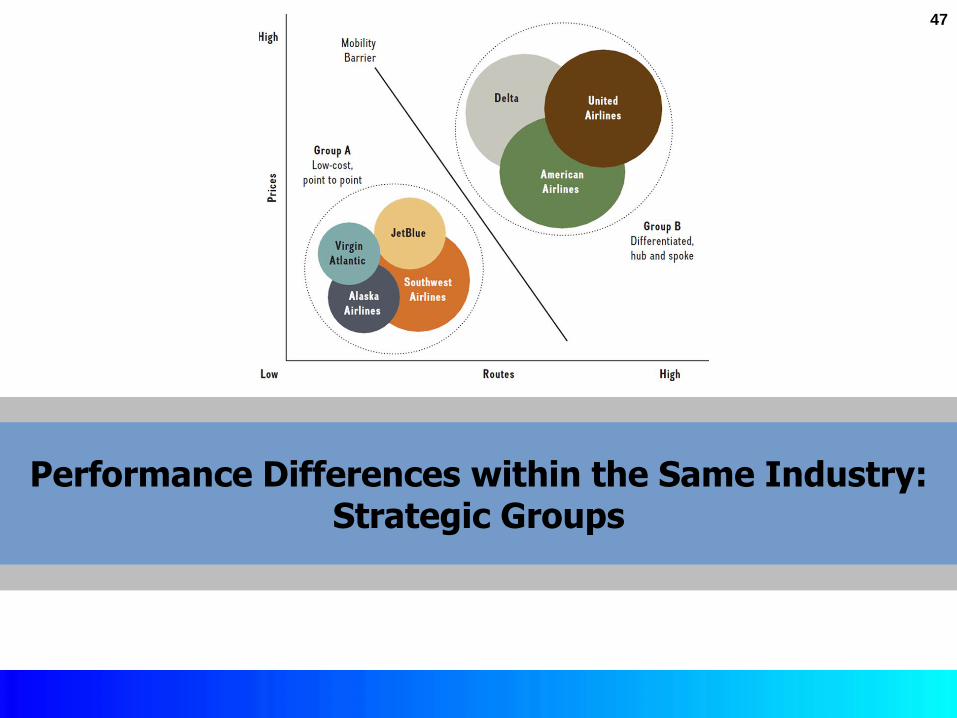
Performance Differences within the Same Industry: Strategic Groups
47

Strategic Groups
• Mobility Barrier Dimensions To Consider:
➢ Specialization
❖Width of product line
❖Target customer segments
❖Geographic markets served
➢Brand Identification
❖Advertising
❖Sales Force
➢Technological Leadership
❖First Mover vs. Imitation Strategy
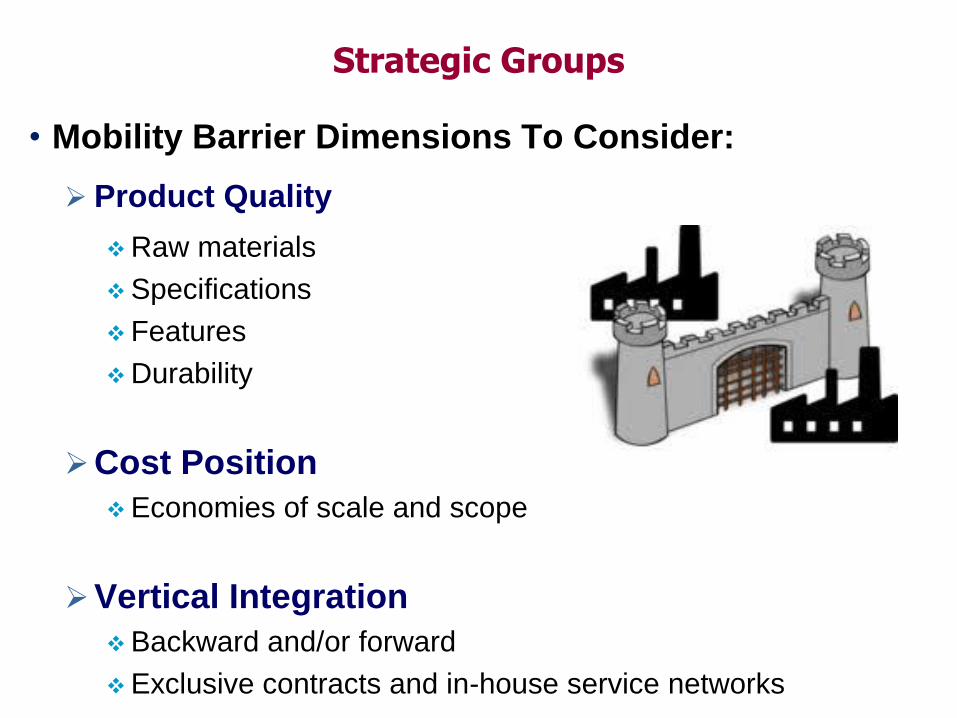
Strategic Groups
• Mobility Barrier Dimensions To Consider:
➢ Product Quality
❖Raw materials
❖Specifications
❖Features
❖Durability
➢Cost Position
❖Economies of scale and scope
➢Vertical Integration
❖Backward and/or forward
❖Exclusive contracts and in-house service networks

Copyright © 2017 by McGraw-Hill Education. This is proprietary material solely for authorized instructor use. Not authorized for sale or distribution in any manner. This document may not be copied, scanned, duplicated, forwarded, distributed, or posted on a website, in whole or part.
Example of Strategic Groups:The Airline Industry
50
Exhibit 3.5

Empirical Testing of Structure-Conduct (Strategy)-Performance
• ROE(j) = 14.7 + .050 CR4(j) + .119 [CAP/S](j) +(2.08) (1.98)
1.30 [A/S](j) +1.40 [R&D/S](j) +0.26 [GROW](j)
(7.20) (2.95) (2.90)
t-statistics in parentheses R-squared = .43
CR4 = 4-firm concentration ROE = return on equity
R&D/S = R&D/Sales A/S = advertising/sales
CAP/S = capital expenditures/Sales GROW = demand growth

Empirical Testing of Structure-Conduct (Strategy)-Performance
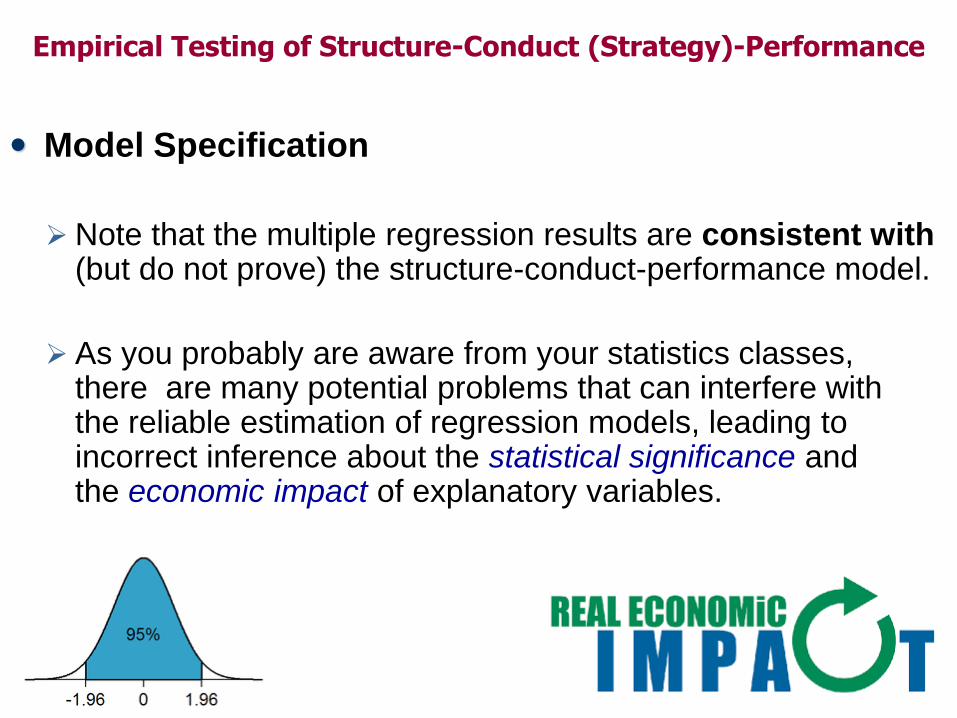
• Model Specification
➢ In practice, researchers estimate a statistical model of
the following form where data are aggregated to the
industry level:
❖Industry Profit Rates = f (Concentration,
Barriers to Entry, Demand …)
Structure-Conduct-PerformanceStructure-Conduct-Performance
Industry Structure• Number of buyers
and sellers• Degree of product
differentiation• Barriers to entry• Cost structures• Vertical integration• Alliances
Industry Structure• Number of buyers
and sellers• Degree of product
differentiation• Barriers to entry• Cost structures• Vertical integration• Alliances
Firm Conduct• Pricing • Advertising• R&D• Investment inplant andequipment
Firm Conduct• Pricing • Advertising• R&D• Investment inplant andequipment
Performance• Econ profits• Accountingprofits (ratios)
• NPV/DCF
• MVA/EVA• Tobin’s Q
Performance• Econ profits• Accountingprofits (ratios)
• NPV/DCF
• MVA/EVA• Tobin’s Q

Empirical Testing of Structure-Conduct (Strategy)-Performance
• Model Specification
➢Multiple regression analysis seeks to evaluate the degrees
to which deviations of the dependent variable (and in this
course our focus has been on profit rates as the dependent
variable) from its mean are “explained by” or associated with
variations in each of a set of independent or explanatory
variables (e.g., concentration, barriers to entry,
demand, etc.)
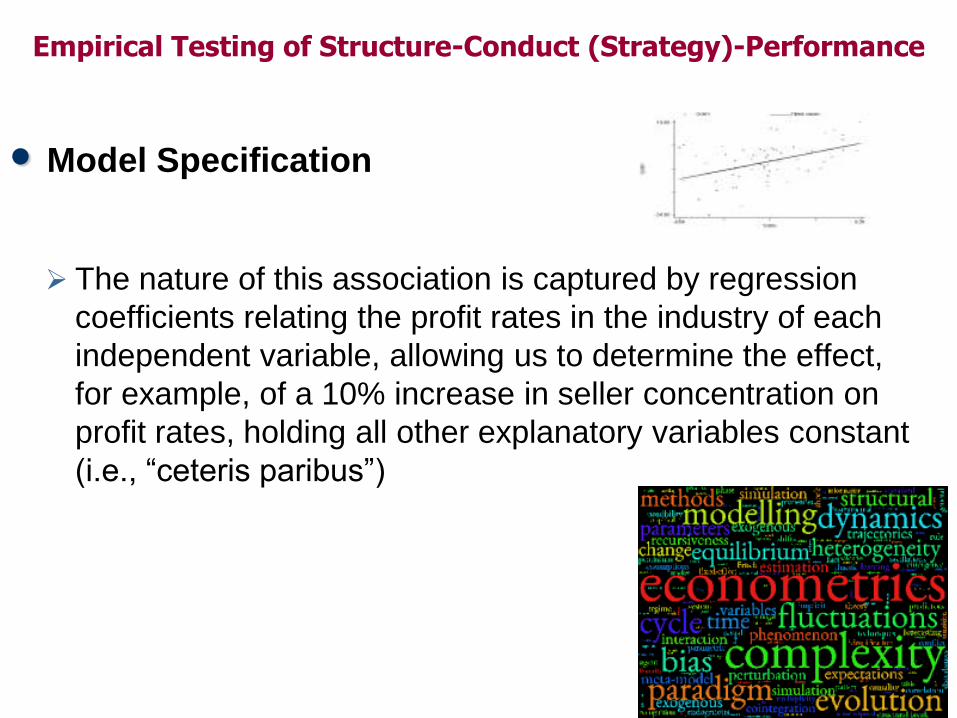
Empirical Testing of Structure-Conduct (Strategy)-Performance
• Model Specification
➢ The nature of this association is captured by regression
coefficients relating the profit rates in the industry of each
independent variable, allowing us to determine the effect,
for example, of a 10% increase in seller concentration on
profit rates, holding all other explanatory variables constant
(i.e., “ceteris paribus”)

Empirical Testing of Structure-Conduct (Strategy)-Performance
• Model Specification
Variable Predicted Sign Reason
CR4 + Higher concentration enables higher prices
CAP/S + Capital-cost barrier to entry
A/S + Advertising intensity as a product differentiation barrier to entry
R&D/S + Technological know-how
GROW + Demand growth leads toless likely price wars
Structure-Conduct-PerformanceStructure-Conduct-Performance
Industry Structure• Number of buyers
and sellers• Degree of product
differentiation• Barriers to entry• Cost structures• Vertical integration• Alliances
Industry Structure• Number of buyers
and sellers• Degree of product
differentiation• Barriers to entry• Cost structures• Vertical integration• Alliances
Firm Conduct• Pricing • Advertising• R&D• Investment inplant andequipment
Firm Conduct• Pricing • Advertising• R&D• Investment inplant andequipment
Performance• Econ profits• Accountingprofits (ratios)
• NPV/DCF
• MVA/EVA• Tobin’s Q
Performance• Econ profits• Accountingprofits (ratios)
• NPV/DCF
• MVA/EVA• Tobin’s Q
Empirical Testing of Structure-Conduct (Strategy)-Performance
• Model Specification
➢Note that the multiple regression results are consistent with(but do not prove) the structure-conduct-performance model.
➢ As you probably are aware from your statistics classes, there are many potential problems that can interfere with the reliable estimation of regression models, leading to incorrect inference about the statistical significance and the economic impact of explanatory variables.

Empirical Testing of Structure-Conduct (Strategy)-Performance
• Three Potential Problems:
(1) Mis-specification problems;
(2) Measurement problems; and
(3) Identification problems

Empirical Testing of Structure-Conduct (Strategy)-Performance
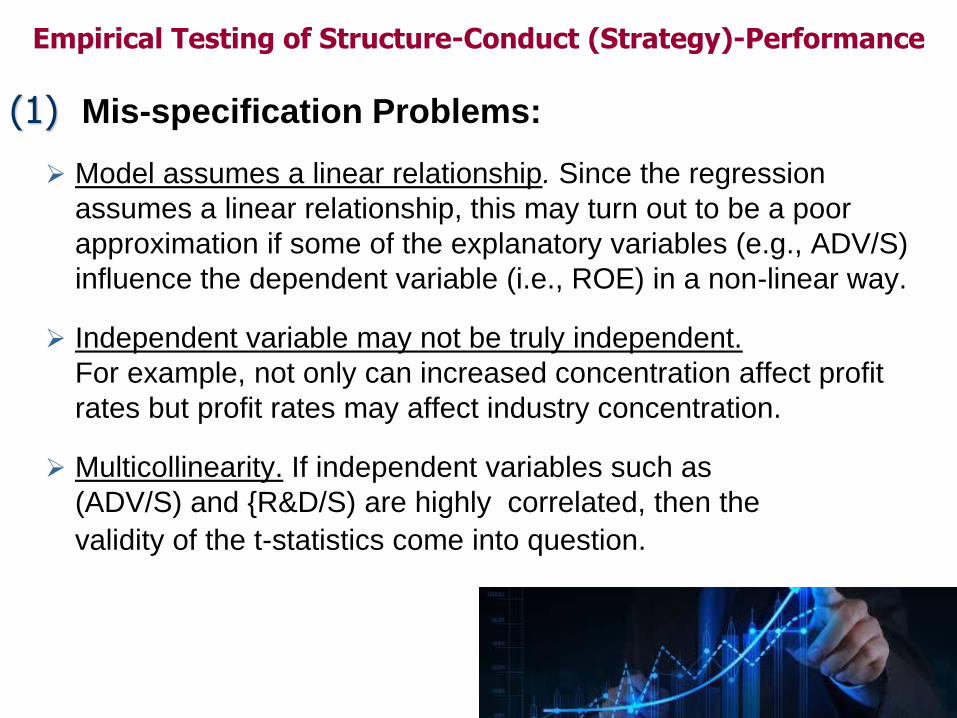
(1) Mis-specification Problems:
➢ Important Variables Omitted. In our regression, the impact
of substitute products, and the power of buyers and suppliers
have not been included in the model specification.
➢ Irrelevant Variables Included. If you believe in “perfect
capital markets” then you may question the idea of capital
cost entry barriers and therefore you would
question the inclusion of the independent
variable [CAP/S] in the model.
Empirical Testing of Structure-Conduct (Strategy)-Performance
(1) Mis-specification Problems:
➢ Model assumes a linear relationship. Since the regression
assumes a linear relationship, this may turn out to be a poor
approximation if some of the explanatory variables (e.g., ADV/S)
influence the dependent variable (i.e., ROE) in a non-linear way.
➢ Independent variable may not be truly independent.
For example, not only can increased concentration affect profit
rates but profit rates may affect industry concentration.
➢ Multicollinearity. If independent variables such as
(ADV/S) and {R&D/S) are highly correlated, then the
validity of the t-statistics come into question.

Empirical Testing of Structure-Conduct (Strategy)-Performance
(2) Measurement Problems:
• For example, CR4 (i.e. the sum of the market share of the leading 4 firms' market share in the industry) may not be the best measure of industry concentration, where the Herfindahl-Hirschman (HHI) is a better measure. Perhaps some performance measure other than ROE would also be better for testing the theory.
• Note: If the evidence is not consistent with the theory it is not necessarily the case that we abandon the theory. One of the many possibilities is that we do not have good measures of the theoretical concepts.
Empirical Testing of Structure-Conduct (Strategy)-Performance
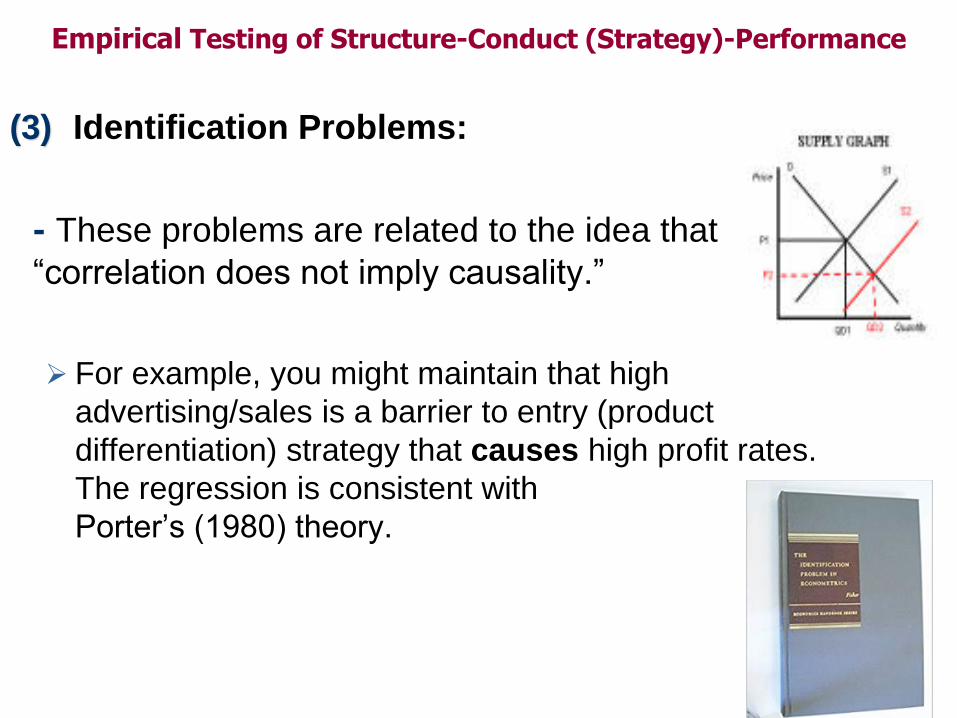
(3) Identification Problems:
- These problems are related to the idea that
“correlation does not imply causality.”
➢ For example, you might maintain that high
advertising/sales is a barrier to entry (product
differentiation) strategy that causes high profit rates.
The regression is consistent with
Porter’s (1980) theory.

Empirical Testing of Structure-Conduct (Strategy)-Performance
(3) Identification Problems
➢ However, one might argue instead that high profit rates allow more discretionary spending in marketing and thus, high profit rates cause high advertising/sales. The empirical evidence is also consistent with this theory. Thus, we have an “identification problem.” The data are consistent with multiple theories and we must find more refined tests and better econometric methods in order to advance our scientific knowledge in strategic management.