Embed Size (px)
Citation preview
Chapter 3
Process & Customer Value
Designing Value-Creating Processes
Process Improvement Tools
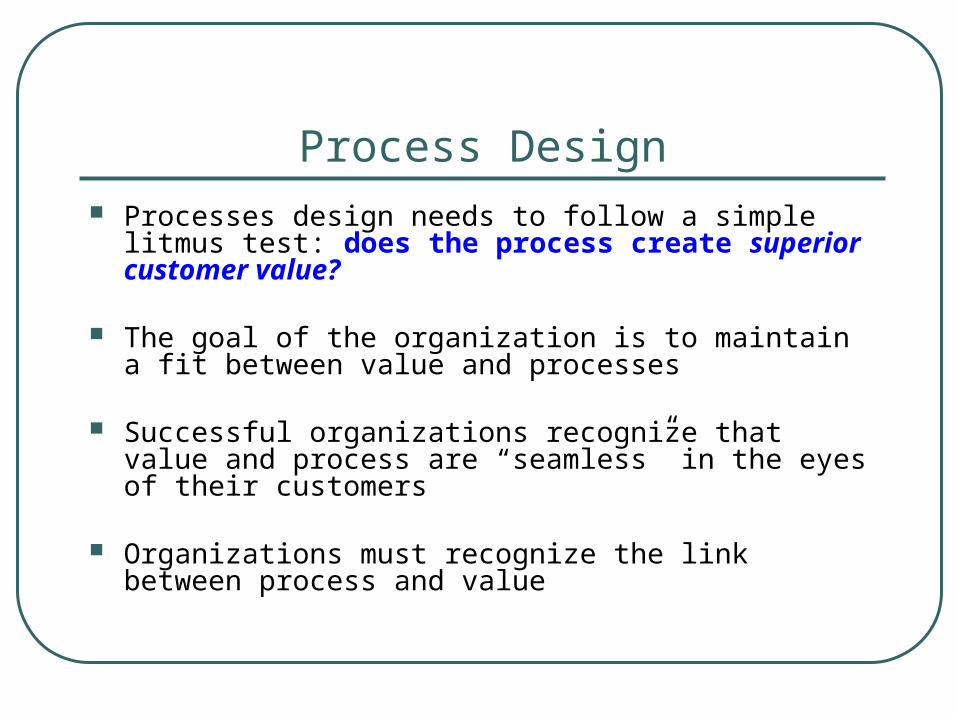
Process Design Processes design needs to follow a simple litmus test:
does the process create superior customer value?
The goal of the organization is to maintain a fit between value and processes
Successful organizations recognize that value and process are “seamless” in the eyes of their customers
Organizations must recognize the link between process and value
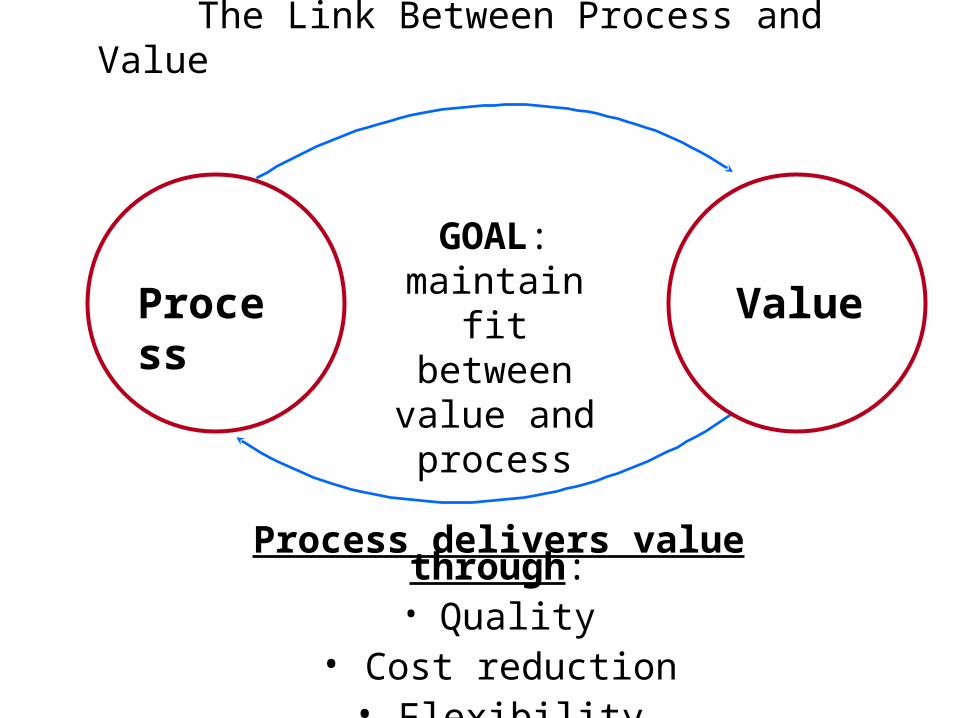
The Link Between Process and Value
GOAL: maintain fit
between value and process
Process
Value
Process delivers value through:• Quality
• Cost reduction• Flexibility
Definition of Process
A process is a specific group of
activities and subordinate tasks
which results in the performance
of a service that is of value
Key Business Process Orientation (BPO) Elements
1) Process management and measurement
2) Process jobs
3) Process view
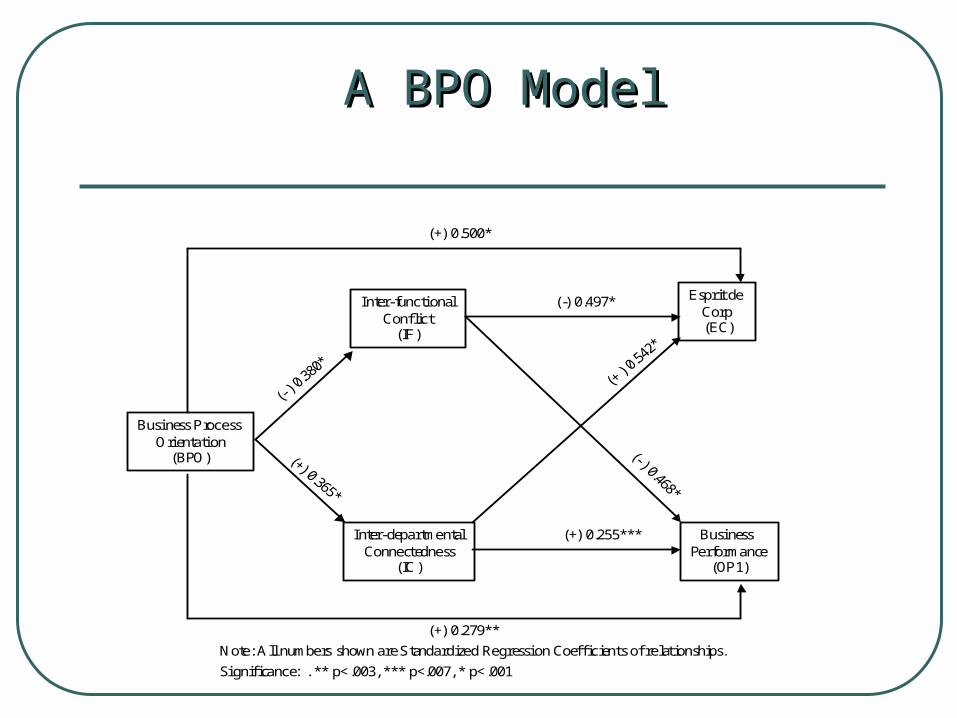
A BPO ModelA BPO Model
Business Process Orientation
(BPO)
Inter-functionalConflict
(IF)
Inter-departmentalConnectedness
(IC)
Esprit de Corp(EC)
Business Performance
(OP1)
(+) 0.500*
(-) 0.497*
(+) 0.279**
(+) 0.255***
Significance: . ** p<.003, *** p<.007, * p<.001
Note: All numbers shown are Standardized Regression Coefficients of relat ionships.
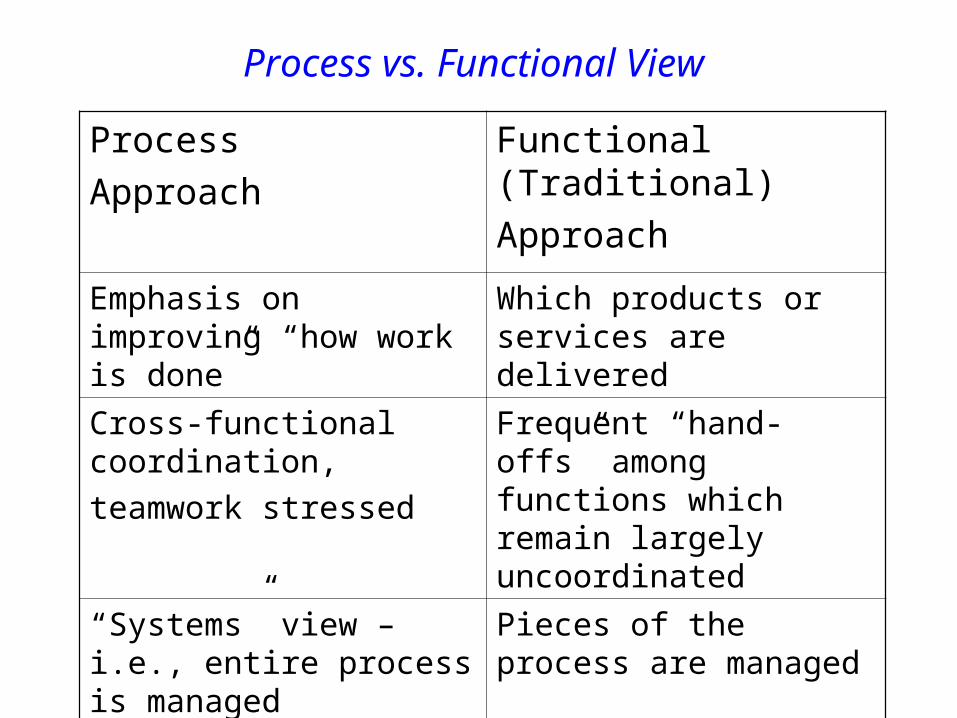
Process vs. Functional View
Process
Approach
Functional (Traditional)
Approach
Emphasis on improving “how work is done”
Which products or services are delivered
Cross-functional coordination,
teamwork stressed
Frequent “hand-offs” among functions which remain largely uncoordinated
“Systems” view – i.e., entire process is managed
Pieces of the process are managed
Customer orientation Internal/company orientation
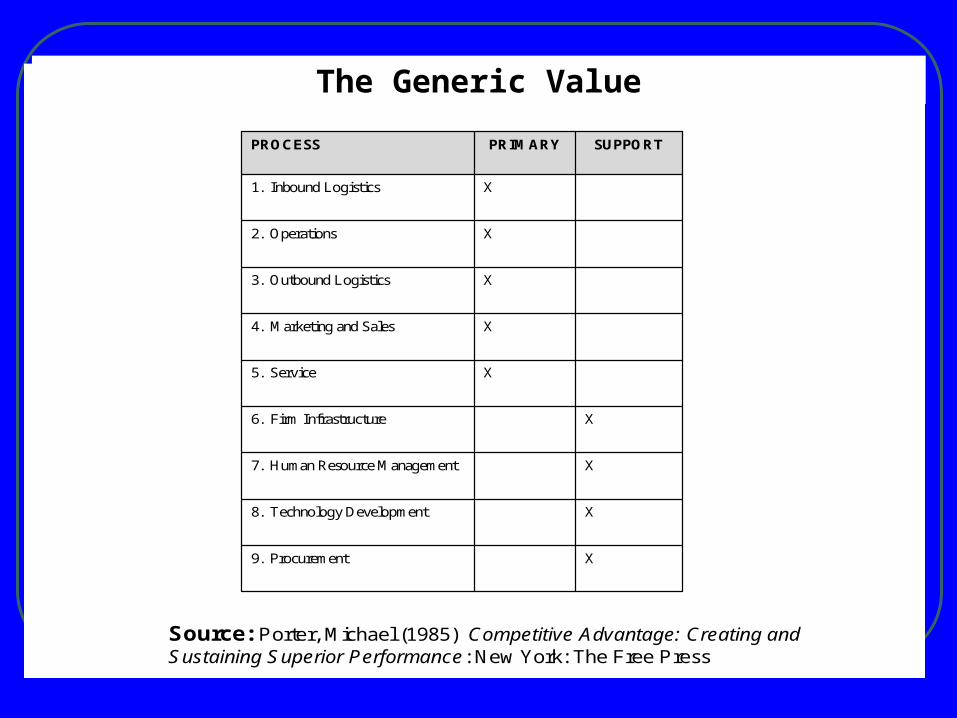
X9. Procurement
X8. Technology Development
X7. Human Resource Management
X6. Firm Infrastructure
X5. Service
X4. Marketing and Sales
X3. Outbound Logistics
X2. Operations
X1. Inbound Logistics
SUPPORTPRIMARYPROCESS
Table 3.2. The Generic Value Chain
Source: Porter, Michael (1985) Competitive Advantage: Creating and Sustaining Superior Performance: New York: The Free Press
The Generic Value

Process Ownership
☛ One of the most visible differences between a process-driven enterprise and a traditional organization is the existence of process owners
☛Hammer recommends that process ownership be a permanent role in order to evolve as business conditions change, and process owners should guide that evolution
☛Managers’ must be given authority over designing the process, measuring its performance, and training the frontline workers who perform it
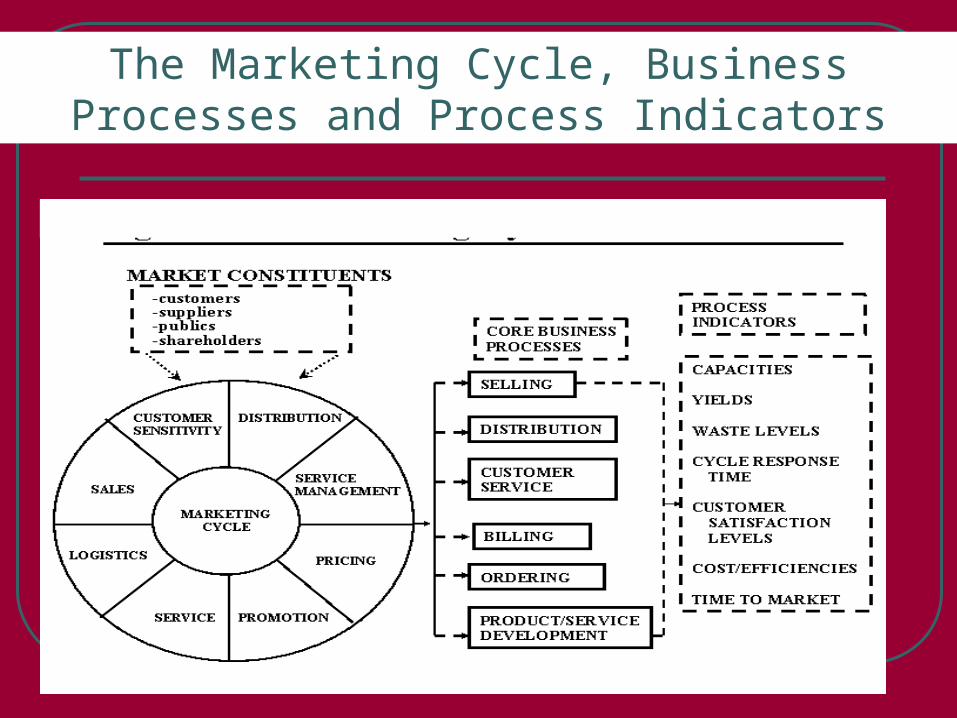
The Marketing Cycle, Business Processes and Process Indicators
The PDCA (Deming) Cycle
The PDCA (or Deming) Cycle is a continuous sequence of activities that represents a powerful decision-making tool for affecting organizational change
Each of these 4 activities are held in equal balance and are equally important
The cycle indicates that the task of process improvement is never done, as past results drive future action
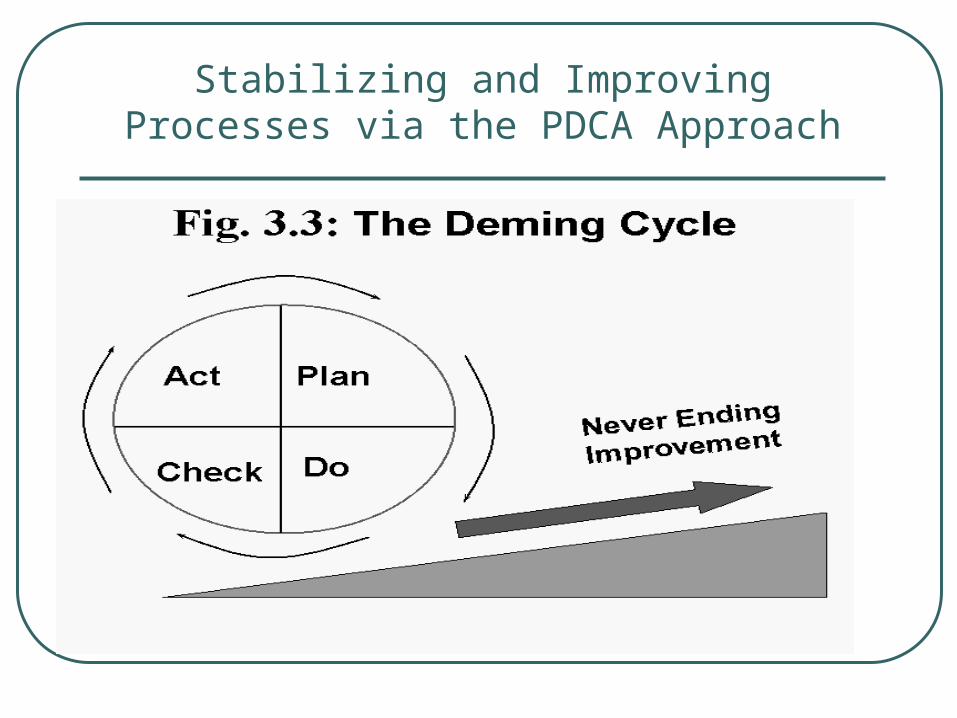
Stabilizing and Improving Processes via the PDCA Approach
PDCA 1: Plan
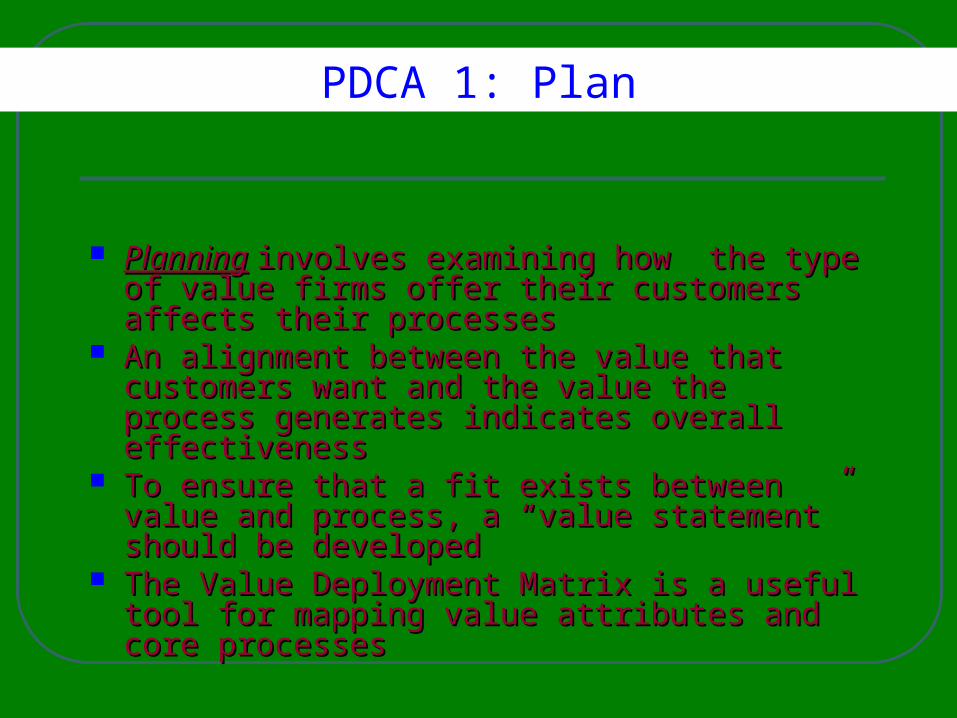
PlanningPlanning involves examining how the type of involves examining how the type of value firms offer their customers affects their value firms offer their customers affects their processes processes
An alignment between the value that customers An alignment between the value that customers want and the value the process generates want and the value the process generates indicates overall effectiveness indicates overall effectiveness
To ensure that a fit exists between value and To ensure that a fit exists between value and process, a “value statement” should be developedprocess, a “value statement” should be developed
The Value Deployment Matrix is a useful tool for The Value Deployment Matrix is a useful tool for mapping value attributes and core processes mapping value attributes and core processes
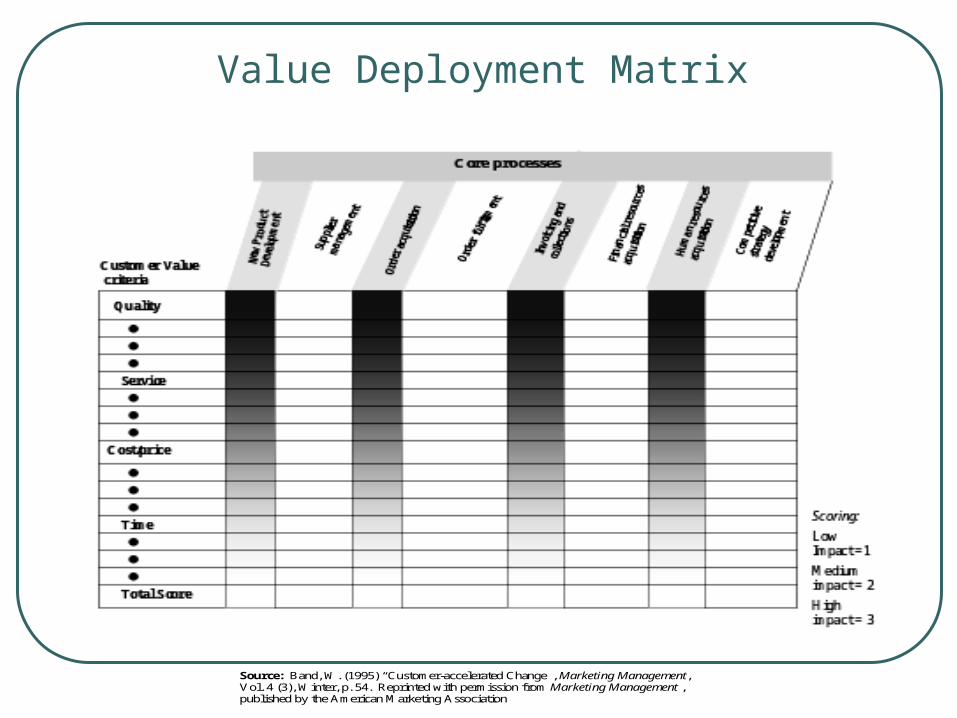
Value Deployment Matrix
Source: Band, W. (1995) “Customer-accelerated Change”, Marketing Management, Vol. 4 (3), Winter, p. 54. Reprinted with permission from Marketing Management , published by the American Marketing Association
PDCA 2: Do The do phase deals with process design and
congruency issues Once a value statement is created or refined,
processes need to be assessed according to their efficacy and congruence with the firm’s value statement
A series of questions such as those listed in Table 3.3 can help determine where to direct process improvement efforts
After examining processes for their fit with the firm’s value statement, individual processes should be studied in order to determine their relevance and importance from the customer’s perspective
Understanding Process Improvement
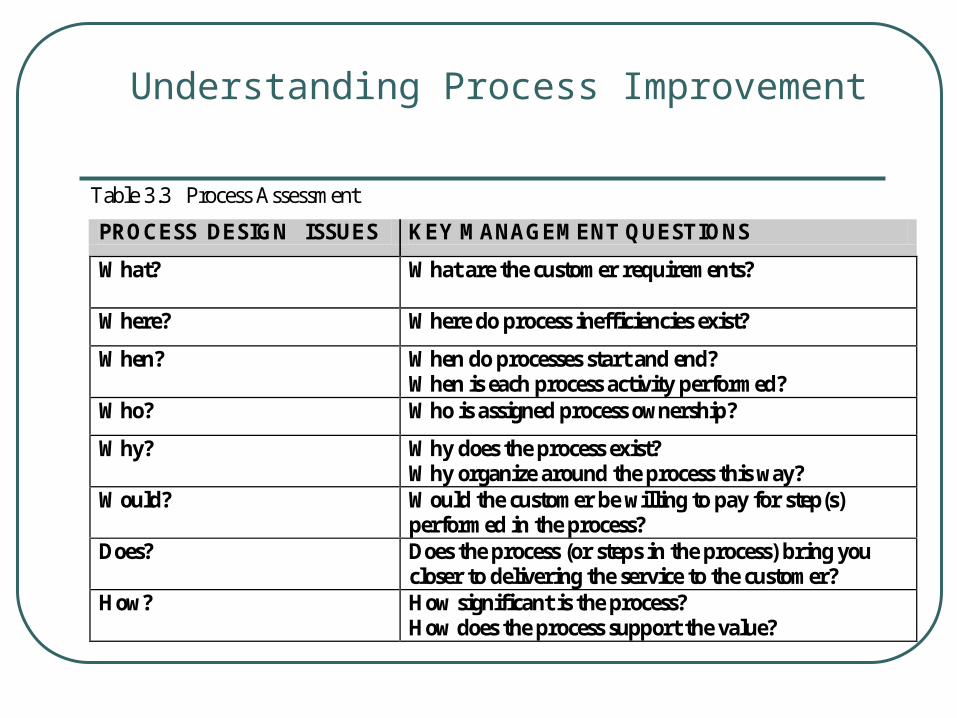
Table 3.3 Process Assessment
PROCESS DESIGN ISSUES KEY MANAGEMENT QUESTIONS
What? What are the customer requirements?
Where? Where do process inefficiencies exist?
When? When do processes start and end? When is each process activity performed?
Who? Who is assigned process ownership?
Why? Why does the process exist? Why organize around the process this way?
Would? Would the customer be willing to pay for step(s) performed in the process?
Does? Does the process (or steps in the process) bring you closer to delivering the service to the customer?
How? How significant is the process? How does the process support the value?
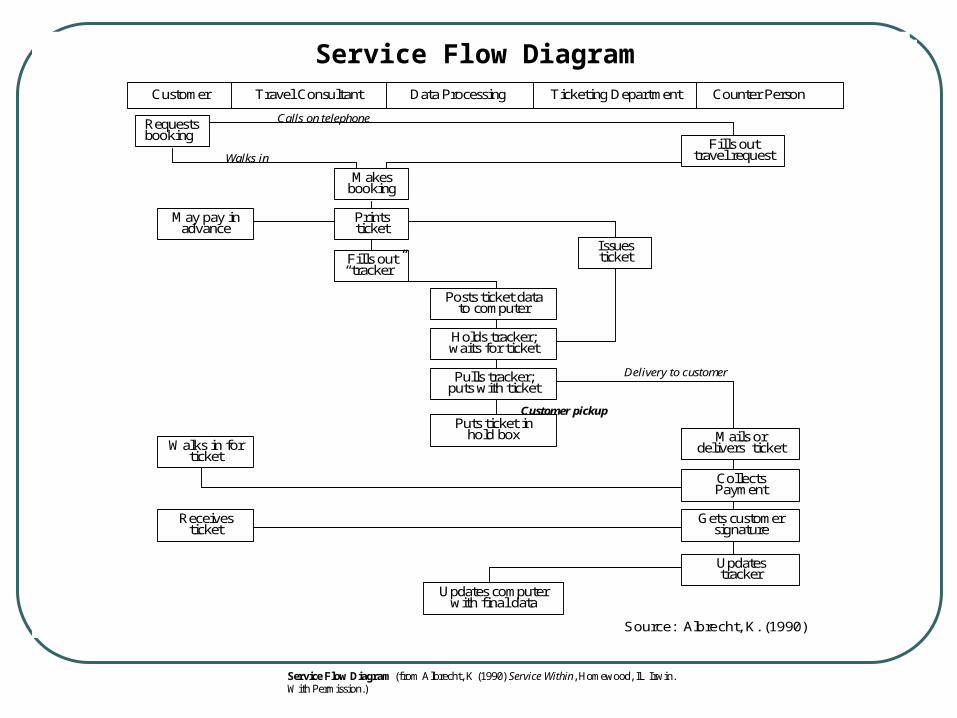
Customer Travel Consultant Data Processing Ticketing Department Counter Person
Requests booking
Fills out travel request
May pay in advance
Calls on telephone
Walks in
Holds tracker; waits for ticket
Pulls tracker; puts with ticket
Posts ticket data to computer
Puts ticket in hold box
Makes booking
Prints ticket
Fills out “tracker”
Issues ticket
Walks in for ticket
Customer pickup
Mails or delivers ticket
Collects Payment
Gets customer signature
Updates tracker
Delivery to customer
Receives ticket
Updates computer with final data
Source: Albrecht, K. (1990)
Figure 3. 5. Service Flow Diagram
Service Flow Diagram (from Albrecht, K (1990) Service Within, Homewood, IL Irwin. With Permission.)
Service Flow Diagram
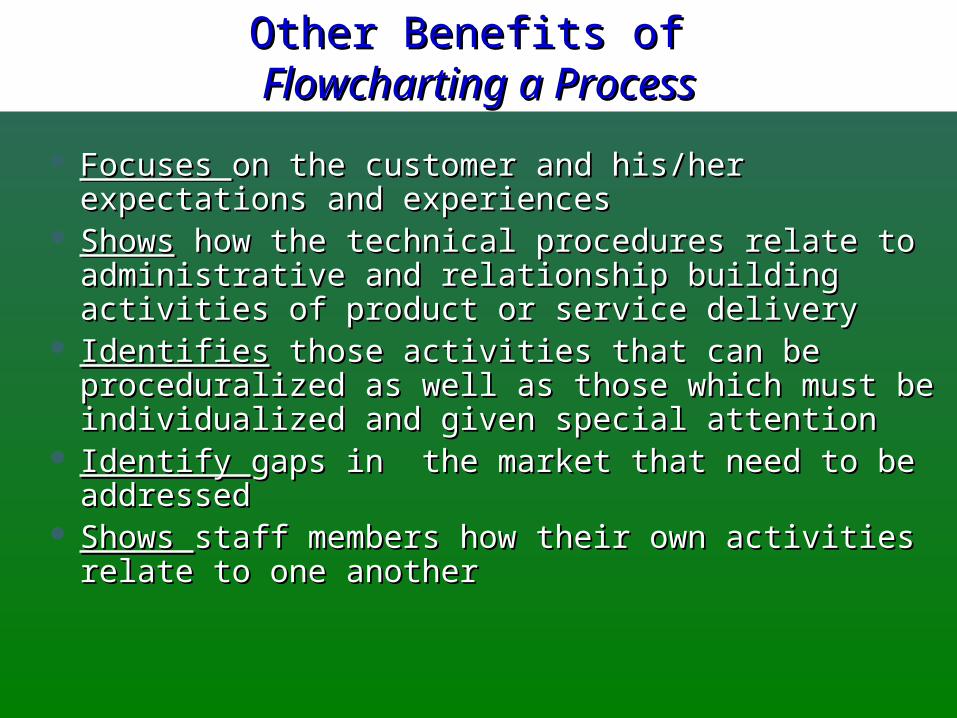
Other Benefits of Other Benefits of Flowcharting a ProcessFlowcharting a Process
Focuses Focuses on the customer and his/her expectations and on the customer and his/her expectations and experiencesexperiences
ShowsShows how the technical procedures relate to how the technical procedures relate to administrative and relationship building activities of administrative and relationship building activities of product or service deliveryproduct or service delivery
IdentifiesIdentifies those activities that can be proceduralized as those activities that can be proceduralized as well as those which must be individualized and given well as those which must be individualized and given special attentionspecial attention
Identify Identify gaps in the market that need to be addressedgaps in the market that need to be addressed
Shows Shows staff members how their own activities relate to staff members how their own activities relate to one another one another
PDCA 3: CheckCheck
Once processes are evaluated for their value- creating effectiveness and measures are developed, then data-driven tools can
be used to routinely monitor, inspect, andimprove them.
Table 3.4 lists some common tools formeasuring, monitoring, controlling andimproving process quality.
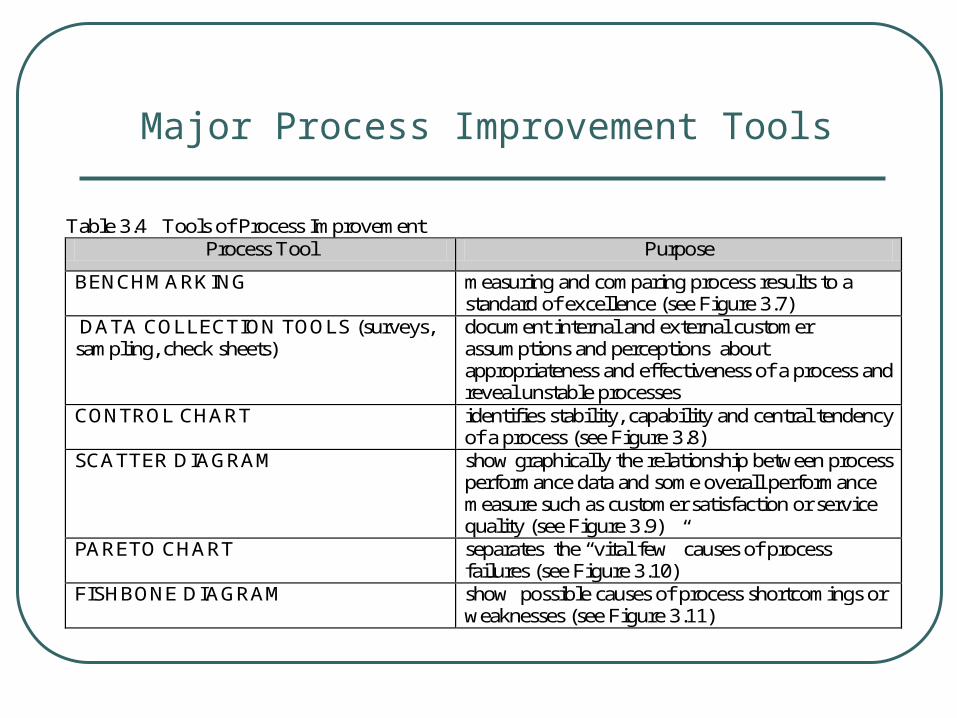
Major Process Improvement Tools
Table 3.4 Tools of Process Improvement Process Tool Purpose
BENCHMARKING measuring and comparing process results to a standard of excellence (see Figure 3.7)
DATA COLLECTION TOOLS (surveys, sampling, check sheets)
document internal and external customer assumptions and perceptions about appropriateness and effectiveness of a process and reveal unstable processes
CONTROL CHART identifies stability, capability and central tendency of a process (see Figure 3.8)
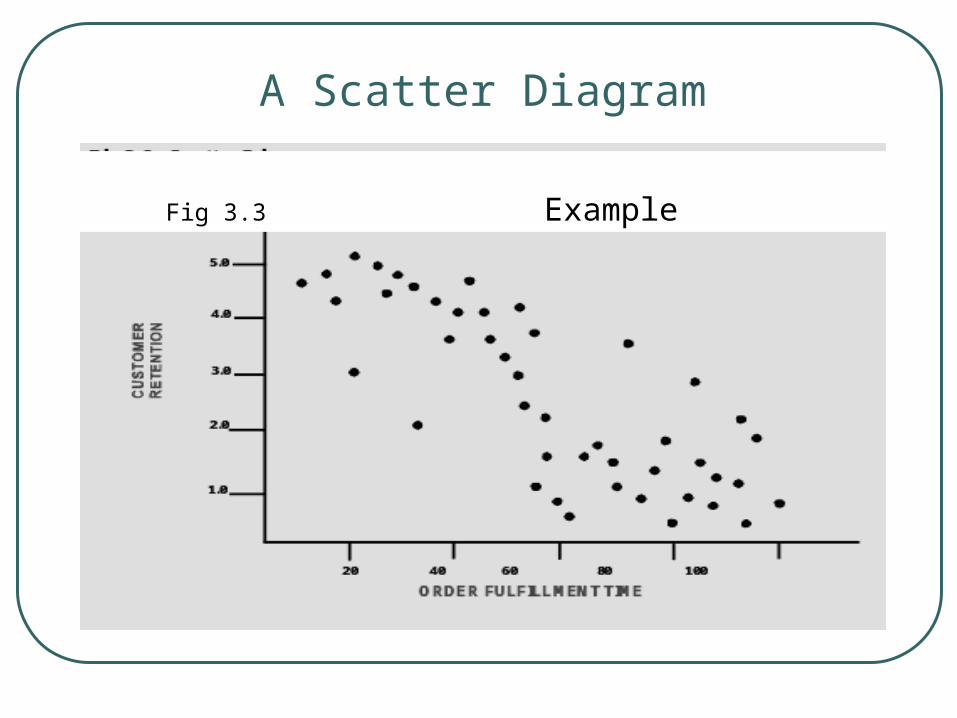
SCATTER DIAGRAM show graphically the relationship between process performance data and some overall performance measure such as customer satisfaction or service quality (see Figure 3.9)
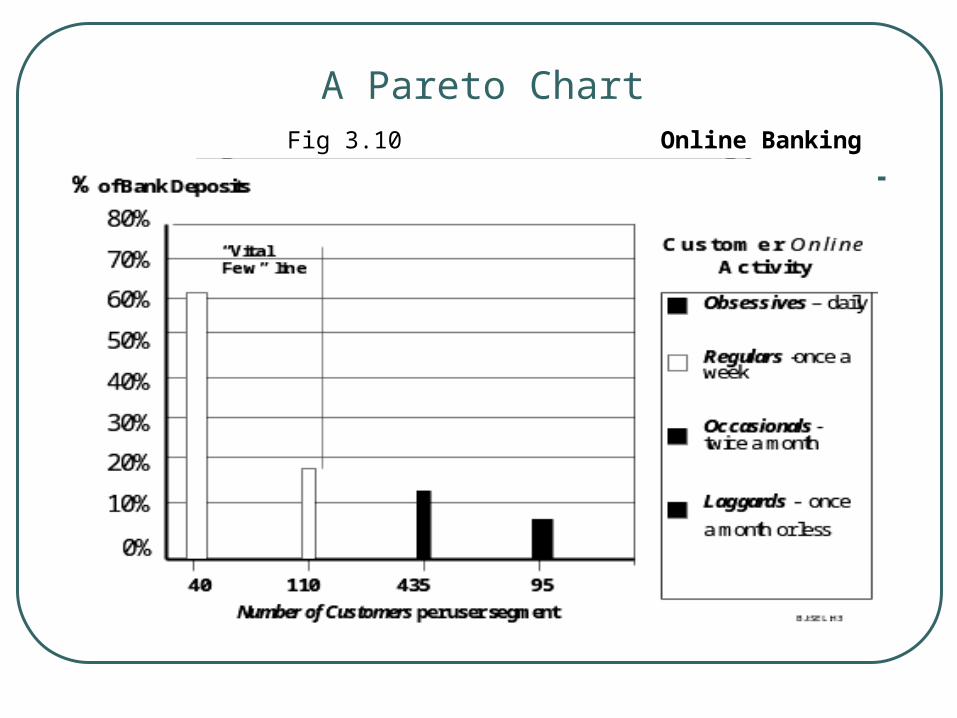
PARETO CHART separates the “vital few” causes of process failures (see Figure 3.10)
FISHBONE DIAGRAM show possible causes of process shortcomings or weaknesses (see Figure 3.11)
Benchmarking
Benchmarking is a process of consistently researching new ideas for methods, practices, and processes, and either adopting the practices or adapting the good features, and implementing them to obtain the “best of the best” (Camp)
Benchmarking is the most important tool for evaluating andimproving processes
Benchmarking compares a company’s own practices(processes or tasks) against similar practices of firmsrecognized as superior in these areas
By comparing itself against the best possible practices, thebenchmarking firm seeks to identify gaps between its current processes and the processes it should implement
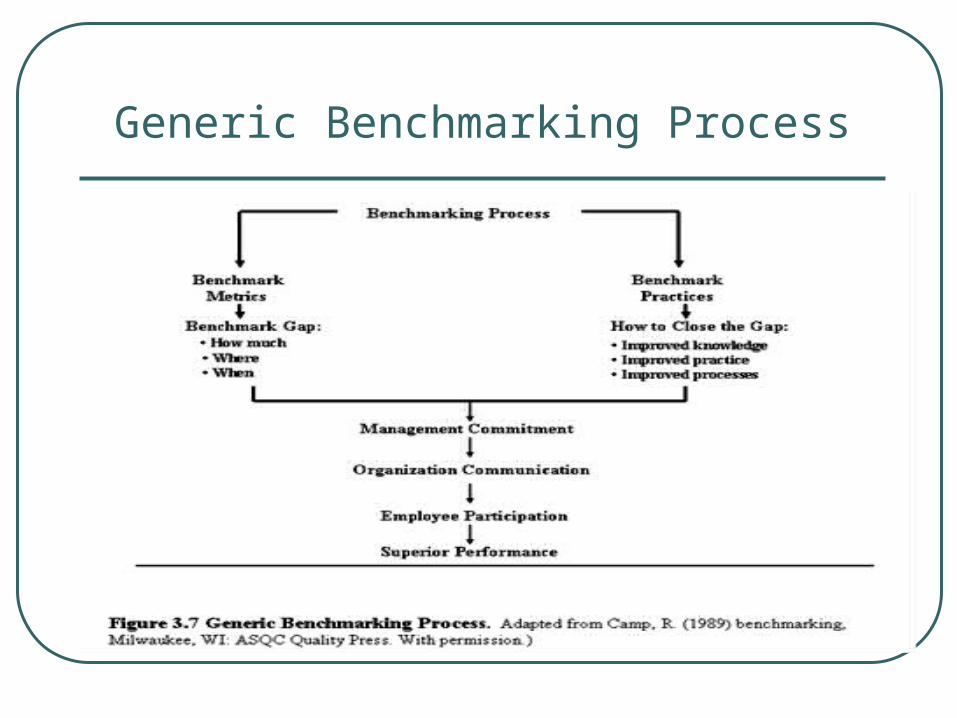
Generic Benchmarking Process
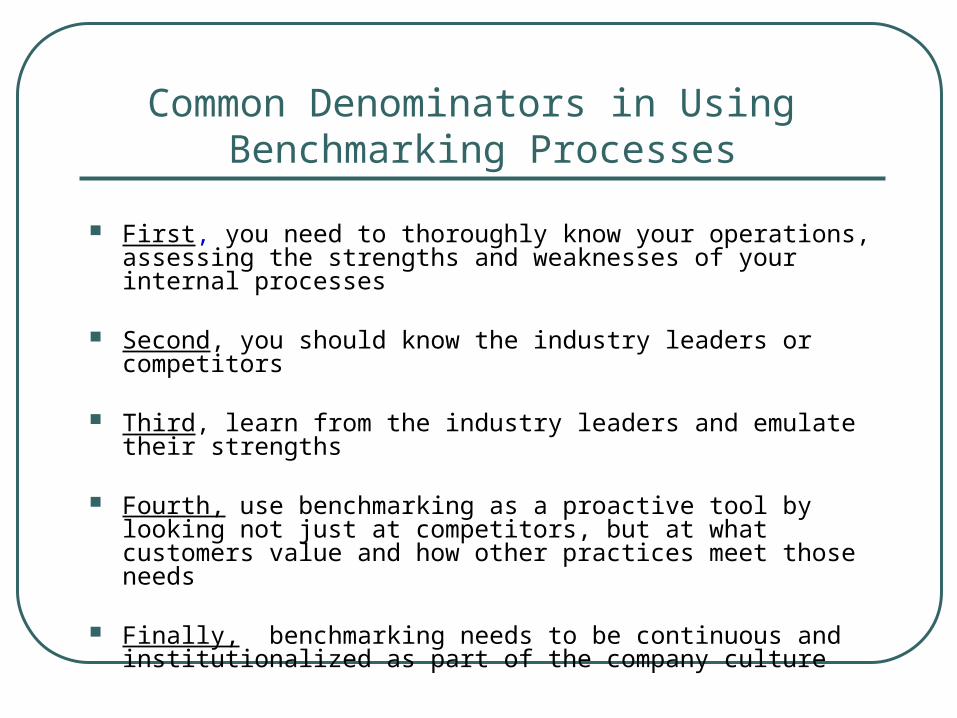
Common Denominators in Using Benchmarking Processes
First, you need to thoroughly know your operations, assessing the strengths and weaknesses of your internal processes
Second, you should know the industry leaders or competitors
Third, learn from the industry leaders and emulate their strengths
Fourth, use benchmarking as a proactive tool by looking not just at competitors, but at what customers value and how other practices meet those needs
Finally, benchmarking needs to be continuous and institutionalized as part of the company culture
Surveys/Checklists & Control Charts
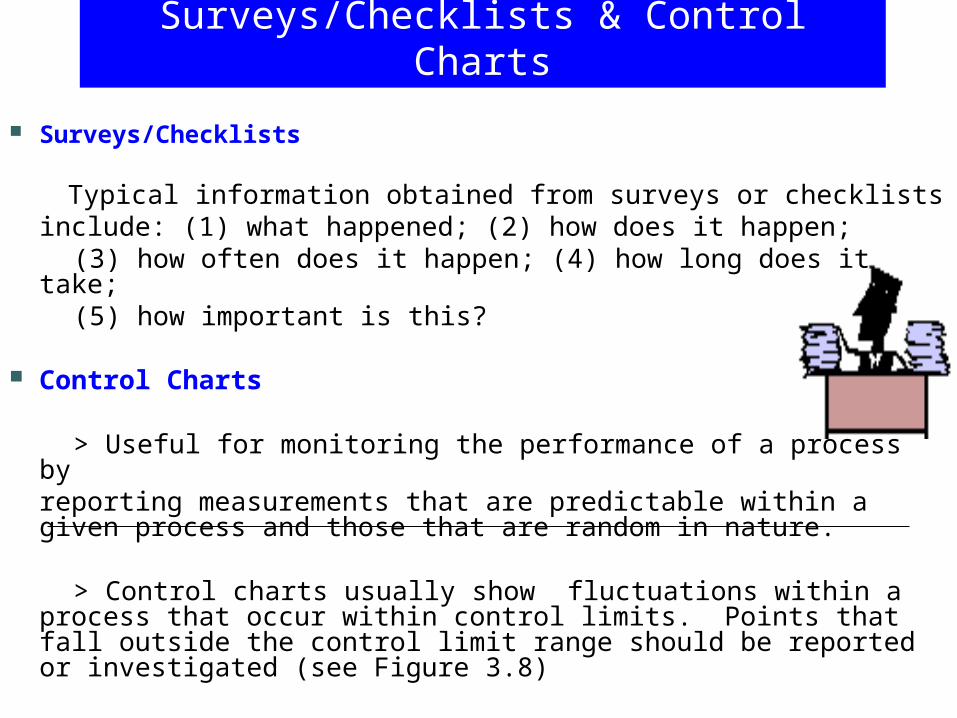
Surveys/Checklists
Typical information obtained from surveys or checklistsinclude: (1) what happened; (2) how does it happen;
(3) how often does it happen; (4) how long does it take; (5) how important is this?
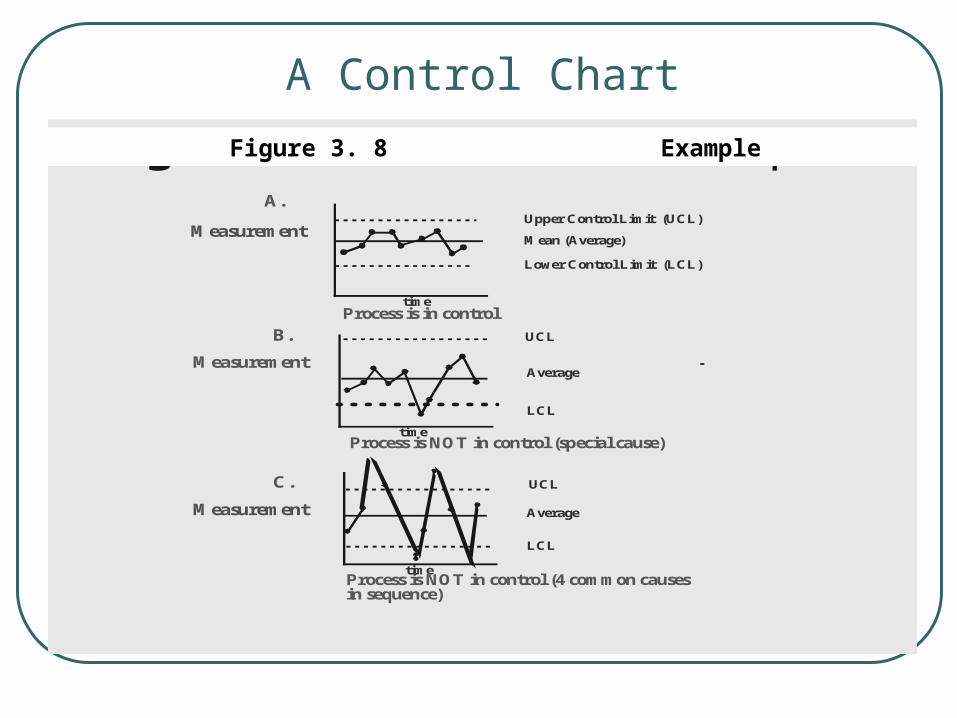
Control Charts
> Useful for monitoring the performance of a process byreporting measurements that are predictable within a given process and those that are random in nature.
> Control charts usually show fluctuations within a process that
occur within control limits. Points that fall outside the control limit range should be reported or investigated (see Figure 3.8)
A Control Chart
Figure 3.8 Control Chart Example
Measurement
Measurement
Measurement
A.
B.
C.
Upper Control Limit (UCL)
Mean (Average)
Lower Control Limit (LCL)
UCL
Average
LCL
time
time
time
UCL
Average
LCL
Process is in control
Process is NOT in control (special cause)
Process is NOT in control (4 common causesin sequence)
Figure 3. 8 Example
Scatter Diagrams & Pareto Charts
Scatter Diagrams (Figure 3.9)Examines 2 variables at one time to determinethe relationship that exists between them
Help determine possible process “fail points” or measurethe results of recently changed processes
Pareto Charts (Figure 3.10)Used when there is a need to determine the relativeimportance of certain variables in process variation
Helps isolate the “vital few” (as opposed to the trivial many)causes of process variation
A Scatter Diagram
Fig 3.3 Example
A Pareto Chart Fig 3.10 Online Banking
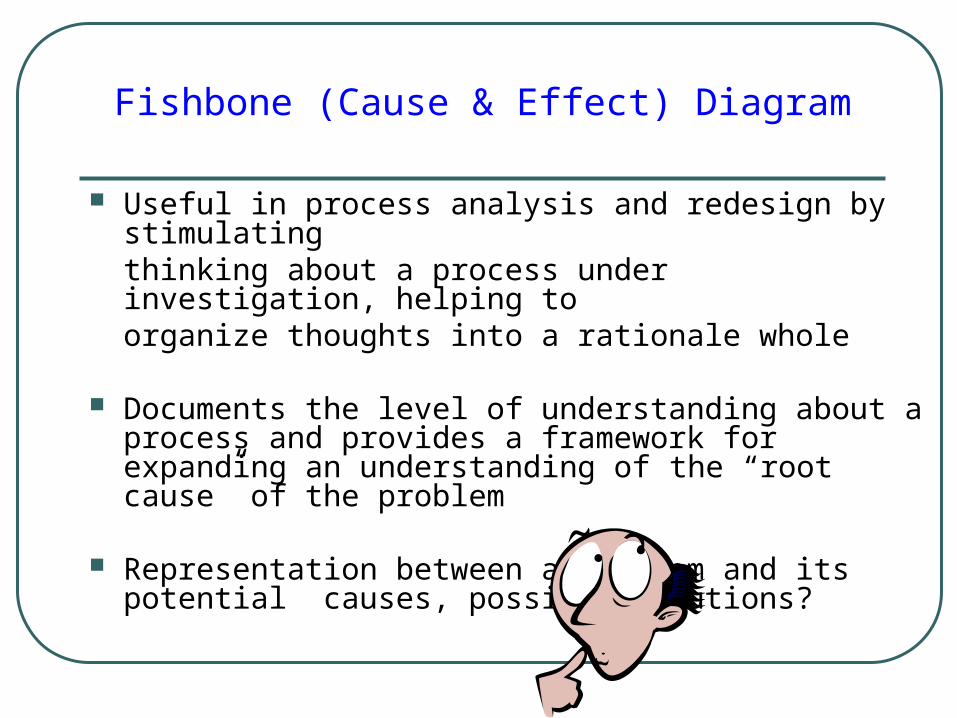
Fishbone (Cause & Effect) Diagram
Useful in process analysis and redesign by stimulatingthinking about a process under investigation, helping toorganize thoughts into a rationale whole
Documents the level of understanding about a process and provides a framework for expanding an understanding of the “root cause” of the problem
Representation between a problem and its potential causes, possible solutions?
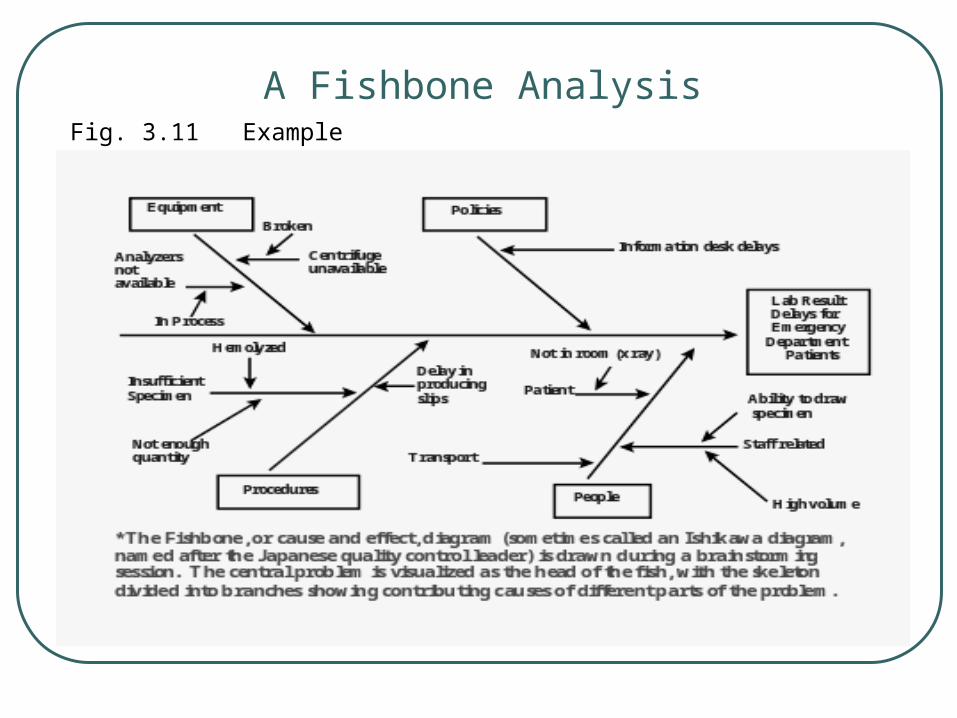
A Fishbone Analysis Fig. 3.11 Example
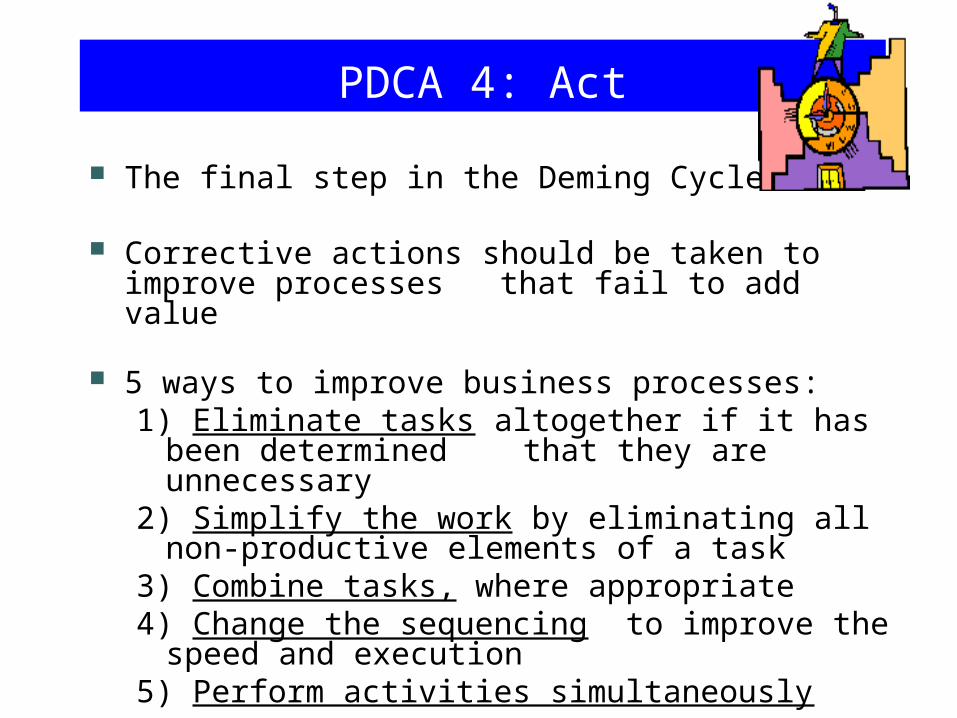
PDCA 4: Act
The final step in the Deming Cycle
Corrective actions should be taken to improve processes that fail to add value
5 ways to improve business processes:
1) Eliminate tasks altogether if it has been determined that they are unnecessary
2) Simplify the work by eliminating all non-productive elements of a task
3) Combine tasks, where appropriate4) Change the sequencing to improve the speed and
execution5) Perform activities simultaneously
Process Improvement & Management: Concluding RemarksConcluding Remarks
■ ■ In most cases, the people who perform the processes In most cases, the people who perform the processes are the ones most capable of determining how to improve are the ones most capable of determining how to improve or simplify the process or simplify the process
■ ■ Management has to create a culture that values Management has to create a culture that values
employee input and rewards people for process innovationemployee input and rewards people for process innovation
■ ■ Once a process improvement has been made, the Once a process improvement has been made, the change must be measured and evaluated for effectiveness change must be measured and evaluated for effectiveness
cont…cont…

Process Improvement & Management: Concluding Remarks - cont..Concluding Remarks - cont..
■ ■ The effective use of process integration is enabling The effective use of process integration is enabling firms to organize in new ways and to better manage firms to organize in new ways and to better manage supply chains and business relationships.supply chains and business relationships.
■ ■ Processes represent more than simply the Processes represent more than simply the “operations” of the company, but rather serve as a “operations” of the company, but rather serve as a means to superior performancemeans to superior performance
■ ■ Unique, value-creating processes are strategic Unique, value-creating processes are strategic assets for organizationsassets for organizations