Embed Size (px)
Citation preview

Chapter 3
Small ruminant production in the tropics: a study of smallholder and
pastoral/extensive farming systems in Kenya
I.S. Kosgeya,b,c, G. J. Rowlandsc, J.A.M. van Arendonkb, R. L. Bakerc
aDepartment of Animal Science, Egerton University, P.O. Box 536, 20107 Njoro,
Kenya
bAnimal Breeding and Genetics Group, Wageningen University, P.O. Box 338, 6700
AH, Wageningen, The Netherlands
cInternational Livestock Research Institute (ILRI), Naivasha Road, P.O. Box 30709,
Nairobi 00100, Kenya
This chapter has been submitted to Small Ruminant Research

Small ruminant production
50
Abstract
A survey was conducted by way of personal interviews with 562 respondents
comprising 459 farmers and 103 butchers/traders in selected districts in the central
and western parts of Kenya, consisting of three predominantly smallholder and four
predominantly pastoral/extensive districts. The study aimed to provide a better
understanding of smallholder and pastoral/extensive sheep and goat farming
systems in the tropics, by taking Kenya as an example. Results show that 58% of
pastoral/extensive farmers and 46% of smallholders indicated livestock as their main
activity. Small ruminants ranked closely behind cattle in their importance. Thirty four
percent of the households kept only sheep, 18% only goats and 48% both species.
The survey demonstrated the relative importance to the farmers of tangible benefits
of farming sheep and goats (such as regular cash income, meat, manure and, in the
case of goats, milk) versus intangible benefits (such as the role of small ruminants as
an insurance against emergencies). Regular cash income and an insurance against
emergencies were the highest priorities. Seventy eight percent of the farmers
reported animal sales over the previous 12 months. Of these, the income was spent
on school fees (32%), purchase of food (22%), farm investment (18%), medical
expenses (10%), off-farm investment (9%), social activities (5%) and re-stocking
(4%). Indigenous genotypes were predominant among pastoral/extensive farmers
and mixed crosses predominant among smallholders. A range of traits: growth rate,
size, shape, drought tolerance, meat quality, fertility, disease and heat tolerance,
prolificacy and temperament were all considered important for both sheep and goats
in both farming systems and across the different genotypes. Compared with other
pure breeds Red Maasai sheep and Small East African goats were rated poorly in
terms of size, shape, growth and fertility but highly in terms of drought and (Red
Maasai) heat tolerance by both smallholder and pastoral/extensive farmers. In
general, crosses were perceived less favourably than indigenous pure breeds. Size
and performance ranked as the most important traits in the choice of breeding
males. Approximately half the farmers inherited their males, reared them on the farm
and kept them for an average of 2-3 years. Uncontrolled mating within the

Chapter 3
51
household’s flock was predominant in both farming systems. Over 98% of the
farmers reported incidence of disease, especially pneumonia (in pastoral/extensive
areas), helminthosis, tick-borne diseases, diarrhoea and foot-rot. Over 95% of the
farmers fed supplements in both dry and wet seasons. Pure exotic and indigenous X
exotic genotypes fetched higher prices than indigenous genotypes due to their
heavier body weight.
(Keywords: Small ruminants; Smallholder; Pastoral/extensive; Breeding
programmes; Tropics)
3.1. Introduction
The importance of small ruminants (i.e., sheep and goats) to the socio-
economic well being of people in developing countries in the tropics in terms of
nutrition, income and intangible benefits (i.e., savings, an insurance against
emergencies, cultural and ceremonial purposes) cannot be overemphasised. Small
ruminants also play a complementary role to other livestock in the utilisation of
available feed resources and provide one of the practical means of using vast areas
of natural grassland in regions where crop production is impractical (Baker and
Rege, 1994). Therefore, improvement programmes are necessary to increase and
sustain the productivity of small ruminants in these areas so as to meet the demands
of the human population on them. However, development of genetic improvement
programmes for sheep and goats will only be successful when accompanied by a
good understanding of the different farming systems and when simultaneously
addressing several constraints – e.g., feeding, health control, management, and cost
and availability of credit and marketing infrastructure (Baker and Gray, 2003).
Many small ruminant genetic improvement programmes have not been very
successful in developing countries in the tropics (Sölkner et al., 1998; Rewe et al.,
2002; Wollny et al., 2002). An important reason is that genetic improvement
programmes have mostly been implemented without taking into consideration all the
needs of the farmer. In addition, poor performance of imported breeds from the

Small ruminant production
52
temperate developed world into tropical countries has created a negative image for
genetic improvement programmes (Turner, 1978; Rewe et al., 2002; Ayalew et al.,
2003). Few studies have elaborated on the many factors affecting the production and
farming of sheep and goats in the tropics. Consequently, there is generally scanty
information, from the farmers’ perspective, on the entire spectrum of small ruminant
farming, a situation limiting the scope of improvement interventions. The current
study attempts to provide a better understanding of smallholder and
pastoral/extensive farming systems, and complements past studies in the tropics
(e.g., Mucuthi et al., 1992; Otieno et al., 1993; Mwendia, 1997; Peeler and Omore,
1997; Mahanjana and Cronjé, 2000; Jaitner et al., 2001; Seleka, 2001; Wollny et al.,
2002). The study aims to help in the development of effective breeding programmes
for sheep and goats in the tropics. More specifically, the survey aimed to:
a) establish why smallholder and pastoral/extensive farmers keep sheep and
goats,
b) determine the relative importance to the farmers of tangible benefits of
farming sheep and goats (e.g., cash income from meat, milk and manure)
versus intangible benefits (e.g., the role of small ruminants to act as a source
of income for future needs - banking or insurance),
c) understand why farmers in different production systems keep particular
breeds,
d) know what attributes of sheep and goats farmers think are important,
e) establish from where farmers access their breeding rams and bucks and how
long they keep them, and
f) understand the constraints that apply to successful farming of small
ruminants.

Chapter 3
53
3.2. Materials and methods
3.2.1. Sampling and questionnaire methodology
The survey was conducted by way of personal interviews with farmers
(household survey) and butchers/traders (market survey) by teams of trained
enumerators in selected districts in the central and western parts of Kenya (see
Table 3.1 and 3.2; Fig. 3.1). The survey of farmers covered seven districts, and that
of traders/butchers covered three districts. The household survey was designed such
that there were three districts that were predominantly smallholder with mixed crop-
livestock farmers (i.e., Nakuru, Nandi and Nyeri) and four that were predominantly
pastoral/extensive (i.e., Baringo, Laikipia, Narok and Trans-Mara) (Table 3.2). Nyeri
district also contains some medium- and low-potential pastoral/extensive areas, of
which one division was selected. Although largely pastoral, Baringo also contains a
smallholder, mixed crop-livestock highland area. One largely smallholder division
was picked in the highlands and one pastoral division in the lowlands. A number of
smallholder households were also selected during the random sampling of the two
Laikipia district divisions. One division in Nakuru district was selected from medium-
potential and one from high-potential zones in the district. The survey areas within
Table 3.1. Selection of samples per district, division and location in different regions of
Kenyaa
District Divisions Locations Sub-locationsNakuru 2 (16) 2 (4); 2 (4) 2 (2), 3 (3); 1 (1), 1 (1)Nandi 2 (9) 2 (15); 2 (9) 3 (3); 3 (3); 3 (3), 2 (2)Nyeri 2 (7) 2 (5); 2 (7) 3 (4), 3 (4); 3 (7), 3 (4)Baringo 2 (14) 2 (8); 2 (5) 3 (3), 3 (3); 3 (3), 3 (3)Laikipia 2 (6) 2 (6); 2 (9) 1 (1), 1 (1); 2 (2), 3 (4)Narok 2 (8) 2 (4); 2 (5) 2 (2), 2 (2); 3 (3), 3 (4)Trans-Mara 2 (5) 2 (4); 2 (7) 3(3), 3 (4); 2 (2), 1 (1)Total 14 (65) 28 (92) 68 (78)aNumbers outside brackets represent numbers sampled while those in brackets represent
population totals.

Small ruminant production
54
each district were replicated at both the division and location levels, i.e., two
divisions and two locations per division were picked in each district using prior
information obtained from the field staff (Table 3.1). Most locations had three or
fewer sub-locations and all were sampled. For locations that contained more than
three sub-locations, three sub-locations were selected at random. Consequently, a
total of 14 divisions, 28 locations and 68 sub-locations were sampled representing
approximately 6% of all sub-locations in the seven districts (see Kosgey et al. (2004)
for further details).
Fig. 3.1. Map of Kenya showing districts surveyed (marked with grey circles)
5
60
30
63
8
9
54
27
50
17
53
44
40
37
21
64
65
20
25
26
42
24
22
14
3361
4846
3243
58
59
7
181
12
31
68
35 57
2
29
5651
15
11
66
10
696
13
473467
38
5249
16
23
36
43 3945
28
4119
62
55
0 500 Kilometers
S
N
EW
BARINGO65BOMET66BONDO67BUNGOMA68BURET69
BUSIA1BUTERE/MUMIAS2CENTRALKISII3EMBU4GARISSA5GUCHA6HOMABAY7ISIOLO8KAJIADO9KAKAMEGA10KEIYO11KERICHO12KIAMBU13KILIFI 14KIRINYAGA15KISUMU16KITUI 17KOIBATEK18KURIA19KWALE20LAIKIPIA21LAMU22LUGARI23MACHAKOS24MAKUENI 25MALINDI 26MANDERA27MARAGUA28MARAKWET29MARSABIT30MBEERE31MERUCENTRAL32MERUNORTH33
MERUSOUTH34MIGORI35MOMBASA36MOYALE37MTELGON38MURANGA39MWINGI 40NAIROBI 41NAKURU42NANDI 43NAROK44NYAMIRA45NYANDARUA46NYANDO47NYERI48RACHUONYO49SAMBURU50SIAYA51SUBA52TAITATAVETA53TANARIVER54TESO55THARAKA56THIKA57TRANSMARA58TRANSNZOIA59TURKANA60
UASINGISHU61VIHIGA62WAJIR63
WESTPOKOT64
KEY

Chapter 3
55
3.2.1.1. Household survey
The household survey used a set of structured questionnaires which were a
slightly modified version of those designed for livestock breed survey in the southern
African region (Rowlands et al., 2003). These questionnaires were designed to
obtain information from respondents on general household characteristics, purposes
of keeping small ruminants, animal breeds, traits of importance, breeding
management, flock sizes and flock structures, animal health, feeding management,
and marketing and prices of animals. Most questions were asked in the form of open
questions. The enumerator ticked the answers given by farmers against a prepared
list in the questionnaire, and then, where appropriate, asked the farmer to rank the
top three. The main exception was for the question pertaining to traits of perceived
importance. In this case the enumerator went through a list of predetermined traits
one by one and asked the farmer whether he considered the trait to be either a good,
average or poor characteristic of the breed(s) he/she kept, or to be a trait that was
not of importance or about which he/she had no opinion.
Sampling was done through clustering of households within a sub-location. A
cluster of households was formed within a given radius, the length of which
depended on the household density. Transects were drawn within the cluster to
make the sampling as random as possible. Only households with sheep and/or goats
were picked along the transects, skipping those that did not have any small
ruminants. A minimum of five households per sub-location owning sheep and/or
goats were sampled for the household survey. The sample number was increased
when there were more than 1,000 households in the sub-location according to the
last census. In this case a minimum of 0.5% of the households in the sub-location
were sampled. Data on households and human populations were obtained from the
Central Bureau of Statistics (CBS) 1999 census.

Small ruminant production
56
3.2.1.2. Market survey
An interview of butchers/traders was done alongside the household survey in
three districts (Baringo, Nakuru and Nandi) to establish meat prices of different
categories of animals (i.e., pure exotic, exotic X indigenous crosses and indigenous).
Butchers/traders within certain clusters of the household survey (and close by when
not occurring within) were interviewed. Where possible a minimum of five
butchers/traders were interviewed per sub-location.
3.2.2. Data analysis
Data were entered into a database in Access, the structure of which can be
found in Rowlands et al. (2003). For the purposes of analysis the farmers were
divided into two farming systems, namely smallholder and pastoral/extensive. A
further sub-division into small ruminant species ownership was also used, namely
those owning only sheep, those owning only goats, and those owning both sheep
and goats. Results are presented mainly in the form of descriptive tabular
summaries. Chi-square (χ2) or t tests were carried out as appropriate to assess the
statistical significance or otherwise of particular comparisons. Logistic regression
with terms for farming system and breed was used to compare the qualities of traits
(proportion of farmers ranking a trait to be good) across breeds.
Indices were calculated to provide overall ranking of (a) the purposes of
keeping sheep or goats and (b) the traits used for choosing rams and bucks
according to the formula:
Index = sum of [4 for rank 1 + 3 for rank 2 + 2 for rank 3 + 1 for a tick] given for an
individual purpose or trait divided by the sum of [4 for rank 1 + 3 for rank 2 +
2 for rank 1 + 1 for a tick] summed over all purposes or traits.
Similar indices were calculated for ranking importance of livestock by species and
source of cash income.

Chapter 3
57
3.3. Results
3.3.1. General household information
Four hundred and fifty nine respondents (218 smallholder and 241
pastoral/extensive farmers) were interviewed for the household survey. Of these 158
(48% and 22%, respectively, of the corresponding totals for smallholder and
pastoral/extensive farmers) owned only sheep, 83 (18% and 18%) owned only goats
and 218 (34% and 60%) owned both sheep and goats (Table 3.2). The majority of
the farmers (89%) were sedentary and the rest nomadic. The majority of
pastoral/extensive farmers (58%) indicated livestock to be their main activity (see
Table 3.3). The corresponding percentage of 46% for smallholders was significantly
lower ( 21χ = 5.91, P <0.05). Thirty three percent of smallholders and 25% of
pastoral/extensive farmers put crops first. Primary income from salary/wages ranked
third.
The importance of small ruminants in the two farming systems is
demonstrated in Table 3.4. Goats outranked cattle when goats were the only small
ruminant species. This was partly due to the fact that 40% of these farmers did not
own and, hence, rank cattle. Where both sheep and goats were owned each
species was ranked similarly behind cattle. Sheep were also ranked second behind
cattle when goats were not owned. Chickens were ranked third. In general, the
rankings of importance of sheep and goats were very similar for both smallholder
and pastoral/extensive farmers.

58
Table 3.2. Number of households by small ruminant species and farming system for the household survey, and numbers of
butchers/traders for the market survey Type of survey District Nakuru Nandi Nyeri Baringo Laikipia Narok Trans-Mara Total Main household survey
Farming system
Sheep Smallholder 41 40 18 1 3 2 0 105 Pastoral/extensive 19 0 13 2 1 18 0 53
Goats
Smallholder 8 7 13 8 3 1 0 40 Pastoral/extensive 6 0 2 20 6 4 5 43
Sheep and goats
Smallholder 19 14 17 11 10 1 1 73 Pastoral/extensive 16 0 6 19 17 50 37 145
Total
Smallholder 68 61 48 20 16 4 1 218 Pastoral/extensive 41 0 21 41 24 72 42 241
Overall total 109 61 69 61 40 76 43 459 Market survey
Butchers/tradersa 25 55 - 23 - - - 103
a(-) sign means survey not done in the district.

59
Table 3.3. Ranking of source of income within household by small ruminant species and farming system Income source Farming system Smallholder Pastoral/extensive Householdsa Householdsb Rankingc Householdsa Householdsb Rankingc
Sheep (n=105) (n=53) Livestock 103 45 0.42 52 33 0.49 Crops 99 37 0.39 41 10 0.31 Salary/wages 33 18 0.13 19 9 0.15 Relative’s remittances 10 1 0.02 3 0 0.01 Home industries 4 1 0.01 4 1 0.03 Otherd 5 3 0.02 1 0 0.01
Goats (n=40) (n=43)
Livestock 37 17 0.39 43 19 0.49 Crops 35 14 0.37 23 12 0.26 Salary/wages 18 8 0.17 15 9 0.17 Relative’s remittances 4 0 0.02 5 2 0.04 Home industries 3 1 0.02 1 0 0.01 Otherd 4 0 0.03 3 1 0.03
Sheep and goats (n=73) (n=145) Livestock 70 39 0.44 145 87 0.49 Crops 71 21 0.39 110 38 0.33 Salary/wages 20 9 0.10 39 14 0.10 Relative’s remittances 9 1 0.03 13 2 0.03 Home industries 4 1 0.02 7 0 0.01 Otherd 3 2 0.02 14 4 0.04
aHouseholds considering item to be an important source of income. bHouseholds ranking income source first. cIndex = sum of [3 for rank 1 + 2 for rank 2 + 1 for rank 3] divided by sum [3 for rank 1 + 2 for rank 2 + 1 for rank 3] for all sources of
cash income for a farming system. dIncludes business (livestock trading, pharmacy, rental houses and retail shops), bee-keeping and pastorhood (priest).

60
Table 3.4. Household ranking of the importance of livestock by small ruminant species and farming system
Species Farming system Smallholder Pastoral/extensive House-
holdsa House-holdsb
House-holdsc
Rankingd House-holdsa
House-holdsb
House-holdsc
Rankingd
Sheep (n=105) (n=53) Cattle 93 93 87 0.44 45 45 31 0.40 Sheep 105 105 12 0.34 52 52 21 0.40 Chicken 96 93 6 0.20 45 41 1 0.18 Othere 18 7 0 0.02 17 7 0 0.02
Goats (n=40) (n=43)
Cattle 23 23 21 0.31 27 27 18 0.30 Goats 40 40 18 0.43 43 43 23 0.47 Chicken 35 33 0 0.22 37 33 0 0.18 Othere 7 4 1 0.03 15 6 2 0.05
Sheep and goats (n=73) (n=145)
Cattle 66 65 49 0.39 135 133 86 0.40 Sheep 73 69 13 0.28 144 139 32 0.30 Goats 73 64 9 0.26 145 142 26 0.27 Chicken 72 19 2 0.07 103 15 0 0.02 Othere 11 2 0 0.00 71 4 1 0.01
aTotal households owning species. bHouseholds considering livestock species to be important (i.e., a rank of 1, 2 or 3). cHouseholds ranking livestock species first. dIndex = sum of [3 for rank 1 + 2 for rank 2 + 1 for rank 3] divided by sum [3 for rank 1 + 2 for rank 2 + 1 for rank 3] for all species for a farming system. eIncludes pigs, donkeys, rabbits, bees, fish, and other types of poultry (ducks, geese, guinea fowl and turkeys).

Chapter 3
61
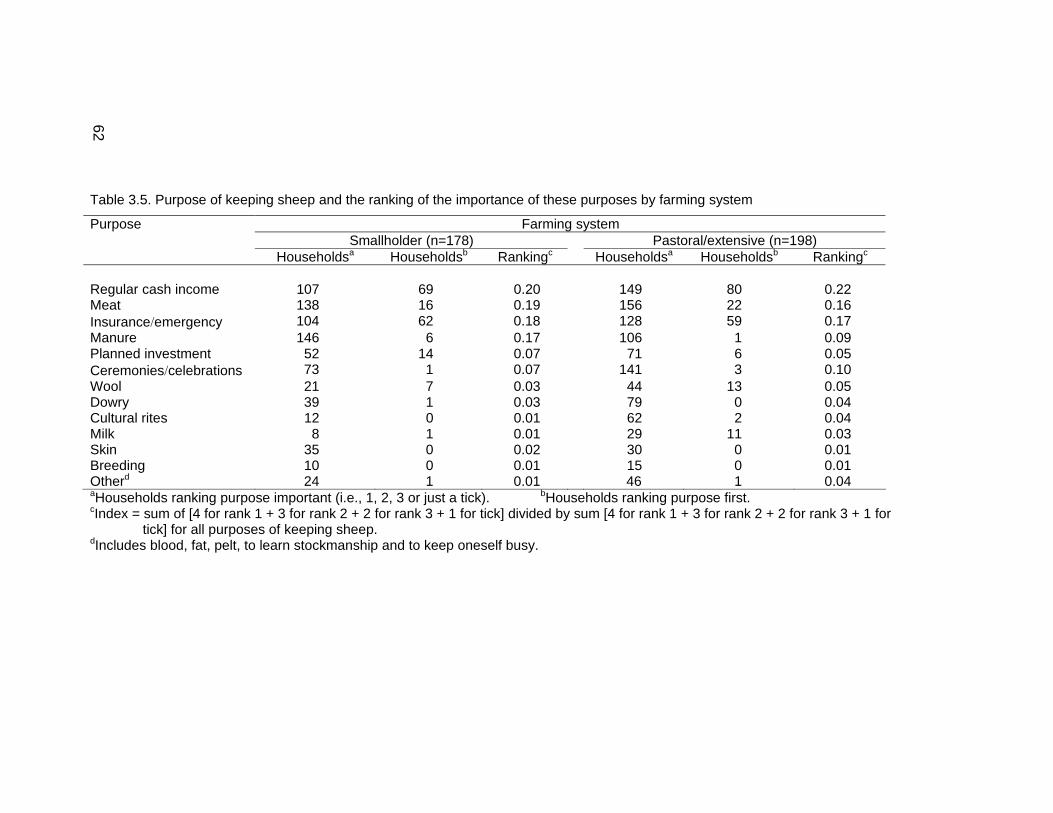
3.3.2. Purposes of keeping sheep and goats
Tables 3.5 and 3.6 present purposes of keeping sheep and goats,
respectively, and the ranking of the importance of these purposes by farming
system. The results indicate the relative importance to the farmers of tangible
benefits of farming sheep and goats (such as regular cash income, meat, manure
and, in the case of goats, milk) versus intangible benefits (such as the role of small
ruminants as an insurance against emergencies). Most smallholder and
pastoral/extensive farmers (on average 72%) put first the keeping of sheep either for
regular cash income or as an insurance against emergencies. Although not
statistically different by a χ2 test the emphasis among pastoral/extensive farmers
tended to be towards regular cash income (Table 3.5). Manure received a higher
ranking among smallholder than pastoral/extensive farmers. For goats, regular cash
income featured most strongly as an insurance against emergencies (Table 3.6).
Only a few farmers kept sheep or goats primarily for breeding in both farming
systems, and this purpose was among the lowly ranked. An interesting purpose,
rarely reported in Kenya, is the milking of sheep, especially by the pastoral
communities where milking was ranked first by 6% of households (see Table 3.5).
None of the surveyed farmers kept goats for mohair.
Three hundred and fifty seven (78%) households reported small ruminant
sales within 12 months preceding the interview. Their income was spent on school
fees (32%), purchase of food (22%), farm investment (18%), medical expenses
(10%), off-farm investment (9%), social activities (5%) and re-stocking (4%). The
trend of expenditure in both farming systems was similar and generally comparable
across small ruminant species, except perhaps for smallholder sheep farmers who
appeared to be more selective in their expenditure. This may be due to small flock
sizes and hence less total income to share across the different areas of expenditure.
62
Table 3.5. Purpose of keeping sheep and the ranking of the importance of these purposes by farming system
Purpose Farming system Smallholder (n=178) Pastoral/extensive (n=198) Householdsa Householdsb Rankingc Householdsa Householdsb Rankingc
Regular cash income 107 69 0.20 149 80 0.22 Meat 138 16 0.19 156 22 0.16 Insurance/emergency 104 62 0.18 128 59 0.17 Manure 146 6 0.17 106 1 0.09 Planned investment 52 14 0.07 71 6 0.05 Ceremonies/celebrations 73 1 0.07 141 3 0.10 Wool 21 7 0.03 44 13 0.05 Dowry 39 1 0.03 79 0 0.04 Cultural rites 12 0 0.01 62 2 0.04 Milk 8 1 0.01 29 11 0.03 Skin 35 0 0.02 30 0 0.01 Breeding 10 0 0.01 15 0 0.01 Otherd 24 1 0.01 46 1 0.04 aHouseholds ranking purpose important (i.e., 1, 2, 3 or just a tick). bHouseholds ranking purpose first. cIndex = sum of [4 for rank 1 + 3 for rank 2 + 2 for rank 3 + 1 for tick] divided by sum [4 for rank 1 + 3 for rank 2 + 2 for rank 3 + 1 for
tick] for all purposes of keeping sheep. dIncludes blood, fat, pelt, to learn stockmanship and to keep oneself busy.

63
Table3.6. Purpose of keeping goats and the ranking of the importance of these purposes by farming system
Purpose Smallholder (n=113) Pastoral/extensive (n=188) Householdsa Householdsb Rankingc Householdsa Householdsb Rankingc
Regular cash income 80 51 0.21 154 75 0.24 Meat 80 8 0.15 166 29 0.19 Insurance/emergency 69 23 0.14 122 50 0.17 Manure 97 3 0.15 91 0 0.07 Ceremonies/celebrations 45 0 0.05 117 2 0.09 Milk 62 18 0.13 80 20 0.09 Planned investment 39 7 0.06 59 9 0.05 Dowry 30 0 0.03 60 1 0.03 Skin 34 0 0.03 39 0 0.02 Breeding 17 2 0.03 6 0 0.00 Mohair 0 0 0.00 0 0 0.00 Cultural rites 5 0 0.00 43 2 0.03 Otherd 27 1 0.03 33 0 0.02
aHouseholds ranking purpose important (i.e., 1, 2, 3 or just a tick). bHouseholds ranking purpose first. cIndex = sum of [4 for rank 1 + 3 for rank 2 + 2 for rank 3 + 1 for tick] divided by sum [4 for rank 1 + 3 for rank 2 + 2 for rank 3 + 1 for
tick] for all purposes of keeping goats. dIncludes blood, fat, pelt and to learn stockmanship, shelter (clothing), bartering with honey, to keep oneself busy, and control (pick) ticks.

Small ruminant production
64
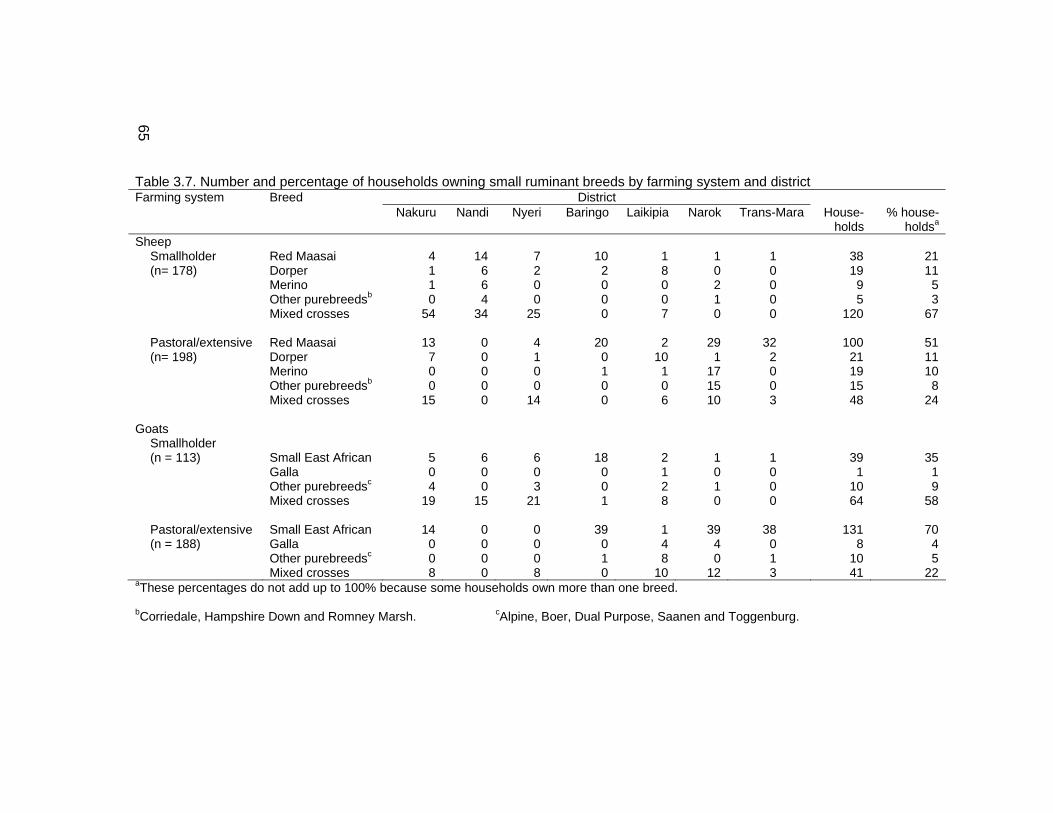
3.3.3. Breeds and breeding management
3.3.3.1. Breeds kept, their origin, lifespan, and traits of economic importance
The number of households that owned different small ruminant breeds by
farming system and district are shown in Table 3.7. Households owning mixed
crosses were predominant in smallholder production for both sheep and goats,
followed by the indigenous genotypes. In the pastoral/extensive system the situation
was reversed with most households owning the indigenous genotypes (mainly Red
Maasai - 51% of the households and Small East African goat - 70%). Animals were
mostly inherited or bought. The exotic genotypes were bought mostly from the
market or commercial farms but the indigenous ones were generally inherited. Half of
both smallholder and pastoral/extensive farmers reared their own males for breeding
purposes on the farm (51% for smallholder and 52% for pastoral/extensive farmers
for sheep; 43 and 62% for goats, respectively). When males were not reared,
smallholders tended to borrow males (29% for sheep; 28% for goats) whereas
pastoral/extensive farmers tended to buy them (28% for sheep; 20% for goats).
Artificial insemination was not used in any of the flocks surveyed. In areas where
families mixed and herded animals on common fields, matings took place at random
with males present in the flocks. The males were then referred to as communal.
Such mating, however, was reported by only 4% of farmers on average. Males were
kept until about 2-3 years of age on average and up to a maximum of 8 and 6 years
for sheep and goats, respectively, in both farming systems. Female sheep and goats
were kept until about 4-5 years old on average, and up to a maximum of 14 years for
sheep and 12 years for goats in smallholder, and up to a maximum of 10 years for
sheep and 15 years for goats in pastoral/extensive systems.
The ranking of the importance of different traits as perceived by farmers for
each breed in the two farming systems are presented in Tables 3.8 and 3.9. A range
of traits: growth rate, size, shape, drought tolerance, meat quality, fertility, disease
65
Table 3.7. Number and percentage of households owning small ruminant breeds by farming system and district Farming system Breed District Nakuru Nandi Nyeri Baringo Laikipia Narok Trans-Mara House-
holds% house-
holdsa
Sheep Smallholder Red Maasai 4 14 7 10 1 1 1 38 21 (n= 178) Dorper 1 6 2 2 8 0 0 19 11 Merino 1 6 0 0 0 2 0 9 5 Other purebreedsb 0 4 0 0 0 1 0 5 3 Mixed crosses 54 34 25 0 7 0 0 120 67 Pastoral/extensive Red Maasai 13 0 4 20 2 29 32 100 51 (n= 198) Dorper 7 0 1 0 10 1 2 21 11 Merino 0 0 0 1 1 17 0 19 10 Other purebreedsb 0 0 0 0 0 15 0 15 8 Mixed crosses 15 0 14 0 6 10 3 48 24
Goats Smallholder (n = 113) Small East African 5 6 6 18 2 1 1 39 35 Galla 0 0 0 0 1 0 0 1 1 Other purebreedsc 4 0 3 0 2 1 0 10 9 Mixed crosses 19 15 21 1 8 0 0 64 58 Pastoral/extensive Small East African 14 0 0 39 1 39 38 131 70 (n = 188) Galla 0 0 0 0 4 4 0 8 4 Other purebreedsc 0 0 0 1 8 0 1 10 5 Mixed crosses 8 0 8 0 10 12 3 41 22
aThese percentages do not add up to 100% because some households own more than one breed. bCorriedale, Hampshire Down and Romney Marsh. cAlpine, Boer, Dual Purpose, Saanen and Toggenburg.

Small ruminant production
66
and heat tolerance, prolificacy and temperament were all considered important for
both sheep and goats in both farming systems and across the different genotypes
(Table 3.8). Other traits, including milk, were of lower importance and there were
inconsistencies in the perceptions of the qualities of two of these traits (colour and
horns) by smallholder and pastoral/extensive farmers. Compared with other pure
breeds Red Maasai were rated highly by both smallholder and pastoral/extensive
farmers in terms of drought and heat tolerance, but there were no perceived breed
differences in terms of disease tolerance (Table 3.8). In contrast, other pure breeds
(including Dorpers and Merinos) were considered generally to have better growth
rate, shape and fertility than Red Maasai. Red Maasai were judged to have poor
prolificacy but the rating of prolificacy levels for other breeds varied according to
farming system (data not shown). Crosses were generally considered unfavourably
relative to indigenous breeds for most traits, and in terms of size, growth and heat
tolerance they were judged to be significantly poorer than Red Maasai. Similar
trends were observed for goats (Table 3.8). Small East African goats were
considered to be significantly smaller and to have poorer fertility and prolificacy, but
to have better drought tolerance than other pure breeds. In general, crosses were
perceived less favourably than indigenous pure breeds. Table 3.9 gives the odds
ratios and their 95% confidence intervals for seven of the most commonly reported
traits in Table 3.8. The odds ratio presented is a measure of the relative perception
for a trait in a given breed when compared with the Red Maasai for sheep and the
Small East African for goats. Essentially, if the odds ratio overlaps one (1) then there
is no difference in the stated perception of the traits, a better perception when
greater than one and a lower perception when less than one. The odds ratio is
significant when its 95% confidence interval excludes one (1) (Bebe et al., 2003). For
instance, the odds ratio of a farmer rating highly the growth rate of a Dorper was
8.56 that of a farmer rating highly the growth rate of a Red Maasai (Table 3.9). In
contrast, the odds ratio for crosses compared with the Red Maasai was only 0.50. In
terms of drought and heat tolerance odds ratios for other breeds and crosses
compared with Red Maasai ranged from 0.17 to 0.65. Similar patterns were evident
for other pure breeds of goats and crosses compared with the Small East African.

67
Table 3.8. Number of households perceiving different traits for each sheep and goat breed to be important (i.e., poor + average + good)
and (in parentheses) the percentage of households perceiving the trait to be good
Trait Sheep Goats Red Maasai
(n=138) Dorper (n=40)
Merino (n=28)
Other purea
(n=20) Crosses (n=168)
Small East African (n=170)
Other pureb
(n=29) Crosses (n=105)
Size 133 (59)
38(79)*
27 (70)
20 (75)
161 (43)*
166 (54)
28 (75)*
104 (43)
Disease tolerance 131 (75)
37(65)
26 (73)
19 (53)
157 (62)
163 (83)
27 (67)
99 (68)*
Drought tolerance 131 (81)
39(69)
27 (56)**
20 (45)***
152 (70)
165 (88)
28 (68)*
91 (77)
Growth 127 (56)
38(92)***
28 (89)**
20 (80)*
153 (44)**
162 (57)
28 (93)**
102 (40)*
Fertility 132 (62)
35(94)**
26 (73)
19 (95)*
149 (48)
161 (59)
26 (96)**
93 (52)
Heat tolerance 126 (79)
36(56)**
27 (63)
18 (39)***
138 (59)**
157 (79)
23 (74)
83 (70)
Shape 121 (62)
37(89)**
27 (81)*
20 (65)
126 (44)
153 (69)
26 (73)
91 (41)***
Prolificacyc 126 (29)
32(47)
26 (46)
17 (41)
136 (17)
155 (34)
25 (80)***
59 (34)

68
Table 3.8. (continued)
Trait Sheep Goats Red Maasai Dorper Merino Other purea Crosses Small East African Other pureb Crosses Temperament 114
(66) 30
(60) 27
(78) 18
(94)* 127 (60)
138 (54)
28 (54)
83 (43)***
Meat quality 103 (81)
34 (100)
24 (79)
19 (100)
96 (70)
152 (88)
24 (96)
60 (70)*
Colourc 78 (71)
31 (81)
21 (81)
13 (92)
72 (46)
86 (80)
23 (91)
42 (60)
Hornsc 43 (56)
10 (70)
8 (50)
1 (0)
25 (36)
67 (55)
19 (63)
32 (25)*
Milk 33 (27)
12 (92)**
16 (56)*
13 (38)
19 (63)*
105 (27)
23 (65)*
63 (27)
Wool 0 (0)
0 (0)
13 (77)
8 (75)
31 (39)
- - -
Fat 2 (0)
1 (100)
0 (0)
0 (0)
2 (0)
- - -
*** P<0.001; **P<0.01; *P<0.05 when compared with Red Maasai (sheep) or Small East African (goats) as the reference breed in a
logistic regression analysis of r/n, where n = number of farmers rating a trait important and r = number of farmers rating a trait good.
Individual breed X farming system r/n values (10 for sheep and 6 for goats) were used in the analysis with terms for breed and farming
system in the model. a Breeds: Corriedale, Hampshire Down, Romney Marsh. b Breeds: Alpine, Boer, Dual Purpose, Galla, Saanen, Toggenburg. cResponses for sheep for smallholder and pastoral/extensive farmers were not consistent for prolificacy, colour and horns and so no
overall significance values are given for sheep.

69
Table 3.9. Odds ratios and 95% confidence limits (in parentheses) of farmers’ perceptions of ‘good’ for seven of the traits considered to
be ‘important’ (see Table 3.8), comparing each breed with Red Maasai (for sheep) and Small East African (for goats) as
reference breeds
Trait Sheep Goats Dorper Merino Other pure Crosses Other pure Crosses Size 2.74
(1.16, 6.48)1.70
(0.69, 4.17)2.11
(0.73, 6.16)0.57
(0.35, 0.95)2.60
(1.04, 6.46)0.66
(0.39, 1.13)Disease tolerance 0.65
(0.29, 1.42)0.91
(0.35, 2.37)0.37
(0.14, 1.0)0.62
(0.36, 1.07)0.44
(0.18, 1.09)0.52
(0.28, 0.97)Drought tolerance 0.57
(0.25, 1.29)0.30
(0.12, 0.72)0.19
(0.07, 0.51)0.65
(0.36, 1.19)0.32
(0.12, 0.82)0.63
(0.30, 1.31)Growth 8.56
(2.50, 29.29)6.56
(1.88, 22.86)3.24
(1.02, 10.28)0.50
(0.29, 0.84)9.57
(2.19, 41.81)0.49
(0.29, 0.84)Fertility 11.64
(2.65, 51.19)1.67
(0.65, 4.29)10.86
(1.41, 83.53)0.71
(0.42, 1.20)21.11
(2.76, 161.65)1.01
(0.58, 1.78)Heat tolerance 0.35
(0.16, 0.77)0.47
(0.19, 1.14)0.17
(0.06, 0.49)0.42
(0.23, 0.76)0.77
(0.28, 2.12)0.71
(0.37, 1.35)Shape 6.01
(1.96, 18.41)2.86
(1.00, 8.16)1.16
(0.43, 3.14)0.67
(0.38, 1.18)1.28
(0.50, 3.29)0.32
(0.18, 0.58)

70
Table 3.10. Ranking of traits when choosing breeding rams/bucks by species and farming system in the two farming systemsa
Trait Sheep Goats Smallholder
(n=178) Pastoral/extensive
(n=198) Smallholder
(n=113) Pastoral/extensive
(n=188) House-
holdsb Ranking House-
holdsb Ranking House-
holdsb Ranking House-
holdsb Ranking
Size 109 0.25 164 0.35 71 0.26 156 0.35 Performance 96 0.21 137 0.21 67 0.26 136 0.23 True to breed 80 0.20 79 0.13 47 0.18 60 0.11 Shape 72 0.11 111 0.13 43 0.10 104 0.13 Availability 56 0.13 28 0.04 29 0.09 23 0.03 Temperament 47 0.07 72 0.07 28 0.06 64 0.07 Colour 21 0.03 63 0.06 18 0.03 53 0.06 Horns 5 0.00 17 0.01 12 0.02 20 0.02 Otherc 1 0.00 1 0.00 1 0.00 1 0.00 aIndex = sum of [4 for rank 1 + 3 for rank 2 + 2 for rank 3 + 1 for tick] divided by sum [4 for rank 1 + 3 for rank 2 + 2 for rank 3 + 1 for
tick] for all traits. bHouseholds ranking trait important (i.e., 1, 2, 3 or just a tick). cHealth status and adaptability to climatic conditions.

Chapter 3
71
The importance of different traits when choosing a breeding ram or buck is
shown in Table 3.10. Size and performance ranked as the most important traits in
the choice of breeding males. ‘True to breed’ and availability featured more
prominently among smallholder than pastoral/extensive farmers.
3.3.3.2. Type of mating, average age at first mating, average flock sizes and flock
structures
Uncontrolled mating within the household’s flock was predominant (on
average 46% for smallholder and 58% for pastoral/extensive farmers for sheep; 42
and 54% for goats). Group mating, in which a group of ewes or does is left with one
or more rams or bucks to mate for a predetermined period, was the other main
system practised by pastoral/extensive farmers (42% for sheep; 36% for goats).
Smallholder households practised hand mating (25% for sheep; 37% for goats),
more so than the pastoral/extensive households. Smallholder farmers mated animals
for the first time at about 10-11 months of age both for males and females. A slightly
wider age range of 9-12 months was reported in pastoral/extensive farming.
Smallholders owned an average of 2.3±2.5 (SD) lambs, 1.7±2.7 weaners and
4.4±4.7 ewes and rams with a maximum flock size of 18 lambs, 18 weaners and 30
adults. The corresponding numbers for pastoral/extensive farmers were much larger:
14.5±24.3, 13.6±24.8 and 36.6±74.6, respectively with a maximum flock size
reported of 150 lambs, 170 weaners and 594 adults. For goats the smallholders
owned an average of 2.6±3.5 kids, 2.8±4.8 weaners and 5.7±7.9 adults (maximum
16 kids, 21 weaners and 33 adults). The corresponding figures for the
pastoral/extensive systems were 9.2±12.2, 8.5±11.4 and 23.1±31.5, respectively
(maximum 100 kids, 70 weaners and 200 adults). There were no overall significant
differences between flock sizes for the two species within the two farming systems.
However, by paired t-test comparison of means, farmers with both sheep and goats
owned more of the latter than the former (young animals and weaners (P<0.001);
adults (P<0.01)).

Small ruminant production
72
3.3.4. Animal health and feeding management
Over 98% of the households reported incidences of diseases in smallholder
and pastoral/extensive farming systems (Table 3.11). Pneumonia, helminthosis, tick-
borne diseases, diarrhoea and foot-rot were the most commonly reported. All these
diseases were very prevalent among pastoral/extensive systems, but, except for
pneumonia and, to a lesser extent, helminthosis, they did not assume the same
importance among smallholders (P<0.001 by χ2 tests). Most farmers sought
veterinary help, mainly from the government veterinary service, private veterinarians
and drug suppliers, with drug suppliers featuring predominantly among
pastoral/extensive farmers (Table 3.11). Anthelmintics and antibiotics were the most
common forms of treatment applied. Thirty three and fifty eight percent of
smallholder and pastoral/extensive farmers reported use of anthelmintics for sheep.
Corresponding figures for goats were 27% and 35%, respectively. Uses of antibiotics
were reported by 29% and 92% of smallholder and pastoral/extensive farmers for
sheep and by 26% and 85%, respectively for goats. Acaricide was mostly used to
control ecto-parasites, applied to sheep virtually always by dipping but to goats
mainly by spraying. Farmers keeping sheep reported visits from extension agents
with an average of 3 (smallholder) and 4 (pastoral/extensive) visits per household
within the last 12 months. On average 9% of the farmers attended one or more
courses given by an extension agent on issues pertaining to small ruminants.
Over 95% of the farmers (on average across species and farming systems)
fed supplements during both dry and wet seasons. Most supplementation in
smallholder farming systems was in the form of roughage (in dry season: sheep –
64% of farmers; goats – 85%; sheep and goats – 73%; in wet season: sheep – 53%;
goats – 59%; sheep and goats – 56%) and minerals (in dry season: sheep – 97%;
goats – 90%; sheep and goats – 95%; in wet season: sheep – 94%; goats – 82%;
sheep and goats – 89%). A smaller percentage of pastoral/extensive than
smallholder farmers fed supplement roughage (on average 33% in the dry season
and 23% in the wet season). They also largely fed mineral supplements (on average

73
Table 3.11. Number of households reporting prevalent disease and source of veterinary services by species and farming system
Disease Sheep Goats Smallholder
(n=178) Pastoral/extensive
(n=198) Smallholder
(n=113) Pastoral/extensive
(n=188) Pneumonia 74 (42)a 56 (28) 34 (30) 77 (41) Helminthosis 34 (19) 73 (37) 17 (15) 46 (25) Tick-borne 14 (8) 75 (38) 7 (6) 61 (33) Diarrhoea 13 (7) 58 (29) 8 (7) 46 (25) Foot-rot 14 (8) 37 (19) 3 (3) 26 (14) Skin diseases 4 (2) 16 (8) 1 (1) 8 (4) Othersb 16 (9) 66 (33) 14 (12) 55 (29) Households reporting diseases 175 (98) 195 (99) 113 (100) 182 (97) Veterinary service Government veterinarian 77 (43) 88 (44) 62 (55) 94 (50) Private 94 (53) 40 (20) 58 (51) 2 (15)9 Drug supplier 71 (40) 143 (72) 50 (44) 131 (70) Government extension officers 39 (22) 39 (20) 36 (32) 40 (21) Otherc 13 (7) 31 (16) 7 (6) 31 (17) aPercentage of households presented in parentheses. bIncludes abnormal births, anthrax, bloat, blue tongue, eye infections, fever, flukes, foot and mouth disease, mastitis, nasal discharge,
orf, plant poisoning, pox, pulpy kidney, rinderpest, salmonellosis, staggers gid, tetanus, trypanosomosis, wounds and abscess, and
yellow fever. cIncludes non-governmental organisations (NGO’s), community-based animal health workers and other animal health providers.

Small ruminant production
74
94% of farmers in the dry season and 85% in the wet season). Concentrate feed was
also purchased by smallholders (in dry season: sheep – 13%; goats – 44%; sheep
and goats – 25%; in wet season: sheep – 10%; goats – 36%; sheep and goats –
16%). Pastoral/extensive farmers, however, rarely purchased concentrates (on
average 7% of farmers over both seasons).
3.3.5. Marketing and prices
Farmers sold their stock primarily to butchers, secondly to other farmers,
thirdly at auctions, but hardly ever directly to abattoirs or through other routes.
Respectively 74% and 76% of smallholder and pastoral/extensive sheep farmers did
not have a preference for a particular season for selling their animals. Corresponding
percentages for goats averaged 84%. The remainder either sold animals in the wet
or dry seasons only. Farmers selling during the dry season slightly outnumbered
those selling in the wet season. Pure exotic and indigenous X exotic genotypes, in
that order, fetched higher prices than indigenous genotypes for both species
(P<0.001) (Table 3.12) but prices varied significantly across districts, especially for
sheep (all genotypes) and indigenous goats. The average price ratios for indigenous
to indigenous X exotic and exotic genotypes were 1:1.3:1.4 for male and female
weaner sheep, and 1:1.2:1.5 and 1:1.3:1.4 for male and female adult sheep,
respectively. Corresponding ratios for goats were 1:1.2:1.3 for weaners and 1:1.1:1.3
and 1:1.2:1.3 for male and female adults, respectively. Generally, farmers preferred
meat from exotic sheep and their crosses to that from indigenous breeds. In contrast,
most farmers preferred indigenous goat meat to that from exotics and their crosses.
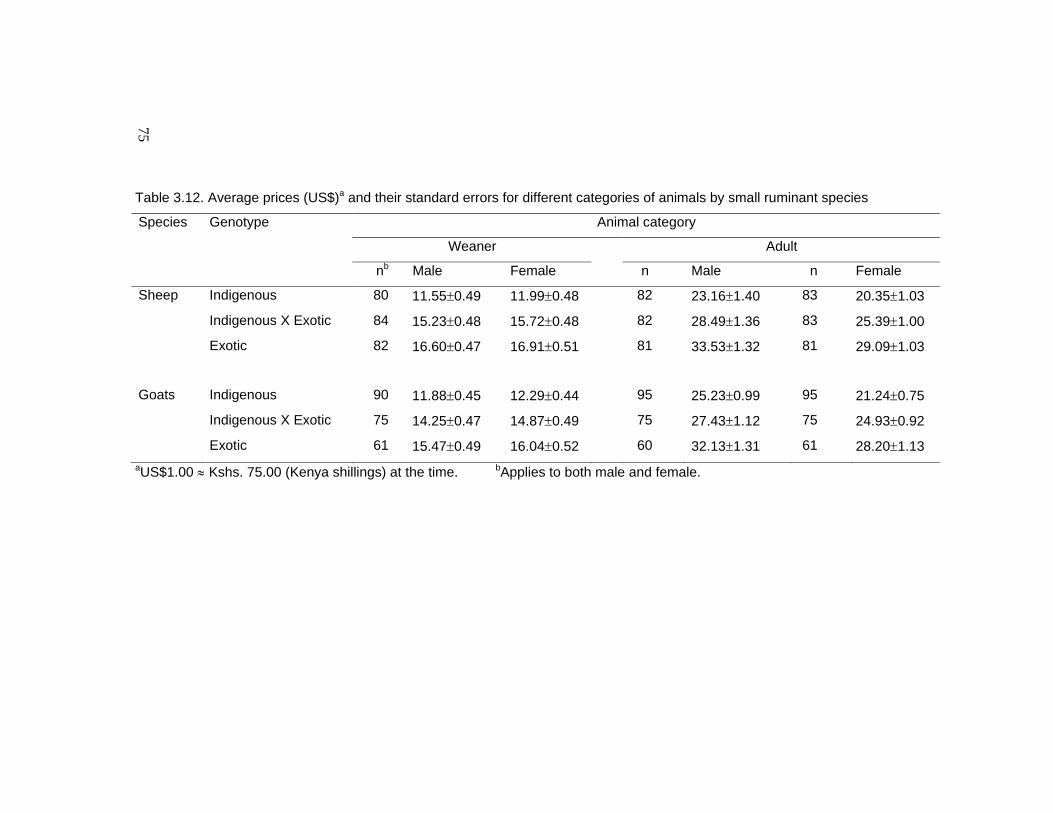
75
Table 3.12. Average prices (US$)a and their standard errors for different categories of animals by small ruminant species
Species Genotype Animal category
Weaner Adult
nb Male Female n Male n Female
Sheep Indigenous 80 11.55±0.49 11.99±0.48 82 23.16±1.40 83 20.35±1.03
Indigenous X Exotic 84 15.23±0.48 15.72±0.48 82 28.49±1.36 83 25.39±1.00
Exotic 82 16.60±0.47 16.91±0.51 81 33.53±1.32 81 29.09±1.03
Goats Indigenous 90 11.88±0.45 12.29±0.44 95 25.23±0.99 95 21.24±0.75
Indigenous X Exotic 75 14.25±0.47 14.87±0.49 75 27.43±1.12 75 24.93±0.92
Exotic 61 15.47±0.49 16.04±0.52 60 32.13±1.31 61 28.20±1.13 aUS$1.00 ≈ Kshs. 75.00 (Kenya shillings) at the time. bApplies to both male and female.
Small ruminant production
76
3.4. Discussion
3.4.1. Overview
It is important to have good understanding of a production system and the
relative importance of the different constraints prior to initiating any genetic
improvement programme (Baker and Gray, 2003). The purpose of the present
survey was to provide a better understanding of smallholder and pastoral/extensive
production systems in the tropics, by taking Kenya as an example. Smallholder
farmers are found mainly in the medium- to high-potential areas (Rege, 1994).
Smallholder farmers tend to keep animals for family needs, rather than purely as an
economic enterprise. In this system, livestock may provide agricultural inputs, such
as manure, and render the enterprise more secure by using residual capacities of
production factors with low opportunity cost such as non-arable land, excess labour,
by converting crops and crop residues into high value animal products and by
balancing production and market risks (Jahnke, 1982). The importance of livestock
to the production system is indicated in the present study in which 46% of the
smallholders put livestock as their primary activity compared with 33% who put crops
first. Pastoralist farmers rely even more on livestock as their main source of
livelihood (58% in the present study) and usually own relatively large numbers of
animals under extensive or communal grazing and management. They are found
mainly in the medium- to low-potential areas. In recent times, pastoralist
communities, especially in the medium potential areas, have been changing from
purely keeping livestock towards agro-pastoral systems. This change is seen in the
present study where 25% of the pastoral/extensive farmers put crop production as
their main activity. Encroachment of crop farmers from other communities and
adoption of crop-based food by the pastoral communities are now common features
in the districts surveyed.
The results of the survey revealed a number of pertinent issues (i.e.,
opportunities and constraints) that, if addressed adequately, could help in developing
effective small ruminant breeding programmes and in increasing the general

Chapter 3
77
productivity of the animals. Small ruminant production was seen not only to be
important by both smallholder and pastoral/extensive farmers, ranking closely behind
cattle, but also to provide a variety of benefits ranging from tangible to intangible
ones. This agrees with other observations (Field, 1985; Okello, 1985; Jaitner et al.,
2001; Seleka, 2001). This knowledge of the reasons for keeping small ruminants is a
prerequisite for deriving operational breeding goals (Jaitner et al., 2001). Indeed,
ignorance of this aspect has been a major constraint in the lack of success in genetic
improvement programmes attempted in the tropics (Sölkner et al., 1998; Rewe et al.,
2002). The importance that farmers attach to the income that can be generated from
small ruminants and the variety of ways in which they use it, however, suggest that
genetic improvement programmes could, if carefully planned, have good chances of
success. One interesting purpose of sheep production observed by some farmers in
this survey, and one rarely reported, is a requirement for milk, especially by the
pastoral communities.
3.4.2. Biological aspects
3.4.2.1. Breeds and breeding management
Availability of animals with good genetic potential, a point raised by farmers at
report-back meetings at the end of the survey, is a constraint to productivity of small
ruminants in the tropics. However, the large percentage of pastoral/extensive
farmers with flocks of indigenous breeds (e.g., Red Maasai sheep and Small East
African goats) provides a potential for good genetic material. Farmers in the current
survey either inherited their males and reared them themselves for breeding
purposes or bought or borrowed them. Keeping of small ruminants for breeding
purposes was lowly ranked. The predominance of uncontrolled mating in both
farming systems and the small flock sizes in smallholder production, as discussed by
Seleka (2001), increases the level of inbreeding. Communal herding, which allows
breeding females to mix with breeding males from other flocks, can minimise
inbreeding (Jaitner et al., 2001), but this appears to have been rarely practised
Small ruminant production
78
among the farmers in this survey. Some males were kept up to 6-8 years of age
which may not be sound production practice, especially if males are allowed to mate
their own daughters. Size, performance and true to breed type ranked as the most
important traits in the choice of breeding males. Whereas introduced pure breeds
were generally considered better in size, growth rate, shape and fertility than the
indigenous Red Maasai sheep and, the Small East African goat, they were rated
poor in terms of drought and heat tolerance (Table 3.8 and 3.9), traits that are
important in the harsh feed and temperature conditions of the tropics. The crosses,
compared to the indigenous genotypes, were disadvantaged throughout most traits
(Table 3.9). This is in agreement with previous observations that crossbreds are
poorly adapted to the low-input traditional production systems of the tropics (Mason
and Buvanendran, 1982; Iñiguez, 1998; Rewe et al., 2002; Wollny et al., 2002;
Ayalew et al., 2003). From the findings in the current study, it would to be possible to
select for faster growth rate, good size and conformation within indigenous breeds
whilst at the same time maintaining the superiority of their adaptability traits.
3.4.2.2. Parasites and diseases
Poor health is the key limiting factor to productivity of sheep and goats in the
tropics and the extent of the problem is demonstrated in this study. Most
smallholders appeared to use government or private veterinarians, but a significant
proportion of pastoral/extensive farmers appeared to depend on drug suppliers; this
raises some doubts about the accurate diagnosis of disease. The number of
extension visits to address the problems pertaining to the farming of small ruminants,
however, was found to be minimal. Maximum productivity in a given system of
production emerges when disease control is optimal (Gatenby, 1986). Thus,
healthcare is an important problem to consider before genetic programmes can be
seriously contemplated. Community-based animal health programmes may be one
way forward (Njoro, 2001), and wider utilisation of indigenous breeds tolerant to
disease another (Baker and Gray, 2003). Farmers did not discriminate between
breeds in terms of disease tolerance (Table 3.8). This appears to contradict recent

Chapter 3
79
studies that unequivocally showed the Red Maasai sheep and the Small East African
goat to be more tolerant than the introduced breeds in coastal Kenya (Baker et al.,
1998; 1999; 2003a and b). However, this could be due to the different environments
in which the study was done (see Baker et al., 2003a), or to the fact that disease
prevalence was so high that it overrode any breed preferences detectable by
farmers.
3.4.3. Ecological aspects
Inadequate feeding and poor quality feed are often regarded to be major
factors limiting sheep and goat production. Climate and season greatly influences
feed supply and quality of the feed. Unreliability of roughage production, especially
during drought periods, is also a problem. The current survey revealed, however,
that a high percentage of both smallholder and pastoral/extensive farmers fed
supplements during both dry and wet seasons, especially minerals. Roughage was
fed by many farmers in both production systems, but pastoral/extensive farmers
rarely purchased concentrates confirming that small ruminants tend to be kept in
low-input systems. Although the feed quality and quantity of many tropical grasses is
often inadequate (e.g., Carles, 1983; Gatenby, 1986; Charray et al., 1992), it would
appear from this survey that farmers are doing their best to attend to the nutrition of
their stock from their limited means. Use of genotypes that are adapted to efficiently
utilise poor quality feed (Baker and Rege, 1994) may be one option but this trait was
not included amongst those used to characterise breeds in this survey.
3.4.4. Socio-economic aspects
Although not studied in the present survey the different socio-cultural ways of
different communities (e.g., the Maasai of Narok and Trans-Mara districts and their
Samburu counterparts in Laikipia compared with Kikuyu smallholders of Nyeri) will
be important to consider in the adoption of any breeding programme. Previous
improvement programmes of small ruminants ignored this fact and ended up

Small ruminant production
80
unsatisfactorily (e.g., Sölkner et al., 1998; Rewe et al., 2002). The difficulty, however,
is that the infrastructure necessary for collection of reliable pedigree and
performance data does not exist (Kiwuwa, 1992) and, furthermore, it is unlikely that
performance recording is logistically feasible in large numbers of smallholder flocks
(Baker and Gray, 2003).
Farmers sold their stock primarily to butchers, and also to individual farmers
and at auctions, but hardly ever to abattoirs, suggesting possibilities of none-
competitive prices. Animals were often sold throughout the year, presumably often
when prices were low, and this supports the results of other reports indicating that ad
hoc sales of animals to meet emergencies prevail (e.g., Seleka, 2001). Farmers
would likely not adopt improved management practices whilst proceeds from sale of
animals are low (Seleka, 2001). Some farmers, however, only sold in dry or wet
seasons, indicating a necessity to explore the possibilities of organised marketing of
animals so that farmers can reap maximum benefit from sales. Current marketing
information in the tropics is largely informal and obtained by talking to buyers or
sellers who have conducted transactions. The fact that most butchers/traders were
paying premium prices for pure exotic and indigenous X exotic crosses of both
sheep and goats could influence the type of genotypes adopted by the farmers.
However, the relative sheep prices found in the current study are very similar to the
40-60% advantages observed by Baker et al. (2003a) in live weight for Dorper
versus Red Maasai sheep in a semi-arid environment in Kenya. Therefore, it is
possible that butchers or traders were paying more for heavier exotic animals or
exotic crosses (and not, for example, for any improved conformation) with the price
per kg probably constant across stock classes.
3.5. Conclusion
The results from the present survey reveal several constraints that need to be
taken into consideration when designing and implementing genetic improvement
programmes for sheep and goats. It is thus necessary to look at the production
system in a holistic way and involve target groups in devising effective small

Chapter 3
81
ruminant breeding programmes. An integrated systems approach to small ruminant
improvement is likely to be the best option. For example, in a study of adoption of
indigenous X exotic crossbred goats in smallholder production systems in Ethiopian
highlands, Ayalew et al. (2003) found that the non-genetic improvement strategies –
better feeding practices and greater attention to basic healthcare - were more
successful than genetic strategies alone. The ultimate beneficiary in that study was
the indigenous goat and not the exotic genotype that had been originally planned. If
any genetic improvement is appropriate in the smallholder or pastoral/extensive
environment in this study in Kenya, then emphasis of genetic improvement of the
indigenous genotype may prove to be the best option.
Acknowledgements
We are greatly indebted to The Netherlands Foundation for the Advancement
of Tropical Research (WOTRO) and the International Livestock Research Institute
(ILRI-Nairobi, Kenya) for financial assistance to carry out this study. We also greatly
acknowledge the support of the personnel of the Kenya’s Ministry of Agriculture and
Rural Development for successful logistic support and subsequent administration of
questionnaires to farmers. Co-operation of the farmers, butchers and traders from
the districts surveyed is warmly acknowledged. We greatly acknowledge Ms Sonal
Nagda (ILRI-Nairobi) for handling the database. Egerton University (Njoro, Kenya) is
gratefully acknowledged for granting the first author study leave.
References Ayalew, W., Rischkowsky, B., King, J.M., Bruns, E., 2003. Crossbreds did not
generate more net benefits than indigenous goats in Ethiopian smallholdings.
Agric. Sys. 76, 1137-1156.
Baker, R.L., Gray, G.D., 2003. Appropriate breeds and breeding schemes for sheep
and goats in the tropics: the importance of characterising and utilising disease
resistance and adaptation to tropical stresses. In: Sani, R., Gray, G.D., Baker,

Small ruminant production
82
R.L. (Eds.), Better Worm Control for Small Ruminants in Tropical Asia.
Australian Centre for International Agricultural Research (ACIAR), Monograph
No. xx. (In press).
Baker, R.L., Mwamachi, D.M., Audho, J.O., Aduda, E.O., Thorpe, W., 1998.
Resistance of Galla and Small East African goats in the sub-humid tropics to
gastrointestinal nematode infections and the peri-parturient rise in faecal egg
counts. Vet. Parasitol. 79, 53-64.
Baker, R.L., Mwamachi, D.M., Audho, J.O., Aduda, E.O., Thorpe, W., 1999. Genetic
resistance to gastro-intestinal nematode parasites in Red Maasai, Dorper and
Red Maasai X Dorper ewes in the sub-humid tropics. Anim. Sci. 69, 335-344.
Baker, R.L., Mugambi, J.M., Audho, J.O., Carles, A.B., Thorpe, W., 2003a.
Resistance to gastro-intestinal nematode parasites, productivity and
productive efficiency of Red Maasai and Dorper sheep in a humid and semi-
arid environment in Kenya: evidence for genotype by environment
interactions. Anim. Sci. (Submitted).
Baker, R.L., Nagda, S., Rodriguez-Zas, S.L., Southey, B.R., Audho, J.O., Aduda,
E.O., Thorpe, W., 2003b. Resistance and resilience to gastro-intestinal
nematode parasites and relationships with productivity of Red Maasai, Dorper
and Red Maasai X Dorper crossbred lambs in the sub-humid tropics. Anim.
Sci. 76, 119-136.
Baker, R.L., Rege, J.E.O., 1994. Genetic resistance to diseases and other stresses
in improvement of ruminant livestock in the tropics. In: Proceedings of the
Fifth World Congress on Genetics Applied to Livestock Production, vol. 20,
University of Guelph, Canada, 7-12 August, 1994, pp. 405-412.
Bebe, B.O., Udo, H.M.J., Rowlands, G.J., Thorpe, W., 2003. Smallholder dairy
systems in the Kenya highlands: breed preferences and breeding practices.
Livest. Prod. Sci. 82, 117-127.
Carles, A.B., 1983. Sheep Production in the Tropics. Oxford University Press, New
York, 213 pp.
CBS, 1999. Central Bureau of Statistics, Population and Housing Census. Nairobi,
Kenya.
Chapter 3
83
Charray, J., Humbert, J.M., Levif, J., 1992. Manual of Sheep Production in the
Tropics. CTA and C.A.B. International, Wallingford, UK, 187 pp.
Field, C.R., 1985. The importance to Rendille subsistence pastoralists of sheep and
goats in Northern Kenya. In: Wilson, R.T., Bourzat, D. (Eds.), Small ruminants
in African agriculture, Proceedings of a Conference held at ILCA, Addis
Ababa, Ethiopia, 30 September - 4 October, 1985, pp. 188-198.
Gatenby, R.M., 1986. Sheep Production in the Tropics and Sub-Tropics. Longman
Inc., New York, 351 pp.
Iñiguez, L., 1998. Community breeding programmes for small ruminants in the
Andean region. In: Proceedings of the Sixth World Congress on Genetics
Applied to Livestock Production, vol. 25, Armidale, NSW, Australia, 11-16
January, 1998, pp. 249-256.
Jahnke, H.E., 1982. Livestock Production Systems and Livestock Development in
Africa. Kieler Wissenschaftsverlag Vauk, Kiel, Federal Republic of Germany,
253 pp.
Jaitner, J., Sowe, J., Secka-Njie, E., Dempfle, L., 2001. Ownership pattern and
management practices of small ruminants in The Gambia - implications for a
breeding programme. Small Rumin. Res. 40, 101-108.
Kiwuwa, G.H., 1992. Breeding strategies for small ruminant productivity in Africa. In:
Rey, B., Lebbie, S.H.B., Reynolds, L. (Eds.), Small ruminant research and
development in Africa, Proceedings of the First Biennial Conference of the
African Small Ruminant Research Network, ILRAD, Kenya, 10-14 December,
1990, pp. 423-434.
Kosgey, I.S., Rowlands, G.J., Baker, R.L., 2004. Small ruminant production in the
tropics: A study of smallholder and pastoral/extensive farming systems.
Monograph No. xx, ILRI-Nairobi, Kenya. (In preparation).
Mahanjana, A.M., Cronjé, P.B., 2000. Factors affecting goat production in a
communal farming system in Eastern Cape region of South Africa. South Afr.
J. Anim. Sci. 30(2), 149-154.
Mason, I.L., Buvanendran, V., 1982. Breeding Plans for Ruminant Livestock in the
Tropics. FAO Anim. Prod. Health Paper, 34, Rome, Italy, 89 pp.

Small ruminant production
84
Mucuthi, M.M., Munei, K., Sharma, K.C., 1992. The contribution of small ruminant
production to household income, with special emphasis on sheep production,
for small scale farmers in the ASAL: a case study of Laikipia West. In:
Proceedings of the Tenth Scientific Workshop of the Small Ruminant
Collaborative Research Support Program (SR-CRSP) held at ILRAD, Nairobi,
Kenya, 26-27 February, 1992, pp. 109-116.
Mwendia, C.W., 1997. Review of Kenyan Agricultural Research, vol. 35, Sheep and
Goats. CAZS, University of Wales, Gwynedd, UK, 129 pp.
Njoro, J.N., 2001. Community initiatives in livestock improvement: the case of
Kathekani, Kenya. In: Community-based management of animal genetic
resources, Proceedings of the Workshop held in Mbabane, Swaziland, 7-11
May, 2001, pp. 77-84.
Okello, K.L., 1985. A survey of the productivity and functions of goats in Uganda. In:
Wilson, R.T., Bourzat, D. (Eds.), Small ruminants in African agriculture,
Proceedings of a Conference held at ILCA, Addis Ababa, Ethiopia, 30
September - 4 October, 1985, pp. 208-217.
Otieno, L., Ackello-Ogutu, C., Mullins, G., Reynolds, L., 1993. Farmers’ reasons for
owning small ruminants in a case study of small ruminant production and
marketing in the semi-humid zone of Kaloleni division, Coast province. In:
Proceedings of the Eleventh Scientific Workshop of the Small Ruminant
Collaborative Research Support Program (SR-CRSP), ILRAD, Nairobi,
Kenya, 3-4 March, 1993, pp. 189-193.
Peeler, E.J., Omore, A.O., 1997. Manual of Livestock Production Systems in Kenya -
Cattle, Sheep and Goat Systems. Second edition, DFID/KARI National
Agricultural Research Project II. National Veterinary Research Centre, Kikuyu,
Kenya, 138 pp.
Rege, J.E.O., 1994. Indigenous African small ruminants: a case for characterization
and improvement. In: Lebbie, S.B.H., Rey, B., Irungu, E.K. (Eds.), Small
ruminant research and development in Africa, Proceedings of the Second
Biennial Conference of the African Small Ruminant Research Network, AICC,
Arusha, Tanzania, 7-11 December, 1992, pp. 205-211.

Chapter 3
85
Rewe, T.O., Ogore, P.B., Kahi, A.K., 2002. Integrated goat projects in Kenya: impact
on genetic improvement. In: Proceedings of the Seventh World Congress on
Genetics Applied to Livestock Production, vol. 33, Montpellier, France, 19-23
August, 2002, pp. 385-387.
Rowlands, G.J., Nagda, S., Rege, J.E.O., Mhlanga, F., Dzama, K., Gandiya, F.,
Hamudikwanda, H., Makuza, S., Moyo, S., Matika, O., Nangomasha, E.,
Sikosana, J., 2003. A Report to FAO on The Design, Execution and Analysis
of Livestock Breed Surveys – A Case Study in Zimbabwe. International
Livestock Research Institute, Nairobi, 212 pp.
Seleka, T.B., 2001. Determinants of short-run supply of small ruminants in Botswana.
Small Rumin. Res. 40, 203-214.
Sölkner, J., Nakimbugwe, H., Zarate, A.V., 1998. Analysis of determinants for
success and failure of village breeding programmes. In: Proceedings of the
Sixth World Congress on Genetics Applied to Livestock Production, vol. 25,
Armidale, NSW, Australia, 11-16 January, 1998, pp. 273-280.
Turner, H.N., 1978. Sheep and the smallholder. World Anim. Rev. 28, 4-8.
Wollny, C.B.A., Banda, J.W., Mlewah, T.F.T., Phoya, R.K.D., 2002. The lessons of
livestock improvement failure: revising breeding strategies for indigenous
Malawi sheep? In: Proceedings of the Seventh World Congress on Genetics
Applied to Livestock Production, vol. 33, Montpellier, France, 19-23 August,
2002, pp. 345-348.

![COURSE AL60D: ADVANCED RUMINANT PRODUCTIONostasp.brinkster.net/downloads/al60d2012.pdfAGLS6004 [AL60D] Advanced Ruminant Production Advanced Ruminant Production Gary Wayne Garcia 02/09/2012](https://img.pdfslide.net/doc/110x75/5e52eefa225a0e0647002013/course-al60d-advanced-ruminant-agls6004-al60d-advanced-ruminant-production-advanced.jpg)


![Ruminant Digestion[1]](https://img.pdfslide.net/doc/110x75/5532bfab4a795968588b46f1/ruminant-digestion1.jpg)