Embed Size (px)
Citation preview
5050
TAX POLICY AND PERFORMANCE
IN AFRICA
CHAPTER 3
Chapter 3 Tax policy and performance in Africa

INTRODUCTIONTax policy—the instruments governments use to raise revenue by taxing economic activities—is an important revenue component of fiscal policy. It is also sensitive to microeconomic aspects of fairness (who to tax and how much) and allocative efficiency (which taxes will minimize the distortions in economic activity) to support higher economic growth. Tax policy in Africa focuses on scaling up domestic revenue mobilization to enable countries to implement development strategies to achieve the SDGs and the aspirations of Agenda 2063.
This chapter explores how to leverage tax policy to raise more revenue for financing sustainable development in Africa. It takes stock of tax policy since 2000, draws lessons from tax policy reforms in Africa and best practices around the world and examines the tax system and the performance of different taxes. It also identifies what needs to be done to increase tax revenue to finance sustainable development.
TRENDS IN TAX POLICY AND PERFORMANCEAfrica’s weighted average tax to GDP ratio was 17 per cent over 2000–2018.1 It improved from 17.9 per cent in 2000 to 19.9 per cent in 2005, the period high, but has since trended downwards, reaching its lowest level of 12.9 per cent in 2016 and was 14.6 per cent in 2018 (figure 3.1). This trend was reflected in both direct taxes and indirect taxes, which peaked at 5.5 per cent and 12.6 per cent, respectively, in 2004. Resource
1 The analysis in this chapter is based on data from the Government Revenue Dataset, compiled by the International Centre for Tax and Development and United Nations University World Institute for Development Economics Research from multiple sources and last accessed in November 2018 (ICTD and UNU-WIDER, 2018). As of November 2018, the data set covered up to 2016, so data for 2017 and 2018 are forecast. Not all countries had a full set of data, and therefore data on some variable are averages of the available data.
Africa’s weighted average ratio of taxes to GDP was 17 per cent over 2000–2018.
A frica has a low tax capacity (ability to
collect taxes) of about 20 per cent of GDP and a lower tax revenue to GDP ratio (17 per cent) than other regions, largely because of inefficiencies in tax policy and revenue collection. Thus, addressing tax capacity constraints and collection inefficiencies could boost tax revenue in Africa by 3 per cent of GDP (the difference between the current tax ratio and tax capacity).
Collection efficiency for the value-added tax (VAT) in many African countries is less than 50 per cent, and property and wealth taxation are still un-tapped sources of revenue.
Improving tax governance by combating corruption and bolstering accountability could reduce inefficiencies and, on average, mobilize up to $72 billion a year—about a third of the estimated average investment financing gap of $230 billion for achieving the Sustainable Development Goals (SDGs) and Agenda 2063 in Africa.
United Nations Economic Commission for AfricaFiscal Policy for Financing Sustainable Development in Africa
51

FIGURE 3.1. TRENDS IN TAX REVENUE AND IT COMPONENTS IN AFRICA, 2000-2018
Note: Data are estimated for 2017 and 2018.Source: Based on data from ICTD and UNU-WIDER (2018), accessed in November 2018
Indirect Resource taxesDirect Total
least 10 per cent increased from 9 in 2000 to 16 in 2018 (table 3.1). Between 2000 and 2018, four countries (Democratic Republic of the Congo, Eswatini, Malawi and Mozambique) increased their ratio by at least 10 percentage points, and seven countries (Congo, Gambia, Guinea, Namibia, Rwanda, Tanzania and Togo) increased it by 5–9 per cent. Twelve countries had an average tax revenue to GDP ratio of at least 10 per cent over 2000–2008, compared with 16 over 2009–2018, with Mozambique (9.6 per cent), Malawi (6 per cent) and Namibia (5.5 per cent) recording the largest increases between the two periods.
Furthermore, whereas only 3 of the 19 countries (Eswatini, 18 per cent; Namibia, 26 per cent; and Senegal, 16 per cent) had a tax to GDP ratio of at least 15 per cent in 2000, 12 of them did so by 2018 suggesting potential for many African countries
taxes followed the same general trend, rising from 1.5 per cent in 2000 and peaking at 3.2 per cent in 2006, before gradually falling to 0.35 per cent in 2016, with a slight recovery to 1.9 per cent in 2017 and 2018.
Tax revenue declined over this period, with the continental weighted tax ratio averaging 17 per cent of GDP, well below the 20 per cent ratio needed to help countries fast track achievement of the SDGs.
The overall decline in the weighted average tax revenue to GDP ratio for Africa between 2000 and 2018 reflected drops in 29 of 51 countries with data, including major economies such as Angola, Ethiopia, Kenya, Morocco and Nigeria. However, in a subgroup of 19 countries, the number of countries with a tax revenue to GDP ratio of at
PER
CEN
T O
F G
DP
10%
20%
0
5%
15%
2000 2005 20102001 2006 2011 20152002 2007 2012 20162003 2008 2013 20172004 2009 2014 2018
17.9%
19.9%
17.0%
18.0%
19.5%
17.7%
15.3%
17.5%
18.9%
17.1%
12.9%
18.9%
17.3%16.5%
15.0%
19.8%
16.8%
15.4%14.6%
Y E A R S
52
Chapter 3 Tax policy and performance in Africa

to make progress towards the goal of 20 per cent (Coulibaly and Gandhi, 2018).
While the number of countries with an average tax revenue to GDP ratio of more than 20 per cent remained stable at 9 between 2000–2008 and 2009–2018 (figure 3.2), some countries increased their tax revenue collection despite the declining growth trend from 2009 onwards. The number of countries with a tax revenue to GDP ratio of 0–10 per cent decreased from 15 over 2000–2008 to 9 over 2009–2018, while the number with a ratio of 10–20 per cent increased from 26 to 33 over the same periods.
TABLE 3.1. IMPROVEMENTS IN AVERAGE WEIGHTED RATIOS OF TAX REVENUE TO GDP IN 22 AFRICAN COUNTRIES BETWEEN 2000–2004 AND 2014–2018
STRUCTURE OF THE TAX SYSTEM AND PERFORMANCE OF TAX TYPESThe primary function of the tax system is to generate revenue for the government while ensuring economic efficiency and easing the tax burden on the poorest segments of society through tax structures with some progressivity. Tax structures influence the incidence of each type of tax. Having an efficient tax system is a key consideration in achieving Agenda 2063 and the SDGs.
Note: Data are estimated for 2017 and 2018.Source: Based on data from ICTD and UNU-WIDER (2018), accessed in November 2018.
WEIGHTED TAX TO GDP RATIOS (%)
AVERAGE WEIGHTED TAX TO GDP RATIOS (%)
Burkina FasoCameroonChadCongo, Dem. Rep.CongoCôte d’IvoireEswatiniGambiaGuineaGuinea-BissauMalawiMozambiqueNamibiaNigerRwandaSenegalSudanTanzaniaTogo
COUNTRY2000
2000 - 2018 INCREASE
(PERCENTAGE POINT)
INTER-PERIOD INCREASE
(PERCENTAGE POINT)
2009 - 2018 Post crisis
2000 - 2008 Fast growth
2018
1111616
1418118789
268
101657
11
420
1151
13683
10148454269
14126
1010152615148
1620311214197
1118
15136
1211153117169
1823341315207
1320
1211558
14221295
10102510111868
14
2.00.90.84.62.70.74.23.14.72.96.09.65.51.52.51.60.23.13.8
United Nations Economic Commission for AfricaFiscal Policy for Financing Sustainable Development in Africa
53

Taxes include direct taxes and indirect taxes. The main components of direct taxes are taxes on individual and corporate income, payroll and workforce taxes, and property taxes. The main components of indirect taxes are taxes on goods and services (sales taxes, VAT, turnover taxes and taxes on financial and capital transactions), excise duties and international trade taxes. How various tax components perform over time can inform the tax policy debate by revealing the evolution of tax structures and the contribution of each tax type to government revenue.
Emerging from a prolonged period of stagnant economic growth in the 1980s and early 1990s, and encouraged by signs of positive growth in the late 1990s, African countries entered the 21st century determined to improve their tax revenue collection by introducing tax reforms.
Tax revenue rose over 2000–2004 (table 3.2). Revenue from direct taxes as a share of GDP barely rose from 5.0 per cent in 2000 to peak at 5.5 per cent in 2004 before gradually declining to 3.5 per cent in 2016; it is estimated to have increased to 3.9 per cent in 2017 and 3.7 per cent in 2018. Revenue from indirect taxes as a share of GDP followed the same pattern, rising from 11.4 per cent in 2000 to peak at 12.6 per cent in 2004, then dropping gradually to 9.0 per cent in 2016, with modest improvement to 9.3 per cent in 2017. Revenue from resource taxes as a share of GDP began at 1.5 per cent in 2000, peaking later than other tax types at 3.2 per cent in 2006 and falling gradually at first, to 2.3 per cent in 2013, then rapidly to 0.3 per cent in 2016, before recovering to 1.9 per cent in 2017 and 2018, reflecting the impact of the slump in commodity prices that began in 2014. The performance of individual components of each tax type varied, however.
FIGURE 3.2. DISTRIBUTION OF AFRICAN COUNTRIES BY AVERAGE TAX REVENUE TO GDP RATIO, 2000–2008, 2009–2018 AND 2000–2018
Note: Data are estimated for 2017 and 2018.Source: Based on data from ICTD and UNU-WIDER (2018), accessed in November 2018
NU
MB
ER O
F C
OU
NTR
IES
AV E R A G E TA X R E V E N U E TO G D P R AT I O
0%-10% 11%-20% 21%-30% 31%-40%
35
15
10
30
0
5
20
25
2009-2018 2000-20182000-2008
40
11
31
7
2
15
26
7
2
9
33
6
3
54
Chapter 3 Tax policy and performance in Africa

as a share of GDP rose slightly, from 5.1 per cent in 2000 to 5.8 per cent in 2004, and then gradually declined to its lowest level in 2016, at 4.7 per cent. Similarly, VAT revenue as a share of GDP rose from 2.0 per cent in 2000 to 3.0 per cent in 2004, before drifting down to 2.0 per cent in 2016. Revenue from excise duties as a share of GDP rose from 1.2 per cent in 2000 to a high of 1.4 in 2003 and declined thereafter, dwindling to 1 per cent in 2016. For revenue from international trade taxes and other taxes, the decline began earlier. Trade tax revenue as a share of GDP dropped from a high of 2.5 per cent in 2000 to 1 per cent in 2016, while other tax revenue as a share of GDP dropped from a high of 0.5 per cent in 2000 to 0.2 per cent in 2016.
Resource tax revenues marginally declined from 1.5 per cent of GDP in 2000 to 1.2 per cent in 2002, and gradually rose to 3.2 per cent by 2006, before falling
Among direct taxes, revenue from personal income taxes as a share of GDP declined almost continuously, from 3.0 per cent in 2000 to 1.9 per cent in 2018, indicating low personal income tax responsiveness to the robust economic growth on the continent. Revenue from corporate income taxes as a share of GDP rose initially, from 1.6 per cent in 2000 to 2.3 per cent in 2006, before gradually declining to 1.5 per cent in 2018. Revenue from payroll and workforce taxes (about 0.1 per cent of GDP over 2000–2018) and property taxes (about 0.2–0.3 per cent) has been largely inconsequential. If properly harnessed by expanding the tax base, these last two components could increase tax revenue.
Nearly all indirect taxes followed the same pattern: a brief rise until 2003 or 2004 and then a gradual decline. Revenue from taxes on goods and services
Note: Data are estimated for 2017 and 2018.Source: Based on data from ICTD and UNU-WIDER (2018), accessed in November 2018.
TABLE 3.2. TRENDS IN TAX REVENUE BY TAX TYPE AND COMPONENT, 2000-2018 (PER CENT OF GDP)
200020012002200320042005200620072008200920102011201220132014201520162017f2018f
3.01%2.85%2.67%2.96%3.05%2.87%2.61%2.53%2.15%2.31%2.31%2.33%2.21%2.15%2.14%2.25%1.98%1.93%1.87%
1.64%1.81%1.82%2.03%2.08%2.24%2.34%2.32%2.20%2.10%1.90%1.98%1.77%1.74%1.47%1.47%1.24%1.62%1.53%
0.05%0.07%0.07%0.10%0.10%0.09%0.08%0.07%0.06%0.07%0.07%0.08%0.08%0.07%0.07%0.08%0.06%0.07%0.07%
0.30%0.22%0.22%0.31%0.28%0.27%0.23%0.23%0.18%0.27%0.25%0.28%0.26%0.24%0.24%0.25%0.22%0.24%0.24%
5.13%5.17%5.26%5.66%5.79%5.56%5.18%5.20%4.86%5.10%5.29%5.21%5.00%4.96%4.75%5.05%4.74%4.85%4.77%
1.52%1.55%1.25%1.36%1.72%2.43%3.17%2.93%2.82%1.74%2.02%2.66%2.65%2.28%1.95%1.22%0.35%1.93%1.86%
Personal income
Corporate income
Payroll and workforce
Goods and services
1.98%2.07%2.39%2.76%3.01%2.93%2.79%2.72%2.45%2.44%2.62%2.58%2.50%2.46%2.31%2.31%2.02%2.41%2.32%
VAT
1.23%1.19%1.28%1.36%1.35%1.23%1.12%1.02%0.90%1.08%0.98%1.01%0.98%0.95%0.87%1.02%0.98%0.87%0.84%
Excise duties
2.52%2.52%2.13%2.03%2.00%1.83%1.70%1.59%1.47%1.44%1.31%1.31%1.42%1.36%1.33%1.33%1.05%0.94%0.86%
International trade
0.50%0.53%0.38%0.38%0.40%0.41%0.33%0.26%0.25%0.28%0.22%0.22%0.25%0.30%0.29%0.29%0.24%0.19%0.18%
Other taxes
RESOURCE TAXESProperty
taxes
DIRECT TAXES INDIRECT TAXES
United Nations Economic Commission for AfricaFiscal Policy for Financing Sustainable Development in Africa
55
to 1.7 per cent in 2009. They improved to 2.7 per cent of GDP in 2011 and 2012 and fluctuated widely before stabilizing at 1.9 per cent of GDP in 2017 and 2018 thanks to improvement in commodity prices.
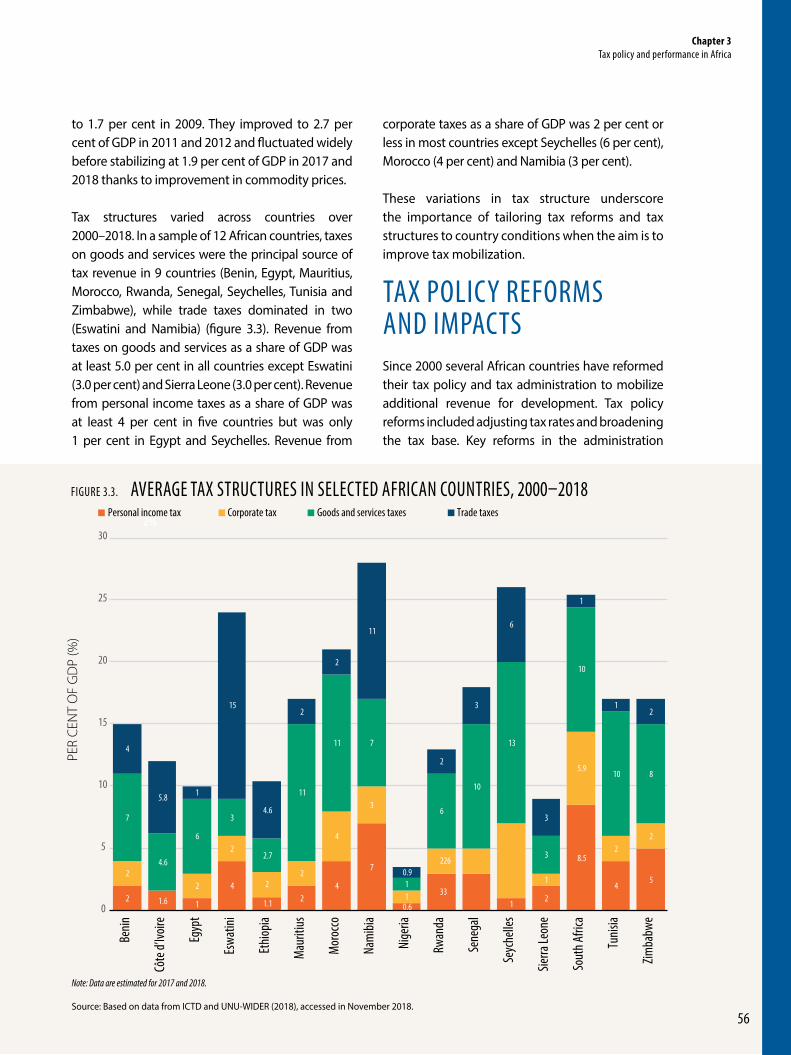
Tax structures varied across countries over 2000–2018. In a sample of 12 African countries, taxes on goods and services were the principal source of tax revenue in 9 countries (Benin, Egypt, Mauritius, Morocco, Rwanda, Senegal, Seychelles, Tunisia and Zimbabwe), while trade taxes dominated in two (Eswatini and Namibia) (figure 3.3). Revenue from taxes on goods and services as a share of GDP was at least 5.0 per cent in all countries except Eswatini (3.0 per cent) and Sierra Leone (3.0 per cent). Revenue from personal income taxes as a share of GDP was at least 4 per cent in five countries but was only 1 per cent in Egypt and Seychelles. Revenue from
FIGURE 3.3. AVERAGE TAX STRUCTURES IN SELECTED AFRICAN COUNTRIES, 2000–2018
Note: Data are estimated for 2017 and 2018.
Source: Based on data from ICTD and UNU-WIDER (2018), accessed in November 2018.
corporate taxes as a share of GDP was 2 per cent or less in most countries except Seychelles (6 per cent), Morocco (4 per cent) and Namibia (3 per cent).
These variations in tax structure underscore the importance of tailoring tax reforms and tax structures to country conditions when the aim is to improve tax mobilization.
TAX POLICY REFORMS AND IMPACTSSince 2000 several African countries have reformed their tax policy and tax administration to mobilize additional revenue for development. Tax policy reforms included adjusting tax rates and broadening the tax base. Key reforms in the administration
2%
2 1.6 1
4
1.1 24
7
0.6
331
2
8.5
45
22
2
22
4
3
1
226
1
5.9
22
7
4.6
6
3
2.7
11
11 7
1
6
10
13
3
10
10 8
4
5.8 1
15
4.6
2
2
11
0.9
2
3
6
3
1
12
0
5
10
15
20
25
30
Benin
Côte
d’Ivo
ire
Egyp
t
Eswa
tini
Ethio
pia
Mau
ritius
Mor
occo
Nam
ibia
Nige
ria
Rwan
da
Sene
gal
Seyc
helle
s
Sierra
Leon
e
Sout
h Afri
ca
Tunis
ia
Zimba
bwe
PER
CEN
T O
F G
DP
(%)
Personal income tax Corporate tax Goods and services taxes Trade taxes
56
Chapter 3 Tax policy and performance in Africa
of taxes included integrating revenue collection responsibilities within a single agency, often a semi-autonomous revenue authority (Moore, 2013), and promoting compliance among taxpayers (discussed in chapter 5).
ADJUSTING TAX RATES
A number of African countries reduced tax rates, in line with the warnings in the Laffer curve literature about the detrimental revenue effect of excessively high tax rates (see, for instance, Laffer, 2004; Khaldun, 1967; Wanniski, 1978).2 Countries made other adjustments as well.
To encourage investment, some African countries reduced or simplified the corporate income tax rate. In 2006 Lesotho reduced the standard corporate income tax rate from 35 per cent to 25 per cent and the rate for manufacturers from 15 per cent to 10 per cent to encourage private sector growth ATAF, 2017). Revenue from corporate income taxes rose from 1.7 per cent of GDP in 2006 to 2.1 per cent in 2007 and to 4 per cent in 2009.
2 The Laffer curve expresses the relationship between tax rates and tax revenue as a trade-off between higher tax rates and higher revenue, showing that there is a point on the curve at which raising the tax rate lowers rather than increases overall revenue; if the tax rate is higher than that rate, cutting it would increase revenue collection (Laffer, 2004).
Tanzania’s debt was increasing while tax revenue collection remained low, at 10.8 per cent of GDP in 2005 (World Bank, 2017). With the support of the World Bank, Tanzania embarked on the Tax Modernization Project to improve the efficiency and effectiveness of tax administration by the Tanzania Revenue Authority by (IEG, 2012):
• Building the capacity of tax administrators.
• Educating taxpayers on how to file and pay taxes.
• Training staff to avoid corruption.• Automating systems for registering,
documenting and collecting taxes.• Introducing an e-filing system.• Creating stronger infrastructure for
monitoring and evaluation (using two digital forensics laboratories to enhance the capacity of the tax investigation unit; World Bank, 2017).
As a result of these measures:
• Revenue collection improved on average by 21 per cent over 2007–2011.
• E-filing of value-added taxes increased from less than 500 in 2009 to over 4,000 in 2011.
• A new mobile tax payment system for property taxes registered 376,666 taxpayers in 2011.
BOX 3.1. LESSONS FROM TANZANIA ON INTEGRATED TAX REFORM
In 2015, Egypt replaced its two-tier corporate tax system with a single tax of 22 per cent (ATAF, 2017)3. Tanzania began modernizing its tax system and tax administration in 2004, which has improved tax revenue collection and increased e-filing (see box 3.1). And in 2017, Tanzania reduced the corporate income tax rate for assemblers of vehicles, tractors and fishing boats from 30 per cent to 10 per cent for the first five years of operations to encourage manufacturing growth. In 2018 Kenya reduced the corporate income tax rate for property developers who construct more than 400 housing units and for vehicle assemblers from 30 per cent to 15 per cent (ATAF, 2017). It is too early to determine the impact of these reforms.
Countries have also reformed personal income taxes. In 2017, South Africa increased the marginal income tax rate for individuals from 41 per cent to 45 per cent. To cushion taxes against the effects of inflation, South Africa regularly reviews personal income tax brackets and tax relief measures; recent reviews were conducted in 2013 and 2016 (National Treasury and SARS, 2016). A 2013 reform resulted in revenue from personal income taxes as a share of GDP increasing from 8.9 per cent in 2013 to 9.8 per cent in 2016. Other countries have lowered rates. To
3 In 2018, the average statutory corporate tax rates ranged from 18.4 per cent in Europe, 21.6 in EU countries, 23.7 in OECD countries, 23 per cent across all 208 jurisdictions, to 28.8 per cent in Africa (Tax Foundation, 2018) (see annex 3.2).
United Nations Economic Commission for AfricaFiscal Policy for Financing Sustainable Development in Africa
57

make personal income tax rates more progressive, Kenya reviewed and increased the number of bands and increased the personal relief rates (thresholds for tax liability) by 10 per cent in 2016 and 2017 (Government of Kenya, 2016). In 2018 Mauritius reduced the personal income tax rate from 15 per cent to 10 per cent for income below $18,840 a year (Government of Mauritius, 2018). It is too short to assess the impact of the reforms in Kenya and Mauritius.
BROADENING THE TAX BASE
To increase domestic revenue mobilization, several African countries have implemented measures to broaden the tax base by introducing or adjusting capital gains taxes or consumption taxes.
Many African countries have some form of capital gains tax. Some countries exempt capital gains from listed securities and apply a reduced rate to gains on unlisted shares. For example, South Africa introduced a capital gains tax in 2001, while Kenya, following many unsuccessful attempts, reintroduced the tax in 2015 after a 30-year suspension (Government of Kenya, 2014).
Goods and services (sales) taxes, the principal source of tax revenue in many countries, have undergone many reforms since 2000, ranging from introducing the VAT to replace those taxes to adjusting VAT rates. Botswana introduced a 10 per cent VAT in April 2002 and then raised it to 12 per cent in April 2010 following the financial crisis (Bakwena, 2012). Rwanda and Egypt replaced sales taxes with a VAT. Rwanda replaced the 15 per cent sales tax in 2001 with a 15 per cent VAT and then raised it to 18 per cent in 2002 (Government of Rwanda, 2001); VAT revenue rose from 3.2 per cent of GDP in 2001 to 4.7 per cent in 2016. Egypt replaced its 10 per cent goods and services tax with a 13 per cent VAT in 2016 and raised it to 14 per cent in 2017 (Rahman, 2017).
Tanzania embarked on the Tax Modernization Project to improve the efficiency and effectiveness of tax administration.
TABLE 3.3. REVENUE FROM VALUE ADDED TAXES AS A SHARE OF GDP, 2000–2018 (%)
BeninBurkina FasoCameroonCabo VerdeCentral African RepublicCôte d’IvoireDem. Rep. of the CongoGabonGhanaGuineaKenyaLesothoMadagascarMalawiMaliMauritaniaMoroccoMozambiqueNigeriaRwandaSenegalSeychellesSouth AfricaSudanTanzaniaTogoTunisiaUgandaZambiaZimbabweAfrica
COUNTRY 2000 2008 2018F
3.83.34.4
3.8
1.92.91.63.8
2.93.92.8
4.00.8
6.6
5.80.52.7
6.13.2
2.0
6.84.85.38.72.4
1.24.3
4.66.22.2
4.4
8.5
1.04.47.3
10.36.5
3.26.46.03.53.30.52.4
7.66.76.04.7
0.64.21.95.54.93.27.36.34.65.3
10.19.35.20.95.07.69.37.02.72.99.66.03.63.38.72.3
Note: Data are estimated for 2017 and 2018.Source: Based on data from ICTD and UNU-WIDER (2018), accessed in November 2018.
VAT revenue as a share of continental GDP barely increased between 2000 and 2018, from 2 per cent to 2.3 per cent, and increased by at least a percentage point in 11 of the 30 African countries with available data (table 3.3). It increased the most in Mauritania (7.3 percentage points), Benin (3.8 per cent), Guinea (3.3 per cent), Burkina Faso (3.4 per cent) and Ghana (2.6 per cent).
58
Chapter 3 Tax policy and performance in Africa

Lesotho replaced the sales tax with the VAT in 2003 to stop the abuse of tax exemption certificates and close loopholes used by suppliers to evade sales taxes (Koatsa and Nchake, 2017). VAT revenue rose from 5.9 per cent of GDP in 2003 to 7.5 per cent in 2014 before drifting down to 6.7 per cent in 2016. Other countries focused on adjusting VAT rates and the list of exemptions or zero-rated products. Kenya reduced VAT rates from 18 per cent to 16 per cent in 2003, and in 2013 it overhauled the VAT, greatly reducing the list of zero-rated goods and thus the amount of VAT refunds (Government of Kenya, 2013). VAT revenue edged up from 4.3 per cent of GDP in 2002 to 4.4 per cent in 2003 and stayed above the initial level before dropping to 4.3 per cent of GDP in 2012 and then to 3.9 per cent in 2013, prompting a second review of VAT policy that year.
In fiscal year 2018/19, South Africa increased its VAT rate from 14 per cent to 15 per cent, estimating that the resulting additional revenue would finance the newly introduced fee-free tertiary education and training for students from low-income households, among other development policy objectives (SARS, 2018).
TACKLING TAX AVOIDANCE
Tax avoidance and evasion—by taking advantage of loopholes or exceptions, liberally interpreting tax codes or even falsifying invoices—results in large losses in tax revenue in Africa. African countries have been reforming their tax policies to address these issues. For example, to counter tax evasion through invoice mispricing and tax avoidance through profit shifting, several African countries have introduced transfer pricing rules
to ensure the fairness and accuracy of transaction pricing within and between enterprises under common ownership or control.4
PERFORMANCE OF TAX REFORMS
While the weighted average tax revenue to GDP ratio for Africa did not change much following these reforms, the number of countries with a ratio below 15 per cent fell by more than half (from 31 countries to 14) between 2000 and 2016. In addition, the number of countries with a ratio above 20 per cent rose from 8 to 11.
Income tax, which increased between 2000 and 2015 by 6.6 percentage points in South Africa, 6.5 percentage points in Rwanda, 5.9 percentage points in Tunisia, 2.6 percentage points in Morocco and 0.6 percentage point in Mauritius, was a key driver of growth in tax revenue (OECD, 2016). This growth was attributed to higher taxes on income and profits, particularly corporate income tax rates.
Box 3.2 illustrates the extensive benefits of tax reforms, particularly simplification of the excise tax structure, in the Philippines. The reforms not only raised additional revenue, but they also contributed to the achievement of several SDGs. African countries could consider similar measures as a vehicle for increasing revenue generation.
4 Tax avoidance and tax evasion are discussed in detail in chapter 6.
Tax avoidance and evasion—by taking advantage of loopholes or exceptions, liberally interpreting tax codes or even falsifying invoices—results in large losses in tax revenue in Africa.
United Nations Economic Commission for AfricaFiscal Policy for Financing Sustainable Development in Africa
59

The 2012 Sin Tax Reform Law in the Philippines substantially increased excise taxes and simplified the tax structure for tobacco. The reform resulted in a huge increase in excise revenue, which enabled large increases in the health budget (see box figures 1 and 2). Tobacco excise revenues doubled as a share of GDP after 2012. The higher tax also reduced tobacco use by close to 20 per cent according to the 2015 Global Adult Tobacco Survey. The increased fiscal
space allowed the Philippines to provide fully subsidized health insurance to the poorest 40 per cent of the population, moving the country closer to its declared goal of universal health coverage.
As recognized by the Addis Ababa Action Agenda on Financing for Development, this example shows how countries can use price and tax measures to reduce tobacco consumption and health care costs, while at
the same time generating more revenue to finance development. This win-win reform for public health and domestic resource mobilization did not require a massive amount of resources to achieve. Indeed, tobacco taxation has been highlighted as one of the “Best Buy” interventions by the World Health Organization, recognizing it as a highly cost-effective measure for tobacco control and a revenue source for governments to fund their country’s development priorities.
BOX 3.2. TOBACCO TAXATION AS WIN-WIN: THE CASE OF THE PHILIPPINES
BOX FIGURE 2 Philippine Department of Health budget before and after the tax reform of 2012, 2007–2017
PH
ILIP
PIN
E P
ESO
S (B
ILLI
ON
S)
PH
ILIP
PIN
E P
ESO
S (B
ILLI
ON
S)
Source: Adapted from Kaiser, Bredenkamp and Iglesias (2016), with updated data from the Philippines Department of Finance and Department of Health.
Amount of tobacco tax revenue Department of Health Budget
160
0
120
40
80
250
0
200
100
50
150
BOX FIGURE 1 Tobacco excise tax revenues in the Philippines before and after the tax reform of 2012, 2007–2017
PH
ILIP
PIN
E P
ESO
S (B
ILLI
ON
S)
PER
CEN
T O
F G
DP
Amount of tobacco tax revenue Tobacco tax revenue as percent of GDP
1
0.6
0.8
0.4
0.2
0
160
0
120
40
80
2007 20112009 2013 20152008 20122010 2014 2016 2017
2007 20112009 2013 20152008 20122010 2014 2016 2017
60
Chapter 3 Tax policy and performance in Africa
Note: Data on VAT performance were available for 24 African countries. The analysis assumes that all final private consumption should have been subjected to the VAT (see the annex for the calculation of VAT collection efficiency, where the VAT gap is calculated as 1 minus this ratio). The results may overestimate the VAT gap because the private consumption data used in calculating the gap were obtained residually and because a share of final private consumption that might have been zero-rated could have been erroneously considered subject to the VAT. Thus, the results are indicative of the trend and potential.
Source: Forecast based on VAT data from ICTD and UNU-WIDER (2018), accessed November 2018, and private consumption data from World Bank (2018b).
FIGURE 3.4. VALUE-ADDED TAX GAP FOR 24 AFRICAN COUNTRIES WITH DATA, 2018
MEASURING AFRICA’S TAX GAP: SELECTED EXAMPLESMeasuring the tax gap—the difference between the amount of taxes paid and the amount that should have been paid during a given year—is challenging. Analysis must contend with the multitude of tax types and national tax systems and the dearth of relevant data (Raczkowski and Mróz, 2016).
THE EXAMPLE OF THE VALUE-ADDED TAX
The VAT, a consumption tax, is used here to illustrate these challenges. The estimates highlight the potential for further resource mobilization in Africa.
The tax gap for the VAT (the shortfall between potential and actual VAT collections) captures both policy and compliance shortcomings (Cnossen,
2015). Policy gaps arise from provisions in VAT policy or law relating to exemptions and zero and other reduced rates. Compliance gaps arise from inadequacies in administering the VAT, which result in lower than expected revenue, including operational inefficiency, limited capacity, fraud and unreliable consumption data. Despite these and other limitations, the compliance efficiency measure5 yields a useful estimate of a country’s VAT performance (Keen, 2013).
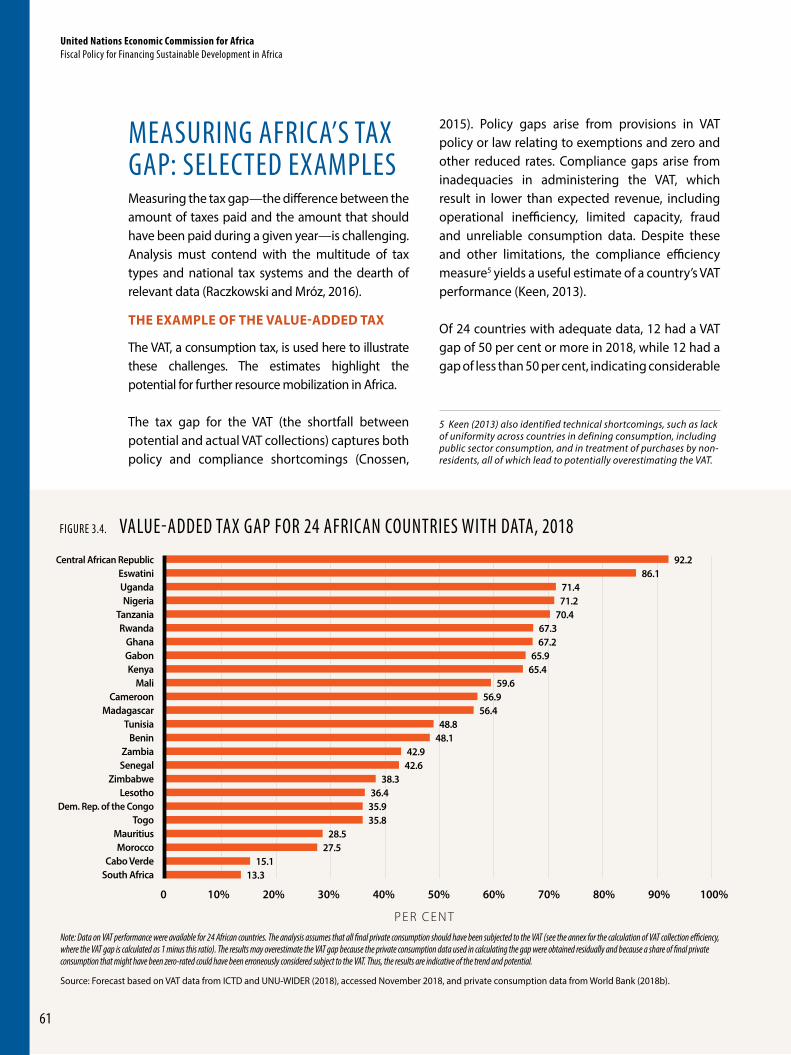
Of 24 countries with adequate data, 12 had a VAT gap of 50 per cent or more in 2018, while 12 had a gap of less than 50 per cent, indicating considerable
5 Keen (2013) also identified technical shortcomings, such as lack of uniformity across countries in defining consumption, including public sector consumption, and in treatment of purchases by non-residents, all of which lead to potentially overestimating the VAT.
0 40%20% 60% 90%10% 50% 80%30% 70% 100%
Central African RepublicEswatiniUgandaNigeria
TanzaniaRwanda
GhanaGabonKenya
MaliCameroon
MadagascarTunisia
BeninZambiaSenegal
ZimbabweLesotho
Dem. Rep. of the CongoTogo
MauritiusMorocco
Cabo VerdeSouth Africa
92.286.1
71.471.2
70.467.367.2
65.965.4
59.656.9
56.448.8
48.142.9
42.638.3
36.435.935.8
28.527.5
15.113.3
P E R C E N T
United Nations Economic Commission for AfricaFiscal Policy for Financing Sustainable Development in Africa
61

scope for increasing VAT collections (figure 3.4). The most efficient VAT collections were in South Africa (13.3 per cent gap) and Cabo Verde (15.1 per cent gap), and the least efficient were in Central African Republic (92.2 per cent gap) and Eswatini (86.1 per cent gap).
Nigeria had the fourth largest VAT gap (71.2 per cent) in 2018 and one of the lowest VAT rates in Africa, at 5 per cent. Doubling the VAT rate could double VAT collections from 0.8 per cent of GDP, and improving collection efficiency could boost VAT collection to more than 1.6 per cent of GDP. Further revenue could be obtained by addressing policy gaps.
While increasing the VAT rate could substantially improve resource mobilization in some countries, countries also need to address the gaps rooted in policy and compliance deficiencies. For example, despite having a high VAT rate of 20 per cent, Madagascar has a VAT gap of 56.4 per cent. Similarly, Cameroon’s VAT tax rate is 19.25 per cent, yet its VAT gap is 56.9 per cent.
AFRICA’S TAX GAP
Each country has an optimum tax revenue as a share of GDP—referred to as its tax capacity—that it can raise according to its underlying macroeconomic, demographic and institutional characteristics (Coulibaly and Gandhi, 2018). Sub-Saharan Africa
has the lowest tax capacity in the world, estimated at 20 per cent of GDP. The low tax capacity is attributable to low level of economic development and a large informal sector (Coulibaly and Gandhi, 2018).
Taking 20 per cent as the conservative tax capacity in Africa and Africa’s average tax revenue to GDP ratio of 17 per cent for 2000–2018 yields an estimated tax gap of 3 per cent of GDP, or approximately $72 billion in forgone revenue.
At the country level the tax gap ranges from 3 per cent of GDP to 9 per cent, with the largest gaps estimated for natural resource–rich countries (see box 3.3 on Chad’s experience; Coulibaly and Gandhi, 2018). The large gaps are attributable to inadequate fiscal policy and low tax capacity, leakages in revenue collection and weak enforcement (Coulibaly and Gandhi, 2018).
Of 24 countries with adequate data, 12 had VAT gaps greater than 50 per cent in 2016, while nine had gaps under 50 per cent, indicating considerable scope for increasing VAT collections.
Chad is a low-income, fragile country with development challenges that have intensified as a result of oil price declines and security shocks (IMF, 2018a, 2018c). Between 2014 and 2016 Chad responded to a contraction in oil revenue and a mounting burden of external commercial debt by cutting spending. An overreliance on oil revenues has depressed tax revenues, so the potential for improvement is high. Revenues from non-resource sectors in Chad are at 5 per cent of GDP, and Chad’s tax gap of 9 per cent of GDP is much higher than the average of 4.6 per cent for Africa excluding North Africa (Coulibaly and Gandhi, 2018).
To respond to budgetary and debt obligations and increase revenue, Chad introduced several reforms to its non-oil tax system:• Strengthened core tax administration
functions such as tax registration and identification of new taxpayers. As part of this reform an automated tax administration system was rolled out in 2014
• Modernized and simplified tax filing payment procedures.
• Increased and improved collection of excise tax revenues
• Suspended tax exemptions, which is estimated to yield an additional $174 million (ECA n.d.).
The average tax ratio in Chad improved from 6 per cent of GDP over 2000–2004 to 11 per cent over 2011–2015 (see table 3.1 in the text), suggesting a large impact from the reforms.
BOX 3.3. INSIGHTS FROM CHAD ON TAX GAPS
62
Chapter 3 Tax policy and performance in Africa
Addressing these challenges could mobilize additional revenue to finance sustainable development and Agenda 2063 aspirations.
KEY CHALLENGES TO TAX POLICY: COUNTRY CASE STUDIESTax policy challenges in Africa include hard to reach sectors (informal economy and agriculture) and the digital economy, curbing corruption, managing growing debt levels and debt-service obligations and resisting pressures to use excessive tax incentives
to attract investment.6 Countries’ experiences with these challenges also reveal some successes from which other countries could learn.
SECTORS THAT ARE HARD TO TAX
Across Africa there are economic agents whose activities are beyond the reach of the tax authorities, for reasons ranging from administrative weaknesses to policy shortcomings (see box 3.4). These economic agents range from small, informal enterprises to medium and large firms that avoid or evade taxes in multiple ways (Bird and Wallace, 2003). Firms may fail to register for taxes or may register but then fail to comply, sometimes by keeping incomplete or falsified records, which make it difficult for tax authorities to police their activities (Terkper, 2003). While these leakages from the tax system are a challenge to tax administration, they also represent an opportunity to mobilize additional resources to finance sustainable development (see chapter 5 for more details).
Informal sector
Informality in Africa spans a wide range, from 20–25 per cent of GDP in South Africa and Mauritius to 50–65 per cent in Benin, Tanzania and Nigeria (Medina, Jonelis and Cangul, 2017).
Monitoring informal activity is difficult because of the lack of data and the large number of informal firms. When monitoring is possible, the cost of bringing these activities within the tax net may outweigh any potential revenue gains in the short term (see box 3.4 for Kenya’s experience; Joshi, Pritchard and Heady, 2014; Kundt, 2017).
Achieving formalization requires better record keeping at the national and subnational levels. Subnational governments can begin by requiring businesses to register for local permits or access to markets; that information can then be digitized
6 Chapter 6 deals with the issues in the natural resources sector, but tax incentives are mentioned here to underscore the relevance to raising more tax revenue.
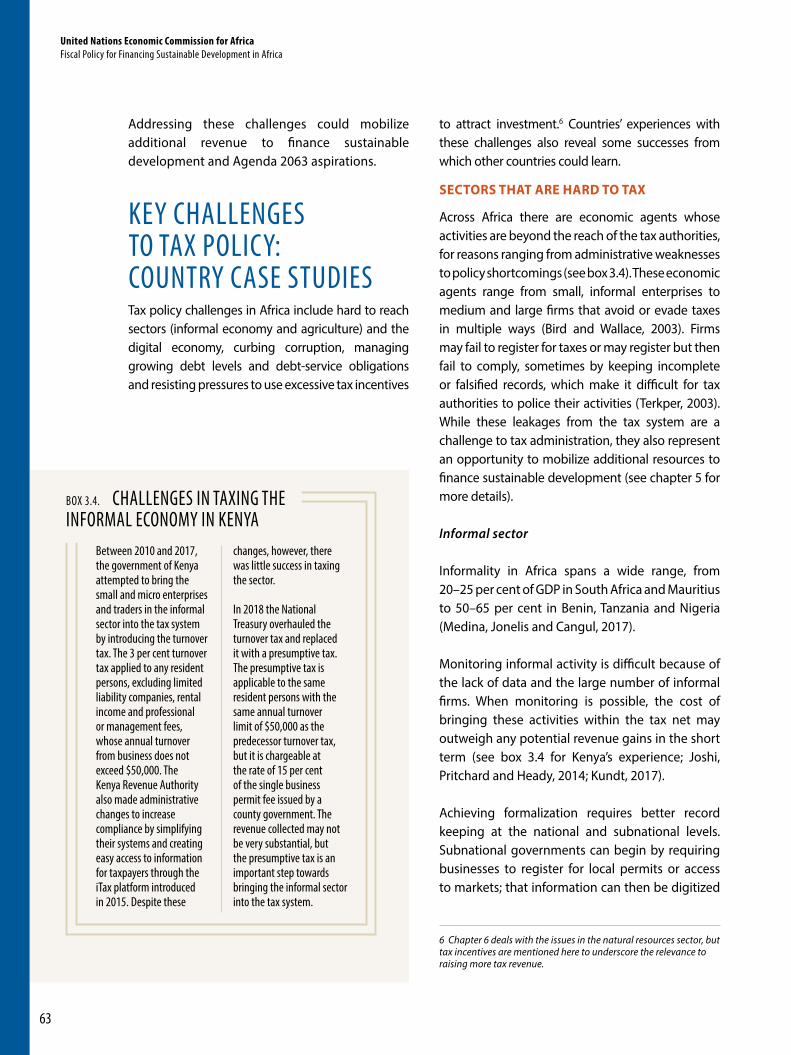
Between 2010 and 2017, the government of Kenya attempted to bring the small and micro enterprises and traders in the informal sector into the tax system by introducing the turnover tax. The 3 per cent turnover tax applied to any resident persons, excluding limited liability companies, rental income and professional or management fees, whose annual turnover from business does not exceed $50,000. The Kenya Revenue Authority also made administrative changes to increase compliance by simplifying their systems and creating easy access to information for taxpayers through the iTax platform introduced in 2015. Despite these
changes, however, there was little success in taxing the sector.
In 2018 the National Treasury overhauled the turnover tax and replaced it with a presumptive tax. The presumptive tax is applicable to the same resident persons with the same annual turnover limit of $50,000 as the predecessor turnover tax, but it is chargeable at the rate of 15 per cent of the single business permit fee issued by a county government. The revenue collected may not be very substantial, but the presumptive tax is an important step towards bringing the informal sector into the tax system.
BOX 3.4. CHALLENGES IN TAXING THE INFORMAL ECONOMY IN KENYA
United Nations Economic Commission for AfricaFiscal Policy for Financing Sustainable Development in Africa
63
and made available to revenue authorities. Governments can then consider implementing a simplified revenue accounting system for taxation (see box 3.5 on Ghana’s experience). The system should be freely available and easy to access so that it supports the growth and administration of the businesses it is designed to include. Formalization can then be progressively strengthened through improved record keeping.
Governments can also provide incentives for firms to formalize, such as offering access to credit, training programmes and government tenders. Since taxation of the informal sector could be regressive for small firms and microenterprises, governments should establish a minimum tax threshold with a graduated scale to protect small businesses and entrepreneurship and promote compliance.
The agriculture sector
The agriculture sector accounted for about 16 per cent of GDP in Africa in 2017 and employs the largest number of active workers on the continent (World Bank, 2018a). But agriculture is hard to tax because
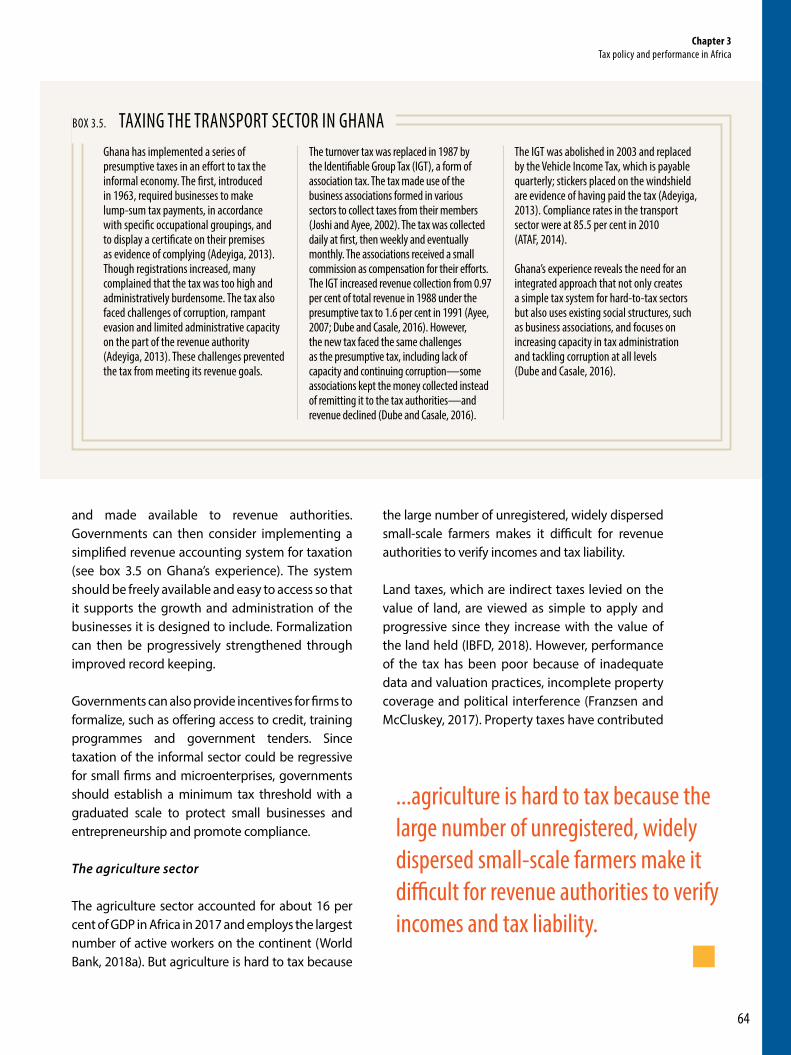
Ghana has implemented a series of presumptive taxes in an effort to tax the informal economy. The first, introduced in 1963, required businesses to make lump-sum tax payments, in accordance with specific occupational groupings, and to display a certificate on their premises as evidence of complying (Adeyiga, 2013). Though registrations increased, many complained that the tax was too high and administratively burdensome. The tax also faced challenges of corruption, rampant evasion and limited administrative capacity on the part of the revenue authority (Adeyiga, 2013). These challenges prevented the tax from meeting its revenue goals.
The turnover tax was replaced in 1987 by the Identifiable Group Tax (IGT), a form of association tax. The tax made use of the business associations formed in various sectors to collect taxes from their members (Joshi and Ayee, 2002). The tax was collected daily at first, then weekly and eventually monthly. The associations received a small commission as compensation for their efforts. The IGT increased revenue collection from 0.97 per cent of total revenue in 1988 under the presumptive tax to 1.6 per cent in 1991 (Ayee, 2007; Dube and Casale, 2016). However, the new tax faced the same challenges as the presumptive tax, including lack of capacity and continuing corruption—some associations kept the money collected instead of remitting it to the tax authorities—and revenue declined (Dube and Casale, 2016).
The IGT was abolished in 2003 and replaced by the Vehicle Income Tax, which is payable quarterly; stickers placed on the windshield are evidence of having paid the tax (Adeyiga, 2013). Compliance rates in the transport sector were at 85.5 per cent in 2010 (ATAF, 2014).
Ghana’s experience reveals the need for an integrated approach that not only creates a simple tax system for hard-to-tax sectors but also uses existing social structures, such as business associations, and focuses on increasing capacity in tax administration and tackling corruption at all levels (Dube and Casale, 2016).
BOX 3.5. TAXING THE TRANSPORT SECTOR IN GHANA
the large number of unregistered, widely dispersed small-scale farmers makes it difficult for revenue authorities to verify incomes and tax liability.
Land taxes, which are indirect taxes levied on the value of land, are viewed as simple to apply and progressive since they increase with the value of the land held (IBFD, 2018). However, performance of the tax has been poor because of inadequate data and valuation practices, incomplete property coverage and political interference (Franzsen and McCluskey, 2017). Property taxes have contributed
...agriculture is hard to tax because the large number of unregistered, widely dispersed small-scale farmers make it difficult for revenue authorities to verify incomes and tax liability.
64
Chapter 3 Tax policy and performance in Africa
intellectual property to shift profits from where they are generated to jurisdictions where taxes are lower, thus eroding the tax base in the originating jurisdiction. These changes necessitate a review of tax laws to ensure that they are appropriate to the current business environment.
The multijurisdictional nature of the digital economy demands a global solution. The Organisation for Economic Co-operation and Development (OECD) has been at the forefront on this issue through its Base Erosion and Profit Shifting project, which makes the following recommendations for taxing the digital economy:
• For the VAT, the suppliers of digital services should be responsible for remitting the tax to the jurisdiction in which the service is consumed.
• The reduced need for a physical presence for digital services means that taxing rights can be established by using rules to determine the characterization of income and a threshold for data exchange.
Though a global solution has yet to be found, some countries (such as South Africa and India) have introduced interim measures to reduce the tax losses resulting from shifting profits through the digital economy (see box 3.6 for South Africa’s experience).
between 0.2 to 0.3 per cent of GDP between 2000 and 2018 (see Table 3.2).
THE DIGITAL ECONOMY
Advances in information technology and the digital economy have revolutionized the business world, from the types of goods and services produced to how they are produced, delivered and paid for. That has created opportunities for better harnessing economic activities for development—including through taxation of profitable activities.
The digital economy—whose key factors of production are digitized information and knowledge (ADB, 2018)—also presents challenges to tax policy because of the difficulty of capturing where value is created and of measuring it (Jakurti, 2017). This is made more complicated with cross-border transactions. Current tax rules relating to cross-border income do not effectively address digital activities, which may not have a fixed physical location, making it easier for such income to remain untaxed (OECD, 2018). Historically, the factors of production were relatively immobile and required extensive use of labour and tangible resources, and cross-border income was allocated on the basis of the permanent establishment or physical presence of a business (CIAT, 2018).
The development of the digital economy has enabled businesses to use digital assets such as
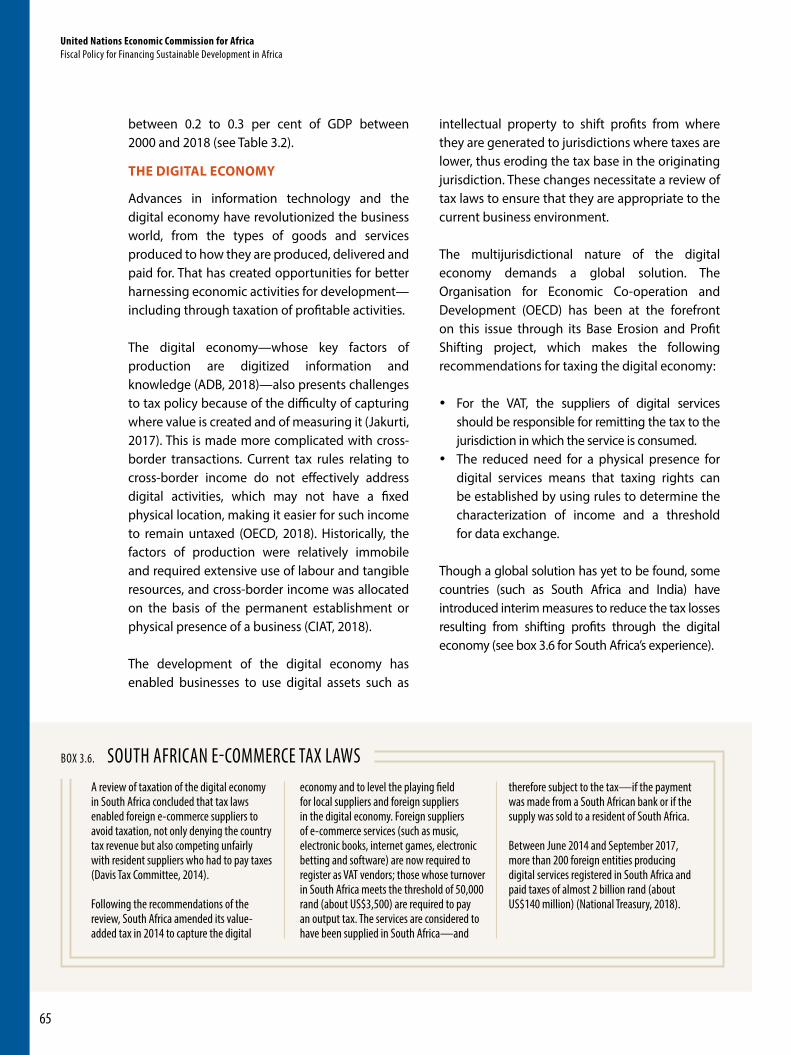
A review of taxation of the digital economy in South Africa concluded that tax laws enabled foreign e-commerce suppliers to avoid taxation, not only denying the country tax revenue but also competing unfairly with resident suppliers who had to pay taxes (Davis Tax Committee, 2014).
Following the recommendations of the review, South Africa amended its value-added tax in 2014 to capture the digital
economy and to level the playing field for local suppliers and foreign suppliers in the digital economy. Foreign suppliers of e-commerce services (such as music, electronic books, internet games, electronic betting and software) are now required to register as VAT vendors; those whose turnover in South Africa meets the threshold of 50,000 rand (about US$3,500) are required to pay an output tax. The services are considered to have been supplied in South Africa—and
therefore subject to the tax—if the payment was made from a South African bank or if the supply was sold to a resident of South Africa.
Between June 2014 and September 2017, more than 200 foreign entities producing digital services registered in South Africa and paid taxes of almost 2 billion rand (about US$140 million) (National Treasury, 2018).
BOX 3.6. SOUTH AFRICAN E-COMMERCE TAX LAWS
United Nations Economic Commission for AfricaFiscal Policy for Financing Sustainable Development in Africa
65
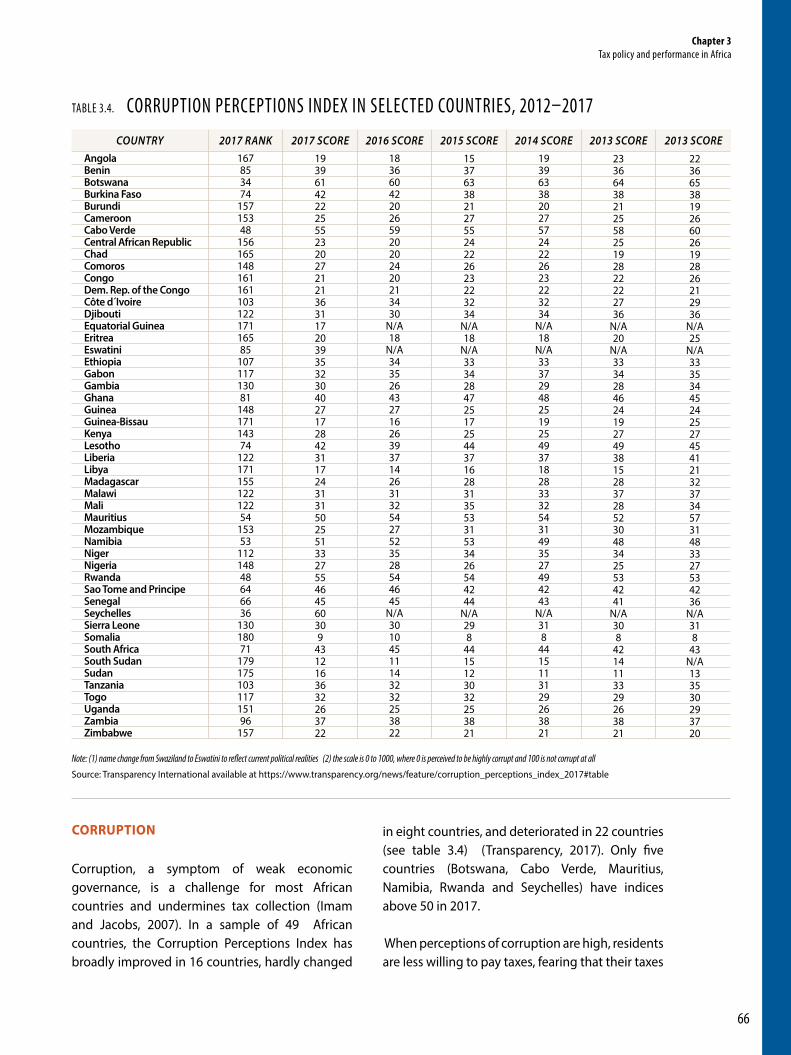
TABLE 3.4. CORRUPTION PERCEPTIONS INDEX IN SELECTED COUNTRIES, 2012–2017
COUNTRY 2017 RANK 2016 SCORE 2014 SCORE2017 SCORE 2015 SCORE 2013 SCORE 2013 SCORE167853474
15715348
15616514816116110312217116585
10711713081
14817114374
12217115512212254
15353
11214848646636
13018071
17917510311715196
157
1836604220265920202420213430
N/A18
N/A343526432716263937142631325427523528544645
N/A30104511143232253822
1939633820275724222623223234
N/A18
N/A333729482519254937182833325431493527494243
N/A318
4415113129263821
193961422225552320272121363117203935323040271728423117243131502551332755464560309
4312163632263722
1537633821275524222623223234
N/A18
N/A333428472517254437162831355331533426544244
N/A298
4415123032253821
2336643821255825192822222736
N/A20
N/A333428462419274938152837285230483425534241
N/A308
4214113329263821
2236653819266026192826212936
N/A25
N/A333534452425274541213237345731483327534236
N/A318
43N/A133530293720
Note: (1) name change from Swaziland to Eswatini to reflect current political realities (2) the scale is 0 to 1000, where 0 is perceived to be highly corrupt and 100 is not corrupt at all Source: Transparency International available at https://www.transparency.org/news/feature/corruption_perceptions_index_2017#table
CORRUPTION
Corruption, a symptom of weak economic governance, is a challenge for most African countries and undermines tax collection (Imam and Jacobs, 2007). In a sample of 49 African countries, the Corruption Perceptions Index has broadly improved in 16 countries, hardly changed
in eight countries, and deteriorated in 22 countries (see table 3.4) (Transparency, 2017). Only five countries (Botswana, Cabo Verde, Mauritius, Namibia, Rwanda and Seychelles) have indices above 50 in 2017.
When perceptions of corruption are high, residents are less willing to pay taxes, fearing that their taxes
AngolaBeninBotswanaBurkina FasoBurundiCameroonCabo VerdeCentral African RepublicChadComorosCongoDem. Rep. of the CongoCôte d´IvoireDjiboutiEquatorial GuineaEritreaEswatiniEthiopiaGabonGambiaGhanaGuineaGuinea-BissauKenyaLesothoLiberiaLibyaMadagascarMalawiMaliMauritiusMozambiqueNamibiaNigerNigeriaRwandaSao Tome and PrincipeSenegalSeychellesSierra LeoneSomaliaSouth AfricaSouth SudanSudanTanzaniaTogoUgandaZambiaZimbabwe
66
Chapter 3 Tax policy and performance in Africa

will be misused or misappropriated (Barone and Mocetti, 2011; Baum et al., 2017). Strengthening public financial management and enhancing the efficiency and equity of public spending will build trust in the system and improve compliance and revenue collection.
Africa, where the gap between average tax revenue and tax capacity is 3 per cent of GDP, has the lowest average scores globally on indicators of both corruption and democratic accountability. Improving the region’s corruption and democratic accountability scores to the global median could reduce this gap considerably (see box 3.7; Coulibaly and Gandhi (2018).
PRESSURE TO ATTRACT INVESTMENT
Countries the world over offer tax incentives to attract foreign investors, thereby forgoing the tax revenue that would have accrued to the country. Yet evidence indicates that tax incentives and tax treaties are of questionable efficacy in attracting investments, especially when the primary motivation to invest is access to natural resources or to a specific market (Tanzi and Zee, 2001). Tax incentives are subject to abuse and rank low in determining the investment location (Tanzi and Zee, 2001), while tax treaties that cede taxing rights to other countries often result in loss of tax revenue that far exceeds the gains from foreign investment (Van de Poel, 2016; see also chapter 6).
Tax holidays and preferential tax rates are the most prevalent types of tax incentives in Africa. These incentives seem to be mostly ineffective (see chapter 2).
African countries, most of which are capital importers, have been slowly ceding taxing rights over income earned within their jurisdiction through residence-based treaties, which have few provisions allocating taxing rights to the country where the income is earned (Hearson, 2016).
While tax allowances are recommended as a more effective form of tax incentives—because the benefit depends on the cost of the investment and not on its profits—some African countries grant tax allowances that are greater than the investment cost incurred.
BALANCING REVENUE NEEDS AND TAX EQUITY
Along with revenue sufficiency, equity is an important goal of taxation – adjusting revenue collection to meet development needs (Musgrave and Musgrave 1976). Equity calls for people with the same income or wealth to pay the same amount of taxes (horizontal equity) and for people with greater income or wealth to pay more taxes (vertical equity; Black, Calitz and Steenkamp, 2015).
Average tax capacity in Sub-Saharan Africa is the lowest in the world, at 20 per cent of GDP, according to an assessment of prospects for mobilizing additional tax revenue for financing sustainable development in Africa (Coulibaly and Gandhi, 2018). Using data up to 2015, the study found that non-resource tax revenue had increased as a share of GDP but not by enough. To bridge the gap, the study recommended that African countries improve both tax capacity and tax efficiency.
The study estimated that improving efficiency to 100 per cent could raise tax revenue by 3.9 per cent of GDP, bringing revenue collection close to the average tax capacity of 20 per cent. The study also estimated that reaching a higher tax to GDP ratio of 24 per cent of GDP to fast track achievement of the Sustainable Development Goals would require increasing tax capacity by a further 4 percentage points of GDP. Improving governance (measured by corruption and
accountability in the International Country Risk Guide) would reduce inefficiencies and help raise about additional $110 billion a year, or almost half of the average $230 billion investment financing gap over 2015–2020. The study illustrates the potential for African countries to raise additional tax revenue by strengthening economic governance, including by combating corruption and promoting accountability and transparency in public financial management.
BOX 3.7. LEVERAGING GOVERNANCE FOR TAX REVENUE MOBILIZATION
United Nations Economic Commission for AfricaFiscal Policy for Financing Sustainable Development in Africa
67
Given the levels of poverty and inequality and the large informal sector, an important concern for taxationin Africa is equity. Failure to address inequality undermines economic growth and development and in some cases is an underlying cause of social tensions and violent conflict (Langer and Stewart, 2015).
Equity in taxation is determined by who bears the final burden of a tax. The design of the tax system thus plays a key role since a poorly designed system may make the poor even poorer (Bird and Zolt, 2005). To promote equity, tax policies need to be informed by studies of tax incidence. Government policies need to respond to the challenges of equity without unduly compromising the tax revenue needed to finance policies to reduce poverty and inequality, which are at the core of the SDGs.
When assessing equity, it is important to consider the equity of the entire tax system, not just of individual tax components. “Making the system as a whole progressive does not require every individual tax to be progressive” (Mirrlees et al., 2011: 26). An individual tax cannot fulfil all the principles of a good tax—revenue sufficiency, equity, economic efficiency and administrative efficiency. Broad-based taxes such as the VAT may be economically and revenue efficient, but their
impact may be regressive. Progressive tax systems have the potential to reduce inequality, but to achieve sustainable development they must be accompanied by effective public spending and a responsive welfare system. Personal and corporate income taxes may be designed to be progressive, but their impact on economic activity may reduce tax revenue, especially in countries with a very large informal sector.
Assessing equity also requires examining public spending measures that reduce inequality through income redistribution. Evaluating whether a tax system is progressive or regressive thus needs to take into account the effect of all taxes in the system on different individuals or households, along with the effects of cash transfers and other public benefits (Varela, 2016).
Progressive taxation, if well designed, could reduce inequality by enabling low-income workers to allocate a greater portion of income to savings and investment, thus improving their economic situation. Furthermore, by boosting revenue, progressive taxation enables governments to fund key services, such as education and health, that favour low-income households and to invest in growth-enabling infrastructure that can increase social equity.
...evidence indicates that tax incentives and tax treaties are of questionable efficacy in attracting investments, especially when the primary motivation to invest is access to natural resources or to a specific market
68
Chapter 3 Tax policy and performance in Africa
69
CONCLUSIONS AND POLICY RECOMMENDATIONSThe overall weighted tax revenue to GDP ratio for the continent has been declining since 2004, underscoring the slower pace of tax growth than income growth. The overall decline in the ratio between 2000 and 2018 reflects declines in the ratio in 29 African countries, including major economies such as Angola, Ethiopia, Kenya, Morocco and Nigeria. At the same time, however, 9 countries had a ratio of at least 10 per cent in 2000, while 16 did in 2018. Four countries increased their ratio by at least 10 percentage points between 2000 and 2018, and 7 increased it by 5–9 percentage points.
Indirect taxes dominate income taxes, raising the possibility that tax systems are regressive but also implying space for collecting additional revenue from income taxes. Low overall tax capacity and large tax gaps signal the potential for raising additional tax revenue by closing these gaps. With comprehensive tax reforms, Africa could raise additional tax revenue of 3 per cent of GDP ($72 billion) a year.
To achieve the SDGs and the aspirations of Agenda 2063, African countries need to increase revenue generation in ways that are equitable and sustainable:
1. To ensure that the tax system is progressive, neutral, fair and efficient, African governments should address the system as a whole, rather than each tax separately. In this way, governments may find additional opportunities to expand the tax base, create more certainty for taxpayers and contextualize any global standards.
The overall weighted tax revenue to GDP ratio for the continent has been declining since 2004, underscoring the slower pace of tax growth than income growth.
2. To broaden the tax base, African countries need to include more and more diverse payers in the tax net.
• The low contribution of payroll and workforce taxes and property taxes (taxing income from properties) signals areas that need particular attention to increase revenue by broadening the tax base.
• Governments should formulate policies to bring the informal economy and agriculture into the tax system, taking care to avoid harming low-income workers.
3. To deepen the tax base, African countries need to review their VAT regulations to reduce the policy gaps (excess use of exemptions and zero or reduced rates). Many African countries’ VAT collection efficiency is well below 50 per cent, indicating that improving VAT collection could increase overall tax revenue collection. (Compliance gaps are covered in chapter 5 on tax administration.)
United Nations Economic Commission for AfricaFiscal Policy for Financing Sustainable Development in Africa
7070
4. African governments should leverage information and communication technology to improve revenue generation. African governments could promote the spread of information technology by using tax policy to support the dissemination of information technology. Information technology facilitates digitization of economic information and makes it easier to tax economic activity. Information technology could be used to bring more economic agents within the tax system (for example, by registering informal workers, using e-tax filing to make it easier to file taxes and simplifying payment processes) and make it easier for them to comply with fair taxation policies.
5. African governments should support development of the digital economy to expand the type of economic activities that
To achieve the SDGs and the aspirations of Agenda 2063, African countries need to increase revenue generation in ways that are equitable and sustainable.
could generate additional revenue. In doing this, governments need to set up infrastructure and legal frameworks to prepare for the complex economic operations of the digital economy, which are susceptible to tax evasion and avoidance.
6. African governments should improve governance in revenue collection by combating corruption and bolstering accountability to reduce inefficiencies in tax collection, which could help realize an extra 3 per cent of GDP in tax revenues.
The most widely used measure of VAT performance in the tax literature is the VAT Collection Efficiency (C-efficiency) indicator proposed by Ebrill et al.
Chapter 3 Tax policy and performance in Africa

ANNEX 3.1 MEASURING VALUE ADDED TAX PERFORMANCE IN AFRICA
ANNEX 3.2 AVERAGE CORPORATE TAX RATE BY REGION OR GROUP, 2018
(2001), which measures the actual VAT revenue as a proportion of potential VAT revenue (assuming perfect enforcement of a uniform VAT on all consumption, which would be a C-efficiency ratio of 1 or 100 per cent).
It is computed as:
Departures from a C-efficiency ratio of 1 or 100 per cent (the benchmark VAT) signal a VAT collection inefficiency, which can result from either policy gaps or compliance gaps (Cnossen, 2015). Policy gaps arise from provisions in VAT policy or laws relating to exemptions or zero and other reduced rates for some categories of consumption. Compliance gaps arise from shortcomings in VAT administration that result in lower revenue than would be expected from VAT policy or law, including operational inefficiency, limited capacity and fraud. While the C-efficiency measure has
VAT C-efficiency =Actual VAT revenue
Standard rate * Final consumption
limitations7 (see Keen, 2013), it is a useful indicator of a country’s VAT performance.
The C-efficiency ratio by itself does not indicate the extent to which policy gaps or compliance gaps account for the departure of VAT collections from the benchmark VAT; examination of VAT laws and the efficiency of tax administration in various countries helps to contextualize the gaps that undermine VAT revenue collection. Chapter 5 examines issues in tax administration in Africa, shedding light on shortcomings in government policy and actions that cause compliance gaps in VAT collection.
7 Limitations include unreliability of consumption data, especially in Africa. Keen (2013) also raised technical shortcomings—including non-uniformity in defining consumption across countries, the treatment of purchases by non-residents and public sector consumption—which potentially lead to overestimating the VAT and could undermine cross-country comparisons.
AfricaAsiaEuropeNorth AmericaOceaniaSouth AmericaBRICSEUG20G7OECDWorld
REGION OR GROUP AVERAGE RATE WEIGHTED AVERAGE RATE NUMBER OF COUNTRIES
28.81%20.65%18.38%23.01%22.00%28.08%28.40%21.86%27.37%27.63%23.93%23.03%
28.39%26.42%25.43%26.22%27.04%32.20%27.33%26.03%27.18%27.21%26.58%26.47%
5046493317135
28197
36208
Source: Tax Foundation 2018, Corporate Tax Rates Around the World 2018
United Nations Economic Commission for AfricaFiscal Policy for Financing Sustainable Development in Africa
71

Adeyiga, George K. 2013. “Baseline Study of Ghana’s Tax System. Baseline Study of Ghana’s Tax System [online].” Available at: http://www.maketaxfair.net/assets/Ghana-Baseline-study-310713.pdf (Accessed 18 November 2018).
ADB (Asian Development Bank). 2018. “Understanding the Digital Economy: What Is It and How Can It Transform Asia?” New Delhi, India: ADB. Available at: https://www.adb.org/news/events/understanding-digital-economy-what-it-and-how-can-it-transform-asia (Accessed 15 October 2018).
ATAF (African Tax Administration Forum). 2014. “Taxation of SMEs in Africa, Good Practices and Lessons Learned: A Case Study of the Ghana Tax Stamp Project.” Pretoria, South Africa. Cited in G. Dube and D. Casale (2016), “The Implementation of Informal Sector Taxation: Evidence from Selected African Countries.” eJournal of Tax Research 14 (3). Available at: https://www.researchgate.net/publication/312218247_The_implementation_of_informal_sector_taxation_Evidence_from_selected_African_countries(Accessed 24 December 2018).
Ayee, J. 2007. “Building Tax Compliance through Reciprocity with Government.” Paper presented at the Foreign Investment Advisory Service of the World Bank Group Regional Conference, Accra, Ghana, 10–11 January.
Bakwena, Malebogo. 2012. “The Recent Economic Reforms in Botswana: A Critical Assessment.” Botswana Journal of African Studies 26 (1): 43.
Barone, G., and S. Mocetti. 2011. “Tax Morale and Public Spending Efficiency.” International Tax and Public Finance 18 (6): 724–749. https://doi.org/10.1007/s10797-011-9174-z
Baum, A., S. Gupta, E. Kimani and S.J. Tapsoba. 2017. “Corruption, Taxes and Compliance.” Working Paper 17/255. Washington, DC: IMF. Available at: https://
REFERENCES www.imf.org/en/Publications/WP/Issues/2017/11/17/Corruption-Taxes-and-Compliance-45379 (Accessed 30 August 2018).
Bird, Richard, and Sally Wallace. 2003. “Is It Really so Hard to Tax the Hard-to-Tax? The Context and Role of Presumptive Taxes.” ITP Paper 0307. Toronto, ON: International Tax Program, Institute for International Business, Joseph L. Rotman School of Management, University of Toronto.
Bird, Richard, and Eric Zolt. 2005. “Redistribution via Taxation: The Limited Role of the Personal Income Tax in Developing Countries.” ITP Paper 0508. Toronto, ON: International Tax Program, Institute for International Business, Joseph L. Rotman School of Management, University of Toronto.
Black, P., E. Calitz and T. Steenkamp. 2015. Public Economics. 6th Edition. Oxford, UK: Oxford University Press.
CIAT (Inter-American Center of Tax Administrations). 2018. Taxation in Digital Economy. Panama City, Panama: CIAT. Available at: https://www.ciat.org/taxation-in-digital-economy/?lang=en (Accessed 15 October 2018).
Cnossen, S. 2015. “Mobilizing VAT Revenues in African Countries.” International Tax and Public Finance 22 (6): 1077–1108. Available at: https://www.researchgate.net/publication/276344974_Mobilizing_VAT_revenues_in_African_countries.
Coulibaly, B.S., and D. Gandhi. 2018. “Mobilization of Tax Revenues in Africa: State of Play and Policy Options.” Policy Brief. Washington, DC: Brookings Institution. Available at: https://www.brookings.edu/wp-content/uploads/2018/10/Mobilization-of-tax-revenues_20181017.pdf (Accessed 16 November 2018).
Davis Tax Committee. 2014. “Addressing Base Erosion and Profit Shifting In South Africa.” Available at: http://www.taxcom.org.za/docs/New_Folder/1
per cent20DTC per cent20BEPS per cent20Interim per cent20Report per cent20- per cent20The per cent20Introductory per cent20Report.pdf (Accessed 15 October 2018).
Dube, G., and D. Casale. 2016. “The Implementation of Informal Sector Taxation: Evidence from Selected African Countries.” eJournal of Tax Research 14 (3): 601–623.
ECA (United Nations Economic Commission for Africa). n.d. Economic Report on Africa 2019 Country Case Study Report for Chad. Mimeo. Addis Ababa, Ethiopia: ECA.
Ebrill, L., M. Keen, J.P. Bodin and V Summers, 2001. The Modern VAT. Washington, DC: International Monetary Fund.
Franzsen, R.C.D., and W.J. McCluskey. 2017. Property Tax in Africa: Status, Challenges, and Prospects. Cambridge, MA: Lincoln Institute of Land Policy. Available at: http://www.worldbank.org/en/country/nigeria/overview (Accessed 24 August 2018).
Government of Kenya 2013. “Value Added Tax Act of Kenya, 2013.” Kenya Gazette Supplement No. 119 (Acts No. 35). Nairobi, Kenya. Available at: http://admin.theiguides.org/Media/Documents/VATper cent20per cent20Actper cent202013_1.pdf.
———. 2014. “Finance Act of Kenya, 2014.” Nairobi, Kenya. Available at: http://kenyalaw.org/kl/fileadmin/pdfdownloads/Acts/Finance_Act_16of2014Final.pdf.
———. 2016. “Finance Act of Kenya, 2016.” Nairobi, Kenya. Available at: http://kenyalaw.org/kl/fileadmin/pdfdownloads/AmendmentActs/2016/FinanceAct_No38of2016.pdf.
Government of Mauritius. 2018. Finance (Miscellaneous Provisions) Act 2018. Port Louis, Mauritius. Available at: https://www.fscmauritius.org/en/fsc-newsletter/relevant-amendments-in-line-with-
72
Chapter 3 Tax policy and performance in Africa
the-finance-miscellaneous-provisions-act-2018.
Government of Rwanda. 2001. “Law no. 06 of 20/01/2001 on the code of Value Added Tax (Rwanda).” Kigali, Rwanda. Available at: http://admin.theiguides.org/Media/Documents/Law%20on%20Code%20of%20Value%20Added%20Tax%202001.pdf.
Hearson, M. 2016. “Measuring Tax Treaty Negotiation Outcomes: The ActionAid Tax Treaties Dataset.” ICTD Working Paper 47. Brighton, UK: International Centre for Tax and Development. Available at: http://www.ictd.ac/publication/measuring-tax-treaty-negotiation-outcomes-the-actionaid-tax-treaties-dataset/ (Accessed 18 August 2018).
IBFD (International Bureau of Fiscal Documentation). 2018. IBFD: Your Portal to Cross Border Tax Expertise [online]. Available at: http://www.ibfd.org/ (Accessed 18 October 2018).
ICTD (International Centre for Tax and Development) and UNU-WIDER (United Nations University–World Institute for Development Economics Research). 2018. The Government Revenue Dataset [database]. Available at: https://www.wider.unu.edu/project/government-revenue-dataset (Accessed November 2018).
IEG (Independent Evaluation Group). 2012. “IEG ICR Review: Tax Modernization Project.” Report ICRR13952. Washington, DC: World Bank. Available at: http://documents.worldbank.org/curated/en/401541474628191025/pdf/000020051-20140625191436.pdf.
Imam, P.A., and D.F. Jacobs. 2007. “Effect of Corruption on Tax Revenues in the Middle East.” Working Paper WP/07/270. Washington, DC: IMF. Available at: http://www.imf.org/external/pubs/ft/wp/2007/wp07270.pdf (Accessed 31 August 2018).
IMF (International Monetary Fund. 2018a. Regional Economic Outlook Sub-Saharan Africa Domestic Revenue Mobilization and Private Investment. Washington, DC: IMF. Available at: https://www.imf.org/en/Publications/REO/SSA/Issues/2018/04/30/sreo0518.
———. 2018b. “Chad: Debt Sustainability Analysis.” IMF Country Report 18/108. Washington, DC: IMF. Available at: https://www.imf.org/external/pubs/ft/dsa/pdf/2018/dsacr18108.pdf.
Jakurti, E. 2017. “Taxing the Digital Economy: It’s Complicated.” Future Development [blog]. Washington, DC: Brookings Institution. Available at: https://www.brookings.edu/blog/future-development/2017/12/13/taxing-the-digital-economy-its-complicated/ (Accessed 15 October 2018).
Joshi, A., and J. Ayee. 2002. “Taxing for the State? Politics, Revenue and the Informal Sector in Ghana.” IDS Bulletin 3 (3): 1–9. Available at: https://www.researchgate.net/publication/292358307_Taxing_for_the_state_Politics_revenue_and_the_informal_sector_in_Ghana (Accessed November 2018).
Joshi, A., W. Pritchard and C. Heady. 2014. “Taxing the Informal Economy: The Current State of Knowledge and Agendas for Future Research.” Journal of Development Studies 50 (10): 1325–1347
Kaiser, K., C. Bredenkamp and R. Iglesias. 2016. Sin Tax Reform in the Philippines: Transforming Public Finance, Health, and Governance for More Inclusive Development. Directions in Development. Washington, DC: World Bank.
Keen, Michael. 2013. “The Anatomy of the VAT.” Working Paper 13/111. Washington, DC: IMF. Available at: https://www.imf.org/external/pubs/ft/wp/2013/wp13111.pdf (Accessed 18 October 2018).
Khaldun, I. 1967. The Muqaddimah: An Introduction to History, Volume 1. 2nd Edition. Translated by F. Rosenthal. Princeton, NJ: Princeton University Press.
Koatsa, N.J., and M.A. Nchake. 2017. Revenue Productivity of the Tax System in Lesotho. Roma, Lesotho: National University of Lesotho.
Kundt, T.C. 2017. “Opportunities and Challenges for Taxing the Informal Economy and Subnational Taxation.” K4D Emerging Issues Report. Brighton, UK: Institute of Development Studies.
Laffer, A.B. 2004. “The Laffer Curve: Past, Present and Future.” Backgrounder 1765 (June). Washington, DC: The Heritage Foundation.
Langer, A., and F. Stewart. 2015. “Regional Imbalances, Horizontal Inequalities, and Violent Conflicts: Insights from Four West African Countries.” Fragility, Conflict, and Violence Group. Washington, DC: World Bank.
Medina, L., A. Jonelis and M. Cangul. 2017. “The Informal Economy in Sub-Saharan Africa: Size and Determinants.” Working Paper WP/17/156. Washington, DC: IMF. Available at: https://www.imf.org/en/Publications/WP/Issues/2017/07/10/The-Informal-Economy-in-Sub-Saharan-Africa-Size-and-Determinants-45017 (Accessed 13 October 2018).
Mirrlees, J., S. Adam, T. Besley, R. Blundell, S. Bond, R. Chote, M. Gammie, P. Johnson, G. Myles and J.M. Poterba. 2011. Tax by Design. London: Institute for Fiscal Studies.
Moore, M. 2013. “Africa’s Tax Systems: Progress, but What is the Next Generation of Reforms?” People, Spaces, Deliberation [blog]. Washington, DC: World Bank. Available at: http://blogs.worldbank.org/publicsphere/africa-s-tax-systems-progress-what-next-generation-reforms (Accessed 23 September 2018)
Musgrave, R.A., and P.B. Musgrave. 1976. Public Finance in Theory and Practice. New York: McGraw-Hill.
United Nations Economic Commission for AfricaFiscal Policy for Financing Sustainable Development in Africa
73

National Treasury. 2018. “VAT on E-Services: South Africa’s Experience.” Pretoria, South Africa: National Treasury. Available at: http://www.un.org/esa/ffd/wp-content/uploads/2018/05/2018-ECOSOC-ICTM_SM_Digital_ABaig.pdf (Accessed 15 October 2018).
National Treasury and SARS (South African Revenue Service). 2016. 2016 Tax Statistics. Pretoria, South Africa. Available at: http://www.sars.gov.za/AllDocs/Documents/Tax Stats/Tax Stats 2016/Tax Stats 2016 Full document web.pdf (Accessed 11 October 2018).
OECD (Organisation for Economic Co-operation and Development). 2016. “Revenue Statistics: African Countries.” OECD.Stat [database]. Paris: OECD Publishing. Available from: https://stats.oecd.org/index.aspx?DataSetCode=REV (Accessed 11 October 2018).
———. 2018. “Revenue Statistics in Africa: Ghana (Edition 2017).” OECD Tax Statistics [database]. Paris: OECD Publishing. Available at: https://doi.org/10.1787/6bc4f1d2-en (Accessed 13 October 2018).
Raczkowski, K., and B. Mróz. 2016. “Tax Gap in the Global Economy.” Available at: https://www.researchgate.net/publication/302335548_Tax_gap_in_the_global_economy.
Rahman, S.A. 2017. “Egypt: VAT Increased to 14%”International Tax Review [online]. 23 August. Available at: http://www.internationaltaxreview.com/Article/3744500/Egypt-VAT-increased-to-14.html (Accessed November 2018).
SARS (South African Revenue Service). 2018. SARS Ready to Implement VAT Rate Increase. Pretoria, South Africa. Available at: http://www.sars.gov.za/Media/MediaReleases/Pages/27-March-2018---SARS-ready-to-implement-VAT-rate-increase.aspx (Accessed 18 October 2018).
Tanzi, V., and H. Zee. 2001. “Tax Policy for Developing Countries.” Economic Issues 27. Washington, DC: IMF. Available from: https://www.imf.org/external/pubs/ft/issues/issues27/ (Accessed 30 August 2018).
Tax Foundation, 2018. Corporate Tax Rates Around the World, 2018, published on 27 November 2018 available at https://taxfoundation.org/corporate-tax-rates-around-world-2018/ accessed on 12 March 2019
Terkper, S. 2003. “Managing Small and Medium-Size Taxpayers in Developing Economies.” Tax Notes International. Special Report, 13 January 2003: 211–234.
Transparency International, Corruption Perceptions Index 2017, available at: https://www.transparency.org/news/feature/corruption_perceptions_index_2017#table
Van de Poel, J. 2016. “In Search of a New Balance: The Impact of Belgian Tax Treaties on Developing Countries.” Brussels: Eurodad. Available at: http://eurodad.org/files/pdf/56ceae983f5d3.pdf(Accessed 8 October 2017).
Varela, P. 2016. “What Are Progressive and Regressive Taxes?” Canberra, Australia: Australian National University, Tax and Transfer Policy Institute. Available at: https://taxpolicy.crawford.anu.edu.au/files/uploads/taxstudies_crawford_anu_edu_au/2016-11/progressive_varela_feb_2016_complete.pdf (Accessed 26 August 2018).
Wanniski, J. 1978. “Tax, Revenues and the ‘Laffer Curve.’” National Affairs–The Public Interest 37 (Winter).
World Bank. 2017. “Modernization, Taxpayer Education Provide Good Foundation for Tax Collection in Tanzania.” Washington, DC: World Bank. Available at: http://www.worldbank.org/en/results/2017/01/05/modernization-taxpayer-education-provide-good-foundation-for-tax-collection-in-tanzania (Accessed 18 November 2018).
———. 2018a. “Agriculture, Forestry and Fishing, Value Added (per cent of GDP).” World Bank national accounts data and OECD National Accounts data files. Washington, DC: World Bank. Available at: https://data.worldbank.org/indicator/NV.AGR.TOTL.ZS?end=2017&locations =ZG&start=1981&view=chart (Accessed 18 October 2018).
———. 2018b. World Development Indicators [database]. Washington, DC: World Bank.
74
Chapter 3 Tax policy and performance in Africa

76
United Nations Economic Commission for AfricaFiscal Policy for Financing Sustainable Development in Africa