Embed Size (px)
Citation preview

45
CHAPTER 3 Variation in quantitative characters in the morphological and anatomical phylogeny of Loudetia and Loudetiopsis 3.0 Abstract Loudetiopsis was created from parts of Loudetia, Trichopteryx and Tristachya, but Phipps (1967) and Clayton (1972) have noted that there is no boundary with Loudetia. Cladistic analysis was therefore performed to ascertain the circumscriptions of Loudetia and Loudetiopsis and to infer hypotheses of species relationships, classifications and biogeography based on morphological and anatomical data. Discrete character states were determined from quantitative anatomical and morphological data using the box and whisker graph method. The ranges of species were compared to determine if there were gaps on which to base decisions for coding character states into binary and multistate characters. Results showed that quantitative morphological characters yielded few discrete character states in the Arundinelleae, with only one (3%) potential phylogenetic character (the length of the awn of the upper lemma) and no discrete character state in the quantitative anatomical data. The length of the awn of the upper lemma is a uniquely-derived character state which defines the Loudetia togoensis – annua – hordeiformis clade. Thus, although the number of discrete and potentially phylogenetically important character states is small, exclusion of quantitative characters may result in the loss of potential phylogenetic signal. Plotting the range and standard deviation of the length of each character on graphs has also revealed taxa with ranges that otherwise do not overlap, indicating seemingly different evolutionary steps, are connected by intermediates and therefore assigned one ordinal code based on lack of the gaps in ranges. This represents the loss and / or distortion of phylogenetic signals. The method of determining discrete character states therefore needs to be improved. Cladistic analyses show that members of the genus Loudetiopsis are nested well within the Loudetia clade, implying that the two genera are inseparable. Therefore this study proposes that Loudetiopsis be subsumed into Loudetia, with the resultant genus becoming monophyletic. One of the hypotheses explaining the chaotic character state distributions among genera is that hybridization may have occurred in the history of the Arundinelleae. This hypothesis can be drawn from conflicting hypotheses of species relationships generated by anatomical and morphological data sets in separate analyses and from high levels of homoplasious character distributions. As a result of unspecialized characteristics, the circumscriptions of species in Loudetia have been problematic, resulting in unstable classifications. A revised classification of the genus is provided. 3.1 Introduction
46
3.1.1 Classification of Loudetia Loudetia Hochst. ex Steud. had been classified into 5 sections: Sect. Loudetia C.E. Hubb., Sect. Pleioneura C.E. Hubb., Sect. Pseudotristachya C.E. Hubb., Sect. Paratristachya C.E. Hubb. and Sect. Lophanthera C.E. Hubb. (Hubbard, 1936,1937). Section Loudetia was further subdivided into 6 subsections (Table 3.1). The heterogeneity of the genus led to the exclusion of 3 sections from Loudetia. A new genus, Loudetiopsis, had been created partly comprising Loudetia Sect. Pseudotristachya (Conert, 1957). Loudetia Sect. Paratristachya and Sect. Pleioneura had been transferred to Tristachya Nees Sect. Diandrostachya Conert (Conert, 1957) and Danthoniopsis Stapf (Clayton, 1967), thus reducing Loudetia to 2 sections: Sect. Loudetia and Sect. Lophanthera (Table 3.2). Table 3.1. Summary of Hubbard’s (1934, 1937, 1949) classification scheme. * = names currently in use in the genus, to which must be added Loudetia pedicellata. Section Type species Additional species I. Loudetia
Subsect. a Flammida Subsect. b Typicae Subsect. c Pungentes Subsect. d Acuminata, Subsect. e Densispica Subsect. f Annua
L. elegans L. flammida* L. elegans L. demeusei* L. acuminata L. densispica* L. hordeiformis*
L. phragmitoides L. angolensis,* L. arundinecea,* L. camerunensis, L. cerata, L. kagerensis,* L. simplex* and L. thomasii L. crassipes, L. lanata* and L. longipes L. filifolia,* L. flavida,* L. migiurtina and L. pennata, L. coarctata* L. tisserantii and L. vanderystii*. L annua,* L. eriopoda and L. gossweileri
II. Pleioneura L. ramosa L. anomala
III. Pseudotristachya L. ternata L. ambiens, L. baldwinii, L. capillipes, L. glabrata, L. trigemina, and L. villopes
47
IV. Paratristachya L. superba L. bequaertii, L. hitchcockii and L. lualabaensis
V. Lophanthera L. togoensis*
In spite of active taxonomic research (Phipps, 1964, 1966, 1972a-e; Clayton, 1967, 1972; Lubke & Phipps, 1973; Li & Phipps, 1973), the circumscription of Loudetia is still not satisfactory. For instance, the inclusion of L. pedicellata (Stent) Chippind. by Chippindall (1955) in Loudetia is controversial because the species shares a number of morphological characters with species in the genus Tristachya Nees. The spikelets (including glumes and lower lemma) and callus of the upper floret are longer in L. pedicellata than in the rest of the genus, these are among the most important characters in distinguishing Loudetia from Tristachya Nees. Loudetia pedicellata is therefore allied to species in Tristachya. Table 3.2. The classification of Loudetia after the exclusion of Sect. Peudotristachya, Sect. Paratristachya and Sect. Pleioneura by Conert (1957) and Clayton (1967). Only species currently treated under Loudetia in the present study are listed. No.
Section
Subsection
Included species
1a Loudetia Typicae L. angolensis C.E. Hubb. L. arundinacea (Hochst. ex A. Rich.) Steud. L. kagerensis (K. Schum.) C.E. Hubb. ex Hutch. L. camerunensis (Nees) C.E. Hubb. L. simplex (Nees) C.E. Hubb.
1b Loudetia Pungentes L. demeusei (De Wild) C.E. Hubb. L. lanata (Stent & Rattray) C.E. Hubb.
1c Loudetia Acuminata L. filifolia Schweick. L. flavida (Stapf) C.E. Hubb.
1b Loudetia Densispicae L. coarctata (A. Camus) C.E. Hubb. L. densispica (Rendle) C.E. Hubb. L. tisserantii C.E. Hubb. L. vanderystii (De Wild) C.E. Hubb.

48
1e Loudetia Annuae L. annua (Stapf) C.E. Hubb. L. hordeiformis (Stapf) C.E. Hubb.
1f Loudetia Flammidae L. flammida (Trin.) C.E. Hubb. L. phragmitoides (Peter) C.E. Hubb.
2 Lophanthera L. togoensis (Pilg.) C.E. Hubb. 3 Insertae sedis L. kagerensis non (K. Schum.) C.E. Hubb. ex
Hutch. L. pedicellata (Stent) Chippind.
3.1.2 Phylogenetic relationships of species of Loudetia Species in Loudetia had been arranged in a presumed genealogical relationship (Hubbard, 1936, 1937), but it was not until 1967 that the first explicitly phylogenetic hypothesis was published (Phipps, 1967). In this hypothesis, the placement of terminal taxa was based on phenetic affinities and deductive reasoning, then commonly used methods. Subsections of Loudetia Sect. Loudetia were presented in separate cladograms and a monotypic section, Lophanthera, was omitted. In this way, the relationships between members of sections and subsections were not clearly discernible. The separation between Loudetia and Loudetiopsis was not supported by non-homoplasious characters (Phipps, 1967). Loudetiopsis therefore formed a grade (not clade) within the Loudetia clade. This emphasized the reservation workers had on the use of the generic name Loudetiopsis, but the genus had still been treated as a distinct entity. The previous phylogenetic hypothesis (Phipps, 1967) offered the most detailed account of species relationships at that time. However, increased knowledge of the genus necessitated changes in species composition. Changing terminal taxa often alters the pattern of species relationships (Sanderson & Donoghue, 1989). This implies that Phipps’ (1967) phylogenetic hypothesis may no longer be consistent with the present knowledge of Loudetia. 3.1.3 Creation of the genus Loudetiopsis The ad hoc pattern of character state distributions, exacerbated by disagreements among workers in perceptions on what should constitute a genus, has long been realized as the main cause of problems in circumscribing genera and their constituent species in the Arundinelleae - thereby producing unstable classifications (Phipps, 1964; Clayton, 1967). For example, the genus Loudetiopsis was created from parts of Loudetia, Trichopteryx Nees and Tristachya in a bid to achieve narrowly defined groups, but Loudetiopsis itself has remained highly variable. Thirteen species originally belonged to this genus (Table 3.3). Loudetiopsis, L. thoroldii Phipps and L. scaettae (A. Camus) W.D. Clayton (Phipps, 1966; Clayton, 1972) were added later in 1966 and 1972. Loudetiopsis chevalierii, L. fulva, L. purpurea, L. ternata and L. villosipes were transferred to Tristachya leaving the genus with 9 species (marked with an
49
asterisk (*) in Table 3.3). This circumscription of Loudetiopsis has sparked controversy over its lack of distinctive boundaries (Phipps, 1967, Clayton, 1972). Consequently, workers reluctantly accepted Loudetiopsis, as circumscribed by Conert (1957) and revised by Phipps (1966) and Clayton (1972). Because of the lack of distinguishing characteristics between Loudetia and Loudetiopsis, a suggestion that the two genera be combined into one was made (Clayton, 1972). Similarly, species of Loudetia, as circumscribed by Hubbart (1934, 1936, 1937, 1949, 1957), have been subject to considerable movement among the genera Danthoniopsis, Loudetiopsis and Tristachya (Conert, 1957; Phipps, 1964; Clayton, 1972) as reviewed in this study. The most controversial group in the Arundinelleae is the genus Loudetiopsis Conert, which is defined by the disposal of spikelets in close triads with the disarticulation occurring below the triad in most species (Conert, 1957; Clayton, 1972). Most workers believe that these characters are not adequate to support the creation of the genus and they have accepted Loudetiopsis reluctantly (Phipps, 1964, 1967; Clayton, 1967; Lubke & Phipps, 1973). It was recommended that Loudetia and Loudetiopsis be combined into one genus (Clayton, 1972). However, Loudetiopsis is a heterogeneous assortment and combining the two genera may increase taxonomic confusion. Alternatively, Loudetiopsis could be subdivided, but this too has no justification (Clayton, 1972). It was finally suggested that the application of this generic name should be restricted to species with spikelets in close triads (Clayton, 1972). Despite this uncertainty, the circumscription of Loudetiopsis has not been tested using contemporary cladistic methods. It was therefore envisaged that including all known species of the two genera in a cladistic analysis would help ascertain the generic circumscriptions of Loudetia and Loudetiopsis (this study).

50
Table 3.3. Species of Loudetiopsis as circumscribed by Conert (1957). * = species be considered to belong to Loudetiopsis. Species of Loudetiopsis The name before Conert’s (1957) revision L. ambiens (K. Schum.) Conert* Trichopteryx ambiens K. Schum. L. capillipes (C.E. Hubb.) Conert* Loudetia capillipes (Chev.) C.E. Hubb. L. chevalierii (Stapf) Conert Tristachya chevalierii Stapf L. chrysothrix (Nees) Conert* Tristachya chrysothrix Nees L. fulva (C.E. Hubb.) Conert Tristachya fulva C.E. Hubb. L. glabrata (K. Schum.) Conert* Trichopteryx glabrata K. Schum. L. glabrinodis (C.E. Hubb.) Conert* Tristachya glabrinodis C.E. Hubb. L. kerstingii (Pilg.) Conert* Trichopteryx kerstingii Pilg. L. purpurea (C.E. Hubb.) Conert Tristachya purpurea C.E. Hubb. L. ternata (Stapf) Conert Trichopteryx ternata Stapf L. thoroldii (C.E. Hubb.) Phipps* Loudetia thoroldii C.E. Hubb. L. trigemina (C.E. Hubb.) Conert* Loudetia trigemina C.E. Hubb. L. tristachyoides (Trin.) Conert* Tristachya tristachyoides (Trin.) C.E. Hubb. L. villosipes (C.E. Hubb.) Conert Loudetia villosipes C.E. Hubb.
Low internal branch support and high levels of homoplasious character state distributions in grass phylogenies have been reported for the Arundinoideae (Phipps, 1964; Clayton, 1967, 1972; Barker, 1993; Barker et al., 1995), but also elsewhere for the grass family, Bambusoideae and Pooideae, Briza complex and Macrochloa Kunth. (Kellog & Watson, 1993; Bayón, 1998; Mathews & Sharrock, 1999; Vázquez & Barkworth, 2004). Most clades leading to the Arundinoideae lacked non-homoplasious synapomorphies and subsequently received no bootstrap support (Grass Phylogeny Working Group, 2000: 391, 397). It may imply that there is little evolutionary evidence stored in most of the characters used to decipher grass phylogenies. This assertion is supported by the chloroplast non-coding rp116, which has yielded well supported trees at familial level (Zhang, 2000); indicating that the distribution of uninformative characters, if this is at the crux of this problem, may be taxon-specific or the high homoplasy levels may be due to the choice and processing of characters. In general, the delimitation of genera and their constituent species has been problematic partly due to the lack of morphologically specialised characteristics in the Arundinelleae (Phipps, 1964; Clayton, 1972; Stebbins, 1981; Barker, 1995).

51
Causes of the low internal branch support and high levels of homoplasy in the Arundinelleae have not been investigated, but they have been postulated as (1) the possible influence of recent evolutionary divergence without adequate time for or with low rates of extinction to eliminate the intermediate morphotypes (Clayton, 1967), (2) the occurrence of hybridization in the evolutionary history of the group (Clayton, 1967), (3) rapid evolution (Clayton, 1967) and (4) introgression among progenitors (Phipps, 1964) to which might be added (5) error in character selection and character state definitions. These problems can be sammarized into two broad scenarios: firstly, problems due to the evolutionary history of the Arundinelleae (first to fourth points) and secondly, the selection and formulation of characters (fifth point). 3.1.4 Hybridization – a hypothesized evolutionary pathway If hybridization has played a major role in the evolutionary history of the group, results of any cladistic analysis should be viewed with considerable reservation (Vázquez & Barkworth, 2004). Such reservation would be applicable particularly in analyses employing characters that are governed by the interaction of many genes, including shapes and linear measurements (Mickevich & Weller, 1990; Vázquez & Barkworth, 2004). Apparently, the chance that some chromosomes and dominant or co-dominant alleles in gene loci may be acquired from a hybridizing species is higher in characters expressed by many genes than it is if a single gene or gene locus is involved. Therefore such characters may exhibit a polyphyletic origin. Thus, evolutionary processes of speciation and extinction are likely not to have left a clear-cut set of informative characters with which to decipher genealogical relationships. Unfortunately, a priori knowledge of the history of character transformation is impossible and therefore the homoplasious pattern of character state distributions in tree topologies may be used as an a posteriori indicator of the complicated path of evolutionary divergence over time in a particular group. In addition, the process of evolutionary divergence cannot be tested (Bisby & Nicholls, 1977). Therefore, the extent to which the phylogenetic signal inherent among morphological and anatomical characters that may have been derived from a single ancestral lineage in the Arundinelleae might have been dampened by characters that might be inherited from more than one ancestor is unknowable. 3.1.5 Formulation of characters Error in the formulation of characters and character state definitions may be controlled by paying particular attention to the selection and definitions of characters and character states (Liu et al., 2003). Varying coding considerations for the same set of characters has been demonstrated to alter classifications based on phenetic analyses (Bisby & Nicholls, 1977). Taxonomic results are therefore also affected by the selection and coding decisions for characters (Farris, 1971; Bisby & Nicholls, 1977; Mishler, 2000). Thus, careful formulations, definitions and coding strategies for morphological and anatomical characters and character states may produce stable classifications inferred from the resultant cladograms. This may be true only in cases where the effect of error in the perception of character and character state distributions overshadows that of inherently ad hoc character and character state distribution patterns. If

52
the latter outweighs the effect of error, any attempt to carefully interpret and code character state distributions within the group would not enhance tree resolution and internal branch support in cladistic analyses. This study therefore offers an opportunity to examine character definitions in general by empirically identifying discrete character states from measurement data and determining their role in the cladistic analysis of Loudetia and Loudetiopsis based on morphological and anatomical attributes. Thus, it was felt that the pattern of distribution of quantitatively defined character states would shed light on the general status of character state boundaries in Loudetia and Loudetiopsis. 3.1.6 Quantitative characters Some workers question the merit of metric data in principle, including the determination of homologous attributes and the significance of means and / or methods used to derive discrete character states from continuous data (Stuessy, 1979; Pimentel & Riggins, 1987; Farris, 1990; Zelditch et al., 1995). They argue that quantitative characters cannot map the phylogeny of taxa and therefore propose that measurement data should not be used to infer genealogical relationships. One of the complaints refers to the optimization of discrimination or variance of scores, which may not portray similarities on which phylogenetic relationships of taxa are based, by principle component analysis, or the optimization of between-group variation by covariance analysis – thus characters found by these methods may not be homologous (Zelditch et al., 1995). However, Jansen (2003) suggests that characters defined using multivariate analysis, including principle components analysis may be phylogenetically informative – indicating differences in opinion. Equally compelling is the assertion that most qualitative characters, including shapes and linear measurements, are quantitative in nature (Baum, 1988; Thiele, 1993). In addition, evidence from genetic and population studies has shown that most morphological characters used by taxonomists, including expressions of height, weight and shape are correlated with evolutionary transformations (Mickevich & Weller, 1990; Lawrence, 2004; Vázquez & Barkworth, 2004). This correlation implies that quantitative characters may contain phylogenetic signals. The proposition that quantitative characters should be rejected in favour of qualitative ones might therefore be questionable - partly because it implies that characters differ in essence or degree and that some of these kinds can a priori be determined to have more phylogenetic information than others (Thiele, 1993). The inability to know the value of characters a priori then leads other authors to contend that excluding quantitative characters results in the loss of the phylogenetic information (Davis, 1993; Thiele, 1993; Zelditch et al., 1995; Rae, 1998; Jansen, 2003). Thus, the use of quantitative characters in cladistic analysis has fomented a debate which is still inconclusive. The difference in form between operational taxonomic units is normally considered to have two components: size and shape (Jansen, 2003). While shapes of characters have commonly been described qualitatively, the use of the size component of morphological attributes admixed with qualitatively defined traits has silently found application in cladistic analyses (Table 3.4). These quantitative characters are often converted into ordinal binary and multistate character using range intervals without stating the method employed

53
to derive discrete states from them. Some of these characters are defined in a manner that the boundary between states, if it exists, is not clear. Contrary to this common practice, when morphometric data comprise the main component of the data matrix, there are often disagreements over methods used to code them (Bisby & Nicholls, 1977; Johnston & Mickevich, 1977; Thorpe, 1984; Simmons, 2001). While qualitative characters and character states are easily determined, they are not always evident, and therefore difficult to discern in measurement data (Stevens, 1991). Measurement data are commonly treated by arbitrarily subdividing scales, which are then converted into ordinal character states (Almeida & Bisby, 1984; Stevens, 1991). Arbitrary definitions of character states may be informative only if characters have sharply discontinuous ranges (Almeida & Bisby, 1984; Thiele, 1993; Stern et al., 2004). Because range boundaries are not readily discernible, various methods of determining them have been developed (Table 3.5). Segment coding and geometric morphometrics are designed to convert the shape measurement into ordinal binary and multistate, but the application of the rest of the methods may be limited to variables of the linear scale type. In general, the standardization applied to most of these methods, including range coding, normalization and traditional morphometrics, has been the subject of criticism, partly because skewed distributions are not well represented, while minor divergence in character states may be dampened (Farris, 1990; Swiderski et al., 1998). In addition, sample sizes common in taxonomic studies may not be adequate for statistical treatments (Almeida & Bisby, 1984; Thorpe, 1984; Farris, 1990). Most methods allow for the partitioning of overlapping characters into character states (Table 3.5). For example, while 37 characters were identified using the range, segment and divergent coding methods, 27 of them were rejected by the gap coding method as having overlapping ranges (Thorpe, 1984). Therefore, except for the gap and its variants graph coding and dot plots, several of these methods appear to be based on the decision to partition overlapping ranges into ordinal character states. Since overlapping characters are not considered taxonomically valuable (Wilkin, 1999; Seitz et al., 2000), methods which fail to filter overlaps (Table 3.5) may not be appropriate. On the other hand, the gap method is dependent on the pooled standard deviation, which is prone to sampling error (Swiderski et al., 1998). The dot plots method developed by Swiderski et al. (1998) produces similar results as the graph method upon which it is based (Almeida & Bisby, 1984), but the graph method has been preferred in this study because of its visual simplicity. Table 3.4. Randomly selected quantitative characters that have been used in cladistic analyses, in which methods of deriving discrete character states have not been stated. Character Character state definition Source Ligule length 1.4-5.6 mm long (0) under 1.4 mm
long (1) over 5.6 mm long (2) Stuessy (1979)

54
Cypsela base Narrower than the fruit body (0) broader than the fruit body (1)
Swenson & Manns (2003)
Interjugal secretory ducts
Small or absent, 0.1 mm in diameter (0) very large, >0.2-0.8 mm (1) enormous, forming cavities, >0.8 mm (2)
Liu et al. (2003)
Main stem wings Absent or up to 1 mm broad (0) 2-4 mm broad (1) 12-20 mm (2)
Karis (2004)
3.1.7 Can morphological and anatomical character sets support the same hypothesis of species relationships in Loudetia? Evidence from different data sources may support the same phylogenetic hypothesis or conflicting hypotheses (Soltis & Kuzoff, 1995; Hedges & Maxson, 1996; Miyamoto, 1996; Normack & Lanteri, 1998; Wiens & Hollingsworth, 2000; Yoder et al., 2001). However, the debate on whether different datasets should be combined or analysed separately appears to be inconclusive. Several workers have suggested that different sources of data should be analysed separately to detect discrepancies in the estimates of phylogenetic hypotheses only if there is no significant incongruence between or among data sets (Hillis, 1987; Bull et al., 1993; de Queiroz, 1993; de Queiroz et al., 1995; Poe, 1996; Huelsenbeck et al., 1996; Normark & Lanteri, 1998). However, there are doubts if classes of data exist or they are just artifacts of technology and traditional philosophy and thus workers recommend analyses based on combined data sets (Doyle, 1992; Miyamoto & Fitch, 1995). This study will investigate whether morphological and anatomical characters support the same or conflicting phylogenetic hypotheses in Loudetia. Table 3.5. The methods of identifying discrete character states from measurement data. lsd = least significant difference, sd = standard
deviation, psd = pooled standard deviation, −
x = mean of sample variables, vs = versus - ie. compared to, ∑ x = the sum of sample variables. Method of analysis
Property Source Comment/Result
Divergent lsd Simon (1983) Overlaps allowed Segment Range divided into equal
segments Thorpe (1984) Overlaps allowed

55
Range RangestateChar. Thorpe (1984) Overlaps allowed Normalization −∑ x( sdx ) Thorpe (1984) Overlaps allowed
Traditional morphometrics
Identify groups based on similarities
Thorpe (1984) No phylogenetic relationships
Canonical variants
Calculate distance matrix
Thorpe (1984) No phylogenetic relationships
Geometric Thorpe (1984) Shapes analysed Euclidian distance matrix
Thorpe (1984) No phylogenetic relationships
Gap x
psd vs−⎛
⎝⎜
⎞
⎠⎟
1
xpsd
−⎛
⎝⎜
⎞
⎠⎟
2
... Thorpe (1984) Overlaps filtered
Graph Plot ranges & sd Almeida & Bisby (1984)
Overlaps filtered
Statistical test Compare means Rae (1998) Overlaps not filtered
Dot plots Plot ranges & sd Swiderski et al. (1998)
Overlaps filtered
3.2 Aims, objectives and questions 3.2.1 Overview. This study was conducted in two parts, a pilot study and a follow-up study. The pilot study was aimed at resolving the taxonomic placement of Loudetia pedicellata, investigating whether morphological, anatomical and leaf surface characters support the same hypothesis of species relationships and determining whether Loudetia is monophyletic. The follow-up study was aimed at investigating the use of and whether quantitative charatcers can shed light on the extensive homoplasy in Loudetia, determining the circumscriptions of Loudetia and Loudetiopsis, producing a classification of Loudetia, determining species relationships in Loudetia and inferring the age of the genus and some homoplasious characters in the genus. A summary of aims, objectives and questions is given below: 3.2.2 Aims
56
3.2.1 Testing the hypothesis of monophyly of Loudetia based on the cladistic analysis of morphological and anatomical data 3.2.2 Investigating if species relationships based on separate analyses of the morphological data set, the anatomical data set and the
leaf surface data set are similar. 3.2.3 Providing a hypothesis of species relationships based on the morphological and anatomical data set 3.2.4 Determining the phylogenetic contribution of quantitative characters in Loudetia and Loudetiopsis 3.2.5 Providing a classification of Loudetia from the cladogram 3.2.6 Investigating if biogeographical evidence can shed light on the age of the genus and its chaotic character distribution These aims will be achieved by attaining the following objectives: (1) Cladistically determine whether all species of Loudetia form one clade that is distinct from clades containing members of other
genera (2) Applying the Farris Incongruence Test to results obtained from separate analyses of the morphological data set, anatomical data set
and leaf surface data set (3) Determining discrete character states and their role in the phylogeny of Loudetia and Loudetiopsis (4) Cladistically analysing the morphological and anatomical data of all the species of Loudetia and those still belonging in
Loudetiopsis (5) Estimating the age of the genus and its chaotic character state distributions from the inferred biogeographical evidence (6) determining an estimation of the age of the genus from biogeographical evidence and applying the knowledge to explain the
chaotic character distributions in Loudetia.. Attempts have been made to answer the following questions: (1) Is Loudetia, as circumscribed by Hubbard (1934, 1936, 1937, 1949, 1957), monophyletic? (2) Can the placement of Loudetia pedicellata be cladistically supported? (3) Does the morphological data set give the same species relationships as the anatomical data set or leaf surface data set in the
Arundinelleae? (4) Is Loudetiopsis a distinct genus from Loudetia? (5) What are the species relationships as elucidated by the combined anatomical and morphological data set? (6) Are trees stable when the combined morphological and anatomical data set is altered by excluding one character at a time? (7) Are quantitative characters valuable in the cladistic analysis of species of Loudetia and Loudetiopsis?

57
(8) Can determining character boundaries quantitatively shed light on whether homoplasy in Loudetia is due to error in character formulation and coding or the evolutionary history of the group?
(9) Can biogeography offer clues about the estimated age of the genus Loudetia and its chaotic character distributions? (10) How does a classification inferred from the cladogram compare with previous classification schemes?
3.3 Rationale of the study The foregoing shows that there are still some uncertainties in the circumscription of Loudetia. For instance, Loudetia pedicellata, is included in Loudetia (Chippindall, 1955), but this placement needs re-examination. Previous work has demonstrated a lack of distinction between Loudetia and Loudetiopsis, thus some workers doubt if the creation of the latter was valid. An attempt to provide solutions to these problems forms a central theme of this chapter. 3.4 Materials and methods 3.4.1 Materials. Owing to the non-occurrence of many taxa in southern Africa and wide distribution of Loudetia species throughout tropical Africa, a comprehensive field-based study is impossible. Therefore, this study was mainly based on herbarium specimens. Field study was limited to the observation and collection of Loudetia camerunensis and L. simplex at Pullen Farm in Nelspruit and L. flavida at Melville Koppies Nature Reserve in South Africa during a pilot study. An extensive field study was undertaken during a follow-up study. Specimens on which this study is based are listed in Appendix 3.1. Voucher specimens were studied at J, MAL, PRE, SDNH and SRGH. In addition, K and B provided electronic images, ETH locality data and BR, EA, ETH, K, PAT, PRE, SRGH, UPS and UWO loans of herbarium specimens (abbreviations for herbaria follow Holmgren et al. (1991) and Smith & Willis (1999)). Depending on availability, up to twenty or more representative specimens per taxon for a widely distributed and highly variable species were sampled to determine variation in character states. Cladistic analyses were based on putative taxa, in which selected specimens represented each species. 3.4.2 Selection of ingroup taxa Materials were selected to include representative samples of all known species of Loudetia and a representative sample of members of the Aundinelleae (Appendix 3.1). Ten species of Loudetiopsis, representing all known species as reviewed in this thesis (Table 3.3) were included during a follow-up study (only 5 of them were studied during a pilot study), to determine the circumscriptions of Loudetia and Loudetiopsis. Representative species of the Arundinelleae: Arundinella (1 species), Danthoniopsis (6 species), Gilgiochloa (1 species), Trichopteryx (1 species) and Tristachya (4 species) were selected to ascertain if species of Loudetiopsis can

58
cluster with species of Loudetia and Tristachya as suggested by Clayton (1972) or form a distinct group and to determine if Loudetia is monophyletic. Because anatomical data were not available for 12 of them, the number of representive species of the Arundinelleae, including Loudetiopsis, was reduced to 10 in the analyses of the anatomical and combined data sets during the pilot study. For instance, Loudetiopsis was initially represented by 5 species in the analysis involving morphological characters of Loudetia and the 22 representative taxa of the Arundinelleae during the pilot study, but 3 of them were excluded in the anatomical and the combined data sets because materials for leaf anatomy were not available.
The separation of the Loudetia simplex complex into forms with and without tubercle-based hairs on glumes and lower lemma, designated as L. simplex and L. camerunensis, respectively, has been proposed in Chapter 2 of this thesis. Loudetia lanata occurs in two distinct forms based on inflorescence type. Loudetia lanata with a contracted panicle designated as Loudetia sp. affin. L. lanata to distinguish it from the open panicle type designated as L. lanata, appears to intergrade with L. simplex. Loudetia kagerensis (K. Schum.) C.E. Hubb. ex Hutch. has a bidentate callus with equal, short teeth while in L. kagerensis sensu Clayton & Renvoize (1989) designated as Loudetia sp. affin. L. kagerensis, the callus is entire and rounded to truncate. In addition, Loudetia sp. affin. L. kagerensis has distinct leaf and inflorescence architectures from those found in L. kagerensis. Tristachya pedicellata Stent was described in 1923 and Chippindall transferred it to Loudetia in 1955 (Stent, 1923; Chippindall, 1955). However, many workers have not applied the name Loudetia pedicellata (Stent) Chippind., including Conert (1957), Phipps (1964, 1966, 1967), Clayton (1967, 1972) and Lubke & Phipps (1973). It is, however, used in southern Africa (Anderson, 1990) so that it is important to clarify its placement. Loudetia pennata (Chiov.) C.E. Hubb. has been synonymized under L. flavida (Stapf) C.E. Hubb. (Clayton, 1972) which it superficially resembles, but it has been perceived as a distinct entity (this study) because the callus of the upper floret has 2 vestigial teeth, it possesses tubercle-based hairs on glumes and the inflorescence is denser than that of L. flavida. Two apparently undescribed entities: Loudetia sp. nov. 1 (Kamundi 2291, J) from eZemvelo Nature Reserve, South Africa and Loudetia sp. nov. 2 (Humbert 16697, PAT) from Angola have been included. In addition to herbarium specimens, Loudetia camerunensis, L. filifolia, L. flavida, L. simplex and Loudetia sp. nov. 1, have been studied in the field in Gauteng, Limpopo and Mpumalanga provinces of South Africa and in Swaziland. 3.4.3 Availability of caryopsis and karyological features in the Arundinelleae The types or shapes, sizes and surface features of caryopses in the Arundinelleae are variable. The Arundinellean caryopses are elongate or rounded, smooth or grooved and sizes range from tiny (about 1.2 mm long) to large (> 4 mm). Caryopsis character and character state variations appear to be useful in distinguishing between genera (this study). However, comparison of features across genera was not possible because of the scanty availability of caryopses in herbarium specimens and the incomplete nature of

59
information in literature. Chromosome numbers and ploidy levels may offer additional characters in the Arundinelleae (Phipps, 1964; Li et al., 1966; Phipps & Mahon, 1973). Cytological data in the Arundinelleae are still not comprehensive and materials for this kind of stduy could not be collected in the field because of the wide distribution of species in Africa, Madagascar and South America. The sampling of materials for karyological studies was further impossible because of the unavailability of viable seeds in herbarium specimens, which could be grown in a greenhouse to obtain meristematic tissue or pollen grain samples for cytological studies. 3.4.4 Preparation of materials for morphological study Only mature specimens were scored to control variation due to developmental stages. Growth cycle, leaf dimensions, inflorescence type and size, spikelet aggregation and size, shape of glumes, number of nerves of the upper lemma and morphology of the callus of the upper floret are some of the characters traditionally used to distinguish between taxa in Loudetia (Hubbard, 1934, 1937, 1949; Phipps, 1964, 1972c; Lubke & Phipps, 1973; Clayton, 1974). Each of these character states taken separately is not exclussively associated with a particular taxonomic group, but groups are defined by a unique combination of characters that are individually also found in other taxa as noted by Phipps (1964). Materials were softened using “Glass Master” solution, placed on a microscope slide and viewed with a dissecting microscope (Wild Heerbrugg M7A or Wild Heerbrugg M8). Minute characters were photographed using a Nikon Digital camera (DXM 1200, Model P.FMD) with ACT-1 computer software. Morphological characters (Figures 3.1 to 3.3) were coded based on Tables 3.6 & 3.8 and incorporated in data matrices (Tables 3.7 & 3.9). 3.4.5 Contribution of leaf anatomy in the taxonomy of the Arundinelleae The use of anatomical characters of the leaf (mainly shape of stomata, microhairs, silica bodies; shape and arrangement of chlorenchyma and shape and number of bundle sheaths) has provided support and additional information to help resolve taxonomic problems even at species level in grasses (Metcalfe, 1960; Li & Phipps, 1973; Ellis, 1976, 1979). When anatomical characters are used alone, the results of taxonomic treatments have been found to be consistent with those obtained by gross morphological studies (Renvoize, 1980). Conert (1957) ignored anatomical characters in his monograph of the Arundinelleae because of the lack of group-specific variation, but Phipps (1964) reports that the variation in leaf anatomical characters offers potential taxonomic characters. The taxonomic value Phipps (1964) attaches to anatomical characters has been followed by taximetric studies of the tribe based on leaf anatomical characters in 1973 (Li & Phipps, 1973; Lubke & Phipps, 1973). This study will investigate whether morphological and anatomical characters support the same or conflicting phylogenetic hypotheses in Loudetia. 3.4.6 Procedure for epon embedding and leaf sectioning

60
Segments of tissue from the median region of mature leaves of herbarium specimens were processed for light microscopy using conventional techniques of wax embedding and sectioning at 10 µm (Johansen, 1940) and of Epon embedding and semi-thin sectioning at 2 µm (Glauert & Phillips, 1965). Techniques for preparing specimens for electron microscopy (Electron Microscope Unit of the University of the Witwatersrand; unpublished) were used. Mature leaf portions without signs of damage, senescence or predation were sampled from the second or third leaf (from the base of the culm). Leaf samples were separately placed in small vials to which about 1 to 2 cm³ of “Glass Master” solution was added, put in a beaker, heated for 30 minutes using a pressure cooker at 80 kPa and left overnight to cool at room temperature. Tough material became reasonably soft when the process of heating was repeated for another 30 minutes after 18 to 24 hours. Initially, the samples were fixed in 10% formalin or in FAA overnight (or for longer periods) and washed in a phosphate buffer solution (PBS) 3 times for 5 minutes each, but the fixing had no effect on the cellular structure of dried leaf specimens and this process was subsequently omitted. PBS was prepared as follows: to 8g NaCl, add 0.2g KCl, 1.15g Na2HPO4, 0.2g NaH2PO4 at pH 2 and fill up to 1000 ml with distilled water (Johansen, 1940). The samples were dehydrated in an alcohol series at 50%, 70%, 90% and 2 changes of absolute alcohol for 30 minutes per treatment, cleared in half xylene and half absolute alcohol also for 30 minutes and placed in pure paraffin wax (2 changes for 30 minutes each). Embedding wax was added to the specimens in paraffin wax and left overnight in an oven at about 60ºC. This allowed embedding wax to infiltrate into the cells slowly and paraffin wax to evaporate (Johansen, 1940). Samples of about 2 to 5 mm long were embedded at the centre of the wax chamber by adding molten embedding wax, adjusting the orientation of portions of the leaf for transverse sectioning and leaving them overnight to dry at room temperature. Epon embedded leaf portions were sectioned using an ultra-microtome (Reichert OM U3). The leaf sections broke into tiny pieces, which may indicate that it was not possible to cut through silica bodies. It may be necessary to clear silica bodies using hydrofluoric acid (Johansen, 1940), but this was not tested. Ordinary wax (Lighthouse Special, Pat. Pend. 88/8386) was used to embed specimens instead of the embedding wax, but also with limited success. Consequently, an attempt was made to score some taxa from published information, mainly Conert (1957) and Lubke & Phipps (1973). Such information was not readily available for all the species under study. Therefore, the freezing microtome technique, considered appropriate only for green leaf material (Johansen, 1940), was employed. 3.4.7 Procedure for tissue tek embedding and leaf sectioning Leaf samples were softened by heating for 30 minutes in “Glass Master” solution using a pressure cooker at 80 kPa. A drop of tissue tek solution was placed onto a plate of a rota freezing microtome and just as it started to solidify, a piece of the softened leaf sample 2 to 5 mm long was placed onto it with veins orientated at right angles to the horizontal plane for transverse sectioning. The first drop of

61
tissue tek allowed leaf samples to stick onto the plate and more drops were added to cover the sample. The tissue tek solution covering the sample was allowed to freeze for 10 to 20 minutes before sectioning. The tissue tek-embedded leaf samples were then sectioned using a Leitz Wetzlar rota freezing microtome. This technique is fast, it produces better results than the wax embedding approach and it can be used to section leaf samples from herbarium materials. However, obtaining a complete transverse section (margin to margin) of the leaf is impossible as the frail sections tend to break into 2 or more parts because tissue tek melts fast and it therefore does not provide support to the sections. 3.4.8 Staining The tissue tek embedded leaf sections were stained following Johansen (1940). Two drops of safranin were added to the sections and left for 15 to 30 minutes before washing in 95% alcohol (2 changes) and absolute alcohol (once). A drop of fast green was added and left for one minute for differentiation. Samples were then washed again in absolute alcohol and xylol (2 changes each) and mounted on a microscope slide in a universal mounting solution (distrene, plasticizer, xylene (DPX)). The microscope slide was left overnight to dry at room temperature and viewed under a compound (Olympus BH-2) microscope fitted with a Nikon digital camera (DXM 1200). Computer packages (Act-1, Simplepc, Corel Photo-Paint 9 and Corel Draw) were used to process images. Leaf anatomical features (Figure 3.4) were assessed based on chacter and character state definitions and coding strategies (Table 3.6 for a pilot study & Table 3.8 for a follow-up study) and data were incorporated into a data matrix (Table 3.7 for a pilot study & Table 3.9 for a follow-up study).
3.4.9 Investigating stability of leaf anatomical characters Anatomical characters are reported to vary depending on the position of the leaf on the plant and the position of the sectioned portion within a leaf (Metcalfe, 1960). Such a variation might introduce an error when comparing characters from different portions of the same leaf and between leaves sampled from different species. Leaves were selected from basal, median and apical regions of each of Loudetia simplex and L. camerunensis from which sections were made from basal, median and apical portions in order to illustrate the extent to which characters are dependent on the position of the leaf on the plant and position of selected portions on the leaf. The location of the leaf on each plant was divided into basal, median and apical regions. One leaf was sampled from each of these basal, median and apical parts of the plant. Each of the selected leaves was in turn divided into the basal, median and apical portions. Samples 3-5 mm long were selected from the median position of each of the basal, median and apical portions of the leaf and sectioned. In addition, two portions of the leaf each 3-5 mm long were selected 5 mm from the ligule and 5 mm from the apex and sectioned. The resultant leaf sections were stained, mounted on microscope slides, photographed and observed for quantitative and qualitative characters using a Zeiss compound microscope. Measurements included the distance between first order vascular bundles,
62
height and width (at the widest point) of the first and second order vascular bundles, diameter of metaxylem of the first order vascular bundle, phloem strand, largest cells of the outer and inner bundlesheath of the first and second order vascular bundles, width of the abaxial epidermal layer and diameter of the largest bulliform cells (Figure 3.4). In addition, the number of cells of the inner and outer bundlesheath was counted. In each case, 5 or more measurements were made and the average calculated.
3.4.10 Preparation of leaf samples for surface characters Leaf surface features in grasses are taxonomically useful (Metcalfe, 1960; Ellis, 1976). Potentially useful characters include presence and type of micro-hairs and silica bodies, presence of prickle hairs and number of files of stomata. Samples of mature leaves were selected from the median region and softened as above. Two to three drops of safranin were added and left overnight. The samples were then washed in 95% alcohol until no more stain came off and then washed in absolute alcohol. A drop of fast green was added and left for one minute. The samples were washed again in absolute alcohol and in xylol and mounted in DPX. Images were viewed with a Nikon digital camera (DXM 1200) and processed using Act-1, Simplepc, Corel Photopaint and Corel Draw computer packages. Leaf surface features were scored using Table 3.6 and data were included in a data matrix (Table 3.7).
3.4.11 Character selection, definition and coding Definitions of characters and character states were initially obtained from literature (Pires et al., 2001) and observation of specimens. Some character state definitions from literature, including relative sizes of callus teeth, shape of callus apex, and arrangement, in which spikelets were consistently sessile or pedicellate in some entities (characters 45, 47 and 53, respectively), were modified to suit the group under study. Both anatomical and morphological characters were coded as binary- and multi-state (Wilkinson, 1995; Seitz et al., 2000). Character state changes were coded in a logical manner, with no assumptions about the evolutionary process (Farris, 2000). There is a disagreement on the use of overlapping characters in cladistic analyses. Some workers argue that overlapping characters are phylogenetically valuable (Almeida & Bisby, 1984; Thiele, 1993; Rae, 1998; Swiderski et al., 1998) whereas others state that they are uninformative and must be excluded from cladistic analyses (Seitz et al., 2000). In this study, attempts were made to exclude overlapping characters from the cladistic analysis. A list of anatomical and morphological characters, their definitions and coding strategies are presented in Tables 3.6 & 3.8 while Tables 3.7 & 3.9 present data matrices. The use of presence and absence of attributes has been criticized as phylogenetically uninformative because these are regarded as representing statements of complementarity, not homology (Farris, 1997; Siebert & Williams, 1998). However, the determination of character and character state homology becomes a problem when studying distantly related taxa (Nixon et al., 1994). Therefore the interpretation of absence of a feature becomes difficult mainly when comparing between distant relatives. In this study, only taxa belonging to the tribe Arundinelleae have been included in cladistic analyses, hence they are closely related and determining
63
homology did not present a serious problem. Therefore absence of a feature has been interpreted as loss during the evolutionary process in accordance with Vargas (2001).
3.4.12 Character polarization and tree rooting The outgroup comparison method was used to polarize characters and root trees (Mooi, 1989; Baum & Estabrook, 1996; Barriel & Tassy, 1998; Farris, 2000). A search for outgroups was conducted during the pilot study. Closely and distantly related putative outgroup taxa were investigated by including them in the analysis based on morphological characters only. Species from Arundinellean genera (Danthoniopsis viridis (Rendle) C.E. Hubb., Loudetiopsis ambiens (K. Schum.) Conert, L. kerstingii (Pilg.) Conert and Arundinella nepalensis Trin.) represented closely related putative outgroup taxa for Loudetia with Fingerhuthia africana Aitch. and F. sesleriiformis Nees representing distantly related putative outgroups. Character state coding in Panicum Linn. and Pennisetum Rich. (Panicoideae), Paspalum Linn., Aristida Linn., Chloris SW. and Echinochloa Beauv. resulted in an increase in character states coded as missing. These taxa were therefore not suitable for putative outgroup species. Closely related species: Danthoniopsis viridis, Loudetiopsis ambiens, L. kerstingii and Arundinella nepalensis did not form a node for outgroup species in a cladistic tree with more than one potential outgroup species. These were therefore not suitable candidates for outgroup species for Loudetia. Fingerhuthia africana Aitch. and F. sesleriiformis formed a node for outgroup species, making them suitable candidates for outgroup species. A molecular phylogeny showed that Andropogon Linn. is closely related to the Arundinelleae (Prof. Anthony Verboom, personal communication). Therefore, Andropogon apendiculatus, A. gayanus Kunth. and A. schirensis Hochst. were included in the analysis as outgroup taxa. Species relationships within each genus for trees generated when species of Andropogon were used as outgroup taxa were identicle to those produced when species of Fingerhuthia were outgroups, but the former resulted in the length of the most parsimonious trees being shorter than those generated in the Fingerhuthia analysis. Therefore, species of Andropogon were selected during analyses based on combined anatomical and morphological data sets in the pilot and follow-up studies, because they produced the most parsimonious trees.
3.4.13 Data analysis
All characters were equally weighted, with multistate characters unordered, for objectivity (Fitch, 1971; Baum & Estabrook, 1996; Meacham, 1984; Linder, 1988; Sanderson & Donoghue, 1989; Seitz et al., 2000). 3.4.13.1 Pilot study

64
Cladistic analyses were performed on separate and combined data matrices of morphological and anatomical characters and leaf surface data set (Table 3.7). There was need to answer the questions: (1) to what extent are phylogenetic hypotheses generated from analyses based on morphological, anatomical and leaf surface characters congruent? and (2) how does the phylogenetic hypothesis generated by the combined morphological and anatomical data compare with separate hypotheses? This necessitated implementing separate and combined analyses and calculating the coefficient of incongruence between data sets based on the incongruence length differential (ILD) method (Farris et al., 1994, 1995). The heuristic search procedure of WINCLADA, version 1.00.08 (Nixon, 2002), was performed on separate and the combined data sets with tree bisection-reconnection branch swapping (TBR + TBR) used as the branch-swapping algorithm. The program was set to keep up to 100 most parsimonious trees in memory. Characters were optimized using the slow optimization option. The characters and character state distributions were mapped onto the tree. Unsupported branches were displayed in a collapsed mode. When more than one equally most parsimonious tree was produced, a Nelsen consensus tree was calculated to display areas of agreement. Bootstrap analyses, with 100 replicates, were performed to represent a quantitative evaluation of relative internal support of clades (Felsenstein, 1985; Hoot et al., 1999). The following scheme of internal branch support was applied: >50% representing no support, 50 to 74% weak support, 75 to 84% moderate and 85 to 100% strong support (Pires et al., 2001).
3.4.13.2 Follow-up study
A heuristic parsimony search was performed on: (1) the combined anatomical and morphological qualitative data set (Characters 0-75; Tables 3.8 & 3.9), but excluding quantitative characters and (2) the combined data set, including one quantitative character (characters 0-76; Tables 3.8 & 3.9) using WINCLADA as above. The number of random addition replicates was increased from 100 (pilot study) to 1,000,000 while allowing 10,000 trees to be kept in memory and 1,000 starting trees. A strict consensus tree was calculated (as above). The number of bootstrap replicates was increased from 100 to 10,000, with a maximum of 1,000 trees held per random addition replicate to ease computational constraints (Beck et al., 2002).
65
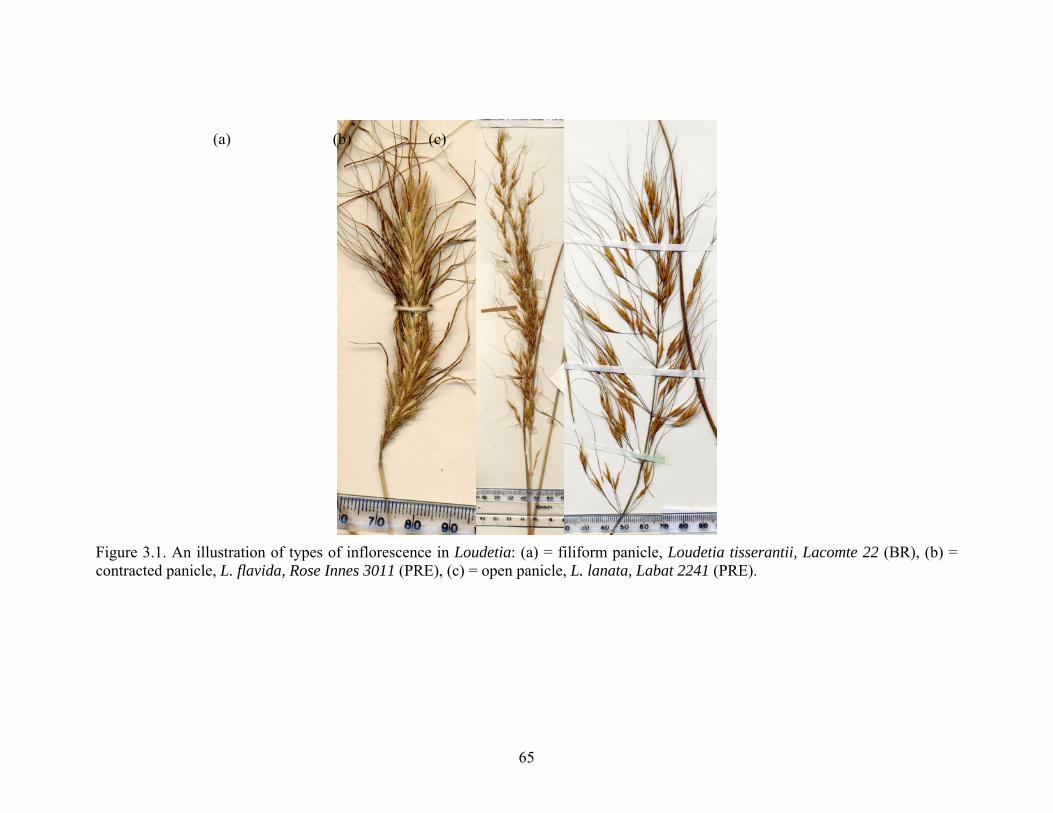
Figure 3.1. An illustration of types of inflorescence in Loudetia: (a) = filiform panicle, Loudetia tisserantii, Lacomte 22 (BR), (b) = contracted panicle, L. flavida, Rose Innes 3011 (PRE), (c) = open panicle, L. lanata, Labat 2241 (PRE).
(c) (b) (a)
66
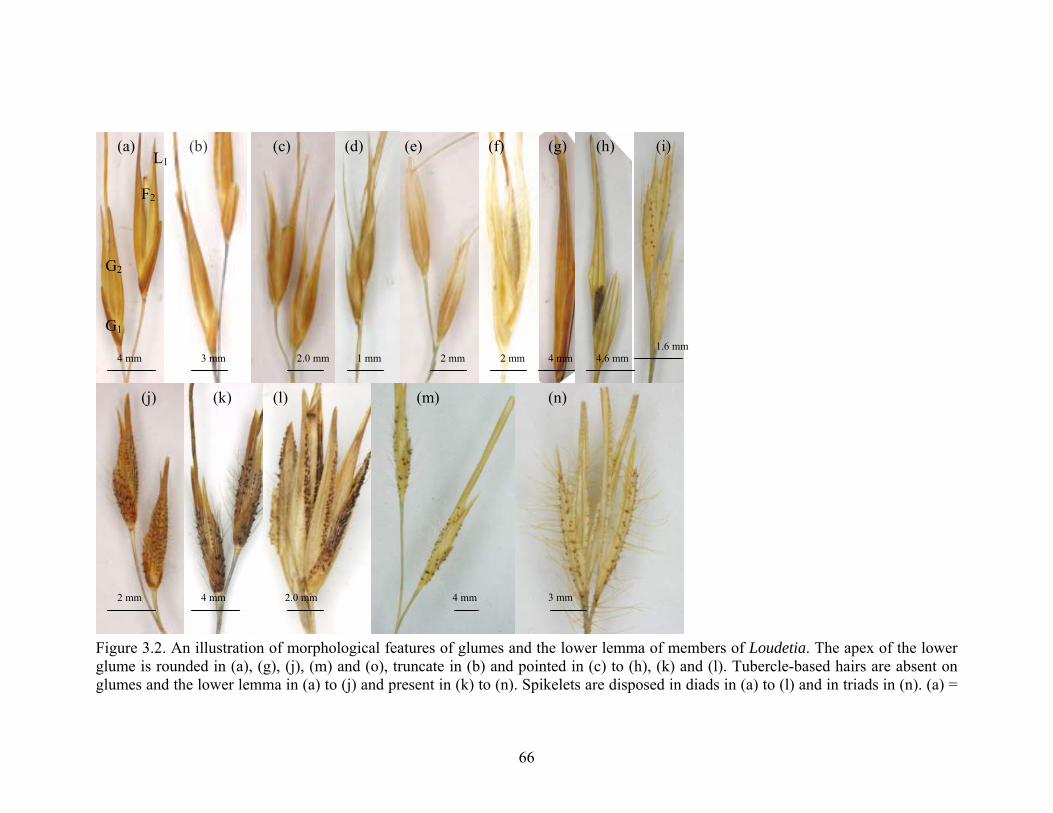
Figure 3.2. An illustration of morphological features of glumes and the lower lemma of members of Loudetia. The apex of the lower glume is rounded in (a), (g), (j), (m) and (o), truncate in (b) and pointed in (c) to (h), (k) and (l). Tubercle-based hairs are absent on glumes and the lower lemma in (a) to (j) and present in (k) to (n). Spikelets are disposed in diads in (a) to (l) and in triads in (n). (a) =
ap (a)
F2
G1
G2
L1 (b) (c) (e) (d) (f) (g)
1 mm 4 mm 3 mm 2.0 mm 2 mm 2 mm 4 mm
(h)
4 mm 2.0 mm 2 mm
1.6 mm 4.6 mm
(i)
4 mm 3 mm
(j) (k) (l) (m) (n)

67
Loudetia arundinacea, Phipps & Vesey-Fitzgerald 3008 (PRE, SRGH); (b) = L. camerunensis, Kamundi 2485 (J); (c) = L. filifolia, Smook 7411 (PRE); (d) L. flavida, Ankrah 20278 (PRE); (e) = L. flammida, Sendulsky 41 (UWO); (f) L. phragmitoides, Chapman & Chapman 8590 (MAL, MO, SHRG); (g) = L. pedicellata, Galpin 9174 (PRE); (h) = L. togoensis, Risopoulos 1255 (BR), (i) = L. annua, Rose Innes 31100 (PRE); (j) = L. kagerensis, Reekmans 6323 (PRE); (k) = L. simplex, Helm 134 (J); (l) = L. vanderystii, Devred 1863 (PRE); (m) = L. hordeiformis, Santo 3498 (PRE); (n) = Loudetiopsis kerstingii, Rose Innes 30684 (PRE). F2 = upper floret, G1 = lower glume, G2 = upper glume, L1 = lower lemma, ap = apex.
68
(k)
(a) (b) (c) (d)
160 μm 400 μm 280 μm 530 μm
(e) (g) (h) (i)
690 μm 320 μm 125 μm 470 μm 65 μm 570 μm
(m) (l) (n) (o)
1120 μm 400 μm 420 μm 390 μm 400 μm
(f)
(k)
(j)

69
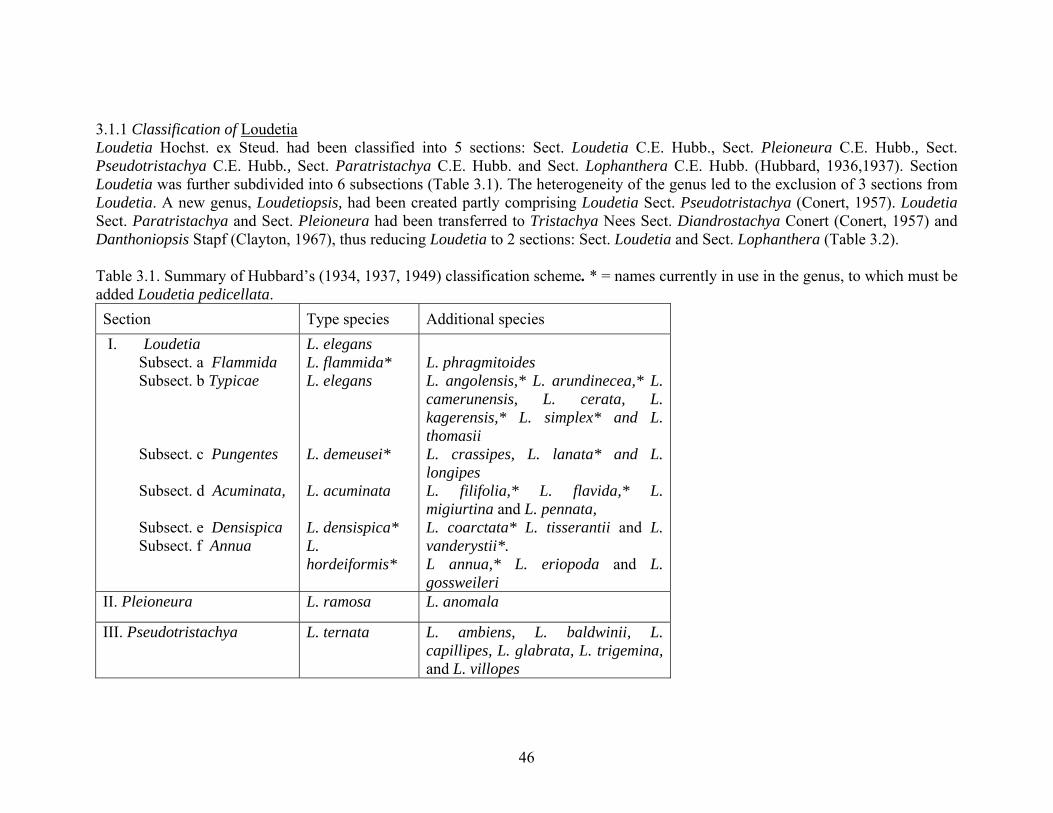
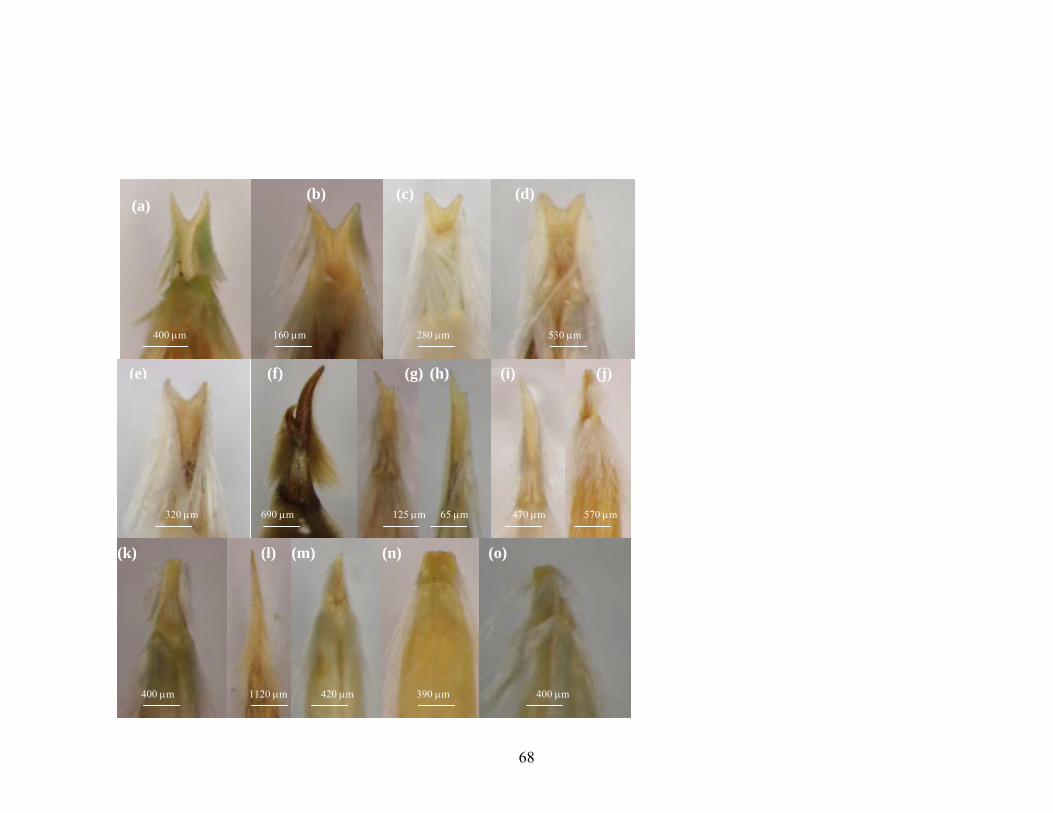
Figure 3.3. An illustration of the morphology of the callus of the upper floret. The callus is conspicuously bidentate with equal teeth in (a) to (e) and unequal teeth in (f) to (i) and inconspicuously bidentate in (j) to (o). It is entire with pungent apex in (m) and (n) and rounded to truncate in (p) to (r). (a) = L. annua, Rose Innes 31100 (PRE); (b) = L. kagerensis, Reekmans 6323 (PRE); (c) = L. cmerunensis, Kamundi 2485 (J); (d) = L. coarctata, Gerald 103 (PRE); (e) = L. vanderystii, Devred 1863 (PRE); (f) = L. togoensis, Risopoulos 1255 (BR); (g) = L. demeusei, Devred 2907 (PRE); (h) = L. densispica, Jeanes 333 (SRGH); (i) = L. lanata, Crook 655 (SRGH); (j) = Loudetia angolensis, Travão 113 (PRE); (k) = L. arundinacea, Phipps & Vesey-Fitzgerald 3008 (PRE, SRGH); (k) = L. filifolia, Smook 7411 (PRE); (l) = L. pedicellata, Galpin 9174 (PRE); (m) = L. flavida, L. Chipunga 91 (SRGH); (n) = L. flammida, T. Sendulsky 41 (UWO); (o) = L. phragmitoides, & Chapman 8590 (MAL, MO, PRE, SRGH).
(a) (b)
(d)
(g)
(e)
(h)
(c)
(f)
(i)

70
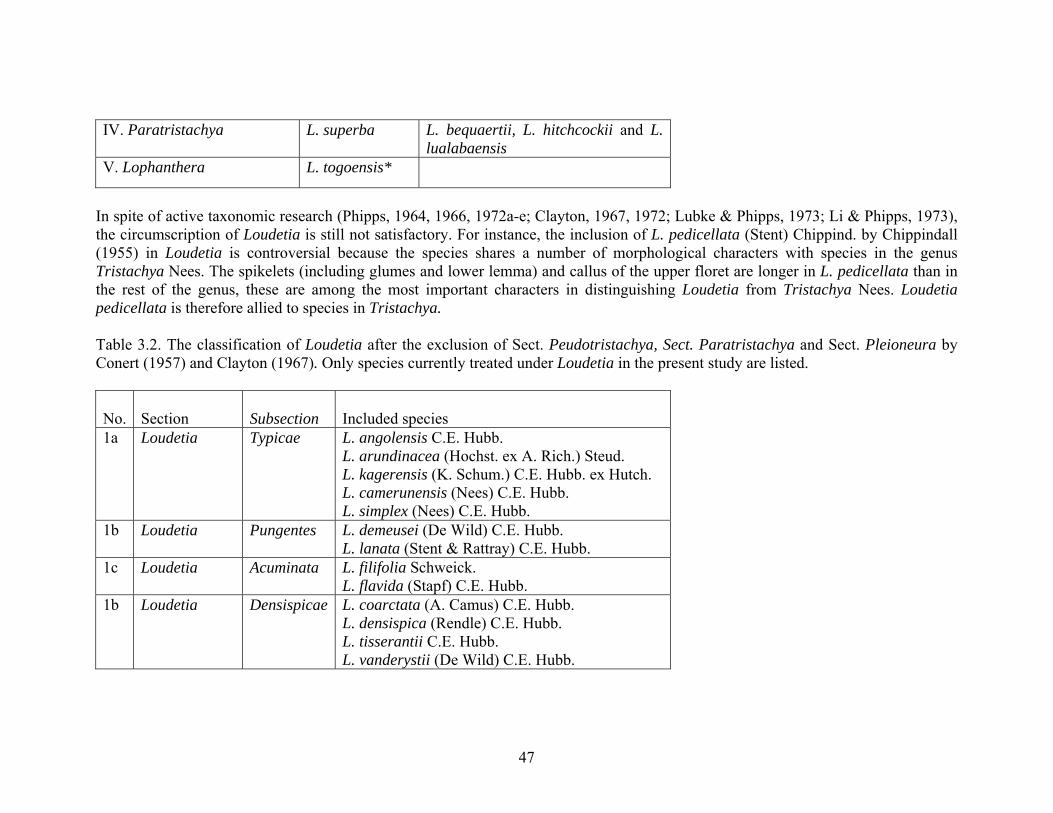
Figure 3.4. Transverse sections of the median region of the leaf showing distribution patterns of the first, second and third order vascular bundles. (a) Arundinella nepalensis, Lubke 1498 (J), (b) = Gilgiochloa indurata, Burtt 2023 (PRE), (c) = Trichopteryx marungensis,Williamson 1004 (PRE), (d) = Danthoniopsis chimanimaniensis, Simon 2378 (PRE), (e) = D. dinteri, Codd 3914 (PRE), (f) = Loudetia filifolia, Nel 5577 (PRE), (g) = D. pruinosa, Strey 3714 (PRE), (h) = D. ramosa, Geiss S245 / CB (PRE) and (i) = D. viridis, Wild 7545 (PRE).
(e)
1750 μm
350 μm

71
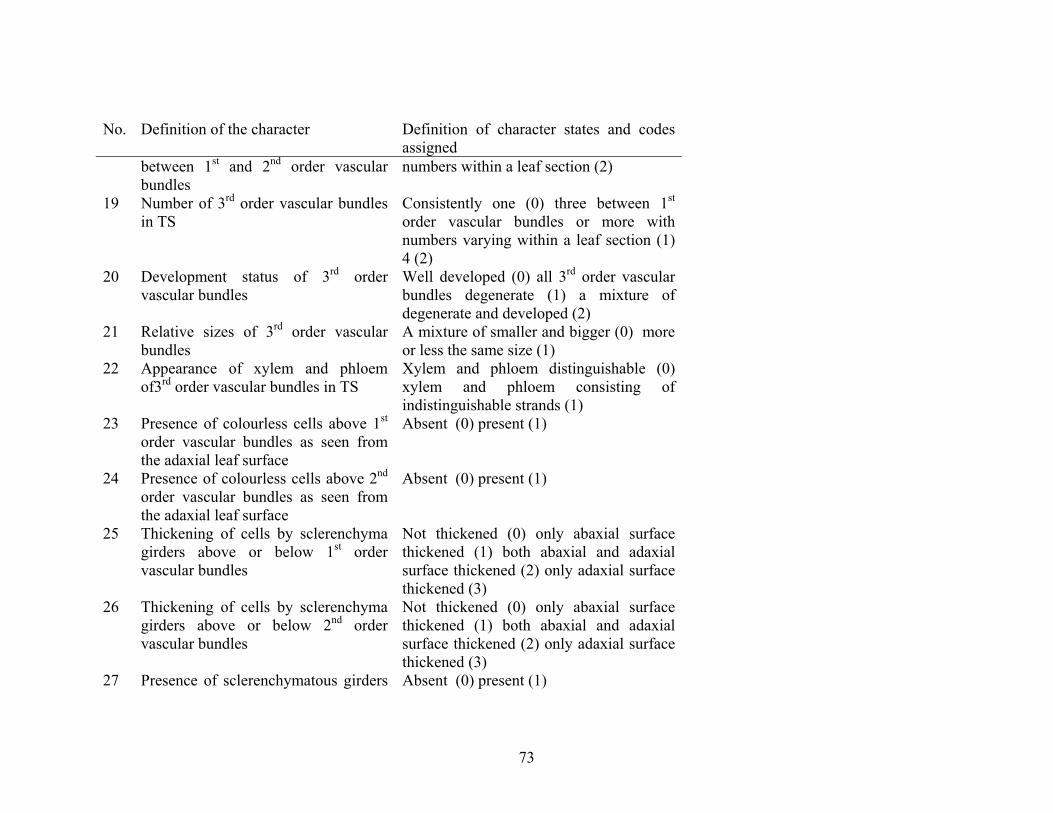
Table 3.6. Character state coding strategies for morphological and anatomical characters. Characters 0 to 28 and 57 to 73 constitute the anatomical characters and 29 to 56 the morphological characters. Codes used for character states are in parentheses in the right hand column.
No. Definition of the character Definition of character states and codes assigned
Qualitative anatomical characters 0 Shape of adaxial leaf surface in T.S. More or less flat (0) undulating (1) 1 Shape of adaxial furrow >90º (0) narrow, ≤90º (1) 2 Depth of adaxial furrow relative to
leaf thickness Equal to or less than ¼ of the leaf thickness (0) greater >¼ of the leaf thickness (1)
3 Distribution of adaxial furrow with respect to 3rd order vascular bundles
Above 3rd order vascular bundles only (0) above 3rd order vascular bundles, but also overlay 2nd or 1st order vascular bundles (1)
4 Nature of bulliform and associated colourless mesophyll cells
Simple layer of bulliform cells only (0) forming an arch clasping 3rd order vascular bundles (1) deeply penetrating fans, but not arches (2)
5 Relative depths of bulliform cells and associated colourless mesophyll cells, if present on adaxial leaf surface
Spanning at least half or more of the leaf thickness (0) spanning less than half of the leaf thickness (1)
6 Presence of bulliform-like cells at the abaxial surface of leaves
Absent (0) present (1)
7 Height of bulliform cells relative to that of 1st order vascular bundles
1st order vascular bundles protruding above the height of bulliform cells (0) more or less the same height (1) bulliform cells protruding above the height of 1st
72
No. Definition of the character Definition of character states and codes assigned order vascular bundles (2)
8 Shape of 1st order vascular bundles in TS
Linear (0) circular or ovate (1)
9 Shape of 2nd order vascular bundles in TS
Linearly elongate across the depth of the leaf (0) more or less ovate (1) circular (2)
10 Shape of 3rd order vascular bundles in TS
More or less ovate (0) predominantly triangular (1)
11 Shape of tips of 1st order vascular bundles as seen from the adaxial leaf surface
Rounded (0) flat topped (1)
12 Shape of tips of 2nd order vascular bundles as seen from the adaxial leaf surface
Rounded (0) flat topped (1)
13 Number of 1st order vascular bundles associated with a mid-rib in TS
One (0) two or more (1)
14 Number of files of bundle sheath cells of 1st order vascular bundles in TS
One (0) two (1)
15 Interruption of outer bundle sheath of 1st order vascular bundles by sclerenchyma girders
Not interrupted (0) only adaxially interrupted (1) only abaxially interrupted (2) interrupted both adaxially and abaxially (3)
16 Phloem strands of 1st order vascular bundles divided or not
Not divided (0) divided into 2 (1) divided into three (2)
17 Number of 2nd order vascular bundles between 1st order vascular bundles in TS
Consistently one (0) more than one (1)
18 Number of 3rd order vascular bundles Consistently one (0) up to two (1) variable
73
No. Definition of the character Definition of character states and codes assigned
between 1st and 2nd order vascular bundles
numbers within a leaf section (2)
19 Number of 3rd order vascular bundles in TS
Consistently one (0) three between 1st order vascular bundles or more with numbers varying within a leaf section (1) 4 (2)
20 Development status of 3rd order vascular bundles
Well developed (0) all 3rd order vascular bundles degenerate (1) a mixture of degenerate and developed (2)
21 Relative sizes of 3rd order vascular bundles
A mixture of smaller and bigger (0) more or less the same size (1)
22 Appearance of xylem and phloem of3rd order vascular bundles in TS
Xylem and phloem distinguishable (0) xylem and phloem consisting of indistinguishable strands (1)
23 Presence of colourless cells above 1st order vascular bundles as seen from the adaxial leaf surface
Absent (0) present (1)
24 Presence of colourless cells above 2nd order vascular bundles as seen from the adaxial leaf surface
Absent (0) present (1)
25 Thickening of cells by sclerenchyma girders above or below 1st order vascular bundles
Not thickened (0) only abaxial surface thickened (1) both abaxial and adaxial surface thickened (2) only adaxial surface thickened (3)
26 Thickening of cells by sclerenchyma girders above or below 2nd order vascular bundles
Not thickened (0) only abaxial surface thickened (1) both abaxial and adaxial surface thickened (2) only adaxial surface thickened (3)
27 Presence of sclerenchymatous girders Absent (0) present (1)
74
No. Definition of the character Definition of character states and codes assigned
linking 3rd order vascular bundles to adaxial and abaxial epidermal cells
28 Presence of a distinct column of pericyle cells enclosing xylem cavities of 1st order vascular bundles
Absent (0) present (1)
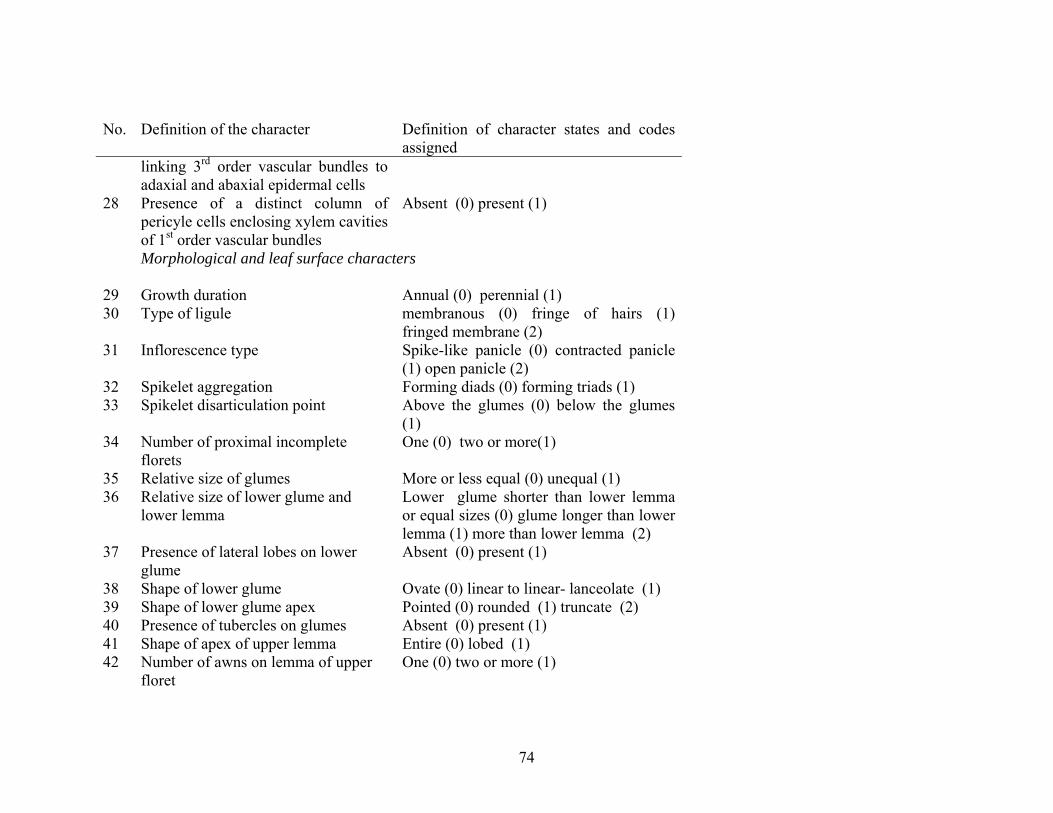
Morphological and leaf surface characters
29 Growth duration Annual (0) perennial (1) 30 Type of ligule membranous (0) fringe of hairs (1)
fringed membrane (2) 31 Inflorescence type Spike-like panicle (0) contracted panicle
(1) open panicle (2) 32 Spikelet aggregation Forming diads (0) forming triads (1) 33 Spikelet disarticulation point Above the glumes (0) below the glumes
(1) 34 Number of proximal incomplete
florets One (0) two or more(1)
35 Relative size of glumes More or less equal (0) unequal (1) 36 Relative size of lower glume and
lower lemma Lower glume shorter than lower lemma or equal sizes (0) glume longer than lower lemma (1) more than lower lemma (2)
37 Presence of lateral lobes on lower glume
Absent (0) present (1)
38 Shape of lower glume Ovate (0) linear to linear- lanceolate (1) 39 Shape of lower glume apex Pointed (0) rounded (1) truncate (2) 40 Presence of tubercles on glumes Absent (0) present (1) 41 Shape of apex of upper lemma Entire (0) lobed (1) 42 Number of awns on lemma of upper
floret One (0) two or more (1)

75
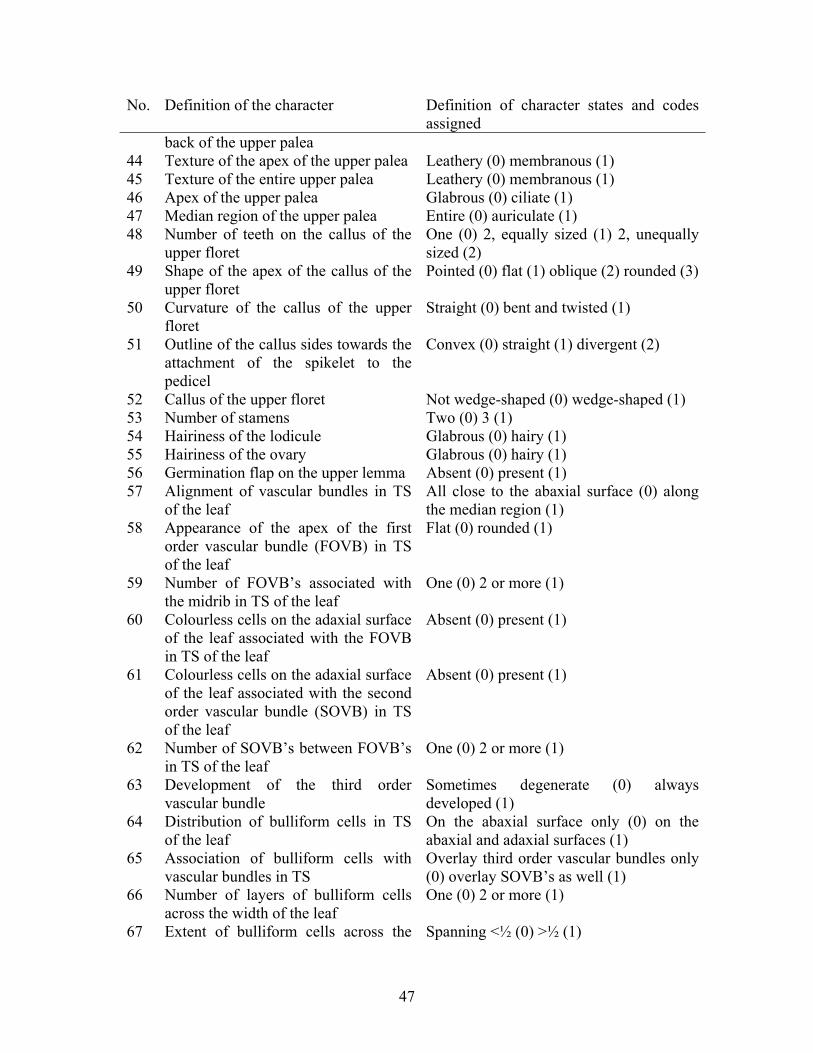
No. Definition of the character Definition of character states and codes assigned
43 Presence of a germination flap on lemma of upper floret
Absent (0) present (1)
44 Gender of lower floret Sterile (0) male (1) hermaphrodite (2) 45 Shape of the apex of palea of upper
floret Entire (0) bilobed) (1)
46 Callus of upper floret Entire (0) two-toothed (1) 47 Relative sizes of callus teeth More or less equal (0) one tooth longer
than the other (1) 48 Surface view of callus apex Deeply incised (0) shallowly emarginate
(2) more or less flat topped to narrowly convex (1)
49 Shape of callus tips Pungent (0) truncate (1) oblique (2) 50 Number of stamens Two (0) three (1) 51 Shape of hilum Elongate (0) ovate (1) 52 Shape of caryopsis Circular (0) elongate (1) 53 Culms branching Not branched (0) branched (1) 54 Spikelets subtended by spathes or not Espatheate (0) subtended by spathes (1) 55 Spikelets arranged in a combination of
sessile and pedicellate aggregations Both or all spikelets pedicellate (0) lower spikelet sessile and upper shortly pedicellate (1)
56 Awn with distinct column and bristle Distinct (0) not distinct (1) 57 Presence of prickle hairs on adaxial
leaf surfaces Absent (0) present (1)
Leaf surface characters 58 Type of prickles on adaxial leaf
surfaces Short and relatively broad-based (0) long and narrow-based and both short and broad-based (1) both long and narrow-based (2)
59 Presence of micro-hair on adaxial leaf Absent (0) present (1)

76
No. Definition of the character Definition of character states and codes assigned
surface 60 Number of cells per micro-hair on
adaxial leaf surface Two (0) both two and three-celled micro-hairs present (1)
Length of distal cell relative to basal cell of micro-hair on adaxial leaf surface
Distal cells shorter (0) more or less equal or distal cells longer (1)
61 Shape of basal cells of micro-hair on adaxial leaf surface
More or less cylindrical (0) funnel-shaped (1)
62 Basal cell of micro-hair on adaxial leaf surface straight or bent near the attachment
Straight (0) bent (1)
63 Distribution of micro-hair on adaxial leaf surface
Restricted to intercellular spaces between veins (0) on intercellular spaces along and between veins(1)
64 Number of files of stomata between veins
One (0) two (1) three to four on adaxial leaf surface (2) five or more (3)
65 Stomata deeply situated in inter-vein depressions or laying on the surface on adaxial leaf surface
Laying on the surface (0) deeply situated (1)
66 Distances between stomata along files on adaxial leaf surface
Short (0) 2 stomata-lengths in between long, more than two stomata-lengths in between (1)
67 Type of subsidiary cells of guard cells of stomata on adaxial leaf surface
Long cells (0) hexagonal(short) cells (1) both long and cells, but they occur in distinct files hexagonal (2)
68 Outline of subsidiary cells of guard cells on adaxial leaf surface
Smooth (0) shallowly to deeply sinuous (1)
69 Nature of areas of contact between guard cells and lateral subsidiary cells
Flat (0) guard cells bulge towards subsidiary cells (1) both guard and lateral
77
No. Definition of the character Definition of character states and codes assigned
on adaxial leaf surface (2) subsidiary cells bulge towards each other subsidiary cells bulge towards guard cells (3)
70 Type of silica bodies on veins on adaxial leaf surface
Dumb-bell (0) sinuous or vertically elongate (1)
71 Relative widths of constrictions on silica bodies on adaxial leaf surface
Narrow, <¼ of silica body width (0) broad, more >¼ of silica body width (1)
72 Presence of prickle hairs along files of silica bodies
absent (0) present (1)
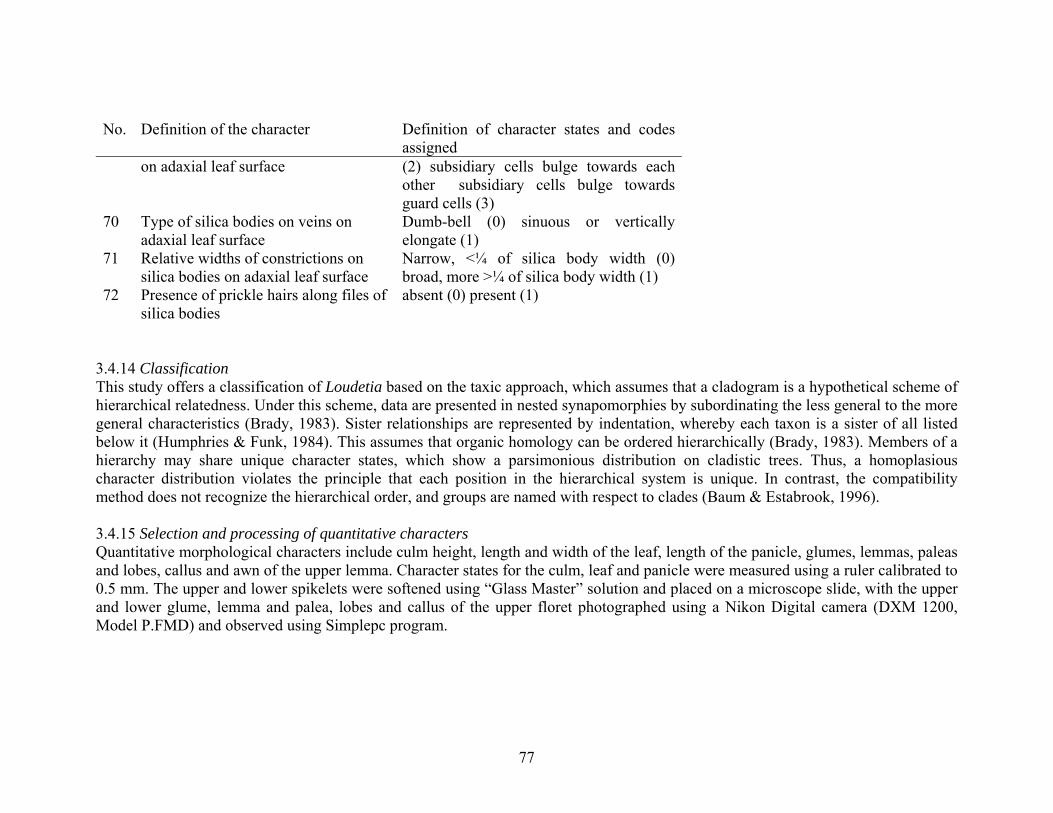
3.4.14 Classification This study offers a classification of Loudetia based on the taxic approach, which assumes that a cladogram is a hypothetical scheme of hierarchical relatedness. Under this scheme, data are presented in nested synapomorphies by subordinating the less general to the more general characteristics (Brady, 1983). Sister relationships are represented by indentation, whereby each taxon is a sister of all listed below it (Humphries & Funk, 1984). This assumes that organic homology can be ordered hierarchically (Brady, 1983). Members of a hierarchy may share unique character states, which show a parsimonious distribution on cladistic trees. Thus, a homoplasious character distribution violates the principle that each position in the hierarchical system is unique. In contrast, the compatibility method does not recognize the hierarchical order, and groups are named with respect to clades (Baum & Estabrook, 1996). 3.4.15 Selection and processing of quantitative characters Quantitative morphological characters include culm height, length and width of the leaf, length of the panicle, glumes, lemmas, paleas and lobes, callus and awn of the upper lemma. Character states for the culm, leaf and panicle were measured using a ruler calibrated to 0.5 mm. The upper and lower spikelets were softened using “Glass Master” solution and placed on a microscope slide, with the upper and lower glume, lemma and palea, lobes and callus of the upper floret photographed using a Nikon Digital camera (DXM 1200, Model P.FMD) and observed using Simplepc program.

78
Table 3.7. The combined anatomical, morphological and leaf surface data matrix (pilot study).
1111111111 2222222222 3333333333 4444444444 5555555555 6666666666 7777 Species
0123456789 0123456789 0123456789 0123456789 0123456789 0123456789 0123456789 0123
Andropogon mannii 1100011111 0001000011 0001010001 2001002001 000?01???? 1101011111 1211013011 0000
A. schirensis 0001011111 1111000203 2000101111 1001002000 000?0????? ?100011111 1110010000 0300
Loudetia angolensis 1101012010 0111312110 1022002011 1100010002 1100100011 001000010? 1210012000 0000
L. annua 0101101120 0011012110 1012000010 1100010101 0100111001 00100000?1 1111010011 130?
L. arundinacea 1000012020 0011211100 1012001111 1100010002 1100100011 0010000101 1110011010 1200
L. camerunensis 1110201021 1111012210 1030002011 1100010003 0200111001 0010000112 1110011110 1000
L. coarctata 1010010000 0111000010 1111001011 1010010001 1000111001 0010000111 1110011110 1000
L. demeusei 1010100000 1011000011 1122002011 1100010011 1000111001 001000010? 1110010010 0000
L. densispica 1010200000 1011000010 1122101011 1010010011 1000111001 00100000?? 1110011010 130?
L. filifolia 1100000110 0011000010 1111100011 1100010100 0200100?20 00100010?? 1110001010 1300
L. flammida 0100010110 1011200010 1022001111 1100010001 0000100?20 00100010?2 1110011010 130?
L. flavida 0100010110 1011200010 1022001111 1100010000 0100110?20 0010001111 1110011030 1011
L. hordeiformis 0101101120 1111011210 1012000010 1100010001 1100111102 0010000103 1110013010 1301
L. kagerensis A 1101011000 0011221011 1122001111 1100010001 1200100211 0010000101 1111011010 1201
L. kagerensis B 0101101210 1111002010 1121001011 1100010001 1000111001 0010000111 1111101001 0101
L. lanata A 1110100000 0000120000 0100022011 1100010001 1101111102 0010000101 1110012110 1300
L. lanata B 1100010001 0011000010 1021002111 1200010001 1200101001 0010000111 1100012110 1301
L. pedicellata 010101100? 000101???2 0021?00211 1110010011 0201120?21 00?0000101 1110011010 0311
L. phragmitoides 1011100001 0011211110 1122101111 1100010003 0200111001 0010000112 1210000100 1200
L. simplex 0101100100 1111010100 1022101111 1100010001 1200101001 0010000101 0??????000 0200
L. tisserantii 1020101001 0101000010 1122100011 1000010001 1200111001 0010000111 1110111110 1000
L. togoensis 0101100230 0110010011 0011000010 1110011011 0100?01002 0010000112 1110001010 1200

79
1111111111 2222222222 3333333333 4444444444 5555555555 6666666666 7777 Species
0123456789 0123456789 0123456789 0123456789 0123456789 0123456789 0123456789 0123
L. vanderystii 1110010000 1101000010 1122001111 1010010001 1000101101 00100000?? 0???000010 130?
Arundinella nepalensis
1000111000 1100010100 01200100?1 0010010001 1011200?21 1100000100 1210112010 1010
Danthoniopsis ramosa
0101101110 0000020210 0021001001 1100010000 0111100?21 1100000101 1210001010 1300
D. viridis 0101010110 0000020210 0000000001 1010010002 0211100?21 11000000?? 1102110010 130?
Loudetiopsis ambiens
1101100101 0001200210 1122102111 1110011002 1200110?01 0010000101 1110011001 0300
L. kerstingii 1100100100 0001202210 1122102010 1110010011 1100111?01 00100000?? 1102110010 130?
Trichopteryx marungensis
0001011211 0000000000 0111020011 1110001001 1001100?21 10?0000102 1110011010 1101
Tristachya leucothrix
0100111100 0101010210 00210010?1 1100010000 1210000?21 0000000100 1111001010 1000
T. rehmannii 0100111100 0001011210 00210100?1 1100011000 0110100??1 01?0000110 1210101010 1000

45
3.4.16 Determination of discrete character states from quantitative data Character state transformations for quantitative characters were determined by the graph method (Almeida & Bisby, 1984). The mean, range and standard deviation (MRSD) of metric values were plotted as box and whisker graphs using Statsoft (2001) to determine if distinct clusters exist in the pattern of variation. Gaps in the series of MRSD’s for all the species studied were then used to define character states from numeric data. The groups of MRSD’s on one side of the gap were assigned the same ordinal code, while those separated by the gap were accorded different ordinal codes (Almeida & Bisby, 1984; Thorpe, 1984). Where the ranges of species overlap without any hiatus in the MRSD’s, the character was considered to be unimodal for all the species studied and was thus rejected (Almeida & Bisby, 1984). A student’s t-test (P ≤ 0.05) was applied to compare if the data subset on one side of the gap was statistically different from the data subset on the other side, thus determining whether the identified character states could arise by chance (Thiele, 1993; Rae, 1998). A similar comparison was applied to character states defined by a dip in the distributions of MRSD’s (Almeida & Bisby, 1984), in which the range of only one species overlaps with the ranges of other species, representing about 3% overlap and on character states defined arbitrarily where there is no gap, with >10% of ranges overlapping with each other. Characters with discrete states were incorporated in the character definitions and data matrix (Tables 3.9 & 3.12). Table 3.8. Character formulation, character state definitions and coding strategies of qualitative and quantitative morphological and anatomical data sets (follow-up study). No. Definition of the character Definition of character states and codes
assigned Qualitative morphological and anatomical characters 0 Growth cycle Annual (0) perennial (1) 1 Branching characteristics of the culm Simple (0) branched (1) 2 Number of nodes of the culm 1-2 (0) 3 (1) 4 or more (2) 3 Characteristic of the basal leaf sheath Not splitting (0) splitting (1) 4 Type of ligule A fringe of hairs (0) fringed membrane (1)5 The mature leaf Rolled (0) expanded (1) 6 The margin of the leaf Straight (0) undulate (1) 7 Lanate hairs on basal leafs Absent (0) present (1) 8 Inflorescence Espatheate (0) spatheate (1) 9 Type of the panicle forming
inflorescence Spikelike (0) spiciform (1) contracted (2) open (3)
10 The rachis of the inflorescence Glabrous (0) hairy (1) 11 The primary node of the inflorescence Glabrous (0) hairy (1) 12 Branching characteristics of the
primary rachis Simple (0) branched (1)
13 Number of nodes on the secondary rachis
One (0) 2 or more (1)
14 The pedicel Glabrous (0) hairy (1) 15 Attachment of the pedicel to the
rachis Adnate at the base (0) free (1)
16 Appearance of the pedicel Slender and forming a loop (0) stout and

46
No. Definition of the character Definition of character states and codes assigned straight (1)
17 Nature of the pedicel Angular or flat (0) rounded (1) 18 Agglomeration of spikelets in the
inflorescence Crowded (0) spread out (1)
19 Spikelet aggregation Paired (0) units of threes (1) 20 Point of the spikelet disarticulation Below glumes (0) above glumes (1) 21 Relative size of the lower and upper
glume The lower glume shorter than the upper (0) equal in size (1) longer than the upper (2)
22 Number of prominent veins on the lower glume
Three (0) 5 or more (1)
23 Vein extension at the apex of the lower glume
Absent (0) present (1)
24 Shape of the lower glume Ovate (0) linear to linear-lanceolate (1) 25 Appearance of the apex of the lower
glume Pointed (0) rounded (1) truncate with emarginate surface (2)
26 The distribution of tubercle-based hairs on glumes and the lower lemma
Absent (0) on the lower glume only (1) on glumes and the lower lemma (2)
27 Number of prominent veins on the upper glume
Three (0) 5 or more (1)
28 Gender of the lower floret Neuter (0) male (1) 29 Texture of the lower lemma Leathery (0) papery (1) 30 Number of prominent veins on the
lower lemma Three (0) 5 (1) 7 (2) 9 (3)
31 Number of prominent veins on the upper lemma
One (0) 3 (1) 5 (2) 7 (3) 9 (4)
32 Appendage at the median region of the upper lemma
Absent (0) sinus with tufts of hairs (1)
33 Shape of lobes of the upper lemma Linear (0) triangular (1) 34 Texture of the upper lemma Papery (0) leathery (1) 35 Relative size of lobes of the upper
lemma Equal (0) unequal (1)
36 Prominent veins on the upper lemma lobe
None (0) 1 (1) 2 (2) 3 (3)
37 Number of awns on the upper lemma One (0) 3 (1) 38 Curvature of the mature awn of the
upper lemma Sickle-like (0) bent at 45-90˚ (1) straight (2)
39 Position of attachment of the awn to the upper lemma
Basal (0) from the apical sinus (1)
40 Apex of the upper palea Entire (0) bi-lobed or emarginate (1) 41 Mucro at the apex of the upper palea Absent (0) present (1) 42 Appearance of the back of the upper
palea Flat (0) canaliculate (1)
43 Appearance of the apical region of the Flat (0) spoon-shaped (1)
47
No. Definition of the character Definition of character states and codes assigned
back of the upper palea 44 Texture of the apex of the upper palea Leathery (0) membranous (1) 45 Texture of the entire upper palea Leathery (0) membranous (1) 46 Apex of the upper palea Glabrous (0) ciliate (1) 47 Median region of the upper palea Entire (0) auriculate (1) 48 Number of teeth on the callus of the
upper floret One (0) 2, equally sized (1) 2, unequally sized (2)
49 Shape of the apex of the callus of the upper floret
Pointed (0) flat (1) oblique (2) rounded (3)
50 Curvature of the callus of the upper floret
Straight (0) bent and twisted (1)
51 Outline of the callus sides towards the attachment of the spikelet to the pedicel
Convex (0) straight (1) divergent (2)
52 Callus of the upper floret Not wedge-shaped (0) wedge-shaped (1) 53 Number of stamens Two (0) 3 (1) 54 Hairiness of the lodicule Glabrous (0) hairy (1) 55 Hairiness of the ovary Glabrous (0) hairy (1) 56 Germination flap on the upper lemma Absent (0) present (1) 57 Alignment of vascular bundles in TS
of the leaf All close to the abaxial surface (0) along the median region (1)
58 Appearance of the apex of the first order vascular bundle (FOVB) in TS of the leaf
Flat (0) rounded (1)
59 Number of FOVB’s associated with the midrib in TS of the leaf
One (0) 2 or more (1)
60 Colourless cells on the adaxial surface of the leaf associated with the FOVB in TS of the leaf
Absent (0) present (1)
61 Colourless cells on the adaxial surface of the leaf associated with the second order vascular bundle (SOVB) in TS of the leaf
Absent (0) present (1)
62 Number of SOVB’s between FOVB’s in TS of the leaf
One (0) 2 or more (1)
63 Development of the third order vascular bundle
Sometimes degenerate (0) always developed (1)
64 Distribution of bulliform cells in TS of the leaf
On the abaxial surface only (0) on the abaxial and adaxial surfaces (1)
65 Association of bulliform cells with vascular bundles in TS
Overlay third order vascular bundles only (0) overlay SOVB’s as well (1)
66 Number of layers of bulliform cells across the width of the leaf
One (0) 2 or more (1)
67 Extent of bulliform cells across the Spanning <½ (0) >½ (1)

48
No. Definition of the character Definition of character states and codes assigned
width of the leaf 68 Height of adaxial bulliform cells
relative to FOVB’s Below the FOVB’s (0) the same height (1) above (2)
69 Height of adaxial bulliform cells relative to SOVB’s
Below the SOVB’s (0) the same height (1) above (2)
70 Bundlesheath cells surrounding protoxylem of the FOVB
Absent or diffuse (0) present in files (1)
71 Outer layer of the bundlesheath of the FOVB in TS
Complete (0) interrupted on the abaxial surface (1) interrupted on the adaxial surface (2) interrupted on both surfaces (3)
72 Phloem strand of the FOVB in TS Entire (0) divided (1) 73 Surface of the abaxial leaf in TS Even (0) uneven (1) 74 Surface of the adaxial leaf in TS Even (0) uneven (1) 75 Crystals across the leaf matrix Absent (0) present (1) 76 Length of the awn of the upper lemma
(Figure 3.12c; P < 0.001) 8-100 mm long (0) 105-180 mm (1)

49
Table 3.9. The combined anatomical and morphological data matrix (followe-up study). Characters 0-75 are qualitative and character 76 is quantitative. Species 0123456789 1111111111
0123456789 2222222222 0123456789
3333333333 0123456789
4444444444 0123456789
5555555555 0123456789
6666666601234567
Andropogon apendiculatus 1020110010 0001010101 0011200111 0001000010 0000111001 0001100010 00110001A. schirensis 1001110110 0000000111 0011200111 0001000010 0000110001 0001100010 00110101A. gayanus 1020111010 0001000111 0011200111 0001000010 0000110001 0001100010 01110101Loudetia angolensis 1020010002 1011101111 0200010001 0300101011 0010110001 0200000000 10100100L. annua 0011010003 0011101111 0201002001 0301101001 1010110011 0200000000 00101110L. arundinacea 1020010002 1011101111 0200010001 0301101011 1010110001 0200000000 00101111L. camerunensis 1010010102 1011101111 0201020001 0301101011 1010110011 0200000000 00000110L. coarctata 1011010102 1011101101 0200012001 0301101011 1010110011 0200000001 10100110L. demeusei 1011010102 1011101111 0200012001 0301101001 0010110022 0200000000 01000110L. densispica 1010010101 0000000100 0200111001 0201101011 1010110022 0200000000 00100110L. filifolia 1011010102 1011001111 0200000001 0401111011 1010110002 0111000000 00100111L. flammida 1020010102 1011101111 0200010001 0401101011 0010110001 0100000000 01110110L. flavida 1010000102 1111111111 0201000001 0401111021 1010110001 0001000000 00100111L. hordeiformis 0011010102 0001101111 0201002001 0301102001 1010110022 0200000000 00101111L. kagerensis 1021010002 0001101111 0200012001 0301102011 1010110011 0200000000 00001110L. lanata 1010000103 1011111111 0200012001 0301101001 1010111022 0200000000 00000111L. pennata 1000010102 1011111111 0201002001 0401101011 1010110001 0001000000 00100110L. phragmitoides 1020010002 1011101111 0200011000 0401101011 0010110001 0200000001 01100110L. simplex 1001000102 1011101111 0201012001 0301102011 0010110022 0200000000 01100111L. tisserantii 1010000001 0100000110 0201101000 0301101011 1010110001 0100000001 10100110L. togoensis 0011010003 0001101111 1201100000 0301102001 0010111022 1200000000 01000111L.a vanderystii 1010000001 0000000100 0200012001 0301102011 1010110011 0200000001 10100110L. sp. nov. 1 1010010001 0011101111 0200002011 0301101011 0010110022 0200000000 01111000L. sp. nov. 2 102?010002 0011101111 0200000010 0100101011 0000110003 0000001001 00100110Arundinella nepalensis 1020110102 0101001100 1010001000 1300101101 0011010003 0101001010 01000000Danthoniopsis acutigluma 1020011102 1011011111 1201000001 2411103011 1010110103 0211001010 01011111D. chimanimaniensis 1020010002 0011101111 1200010101 2400103011 0110000003 0211001010 01101111D. dinteri 0010011002 1011101111 1201000101 2300103011 1110000103 0211001011 01011011D. parva 1120010102 0011101111 0201000001 1411103011 1000110003 0211001010 01011111D. pruinosa 1021011002 0011101111 0201000001 0211103011 0001000003 0211001010 01011111D. ramosa 1120010102 1011001111 0201000001 3401103011 0010110003 0111001010 00011111D. viridis 1010011102 1110111111 1200011101 0312101001 0000101003 0111001010 01011111Gilgiochloa indurata 0010011001 0000101100 0201000001 1200103101 0011100103 0100001000 00100110Loudetiopsis ambiens 1011010003 1011101111 1200011001 0301101011 0010110011 0200000001 10100110L. capillipes 1010010103 0101011011 1101112001 0400101011 0010110011 0100000001 10100110L. chrysothrix 1011010102 1100011011 1100112001 0301101011 1010110022 0200000001 00100110L. glabrinodis 1010000103 0001001011 1200010001 0400101011 0010000003 0100000000 00100110L. glabrata 1001010102 1001101111 1200010001 0400101011 1010110011 0100000000 00100110L. kerstingii 0020000003 0101011111 1100112001 0200101011 1010110011 0200000000 00100110L. scaettae 1010000103 0101011011 1200100001 0301101011 0010000003 0101000000 00100110L. thoroldii 1020010102 1001101111 1200012001 0401101011 0010000003 0101000000 00100111L. trigemina 1020010002 0101011111 1100010001 0400103011 0010000003 0210000000 00100010L. tristachyoides 1020010002 0101011111 1100010001 0400103011 0010110001 0100000100 01100110Trichopteryx marungensis 1120011102 1111101111 0201002001 0300102011 0000110003 0200000110 01111110Tristachya bequaertii 1010010102 1001101111 1100100001 1300102111 0011000000 1001011110 00011110T. leucothrix 1010010102 1010001111 1101122001 0302103011 0010000000 1001011011 00100100T. pedicellata 1010010002 1001001111 1200010001 0300102011 0010000000 0001011010 01000110

50
T. superba 1020010101 1001101111 1200000001 1301101111 0011000000 1001011001 11010111
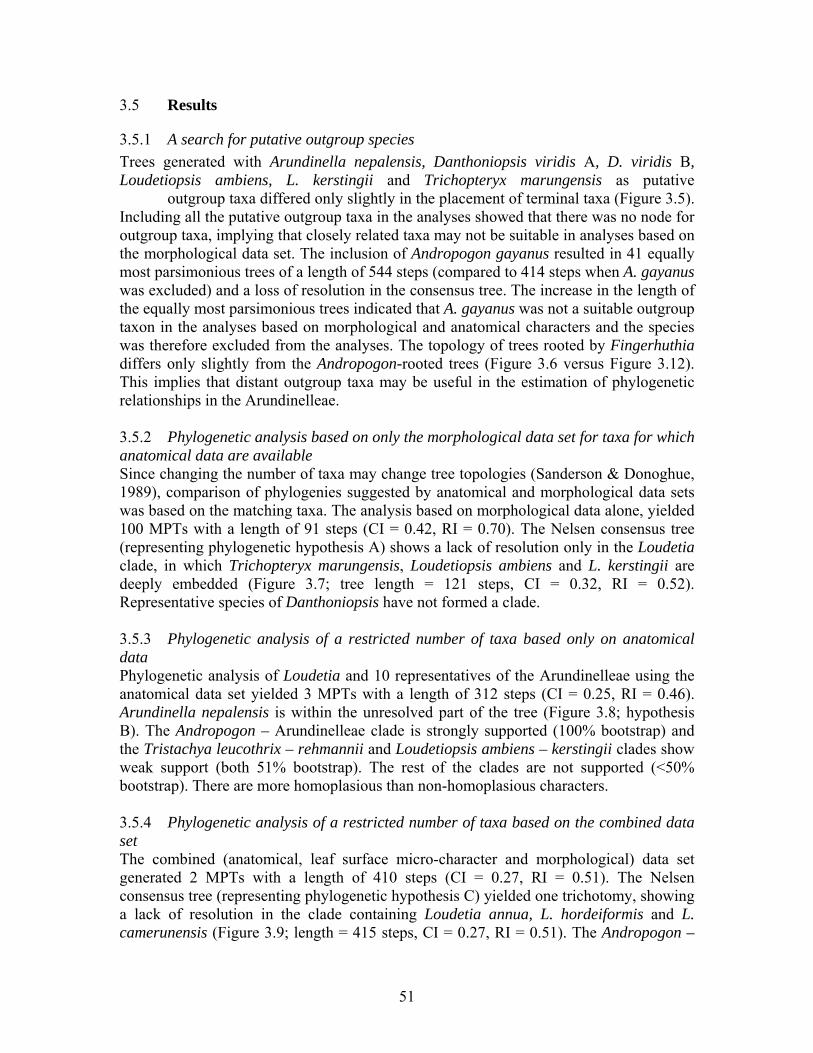
51
3.5 Results
3.5.1 A search for putative outgroup species Trees generated with Arundinella nepalensis, Danthoniopsis viridis A, D. viridis B, Loudetiopsis ambiens, L. kerstingii and Trichopteryx marungensis as putative outgroup taxa differed only slightly in the placement of terminal taxa (Figure 3.5). Including all the putative outgroup taxa in the analyses showed that there was no node for outgroup taxa, implying that closely related taxa may not be suitable in analyses based on the morphological data set. The inclusion of Andropogon gayanus resulted in 41 equally most parsimonious trees of a length of 544 steps (compared to 414 steps when A. gayanus was excluded) and a loss of resolution in the consensus tree. The increase in the length of the equally most parsimonious trees indicated that A. gayanus was not a suitable outgroup taxon in the analyses based on morphological and anatomical characters and the species was therefore excluded from the analyses. The topology of trees rooted by Fingerhuthia differs only slightly from the Andropogon-rooted trees (Figure 3.6 versus Figure 3.12). This implies that distant outgroup taxa may be useful in the estimation of phylogenetic relationships in the Arundinelleae. 3.5.2 Phylogenetic analysis based on only the morphological data set for taxa for which anatomical data are available Since changing the number of taxa may change tree topologies (Sanderson & Donoghue, 1989), comparison of phylogenies suggested by anatomical and morphological data sets was based on the matching taxa. The analysis based on morphological data alone, yielded 100 MPTs with a length of 91 steps (CI = 0.42, RI = 0.70). The Nelsen consensus tree (representing phylogenetic hypothesis A) shows a lack of resolution only in the Loudetia clade, in which Trichopteryx marungensis, Loudetiopsis ambiens and L. kerstingii are deeply embedded (Figure 3.7; tree length = 121 steps, CI = 0.32, RI = 0.52). Representative species of Danthoniopsis have not formed a clade. 3.5.3 Phylogenetic analysis of a restricted number of taxa based only on anatomical data Phylogenetic analysis of Loudetia and 10 representatives of the Arundinelleae using the anatomical data set yielded 3 MPTs with a length of 312 steps (CI = 0.25, RI = 0.46). Arundinella nepalensis is within the unresolved part of the tree (Figure 3.8; hypothesis B). The Andropogon – Arundinelleae clade is strongly supported (100% bootstrap) and the Tristachya leucothrix – rehmannii and Loudetiopsis ambiens – kerstingii clades show weak support (both 51% bootstrap). The rest of the clades are not supported (<50% bootstrap). There are more homoplasious than non-homoplasious characters. 3.5.4 Phylogenetic analysis of a restricted number of taxa based on the combined data set The combined (anatomical, leaf surface micro-character and morphological) data set generated 2 MPTs with a length of 410 steps (CI = 0.27, RI = 0.51). The Nelsen consensus tree (representing phylogenetic hypothesis C) yielded one trichotomy, showing a lack of resolution in the clade containing Loudetia annua, L. hordeiformis and L. camerunensis (Figure 3.9; length = 415 steps, CI = 0.27, RI = 0.51). The Andropogon –

52
Arundinelleae clade is strongly supported (100% bootstrap), the Arundinelleae clade is moderately supported 84% bootstrap) and the Loudetia clade is weakly supported (52% bootstrap). Loudetia pedicellata is separated from the Loudetia clade and it is sister to the LR clade. The L. angolensis – L. arundinacea clade is retrieved and it is weakly supported (62% bootstrap). There was no significant incongruence at the 95% confidence level between the morphological and anatomical data sets. The anatomical and morphological data sets therefore meet the statistical criterion for the combined analysis because of the lack of significant incongruence at P ≤ 0.05 (Bull et al., 1993; de Queiroz, 1993; de Queiroz et al., 1995; Farris et al., 1995; Poe, 1996; Huelsenbeck et al., 1996; Normark & Lanteri, 1998). However, there was significant incongruence between pairs of anatomical and leaf surface data sets, the morphological and leaf surface data sets and among the morphological, anatomical and leaf surface data sets (Table 3.10), which necessitated separate cladistic analyses based on the anatomical data set, leaf surface data set and morphological data set (Miyamoto and Fitch, 1995; Normark & Lanteri, 1998). Table 3.10. Farris et al.’s (1994, 1995) statistical test of incongruence between data sets. Abbreviations used: A = anatomical data set, L = leaf surface character data set, M = morphological data set, S = the number of replicates for which incongruence from randomized partitions is less than the observed partitions, P-value determines the null hypothesis of congruence at the 95% confidence level (calculated from 1 – S / W) and W = replications of partitions (after Yoder et al., 2001: 409). Data sets S-value W-value P-value Interpretation A versus L 999 1000 0.0020 Highly significant A versus M 512 1000 0.4885 Not significant L versus M 1000 1000 0.0010 Highly significant A versus L versus M 936 1000 0.0649 Significant

53
Figure 3.5. A single most parsimonious tree with a length of 242 steps (CI = 0.32, RI = 0.57) generated with Arundinella nepalensis included in the analysis in a search for a putative outgroup species for Loudetia based on the combined data. The tree is not resolved. Multiple outgroup analyses revealed that there is no node for outgroups, implying that closely related species are not suitable as outgroup species for Loudetia. Symbols: filled circles = synapomorphic and autapomorphic character states, empty circles = homoplasious character state distribution.
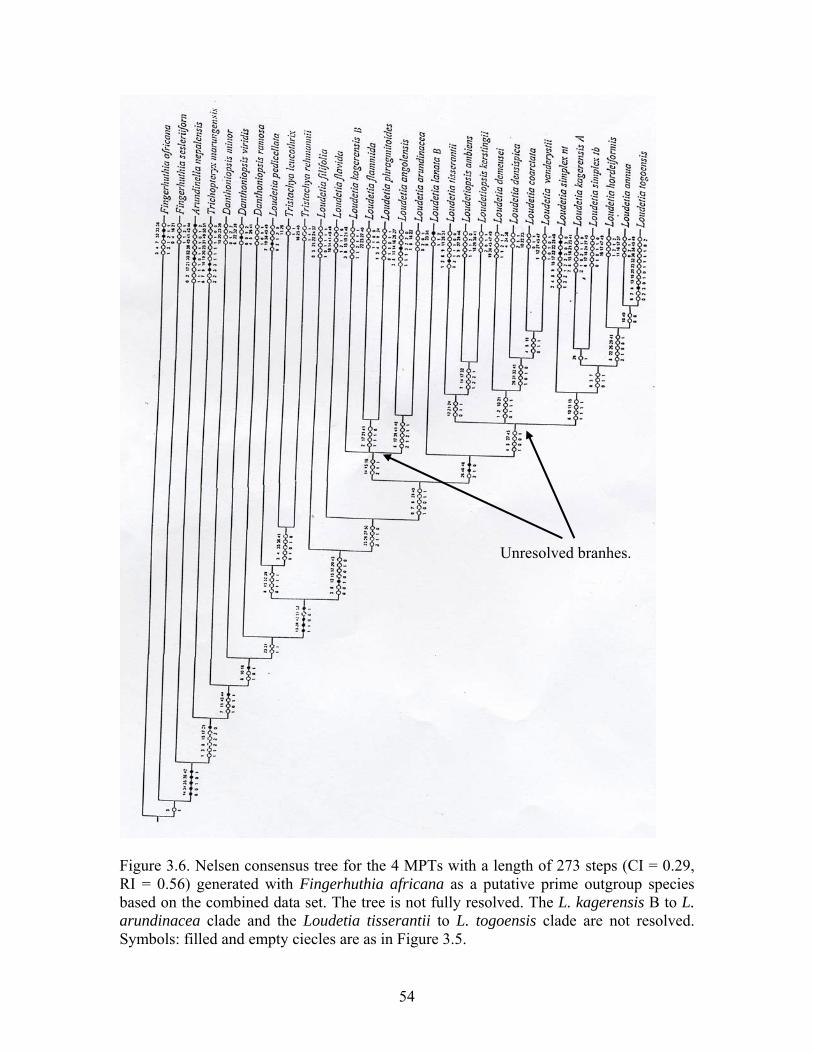
54
Figure 3.6. Nelsen consensus tree for the 4 MPTs with a length of 273 steps (CI = 0.29, RI = 0.56) generated with Fingerhuthia africana as a putative prime outgroup species based on the combined data set. The tree is not fully resolved. The L. kagerensis B to L. arundinacea clade and the Loudetia tisserantii to L. togoensis clade are not resolved. Symbols: filled and empty ciecles are as in Figure 3.5.
Unresolved branhes.

55
Figure 3.7. Nelsen consensus tree for the 100 MPTs with a length of 121 steps (CI = 0.32, RI = 0.52) generated in the analysis of a restricted number of taxa (pilot study) based on morphological data set. The topology of this tree represents hypothesis A. Characters and character states are represented as in Figure 3.5. The tree is very poorly resolved. Symbols: filled and empty circles are as in Figure 3.5.
100
69

56
Figure 3.8. Nelsen consensus tree for the 3 MPTs with a length of 312 steps (CI = 0.24, RI = 0.46) generated in the analysis of a restricted number of taxa (pilot study) based on the anatomical data set. The topology of this tree represents hypothesis B. Characters and character states are represented as in Figure 3.5. The tree is far from resolved. Symbols: filled and empty circles are as in Figure 3.5.
100
51
51
100

57
Figure 3.9. Nelsen consensus tree for the 2 MPTs with a length of 415 steps (CI = 0.27, RI = 0.51) generated in the analysis of a restricted number of taxa (pilot study) based on the combined data set. The topology of this tree represents hypothesis C. Characters and character states are represented as in Figure 3.5. The Loudetia clade is fully resolved. AHS = the Loudetia annua – hordeiformis – simplex clade, DDLA = the Loudetia demeusei – densispica – lanata A – Loudetiopsis ambiens – kerstingii clade, FPKAA = the Loudetia flammida – phragmitoides – kagerensis B – angolensis – arundinacea clade, VCT = the Loudetia vanderystii – coarctata – tisserantii clade, GM = the Trichopteryx gracillima – marungensis clade, PLR = the Loudetia pedicellata – Tristachya leucothrix – rehmannii clade, LR = the Tristachya leucothrix – rehmannii clade. Loudetia pedicellata is sister to the LR clade, implying a close relationship with members of Tristachya. Symbols: filled and empty circles are as in Figure 3.5.
100
84
52
62
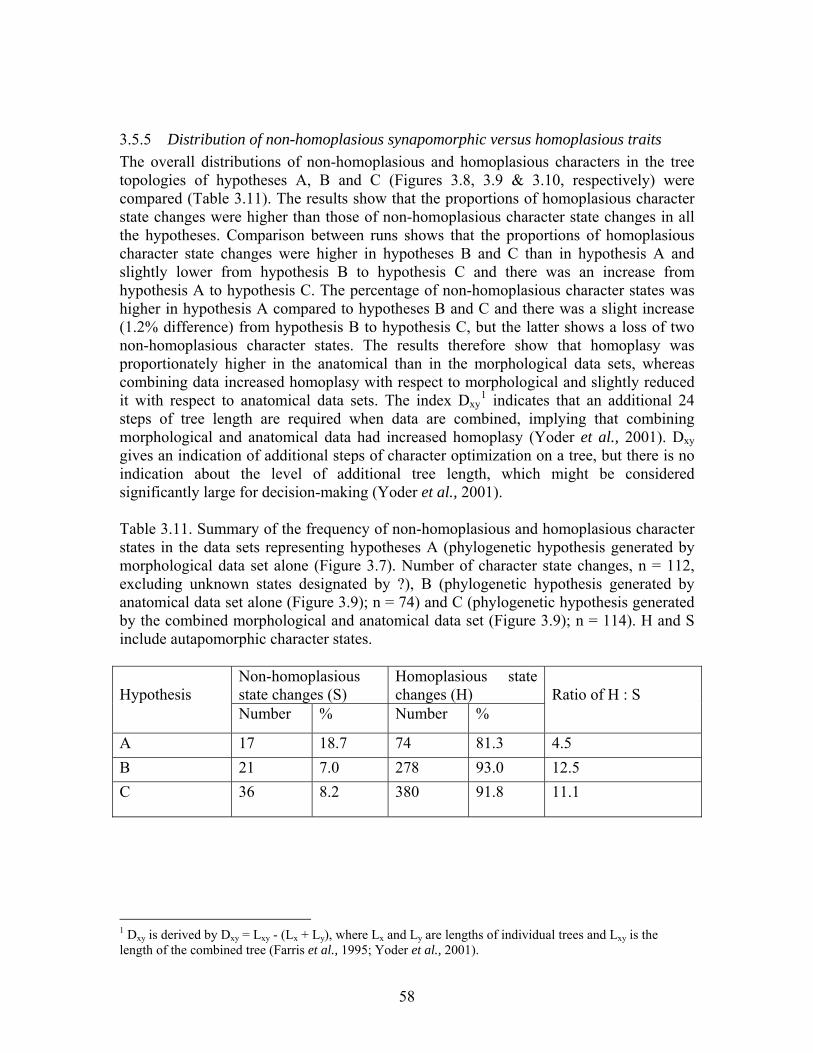
58
3.5.5 Distribution of non-homoplasious synapomorphic versus homoplasious traits The overall distributions of non-homoplasious and homoplasious characters in the tree topologies of hypotheses A, B and C (Figures 3.8, 3.9 & 3.10, respectively) were compared (Table 3.11). The results show that the proportions of homoplasious character state changes were higher than those of non-homoplasious character state changes in all the hypotheses. Comparison between runs shows that the proportions of homoplasious character state changes were higher in hypotheses B and C than in hypothesis A and slightly lower from hypothesis B to hypothesis C and there was an increase from hypothesis A to hypothesis C. The percentage of non-homoplasious character states was higher in hypothesis A compared to hypotheses B and C and there was a slight increase (1.2% difference) from hypothesis B to hypothesis C, but the latter shows a loss of two non-homoplasious character states. The results therefore show that homoplasy was proportionately higher in the anatomical than in the morphological data sets, whereas combining data increased homoplasy with respect to morphological and slightly reduced it with respect to anatomical data sets. The index Dxy
1 indicates that an additional 24 steps of tree length are required when data are combined, implying that combining morphological and anatomical data had increased homoplasy (Yoder et al., 2001). Dxy gives an indication of additional steps of character optimization on a tree, but there is no indication about the level of additional tree length, which might be considered significantly large for decision-making (Yoder et al., 2001). Table 3.11. Summary of the frequency of non-homoplasious and homoplasious character states in the data sets representing hypotheses A (phylogenetic hypothesis generated by morphological data set alone (Figure 3.7). Number of character state changes, n = 112, excluding unknown states designated by ?), B (phylogenetic hypothesis generated by anatomical data set alone (Figure 3.9); n = 74) and C (phylogenetic hypothesis generated by the combined morphological and anatomical data set (Figure 3.9); n = 114). H and S include autapomorphic character states.
Non-homoplasious state changes (S)
Homoplasious state changes (H)
Hypothesis
Number % Number %
Ratio of H : S
A 17 18.7 74 81.3 4.5 B 21 7.0 278 93.0 12.5 C 36 8.2 380 91.8 11.1
1 Dxy is derived by Dxy = Lxy - (Lx + Ly), where Lx and Ly are lengths of individual trees and Lxy is the length of the combined tree (Farris et al., 1995; Yoder et al., 2001).
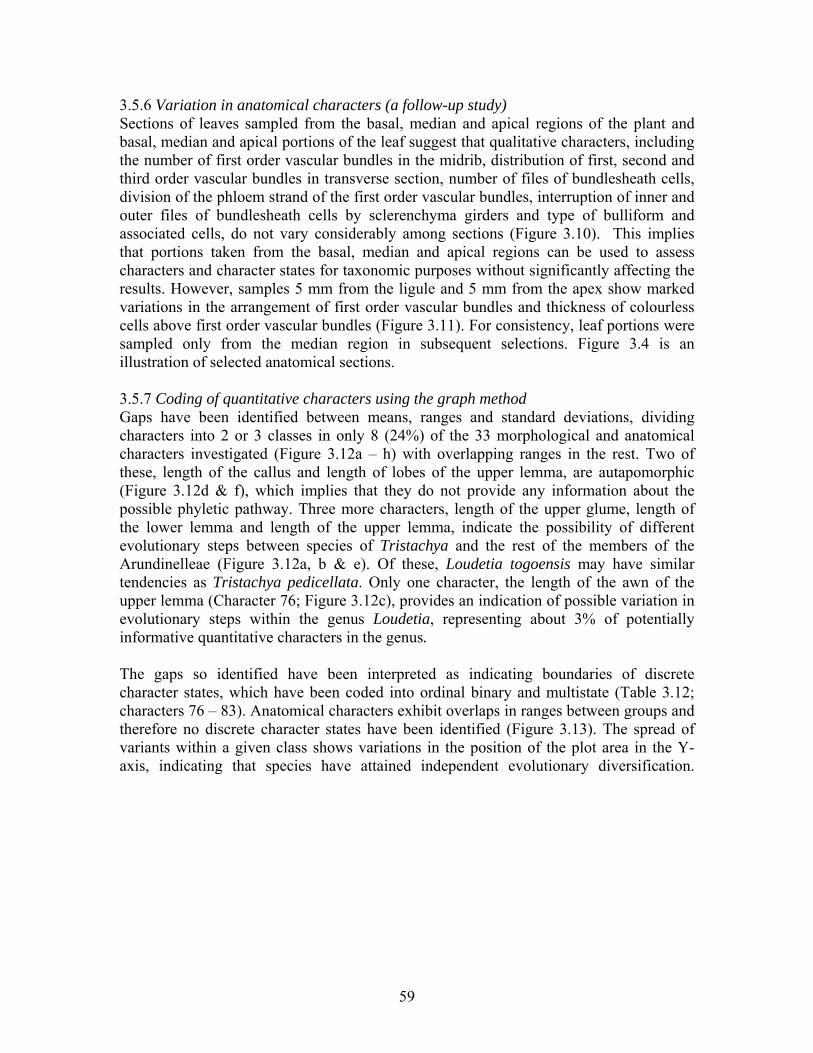
59
3.5.6 Variation in anatomical characters (a follow-up study) Sections of leaves sampled from the basal, median and apical regions of the plant and basal, median and apical portions of the leaf suggest that qualitative characters, including the number of first order vascular bundles in the midrib, distribution of first, second and third order vascular bundles in transverse section, number of files of bundlesheath cells, division of the phloem strand of the first order vascular bundles, interruption of inner and outer files of bundlesheath cells by sclerenchyma girders and type of bulliform and associated cells, do not vary considerably among sections (Figure 3.10). This implies that portions taken from the basal, median and apical regions can be used to assess characters and character states for taxonomic purposes without significantly affecting the results. However, samples 5 mm from the ligule and 5 mm from the apex show marked variations in the arrangement of first order vascular bundles and thickness of colourless cells above first order vascular bundles (Figure 3.11). For consistency, leaf portions were sampled only from the median region in subsequent selections. Figure 3.4 is an illustration of selected anatomical sections. 3.5.7 Coding of quantitative characters using the graph method Gaps have been identified between means, ranges and standard deviations, dividing characters into 2 or 3 classes in only 8 (24%) of the 33 morphological and anatomical characters investigated (Figure 3.12a – h) with overlapping ranges in the rest. Two of these, length of the callus and length of lobes of the upper lemma, are autapomorphic (Figure 3.12d & f), which implies that they do not provide any information about the possible phyletic pathway. Three more characters, length of the upper glume, length of the lower lemma and length of the upper lemma, indicate the possibility of different evolutionary steps between species of Tristachya and the rest of the members of the Arundinelleae (Figure 3.12a, b & e). Of these, Loudetia togoensis may have similar tendencies as Tristachya pedicellata. Only one character, the length of the awn of the upper lemma (Character 76; Figure 3.12c), provides an indication of possible variation in evolutionary steps within the genus Loudetia, representing about 3% of potentially informative quantitative characters in the genus. The gaps so identified have been interpreted as indicating boundaries of discrete character states, which have been coded into ordinal binary and multistate (Table 3.12; characters 76 – 83). Anatomical characters exhibit overlaps in ranges between groups and therefore no discrete character states have been identified (Figure 3.13). The spread of variants within a given class shows variations in the position of the plot area in the Y-axis, indicating that species have attained independent evolutionary diversification.
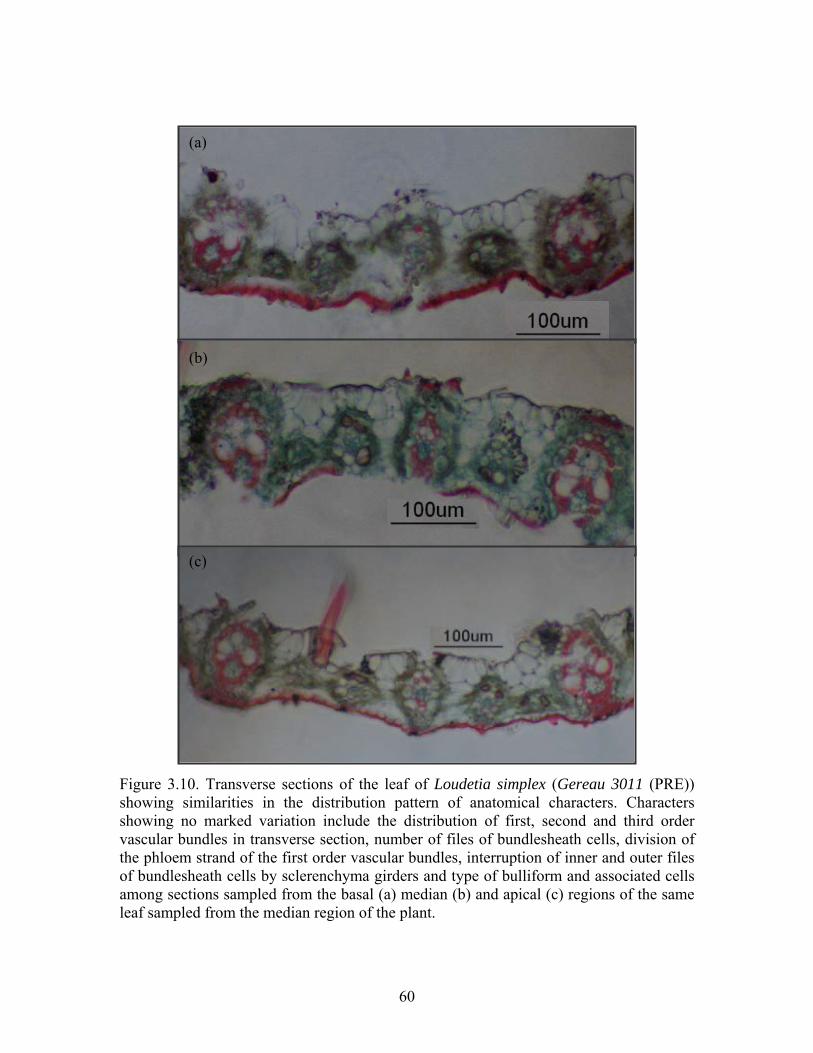
60
Figure 3.10. Transverse sections of the leaf of Loudetia simplex (Gereau 3011 (PRE)) showing similarities in the distribution pattern of anatomical characters. Characters showing no marked variation include the distribution of first, second and third order vascular bundles in transverse section, number of files of bundlesheath cells, division of the phloem strand of the first order vascular bundles, interruption of inner and outer files of bundlesheath cells by sclerenchyma girders and type of bulliform and associated cells among sections sampled from the basal (a) median (b) and apical (c) regions of the same leaf sampled from the median region of the plant.
(a)
(b)
(c)
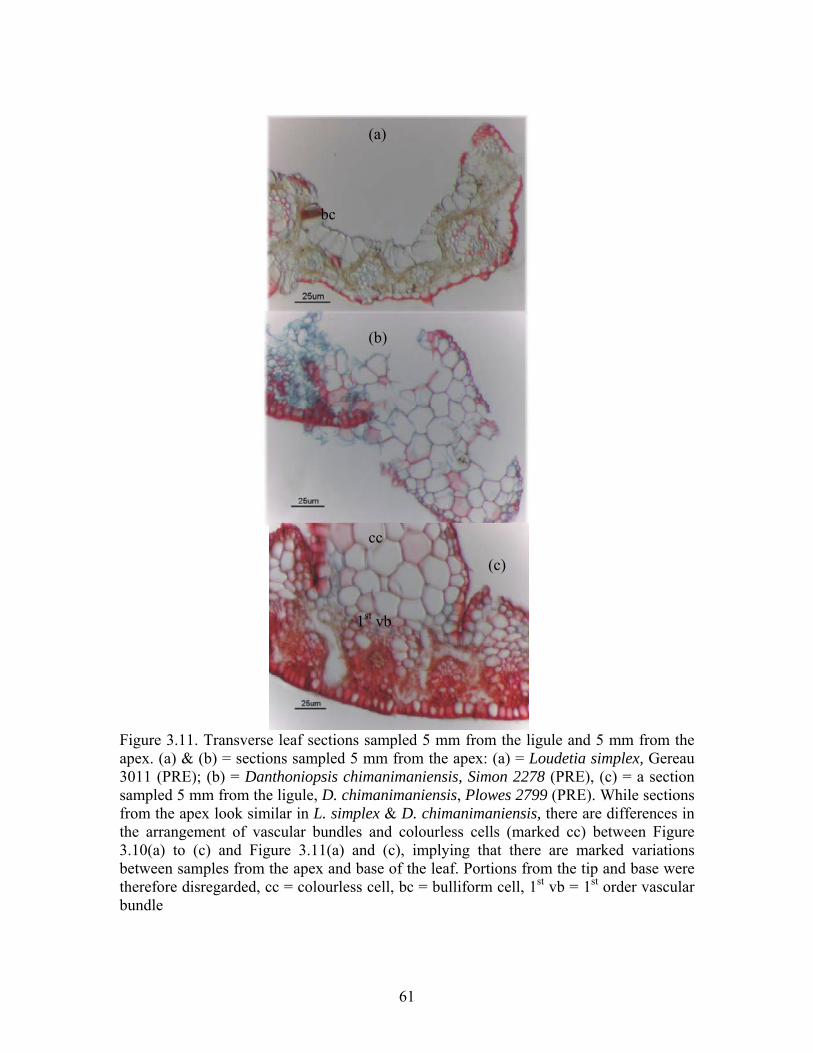
61
Figure 3.11. Transverse leaf sections sampled 5 mm from the ligule and 5 mm from the apex. (a) & (b) = sections sampled 5 mm from the apex: (a) = Loudetia simplex, Gereau 3011 (PRE); (b) = Danthoniopsis chimanimaniensis, Simon 2278 (PRE), (c) = a section sampled 5 mm from the ligule, D. chimanimaniensis, Plowes 2799 (PRE). While sections from the apex look similar in L. simplex & D. chimanimaniensis, there are differences in the arrangement of vascular bundles and colourless cells (marked cc) between Figure 3.10(a) to (c) and Figure 3.11(a) and (c), implying that there are marked variations between samples from the apex and base of the leaf. Portions from the tip and base were therefore disregarded, cc = colourless cell, bc = bulliform cell, 1st vb = 1st order vascular bundle
(a)
(b)
(c)
cc
bc
1st vb
62
Also different are the magnitudes of the range values, indicating differences in within-species variation for the same character (Figures 3.13 & 3.14). For example, the length of the callus is more variable in Loudetia demeusei (n = 7) than in L. camerunensis (n = 25). In addition, the length of the upper lemma is more variable in Loudetia densispica (range = 8.4 – 18.0 mm ± 1.0 mm, n = 5) than in L. simplex and L. camerunensis (5 – 11 mm, n = 27; 7.8 – 12.4 mm, n = 25, respectively; Figure 3.12). In addition, the ranges of the upper glume for Loudetia arundinacea, L. demeusei, L. densispica and L. camerunensis do not overlap those of L. angolensis and L. phragmitoides, but L. filifolia and L. flavida bridge the gap and these species are therefore perceived to belong to one class, with all of these species assigned the same ordinal code (Figure 3.12, Table 3.12, character 77). The bridging of otherwise distinct ranges by intermediates is common in all the 33 morphological and anatomical characters investigated, implying that there is some divergence in character states, which cannot be accounted for when the coding decisions are based on the criterion of the gap in ranges and standard deviations. 3.5.8 Statistical comparison The student’s t-test yields equally highly significant differences between means of characters defined by the gap, the dip in the frequency in which the range of at least one species traverses the gap and in characters with range overlaps involving more than one species, for which character states have been arbitrarily assigned without basing the coding decision on gaps (Table 3.12). This suggests that the means of gap-, dip- and arbitrarily-defined character states are distinct and can be recognised as indicating discrete character states. However, characters defined by the dip in the frequency of the range represent overlapping ranges, where there are no gaps with which to base coding decisions. Equally overlapping are character states whose boundaries were arbitrarily assigned.

63
Table 3.12. Comparison between states of quantitative characters defined by the gap in ranges (graph method) and arbitrarily assigned states in overlapping characters (Figures 3.13 & 3.14). MRSD = mean, range and standard deviation. No. Character Character states definition Definition P-value 76 Length of the awn of
the upper lemma (Figure 3.12c; P < 0.001)
8-100 mm long (0) 105-180 mm long (1)
Gap in MRSD’s <0.001
77 Length of the upper glume (Figure 3.12a)
2-3 mm (0) 4-20 mm long (1) 23-30 mm long (2)
Gap in MRSD’s <0.001
78 Length of the lower lemma (Figure 3.12b)
Up to 2 mm (0) 3-18 mm long (1) >18 mm long (2)
Gap in MRSD’s <0.001
79 Length of the upper lemma (Figure 3.12e)
0.1-2.3 mm long (0) 2.5-4.3 mm long (1)
Gap in MRSD’s <0.001
80 Length of lobes of the upper lemma (Figure 3.12f)
0.1-2.4 mm long (0) 2.5-5.8 mm long (1)
Gap in MRSD’s <0.001
81 Length of the callus of the upper lemma (Figure 3.12d)
0.1-2.3 mm long (0) 2.5-4.4 mm long (1)
Gap in MRSD’s <0.001
82 Length of the lower glume (Figure 3.12)
1-9 mm long (0) 10-18 mm long (1)
Dip in MRSD’s 0.010
83 Length of the lower palea (Figure 3.12)
1-10 mm long (0) 11-21 mm long (1)
Dip in MRSD’s <0.001
84 Width of the leaf 1-7.8 mm wide (0) 8-22 mm wide (1)
Dip in MRSD’s 0.010
85 Distance between first order vascular bundles
200-800 µm (0) >800 µm long (1)
Dip in MRSD’s <0.001
86 Length of the upper glume
1-16 mm long (0) >16 mm long (1)
Dip in MRSD’s <0.001
87 Awn length 8-80 mm long (0) 80-170 mm long (1)
Dip in MRSD’s <0.001
88 Length of the panicle <250 mm long (0) >250 mm long (1)
Arbitrary <0.001
89 Length of the longer pedicel
<8 mm long (0) >8 mm long (1)
Arbitrary <0.001
90 Length of the shorter pedicel
<3.5 mm long (0) > 3.5 mm long (1)
Arbitrary <0.001
91 Height of the culm <700 mm high (0) > 700 mm high (1)
Arbitrary <0.001
92 Distance between 1st order vascular bundles
<680 long μm Arbitrary <0.001
93 Height of the 1st order vascular bundle
<200 μm high (0) > 200 μm high (1)
Arbitrary <0.001
94 Height of the 2nd order vascular bundle
<150 μm high (0) > 150 μm high (1)
Arbitrary <0.001

64
No. Character Character states definition Definition P-value 95 Width of the 1st order
vascular bundle <140 μm wide (0) > 140 μm wide (1)
Arbitrary <0.001
96 Width of the 2nd order vascular bundle
< 72 μm wide (0) > 72 wide μm (1)
Arbitrary <0.001
97 Width of the abaxial epidermal layer
< 15 μm wide (0) > 15 wide μm (1)
Arbitrary <0.001
98 Height of the bulliform cell
< 45 μm high (0) > 45 μm high (1)
Arbitrary <0.001
99 Width of the bulliform cell
< 52 μm high (0) > 52 μm high (1)
Arbitrary <0.001
100 Diameter of the outer bundlesheath cell of the 1st order vascular bundle
< 12.5 μm wide (0) > 12.5 μm wide (1)
Arbitrary <0.001
101 Diameter of the outer bundlesheath cell of the 2nd order vascular bundle
< 11.5 μm long (0) > 11.5 μm long (1)
Arbitrary <0.001
102 Number of the outer bundlesheath cells of the 1st order vascular bundle
< 27 cell (0) > 27 cell (1) Arbitrary <0.001
103 Number of the inner bundlesheath cells of the 1st order vascular bundle
< 17 cell (0) > 17 cell (1) Arbitrary <0.001
104 Number of the outer bundlesheath cells of the 2nd order vascular bundle
< 12 cell (0) > 12 cell (1) Arbitrary <0.001
105 Number of the inner bundlesheath cells of the 2nd order vascular bundle
< 12 cells (0) > 12 cells (1) Arbitrary <0.001
106 Diameter of metaxylem of the 1st order vascular bundle
< 30 μm wide (0) > 30 μm wide (1)
Arbitrary <0.001
107 Diameter of phloem of the 1st order vascular bundle
< 37 μm wide (0) > 37 μm wide (1)
Arbitrary <0.001
108 Diameter of phloem of the 2nd order vascular bundle
< 38 μm wide (0) > 38 μm wide (1)
Arbitrary <0.001
65
3.5.9 Phylogeny of Loudetia and Loudetiopsis Cladistic analysis based on the combined qualitative morphological and anatomical data set (Table 3.9) yields 2 most parsimonious trees (MPTs) each with a length of 458 steps (CI = 0.21 and RI = 0.52). These trees differ only in the placement of outgroup species Andropogon gayanus and A. schirensis, with a trichotomy in the strict consensus tree indicating the lack of resolution in that clade. The length of the consensus tree is one step longer than these two MPTs at 459 steps, but the consistency and retention indices remain the same (Figure 3.14). Representative species of Tristachya form their own clade (marked T, Figure 3.14), but Gilgiochloa indurata and Trichopteryx marungensis are embedded in the Danthoniopsis clade (the D-clade), whereas species of Loudetiopsis are embedded in the Loudetia clade (designated as the L-clade; Figure 3.14). The topology of Figure 3.14 confirms that Loudetia is paraphyletic with the exclusion of species currently being treated under Loudetiopsis, whereas Loudetiopsis appear to be polyphyletic (Figure 3.14). In addition, the relationship between Tristachya pedicellata with other members of Tristachya has been supported. The L-clade and the D-clade both lack non-homoplasious synapomorphic characters as well as internal branch support, with bootstrap values less than 50%. However, the introduction of the awn length (character 76; Table 3.12) yields one uniquely derived character state by members of the Loudetia togoensis - annua - hordeiformis clade (the TAH-clade, Figure 3.15). Two character states among those defining the L-clade exhibit reversals within this clade and among members of the D- and T-clades (character states 31,4 and 62,0; Table 3.13). Parallel or convergent evolution can also be inferred among the L-clade-defining character states with representatives of Danthoniopsis, Trichopteryx and Tristachya. Within the L-clade, 5 minor clades receive weak internal branch support (using the scheme of internal branch support adopted in section 3.1). These are the L. flavida - pennata clade (FP, 63% bootstrap), L. annua - hordeiformis clade (AH, 50% bootstrap), L. densispica - tisserantii - vanderystii clade (DTV, 67% bootstrap), L. tisserantii - vanderystii clade (TV, 53% bootstrap) and the Loudetiopsis trigemina - tristachyoides clade (TT, 54% bootstrap). 3.5.10 Do morphological, anatomical and leaf surface data sets support the same or conflicting phylogenetic hypotheses? The Farris et al (1994, 1995) incongruence length differential (ILD) test for conflict between data sets shows no significant incongruence at the 95% confidence level between the morphological and anatomical data sets (Table 3.10). These data sets therefore meet the statistical criterion for combining them in a cladistic analysis because of the lack of significant incongruence at P ≤ 0.05 (Bull et al., 1993; de Queiroz, 1993; de Queiroz et al., 1995; Farris et al., 1995; Poe, 1996; Huelsenbeck et al., 1996; Normark & Lanteri, 1998). The lack of significant difference between morphological and anatomical data sets implies that these character matrices support the same phylogenetic hypothesis. There were significant incongruences between pairs of anatomical and leaf surface data sets, the morphological and leaf surface data sets and among the morphological, anatomical and leaf surface data sets (Table 3.10), which necessitated separate cladistic analyses based on the anatomical data set, leaf surface data set and morphological data set
66
(Miyamoto and Fitch, 1995; Normark & Lanteri, 1998). For this reason, leaf surface characters were excluded. However, excluding one character at a time from the cladistic
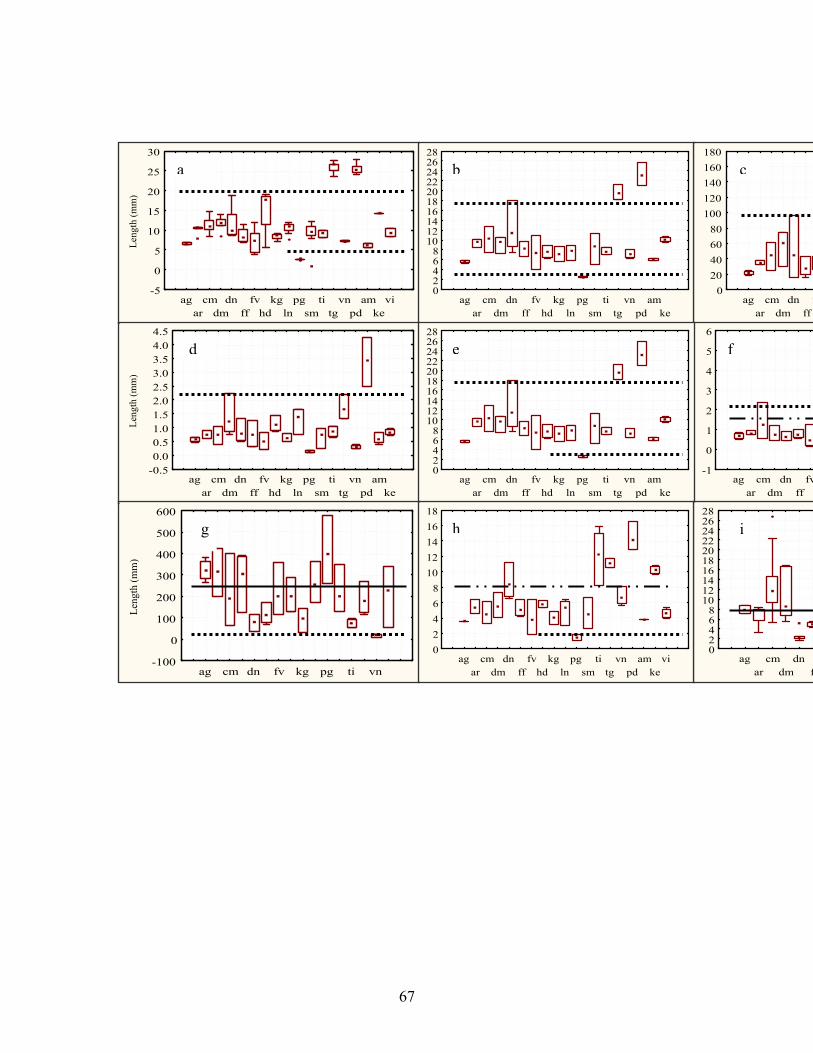
67
agar
cmdm
dnff
fvhd
kgln
pgsm
titg
vnpd
amke
vi-5
0
5
10
15
20
25
30
Leng
th (m
m)
a
agar
cmdm
dnff
fvhd
kgln
pgsm
titg
vnpd
amke
02468
10121416182022242628
b
agar
cmdm
dnff
f0
20406080
100120140160180
c
agar
cmdm
dnff
fvhd
kgln
pgsm
titg
vnpd
amke
-0.50.00.51.01.52.02.53.03.54.04.5
Leng
th (m
m)
d
agar
cmdm
dnff
fv-1
0
1
2
3
4
5
6
agar
cmdm
dnff
fvhd
kgln
pgsm
titg
vnpd
amke
02468
10121416182022242628
fe
ag cm dn fv kg pg ti vn-100
0
100
200
300
400
500
600
Leng
th (m
m)
g
agar
cmdm
dnff
fvhd
kgln
pgsm
titg
vnpd
amke
vi02468
1012141618
h
agar
cmdm
dnf
02468
10121416182022242628
i

68
Figure 3.12. The identification of gaps in numeric characters. a = length of the upper glume, b = length of the lower lemma, c = length of the awn of the upper lemma, d = length of the callus of the upper lemma, e = length of the upper lemma, f = length of lobes of the upper lemma, g = length of the panicle, h = length of the lower glume, i = length of the longer pedicel, j = length of the shorter pedicel, k = length of the leaf blade, l = height of the culm, m = width of the leaf blade, n = length of the lower palea and o = length of the upper palea. Abbreviations: ag = Loudetia angolensis, ar = L. arundinacea, cm = L. camerunensis, ct = L. coarctata, dm = L. demeusei, dn = L. densispica, ff = L. filifolia, fv = L. flavida, hd = L. hordeiformis, kg = L. kagerensis, ln = L. lanata, pg = L. phragmitoides, sm = L. simplex, ti = L. tisserantii, tg = L. togoensis, vn = L. vanderystii, vi = Danthoniopsis viridis, am = Loudetiopsis ambiens, ke = L. kestingii, pd = Tristachya pedicellata, = dip in the frequency distribution of means, ranges and standard deviations, dashed line = gap in the frequency distribution of means, ranges and standard deviations where no value exists, and solid line = arbitrary definition of character state where no gap in ranges exists.
agar
cmdm
dnff
fvhd
kgln
pgsm
titg
vnpd
-202468
1012141618202224
Leng
th (m
m)
agar
cmdm
dnff
fvhd
kgln
pgsm
titg
vnpd
-2000
200400600800
10001200140016001800
k
agar
cmdm
dn-200
0200400600800
100012001400160018002000
l
agar
cmdm
dnff
fvhd
kgln
pgsm
tivn
pdam
kevi
02468
10121416182022
agar
cmdm
dnff
fv0
2
4
6
8
10
12
14
16
m n o
agar
cmdm
dnff
fvhd
kgln
pgsm
titg
vnpd
0
2
4
6
8
10
12
14Le
ngth
(mm
)
j

69
Figure 3.13. The identification of gaps in anatomical numeric characters. a = diameter of cells of the inner bundlesheath (BS) of the 1st order vascular bundles (1st vbs), b = diameter of cells of the inner BS of the 2nd order vascular bundles (2nd vbs), c = diameter of cells of the outer BS of the 1st vbs, d = diameter of cells of the outer BS of the 1st vbs, e = diameter of metaxylem of the 1st vbs, f = diameter of phloem strand of the 1st vbs, g = diameter of phloem strand of the 2nd vbs, h = width of bulliform cells, i = height of the 1st vbs, j = height of the 2nd vbs, k = distance between 1st vbs, l = number of cells of the outer BS of 1st vbs, m = width of the 1st vbs, n = width of the 2nd vbs, width of the abaxial epidermal layer, p = width of the bulliform cell, q = number of cells of the inner layer of bundlesheath cells of the 2nd vbs. Abbreviations are as in Figure 5.12.
agan
arcm
ctdm
dnfffv
hdkg
lnpe
pgsm
titg
vnap
shne
dipv
amke
sctrbe
lepd
su2468
1012141618202224262830
Dia
met
er (μm
) a
agan
arcm
ctdm
dnff
fvhd
kgln
pepg
smti
tgvn
apsh
nedi
pvam
kesc
trbe
lepd
su2468
10121416182022242628
b
agan
arcm
ctdm
dnff
fvhd
kgln
pepg
sm468
1012141618202224
agan
arcm
ctdm
dnff
fvhd
kgln
pepg
smti
tgvn
apsh
nedi
pvam
kesc
trbe
lepd
su2468
101214161820222426
Dia
met
er (μm
)
c
d
agan
arcm
ctdm
dnff
fvhd
kgln
pepg
smti
tgvn
apsh
nedi
pvam
kesc
trbe
lepd
su0
10
20
30
40
50
60
70
80 e
agan
arcm
ctdm
dnff
fvhd
kgln
pepg
sm10
20
30
40
50
60
70
80
f
agan
arcm
ctdm
dnff
fvhd
kgln
pepg
smti
tgvn
apsh
nedipvam
kesc
trbe
lepd
su0
10
20
30
40
50
60
70
Dia
met
er (μm
)
g
agan
arcm
ctdm
dnff
fvhd
kgln
pepg
sm50
100
150
200
250
300
350
400
450
i
agan
arcm
ctdm
dnff
fvhd
kgln
pepg
smti
tgvn
apsh
nedi
pvam
kesc
trbe
lepd
su0
20
40
60
80
100
120
140
h

70
Andropogon apendiculatusAndropogon schirensisAndropogon gayanus
Loudetia angolensis
Loudetia annua
Loudetia arundinaceaLoudetia camerunensis
Loudetia coarctata
Loudetia demeusei
Loudetia densispica
Loudetia filifolia
Lousetia flammida
Loudetia flavida
Loudetia hordeiformis
Loudetia kagerensis
Loudetia lanataLoudetia pennata
Loudetia phragmitoides
Loudetia simplex
Loudetia tisserantii
Loudetia togoensis
Loudetia vanderystii
Loudetia sp. nova 1
Loudetia sp. nova 2
Loudetiopsis ambiens
Loudetiopsis capillipes
Loudetiopsis chrysothrix
Loudetiopsis glabrataLoudetiopsis glabrinodis
Loudetiopsis kerstingii
Loudetiopsis scaettae
Loudetiopsis thoroldii
Loudetiopsis trigeminaLoudetiopsis tristachyoides
Arundinella nepalensis
Danthoniopsis acutigluma
Danthoniopsis chimanimaniensisDanthoniopsis dinteri
Danthoniopsis parva
Danthoniopsis pruinosa
Danthoniopsis ramosa
Danthoniopsis viridis
Gilgiochloa indurataTrichopteryx marungensis
Tristachya bequartiiTristachya leucothrix
Tristachya pedicellataTristachya superba
46
1
15
158
0
13
0
7
1
3
1
2
071
0
62
1
6
1
73
1
71
0
70
0
67
0
61
1
68
0
49
1
48
1
36
1
9
3
7
0
72
1
65
1
7
0
2
263
0
25
2
23
1
61
1
60
1
18
0
3
1
74
1
73
1
68
0
63
0
73
1
69
1
49
2
48
2
31
2
26
1
18
0
52
1
35
1
14
0
3
1
70
0
64
1
51
1
7
1
58
0
38
2
35
1
11
1
5
0
12
0
73
1
63
0
36
2
12
0
3
1
2
2
71
0
63
0
46
1
15
1
9
3
5
0
69
0
68
0
26
2
2
0
60
1
30
0
26
1
73
1
38
1
5
0
2
0
71
0
51
1
48
0
30
0
26
1
25
0
23
1
22
2
11
1
71
0
63
0
50
1
46
1
30
0
26
0
24
1
20
1
12
0
9
3
7
0
36
2
24
0
18
0
67
0
66
0
64
1
62
1
49
2
48
2
40
0
28
1
25
0
9
1
60
1
56
1
51
0
49
3
42
0
31
1
30
0
28
1
25
0
10
0
26
1
20
1
9
3
3
1
61
1
60
1
51
1
23
1
60
1
49
2
48
2
21
1
13
0
10
1
3
1
74
1
69
0
68
0
17
0
14
0
10
0
9
3
5
048
1
3
1
2
0
40
1
31
2
5
0
0
0
69
1
26
0
25
0
5
0
33
1
26
2
72
1
66
0
52
1
49
3
45
0
44
074
0
69
2
68
2
62
1
57
1
51
1
75
1
71
0
68
0
66
0
64
0
51
1
43
1
38
0
37
1
30
0
29
1
26
1
19
0
18
0
11
1
47
1
29
2
20
1
15
1
14
0
1
0
70
0
64
0
63
1
41
1
31
4
29
2
10
066
0
60
1
47
1
41
1
40
1
29
2
2
1
0
0
42
0
29
1
10
0
6
0
42
0
33
1
32
1
3
1
69
1
68
1
62
0
51
1
29
3
14
0
6
0
75
1
69
2
46
1
44
1
42
0
38
0
33
2
32
1
26
1
15
1
13
0
11
1
6
1
2
1
74
1
63
1
53
0
52
0
51
1
47
1
44
1
38
0
37
1
29
1
19
0
18
0
13
0
12
0
9
1
2
1
0
075
1
73
0
70
0
63
1
58
0
57
1
56
0
53
0
52
0
42
0
36
2
26
2
11
1
73
1
68
2
65
1
57
1
43
1
37
1
29
1
14
167
0
64
0
63
1
60
1
36
3
33
2
26
2
25
2
23
1
13
0
12
1
64
0
25
1
7
0
72
1
61
1
60
1
59
0
58
0
50
1
43
1
37
1
33
1
29
1
14
1
71
0
48
0
36
3
26
0
24
0
9
2
17
1
7
0
2
2
33
0
31
4
21
1
40
0
9
3
20
1
17
0
15
1
11
1
61
1
60
1
7
0
5
0
70
0
19
0
16
0
13
0
9
1
24
1
14
0
12
0
70
0
65
1
7
0
10
0
26
2
72
1
62
1
31
4
33
0
48
0
2
2
40
0
7
0
69
0
74
1
68
0
48
1
70
0
65
1
62
0
58
0
40
1
25
0
10
0
0
0
36
2
23
1
62
1
40
0
3
1
49
2
48
2
38
0
26
2
51
2
31
3
74
1
73
1
51
0
23
1
15
1
70
0
53
1
25
0
33
1
20
0
12
1
49
1
45
1
44
1
40
1
53
0
2
1
64
0
63
1
62
0
59
0
56
0
31
4
71
0
43
1
31
2
10
0
40
1
32
1
33
1
31
4
74
1
45
1
44
1
7
1
1
1
69
2
68
2
27
0
20
0
73
1
25
0
23
1
6
1
51
2
36
3
7
0
65
1
52
1
27
1
12
1
51
1
25
1
14
1
69
2
62
0
50
1
24
1
21
1
68
0
36
2
2
1
74
1
55
1
49
0
67
1
45
0
22
0
21
2
10
1
4
0
63
0
62
1
56
1
54
0
49
3
44
0
42
1
39
1
36
1
34
1
33
0
31
3
28
0
27
0
24
0
23
0
20
1
16
1
9
2
8
0
7
1
66
1
18
1
Figure 3.14. Strict consensus of the 2 MPT’s with a length of 459 steps (CI = 0.21, RI = 0.52) based on the qualitative morphological and anatomical character set. The strict consensus tree lacks resolution only in the clade containing outgroup species. Bootstrap values ≥50% (arrows) and characters and character states supporting clades are indicated.
T
A
D
L
100% 100%
50%
67%
54%
The L-clade
RAP
CKT
AH
FP
63%
53%
Continued on the next page

71
A = Arundinella nepalensis, D = Danthoniopsis, L = Loudetia, T = Tristachya, RAP = the Danthoniopsis ramosa – acutigluma – parva clade, FP = the Loudetia flammida – phragmitoides clade, CKT = the Loudetiopsis capillipes – kerstingii – trigemina clade, AH = the Loudetia annua – hordeiformis clade, BL = the Tristachya bequartii – leucothrix clade. Symbols: filled and empty circles are as in Figure 3.5. Table 3.13. The distribution of character states defining the Loudetia clade based on Figure 3.14. 1st vb = first order vascular bundle, 2nd vb = second order vascular bundle, TS = transverse section. Abbreviations for clades are as in Figure 3.14.
Distribution other than in the Loudetia clade Char.
state Character state Clade Terminal taxon
31,4 Nine prominent veins on the upper lemma RAP FP CKT
D. chimanimaniensis
56,0 Absence of the germination flap on the upper lemma
None T. marungensis
59,0 One 1st vb associated with the midrib in TS of the leaf
None T. superba
62,0 One 2nd vb between 1st vb in TS of the leaf AH BL
D. ramosa
63,1 The third order vascular bundle well developed None T. leucothrix D. chimanimaniensis Gilgiochloa indurata T. marungensis
64,0 Bulliform cells distributed on the abaxial and adaxial surfaces as seen in TS of the leaf
None A. nepalensis T. pedicellata T. leucothrix D. chimanimaniensis
analysis based on the combined morphological and anatomical data set also changes the placement of major clades without necessarily altering species relationships within a genus. For example, when all characters are used, Tristachya becomes a basal genus on the tree followed by Danthoniopsis, with Loudetia / Loudetiopsis becoming terminal (Table 3.14). This pattern is retained when some characters are excluded, including characters 0, 3, 6, 8, 10 and others, but the pattern is altered when other characters are excluded. Notably, excluding characters 21 and 70 results in Loudetia / Loudetiopsis becoming basal followed by Tristachya, with Danthoniopsis placed at the terminal, whereas representative species of Danthoniopsis, Loudetia / Loudetiopsis and / or Tristachya are variously split into different clades, indicating the lack of resolution when characters 1, 2, 4, 5 and many others are excluded (Table 3.14). Therefore, morphological and anatomical data sets and altering character combinations support different phylogenetic relationships and alter classifications at generic level in the Arundinelleae.
Continued from the previous page 51

72
Andropogon apendiculatusAndropogon schirensisAndropogon gayanus
Loudetia angolensis
Loudetia annua
Loudetia arundinacea
Loudetia camerunensis
Loudetia coarctata
Loudetia demeusei
Loudetia densispica
Loudetia filifolia
Lousetia flammida
Loudetia flavida
Loudetia hordeiformis
Loudetia kagerensis
Loudetia lanata
Loudetia pennata
Loudetia phragmitoides
Loudetia simplex
Loudetia tisserantii
Loudetia togoensis
Loudetia vanderystii
Loudetia sp. nova 1Loudetia sp. nova 2
Loudetiopsis ambiens
Loudetiopsis capillipes
Loudetiopsis chrysothrix
Loudetiopsis glabrataLoudetiopsis glabrinodis
Loudetiopsis kerstingii
Loudetiopsis scaettae
Loudetiopsis thoroldii
Loudetiopsis trigeminaLoudetiopsis tristachyoides
Arundinella nepalensis
Danthoniopsis acutigluma
Danthoniopsis chimanimaniensisDanthoniopsis dinteri
Danthoniopsis parvaDanthoniopsis pruinosa
Danthoniopsis ramosa
Danthoniopsis viridis
Gilgiochloa indurata
Trichopteryx marungensis
Tristachya bequartiiTristachya leucothrix
Tristachya pedicellataTristachya superba
46
1
15
158
0
13
0
7
1
3
1
2
071
0
6
1
73
1
71
0
70
0
67
0
61
1
68
0
49
1
48
1
36
1
9
3
7
0
72
1
65
1
7
0
2
2
63
0
25
2
23
1
61
1
60
1
18
0
3
1
74
1
73
1
68
0
63
0
73
1
69
1
49
2
48
2
31
2
26
1
18
0
52
1
35
1
14
0
3
1
70
0
64
1
51
1
7
1
58
0
38
2
35
1
11
1
5
0
12
0
73
1
70
0
65
1
63
0
36
2
7
0
3
1
2
2
71
0
63
0
46
1
15
1
9
3
5
0
69
0
68
0
26
2
2
0
60
1
30
0
26
1
73
1
38
1
5
0
2
0
71
0
51
1
48
0
30
0
26
1
25
0
23
1
22
2
11
1
71
0
63
0
50
1
46
1
30
0
26
0
24
1
20
1
12
0
9
3
7
0
36
2
24
0
18
0
67
0
66
0
49
2
48
2
33
1
28
1
10
0
9
1
2
1
60
1
56
1
51
0
42
0
31
1
30
0
28
1
10
0
26
1
20
1
9
3
3
1
61
1
60
1
51
1
23
1
60
1
49
2
48
2
21
1
13
0
10
1
3
1
74
1
69
0
68
0
17
0
14
0
10
0
9
3
5
048
1
3
1
2
0
40
1
31
2
5
0
0
0
69
1
26
0
25
0
5
0
33
1
26
2
72
1
66
0
52
1
49
3
45
0
44
074
0
69
2
68
2
62
1
57
1
51
1
75
1
71
0
68
0
66
0
64
0
51
1
43
1
38
0
37
1
30
0
29
1
26
1
19
0
18
0
11
1
47
1
40
1
15
1
14
0
6
1
70
0
64
0
63
1
41
1
31
4
10
0
7
066
0
60
1
47
1
41
1
40
1
7
0
6
1
2
1
0
0
42
0
40
1
1
174
0
44
0
42
0
29
0
3
1
62
0
51
1
29
3
20
0
14
0
1
1
75
1
69
2
46
1
44
1
42
0
38
0
33
2
32
1
26
1
15
1
13
0
11
1
6
1
2
1
63
1
53
0
52
0
51
1
47
1
38
0
37
1
33
0
32
0
19
0
18
0
13
0
12
0
9
1
2
1
0
0
75
1
69
2
68
2
59
1
58
0
57
1
42
0
36
2
23
1
11
1
7
1
6
1
1
1
73
1
68
2
65
1
57
1
43
1
37
1
29
1
14
167
0
64
0
63
1
60
1
36
3
33
2
26
2
25
2
23
1
13
0
12
1
64
0
25
1
7
0
72
1
61
1
60
1
59
0
58
0
50
1
43
1
37
1
33
1
29
1
14
1
70
0
65
1
62
0
58
0
40
1
76
1
25
0
10
0
0
0
36
2
23
1
62
1
40
0
3
1
49
2
48
2
38
0
26
2
71
0
48
0
36
3
26
0
24
0
9
2
17
1
7
0
2
2
33
0
31
4
21
1
40
0
9
3
20
1
17
0
15
1
11
1
61
1
60
1
7
0
5
0
70
0
19
0
16
0
13
0
9
1
24
1
14
0
12
0
10
0
26
2
70
0
65
1
64
1
62
1
26
2
49
3
25
0
33
0
72
1
62
1
31
448
0
2
2
40
0
7
0
69
0
74
1
68
0
48
1
51
2
31
3
74
1
73
1
51
0
23
1
15
1
70
0
53
1
25
0
33
1
20
0
12
1
49
1
45
1
44
1
40
1
53
0
2
1
64
0
63
1
62
0
59
0
56
0
31
4
71
0
45
0
43
1
31
2
7
0
6
1
29
1
20
0
10
0
69
2
68
2
32
1
74
1
45
1
44
1
33
1
31
4
27
0
73
1
25
0
23
1
51
2
36
3
29
2
65
1
52
1
27
1
12
1
51
1
25
1
14
1
69
2
62
0
50
1
24
1
21
1
68
0
36
2
2
1
74
1
55
1
49
0
67
1
45
0
22
0
21
2
10
1
4
0
63
0
56
1
54
0
49
3
44
0
42
1
39
1
36
1
34
1
33
0
31
3
28
0
27
0
24
0
23
0
20
1
16
1
9
2
8
0
7
1
62
1
66
1
18
1
Figure 3.15. Support by one non-homoplasious character state in the TAH clade with the inclusion of character 76: the awn length scored as quantitative. Tree length = 460, CI = 0.21 and RI = 0.52 generated by the morphological and anatomical data set. Symbols: filled and empty circles are as in Figure 3.5.
TAH

73
Table 3.14. Instability in the placement order of major groups (Danthoniopsis (D), Loudetia / Loudetiopsis (L) and Tristachya (T)) in trees generated when one character was excluded from the analysis at a time. A minus sign indicates the character which was excluded. Char. = character, DLT = Danthoniopsis-Loudetia / Loudetiopsis-Tristachya, DLDTDL = Danthoniopsis-Loudetia / Loudetiopsis-Danthoniopsis-Tristachya- Danthoniopsis-Loudetia / Loudetiopsis, DLTDL = Danthoniopsis-Loudetia / Loudetiopsis-Tristachya-Danthoniopsis-Loudetia / Loudetiopsis, DTDL = Danthoniopsis-Tristachya-Danthoniopsis-Loudetia / Loudetiopsis, DTDLTL = Danthoniopsis-Tristachya-Danthoniopsis-Loudetia / Loudetiopsis- Tristachya-Loudetia / Loudetiopsis, DTL = Danthoniopsis-Tristachya-Loudetia / Loudetiopsis, DTLD = Danthoniopsis-Tristachya-Loudetia / Loudetiopsis-Danthoniopsis, DTLDL = Danthoniopsis-Tristachya- Loudetia / Loudetiopsis-Danthoniopsis-Loudetia / Loudetiopsis, DTLTDL = Danthoniopsis-Tristachya-Loudetia / Loudetiopsis-Tristachya-Danthoniopsis-Loudetia / Loudetiopsis, LDLT = Loudetia / Loudetiopsis-Danthoniopsis-Loudetia / Loudetiopsis-Tristachya, LDLTL = Loudetia / Loudetiopsis-Danthoniopsis-Loudetia / Loudetiopsis-Tristachya-Loudetia / Loudetiopsis, LDTDL = Loudetia / Loudetiopsis-Danthoniopsis-Tristachya-Danthoniopsis-Loudetia / Loudetiopsis, LDTL = Loudetia / Loudetiopsis-Danthoniopsis-Tristachya-Loudetia / Loudetiopsis, LDTLD = Loudetia / Loudetiopsis-Danthoniopsis-Tristachya-Loudetia / Loudetiopsis-Danthoniopsis, LTD = Loudetia / Loudetiopsis-Tristachya-Danthoniopsis, LTDL = Loudetia / Loudetiopsis-Tristachya-Danthoniopsis-Loudetia / Loudetiopsis, LTLTDLD = Loudetia / Loudetiopsis-Tristachya-Loudetia / Loudetiopsis-Tristachya-Danthoniopsis-Loudetia / Loudetiopsis-Danthoniopsis, TDL = Tristachya-Danthoniopsis-Loudetia / Loudetiopsis, TDLD = Tristachya-Danthoniopsis-Loudetia / Loudetiopsis-Danthoniopsis, TDLDL = Tristachya-Danthoniopsis-Loudetia / Loudetiopsis-Danthoniopsis-Loudetia / Loudetiopsis, TLDLDL = Tristachya- Loudetia / Loudetiopsis-Danthoniopsis-Loudetia / Loudetiopsis Danthoniopsis-Loudetia / Loudetiopsis. N = number of trees, l = tree length, Ci = consistence index, Ri = retention index. Char. excluded N l Ci Ri Collapsed nodes Tree topology None 2 456 0.22 0.53 1 TDL -0 16 452 0.22 0.53 9 TDL -1 100 456 0.22 0.53 26 LDTDL -2 20 445 0.22 0.53 9 LTDL -3 56 449 0.22 0.53 19 TDL -4 45 456 0.22 0.53 28 LTLDL -5 100 451 0.22 0.53 20 DLTL -6 2 451 0.22 0.53 1 TDL -7 1 443 0.22 0.53 0 DTLTDL -8 2 457 0.22 0.53 1 TDL -9 6 446 0.22 0.53 2 DLTL -10 10 447 0.22 0.53 6 TDL -11 100 451 0.22 0.53 27 LDTDL -12 100 448 0.22 0.53 14 TDL -13 40 454 0.22 0.53 9 DTDL -14 100 451 0.22 0.53 14 LDTL
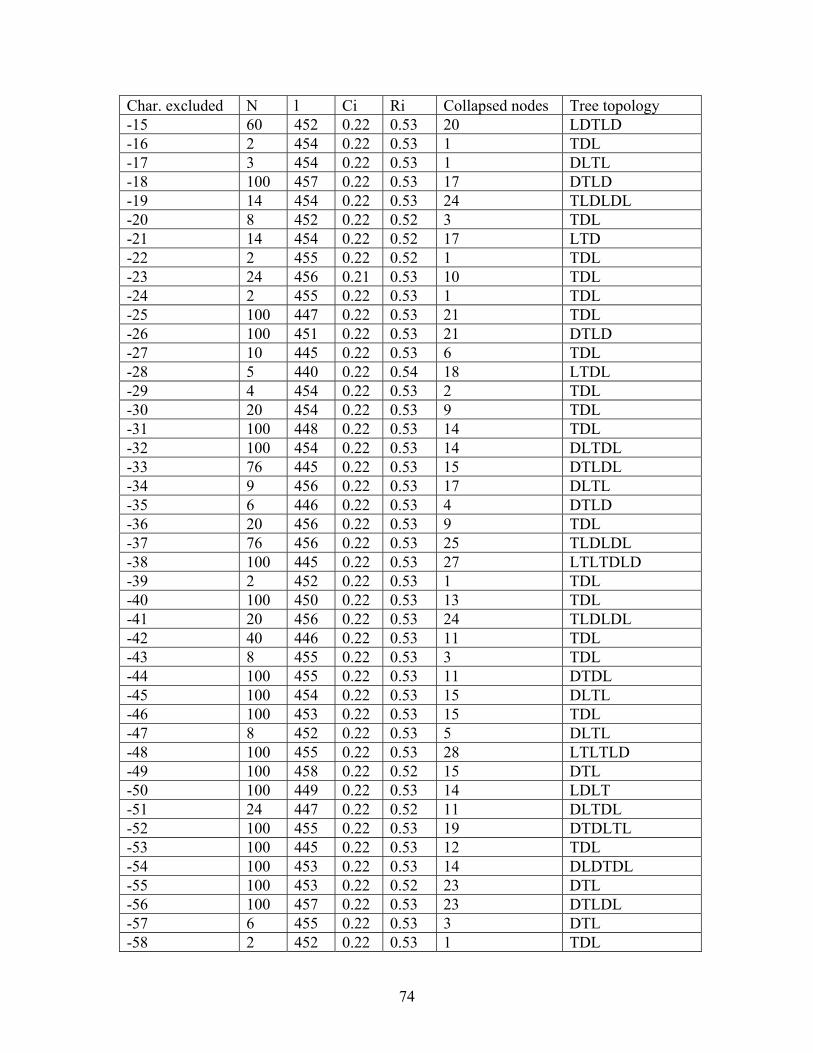
74
Char. excluded N l Ci Ri Collapsed nodes Tree topology -15 60 452 0.22 0.53 20 LDTLD -16 2 454 0.22 0.53 1 TDL -17 3 454 0.22 0.53 1 DLTL -18 100 457 0.22 0.53 17 DTLD -19 14 454 0.22 0.53 24 TLDLDL -20 8 452 0.22 0.52 3 TDL -21 14 454 0.22 0.52 17 LTD -22 2 455 0.22 0.52 1 TDL -23 24 456 0.21 0.53 10 TDL -24 2 455 0.22 0.53 1 TDL -25 100 447 0.22 0.53 21 TDL -26 100 451 0.22 0.53 21 DTLD -27 10 445 0.22 0.53 6 TDL -28 5 440 0.22 0.54 18 LTDL -29 4 454 0.22 0.53 2 TDL -30 20 454 0.22 0.53 9 TDL -31 100 448 0.22 0.53 14 TDL -32 100 454 0.22 0.53 14 DLTDL -33 76 445 0.22 0.53 15 DTLDL -34 9 456 0.22 0.53 17 DLTL -35 6 446 0.22 0.53 4 DTLD -36 20 456 0.22 0.53 9 TDL -37 76 456 0.22 0.53 25 TLDLDL -38 100 445 0.22 0.53 27 LTLTDLD -39 2 452 0.22 0.53 1 TDL -40 100 450 0.22 0.53 13 TDL -41 20 456 0.22 0.53 24 TLDLDL -42 40 446 0.22 0.53 11 TDL -43 8 455 0.22 0.53 3 TDL -44 100 455 0.22 0.53 11 DTDL -45 100 454 0.22 0.53 15 DLTL -46 100 453 0.22 0.53 15 TDL -47 8 452 0.22 0.53 5 DLTL -48 100 455 0.22 0.53 28 LTLTLD -49 100 458 0.22 0.52 15 DTL -50 100 449 0.22 0.53 14 LDLT -51 24 447 0.22 0.52 11 DLTDL -52 100 455 0.22 0.53 19 DTDLTL -53 100 445 0.22 0.53 12 TDL -54 100 453 0.22 0.53 14 DLDTDL -55 100 453 0.22 0.52 23 DTL -56 100 457 0.22 0.53 23 DTLDL -57 6 455 0.22 0.53 3 DTL -58 2 452 0.22 0.53 1 TDL

75
Char. excluded N l Ci Ri Collapsed nodes Tree topology -59 6 455 0.22 0.53 12 DLTL -60 8 451 0.22 0.53 6 TDL -61 6 455 0.22 0.52 12 DLTL -62 100 449 0.22 0.53 24 DLT -63 100 453 0.22 0.53 15 DLTL -64 100 446 0.22 0.53 20 LDTLD -65 6 447 0.22 0.53 6 TDL -66 2 449 0.22 0.53 1 TDL -67 100 451 0.22 0.53 23 DTLD -68 2 451 0.22 0.53 1 TDL -69 100 455 0.22 0.53 16 DTL -70 6 445 0.22 0.53 3 LTD -71 100 445 0.22 0.53 16 TDLDL -72 14 448 0.22 0.53 11 LDTLD -73 100 450 0.22 0.53 19 DLTL -74 40 453 0.22 0.53 23 DLTL -75 100 449 0.22 0.53 14 TDL -76 100 448 0.22 0.53 18 TDL -77 8 456 0.22 0.53 3 DTLDL
3.6 Discussion 3.6.1 Phylogenetic resolution The results show that separate morphological and anatomical characters do not offer much information about species relationships within Loudetia (Figures 3.7 & 3.8, respectively). Poorer resolutions in hypotheses A and B than in hypothesis C (Figures 3.7 to 3.9) may imply that each of the separate data sets contain weak phylogenetic signals for particular nodes, which may be masked by homoplasious character state distributions in separate analyses, but they may additively assert themselves above the phylogenetic noise in the combined data set (de Queiroz, 1993; Bull et al., 1993; Patterson et al., 1993; Doyle, 1992). The resolution of hypothesis C is thus consistent with the findings that different data sets resolve particular nodes in phylogenetic analyses of the trichopteran caddisflies (Kjer et al., 2001). However, internal branch support for the Arundinelleae in hypothesis C is lower than that obtained in hypothesis A (92% versus 84% bootstrap), but higher than in hypothesis B (less than 50% bootstrap). Furthermore, most major clades in hypothesis C are not supported and this trend is comparable to hypothesis B. The reduction in internal branch support in hypothesis C compared to hypothesis A may indicate that the data set with a larger number of characters has swamped the one with a smaller number of characters (46 anatomical versus 28 morphological characters). The reduced internal branch support in hypothesis C compared to hypothesis A shows that an increase in the number of characters apparently has a diluting effect on the amplitude of the phylogenetic signal in hypothesis C in accordance with Bull et al. (1993). In spite of the reduction in internal branch support in most of the major clades in the combined data set, the results suggest that phylogenetic relationships within Loudetia might not be inferred by separate evidence from morphological and anatomical characters, but they might be accessible through a combination of these. The use of combined data sets of
76
morphological and anatomical characters should therefore be encouraged in a non-molecular phylogenetic analysis of the Arundinelleae. However, the AHS trichotomy within the Loudetia clade in hypothesis C may indicate that the phylogenetic hypothesis of the group cannot be fully resolved by the characters used or that the amount of homoplasy in characters and character states may still be high enough to overwhelm homology and interfere with the estimation of phylogenetic relationships (Bull et al., 1993; Kluge, 1998). The lack of strong internal branch support in the Loudetia clade (less than 50% bootstrap in hypothesis B and 52% each for hypotheses A and C) may be due to high levels of homoplasy (reversal and parallel character state transformations). High ratios of homoplasious characters and character states (Table 3.11) may indicate that there are relatively high proportions of phylogenetically uninformative characters in the morphological and anatomical data sets used. The lack of strong internal branch support2 is common in grass phylogenies. Barker et al. (1995) noted that CI values as low as 0.15 are not only common, but also acceptable for a data matrix of 30 or more taxa in the Gramineae. The problem may be particularly important in the Arundinoideae, which are reported to have a large number of unspecialized characteristics (Stebbins, 1981). Lack of strong support in grass phylogenies is common with the use of morphological, and even molecular data (Mathews and Sharrock, 1999). Kellog and Watson (1993) noted that parallelism is extensive in grass phylogenies. The present results are therefore expected and are comparable to those reported by Barker et al. (1995) for the Arundinoideae, Bayón (1998) for the Briza complex and the Grass Phylogeny Working Group (2000) for the whole family. The lack of strong branch support may be attributed to conflicting data sets or homoplasy (de Queiroz, 1993). 3.6.2 Conflict in the estimation of phylogenetic relationships
The pattern of relationships among species of Loudetia is not discernible due to the lack of resolution in Figures 3.6 and 3.9). However, the pattern of relationships of terminal taxa within the Arundinellean clade is different between phylogenetic hypothesis A (Figure 3.7) – ([[Tristachya] [Arundinella [Danthoniopsis [Loudetia, Loudetiopsis, Trichopteryx]]]]) and phylogenetic hypothesis B (Figure 3.8) – ([[Danthoniopsis, Trichopteryx] [Tristachya, Loudetia pedicellata] [Loudetia, Loudetiopsis, Arundinella]]). Aberrant estimates of phylogenetic relationships between hypotheses A and B for the same taxa and the significant difference between anatomical and leaf surface data sets, leaf surface and morphological data sets and among anatomical, leaf surface and morphological data sets (Table 3.10) may indicate that data partitions conflict (Yoder et al., 2001). Conflicting molecular and morphological phylogenies have been reported in Caryoperis (Lamiaceae), Heuchera (Saxifragaceae), slow lorises (primates), iguanid lizards, amniotes, eutherian mammals, pathogenic weevil lineages and in many other examples (Soltis & Kuzoff, 1995; Hedges & Maxson, 1996; Miyamoto, 1996; Normack & Lanteri, 1998; Cantino et al., 1999; Wiens & Hollingsworth, 2000; Levasseur & Lapinte, 2001; Yoder et al., 2001). Although relationships and the placement of terminal taxa are different, there is no significant incongruence between morphological and
2 Bootstrap values on grass phylogenetic hypotheses are not readily available in literature.

77
anatomical data sets at 95% confidence level (P = 0.4885; Table 3.10). However, results of this incongruence test may indicate the failure of the method to detect significant incongruence and the threshold of 95% may be restrictive (two of the criticisms of methods available for testing data set incongruence), rather than an indication of homogeneity between the morphological and anatomical data sets (Miyamoto & Fitch, 1995; Normark & Lanteri, 1998; Wien & Hollingsworth, 2000; Yoder et al., 2001). Conflicting estimates of phylogenetic relationships between data sets can be attributed to one or more of the following factors: incorrect assessment of homology, sampling error, different evolutionary histories between data sets, hybridization and introgression or horizontal gene transfer and/or chloroplast capture (for molecular work), homoplasy and error in the data analysis method (Baldauf & Palmer, 1990; Graur et al., 1991; de Queiroz, 1993; Bull et al., 1993; Patterson et al., 1993; Poe, 1996; Schilling et al., 1996; Normark & Lanteri, 1998). In plants, incongruence of phylogenetic estimates between data sets has been linked mainly to hybridization and introgression (Soltis & Kuzoff, 1995; Schilling & Panero, 1996; Wilson, 1998). The occurrence of hybridization in the Arundinelleae has also been hypothesized by Phipps (1964), but no investigation has been made to date. Despite ambiguities in species relationships generated by cladistic analyses based on separate anatomical and morphological data sets, there is agreement about some relationships. Loudetia species form a node within which Loudetiopsis is nested. The sister relationship between Loudetia angolensis and L. arundinacea in Figures 3.7 & 3.8 is retrieved in Figure 3.9. These areas of agreement offer a more conservative estimate of phylogenetic relationships, the deciphering of which may be inundated by traces of complicated histories of morphological and anatomical character state transformations (Hillis, 1987; de Queiroz et al., 1993; Patterson et al., 1993; Normark & Lanteri, 1998; Kjer et al., 2001). The link between the morphological or anatomical data set and a particular hypothesis of species relationships are weakly supported when the exclusion of at least one character at a time from the analysis alters the placement of terminal taxa in the tree topology. In this case, conflicting phylogenetic relationships are indicative of changes in character combinations in the same data set even when the number of characters is maintained at N − 1. Therefore the data set exhibits instability in the order of major clades in tree topologies when character combinations have changed. The effect of excluding some characters in conflicting data sets has not been investigated, but it is expected that this would variously alter the pattern of species relationships as in Table 3.14. The change from the Tristachya – Danthoniopsis – Loudetia / Loudetiopsis (TDL) when the cladistic analysis is based on a complete data set to Loudetia / Loudetiopsis – Danthoniopsis – Tristachya (LDT), Danthoniopsis – Loudetia / Loudetiopsis – Tristachya (DLT) and Danthoniopsis – Tristachya – Loudetia / Loudetiopsis (DTL) when some characters are excluded from the cladistic analyses represent competitive hypotheses of species relationships, in which basal and terminal taxa are swapped. Thus, although the TDL pattern is achieved in 38% (30 out of 78 analyses) of the analyses with one character excluded at a time and only about 2.5% (2 out of 78 analyses) for each of the LTD and

78
DLT and 5% (4 out of 78 analyses) for the DTL patterns, decisions regarding basal and terminal genera in the Arundinelleae cannot be made with certainty using the anatomical and morphological data set. This implies that relationships and classifications at generic level are unstable. The length of trees, ranging from 449 steps to 458 steps (Table 3.14), does not guide the choice based on the most parsimonious trees among the TDL, LTD, DLT and DTL patterns, but the TDL pattern has some of the most resolved trees. Therefore the TDL pattern of relationships among these genera has been chosen. 3.6.3 Monophyly of Loudetia The Arundinelleae form a moderately supported group (84% bootstrap) in hypothesis C (Figures 3.9 & 3.14) in which Loudetia and Loudetiopsis form a distinct clade, but Loudetia pedicellata is excluded. Loudetia pedicellata is sister to both Tristachya leucothrix and T. bequaertii. Therefore Loudetia is polyphyletic with the inclusion of L. pedicellata and paraphyletic with the exclusion of species now treated under Loudetiopsis. Loudetiopsis appears to be polyphyletic, with Loudetiopsis glabrinodis sister to the Loudetia filifolia – flavida – pennata clade, Loudetiopsis ambiens sister to the Loudetia flammida – phragmitoides clade and the Loudetia angolensis – Loudetia sp. nova 2 clade. A compact group of Loudetiopsis consisting of L. chrysothrix – scaetae – capillipes – kerstingii – trigemina – tristachyoides is sister to the Loudetia densispica – tisserantii – vanderystii clade. The placement of Loudetiopsis species within the Loudetia clade suggests that there is no cladistic support for recognising Loudetiopsis. The results of cladistic analysis are thus consistent with the previous placement of Loudetiopsis within the Loudetia clades based on intuition and phenetic affinities (Phipps, 1967). Thus, species under Loudetiopsis can be transferred to Loudetia. The Loudetia / Loudetiopsis combined genus still lacks synapomorphic characters. It is defined by: (1) having a prominent vein on the upper lemma (character 31, 4), (2) absence of a germination flap on the upper lemma (character 56, 0), (3) a tendency to have one first order vascular bundle associated with the midrib in transverse section (character 59, 0), (4) a tendency to have one second order vascular bundle between first order vascular bundles (character 62, 0), (5) third order vascular bundles almost always well-developed (character 62, 1) and (6) bulliform cells distributed only on the abaxial surface of the leaf blade (character 64, 0). These character states appear to have arisen more than once (in the case of the possession of nine prominent veins on the upper lemma) or independently among members of the Arundinelleae (Figure 3.14). There are three or more gradations in Loudetiopsis: L. ambiens, L. grabrata and L. villosipes are closely related to Loudetia, Loudetiopsis sensu stricto contains L. ternata and L. thoroldii and the rest of the species (including L. baldwinii and L. falcipes) are closely allied to Tristachya (Phipps, 1972d; Clayton; 1967). This suggests that if Loudetiopsis is incorrectly circumscribed, the species now treated under it may be split into two or more genera, Loudetia and Tristachya or that few species may remain in Loudetiopsis. The relationships of all Loudetiopsis species was not analysed because of the unavailability of specimens (section 3.1.3.9) for coding leaf anatomical characters and character states. Thus, a study involving all the species of Loudetia, Loudetiopsis and

79
Tristachya would elaborate the placement of the rest of the species under the genus Loudetiopsis. The placement of Loudetia pedicellata within the PLR clade in Figure 3.14 suggests that the species should be treated under Tristachya, although it is marginally separated from the Loudetia clade. Loudetia pedicellata is sister to Tristachya bequaertii and T. leucothrix. Transferring L. pedicellata to Tristachya offers support to Stent’s (1923) treatment of the species under Tristachya. Therefore, this study proposes that the name Tristachya pedicellata Stent should be resurrected and Loudetia pedicellata (Stent) Chippind., which was created by Chippindall (1955) and followed by Anderson (1990), should be synonymized. 3.6.4 Dependence of leaf anatomical sections on positions of samples Metcalfe (1960) reports that anatomical characters vary depending on the position of the leaf on the plant and the position of the sectioned portion within a leaf without presenting details. However, there were no marked variations in quantitative and qualitative characters in the number of first order vascular bundles in the midrib, distribution of first, second and third order vascular bundles in transverse section, number of files of bundlesheath cells, division of the phloem strand of the first order vascular bundles, interruption of inner and outer files of bundlesheath cells by sclerenchyma girders and type of bulliform and associated cells, in mature leaves of members of the Arundinelleae sampled from the basal, median and apical regions of the plant (Figure 3.10). Within a leaf, variation can be observed in samples taken 5 mm from the ligule and 5 mm from the apex (Figure 3.11). Therefore, in the Arundinelleae, qualitative and quantitative characters obtained from leaves sampled from the basal, median and apical positions on the plant can be comparable. However, portions from extremely basal regions of the leaf have thicker midrib and assosiated veins than the apical portions and these exhibit variation in the order of first, second and third order vascular bundles and distance between first order vascular bundles and thickness of colourless cells above first order vascular bundles, among other characters. Extremely apical and basal portions of the leaf must therefore be avoided in comparative studies. 3.6.5 Identification of discrete character states from measurement data The graph method is designed to deal with within-unit and between-unit variability (Almeida & Bisby, 1984). Within-unit variability refers to variants of one class, which are displayed on one side of the gap, if any, and variation in means, ranges and standard deviations (MRSD’s) separated by the gap represents between-unit variation. The identification of boundaries between character states using the graph method demonstrates the power and simple logic of explicitly converting numeric characters to ordinal binary and multistate in a manner that allows the exclusion of overlapping conditions (Figures 3.6 & 3.7). Statistical scaling using the difference between means has been suggested and assumed to provide an objective and repeatable method for deciding if two taxa are similar in terms of a measurement attribute (Farris, 1990; Rae, 1998; Wiens, 2001). However, it is known that a deviation from normality either due to sampling error or geographical variation may shift the means one way or another (Pimentel & Riggins, 1987; Farris, 1990; Swiderski et al., 1998). As a result, the
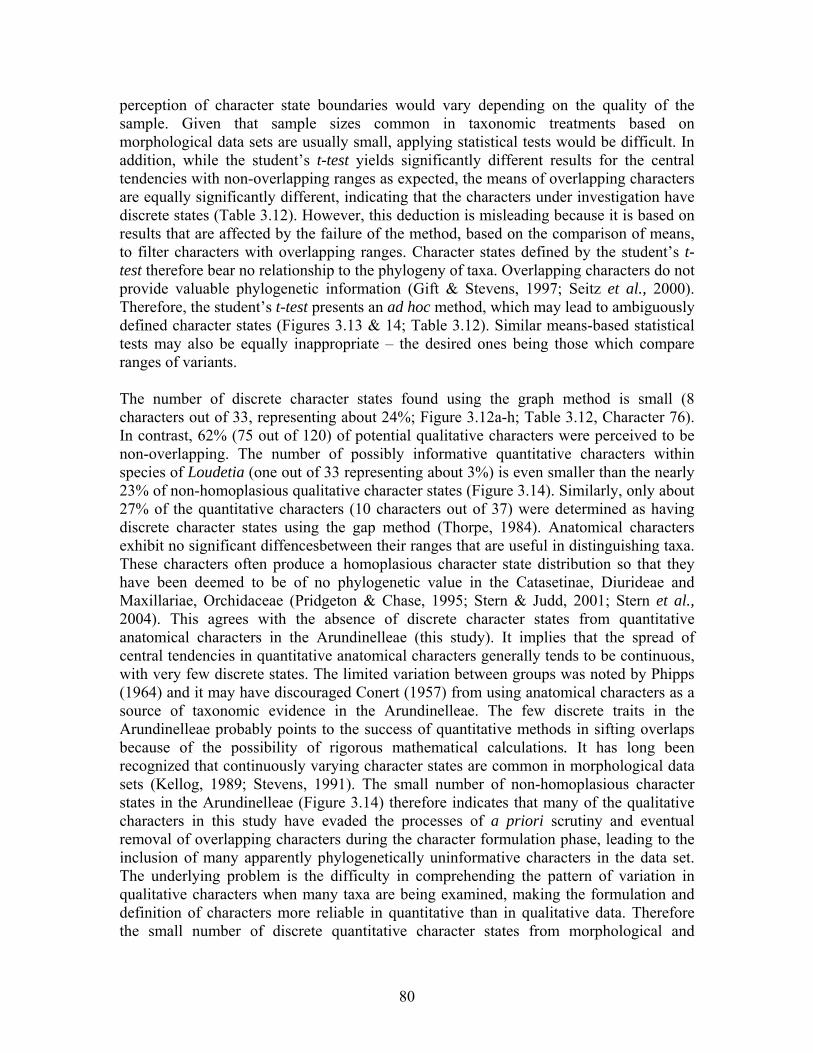
80
perception of character state boundaries would vary depending on the quality of the sample. Given that sample sizes common in taxonomic treatments based on morphological data sets are usually small, applying statistical tests would be difficult. In addition, while the student’s t-test yields significantly different results for the central tendencies with non-overlapping ranges as expected, the means of overlapping characters are equally significantly different, indicating that the characters under investigation have discrete states (Table 3.12). However, this deduction is misleading because it is based on results that are affected by the failure of the method, based on the comparison of means, to filter characters with overlapping ranges. Character states defined by the student’s t-test therefore bear no relationship to the phylogeny of taxa. Overlapping characters do not provide valuable phylogenetic information (Gift & Stevens, 1997; Seitz et al., 2000). Therefore, the student’s t-test presents an ad hoc method, which may lead to ambiguously defined character states (Figures 3.13 & 14; Table 3.12). Similar means-based statistical tests may also be equally inappropriate – the desired ones being those which compare ranges of variants. The number of discrete character states found using the graph method is small (8 characters out of 33, representing about 24%; Figure 3.12a-h; Table 3.12, Character 76). In contrast, 62% (75 out of 120) of potential qualitative characters were perceived to be non-overlapping. The number of possibly informative quantitative characters within species of Loudetia (one out of 33 representing about 3%) is even smaller than the nearly 23% of non-homoplasious qualitative character states (Figure 3.14). Similarly, only about 27% of the quantitative characters (10 characters out of 37) were determined as having discrete character states using the gap method (Thorpe, 1984). Anatomical characters exhibit no significant diffencesbetween their ranges that are useful in distinguishing taxa. These characters often produce a homoplasious character state distribution so that they have been deemed to be of no phylogenetic value in the Catasetinae, Diurideae and Maxillariae, Orchidaceae (Pridgeton & Chase, 1995; Stern & Judd, 2001; Stern et al., 2004). This agrees with the absence of discrete character states from quantitative anatomical characters in the Arundinelleae (this study). It implies that the spread of central tendencies in quantitative anatomical characters generally tends to be continuous, with very few discrete states. The limited variation between groups was noted by Phipps (1964) and it may have discouraged Conert (1957) from using anatomical characters as a source of taxonomic evidence in the Arundinelleae. The few discrete traits in the Arundinelleae probably points to the success of quantitative methods in sifting overlaps because of the possibility of rigorous mathematical calculations. It has long been recognized that continuously varying character states are common in morphological data sets (Kellog, 1989; Stevens, 1991). The small number of non-homoplasious character states in the Arundinelleae (Figure 3.14) therefore indicates that many of the qualitative characters in this study have evaded the processes of a priori scrutiny and eventual removal of overlapping characters during the character formulation phase, leading to the inclusion of many apparently phylogenetically uninformative characters in the data set. The underlying problem is the difficulty in comprehending the pattern of variation in qualitative characters when many taxa are being examined, making the formulation and definition of characters more reliable in quantitative than in qualitative data. Therefore the small number of discrete quantitative character states from morphological and
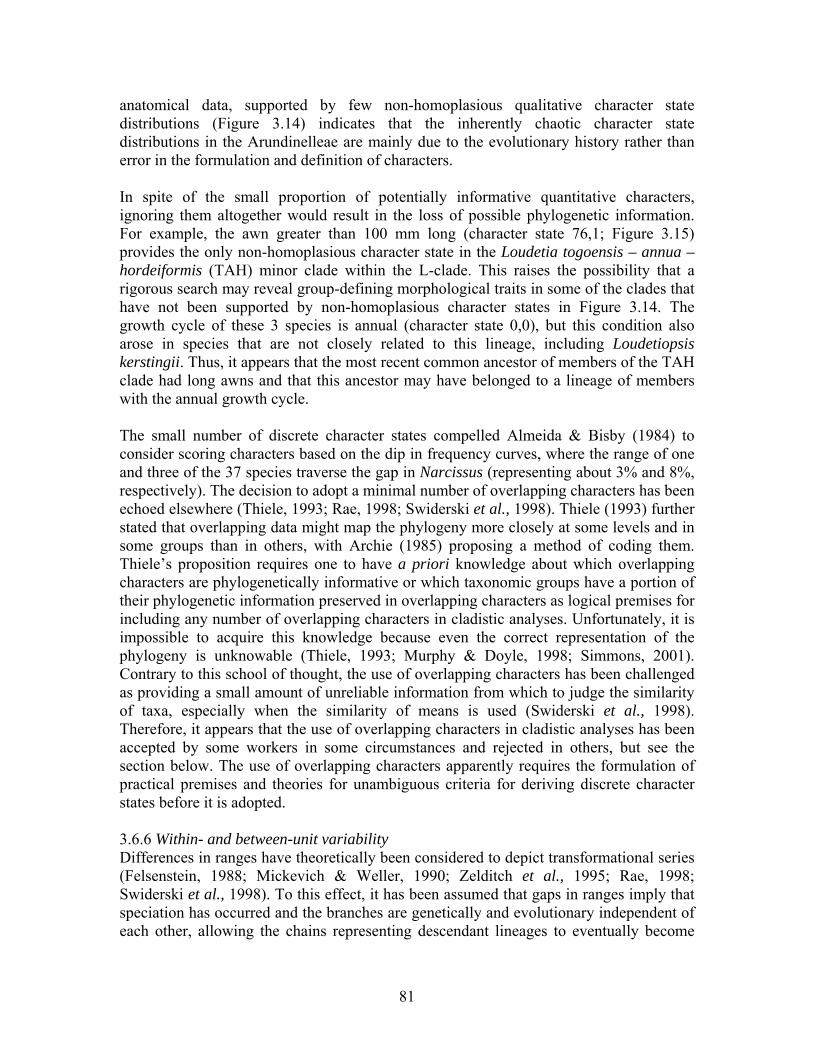
81
anatomical data, supported by few non-homoplasious qualitative character state distributions (Figure 3.14) indicates that the inherently chaotic character state distributions in the Arundinelleae are mainly due to the evolutionary history rather than error in the formulation and definition of characters. In spite of the small proportion of potentially informative quantitative characters, ignoring them altogether would result in the loss of possible phylogenetic information. For example, the awn greater than 100 mm long (character state 76,1; Figure 3.15) provides the only non-homoplasious character state in the Loudetia togoensis – annua – hordeiformis (TAH) minor clade within the L-clade. This raises the possibility that a rigorous search may reveal group-defining morphological traits in some of the clades that have not been supported by non-homoplasious character states in Figure 3.14. The growth cycle of these 3 species is annual (character state 0,0), but this condition also arose in species that are not closely related to this lineage, including Loudetiopsis kerstingii. Thus, it appears that the most recent common ancestor of members of the TAH clade had long awns and that this ancestor may have belonged to a lineage of members with the annual growth cycle. The small number of discrete character states compelled Almeida & Bisby (1984) to consider scoring characters based on the dip in frequency curves, where the range of one and three of the 37 species traverse the gap in Narcissus (representing about 3% and 8%, respectively). The decision to adopt a minimal number of overlapping characters has been echoed elsewhere (Thiele, 1993; Rae, 1998; Swiderski et al., 1998). Thiele (1993) further stated that overlapping data might map the phylogeny more closely at some levels and in some groups than in others, with Archie (1985) proposing a method of coding them. Thiele’s proposition requires one to have a priori knowledge about which overlapping characters are phylogenetically informative or which taxonomic groups have a portion of their phylogenetic information preserved in overlapping characters as logical premises for including any number of overlapping characters in cladistic analyses. Unfortunately, it is impossible to acquire this knowledge because even the correct representation of the phylogeny is unknowable (Thiele, 1993; Murphy & Doyle, 1998; Simmons, 2001). Contrary to this school of thought, the use of overlapping characters has been challenged as providing a small amount of unreliable information from which to judge the similarity of taxa, especially when the similarity of means is used (Swiderski et al., 1998). Therefore, it appears that the use of overlapping characters in cladistic analyses has been accepted by some workers in some circumstances and rejected in others, but see the section below. The use of overlapping characters apparently requires the formulation of practical premises and theories for unambiguous criteria for deriving discrete character states before it is adopted. 3.6.6 Within- and between-unit variability Differences in ranges have theoretically been considered to depict transformational series (Felsenstein, 1988; Mickevich & Weller, 1990; Zelditch et al., 1995; Rae, 1998; Swiderski et al., 1998). To this effect, it has been assumed that gaps in ranges imply that speciation has occurred and the branches are genetically and evolutionary independent of each other, allowing the chains representing descendant lineages to eventually become

82
distinct from each other (Swiderski et al., 1998; Mishler, 2000). This means that characters with non-overlapping ranges between groups might indicate differences in phyletic lineages. Therefore different ordinal character states should be assigned to taxa with non-overlapping ranges for a particular trait in order to capture this possible evolutionary transformation. In the Arundinelleae, the quantitative characters examined show variability that might indicate within-class and between-class variation. Between-class variation, represented by gaps between groups of ranges (Figure 3.12a-h), have been interpreted as representing boundaries between discrete character states. Thus, distinct ordinal codes have been assigned following Thorpe (1984). However, the ranges of characters on one side of the hiatus also appear to be highly variable so that a particular code assigned to species may be considered to be heterogeneous – thus encompassing species that probably represent different steps of the evolutionary divergence. For example, the callus of the upper lemma is clearly shorter in Loudetia phragmitoides and L. vanderystii than it is in L. arundinacea, L. demeusei, L. hordeiformis, L. kagerensis, L. lanata, L. tisserantii and L. togoensis, but the position of the hiatus dictates the assignment of the same ordinal code to these seemingly variable characteristics (Figure 3.12c). In this case, the resolution of independent evolutionary divergence among descendants of lineages is blurred by overlaps in ranges of otherwise discrete sets of character states caused by intermediates, i.e. intraspecific variation has obscured interspecific variation. Thus, while the coding decisions guided by the graph method may help with inferring evolutionary independence (branches) from evidence of divergence among the descendants (Swiderski et al., 1998), some divergence remains unaccounted for. This reflects limitations imposed by the reliance on the hiatus between ranges and standard deviations for guiding coding decisions for quantitative characters in the gap-dependent methods. Swiderski et al. (1998) propose the inspection of overlapping characters to see if hypotheses of evolutionary transformation can be formulated to augment those inferred from gaps. The process involves creating subsets within overlapping characters to circumvent the effect of intermediates that overlap ranges of taxa that do not overlap with each other. This represents an enhanced method of gleaning information from the heterogeneous classes that have been initially identified using the gap-dependent methods. However, the method represents a switch from one criterion (gap-dependent) to another (a perception that requires that data are spread in hyperspace to capture multidimensional variation). The forcing together of superficially similar taxa, which differ with respect to numerous less obvious character states has also been observed in the treatment of qualitative characters in Macrochloa (Vázquez & Barkworth, 2004). This commonality in the treatment of qualitative and quantitative characters indicates that simple procedures of defining character state boundaries being followed in morphological attributes fall short of interpreting complicated patterns of character state transformations. This failure to account for what may be perceived to be less obvious evolutionary steps represents the possible loss and / or twist of information, which may result in the masking and misrepresentation of phylogenetic signals. The resulting attempt to track species relationships may become chaotic, with a likelihood of high levels of homoplasious character distributions (Swiderski et al., 1998). This problem may be exacerbated by the
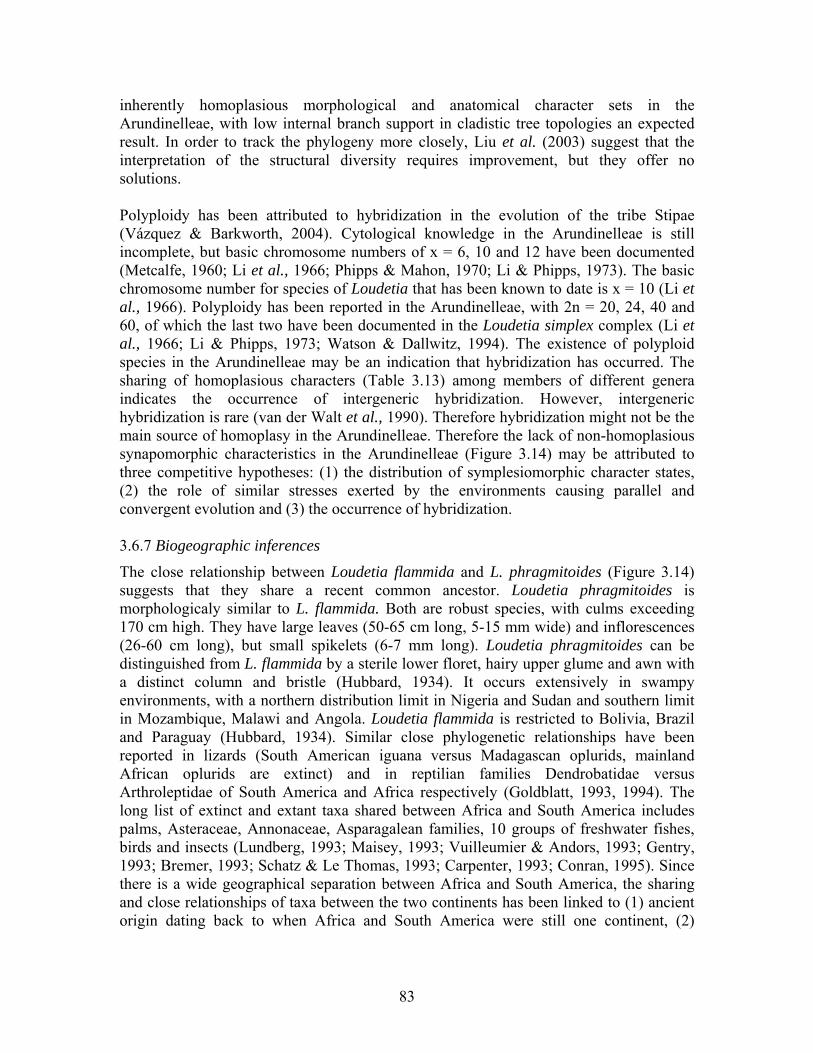
83
inherently homoplasious morphological and anatomical character sets in the Arundinelleae, with low internal branch support in cladistic tree topologies an expected result. In order to track the phylogeny more closely, Liu et al. (2003) suggest that the interpretation of the structural diversity requires improvement, but they offer no solutions. Polyploidy has been attributed to hybridization in the evolution of the tribe Stipae (Vázquez & Barkworth, 2004). Cytological knowledge in the Arundinelleae is still incomplete, but basic chromosome numbers of x = 6, 10 and 12 have been documented (Metcalfe, 1960; Li et al., 1966; Phipps & Mahon, 1970; Li & Phipps, 1973). The basic chromosome number for species of Loudetia that has been known to date is x = 10 (Li et al., 1966). Polyploidy has been reported in the Arundinelleae, with 2n = 20, 24, 40 and 60, of which the last two have been documented in the Loudetia simplex complex (Li et al., 1966; Li & Phipps, 1973; Watson & Dallwitz, 1994). The existence of polyploid species in the Arundinelleae may be an indication that hybridization has occurred. The sharing of homoplasious characters (Table 3.13) among members of different genera indicates the occurrence of intergeneric hybridization. However, intergeneric hybridization is rare (van der Walt et al., 1990). Therefore hybridization might not be the main source of homoplasy in the Arundinelleae. Therefore the lack of non-homoplasious synapomorphic characteristics in the Arundinelleae (Figure 3.14) may be attributed to three competitive hypotheses: (1) the distribution of symplesiomorphic character states, (2) the role of similar stresses exerted by the environments causing parallel and convergent evolution and (3) the occurrence of hybridization. 3.6.7 Biogeographic inferences
The close relationship between Loudetia flammida and L. phragmitoides (Figure 3.14) suggests that they share a recent common ancestor. Loudetia phragmitoides is morphologicaly similar to L. flammida. Both are robust species, with culms exceeding 170 cm high. They have large leaves (50-65 cm long, 5-15 mm wide) and inflorescences (26-60 cm long), but small spikelets (6-7 mm long). Loudetia phragmitoides can be distinguished from L. flammida by a sterile lower floret, hairy upper glume and awn with a distinct column and bristle (Hubbard, 1934). It occurs extensively in swampy environments, with a northern distribution limit in Nigeria and Sudan and southern limit in Mozambique, Malawi and Angola. Loudetia flammida is restricted to Bolivia, Brazil and Paraguay (Hubbard, 1934). Similar close phylogenetic relationships have been reported in lizards (South American iguana versus Madagascan oplurids, mainland African oplurids are extinct) and in reptilian families Dendrobatidae versus Arthroleptidae of South America and Africa respectively (Goldblatt, 1993, 1994). The long list of extinct and extant taxa shared between Africa and South America includes palms, Asteraceae, Annonaceae, Asparagalean families, 10 groups of freshwater fishes, birds and insects (Lundberg, 1993; Maisey, 1993; Vuilleumier & Andors, 1993; Gentry, 1993; Bremer, 1993; Schatz & Le Thomas, 1993; Carpenter, 1993; Conran, 1995). Since there is a wide geographical separation between Africa and South America, the sharing and close relationships of taxa between the two continents has been linked to (1) ancient origin dating back to when Africa and South America were still one continent, (2)
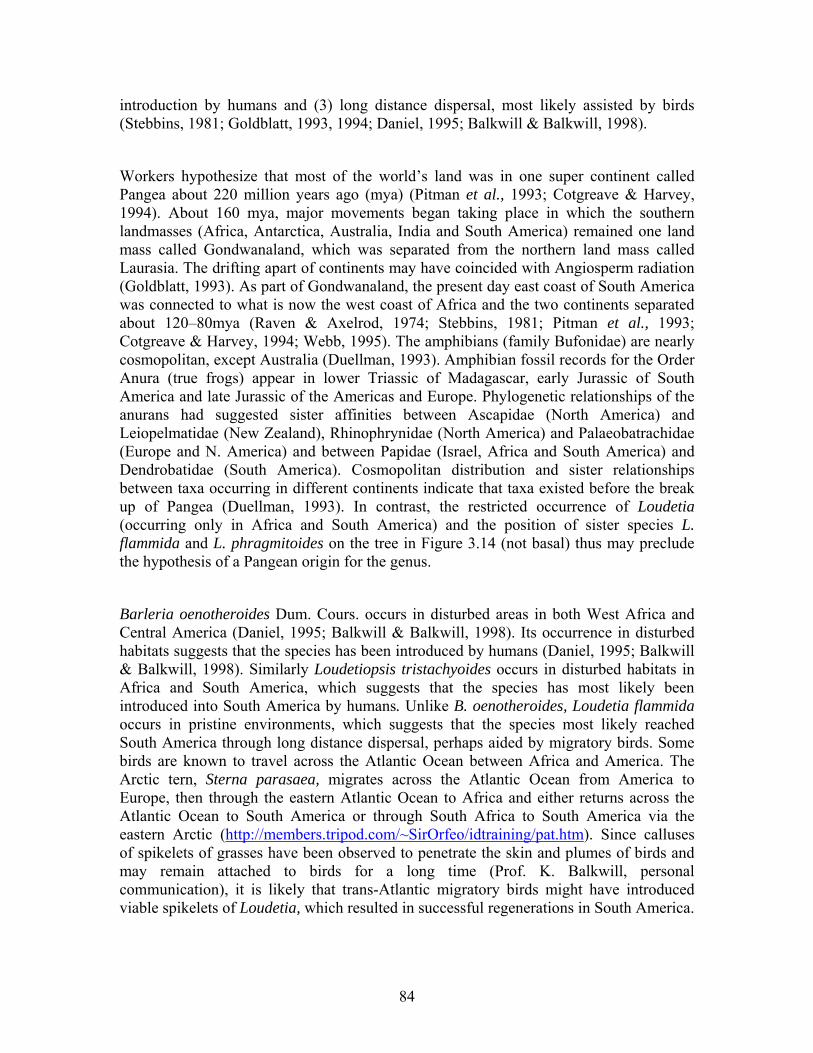
84
introduction by humans and (3) long distance dispersal, most likely assisted by birds (Stebbins, 1981; Goldblatt, 1993, 1994; Daniel, 1995; Balkwill & Balkwill, 1998).
Workers hypothesize that most of the world’s land was in one super continent called Pangea about 220 million years ago (mya) (Pitman et al., 1993; Cotgreave & Harvey, 1994). About 160 mya, major movements began taking place in which the southern landmasses (Africa, Antarctica, Australia, India and South America) remained one land mass called Gondwanaland, which was separated from the northern land mass called Laurasia. The drifting apart of continents may have coincided with Angiosperm radiation (Goldblatt, 1993). As part of Gondwanaland, the present day east coast of South America was connected to what is now the west coast of Africa and the two continents separated about 120–80mya (Raven & Axelrod, 1974; Stebbins, 1981; Pitman et al., 1993; Cotgreave & Harvey, 1994; Webb, 1995). The amphibians (family Bufonidae) are nearly cosmopolitan, except Australia (Duellman, 1993). Amphibian fossil records for the Order Anura (true frogs) appear in lower Triassic of Madagascar, early Jurassic of South America and late Jurassic of the Americas and Europe. Phylogenetic relationships of the anurans had suggested sister affinities between Ascapidae (North America) and Leiopelmatidae (New Zealand), Rhinophrynidae (North America) and Palaeobatrachidae (Europe and N. America) and between Papidae (Israel, Africa and South America) and Dendrobatidae (South America). Cosmopolitan distribution and sister relationships between taxa occurring in different continents indicate that taxa existed before the break up of Pangea (Duellman, 1993). In contrast, the restricted occurrence of Loudetia (occurring only in Africa and South America) and the position of sister species L. flammida and L. phragmitoides on the tree in Figure 3.14 (not basal) thus may preclude the hypothesis of a Pangean origin for the genus.
Barleria oenotheroides Dum. Cours. occurs in disturbed areas in both West Africa and Central America (Daniel, 1995; Balkwill & Balkwill, 1998). Its occurrence in disturbed habitats suggests that the species has been introduced by humans (Daniel, 1995; Balkwill & Balkwill, 1998). Similarly Loudetiopsis tristachyoides occurs in disturbed habitats in Africa and South America, which suggests that the species has most likely been introduced into South America by humans. Unlike B. oenotheroides, Loudetia flammida occurs in pristine environments, which suggests that the species most likely reached South America through long distance dispersal, perhaps aided by migratory birds. Some birds are known to travel across the Atlantic Ocean between Africa and America. The Arctic tern, Sterna parasaea, migrates across the Atlantic Ocean from America to Europe, then through the eastern Atlantic Ocean to Africa and either returns across the Atlantic Ocean to South America or through South Africa to South America via the eastern Arctic (http://members.tripod.com/~SirOrfeo/idtraining/pat.htm). Since calluses of spikelets of grasses have been observed to penetrate the skin and plumes of birds and may remain attached to birds for a long time (Prof. K. Balkwill, personal communication), it is likely that trans-Atlantic migratory birds might have introduced viable spikelets of Loudetia, which resulted in successful regenerations in South America.
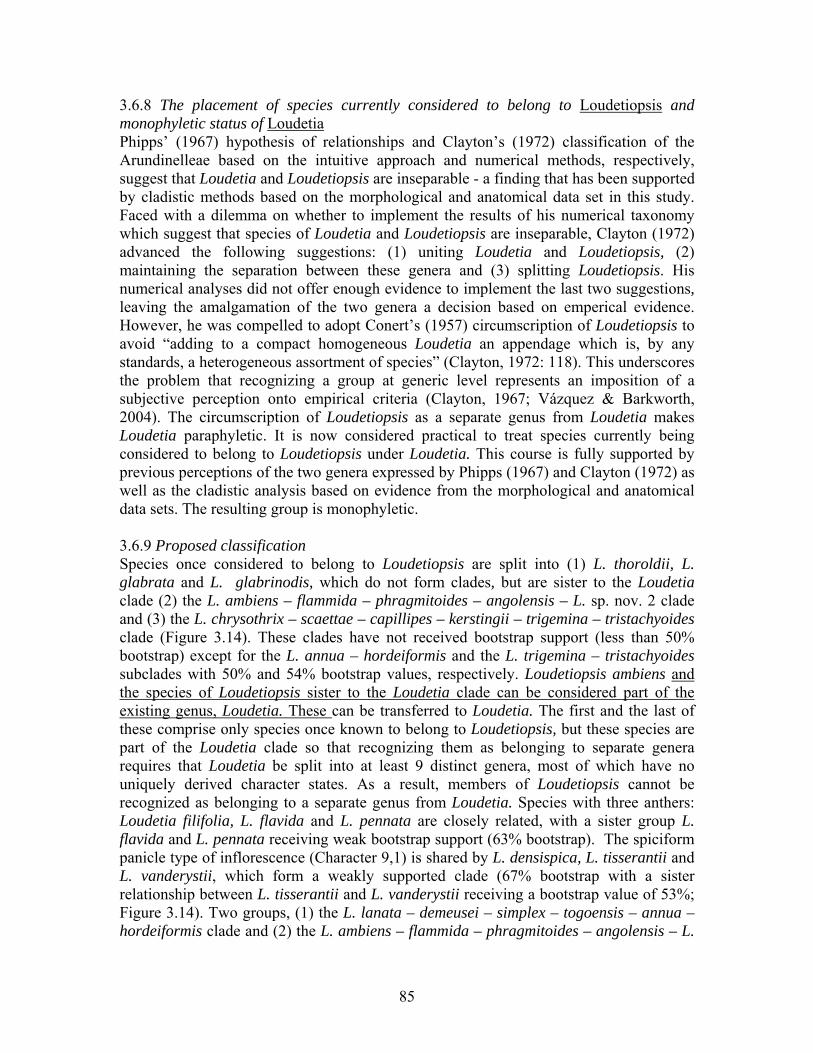
85
3.6.8 The placement of species currently considered to belong to Loudetiopsis and monophyletic status of Loudetia Phipps’ (1967) hypothesis of relationships and Clayton’s (1972) classification of the Arundinelleae based on the intuitive approach and numerical methods, respectively, suggest that Loudetia and Loudetiopsis are inseparable - a finding that has been supported by cladistic methods based on the morphological and anatomical data set in this study. Faced with a dilemma on whether to implement the results of his numerical taxonomy which suggest that species of Loudetia and Loudetiopsis are inseparable, Clayton (1972) advanced the following suggestions: (1) uniting Loudetia and Loudetiopsis, (2) maintaining the separation between these genera and (3) splitting Loudetiopsis. His numerical analyses did not offer enough evidence to implement the last two suggestions, leaving the amalgamation of the two genera a decision based on emperical evidence. However, he was compelled to adopt Conert’s (1957) circumscription of Loudetiopsis to avoid “adding to a compact homogeneous Loudetia an appendage which is, by any standards, a heterogeneous assortment of species” (Clayton, 1972: 118). This underscores the problem that recognizing a group at generic level represents an imposition of a subjective perception onto empirical criteria (Clayton, 1967; Vázquez & Barkworth, 2004). The circumscription of Loudetiopsis as a separate genus from Loudetia makes Loudetia paraphyletic. It is now considered practical to treat species currently being considered to belong to Loudetiopsis under Loudetia. This course is fully supported by previous perceptions of the two genera expressed by Phipps (1967) and Clayton (1972) as well as the cladistic analysis based on evidence from the morphological and anatomical data sets. The resulting group is monophyletic. 3.6.9 Proposed classification Species once considered to belong to Loudetiopsis are split into (1) L. thoroldii, L. glabrata and L. glabrinodis, which do not form clades, but are sister to the Loudetia clade (2) the L. ambiens – flammida – phragmitoides – angolensis – L. sp. nov. 2 clade and (3) the L. chrysothrix – scaettae – capillipes – kerstingii – trigemina – tristachyoides clade (Figure 3.14). These clades have not received bootstrap support (less than 50% bootstrap) except for the L. annua – hordeiformis and the L. trigemina – tristachyoides subclades with 50% and 54% bootstrap values, respectively. Loudetiopsis ambiens and the species of Loudetiopsis sister to the Loudetia clade can be considered part of the existing genus, Loudetia. These can be transferred to Loudetia. The first and the last of these comprise only species once known to belong to Loudetiopsis, but these species are part of the Loudetia clade so that recognizing them as belonging to separate genera requires that Loudetia be split into at least 9 distinct genera, most of which have no uniquely derived character states. As a result, members of Loudetiopsis cannot be recognized as belonging to a separate genus from Loudetia. Species with three anthers: Loudetia filifolia, L. flavida and L. pennata are closely related, with a sister group L. flavida and L. pennata receiving weak bootstrap support (63% bootstrap). The spiciform panicle type of inflorescence (Character 9,1) is shared by L. densispica, L. tisserantii and L. vanderystii, which form a weakly supported clade (67% bootstrap with a sister relationship between L. tisserantii and L. vanderystii receiving a bootstrap value of 53%; Figure 3.14). Two groups, (1) the L. lanata – demeusei – simplex – togoensis – annua – hordeiformis clade and (2) the L. ambiens – flammida – phragmitoides – angolensis – L.

86
sp. nov. 2 clade, represent heterogeneous assortments of species. Within the first group, the long awned L. togoensis, L. annua and L. hordeiformis (character 76,1; Figure 3.15) are more closely related to each other than each one is to L. lanata, L. demeusei and L. simplex, with which they share obliquely-shaped callus apex due to the two callus teeth being unequally-sized (character 49,2; Figure 3.14). In the second group, L. ambiens (which superficially does not resemble the rest of the species in the group) is closely related to sister groups L. flammida & L. phragmitoides and L. angolensis & L. sp. nov. 2.
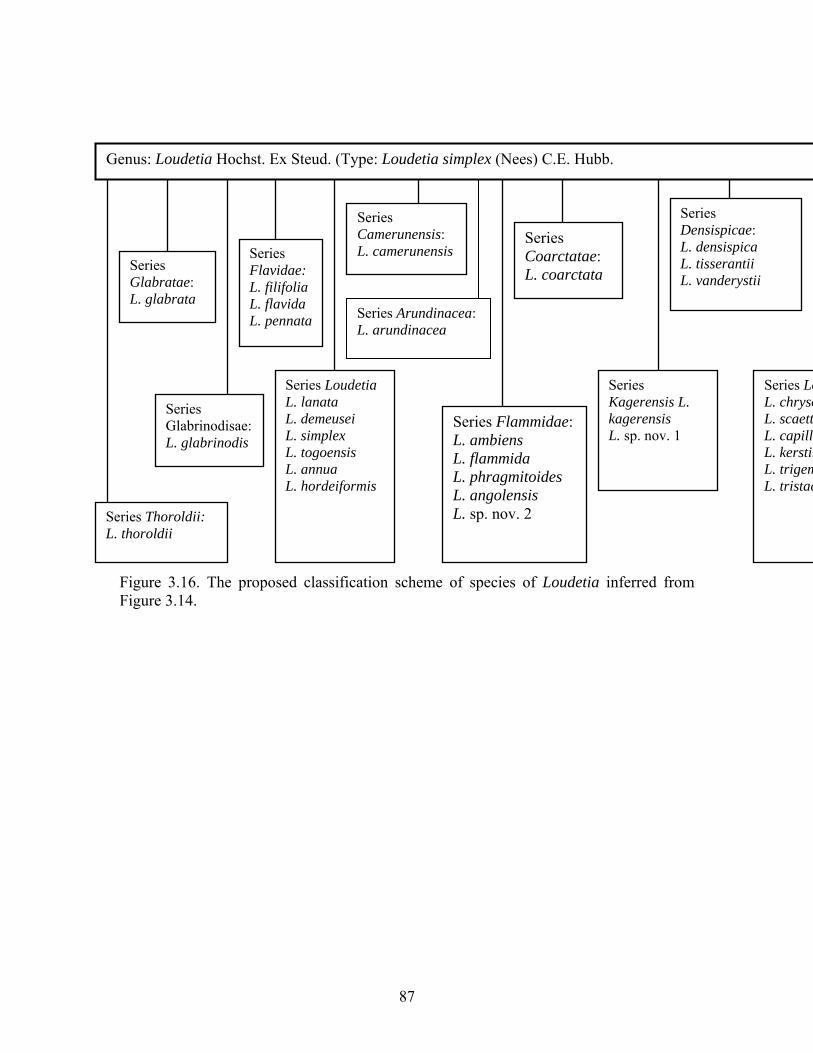
87
Figure 3.16. The proposed classification scheme of species of Loudetia inferred from Figure 3.14.
Genus: Loudetia Hochst. Ex Steud. (Type: Loudetia simplex (Nees) C.E. Hubb.
Series Thoroldii: L. thoroldii
Series Coarctatae: L. coarctata
Series Camerunensis: L. camerunensis
Series Kagerensis L. kagerensis L. sp. nov. 1
Series Flavidae: L. filifolia L. flavida L. pennata
Series Loudetia L. lanata L. demeusei L. simplex L. togoensis L. annua L. hordeiformis
Series Densispicae: L. densispica L. tisserantii L. vanderystii
Series Flammidae: L. ambiens L. flammida L. phragmitoides L. angolensis L. sp. nov. 2
Series LoL. chrysoL. scaettL. capilliL. kerstinL. trigemL. tristac
Series Glabratae: L. glabrata
Series Glabrinodisae:L. glabrinodis
Series Arundinacea: L. arundinacea

88
3.6.10 Comparison between the proposed classification and the previous classification Loudetia was first classified in 1936 (Hubbard, 1936). Five sections were recognised (Table 3.1). With the increase of knowledge, this classification was revised by adding new species to and transferring others from Loudetia (Hubbard, 1937, 1949; Conert, 1957; Clayton, 1967; Table 3.2). As a result, only two of the five sections were accepted (Clayton, 1967; Table 3.2). Loudetia togoensis belonged to a monotypic Section Lophanthera while section Loudetia was subdivided into six subsections (Table 3.2). Areas of similarities and differences between previous classifications (Table 3.2) and the proposed classification of Loudetia (Figure 3.16) are summarized in Table 3.15. Table 3.15. Comparison between the proposed classification (Figure 3.16) and the previous classification presented in Table 3.2. Lophthanthera = section.
Clayton (1967) D. Kamundi (proposed) Species Subsection Series L. ambiens – Flammidae L. angolensis Loudetia (= Typicae) Flammidae L. annua Annuae Loudetia L. arundinacea Loudetia Arundinaceae L. camerunensis Loudetia Camerunensis L. capillipes – Loudetiopsis L. chrysothrix – Loudetiopsis L. coarctata Densispicae Coarctatae L. demeusei Pungentes Pungentes L. densispica Densispicae Densispicae L. filifolia Acuminatae Acuminatae L. flammida Flammidae Flammidae L. flavida Acuminatae Acuminatae L. glabrata – Loudetiopsis L. glabrinodis – Loudetiopsis L. hordeiformis Annuae Loudetia L. kagerensis Insertae sedis Kagerensis L. lanata Pungentes Pungentes L. pedicellata Insertae sedis – L. pennata – Acuminatae L. phragmitoides Flammidae Flammidae L. scaetae – Loudetiopsis L. simplex Loudetia Loudetia L. thoroldii – Loudetiopsis L. tisserantii Densispicae Densispicae L. togoensis (Lophanthera) Loudetia L. trigemina – Loudetiopsis L. tristachyoides – Loudetiopsis L. vanderystii Densispicae Densispicae Loudetia sp. nov. 1 – Kagerensis Loudetia sp. nov. 2 – Flammidae

89
Table 3.16. Comparison between the number of species in a subsection (Clayton, 1967) and the number of species in the proposed classification (Kamundi). Lophanthera = Section.
Previous classification (Clayton, 1967) Proposed classification (Kamundi) Subsection Species Series Species Loudetia L. angolensis Loudetia L. annua L. arundinacea L. hordeiformis L. camerunensis L. simplex L. togoensis Annuae L. annua – – L. hordeiformis – – Acuminatae L. filifolia Acuminatae L. filifolia L. flavida L. flavida
– – L. pennata Densispicae L. coarctata Densispicae L. densispica L. densispica – – L. tisserantii – – L. vanderystii – – Flammidae L. flammida Flammidae L. flammida L. phragmitoides L. phragmitoides
– – L. ambiens – – L. angolensis – – L. angolensis – – Loudetia sp. nov. 2
(Lophanthera) L. togoensis – – Pungentes L. demeusei Pungentes L. lanata L. lanata – – Insertae sedis L. kagerensis Kagerensis L. kagerensis L. pedicellata Loudetia sp. nov. 1
– – Arundinaceae L. arundinacea
– – Coarctatae L. coarctata
– – Camerunensis L. camerunensis
– – Loudetiopsis L. capillipes – – L. chrysothrix
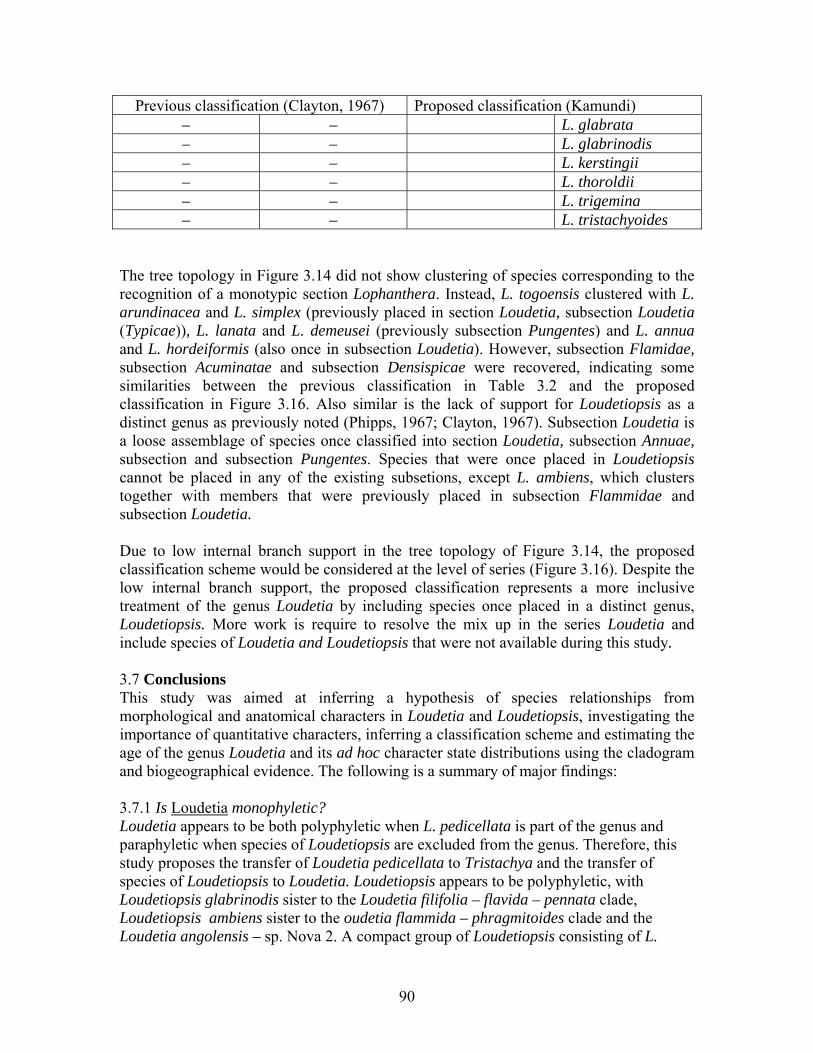
90
Previous classification (Clayton, 1967) Proposed classification (Kamundi) – – L. glabrata – – L. glabrinodis – – L. kerstingii – – L. thoroldii – – L. trigemina – – L. tristachyoides
The tree topology in Figure 3.14 did not show clustering of species corresponding to the recognition of a monotypic section Lophanthera. Instead, L. togoensis clustered with L. arundinacea and L. simplex (previously placed in section Loudetia, subsection Loudetia (Typicae)), L. lanata and L. demeusei (previously subsection Pungentes) and L. annua and L. hordeiformis (also once in subsection Loudetia). However, subsection Flamidae, subsection Acuminatae and subsection Densispicae were recovered, indicating some similarities between the previous classification in Table 3.2 and the proposed classification in Figure 3.16. Also similar is the lack of support for Loudetiopsis as a distinct genus as previously noted (Phipps, 1967; Clayton, 1967). Subsection Loudetia is a loose assemblage of species once classified into section Loudetia, subsection Annuae, subsection and subsection Pungentes. Species that were once placed in Loudetiopsis cannot be placed in any of the existing subsetions, except L. ambiens, which clusters together with members that were previously placed in subsection Flammidae and subsection Loudetia. Due to low internal branch support in the tree topology of Figure 3.14, the proposed classification scheme would be considered at the level of series (Figure 3.16). Despite the low internal branch support, the proposed classification represents a more inclusive treatment of the genus Loudetia by including species once placed in a distinct genus, Loudetiopsis. More work is require to resolve the mix up in the series Loudetia and include species of Loudetia and Loudetiopsis that were not available during this study. 3.7 Conclusions This study was aimed at inferring a hypothesis of species relationships from morphological and anatomical characters in Loudetia and Loudetiopsis, investigating the importance of quantitative characters, inferring a classification scheme and estimating the age of the genus Loudetia and its ad hoc character state distributions using the cladogram and biogeographical evidence. The following is a summary of major findings: 3.7.1 Is Loudetia monophyletic? Loudetia appears to be both polyphyletic when L. pedicellata is part of the genus and paraphyletic when species of Loudetiopsis are excluded from the genus. Therefore, this study proposes the transfer of Loudetia pedicellata to Tristachya and the transfer of species of Loudetiopsis to Loudetia. Loudetiopsis appears to be polyphyletic, with Loudetiopsis glabrinodis sister to the Loudetia filifolia – flavida – pennata clade, Loudetiopsis ambiens sister to the oudetia flammida – phragmitoides clade and the Loudetia angolensis – sp. Nova 2. A compact group of Loudetiopsis consisting of L.

91
chrysothrix – scaetae – capillipes – kerstingii – trigemina – tristachyoides is sister to the Loudetia densispica – tisserantii – vanderystii clade. 3.7.2 Phylogenetic relationships Species of Loudetiopsis are closely related to species of Loudetia. The L-clade is recognized as one genus, which includes all species of Loudetiopsis – implying that Loudetiopsis and Loudetia are inseparable. Based on this information, species of Loudetiopsis should be transferred to Loudetia. 3.7.3 Discordant patterns of phylogenetic relationships In this study, separate analyses of morphological and anatomical data sets did not resolve the Loudetia clade, but apparently indicated that conflict may exist between the two data sets and within each data set. In addition, the Loudetia clade receives low internal branch support with less than 50% bootstrap in most nodes in all analyses, particularly in hypothesis B (Figure 3.14). This has been interpreted to be due to relatively high homoplasy levels. Incongruence between the morphological and leaf surface and anatomical and leaf surface data sets and high homoplasy levels may indicate that reticulate character state evolution has occurred through hybridization. Reticulate evolution explains, taxonomic problems within the genus Loudetia. Excluding one character at a time in cladistic analyses reveals instability in the placement of major genera: Danthoniopsis, Loudetia / Loudetiopsis and Tristachya, with respect to each other in the tree topology. The most frequent pattern is Tristachya – Danthoniopsis – Loudetia / Loudetiopsis (TDL), which appears in 38% of the analyses, but Loudetia / Loudetiopsis – Danthoniopsis – Tristachya (LDT), Danthoniopsis – Loudetia / Loudetiopsis – Tristachya (DLT) and Danthoniopsis –Tristachya – Loudetia / Loudetiopsis (DTL) are also competitive hypotheses, each with less than 6% occurrence. This instability in the placement of genera means that the problem of basal and terminal taxa among these genera, in addition to classification at generic level, cannot be resolved with the morphological and anatomical data sets used in this study. 3.7.4 Quantitative characters Only about 3% (one out of 33) of quantitative characters are potentially important in the cladistic analysis of Loudetia using the graph method to perceive discrete character states. Most of the quantitative morphological and all of the quantitative anatomical characters investigated show overlapping ranges suggesting that they should be rejected. Since quantitative characters are easily assessed using empirical methods, the small number of potential characters may be due to the inherently chaotic character state distributions in the Arundinelleae. Therefore problems that have been faced in the delimitation of species in Loudetia can be attributed chiefly to the lack of group-specific characters and character states, which might be a result of hybridization, rapid evolution and the retention of ancestral (plesiomorphic) character states rather than error in character treatments. The presence of a non-homoplasious quantitative character defining the Loudetia togoensis – annua – hordeiformis clade indicates that the decision to exclude quantitative characters based on homoplasy leads to the loss of potential phylogenetic signals. The

92
existence of non-overlapping ranges within one class (Figures 3.13 & 3.14; Table 3.12) indicates that the determination of discrete character states from metric data using the graph method (Almeida & Bisby, 1984) produces coarse-grained clusters, each of which may encompass different evolutionary steps. Treating characters with seemingly minor evolutionary divergence as if they belong to one class, as exhibited by variations in the ranges, means and standard deviations (Figures 3.12 & 3.13), can result in misleading phylogenetic relationships. Methods currently available exhibit limitations in dealing with taxa with apparently complicated evolutionary histories. Therefore there is need to improve methods of determining discrete character states from quantitative data to incorporate thorough assessments of hypotheses of evolutionary divergence for taxa initially identified as belonging to one ordinal code. 3.7.5 Estimated age of Loudetia and the chaotic distribution of characters Apparently, Loudetia flammida is likely to have reached South America via long distance dispersal, most likely aided by birds (Figure 3.14). Therefore no clue about estimation of the age of the genus and its chaotic character state distribution can be obtained from biogeographical evidence. 3.7.6 Classification scheme The proposed classification scheme based on Figure 3.14 includes species of Loudetiopsis. This proposed classification is consistent with a phenetic analysis (Clayton, 1972) and a phylogenetic hypothesis based on intuition (Phipps, 1967). Clayton (1972) and Phipps (1967) reported the lack of unique diagnostic characters for Loudetiopsis, but they retained Loudetiopsis as a distinct genus. The lack of diagnostic characters can be noted for Danthoniopsis, Loudetia and Loudetiopsis, but these genera are defined by a set of homoplasious characters as reported by Phipps (1964) and they form distinct clades. The proposed classification suggests subdivisions of Loudetia into subgenera or sections, but this awaits elaboration by a molecular phylogeny of the group. It differs from Hubbard’s (1934, 1937) classification by not recognizing L. togoensis as belonging to a monotypic section. Basal species (L. thoroldii, L. glabrata and L. glabrinodis) do not form clades, but terminal species form a clade comprising only members of Loudetiopsis. In the proposed circumscription, Loudetia is monophyletic. 3.8 References Almeida, M.T. & F.A. Bisby. 1984. A simple method for establishing taxonomic
characters from measurement data. Taxon 33(3): 405–409. Anderson, H.M. 1990. Loudetia Steud. In: Leistner, O.A (ed.). Grasses of southern
Africa. Memoirs of the Botanical Survey of South Africa No. 58. National Botanic Gardens/Botanical Research Institute. Pp. 205–348.
Archie, J.W. 1985. Methods for coding variable morphological features for numerical taxonomic analysis. Syst. Biol. 34: 326–345.
Baldauf, S.L. & J.D. Palmer. 1990. Evolutionary transfer of the chloroplast tufA gene to the nucleus. Nature 344: 262–265.
Balkwill, M.-J. & K. Balkwill. 1998. A preliminary analysis of the distribution pattern of a large, pantropical genus, Barleria L. (Acanthaceae). J. Biogeogr. 25: 95–110.
93
Barker, N.P. 1993. A biosystematic study of Pentameris (Arundinae, Poaceae). Bothalia 23 (1): 25–47.
Barker, N.P., H.P. Linder & E.H. Harley. 1995. Polyphyly of the Arundinoideae (Poaceae): evidence from rbcL sequence data. Syst. Bot. 20: 423–435.
Barriel, V. & P. Tassy. 1998. Rooting with multiple outgroups: consensus versus parsimony. Cladistics 14(2): 193–200.
Baum, B.R. 1988. A simple procedure for establishing discrete characters from measurement data, applicable to cladistics. Taxon 37(1): 63–70.
Baum, B.R. & G. Estabrook. 1996. Impact of outgroup inclusion on estimates by parsimony of undirected branching of ingroup phylogenetic lines. Taxon 45: 243–257.
Bayón, N. D. 1998. Cladistic analysis of the Briza complex (Poaceae, Poeae). Cladistics 14: 287–296.
Beck, J.B., L.N. Guy, P.J. Calie, G.I. Baird, R.L. Small & E.E. Schilling. 2002. Is subtribe Solidagininae (Asteraceae) monophyletic? Taxon 53(3): 691–698.
Bisby, F.A. & K.W. Nicholls. 1977. Effects of varying character definitions on classification of Genisteae (Leguminosae). Botanical Journal of the Linnean Society 94: 97–121.
Brady, R.H. 1983. Parsimony, hierarchy and biological implications. In: Platnick, N. I. & Funk, V.A. (eds.). Advances in cladistics, Volume 2: Proceedings of the second meeting of the Willi Hennig Society. Columbia University Press, New York, pp. 1–36.
Bremer, K. 1993. Intercontinental relationships of African and South American Asteraceae: A cladistic biogeographic analysis, pp 105–138. In: Goldblatt, P. (ed.). Biological relationships between Africa and South America. Yale Univ. Press, New Haven.
Bull, J.J., J.P. Huelsenbeck, C.W. Cunningham, D.L. Swofford & P.J. Waddel. 1993. Partitioning and combining data in phylogenetic analysis. Syst. Biol. 42: 384–397.
Cantino, P.D., S. J. Wagstaff & R.G. Olmstead. 1999. Caryoperis (Lamiaceae) and the conflict between phylogenetic and pragmatic consideration in botanical nomenclature. Syst. Bot. 23(3): 369–386.
Carpenter, J.M. 1993. Biogeographic patterns in the Vespidae (Hymenoptera): two views of Africa and South America, pp. 139–155. In: Goldblatt, P. (ed.). Biological relationships between Africa and South America. Yale Univ. Press, New Haven. Collazo, A. (2000). Developmental variation, homology, and the pharyngula stage. Syst. Biol. 49(1): 3–18.
Chase, M.W., M.F. Fay, V. Savolainen. 2000. High level classification in the Angiosperms: new insights from the perspective of DNA sequence data. Taxon 49: 685–704.
Chippindall, L.K.A. 1955. A guide to the identification of grasses in South Africa. In: D. Meredith (ed.), The grasses and pastures of South Africa. Central News Agency, Cape Town.
Clayton, W.D. 1967. Studies in the Gramineae: XIV. Arundinelleae. Kew Bull. 21(1): 119–124.
Clayton, W.D. 1972. Numerical Taxonomy of the Arundinelleae. Kew Bull. 26(1): 111–123.

94
Clayton, W.D. 1974. Arundinelleae. Flora of Tropical East Africa 2: 406–431. Clayton, W.D. & S.A., Renvoize. 1989. Arundinelleae Stapf. In: Launert, E. & Pope,
G.V. (eds.). Flora Zambesiaca 10(3): 199, 216–220. Collazo, A. 2000. Developmental variation, homology, and the pharyngula stage. Syst.
Biol. 49(1): 3–18. Conert, H. J. 1957. Beiträge zur Monographie der Arundinelleae. Bot. Jahrb. Syst. 77
(2/3): 226–354. Conran, J.G. 1995. Family distributions in the Liliiflorae and their biogeographical
implications. J. Biogeogr. 22: 1023–1034. Cotgreave, P. & P.H. Harvey. 1994. Associations among biogeography, phylogeny and
bird species diversity. Biodiversity letters 2: 46–55. Daniel, T.F. 1995. New and reconsidered Mexican Acanthaceae: VI. Chiapas. Proc. Calif.
Acad. Sci. 48: 253–282. Davis, P.H. & V.H. Heywood. 1963. Principles of Angiosperm Taxonomy. Oliver &
Boyd, Edinburgh & London. 556 pp. Davis, J. 1993. Character removal as a means for assessing stability of clades. Cladistics
9: 201–210. de Queiroz, A. 1993. For consensus (sometimes). Syst. Biol. 42: 368–372. de Queiroz, A., M.J. Donoghue & Kim, J. 1995. Separate versus combined analysis of
phylogenetic evidence. Annu. Rev. Ecol. Syst. 26: 657–681. Doyle, J.J. 1992. Gene trees and species trees: molecular systematics as one-character
taxonomy. Syst. Bot. 17: 144–163. Dreyer, L.L., E.M. Marais & J.J.A. van der Walt. 1993. Pelargonium worcesterae: a
neglected species. S. Afr. Journ. Bot. 59(1): 69–73. Duellman, W.E. 1993. Amphibians in Africa and South America: evolutionary history
and ecological comparison, pp. 200–243. In: Goldblatt, P. (ed.). Biological relationships between Africa and South America. Yale Univ. Press, New Haven.
Ellis, R.P. 1976. A procedure for standardizing comparative leaf anatomy in the Poaceae. I. The leaf as viewed in transverse section. Bothalia 12(1): 65–109.
Ellis, R.P. 1979. A procedure for standardizing comparative leaf anatomy in the Poaceae. II. The epidermis as viewed in surface view. Bothalia 12(4): 641–671.
Farris, J.S. 1971. The hypothesis of non- specificity and taxonomic congruence. Annual Review of Ecology and Systematics 2: 277–302.
Farris, J.S. 1983. Logical basis of phylogenetic analysis. In: Platnick, N.I. & Funk, V.A. (eds.). Advances in cladistics, Volume 2: Proceedings of the second meeting of the Willi Hennig Society. Columbia University Press, New York, pp. 1–36.
Farris, J.S. 1990. Phenetics in camouflage. Cladistics 6: 91–100. Farris, J.S. 1997. The information content of a phylogenetic system. Syst. Zool. 28: 483–
519. Farris, J.S. 2000. Paraphyly, outgroups and transformations. Cladistics 16: 425–429. Farris, J.S., M. Kallersjö, A.G. Kluge & C. Bult. 1994. Testing significance of
incongruence. Cladistics 10: 315–319. Farris, J.S., M. Kallersjö, A.G. Kluge & C. Bult. 1995. Constructing a significance test
for incongruence. Syst. Biol. 44: 570–572. Felsenstein, J. 1985. Confidence limits on phylogenies: an approach using the bootstrap.
Evolution 39: 783–791.

95
Felsenstein, J. 1988. Phylogenies and quantitative characters. Annu. Rev. Ecol. Syst. 19: 445–471.
Fishbein, M., Hibsch-Jetter, D.E Sortis & L. Hufford. 2001. Phylogeny of Saxifragales (Angiosperm, Eudicots): Analysis of rapid ancient radiation. Syst. Biol. 50(6): 817–847.
Fitch, W.M. 1971. Towards defining the course of evolution: minimum change for a specific tree topology. Syst. Zool. 20: 406–416.
Gentry, A.H. 1993. Diversity and floristic composition of lowland tropical forests in Africa and South America, pp. 500–547. In: Goldblatt, P. (ed.). Biological relationships between Africa and South America. Yale Univ. Press, New Haven.Gift, N, P.E. Stevens. 1997. Vagaries in the delimitation of character states in quantitative variation – an experimental study. Syst. Biol. 46: 112–125.
Gift, N. & P.E. Stephens. 1997. Vagaries in the delimitation of character states in quantitative variation – an experimental study. Syst. Biol. 46(1): 112–125.
Glauert, A.M. & R. Phillips. 1965. The preparation of thin sections. In: Kay, D. (ed.). Techniques for electron microscopy. Alden & Mowbray (Ltd.). Alden Press, Oxford, pp. 213–253.
Goldblatt, P. 1993. Biological relationships between Africa and South America, pp. 3–14. In: Goldblatt, P. (ed.). Biological relationships between Africa and South America. Yale Univ. Press, New Haven.
Goldblatt, P. 1994. Common inheritance v. congruent evolution – African and South American biogeography compared. J. Biogeogr. 21 119–120.
Graham, S.A. 2002. Phylogenetic relationships and biogeography of the endemic Caribbean genera Crenea, Ginoria and Haitia (Lythraceae). Caribb. J. Sci. 38(3–4): 195–204.
Grass Phylogeny Working Group. 2000. Phylogeny and subfamilial classification of grasses (Poaceae). Annals of Missouri Botanic Garden 88(3): 373–457.
Graur, D., W.A. Hide & W.-H. Li. 1991. Is the guinea-pig a rodent? Nature 351: 649–652.
Hedges, S.B, & L.R. Maxson. 1996. Re: Molecules and morphology in amniote phylogeny. Mol. Phylogenet. Evol. 6: 312–314.
Hillis, D.M. 1987. Molecular versus morphological approaches to systematics. Annu. Rev. Ecol. Syst. 18: 23–42.
Hillis D.M. & J.J. Bull. 1993. An empirical test of bootstrapping as a method for assessing confidence in phylogenetic analysis. Syst. Biol. 42(2): 182–192.
Holmgren, P.K., N.H. Holmgren & L.C. Barnett. 1991. Index Herbariorum. 8th edition. New York Botanic Garden, New York.
Hoot, S.B., S. Magallón & P.R. Crane. 1999. Phylogeny of basal eudicotes based on three molecular data sets: atpB, rbcL, and 18S nuclear ribosomal DNA sequences. Annals of Missouri Botanic Garden 86(1): 1–32.
Hubbard, C.E. 1934. Notes on African Grasses: 17. Kew Bull. 1934: 426–433. Hubbard, C.E. 1936. The genera of the tribe Arundinelleae. Kew Bull. 1936: 317–321. Hubbard, C.E. 1937. Loudetia Hochst. ex Steud. In: Prain, D. (ed.). Gramineae. Flora of
Tropical Africa. 10: 1–52. L. Reeve & Co. Ltd., Ashford, Kent. Hubbard, C.E. 1949. Notes on African grasses, 23. Kew Bull. 1949: 352–358. Hubbard, C.E. 1957. Notes on African grasses: 28. Kew Bull. 1957: 61–64.
96
Huelsenbeck, J. P., J. J. Bull & C. W. Cunningham. 1996. Combining data in phylogenetic analysis. Trends Ecol. Evol. 11: 152–158.
Hull, D.L. 1984. Cladistic theory: hypotheses that blur and grow. In: Duncan, T & Stuessy, T.F. (eds.). Cladistics: perspectives on the reconstruction of evolutionary history. New York, Columbia University Press, 1–23.
Humphries, C.J. & V.A. Funk. 1984. Cladistic methodology. In: Heywood, V.H. & Moore, D.M. (eds.). “Current concepts in plant taxonomy, Systematics Special Volume No. 25, Academic Press, London & Orlando, pp. 323–361.
Jansen, R.J. 2003. The conundrum of morphometrics. Taxon 52: 663–671. Johansen, D.A. 1940. Plant microtechnique. McGraw-Hill Book Co., Inc. New York &
London. Johnson, S.D. 1996. Pollination, adaptation and speciation models in the Cape flora of
South Africa. Taxon 45: 59 – 66. Karis, P.O. 2004. Taxonomy, phylogeny and biogeography of Limonium Sect.
Pteroclados (Plumbaginaceae), based on morphological data. Bot. J. Linn. Soc. 144: 461–482.
Kellog, E.A. 1989. Comments on genomic genera in the Triticeae (Poaceae). Amer. Journ. Bot. 76(6): 796–805.
Kellog, E.A. & L. Watson. 1993. Phylogenetic studies of a large data set. I. Bambusoideae, and Pooideae (Gramineae). Bot. Rev. 59: 273–343.
Kjer, K.M., R.J. Blahnik & R.W. Holzenthal. 2001. Phylogeny of Trichoptera (claddisflies): characterization of signal and noise within multiple datasets. Syst. Biol. 50(6): 781–816.
Kluge, A.G. 1998. Total evidence or taxonomic congruence: Cladistics or consensus classification. Cladistics 14: 151–158.
Lawrence, P.A. 2004. Last hideout of the uknown? Nature 429: 247. Levasseur, C. & F.-J. Lapointe. 2001. War and peace in phylogenetics: a rejoinder on
total evidence and consensus. Syst. Biol. 50(6): 881–891. Li, Y.-H., R.A. Lubke & J.B. Phipps. 1966. Studies in Arundinelleae (Gramineae) IV.
Chromosome numbers of 23 species. Can. J. Botany 44: 387–393. Li, Y.-H. & J.B. Phipps. 1973. Studies in Arundinelleae (Gramineae). XV. Taximetrics of
leaf anatomy. Can. J. Botany 51(3): 657–680. Linder, H.P. 1988. A review of cladistics for botanists. S. Afri. J. Bot. 54(3): 208–220. Liu, M., B.-E. van Wyk & P.M Tinley. 2003. The taxonomic value of fruit structure in
the subfamily Saniculoideae and related African genera (Apiaceae). Taxon 52: 261–270.
Lubke, R.A. & J.B. Phipps. 1973. Taximetrics of Loudetia (Gramineae) based on leaf anatomy. Can. J. Botany 51: 2127–2146.
Lundberg, J.G. 1993. African–South American freshwater fish clades and continental drift: problems with a paradigm, pp. 156–199. In: Goldblatt, P. (ed.). Biological relationships between Africa and South America. Yale Univ. Press, New Haven.
Maddison, W., & M. McMahon. 2000. Divergence and reticulation among mountain populations of a jumping spider (Habronattus pugillis Griswold). Syst. Biol. 49(3): 400–421.
97
Maisey, J.G. 1993. Tectonics, the Santana Langerstätten, and the implication for late Gondwana biogeography, pp. 435–454. In: Goldblatt, P. (ed.). Biological relationships between Africa and South America. Yale Univ. Press, New Haven.
Mathews, S. & R.A. Sharrock. 1999. The phytochrome gene family in grasses (Poaceae): a phylogeny and evidence that grasses have a subset of loci found in dicot Angiosperms. Mol. Biol. Evol. 13(8): 1141–1150.
Meacham, C.A. 1984. The role of hypothesizing direction in the estimation of evolutionary history. Taxon 33(1): 26–38.
Meadows, M.E. & P.H. Linder. 1993. A palaeoecological perspective on the origin of Afromontane grasslands. J. Biogeogr. 20: 345–355.
Metcalfe, C.R. 1960. Anatomy of the Monocotyledons. 1. Gramineae. Clarendon Press, Oxford.
Mickevich, M.F. & J. Weller. 1990. Evolutionary character analysis: tracing character change on a cladogram. Cladistics 6: 137–170.
Mishler, B.D. 2000. Deep phylogenetic relationships among “plants” and their implications for classification. Taxon 49: 661–683.
Miyamoto, M.M. & W.M. Fitch. 1995. Testing species phylogenies and phylogenetic methods with congruence. Syst. Biol. 44(1): 64–76.
Miyamoto, M. 1996. A congruence study of the molecular and morphological data for eutherian mammals. Mol. Phylogenet. Evol. 6: 373–390.
Mlot, C. 1995. A high glacier opens a view of the ice age tropics. Science 269: 32. Mooi, R. 1989. The outgroup criterion revisited via naked zones and alleles. Syst. Biol.
38: 283–290. Murphy, R.W. & K.D. Doyle. 1998. Phylogenetics: frequencies and polymorphic
characters in genealogical estimation. Syst. Biol. 47(4): 737–761. Nixon, K.C., W.L. Crepet, D. Stevenson & E.M. Friis. 1994. A reevaluation of seed plant
phylogeny. Annals of Missouri Botanic Garden 81: 484–533. Nixon, K.C. 2002. Winclada version 1.00.08. 2210 Ellis Hollow Road, Ithaca, New York. Normark, B.B. & A.A. Lanteri. 1998. Incongruence between morphology and
mitochondrial-DNA characters suggests hybrid origins of pathogenic weevil lineages (genus Aramigus). Syst. Biol. 47: 475–494.
Patterson, C., D.M. Williams & C.J. Humphries. 1993. Congruence between molecular and morphological phylogenies. Annu. Rev. Ecol. Syst. 24: 153–188.
Pažoutová, S. 2001. The phylogeny and evolution of the genus Claviceps. Mycol. Res. 105(3): 275–283.
Phipps, J.B. 1964. Studies in the Arundinelleae (Gramineae), I. Classification of the taxa occurring in Bechuanaland, the Rhodesias and Nyasaland, and Mozambique. Kirkia 4: 87–104.
Phipps, J.B. 1966. Studies in the Arundinelleae (Gramineae). III. Checklist and key to genera. Kirkia 5(2): 235–258.
Phipps, J.B. 1967. Studies in the Arundinelleae (Gramineae). VIII. The phylogeny, a hypothesis. Blumea 15: 477–517.
Phipps, J.B. 1970. Studies in the Arundinelleae (Gramineae). X. Preliminary taximetrics. Can. J. Botany 48: 2333–2356.
Phipps, J.B. & J.B. Mahon. 1970. Studies in the Arundinelleae (Gramineae). IX. Chromosome numbers of 21 species. Can. J. Botany 48(7): 1419–1423.

98
Phipps, J.B. 1972a. Studies in the Arundinelleae (Gramineae). XI. Taximetrics of changing classifications. Can. J. Botany 50: 787–802.
Phipps, J.B. 1972b. Studies in the Arundinelleae (Gramineae). XII. Relationships of Arundinella, Jansenella, Trichopteryx, and the danthoniopsoids. Can. J. Botany 50: 825–837.
Phipps, J.B. (1972c). Studies in the Arundinelleae (Gramineae). XIII. Taximetrics of the loudetioid, tristachyoid, and danthoniopsoid groups. Can. J. Botany 50: 937–948.
Phipps, J.B. 1972d. Studies in the Arundinelleae (Gramineae). XIV. Taximetrics of a reduced character set. Can. J. Botany 50: 1309–1336.
Phipps, J.B. 1972e. Studies in the Arundinelleae (Gramineae). XVI. Danthoniopsis – the middle way. Boletin da Sociedade Broteriana 46: 417–427.Pimentel, R.A. & R. Riggins. 1987. The nature of cladistic data. Cladistics 3(3): 201–209.
Pires, J.C., M.F. Fay, W.S. Davis, L. Hufford, J. Rova, M.W. Chase & K.J Sytsma. 2001. Molecular and morphological phylogenetic analyses of Themidaceae (Asparagales). Kew Bull. 56(3): 601–626.
Pitman, W.C., S. Cande, J. Labrecques & J. Pindell. 1993. Fragmentation of Gondwana: the separation of Africa from America, pp. 15–34. In: Goldblatt, P. (ed.). Biological relationships between Africa and South America. Yale Univ. Press, New Haven.
Poe, S. 1996. Data set incongruence and the phylogeny of crocodilians. Syst. Biol. 45(4): 393–414.
Pridgeton, A.M. & M.W. Chase. 1995. Subterranean axes in tribe Diurideae (Orchidaceae): morphology, anatomy, and systematic significant. American Journ. Bot. 82: 1473–1495.
Rae, T.C. 1998. The logical basis for the use of continuous characters in phylogenetic systematics. Cladistics 14: 221–228.
Raven, P.H. & D.I. Axelrod. 1974. Angiosperm biogeography and past continental movements. Annals of Missouri Botanic Garden 61(3): 539–673.
Renvoize, S.A. 1980. The subfamily Arundinoideae and its position in relation to a general classification of the Gramineae. Kew Bull. 36(1): 85–102.
Sanderson, M.J. & M.J. Donoghue. 1989. Patterns of variation in levels of homoplasy. Evolution 43(8): 1781–1795.Schilling, E.E. & J.L. Panero. 1996. Phylogenetic reticulation in subtribe Helianthinae. Am. J. Bot. 83(7): 937–948.
Schatz, G.E. & A. Le Thomas. 1993. Annonaceae: a primitive family with an ancient center in Africa–South America, pp. 86–104. In: Goldblatt, P. (ed.). Biological relationships between Africa and South America. Yale Univ. Press, New Haven.
Schilling, E.E. & J.L. Panero. 1996. Phylogenetic reticulation in subtribe Helianthinae. Am. J. Bot. 83(7): 937–948.
Scotland, R.W. 1992. Cladistic theory. In: Forey, P.L., Humphries, C.J., Kitching, J.J., Scotland, R.W., Siebert, D.J. & Williams, D.M. (eds.). Cladistics. A practical course in Systematics. Clarendon Press, Oxford. Pp. 3–13.
Seitz, V., S.O. Garcia & A. Liston 2000. Alternative coding strategy and inapplicable data coding problem. Taxon 49: 47–54.
Siebert, D.J. & D.M. Williams 1998. Recycled. Cladistics 14: 339–347. Simmons, N.B. 2001. Misleading results from the use of ambiguity coding to score
polymorphisms in higher-level taxa. Syst. Biol. 50(4): 613–620.

99
Simon, C.M. 1983. A new coding procedure for morphometric data with an example from periodical Cicada wing veins. In: J. Felsenstein. 1983. Numerical taxonomy. Springer, New York.
Smith, G.F. & C.K. Willis. 1999. Index Herbariorum: southern African suppliment, 2nd ed. SABONET Report No. 8. December 1999.
Sober, E.R. 1983. Parsimony methods in systematics. In: Platnick, N. I. & Funk, V. A. (eds.). Advances in cladistics, Volume 2: Proceedings of the second meeting of the Willi Hennig Society. Columbia University Press, New York, pp. 37–47.
Soltis, D.E. & R.K. Kuzoff. 1995. Discordance between nuclear and chloroplast phylogenies in the Heuchera group (Saxifragaceae). Evolution 49(4): 727–742).
Sprangler, R.E. & R.G. Olmstead. 1999. Phylogenetic analysis of Bignoniaceae based on the cpDNA gene sequences rbcL and ndhF. Annals of Missouri Botanic Garden 86: 33–46.
Statsoft. 2001. Statistica for Windows. Statisoft, Tulsa. Stebbins, G.L. 1981. Coevolution of grasses and herbivores. Annals of Missouri Botanic
Garden 68: 75–86. Stent, S.M. 1923. South African Gramineae. A new genus and seven new species.
Bothalia 1: 170–178. Stern, W.L. & W.S. Judd. 2001. Comparative anatomy and systematics of Catasetinae
(Orchidaceae). Bot. Journ. Linn. Soc. 136: 153–178. Stern, W.L., W.S. Judd & B.S.Carlsward. 2004. Systematic and comparative anatomy of
Maxillarieae (Orchidaceae), sans Oncidiinae. Botanical Journal of the Linnean Society 144: 251–254.
Stevens, P.F. 1991. Character states, morphological, variation and phylogenetic analysis: a review. Syst. Bot. 16: 553–583.
Stuessy, T.F. 1979. Cladistics of Melampodium (Compositae). Taxon 28: 179–195. Stuessy, T.F. 1990. Plant taxonomy: the systematic evaluation of comparative data.
Columbia University Press, New York. Swenson, U. & U. Manns. 2003. Phylogeny of Pericauliis (Asteraceae): a total evidence
approach reappraising the double origin of woodiness. Taxon 52: 533–546. Swiderski, D.L., M.L. Zelditch & W.L. Fink. 1998. Why morphometric is not special:
coding quantitative data for phylogenetic analysis. Syst. Biol. 47: 508–519. Thiele, K. 1993. The holy grail of the perfect character: the cladistic treatment of
morphometric data. Cladistics 9: 275–304. Thomas, J.C. & W.J. Bond. 1997. Genetic variation in an endangered cedar
(Widdringtonia cedarbergensis) versus two congeneric species. S. Afri. Journ. Bot. 63(3): 133–140.
Thorpe, R.S. 1984. Coding morphometric characters for constructing distance Wagner networks. Evolution 38(2): 244–255.
van der Walt, J.J.A., H.J.T. Venter, R. Verhoeven & L.L. Dreyer. 1990. The transfer of Erodium incarnatum to the genus Pelargonium (Geraniaceae). S. Afr. Journ. Bot. 56(5): 560–564.
Vargas, P. 2001. Phylogenetic and evolutionary insights into the Saxifraga pentadactylis complex (Saxifragaceae): variation in nrITS sequences. Nordic J. Bot. 21(1): 75–82.
100
Vázquez, F.M. & M.E. Barkworth. 2004. Resurrection and emendation of Macrochloa (Gramineae: Stipae). Botanical Journal of the Linnean Society 94: 483–495.
Vilgalys, R. 1986. Phenetic and cladistic relationships in Collybia Sect. Levipedes (Fungi: Basidiomycetes). Taxon 35(2): 225–233.
Vuilleumier, F. & A.V. Andors. 1993. Avian biological relationships between Africa and South America, pp. 289–328. In: Goldblatt, P. (ed.). Biological relationships between Africa and South America. Yale Univ. Press, New Haven.
Wagner, P.J. 2000. The quality of the fossil record and the accuracy of phylogenetic inferences about sampling and diversity. Syst. Biol. 49(1): 65–86.
Watson, L. & M.S. Dallwitz. 1994. The grass genera of the world. Revised edition, CAB International, pp. 567–568.
Webb, S.D. 1995. Biological implications of the middle Miocene Amazon Seaway. Science 269: 361–362.
Wiens, J.J. & D.B. Hollingsworth. 2000. War of the iguanas: conflicting molecular and morphological phylogenies and long-branch attraction in iguanid lizards. Syst. Biol. 49(1): 143–159.
Wiens, J.J. 2001. Character analysis in morphological phylogenetics: problems and solutions. Syst. Biol. 50(5): 689–699.
Wilkin, P. 1999. A morphometric study of Dioscorea quartiniana A. Rich. (Dioscoreaceae). Kew Bull. 54: 1–18.
Wilkinson, M. 1995. Coping with abundant missing entries in phylogenetic inferences using parsimony. Syst. Biol. 44: 501–514.
Williams, D.M. 2002. Precision and parsimony. Taxon 51: 143–149. Wilson, C.A. 1998. A cladistic analysis of Iris series Californicae based on
morphological data. Syst. Bot. 23(1): 73–88. Yoder, A.D., J.A. Irwin & B.A. Payseur. 2001. Failure of the IDL to determine data
combinability for slow Loris phylogeny. Syst. Biol. 50(3): 408–424. Zelditch, M.L., W.L. Fink & D.L. Swiderski. 1995. Morphometrics, homology, and
phylogenetics: quantified characters as synapomorphies. Syst. Biol. 44(2): 179–189.
Zhang, W. 2000. Phylogeny of the grass family (Poaceae) from rp116 intron sequence data. Molecular Phylogenetics and Evolution 15(1): 135–146.

101
Appendix 3.1. List of specimens studied. Anat = Leaf sample for anatomical study, Coll. = Collector, Coll. No. = Collector number, Herb = Herbarium where the voucher specimen is lodged, * indicates that the specimen was consulted for morphological (morph column) or anatomical (anat column) studies.
Part used Species Coll. Coll. No. Herb Morph Anat Andropogon apendicularis Johnson s.n. J * * A. apendicularis Maguire 8173 J * * A. apendicularis Maguire 8594 J * * A. apendicularis Maguire 8639 J * * A. apendicularis Rogers 24175 J * * A. gayanus Balkwill 7973a J * * A. schirensis Hologne 876 J * * A. schirensis Hologne 463 J * * A. schirensis Maguire 8173 J * * A. schirensis Stalmans 2639 J * * Loudetia angolensis Berghen 3166 BELG * * L. angolensis Croat 29625 PRE * * L. angolensis Drummond 6872 PRE * * L. angolensis Green 2 PRE * * L. angolensis Greenway 7192 PRE * * L. angolensis Mwambi 81 PRE * * L. angolensis Simon 1980 PRE * L. angolensis Rose Innes 31100 PRE * L. angolensis Santo 2187 PRE * * L. angolensis Travão 103 PRE * * L. annua Fay 7385 PRE * * L. annua Leeuwenberg 10439 UPS * * L. annua Santo 3528 SRGH * * L. arundinacea De Nevers 3267 MO * * L. arundinacea Phipps 3007a PRE * * L. arundinacea Gosweiler 11879 PRE * L. arundinacea Greenway 10087 SRGH * L. arundinacea Greenway 143077 PRE * * L. arundinacea Phipps 3008 PRE * L. camerunensis Adam 20351 PRE * L. camerunensis Bogdan 1415 PRE * L. camerunensis Bouxin 1643 PRE * L. camerunensis Burtt 1441 PRE * L. camerunensis Chapman 7355 SRGH * L. camerunensis Chase 3636 SRGH * L. camerunensis Crook 651 SRGH * * L. camerunensis Davidse 6614 PRE * L. camerunensis du Toit 2359 PRE * L. camerunensis Glover 2325 PRE *
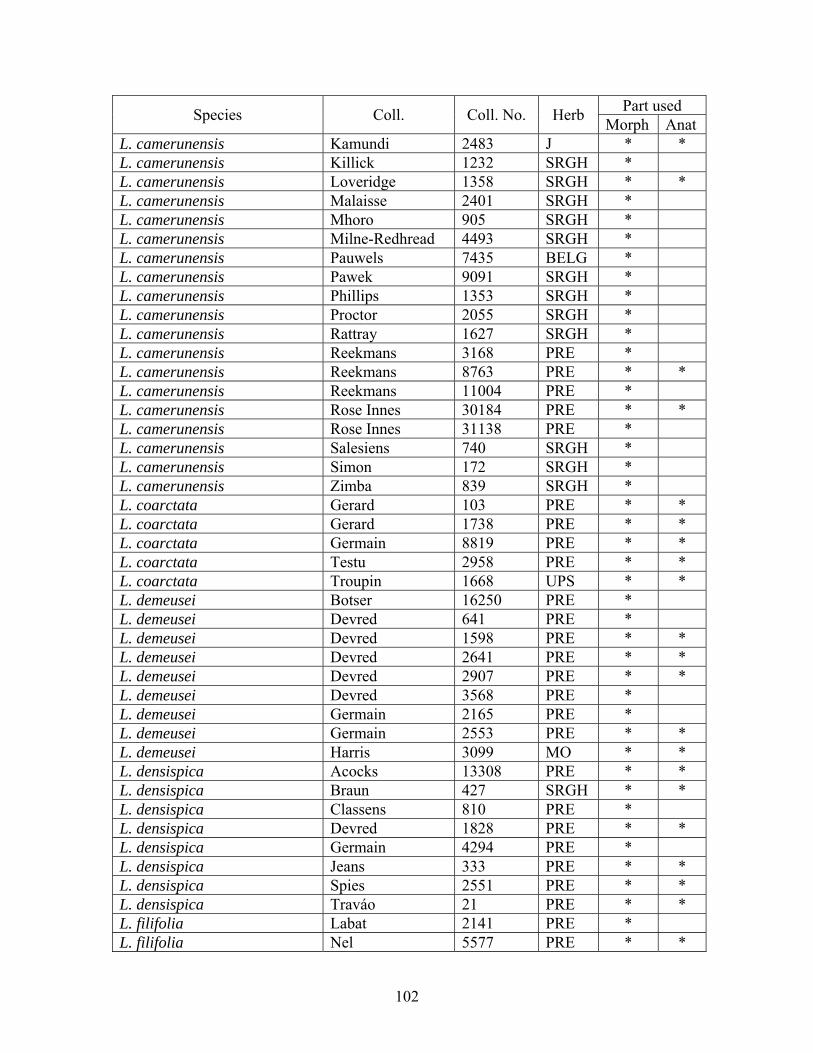
102
Part used Species Coll. Coll. No. Herb Morph Anat L. camerunensis Kamundi 2483 J * * L. camerunensis Killick 1232 SRGH * L. camerunensis Loveridge 1358 SRGH * * L. camerunensis Malaisse 2401 SRGH * L. camerunensis Mhoro 905 SRGH * L. camerunensis Milne-Redhread 4493 SRGH * L. camerunensis Pauwels 7435 BELG * L. camerunensis Pawek 9091 SRGH * L. camerunensis Phillips 1353 SRGH * L. camerunensis Proctor 2055 SRGH * L. camerunensis Rattray 1627 SRGH * L. camerunensis Reekmans 3168 PRE * L. camerunensis Reekmans 8763 PRE * * L. camerunensis Reekmans 11004 PRE * L. camerunensis Rose Innes 30184 PRE * * L. camerunensis Rose Innes 31138 PRE * L. camerunensis Salesiens 740 SRGH * L. camerunensis Simon 172 SRGH * L. camerunensis Zimba 839 SRGH * L. coarctata Gerard 103 PRE * * L. coarctata Gerard 1738 PRE * * L. coarctata Germain 8819 PRE * * L. coarctata Testu 2958 PRE * * L. coarctata Troupin 1668 UPS * * L. demeusei Botser 16250 PRE * L. demeusei Devred 641 PRE * L. demeusei Devred 1598 PRE * * L. demeusei Devred 2641 PRE * * L. demeusei Devred 2907 PRE * * L. demeusei Devred 3568 PRE * L. demeusei Germain 2165 PRE * L. demeusei Germain 2553 PRE * * L. demeusei Harris 3099 MO * * L. densispica Acocks 13308 PRE * * L. densispica Braun 427 SRGH * * L. densispica Classens 810 PRE * L. densispica Devred 1828 PRE * * L. densispica Germain 4294 PRE * L. densispica Jeans 333 PRE * * L. densispica Spies 2551 PRE * * L. densispica Traváo 21 PRE * * L. filifolia Labat 2141 PRE * L. filifolia Nel 5577 PRE * *

103
Part used Species Coll. Coll. No. Herb Morph Anat L. filifolia Schweickerdt 1878 PRE * L. filifolia Smook 7411 PRE * * L. flammida Sendulsky 41 UWO * * L. flavida du Toit 2765 PRE * L. flavida Gilbert 234 UPS * * L. flavida Harder 3936 PRE * * L. flavida Jansen 7899 PRE * L. flavida Leippert 5080 PRE * L. flavida Philcox 8583 SRGH * L. flavida Pole-Evans 517 PRE * L. flavida Rose Innes 30236 PRE * L. flavida Rose Innes 31011 PRE * * L. flavida Smook 1149 PRE * * L. flavida Stohr 781 PRE * * L. flavida Vasey-Fitzgerard 1711 SRGH * L. hordeiformis Adam 15177 PRE * * L. hordeiformis Adam 15877 PRE * L. hordeiformis Ankrah 20476 PRE * L. hordeiformis Rose Innes 30620 PRE * * L. hordeiformis Rose Innes 30987 PRE * * L. hordeiformis Santo 3498 PRE * * L. hordeiformis Testu 1630 PRE * * L. hordeiformis Ward 53 BR * * L. kagerensis Adam 17417 PRE * * L. kagerensis Bouxin 2240 PRE * L. kagerensis Greenway 13347 PRE * L. kagerensis Greenway 9991 PRE * * L. kagerensis Gwynne 1536 PRE * L. kagerensis Kayombo 124 PRE * * L. kagerensis Michelmore 1303 PRE * L. kagerensis Mullenders 2121 PRE * L. kagerensis Reekmans 6323 PRE * * L. kagerensis Robyns 1704 PRE * * L. kagerensis Rose Innes 31123 PRE * L. kagerensis Rounce 326 SRGH * * L. lanata Brain 2899 SRGH * L. lanata Croat 29715 PRE * L. lanata Crook 655 SRGH * * L. lanata Davidse 6675A PRE * L. lanata de Winter 4649 PRE * * L. lanata du Plessis 1032 PRE * L. lanata Mullin 2125 SRGH * * L. lanata Pocock 208 PRE * *

104
Part used Species Coll. Coll. No. Herb Morph Anat L. lanata Robinson 173 PRE * * L. lanata Rose Innes 30313 PRE * * L. lanata Schweickerdt 489 PRE * L. pennata Vasey-Fitzgerard 2456 SRGH * * L. pennata Vasey-Fitzgerard 5009 SRGH * * L. pennata Webster A310 SRGH * * L. phragmitoides Chapman 8590 PRE * * L. phragmitoides Evrard 86 PRE * L. phragmitoides Granville 321 PRE * L. phragmitoides Greenway 7192 BR * * L. phragmitoides Harley 1744 PRE * * L. phragmitoides Lieben 1677 PRE * * L. phragmitoides Lynes 255 BR * * L. phragmitoides Rose Innes 31135 PRE * * L. simplex Adam 11 PRE * L. simplex Astle 5617 PRE * * L. simplex Biegel 1145 SRGH * L. simplex Burrows 2179 J * L. simplex Burrows 7330 J * * L. simplex Cleghorn 1854 SRGH * L. simplex du Toit 1099 PRE * * L. simplex Fisher 1523 PRE * L. simplex Fisher 1528 PRE * * L. simplex Gereau 3011 PRE * * L. simplex Greenway 5080 SRGH * L. simplex Harris 2218 PRE * L. simplex Jackson 2 PRE * L. simplex Kamundi 2484 J * * L. simplex Livingstone 14 PRE * * L. simplex Querré 109 SRGH * L. simplex Reekmans 9702 PRE * L. simplex Reekmans 10369 PRE * L. simplex Schlieben 280 PRE * * L. simplex Simon 648 SRGH * L. simplex Turner 127 PRE * L. simplex Vasey-Fitzgerard 3168 SRGH * L. tisserantii Gerard 53 BR * * L. tisserantii Gerard 64 SRGH * * L. tisserantii Gerard 3955 BR * * L. tisserantii Gerard 4533 BR * L. tisserantii Lacomte 22 SRGH * * L. tisserantii Tisserant s.n. PRE * * L. togoensis Adam 12316 UWO * *

105
Part used Species Coll. Coll. No. Herb Morph Anat L. togoensis Adam 18879 UWO * * L. togoensis Ankrah 20267 PRE * * L. togoensis Ankrah 20477 PRE * * L. togoensis Berghen 8145 BR * * L. togoensis Jackson 1.12973 PRE * * L. togoensis Rose Innes 30650 PRE * L. togoensis Rose Innes 31029 PRE * L. togoensis Santo 3393 PRE * L. vanderystii Carlier 100 SRGH * L. vanderystii Descoings 1855 PRE * * L. vanderystii Devred 1863 PRE * L. vanderystii Dujardin 49 PRE * * L. vanderystii Germain 2518 PRE * * L. vanderystii Kami 193 BR * * L. vanderystii Leonard 5798 PRE * Arundinella nepalensis Lubke 1498 J * * A. nepalensis Moss 11134 J * * Danthoniopsis acutigluma Stohr 527 PRE * * D. chimanimaniensis Plowes 2799 PRE * * D. chimanimaniensis Simon 278 PRE * * D. dinteri Codd 3914 PRE * * D. dinteri de Winter 2890 PRE * * D. dinteri Dinter 7562 PRE * * D. dinteri Vock s.n. PRE * * D. parva Hardy 6809 PRE * * D. parva Krynauw 1444 PRE * * D. parva Smook 7416 PRE * * D. pruinosa Strey 3714 PRE * * D. ramosa Geiss S245/CB PRE * * D. viridis Eylesii 2969 PRE * * D. viridis Robinson 4993 PRE * D. viridis Wild 7545 PRE * * Gilgiochloa indurata Burtt 2023 PRE * * Gilgiochloa indurata Greenway 11478 PRE * * Loudetiopsis ambiens Amshoft 1938 PRE * * L. ambiens Daziel 885 PRE * * L. ambiens Rose Innes 30603 PRE * * L. ambiens Rose Innes 30604 PRE * * L. ambiens Rose Innes 30616 PRE * * L. ambiens Rose Innes 30902 PRE * * L. ambiens Rose Innes 31136 PRE * * L. chrysothrix Davidse 10984 PRE * * L. chrysothrix Tuley 1521 K * *

106
Part used Species Coll. Coll. No. Herb Morph Anat L. capillipes Adam 12457 K * * L. glabrata FHI 34223 K * * L. glabrenodis Rose Innes 30685 PRE * * L. kerstingii Adam 6617 PRE * * L. kerstingii Rose Innes 30084 PRE * * L. kerstingii Rose Innes 30478 J * * L. scaettae Adam 15171 PRE * * L. scaettae Rose Innes 30133 PRE * * L. scaettae Rose Innes 30206 PRE * * L. scaettae Rose Innes 30622 PRE * * L. scaettae Rose Innes 30780 PRE * * L. trigemina Adam 13976 PRE * * L. trigemina Adam 13982 PRE * L. trigemina Tuley 2029 K * * Trichopteryx marungensis Greenway 5408 PRE * * T. marungensis Hendrickx 4050 PRE * * T. marungensis Wild 4612 PRE * * T. marungensis Williamson 1004 PRE * * Tristachya bequaertii Davidse 7258 PRE * * T. bequaertii Davie 2974 J * * T. bequaertii de Menezes 2363 PRE * * T. bequaertii Estes 139 PRE * * T. bequaertii Jackson 1130 PRE * * T. bequaertii Simons 2013 PRE * * T. bequaertii Stohr 369 PRE * * T. chrysothrix Davidse 10984 PRE * * T. leucothrix Ellery 265 PRE * * T. leucothrix Reddy 1884 J * * T. leucothrix Reid 35 J * * T. leucothrix Stalmans 2013 J * * T. pedicellata Adam 14954 J * * T. pedicellata de Winter 2207 PRE * * T. pedicellata du Toit 612 PRE * * T. pedicellata Ellis 3503 PRE * * T. pedicellata Galpin 9174 PRE * * T. pedicellata Pole-Evans 1B PRE * * T. pedicellata Pole-Evans 260 PRE * T. pedicellata Retief 145 PRE * * T. pedicellata Stent 21562 PRE * T. superba Correira 3563 PRE * * T. superba de Winter 4402 PRE * * T. superba Maguire 2513 PRE * * T. superba Symons 7519 UPS * *

107
Appendix 3.2. Theories of cladistic methods. Loudetia species have been classified into a perceived sequence of descent (Hubbard, 1936), but it was not until 1967 that the first explicitly phylogenetic hypothesis was published (Phipps, 1967). The phylogenetic analysis was based on phenetic affinities and intuitive method then commonly utilized to assign terminal taxa to clades. It excluded 10 species of those currently belonging to Loudetia and included 15 others, which are now not regarded as members of Loudetia.
Modern approach uses cladistic methods to classify organisms based on common ancestry (Stuessy 1990). Willi Hennig pioneered cladistic method in 1950, and it has gained in popularity after being translated into English and has currently found wide application in systematics (Scotland, 1992). In addition to elucidating genealogical relationships, the modern phylogenetic approach has the advantage (over deductive methods) of empirically testing the circumscription of taxa assigned to a particular rank. Thus, it was envisaged with this thesis that a revised phylogenetic analysis involving all of the currently known taxa in Loudetia and Loudetiopsis would reveal a new hypothesis of species relationships and test the validity of the circumscription of the genera.
Cladistic methods Cladistic approaches equate changes in character states with cladogenic evolution and incorporate them into nodes of a phyletic tree (Vilgalys, 1986). Thus, evolutionary relationships are inferred by analyzing character state distributions using homologous shared derived characters called synapomorphies (Siebert & William, 1998; Farris, 2000). Homology can be defined as “similarity due to continuity of information” and it can be determined by character state similarity, congruence and conjunction (coincidence) (Collazo, 2000). Homology forms the basis upon which hypotheses of relationships are formulated.
Synapomorphic character states define a monophyletic group comprising all the descendants of an ancestor. The concept of monophyletic groups is central in understanding evolutionary relationships (Humphries & Funk, 1984). It requires making assumptions that characters are derived from an ancestor, and the different character states the descendants possess are independently modified during the course of evolution (Hull, 1984; Kluge, 1998). Taxa possessing a suite of synapomorphic characters produce a congruent distribution pattern of character states when these are polarized and optimized on a tree. Character state congruence gives observable evidence of evolutionary relatedness, thus enabling inferences about sister relationships to be made. Synapomorphic characters, therefore, provide phylogenetic signals (Farris, 2000). On the other hand, symplesiomorphic (the sharing of ancestral) character states do not convey any phylogenetic signal. Groups sharing plesiomorphic characters can be described as paraphyletic (Farris, 2000).

108
Not all character states are in accordance with the evolutionary trend (Sober, 1983; Williams, 2002). Discordant character state distribution on a tree may be attributed to homoplasy. Homoplasious character states are assumed not to have been derived from a common ancestor and may therefore be non-homologous, but see below. They may arise in distinct lines of organisms by convergence towards a common form or function due to environmental factors (Davis & Heywood, 1963). Alternatively, character states may arise independently, exhibiting parallelism in different organisms, and appearing at different branches on a phylogenetic tree (Brady, 1983). Furthermore, reversal may occur when character transformation from one state to another occurs in a line of taxa and reverts back to the original state in one or more taxa. Phylogenetic diversification may occur rapidly in a small geographical area, producing few novel characters with high retention of ancestral polymorphism through several speciation events (Maddison & McMahon, 2000). Such speciation events may give rise to unique features or monotypic taxa (Maddison & McMahon, 2000). In addition, hybridization and introgression can yield character polymorphism, which may also exhibit discordant character state distribution on a phylogenetic tree. Thus, inconsistent distribution of attributes may occur even when there is no character state convergence, reversal or parallelism. Groups defined by convergent character states are polyphyletic. Both paraphyletic and polyphyletic groups do not convey phylogenetic signals and these must be rejected (Humphries & Funk, 1984). When character states are optimized on a phylogenetic tree, homoplasious character state changes require more than one step to fit into the evolutionary tree, whereas non-homologous characters coded into binary states appear once (Brady, 1983). Homoplasious characters therefore may increase ad hoc propositions of hypotheses of evolutionary sequences (Kluge, 1998). However, a reversal might be a synapomorphy. The effects of character state changes appearing more than once on cladistic trees might include increasing tree lengths, lowering consistency and retention indices as well as internal branch supports and producing trees that are not fully resolved (Sanderson & Donoghue, 1989). The shortest tree can be found by parsimony analysis, which assumes that the minimum numbers of character state transformations have occurred (Farris, 1983; Sober, 1983; Wiens & Hollingsworth, 2000). However, the precision of parsimony depends on the heterogeneity of taxa sampled and the sensitivity of the method of character state optimization (Sober, 1983; Sprangler & Olmstead, 1999; Wagner, 2000; Wiens & Hollingsworth, 2000; Williams, 2002).
Parsimony methods presuppose that the sharing of derived characteristics is evidence for common ancestry (Sober, 1983; Humphries & Funk, 1984). A discordant character state distribution, therefore, falsifies the hypothesis of genealogies. Whereas proponents argue that inferring genealogies rests in parsimony, some workers doubt that synapormorphies may be evidence of kinship due to the possibility of mutation occurring independently in two taxa, producing similar character states (Farris, 1983; Sober, 1983). This independent origin of similar character states is termed parallelism and may pose serious problems when few characters are used in the analysis. Furthermore, parsimony presupposes simplicity of nature, which may not be universally applicable (Hull, 1984). However,
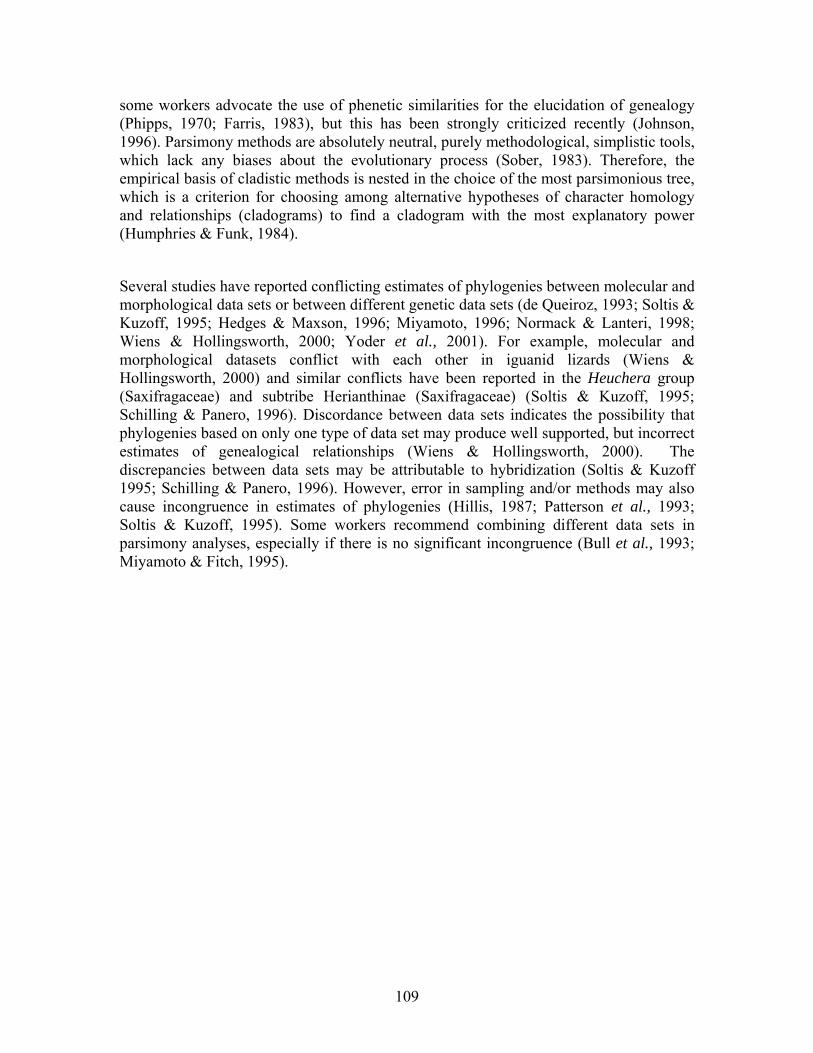
109
some workers advocate the use of phenetic similarities for the elucidation of genealogy (Phipps, 1970; Farris, 1983), but this has been strongly criticized recently (Johnson, 1996). Parsimony methods are absolutely neutral, purely methodological, simplistic tools, which lack any biases about the evolutionary process (Sober, 1983). Therefore, the empirical basis of cladistic methods is nested in the choice of the most parsimonious tree, which is a criterion for choosing among alternative hypotheses of character homology and relationships (cladograms) to find a cladogram with the most explanatory power (Humphries & Funk, 1984).
Several studies have reported conflicting estimates of phylogenies between molecular and morphological data sets or between different genetic data sets (de Queiroz, 1993; Soltis & Kuzoff, 1995; Hedges & Maxson, 1996; Miyamoto, 1996; Normack & Lanteri, 1998; Wiens & Hollingsworth, 2000; Yoder et al., 2001). For example, molecular and morphological datasets conflict with each other in iguanid lizards (Wiens & Hollingsworth, 2000) and similar conflicts have been reported in the Heuchera group (Saxifragaceae) and subtribe Herianthinae (Saxifragaceae) (Soltis & Kuzoff, 1995; Schilling & Panero, 1996). Discordance between data sets indicates the possibility that phylogenies based on only one type of data set may produce well supported, but incorrect estimates of genealogical relationships (Wiens & Hollingsworth, 2000). The discrepancies between data sets may be attributable to hybridization (Soltis & Kuzoff 1995; Schilling & Panero, 1996). However, error in sampling and/or methods may also cause incongruence in estimates of phylogenies (Hillis, 1987; Patterson et al., 1993; Soltis & Kuzoff, 1995). Some workers recommend combining different data sets in parsimony analyses, especially if there is no significant incongruence (Bull et al., 1993; Miyamoto & Fitch, 1995).