Embed Size (px)
Citation preview

114
CHAPTER 4
BEHAVIOUR OF REINFORCED CONCRETE
CORRODED SQUARE COLUMN SPECIMENS
4.1 GENERAL
In the pervious chapter, the effects of corrosion on circular corroded
and uncorroded columns were discussed in detail. In this chapter the
behaviour of conventional and corroded square columns with Fly Ash as
corrosion inhibitor and behaviour of column under loading conditions of
corrosion have been studied.
4.2 EXPERIMENAL PROGRAMME
The experimental programme was divided into two phases. In the
first phase, investigation was done on the effect of fly ash and bagasee ash
(added separately) as supplementary cementitious materials and the influence
of these products on the strength and resistance to chloride ion penetration of
concrete made with three different cement replacement levels (10%, 20% and
30%). By conducting various tests on the cylindrical and cubical specimens
with various proportions, the better corrosion inhibitor was chosen and its
optimum level obtained. In the second phase, using this corrosion inhibitor
and its optimum level the behaviour of square columns were studied.

115
4.2.1 Fly Ash
Fly Ash (FA) is the residue from combustion of pulverized coal
collected by the mechanical or electrostatic separators from fuel gases of
thermal power plants. Its composition varies with the type of fuel burnt, load
on boiler and type of separator etc. The carbon content in fly ash should be as
low as possible whereas the silica content should be as high as possible.
There are about 80 thermal power plants functioning in India generating
around 100 million tons of fly ash per annum. Storage and disposal of fly ash
is a problem for thermal power stations as it creates severe pollution
problems. In view of these serious considerations, lot of investigations are
being carried out for utilization of fly ash. The fly ash from Mettur power
plant was used in the present investigation.
4.2.2 Bagasse Ash
Bagasse is the residue fiber remaining when sugarcane is pressed to
extract the sugar. In India, there are about 391 sugar units generating 81.36
million tonnes of bagasse. Bagasse is also used as raw material for paper
making due to its fibrous content and about 0.3 tonnes of paper can be made
from one tonne of bagasse. When this waste is burnt under controlled
conditions, it also gives ash having amorphous silica, which has pozzolanic
properties. The bagasse from Shakthi sugars, Appakoodal, Erode was used in
this test. The Bagasse Ash (BA) was obtained by burning the bagasse at
controlled temperature of 800oC for more than one hour. These ashes were
prepared as a fine powder using a pulverizer and kept in polythene bags
before use. The physical and chemical properties of BA and FA are presented
in Tables 4.1 and 4.2.

116
Table 4.1 Properties of the Constituent Materials
Sl.No Parameter OPC used Fly Ash Bagasse
Ash Fine
Aggregate Coarse
Aggregate 1 Normal
Consistency 29 % 30% 30 % - -
2 Fineness by Sieving (%) 45 micron
80 78.60 91 -
-
3 Initial Setting Time (minutes)
38 84 67 - -
4 Final Setting Time(minutes)
300 395 350 - -
5 Specific Gravity
3.15 2.10 1.93 2.55 2.69
6 Bulk Density 1747 1590 7 Fineness
Modulus - - - 2.755 6.86
8 Water Absorption
- - - 1.0% 0.52%
Table 4.2 Chemical Composition of Cement and Ashes
Material SiO2 Al2O3 Fe2O2 CaO MgO SO3
OPC 21.4 5.3 3.2 61.6 0.8 2.2 Fly Ash 59.62 26.43 6.61 1.20 0.76 0.58 Bagasse
Ash 64.50 6.93 5.69 5.2 1.69 -
4.2.3 Mix Proportions and Casting
A mix M30 grade was designed as per IS 10262-1981 and the
same was used to prepare the test samples. The cement replacement level was

117
varied from 10%, 20% and 30% labelled six series as FA1, FA2, FA3 and
BA1,BA2,BA3. All the materials were taken by weight as per the mix
proportions and hand mixing were adopted for making concrete.
4.2.4 Details of Specimen
The experimental program involves casting and testing of 117
concrete specimens with and without FA and BA. The different specimens
considered in this study include 54 numbers of 150 150 150 mm cubes for
7, 28 and 56 days cube compressive strength, 21 numbers of 150 mm
diameter and 300mm height cylinders for 28 days split Tensile strength,
modulus of elasticity value and 21 numbers of (100 100 500 mm size)
prisms for 28 days flexural strength. All the test specimens were cast in steel
moulds on a table vibrator and allowed to set for 24 hours. Then the
specimens were removed from the moulds and kept in the curing pond. The
strength characteristics were examined as per IS 516-1959. Three specimens
were tested for the required age and the average values were taken. Chloride
permeability of the concrete mixes were evaluated as per ASTM C1202
(100 mm dia, 50 mm thick cylindrical sample) at the age of 28 days.
Figure 4.1 shows the one batch of specimens after 28 days curing.
Figure 4.1 Batch of Specimens after 28 Days Curing

118
The bond strength of concrete was estimated from pull out test.
The pull out test was carried out on 150 mm concrete cubes with 12 mm
diameter reinforcing bar centrally embedded in the cube with a cover of
25 mm as shown in Figure 4.2. Totally 24 specimens were cast and cured.
12 of these specimens were placed in the tank filled with an electrolytic
solution, which contains 3.5 % Sodium chloride (NaCl) by weight of water,
and was changed on a weekly basis to eliminate any change in the
concentration of NaCl. Three specimens were used as control specimens and
were not placed in the concentrated NaCl solution. The direction of the
current was arranged so that the reinforcing bar served as the anode while the
bare steel bar served as the cathode. A voltage of 5V was applied to accelerate
the corrosion for a period of 30 days. After the accelerated corrosion, the pull
out test was performed on the specimens. Figure 4.3 shows the accelerated
corrosion process of the specimens.
Figure 4.2 Pull Out Test Specimen

119
Figure 4.3 Accelerated Corrosion Process of the Specimens
4.3 RESULTS AND DISCUSSION
4.3.1 Physical and Chemical Properties of Cement and Ashes
Physical properties of cement, Fly Ash and Bagasse Ash are given
in Table 4.1. From the fineness value it confirms that the ashes are very fine
particles. The chemical analysis values are given in Table 4.2 for OPC, FA
and BA showed the silica content of BA is 64.50% and FA is 59.62%
against the cement value of 21.4%. These confirmed that basically FA and
BA are silica rich material which can be used as supplementary cementitious
material.
4.3.2 Workability
The mixed fresh concrete was tested for its workability parameters
and the results are given in Table 4.3. From the observed values it is evident
that the workability performance of blended cement concrete is better than
conventional concrete The spherical shaped particle of fly ash acts as
miniature ball bearings within the concrete mix and improves the
workability.
120
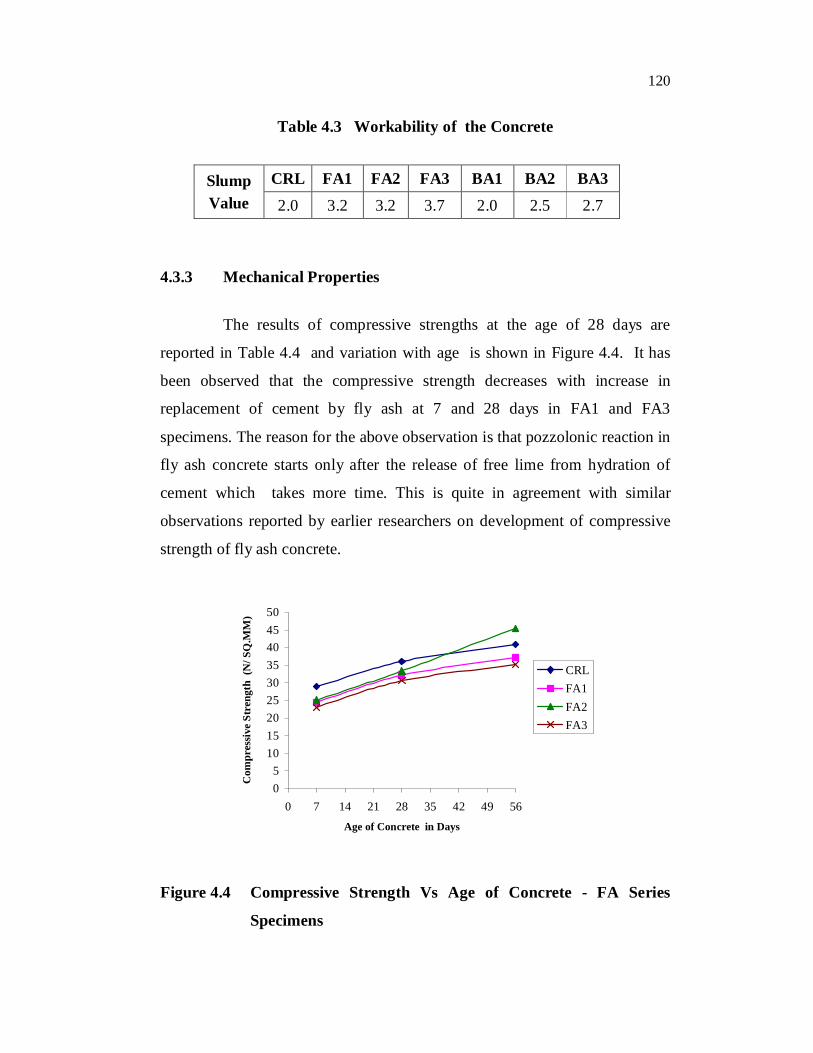
Table 4.3 Workability of the Concrete
Slump Value
CRL FA1 FA2 FA3 BA1 BA2 BA3 2.0 3.2 3.2 3.7 2.0 2.5 2.7
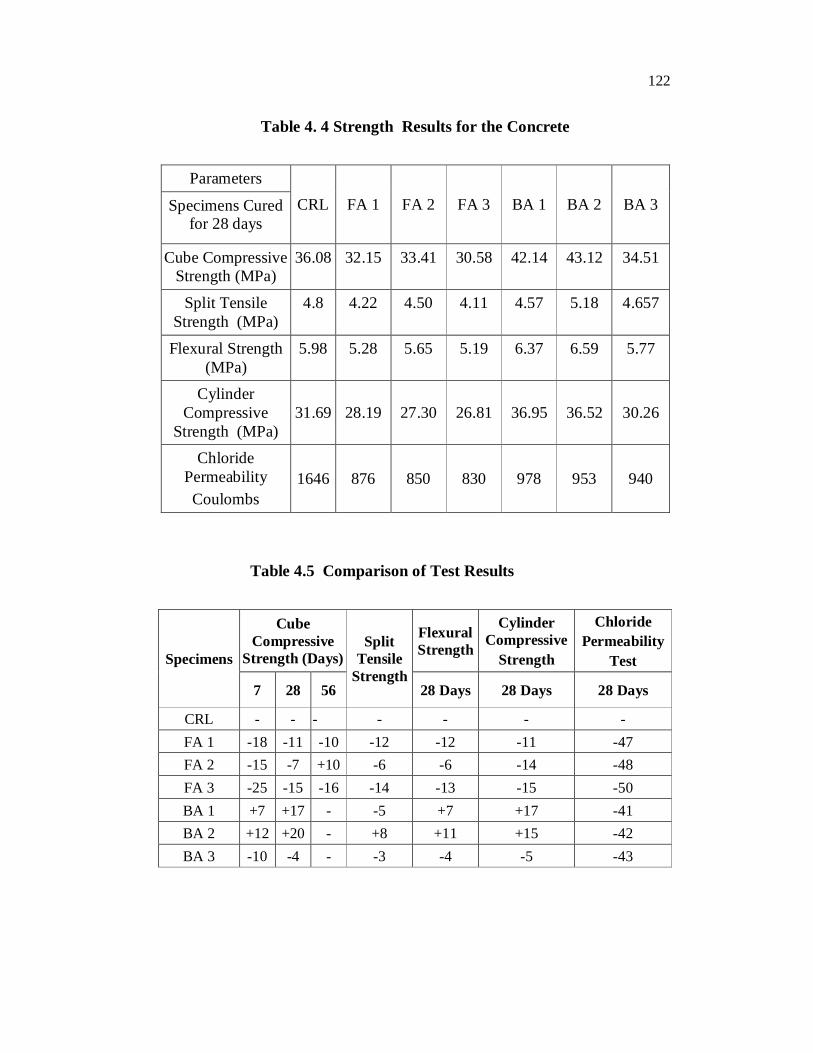
4.3.3 Mechanical Properties
The results of compressive strengths at the age of 28 days are
reported in Table 4.4 and variation with age is shown in Figure 4.4. It has
been observed that the compressive strength decreases with increase in
replacement of cement by fly ash at 7 and 28 days in FA1 and FA3
specimens. The reason for the above observation is that pozzolonic reaction in
fly ash concrete starts only after the release of free lime from hydration of
cement which takes more time. This is quite in agreement with similar
observations reported by earlier researchers on development of compressive
strength of fly ash concrete.
05
101520253035404550
0 7 14 21 28 35 42 49 56Age of Concrete in Days
Com
pres
sive
Str
engt
h (N
/ SQ
.MM
)
CRLFA1FA2FA3
Figure 4.4 Compressive Strength Vs Age of Concrete - FA Series
Specimens

121
The variation of cube compressive strength for the partial
replacement of cement by BA at different curing periods is given in
Figure 4.5. It can be seen that the compressive strength increases with
increase in replacement of cement by BA at 7 and 28 days in BA1 and BA2
specimens. From the foregoing discussion, it can be concluded that the BA
containing amorphous silica increases the compressive strength. Flexural
strength test, split tensile strength and the cylinder compressive strength
were conducted for various mixes on test specimens at the age of 28 days and
the results are given in Table 4.4. The flexural strength, and cylinder
compressive strength decreases with increase in replacement of cement by fly
ash at 28 days, whereas the strength results are increased with increase in
replacement of BA in BA1 and BA2 specimens at 28 days. Figure 4.6 shows
the experimental test set up and Figure 4.7 shows the failure mode of the
specimens. The percentage variation of strength results for different
percentage of replacement of cement by FA and BA were compared with the
conventional specimens and are presented in Table 4.5.
05
101520253035404550
CRL BA1 BA2 BA3
Specimens
Com
pres
sive
Str
engt
h (N
/SQ
.MM
)
7- Days28 Days
Figure 4.5 Compressive Strength Vs Percentage Cement Replacement -
BA Series Specimens
122
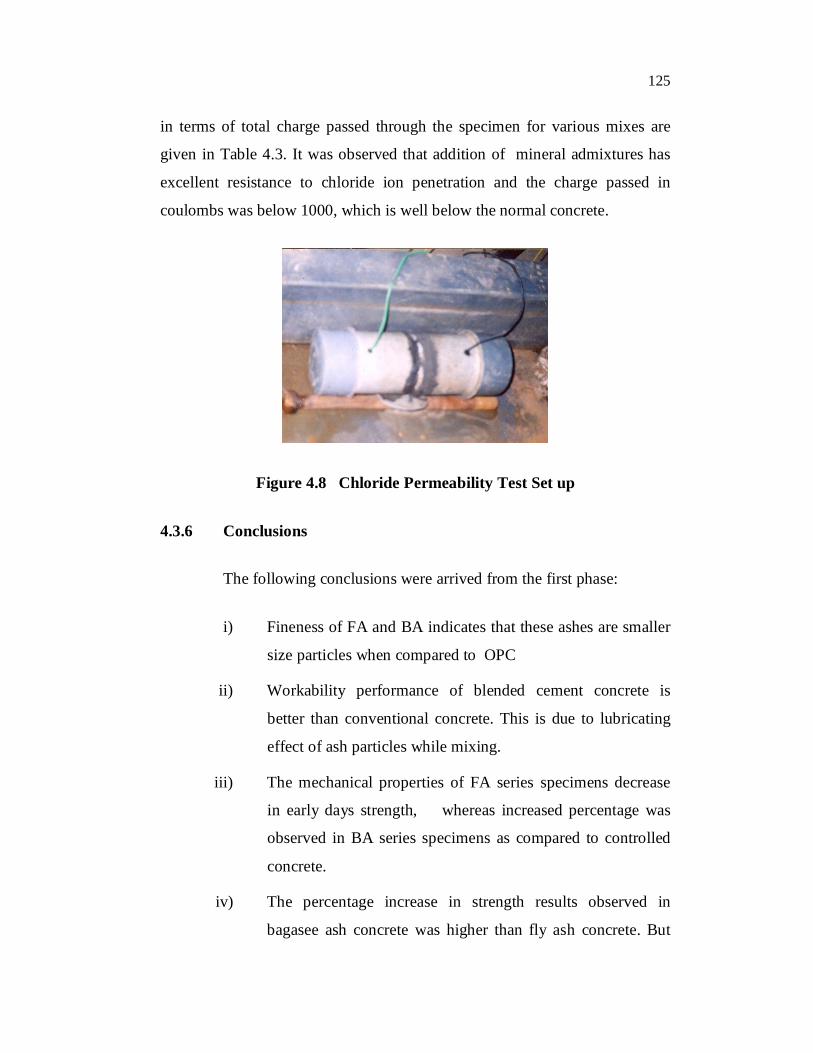
Table 4. 4 Strength Results for the Concrete
Parameters CRL FA 1 FA 2 FA 3 BA 1 BA 2 BA 3 Specimens Cured
for 28 days
Cube Compressive Strength (MPa)
36.08 32.15 33.41 30.58 42.14 43.12 34.51
Split Tensile Strength (MPa)
4.8 4.22 4.50 4.11 4.57 5.18 4.657
Flexural Strength (MPa)
5.98 5.28 5.65 5.19 6.37 6.59 5.77
Cylinder Compressive
Strength (MPa) 31.69 28.19 27.30 26.81 36.95 36.52 30.26
Chloride Permeability Coulombs
1646 876 850 830 978 953 940
Table 4.5 Comparison of Test Results
Specimens
Cube Compressive
Strength (Days) Split
Tensile Strength
Flexural Strength
Cylinder Compressive
Strength
Chloride Permeability
Test
7 28 56 28 Days 28 Days 28 Days
CRL - - - - - - - FA 1 -18 -11 -10 -12 -12 -11 -47 FA 2 -15 -7 +10 -6 -6 -14 -48 FA 3 -25 -15 -16 -14 -13 -15 -50 BA 1 +7 +17 - -5 +7 +17 -41 BA 2 +12 +20 - +8 +11 +15 -42 BA 3 -10 -4 - -3 -4 -5 -43

123
Figure 4. 6 Experimental Test Set - up - of Concrete Prisms
Figure 4.7 Failure Mode of Prisms

124
4.3.4 Pull Out Test
The bond between concrete and rebars plays a vital role to give
strength to the concrete structures. Pull out strength was determined by
measuring the maximum force required to pull the rebar from the concrete
after the accelerated corrosion process. The test was carried out in pull out
testing machine. Average of three specimen results are shown in Table 4.6.
UC and C referred as Uncorroded and Corroded specimens. FA1 to FA3
represents the cement replacement by fly ash as 10%, 20% and 30%. The
test results show that the at 20% replacement of cement by fly ash gives less
variation than the conventional and corroded specimens. The higher bond
resistance of fly ash concrete is a result of the lower corrosion rate of the
reinforcing bars.
Table 4.6 Pull Out Test Results
Sl.No Specimens Pullout test
in kN 1 UC 8.44
2 C 7.68
3 FAUC1 7.59
4 FAUC2 7.76
5 FAUC3 7.42
6 FAC1 7.21
7 FA C2 7.29
8 FA C3 7.04
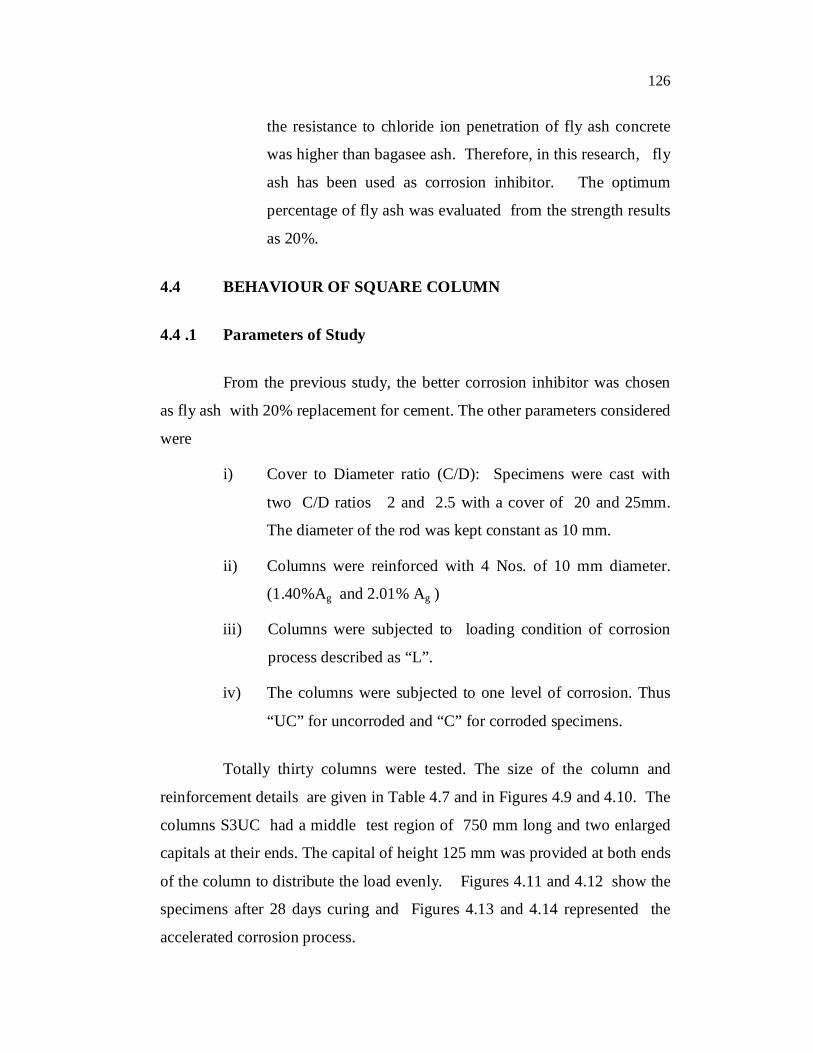
4.3.5 Rapid Chloride Permeability Test
Rapid chloride Permeability test was conducted as per ASTM C
1202 standards. It is given in Figure 4.8. The values of chloride permeability
125
in terms of total charge passed through the specimen for various mixes are
given in Table 4.3. It was observed that addition of mineral admixtures has
excellent resistance to chloride ion penetration and the charge passed in
coulombs was below 1000, which is well below the normal concrete.
Figure 4.8 Chloride Permeability Test Set up
4.3.6 Conclusions
The following conclusions were arrived from the first phase:
i) Fineness of FA and BA indicates that these ashes are smaller
size particles when compared to OPC
ii) Workability performance of blended cement concrete is
better than conventional concrete. This is due to lubricating
effect of ash particles while mixing.
iii) The mechanical properties of FA series specimens decrease
in early days strength, whereas increased percentage was
observed in BA series specimens as compared to controlled
concrete.
iv) The percentage increase in strength results observed in
bagasee ash concrete was higher than fly ash concrete. But
126
the resistance to chloride ion penetration of fly ash concrete
was higher than bagasee ash. Therefore, in this research, fly
ash has been used as corrosion inhibitor. The optimum
percentage of fly ash was evaluated from the strength results
as 20%.
4.4 BEHAVIOUR OF SQUARE COLUMN
4.4 .1 Parameters of Study
From the previous study, the better corrosion inhibitor was chosen
as fly ash with 20% replacement for cement. The other parameters considered
were
i) Cover to Diameter ratio (C/D): Specimens were cast with
two C/D ratios 2 and 2.5 with a cover of 20 and 25mm.
The diameter of the rod was kept constant as 10 mm.
ii) Columns were reinforced with 4 Nos. of 10 mm diameter.
(1.40%Ag and 2.01% Ag )
iii) Columns were subjected to loading condition of corrosion
process described as “L”.
iv) The columns were subjected to one level of corrosion. Thus
“UC” for uncorroded and “C” for corroded specimens.
Totally thirty columns were tested. The size of the column and
reinforcement details are given in Table 4.7 and in Figures 4.9 and 4.10. The
columns S3UC had a middle test region of 750 mm long and two enlarged
capitals at their ends. The capital of height 125 mm was provided at both ends
of the column to distribute the load evenly. Figures 4.11 and 4.12 show the
specimens after 28 days curing and Figures 4.13 and 4.14 represented the
accelerated corrosion process.

127
Table 4.7 Details of Test Specimen - Square Column
Specimen No of Specimen
Size of the Column
Cover in mm
Main Reinforcement
Lateral Ties
S1UC 2 150 150
500 mm Height
25
4 Nos - 10 mm diameter
6 mm dia at 150 mm c/c
S1C 2
S1FAUC 2
S1FAC 2
S2UC 2 125 125
500 mm Height
20 4 Nos - 10 mm diameter
6 mm dia at 125 mm c/c
S2C 2
S2LUC 1
S2LC 1
S3UC 2 125 125
1000 mm Height
20 4 Nos - 10 mm diameter
6 mm dia at 125 mm c/c
S3C 2
S3LUC 1
S3LC 1
S 4UC 2 150 150
2000 Height
25 4 Nos - 10 mm diameter
6 mm dia at 150 mm c/c
S4 C 2
S4FAUC 2
S4FAC 2
S5LUC 1 150 mm dia 300 mm
Height 20 4 Nos - 10 mm
diameter 6 mm dia at 73 mm c/c S5LC 1

128
Figure 4.9 Reinforcement Details - S3UC Specimen
Figure 4.10 Reinforcement Details - S4UC Specimen

129
Figure 4.11 Specimens after 28 Days Curing –S3UC
Figure 4.12 Specimens after 28 Days Curing - S2UC

130
Figure 4.13 Specimens Subjected to Accelerated Corrosion Process -
S4C
Figure 4.14 Specimens Subjected to Accelerated Corrosion Process -
S3C

131
4.4.2 Sustained Load and Corrosion Process
A load of 45 kN was applied to the specimens. The loading was
exerted by keeping two 2.5 cm thick steel plates one at the top and the other at
the bottom of the specimens and the whole assembly is tightened with
threaded rod and nuts which was controlled by a torque wrench. Figures 4.15
and 4.16 show the sustained loading of the specimens. The load decreases
as the corrosion proceeds (Creep effects) with increase in time. To maintain
the loads constant throughout the duration of the test, continuous monitoring
and adjustment of nuts were required. The steel plates, nuts and bolts were
plated with Zinc - coating to avoid the galvanostatic corrosion.
Figure 4.15 Sustained Loading of the Specimens - S5LUC

132
Figure 4.16 Sustained Loading of the Specimens - S2LUC and S3LUC
4.4.3 Instrumentation and Testing Procedure
All the specimens were loaded until failure under axial compression
in a testing frame. The specimens were externally confined by 10 mm thick
mild steel collars in the top during testing to prevent premature failure.
Longitudinal strains were manually measured using DEMEC gauge with
150mm length having a least count of 0.002mm.Pellets were glued on the
concrete surface. Pellets were fixed at mid height of the column for strain
measurements in the longitudinal direction. Strains were noted down for
every 100kN increment of load. The Test set up for the columns is shown in
Figures 4.17 to 4.19.

133
Figure 4.19 Test Set - up - of Column - S2C
Figure 4.17 Test Set - up - of
Column S4UC
Figure 4.17 Test Set - up - of
Column S3UC

134
4.5 RESULTS AND DISCUSSION
The corrosion activity of column specimens were evaluated by Non-
Destructive and destructive tests. In the Non-Destructive test the effect of
corrosion on electrochemical study (OCP measurement), Physical study
(Rebound value, UPV value), and Chemical study (Chloride content, pH
value) of all the specimens were studied. In the Destructive test the effect of
corrosion on ultimate load, axial strain, energy absorption capacity and
weight loss of steel of all the specimens were studied.
4.5.1 Estimation of Corrosion Potential by Open Circuit Potential
Measurement
Figure 4.20 shows the corrosion potential of the specimens versus
the time of accelerating steel corrosion. It can be seen that concerning the
bars in the S1C specimens the potential drops to -276 mV after 16 days of
accelerated exposure, whereas those noted in the S2C is 12 days of exposure.
The potential drops to -276 mV in S3C specimens after 15 days and S4C
is 18 days of exposure.
Exposure Time
-450
-400
-350
-300
-250
-200
-150
-100
-50
00 10 20 30
OC
P in
mV
S2CS1CS3CS4C
Figure 4.20 OCP Vs Exposure Time- S Series Specimens

135
From Figures 4.21 and 4.22 It can be observed that the bars in the
S1FC specimens the potential drops to -276 mV after 18 days of accelerated
exposure, whereas those noted in the S4FC is 22 days of exposure. The
potential drops to -276 mV in S2SC and S3SC specimens after 12 days
and S5SC is 8 days of exposure. The average potential values measured at
the end of the accelerated corrosion process in a well defined grid points are
shown in Table 4.8 and Figure 4.23. It can be seen that the column with
20mm cover shows lower potential value than the column with 25 mm cover.
-400
-350
-300
-250
-200
-150
-100
-50
00 5 10 15 20 25 30
ExposureTime
Ocp
in m
V
S1FC
S4FC
S1C
S4C
Figure 4.21 OCP Vs Exposure Time - S1 and S4 Series Specimens

136
-600
-500
-400
-300
-200
-100
00 10 20 30 40
Exposure Time
OC
P in
mV
S2CS3CS2LCS3LCS5LC
Figure 4.22 OCP Vs Exposure Time - S2 and S3 Series Specimens
Figure 4.23 Grid Points for Measurement of OCP Value
137
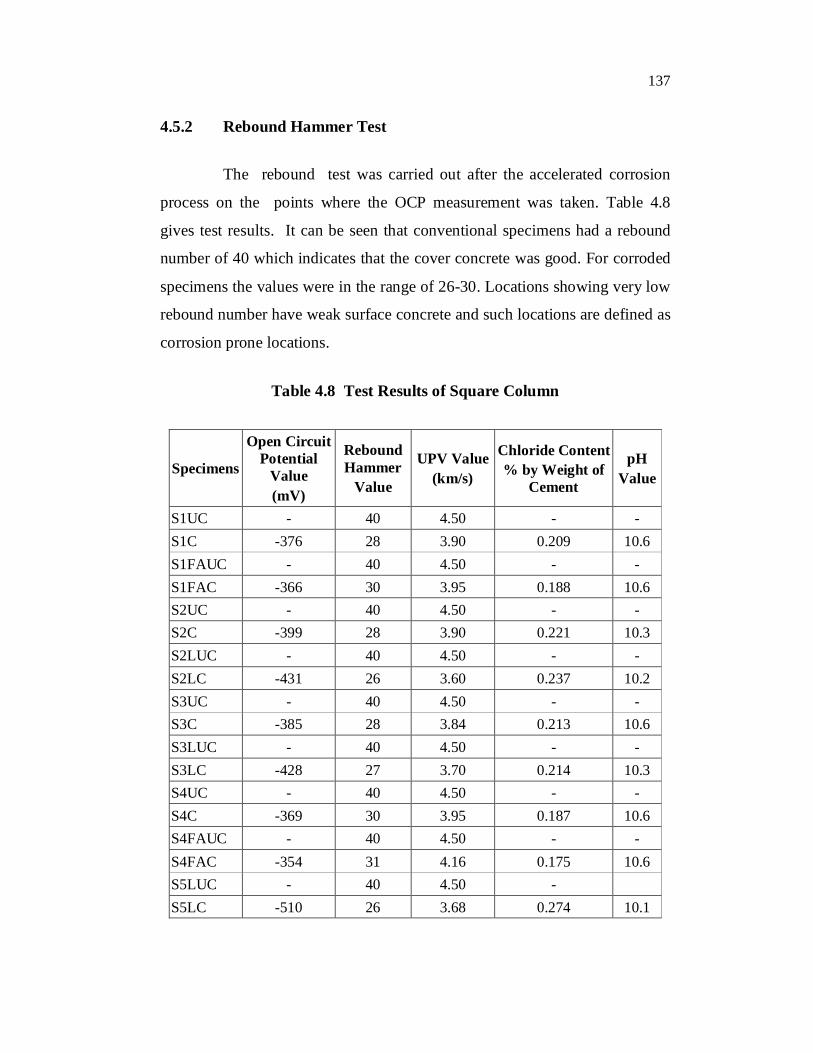
4.5.2 Rebound Hammer Test
The rebound test was carried out after the accelerated corrosion
process on the points where the OCP measurement was taken. Table 4.8
gives test results. It can be seen that conventional specimens had a rebound
number of 40 which indicates that the cover concrete was good. For corroded
specimens the values were in the range of 26-30. Locations showing very low
rebound number have weak surface concrete and such locations are defined as
corrosion prone locations.
Table 4.8 Test Results of Square Column
Specimens
Open Circuit Potential
Value (mV)
Rebound Hammer
Value
UPV Value (km/s)
Chloride Content % by Weight of
Cement
pH Value
S1UC - 40 4.50 - - S1C -376 28 3.90 0.209 10.6 S1FAUC - 40 4.50 - - S1FAC -366 30 3.95 0.188 10.6 S2UC - 40 4.50 - - S2C -399 28 3.90 0.221 10.3 S2LUC - 40 4.50 - - S2LC -431 26 3.60 0.237 10.2 S3UC - 40 4.50 - - S3C -385 28 3.84 0.213 10.6 S3LUC - 40 4.50 - - S3LC -428 27 3.70 0.214 10.3 S4UC - 40 4.50 - - S4C -369 30 3.95 0.187 10.6 S4FAUC - 40 4.50 - - S4FAC -354 31 4.16 0.175 10.6 S5LUC - 40 4.50 - S5LC -510 26 3.68 0.274 10.1
138
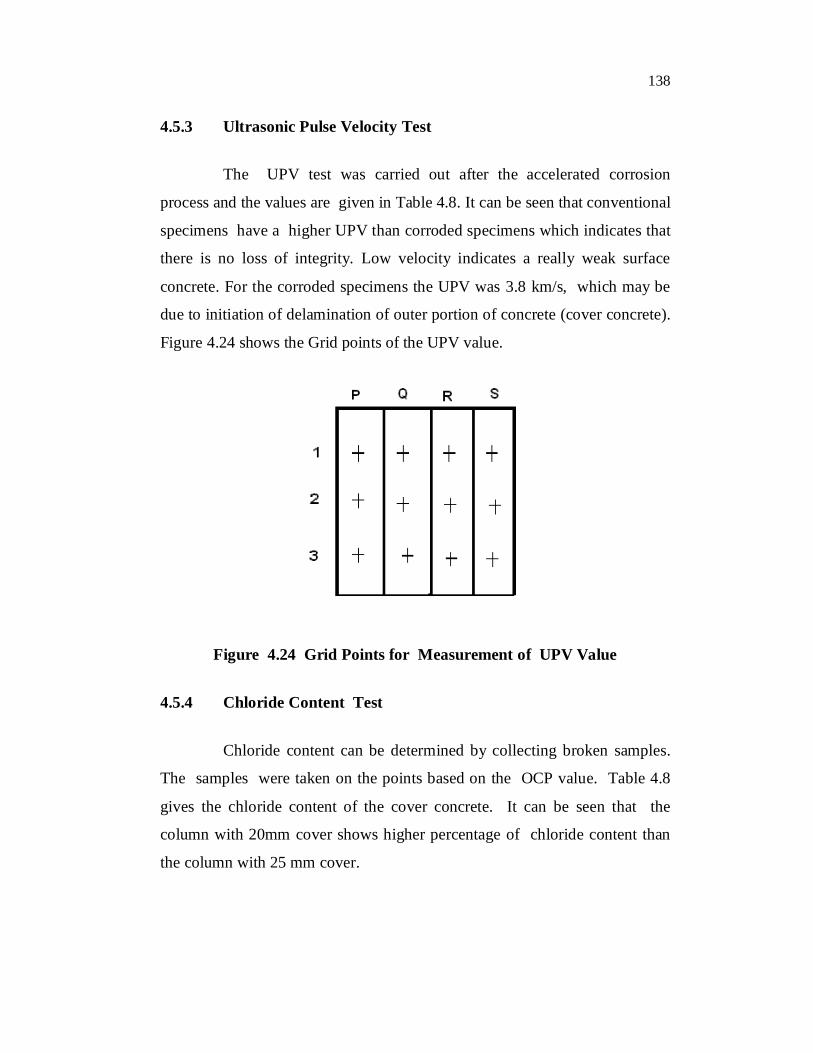
4.5.3 Ultrasonic Pulse Velocity Test
The UPV test was carried out after the accelerated corrosion
process and the values are given in Table 4.8. It can be seen that conventional
specimens have a higher UPV than corroded specimens which indicates that
there is no loss of integrity. Low velocity indicates a really weak surface
concrete. For the corroded specimens the UPV was 3.8 km/s, which may be
due to initiation of delamination of outer portion of concrete (cover concrete).
Figure 4.24 shows the Grid points of the UPV value.
Figure 4.24 Grid Points for Measurement of UPV Value
4.5.4 Chloride Content Test
Chloride content can be determined by collecting broken samples.
The samples were taken on the points based on the OCP value. Table 4.8
gives the chloride content of the cover concrete. It can be seen that the
column with 20mm cover shows higher percentage of chloride content than
the column with 25 mm cover.

139
4.5.5 pH Value Test
pH value is very important as the alkalinity of concrete maintains
the passivity of steel. Based on the Open Circuit Potential (OCP) values,
powder samples were collected from the cover concrete at the selected
locations. The pH value of the filtered solution was then measured using a
calibrated pH meter and presented in the Table 4.8.
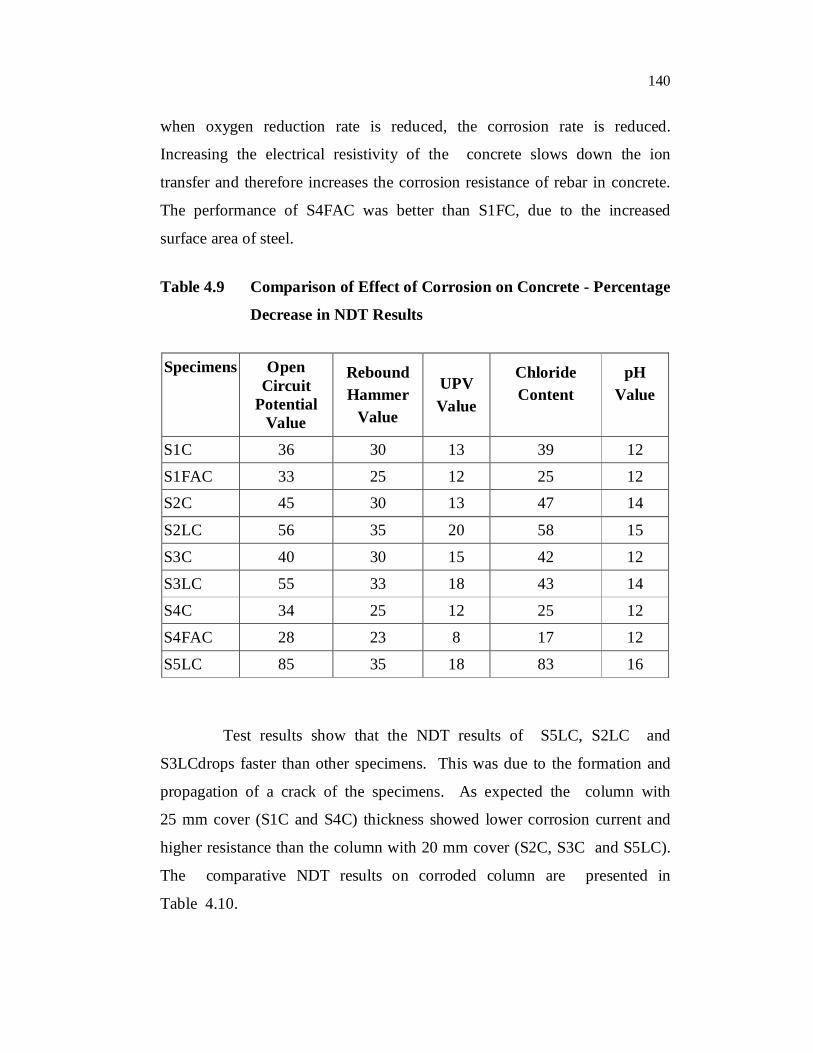
4.5.6 Discussions on the Effect of Corrosion on Non-Destructive
Test
The effect of corrosion on Non-Destructive Test (NDT) results of all
the corroded columns were compared with the respective threshold (or
conventional column) value. The percentage decrease in the value are
presented in Table 4.9.
The percentage variation depends on the corrosion rate. The
corrosion of reinforcement is initiated when the chloride content exceeds a
threshold value that depassivates the embedded steel in concrete. Once the
protective oxide layer around the reinforcement bars were broken, the
corrosion propagation depends on moisture and oxygen availability in the
neighborhood of the rebars.
The performance of S1FAC and S4FAC was better than all the
specimens. The results of this specimen show that fly ash addition to concrete
mixes improves the corrosion resistance of concrete. The fly ash cement mix
has a denser microscopic pore structure and relatively impermeable concrete.
Water normally enters concrete by capillary action: the fewer and smaller the
capillary pores are, the less water enters the concrete and the lower the rates
of oxygen diffusion and carbonation. Due to the high alkalinity in concrete
there are few H+ ions to be consumed in the cathodic reaction. Therefore,
140
when oxygen reduction rate is reduced, the corrosion rate is reduced.
Increasing the electrical resistivity of the concrete slows down the ion
transfer and therefore increases the corrosion resistance of rebar in concrete.
The performance of S4FAC was better than S1FC, due to the increased
surface area of steel.
Table 4.9 Comparison of Effect of Corrosion on Concrete - Percentage
Decrease in NDT Results
Specimens Open Circuit
Potential Value
Rebound Hammer
Value
UPV Value
Chloride Content
pH Value
S1C 36 30 13 39 12
S1FAC 33 25 12 25 12 S2C 45 30 13 47 14
S2LC 56 35 20 58 15
S3C 40 30 15 42 12
S3LC 55 33 18 43 14
S4C 34 25 12 25 12
S4FAC 28 23 8 17 12
S5LC 85 35 18 83 16
Test results show that the NDT results of S5LC, S2LC and
S3LCdrops faster than other specimens. This was due to the formation and
propagation of a crack of the specimens. As expected the column with
25 mm cover (S1C and S4C) thickness showed lower corrosion current and
higher resistance than the column with 20 mm cover (S2C, S3C and S5LC).
The comparative NDT results on corroded column are presented in
Table 4.10.
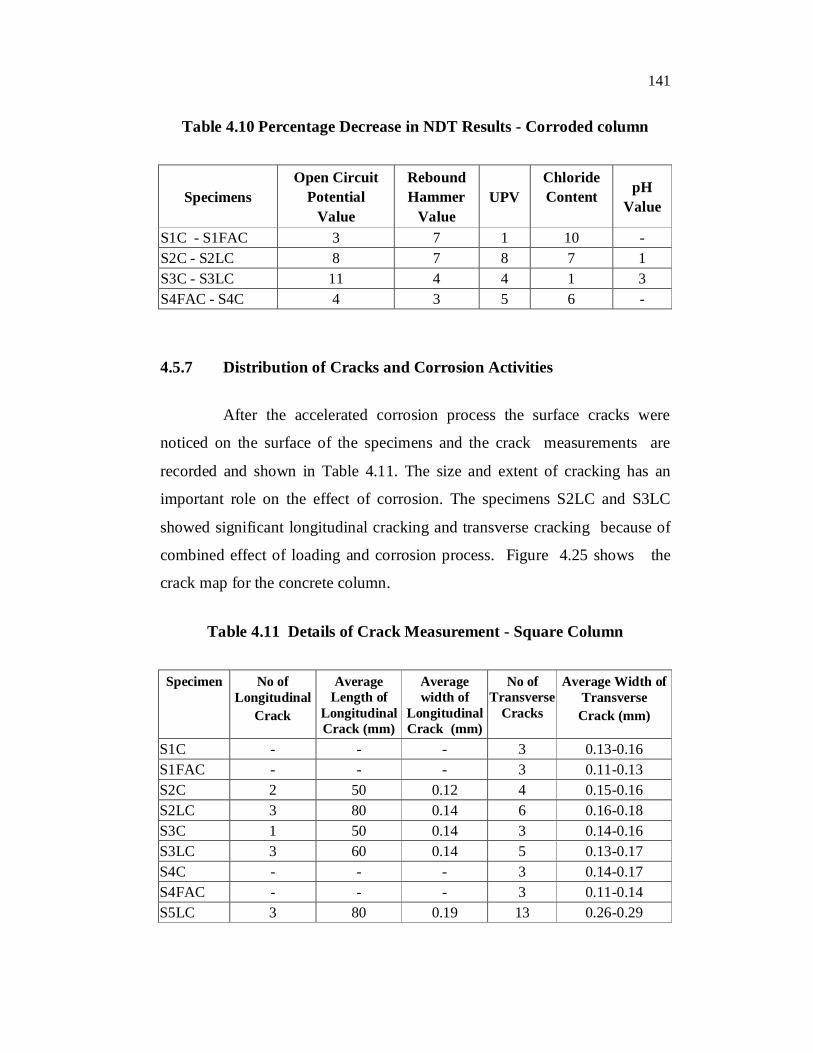
141
Table 4.10 Percentage Decrease in NDT Results - Corroded column
Specimens Open Circuit
Potential Value
Rebound Hammer
Value UPV
Chloride Content
pH Value
S1C - S1FAC 3 7 1 10 - S2C - S2LC 8 7 8 7 1 S3C - S3LC 11 4 4 1 3 S4FAC - S4C 4 3 5 6 -
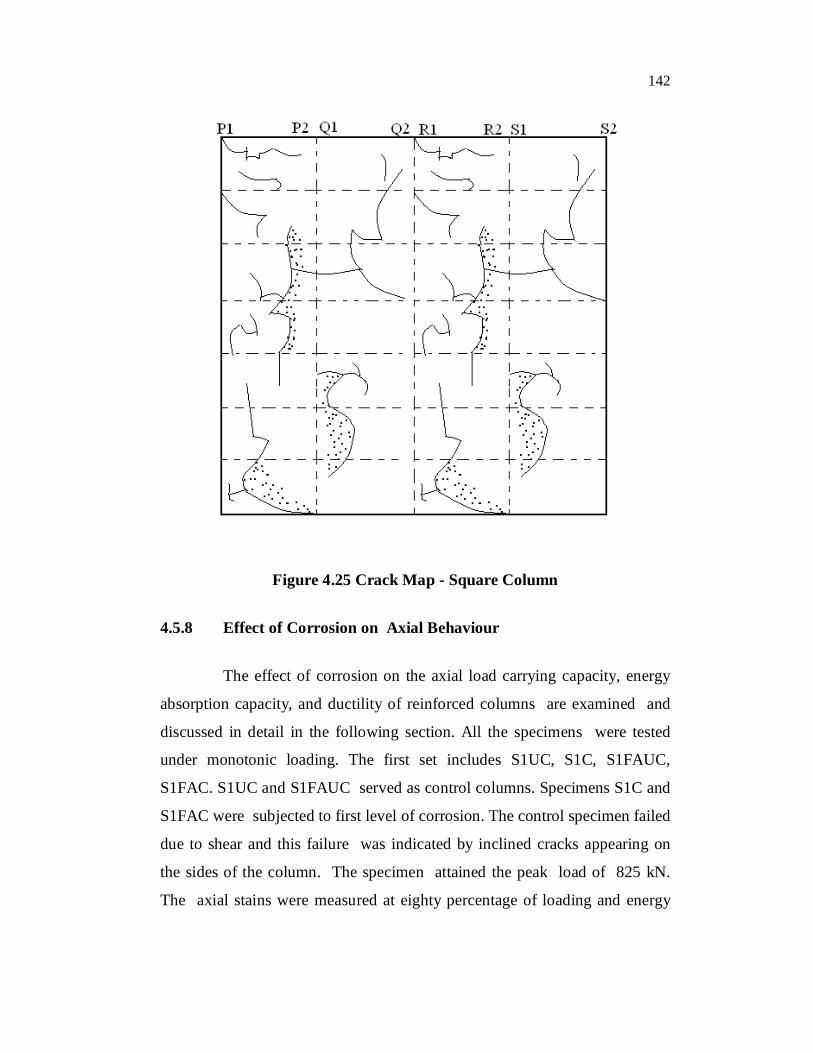
4.5.7 Distribution of Cracks and Corrosion Activities
After the accelerated corrosion process the surface cracks were
noticed on the surface of the specimens and the crack measurements are
recorded and shown in Table 4.11. The size and extent of cracking has an
important role on the effect of corrosion. The specimens S2LC and S3LC
showed significant longitudinal cracking and transverse cracking because of
combined effect of loading and corrosion process. Figure 4.25 shows the
crack map for the concrete column.
Table 4.11 Details of Crack Measurement - Square Column
Specimen No of Longitudinal
Crack
Average Length of
Longitudinal Crack (mm)
Average width of
Longitudinal Crack (mm)
No of Transverse
Cracks
Average Width of Transverse
Crack (mm)
S1C - - - 3 0.13-0.16 S1FAC - - - 3 0.11-0.13 S2C 2 50 0.12 4 0.15-0.16 S2LC 3 80 0.14 6 0.16-0.18 S3C 1 50 0.14 3 0.14-0.16 S3LC 3 60 0.14 5 0.13-0.17 S4C - - - 3 0.14-0.17 S4FAC - - - 3 0.11-0.14 S5LC 3 80 0.19 13 0.26-0.29
142
Figure 4.25 Crack Map - Square Column
4.5.8 Effect of Corrosion on Axial Behaviour
The effect of corrosion on the axial load carrying capacity, energy
absorption capacity, and ductility of reinforced columns are examined and
discussed in detail in the following section. All the specimens were tested
under monotonic loading. The first set includes S1UC, S1C, S1FAUC,
S1FAC. S1UC and S1FAUC served as control columns. Specimens S1C and
S1FAC were subjected to first level of corrosion. The control specimen failed
due to shear and this failure was indicated by inclined cracks appearing on
the sides of the column. The specimen attained the peak load of 825 kN.
The axial stains were measured at eighty percentage of loading and energy
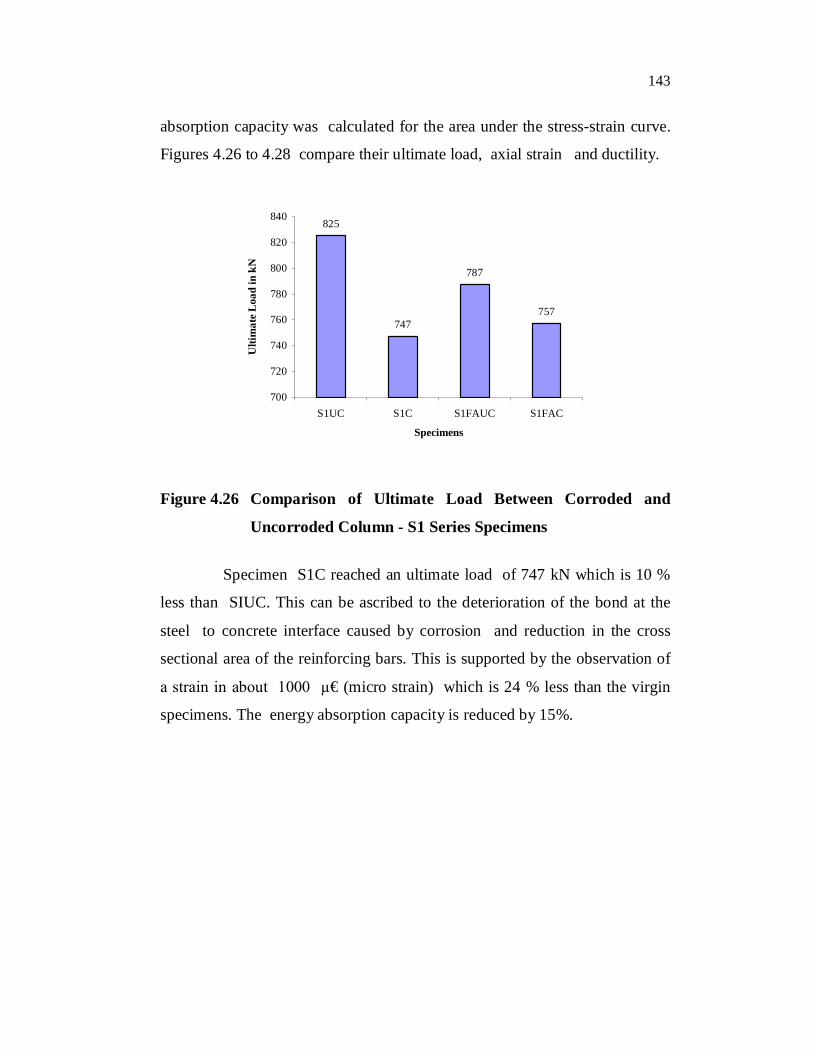
143
absorption capacity was calculated for the area under the stress-strain curve.
Figures 4.26 to 4.28 compare their ultimate load, axial strain and ductility.
825
747
787
757
700
720
740
760
780
800
820
840
S1UC S1C S1FAUC S1FAC
Specimens
Ulti
mat
e L
oad
in k
N
Figure 4.26 Comparison of Ultimate Load Between Corroded and
Uncorroded Column - S1 Series Specimens
Specimen S1C reached an ultimate load of 747 kN which is 10 %
less than SIUC. This can be ascribed to the deterioration of the bond at the
steel to concrete interface caused by corrosion and reduction in the cross
sectional area of the reinforcing bars. This is supported by the observation of
a strain in about 1000 µ€ (micro strain) which is 24 % less than the virgin
specimens. The energy absorption capacity is reduced by 15%.
144
1310
1000
1150 1130
0
200
400
600
800
1000
1200
1400
S1UC S1C S1FAUC S1FAC
Specimens
Axi
al S
trai
n (M
icro
Str
ain)
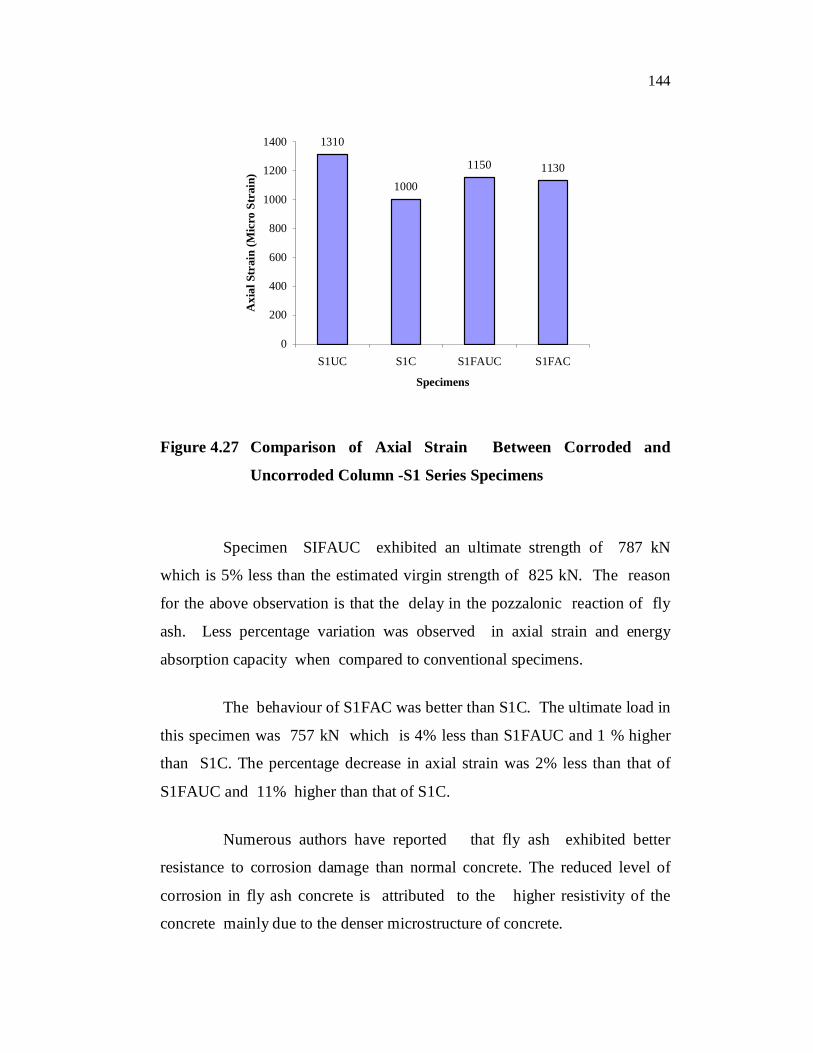
Figure 4.27 Comparison of Axial Strain Between Corroded and
Uncorroded Column -S1 Series Specimens
Specimen SIFAUC exhibited an ultimate strength of 787 kN
which is 5% less than the estimated virgin strength of 825 kN. The reason
for the above observation is that the delay in the pozzalonic reaction of fly
ash. Less percentage variation was observed in axial strain and energy
absorption capacity when compared to conventional specimens.
The behaviour of S1FAC was better than S1C. The ultimate load in
this specimen was 757 kN which is 4% less than S1FAUC and 1 % higher
than S1C. The percentage decrease in axial strain was 2% less than that of
S1FAUC and 11% higher than that of S1C.
Numerous authors have reported that fly ash exhibited better
resistance to corrosion damage than normal concrete. The reduced level of
corrosion in fly ash concrete is attributed to the higher resistivity of the
concrete mainly due to the denser microstructure of concrete.

145
0.03
0.0255
0.0267
0.0259
0.023
0.024
0.025
0.026
0.027
0.028
0.029
0.03
0.031
S1UC S1C S1FAUC S1FAC
Specimens
Ener
gy A
bsor
ptio
n ca
paci
ty
Figure 4.28 Comparison of Energy Absorption Capacity Between
Corroded and Uncorroded Column -S1 Series Specimens
The second set specimens includes S2UC, S2C, S2LUC and S2LC.
S2UC attained the maximum load of 734 kN followed in sequence by
S2LUC , S2C and S2LC. Specimen S2C reached an ultimate strength of
642 kN, which is 1.14 times less than the conventional column. The axial
strain decreases by a factor of 1.33 and energy absorption decreases by 1.36
times than the uncorroded column. Figures 4.29 to 4.31 compare their
ultimate load, axial strain and ductility.
The ultimate load observed in the specimen S2LUC was 653 kN.
which is 1.12 times less than the conventional specimen. The axial stain and
energy absorption are observed as 1.2 times less than S2UC.
146
733.5
642.12 653
481
0
100
200
300
400
500
600
700
800
S2UC S2C S2LUC S2LC
Specimens
Ulti
mat
e L
oad
in k
N
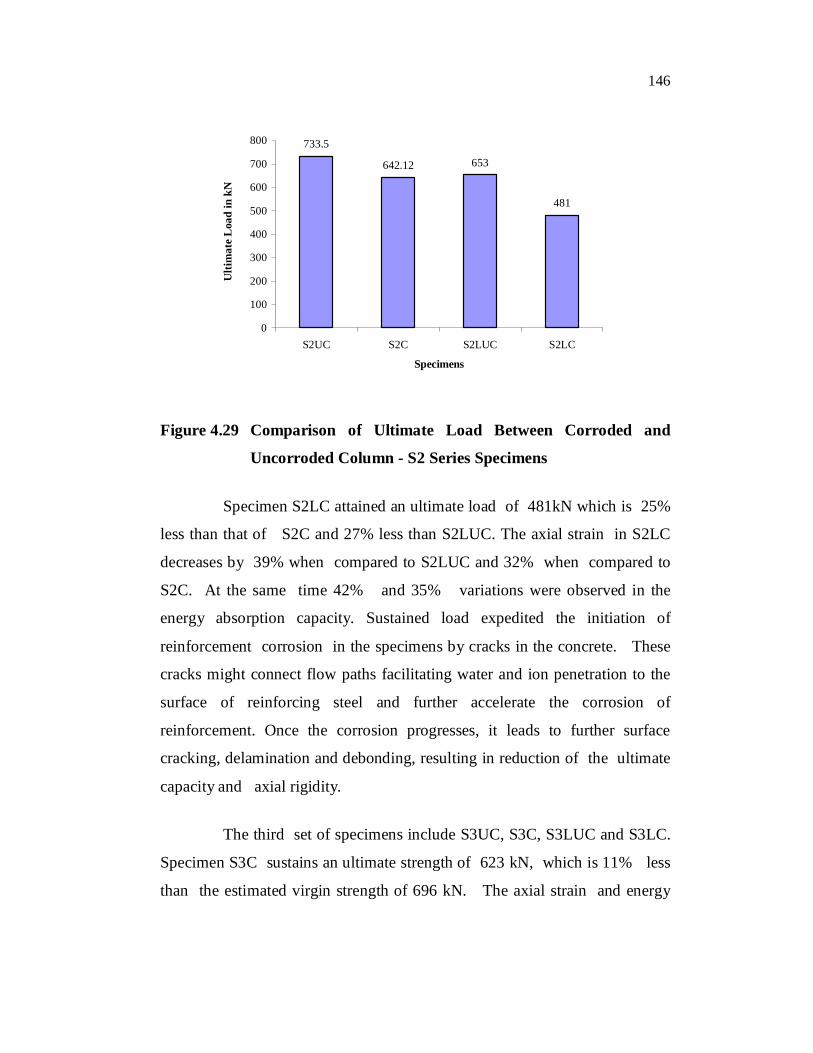
Figure 4.29 Comparison of Ultimate Load Between Corroded and
Uncorroded Column - S2 Series Specimens
Specimen S2LC attained an ultimate load of 481kN which is 25%
less than that of S2C and 27% less than S2LUC. The axial strain in S2LC
decreases by 39% when compared to S2LUC and 32% when compared to
S2C. At the same time 42% and 35% variations were observed in the
energy absorption capacity. Sustained load expedited the initiation of
reinforcement corrosion in the specimens by cracks in the concrete. These
cracks might connect flow paths facilitating water and ion penetration to the
surface of reinforcing steel and further accelerate the corrosion of
reinforcement. Once the corrosion progresses, it leads to further surface
cracking, delamination and debonding, resulting in reduction of the ultimate
capacity and axial rigidity.
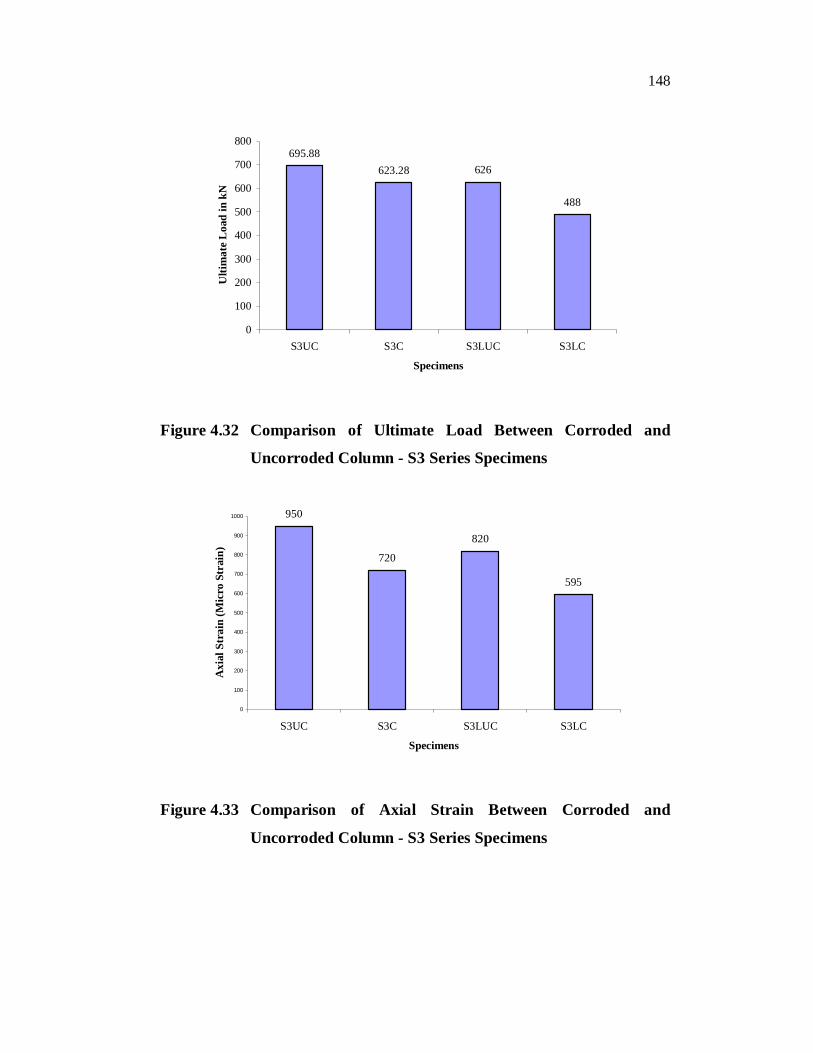
The third set of specimens include S3UC, S3C, S3LUC and S3LC.
Specimen S3C sustains an ultimate strength of 623 kN, which is 11% less
than the estimated virgin strength of 696 kN. The axial strain and energy
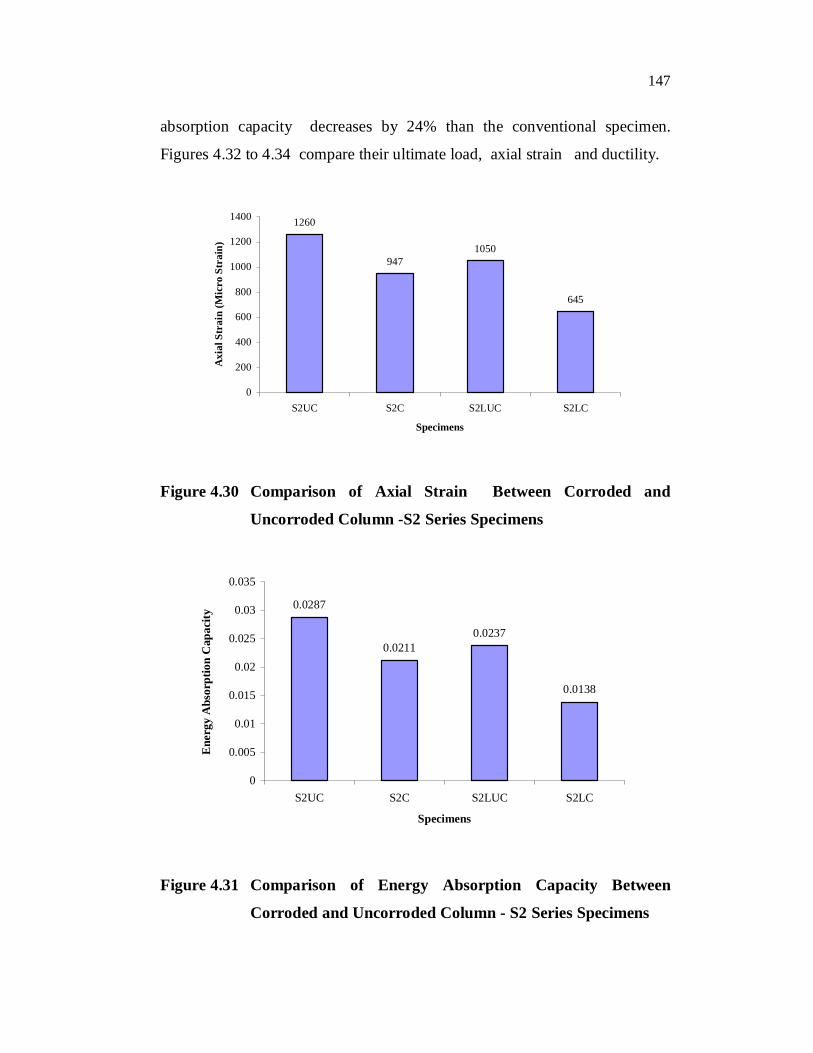
147
absorption capacity decreases by 24% than the conventional specimen.
Figures 4.32 to 4.34 compare their ultimate load, axial strain and ductility.
1260
9471050
645
0
200
400
600
800
1000
1200
1400
S2UC S2C S2LUC S2LC
Specimens
Axi
al S
trai
n (M
icro
Str
ain)
Figure 4.30 Comparison of Axial Strain Between Corroded and
Uncorroded Column -S2 Series Specimens
0.0287
0.02110.0237
0.0138
0
0.005
0.01
0.015
0.02
0.025
0.03
0.035
S2UC S2C S2LUC S2LC
Specimens
Ene
rgy
Abs
orpt
ion
Cap
acity
Figure 4.31 Comparison of Energy Absorption Capacity Between
Corroded and Uncorroded Column - S2 Series Specimens
148
695.88623.28 626
488
0
100
200
300
400
500
600
700
800
S3UC S3C S3LUC S3LC
Specimens
Ulti
mat
e L
oad
in k
N
Figure 4.32 Comparison of Ultimate Load Between Corroded and
Uncorroded Column - S3 Series Specimens
950
720
820
595
0
100
200
300
400
500
600
700
800
900
1000
S3UC S3C S3LUC S3LC
Specimens
Axi
al S
trai
n (M
icro
Str
ain)
Figure 4.33 Comparison of Axial Strain Between Corroded and
Uncorroded Column - S3 Series Specimens

149
The ultimate load taken by the specimen S3LUC was 626 kN,
which is 10% less than the conventional specimen. The axial stain and energy
absorption are observed as 14 % and 18% less than S3UC.
Specimen S3LC attained an ultimate load of 488 kN which is 22%
less than that of S3C and S3LUC. Notable percentage variation was
observed in axial strain. The value of 27% was noted when compared to
S3LUC and 17% when compared to S2C. At the same time 20 % and
14 % variations were observed in the energy absorption capacity.
0.0193
0.01480.0158
0.0127
0
0.005
0.01
0.015
0.02
0.025
S3UC S3C S3LUC S3LC
Specimens
Ene
rgy
Abs
orpt
ion
Cap
acity
Figure 4.34 Comparison of Energy Absorption Capacity Between
Corroded and Uncorroded Column - S3 Series Specimens
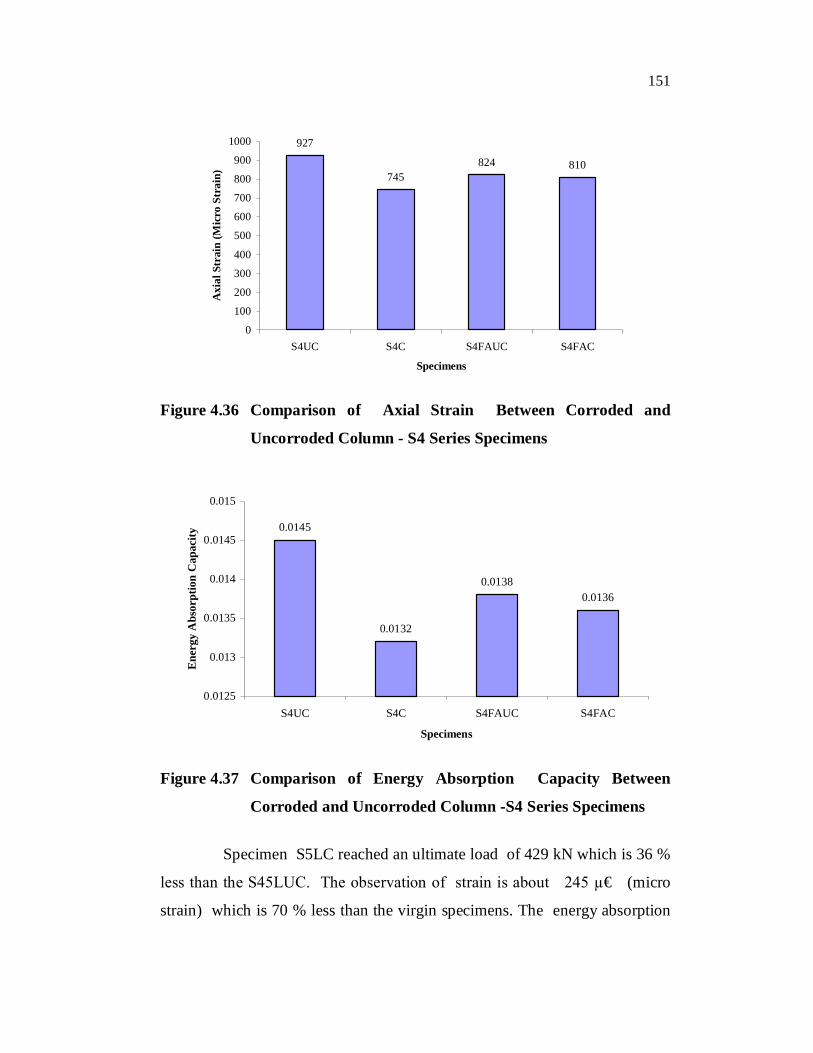
Specimen S4C reached an ultimate load of 616 kN which is 8 %
less than the S4UC. The observation of strain is about 745 µ€ (micro
strain) which is 20 % less than the virgin specimens. The energy absorption
capacity is reduced to 9% when compared to S4UC. The control column
failed due to buckling and this failure was indicated by a lump of concrete
spalling from the sides of the column at approximately mid height at the

150
ultimate load level. The specimen attained the peak load of 672 kN. The
comparisons are presented in Figures 4.35 to 4.37.
672
616
634
622
580
590
600
610
620
630
640
650
660
670
680
S4UC S4C S4FAUC S4FAC
Specimens
Ulti
mat
e L
oad
in k
N
Figure 4.35 Comparison of Ultimate Load Between Corroded and
Uncorroded Column - S4 Series Specimens
Specimen S4FAUC exhibited an ultimate strength of 634 kN
which is 6% less than the estimated virgin strength of 672 kN. The
percentage decrease in axial train and energy absorption were noted as 11%
and 5% compared to S4FAUC. The behaviour of S4FAC was better than
S4C. The ultimate load in this specimen was 622 kN which is 2% less than
S4FAUC and 1 % higher than S4C. The percentage decrease in axial strain
was 2% less than that of S4FAUC and 9% higher than that of S4C.
Likewise the percentage decrease in energy absorption capacity was 1% less
than that of S4FAUC and 3% higher than that of S4C.
151
927
745824 810
0
100
200
300
400
500
600
700
800
900
1000
S4UC S4C S4FAUC S4FAC
Specimens
Axi
al S
trai
n (M
icro
Str
ain)
Figure 4.36 Comparison of Axial Strain Between Corroded and
Uncorroded Column - S4 Series Specimens
0.0145
0.0132
0.01380.0136
0.0125
0.013
0.0135
0.014
0.0145
0.015
S4UC S4C S4FAUC S4FAC
Specimens
Ene
rgy
Abs
orpt
ion
Cap
acity
Figure 4.37 Comparison of Energy Absorption Capacity Between
Corroded and Uncorroded Column -S4 Series Specimens
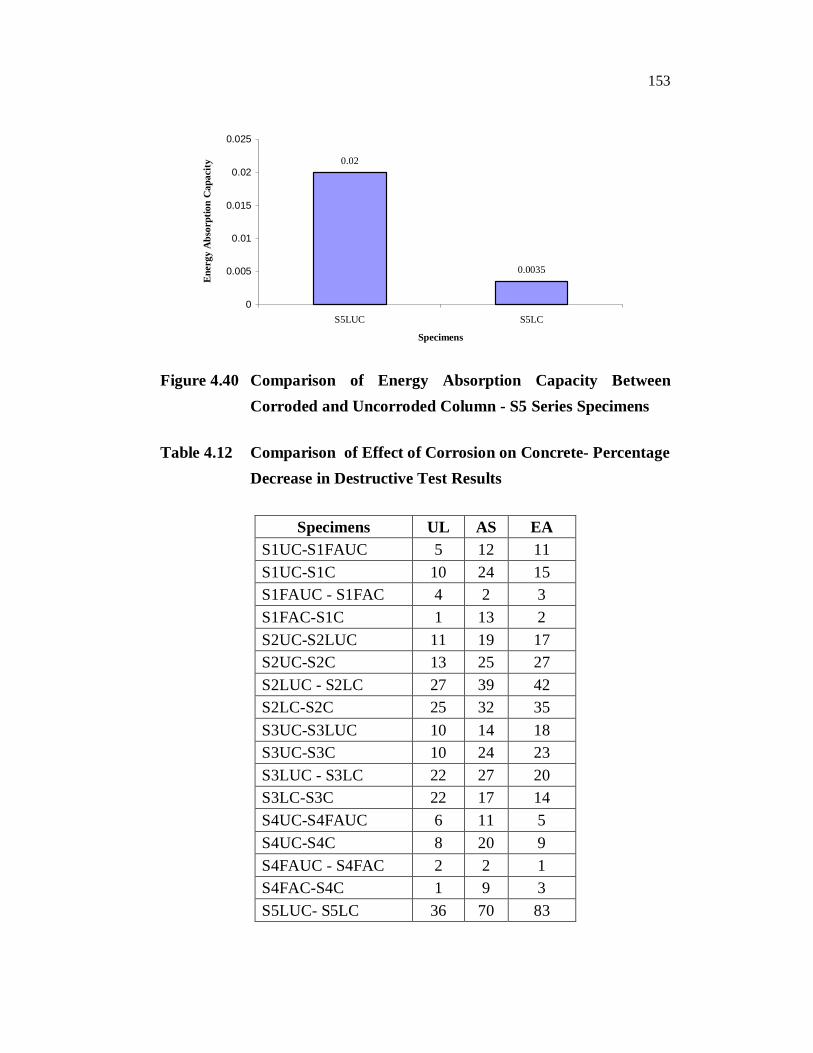
Specimen S5LC reached an ultimate load of 429 kN which is 36 %
less than the S45LUC. The observation of strain is about 245 µ€ (micro
strain) which is 70 % less than the virgin specimens. The energy absorption

152
capacity is reduced to 83% when compared to S5LUC. The comparisons
are shown in Figures 4.38 to 4.40 and in Table 4.12.
675
429
0
100
200
300
400
500
600
700
800
S5LUC S5LC
Specimens
Ulti
mat
e L
oad
in k
N
Figure 4.38 Comparison of Ultimate Load Between Corroded and
Uncorroded Column - S5 Series Specimens
815
245
0
100
200
300
400
500
600
700
800
900
S5LUC S5LC
Specimens
Axi
al S
trai
n (M
icro
Str
ain)
Figure 4.39 Comparison of Axial Strain Between Corroded and
Uncorroded Column - S5 Series Specimens
153
0.02
0.0035
0
0.005
0.01
0.015
0.02
0.025
S5LUC S5LC
Specimens
Ene
rgy
Abs
orpt
ion
Cap
acity
Figure 4.40 Comparison of Energy Absorption Capacity Between
Corroded and Uncorroded Column - S5 Series Specimens
Table 4.12 Comparison of Effect of Corrosion on Concrete- Percentage Decrease in Destructive Test Results
Specimens UL AS EA S1UC-S1FAUC 5 12 11 S1UC-S1C 10 24 15 S1FAUC - S1FAC 4 2 3 S1FAC-S1C 1 13 2 S2UC-S2LUC 11 19 17 S2UC-S2C 13 25 27 S2LUC - S2LC 27 39 42 S2LC-S2C 25 32 35 S3UC-S3LUC 10 14 18 S3UC-S3C 10 24 23 S3LUC - S3LC 22 27 20 S3LC-S3C 22 17 14 S4UC-S4FAUC 6 11 5 S4UC-S4C 8 20 9 S4FAUC - S4FAC 2 2 1 S4FAC-S4C 1 9 3 S5LUC- S5LC 36 70 83
154
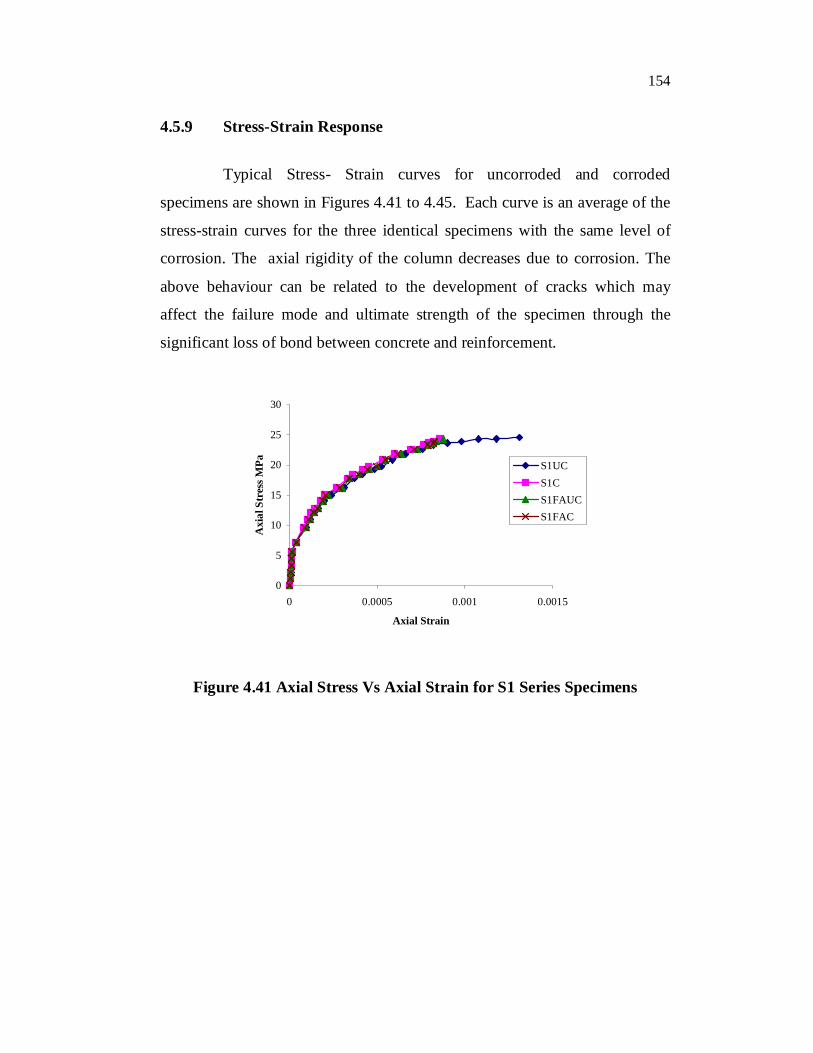
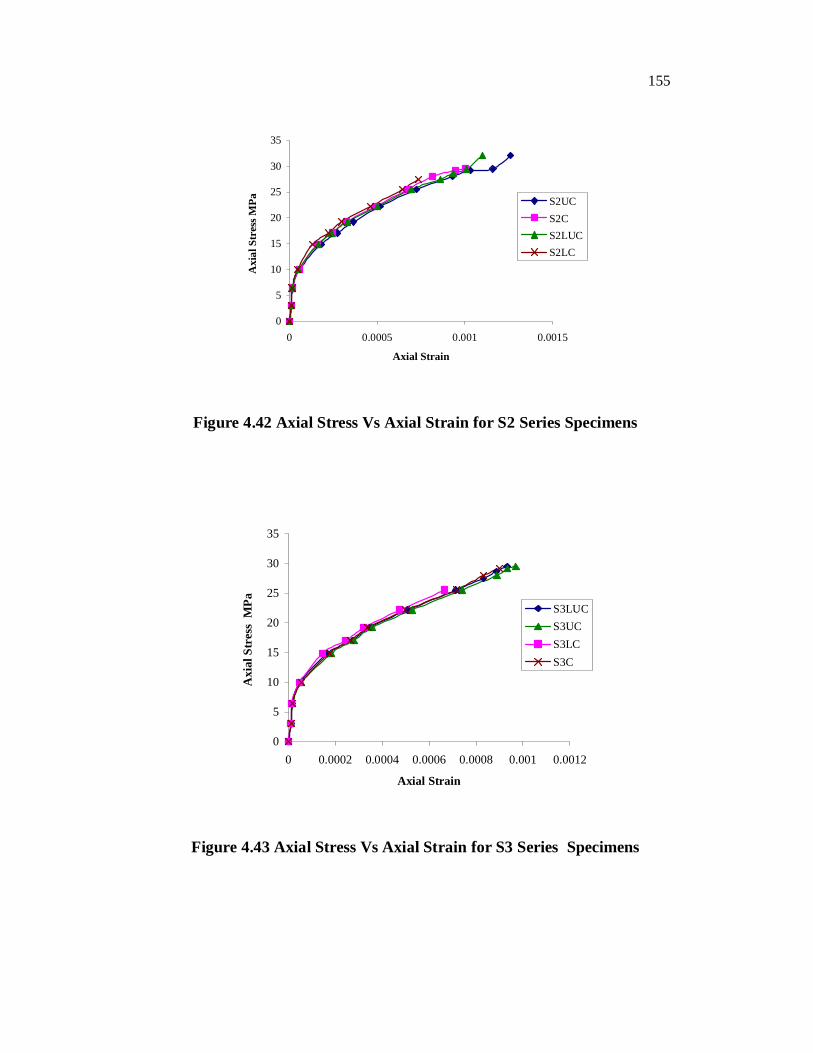
4.5.9 Stress-Strain Response
Typical Stress- Strain curves for uncorroded and corroded
specimens are shown in Figures 4.41 to 4.45. Each curve is an average of the
stress-strain curves for the three identical specimens with the same level of
corrosion. The axial rigidity of the column decreases due to corrosion. The
above behaviour can be related to the development of cracks which may
affect the failure mode and ultimate strength of the specimen through the
significant loss of bond between concrete and reinforcement.
0
5
10
15
20
25
30
0 0.0005 0.001 0.0015
Axial Strain
Axi
al S
tres
s MPa S1UC
S1CS1FAUCS1FAC
Figure 4.41 Axial Stress Vs Axial Strain for S1 Series Specimens
155
0
5
10
15
20
25
30
35
0 0.0005 0.001 0.0015
Axial Strain
Axi
al S
tres
s MPa S2UC
S2CS2LUCS2LC
Figure 4.42 Axial Stress Vs Axial Strain for S2 Series Specimens
0
5
10
15
20
25
30
35
0 0.0002 0.0004 0.0006 0.0008 0.001 0.0012
Axial Strain
Axi
al S
tres
s M
Pa S3LUCS3UCS3LCS3C
Figure 4.43 Axial Stress Vs Axial Strain for S3 Series Specimens

156
0
5
10
15
20
25
0 0.0005 0.001
Axial Strain
Axi
al S
tres
s MPa
S4UCS4CS4FAUCS4FAC
Figure 4.44 Axial Stress Vs Axial Strain for S4 Series Specimens
0
5
10
15
20
25
30
35
0 0.0005 0.001 0.0015
Axial Strain
Axi
al S
tres
s MPa
S5LUCS5LC
Figure 4.45 Axial Stress Vs Axial Strain for S5 Series Specimens
157
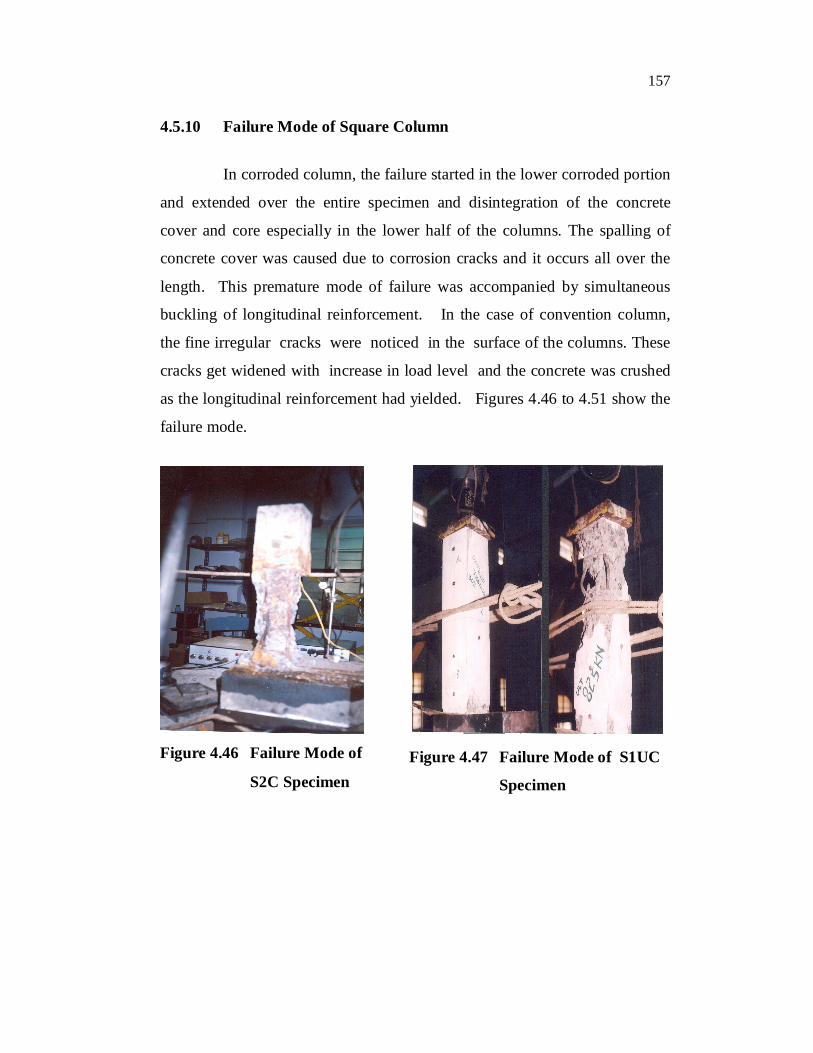
4.5.10 Failure Mode of Square Column
In corroded column, the failure started in the lower corroded portion
and extended over the entire specimen and disintegration of the concrete
cover and core especially in the lower half of the columns. The spalling of
concrete cover was caused due to corrosion cracks and it occurs all over the
length. This premature mode of failure was accompanied by simultaneous
buckling of longitudinal reinforcement. In the case of convention column,
the fine irregular cracks were noticed in the surface of the columns. These
cracks get widened with increase in load level and the concrete was crushed
as the longitudinal reinforcement had yielded. Figures 4.46 to 4.51 show the
failure mode.
Figure 4.46 Failure Mode of
S2C Specimen
Figure 4.47 Failure Mode of S1UC
Specimen

158
Figure 4.48 Failure Mode of
S3C Specimen
Figure 4.49 Failure Mode of
S2UC Specimen
Figure 4.50 Failure Mode of
S4C Specimen
Figure 4.50 Failure Mode of
S3UC Specimen

159
4.5.11 Measurement of Weight Loss
The loss of weight of the rebars were calculated by the gravimetric
method. Figure 4.52 shows the percentage weight loss versus level of
corrosion for various C/D ratios. Figure 4.53 shows the corroded rebars.
0
1
2
3
4
5
6
7
8
9
10
S1C S1FAC S4C S4FAC S2C S2LC S3C S3LC S5LC
Specimens
Perc
enta
ge W
eigh
t Los
s
Figure 4.52 Comparison of Weight Loss in S Series Specimens
Figure 4.53 Corroded Rebars

160
4.6 CONCLUSIONS
The following conclusions are arrived at based on this study:
The rebound Value, UPV value and pH of concrete pore
solution decreases in the corroded specimens.
The chloride content expressed as percentage by weight of
cement increases with decrease in the concrete cover.
The corrosion potential decreases with decrease in the
concrete cover.
The load carrying capacity, ductility and energy absorption
capacity of the conventional column increases with the
increase in the cross section of the column (S1UC and
S2UC).
The load carrying capacity, ductility and energy absorption
capacity of the conventional short (S1UC) column increases
with respect to long column (S4UC) of same cross section.
The percentage decrease in load carrying capacity, ductility
and energy absorption capacity of the corroded column
decreases with the increase in the cover concrete (S1C and
S2C).
The percentage decrease in load carrying capacity, ductility
and energy absorption capacity of the corroded short column
increases when compared to the percentage decrease in long
column of the same cover (S1C and S4C).
The percentage loss of weight in steel increases with
decrease in cover and the percentage decrease in load
161
carrying capacity of the corroded column increases with
increase in percentage weight loss of steel.
The percentage loss of weight in steel and load carrying
capacity of the corroded column increases with decrease in
surface areas of steel embedded.
Significant increase in strength and ductility was observed in
fly ash concrete corroded column when compared to that of
conventional concrete corroded column.
The sustained load and accelerated corrosion procedure
results in a loss of ultimate load carrying capacity of about
27 %.