Embed Size (px)
Citation preview

76
CHAPTER 4
CHARACTERIZATION OF SILVER AND GOLD
NANOPARTICLES SYNTHESIZED USING AQUEOUS
EXTRACT OF OCIMUM SANCTUM, EMBLICA
OFFICINALIS AND SILYMARIN
4.1 INTRODUCTION
Nanotechnology is an emerging field for the prospective
researchers. Natural products are mostly used for the production of
nanoparticles. Nanotechnology application is more suitable for the biological
molecules because of their exclusive properties, reliability eco-friendliness
(Harekrishna et al 2009) and presence of several metabolites is widely
distributed (Ankamwar et al 2005) in the environment.
4.2 MATERIALS AND METHOD
4.2.1 Silver Nanoparticles Synthesis
Synthesis of silver nanoparticles has been explained in detail in
chapter 2 (Materials and Method) in section 2.6 and the same has been
followed.
77
4.2.2 Gold Nanoparticles Synthesis
Synthesis of gold nanoparticles has been explained in detail in
chapter 2 (Materials and Method) in the section 2.7 and the same has been
followed.
4.2.3 UV–Vis Spectroscopy
The description has already been given in the chapter 2 in section
2.10.1
4.2.4 FTIR
This description has already been given in the chapter 2 in the
section 2.10.2.
4.2.5 XRD
This description has already been given in the chapter 2 in the
section 2.10.3.
4.2.6 SEM
This description has already been given in the chapter 2 in the
section 2.10.4
4.2.7 Volumetric estimation of silver and gold ions
This description has already been given in the chapter 2 in the section
2.14

78
4.3 RESULTS
4.3.1 UV-Vis Spectroscopy
Formation of nanoparticles has been evaluated using UV –Vis
spectroscopy. This was the initial step to conform the result. The UV –Visible
spectrum was recorded for aqueous extracts of Ocimum sanctum, Emblica
officinalis, and aqueous solution of Silymarin at different time intervals. The
Surface Plasmon Resonance (SPR) of these plants peaks produced during
reaction was recorded after 72 hours.
Aqueous extracts of the experimental plants yielding the SPR
peaks at Ocimum sanctum silver nanoparticles 428 nm, Emblica officinalis
silver nanoparticles 429 nm, Silymarin silver nanoparticles 455 nm, Ocimum
sanctum gold nanoparticles 520nm, Emblica officinalis gold nanoparticles
528 nm, Silymarin gold nanoparticles 525nm.
Figure 4.1 shows the Surface Plasmon Resonance peak at 428 nm
for the silver nanoparticles synthesized using the extracts of Ocimum
sanctum. Figure 4.2 has the Surface Plasmon Resonance peak at 429 nm for
the silver nanoparticles synthesized using the extracts of Emblica officinalis.
Figure 4.3 has the SPR peak at 455 nm for the silver nanoparticles
synthesized using the solution of Silymarin.
Figure 4.4 shows the peak at 520 nm for the gold nanoparticles
synthesized using the extracts of Ocimum sanctum. Figure 4.5 shows the SPR
peak at 528 nm for the gold nanoparticles synthesized using the extracts of
Emblica officinalis. Figure 4.6 shows the Surface Plasmon Resonance peak at
525 nm for the gold nanoparticles synthesized using the Silymarin.

79
Figure 4.1 UV-Visible absorption spectra of silver nanoparticles synthesized using the crude leaf extracts of Ocimum sanctum
Figure 4.2 UV-Visible absorption spectra of silver nanoparticles synthesized using the crude fruit extracts of Emblica officinalis
0
1
0.2
0.4
0.6
0.8
300 800400 500 600 700
Abs
Wavelength[nm]

80
Figure 4.3 UV-Visible absorption spectra of silver nanoparticles synthesized using the Silymarin powder
Figure 4.4 UV-Visible absorption spectra of gold nanoparticles synthesized using the crude leaf extracts of Ocimum sanctum
0.1
1
0.2
0.4
0.6
0.8
300 800400 500 600 700
Abs
Wavelength[nm]
0
0.6
0.2
0.4
400 800500 600 700
Abs
Wavelength[nm]

81
Figure 4.5 UV UV-Visible absorption spectra of gold nanoparticles synthesized using the crude fruit extracts of Emblica officinalis
Figure 4.6 UV-Visible absorption spectra of gold nanoparticles synthesized using the Silymarin powder

82
4.3.2 FTIR
FTIR analysis was used here to analyse the functional group characterization of silver gold nanoparticles synthesised from the leaves extract of Ocimum sanctum, Emblica officinalis and their Silymarin and its crude form also. The absorbance band in the region of 500–4000 cm-1 was very sensitive and changes occurred even with minor variation in the structure of the materials and the same spectrum was recorded in this study. In this present investigation the shifts and different vibration results were interpreted.
Figure 4.7 shows the six peaks of FTIR absorption spectra of crude
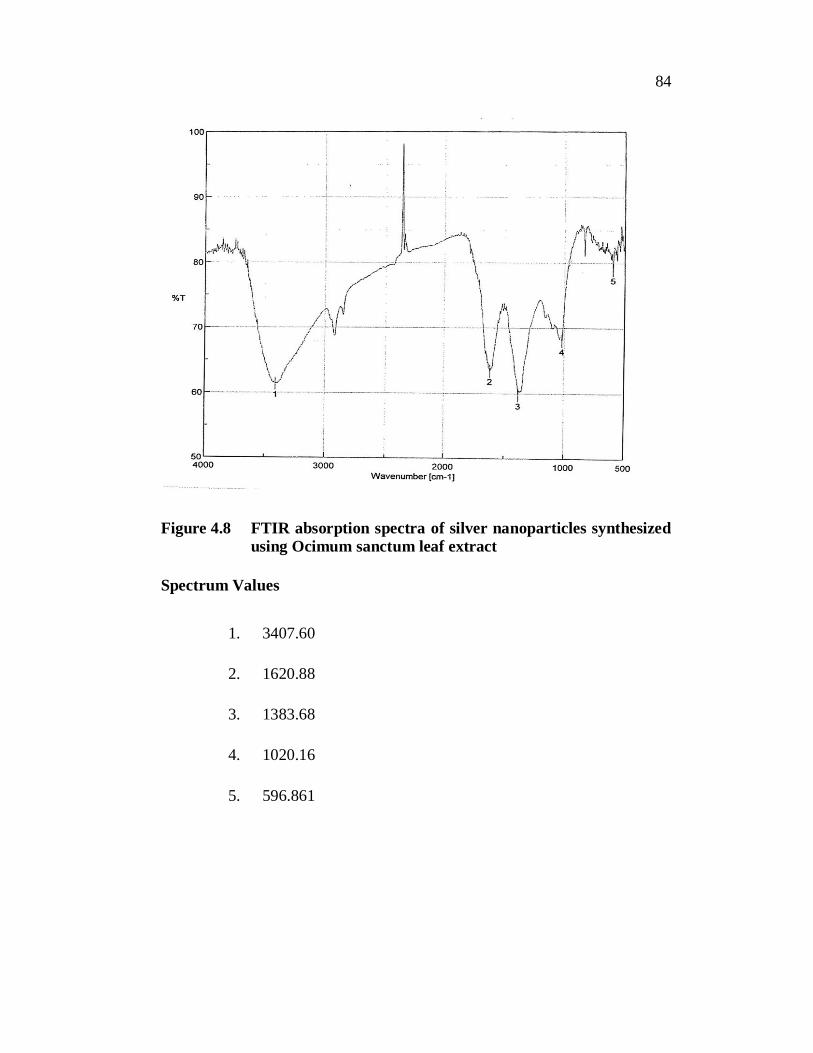
Ocimum sanctum leaves extract, Figure 4.8 shows the five peaks of FTIR
absorption spectra of silver nanoparticles synthesized using Ocimum sanctum
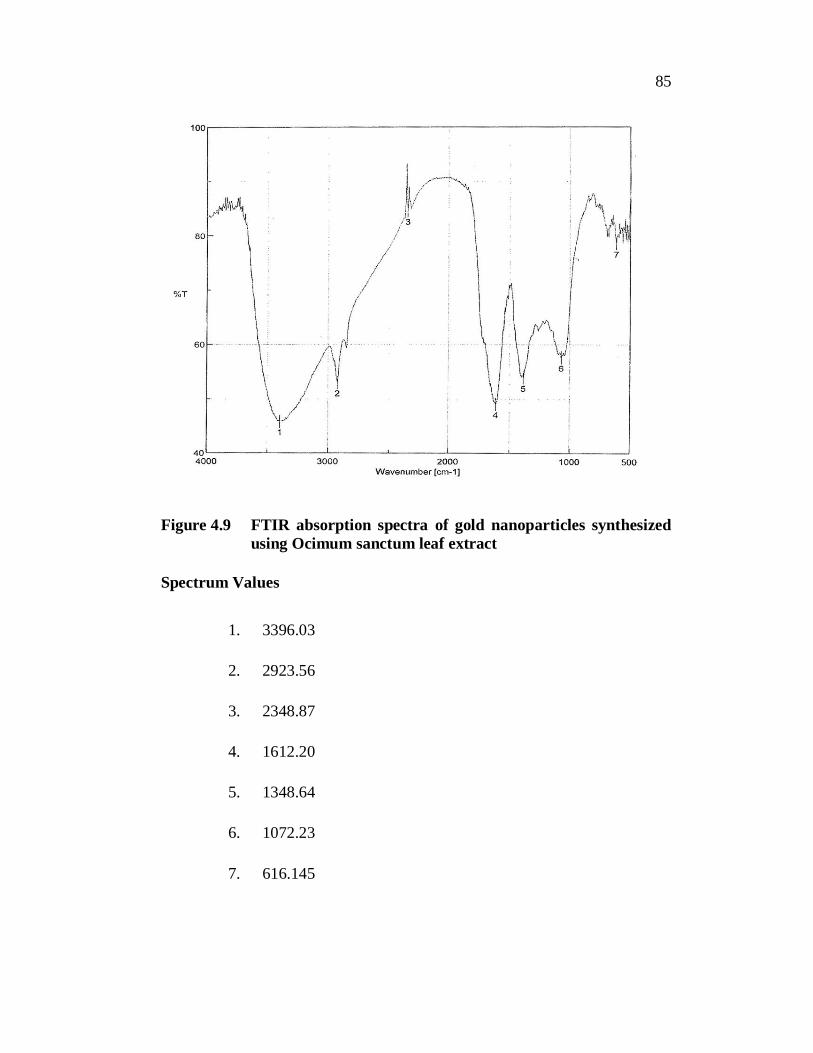
leaf extract, Figure 4.9. shows the seven peaks FTIR absorption spectra of
gold nanoparticles synthesized using Ocimum sanctum leaf extract,
Figure 4.10 shows the ten peaks of FTIR absorption spectra of crude Emblica
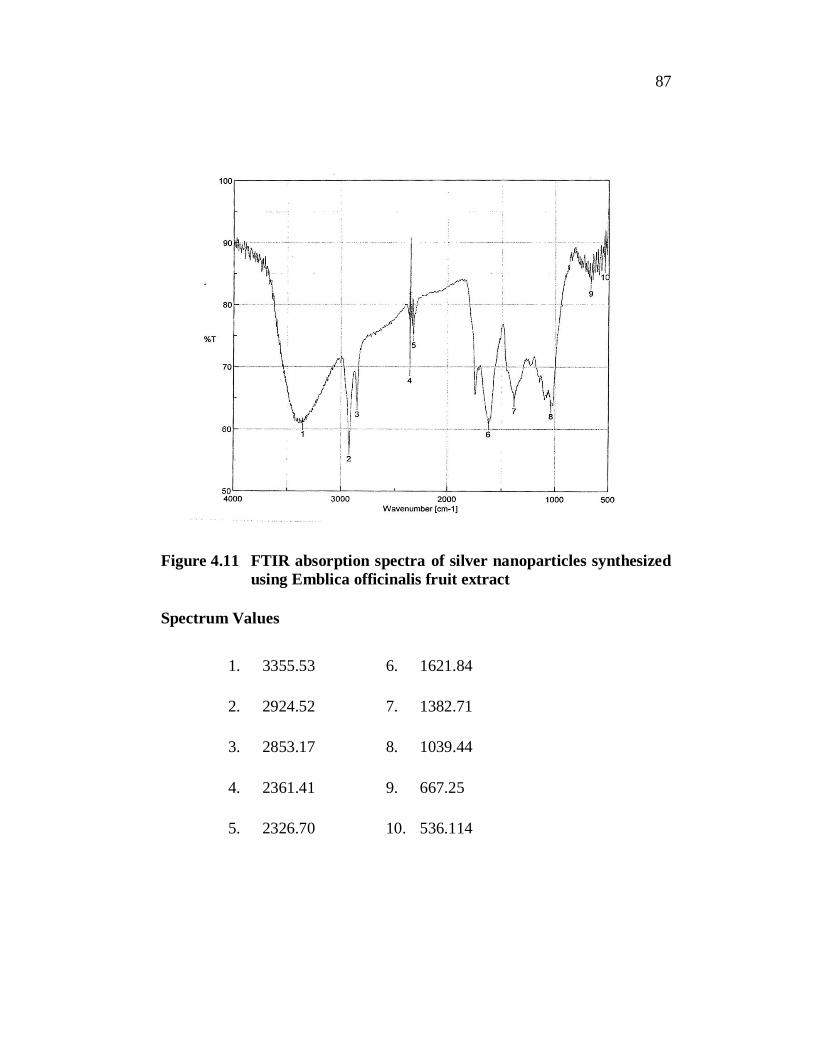
officinalis fruit extract, Figure 4.11 shows the ten peaks of FTIR absorption
spectra of silver nanoparticles synthesized using Emblica officinalis fruit
extract Figure 4.12 shows the four peaks of FTIR absorption spectra of gold
nanoparticles synthesized using Emblica officinalis fruit extract, Figure 4.13
shows the fourteen peaks of FTIR absorption spectra of Silymarin powder
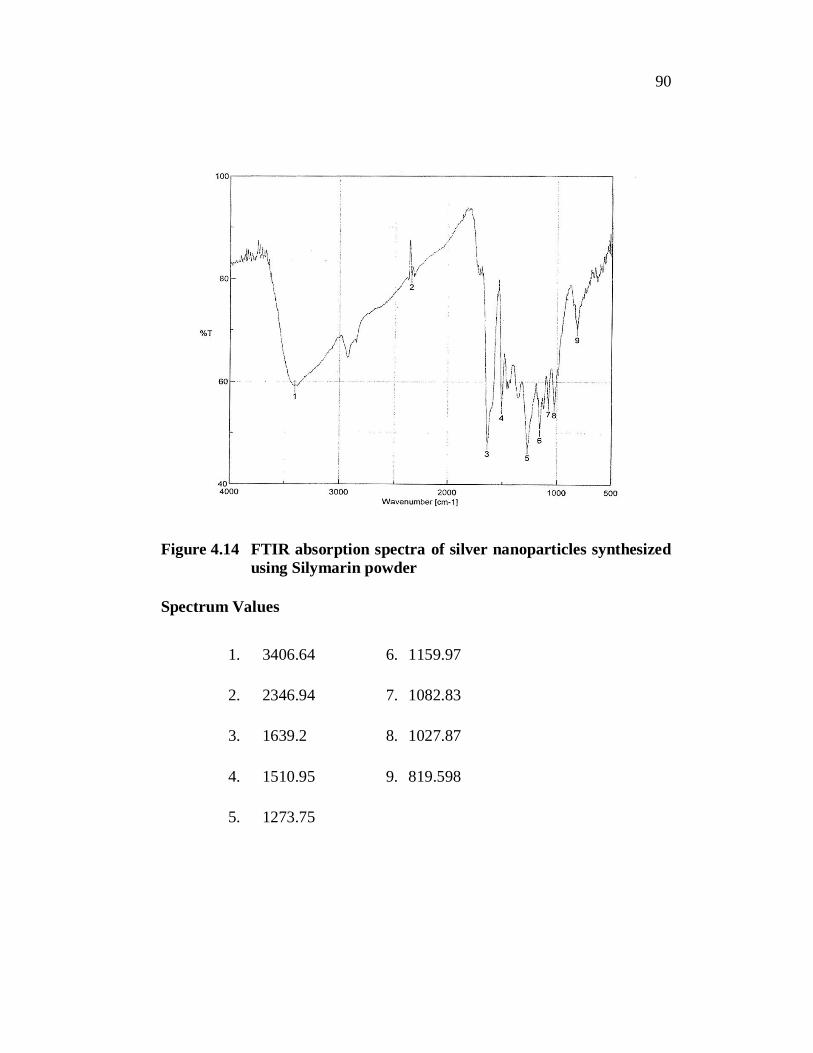
Figure 4.14 shows the nine peaks of FTIR absorption spectra of silver
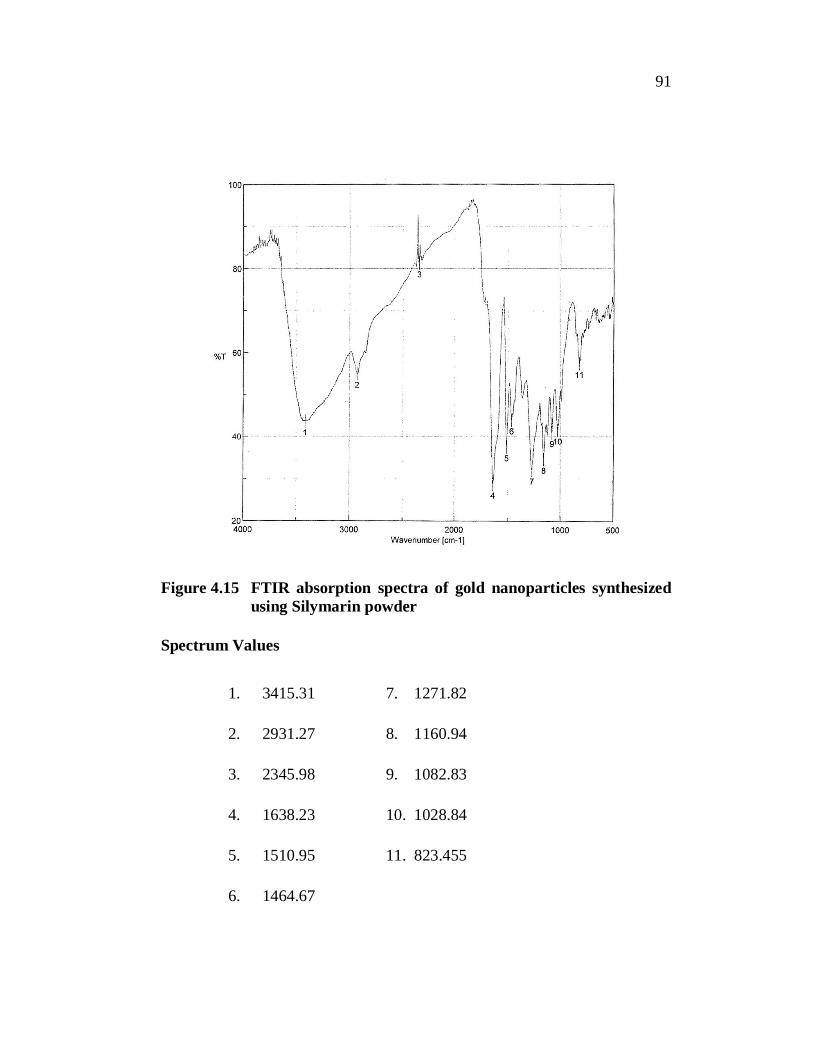
nanoparticles synthesized using Silymarin powder, Figure 4.15 shows the
eleven peaks of FTIR absorption spectra of gold nanoparticles synthesized
using Silymarin powder.

83
Figure 4.7 FTIR absorption spectra of crude Ocimum sanctum leaves extract
Spectrum Values
1. 3392.17
2. 2923.56
3. 2353.69
4. 1628.59
5. 1403.92
6. 1017.27
84
Figure 4.8 FTIR absorption spectra of silver nanoparticles synthesized using Ocimum sanctum leaf extract
Spectrum Values
1. 3407.60
2. 1620.88
3. 1383.68
4. 1020.16
5. 596.861
85
Figure 4.9 FTIR absorption spectra of gold nanoparticles synthesized using Ocimum sanctum leaf extract
Spectrum Values
1. 3396.03
2. 2923.56
3. 2348.87
4. 1612.20
5. 1348.64
6. 1072.23
7. 616.145

86
Figure 4.10 FTIR absorption spectra of crude Emblica officinalis fruit extract
Spectrum Values
1. 3290.93 6. 2327.66
2. 2923.56 7. 1719.23
3. 2853.17 8. 1457.92
4. 2364.30 9. 1018.23
5. 2354.66 10. 666.285
87
Figure 4.11 FTIR absorption spectra of silver nanoparticles synthesized using Emblica officinalis fruit extract
Spectrum Values
1. 3355.53 6. 1621.84
2. 2924.52 7. 1382.71
3. 2853.17 8. 1039.44
4. 2361.41 9. 667.25
5. 2326.70 10. 536.114

88
Figure 4.12 FTIR absorption spectra of gold nanoparticles synthesized using Emblica officinalis fruit extract
Spectrum Values
1. 3370.96
2. 2350.80
3. 1608.34
4. 1022.09

89
Figure 4.13 FTIR absorption spectra of Silymarin powder
Spectrum Values
1. 3444.24 8. 1271.82
2. 2923.56 9. 1163.83
3. 2340.19 10. 1083.8
4. 2322.84 11. 1018.23
5. 1635.34 12. 823.455
6. 1509.03 13. 589.147
7. 1466.6 14. 529.36
90
Figure 4.14 FTIR absorption spectra of silver nanoparticles synthesized using Silymarin powder
Spectrum Values
1. 3406.64 6. 1159.97
2. 2346.94 7. 1082.83
3. 1639.2 8. 1027.87
4. 1510.95 9. 819.598
5. 1273.75
91
Figure 4.15 FTIR absorption spectra of gold nanoparticles synthesized using Silymarin powder
Spectrum Values
1. 3415.31 7. 1271.82
2. 2931.27 8. 1160.94
3. 2345.98 9. 1082.83
4. 1638.23 10. 1028.84
5. 1510.95 11. 823.455
6. 1464.67

92
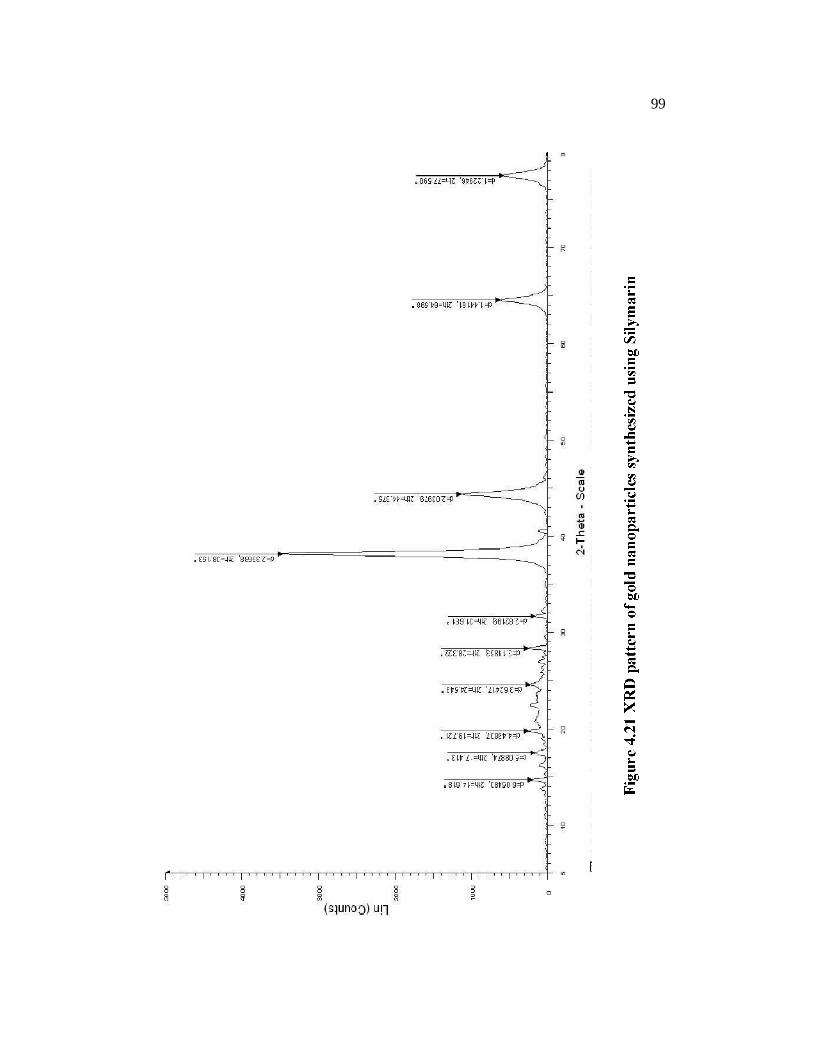
4.3.3 XRD
The evidence of extracellular formation of elemental silver and
gold was detected by X-ray diffraction (XRD) analysis. The crystal structure,
crystallite size and pattern have been evaluated using the X-ray diffraction.
The diffraction peaks of nanoparticles appeared at different planes and can be
assigned to lattice planes and these were observed and compared with JCPDS
data. Apart from these peaks, unassigned peaks were also noted in this present
investigation. The XRD peaks and their corresponding 2 lattice plane for
silver and gold nanoparticles values are given in the following Table 4.1.
Table 4.1 XRD Peaks values of Ocimum sanctum, Emblica officinalis and Silymarin
S.No XRD Peaks 2 Value 1 Silver nanoparticles synthesised
from Ocimum sanctum 1. 38.87 2. 44.385 3. 64.569 4. 77.511
1. 111 2. 200 3. 220 4. 311
2 Silver nanoparticles synthesised from Emblica officinalis 1. 38.105 2. 44.384 3. 64.444 4. 77.406
1. 111 2. 200 3. 220 4. 311

93
Table 4.1 (Continued)
3 Silymarin Silver nanoparticles 1. 38.466 2. 44.626 3. 64.817 4. 77.789
1. 111 2. 200 3. 220 4. 311
4 Gold nanoparticles synthesised form Ocimum sanctum 1. 38.250 2. 44.400 3. 64.750 4. 77.654
1. 111 2. 200 3. 220 4. 311
5 Gold nanoparticles synthesised from Emblica officinalis 1. 38.128 2. 44.256 3. 64.470 4. 77.378
1. 111 2. 200 3. 220 4. 311
6 Silymarin gold nanoparticles 1. 38.128 2. 44.256 3. 64.470 4. 77.378
1. 111 2. 200 3. 220 4. 311
Figure 4.16 shows the result of XRD pattern of silver nanoparticles
synthesized using Ocimum sanctum leaf extract. Figure 4.17 shows the result
of XRD pattern of gold nanoparticles synthesized using Ocimum sanctum leaf
extract. Figure 4.18 shows the result of XRD pattern of silver nanoparticles
synthesized using Emblica officinalis fruit extract. Figure 4.19 shows the
result of XRD pattern of gold nanoparticles synthesized using Emblica
officinalis fruit extract. Figure 4.20 shows the result of XRD pattern of silver
nanoparticles synthesized using Silymarin. Figure 4.21 shows the result of
XRD pattern of gold nanoparticles synthesized using Silymarin.

94

95

96

97

98
99
100
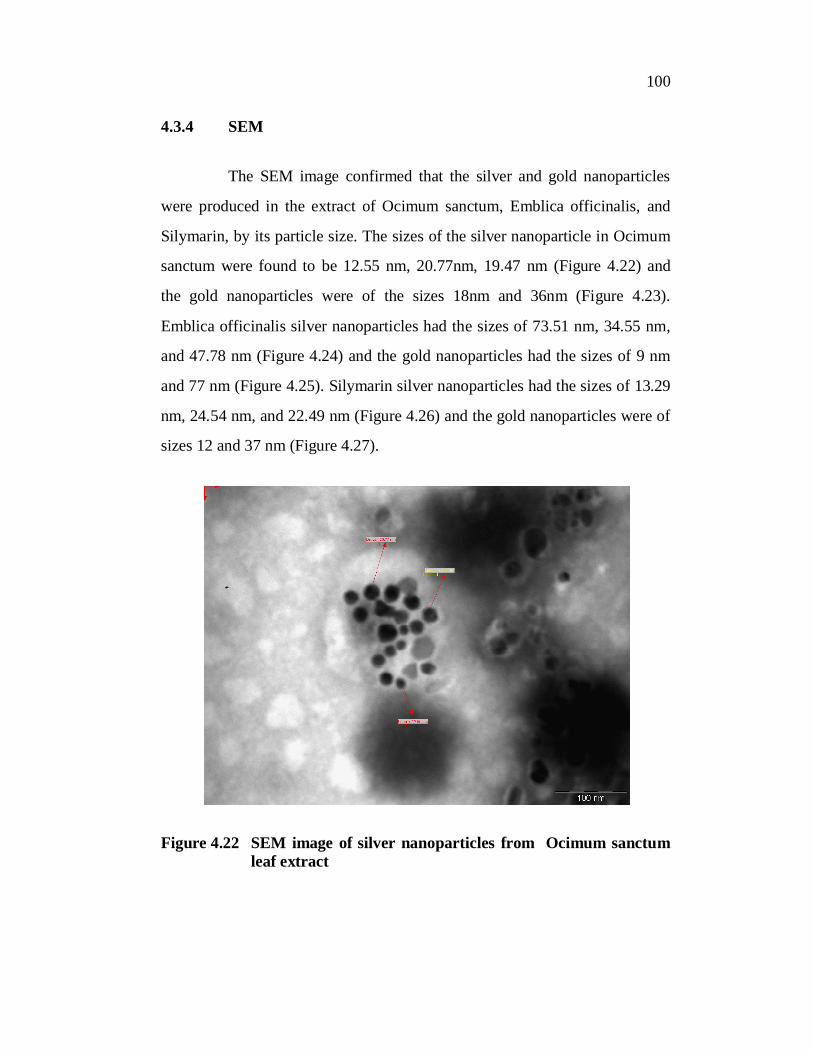
4.3.4 SEM
The SEM image confirmed that the silver and gold nanoparticles
were produced in the extract of Ocimum sanctum, Emblica officinalis, and
Silymarin, by its particle size. The sizes of the silver nanoparticle in Ocimum
sanctum were found to be 12.55 nm, 20.77nm, 19.47 nm (Figure 4.22) and
the gold nanoparticles were of the sizes 18nm and 36nm (Figure 4.23).
Emblica officinalis silver nanoparticles had the sizes of 73.51 nm, 34.55 nm,
and 47.78 nm (Figure 4.24) and the gold nanoparticles had the sizes of 9 nm
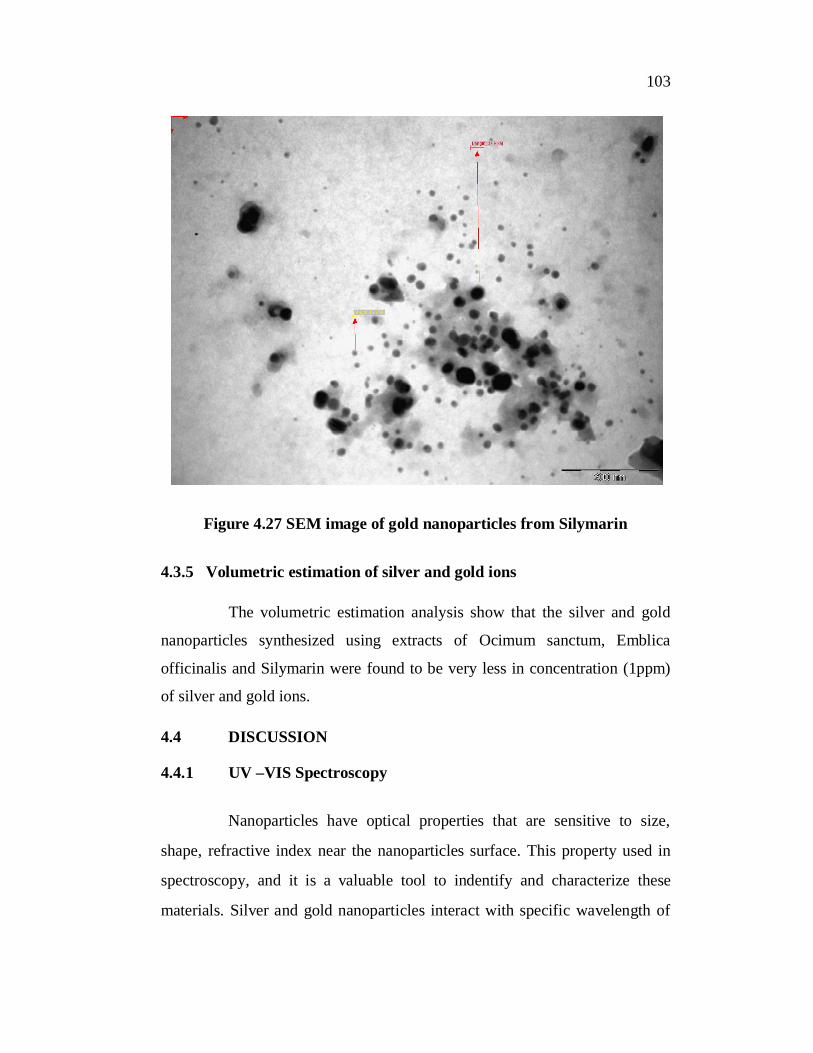
and 77 nm (Figure 4.25). Silymarin silver nanoparticles had the sizes of 13.29
nm, 24.54 nm, and 22.49 nm (Figure 4.26) and the gold nanoparticles were of
sizes 12 and 37 nm (Figure 4.27).
Figure 4.22 SEM image of silver nanoparticles from Ocimum sanctum leaf extract

101
Figure 4.23 SEM image of gold nanoparticles from Ocimum sanctum leaf extract
Figure 4.24 SEM image of silver nanoparticles from Emblica officinalis fruit extract

102
Figure 4.25 SEM image of gold nanoparticles from Emblica Officinalis fruit extract
Figure 4.26 SEM image of silver nanoparticles from Silymarin
103
Figure 4.27 SEM image of gold nanoparticles from Silymarin
4.3.5 Volumetric estimation of silver and gold ions
The volumetric estimation analysis show that the silver and gold
nanoparticles synthesized using extracts of Ocimum sanctum, Emblica
officinalis and Silymarin were found to be very less in concentration (1ppm)
of silver and gold ions.
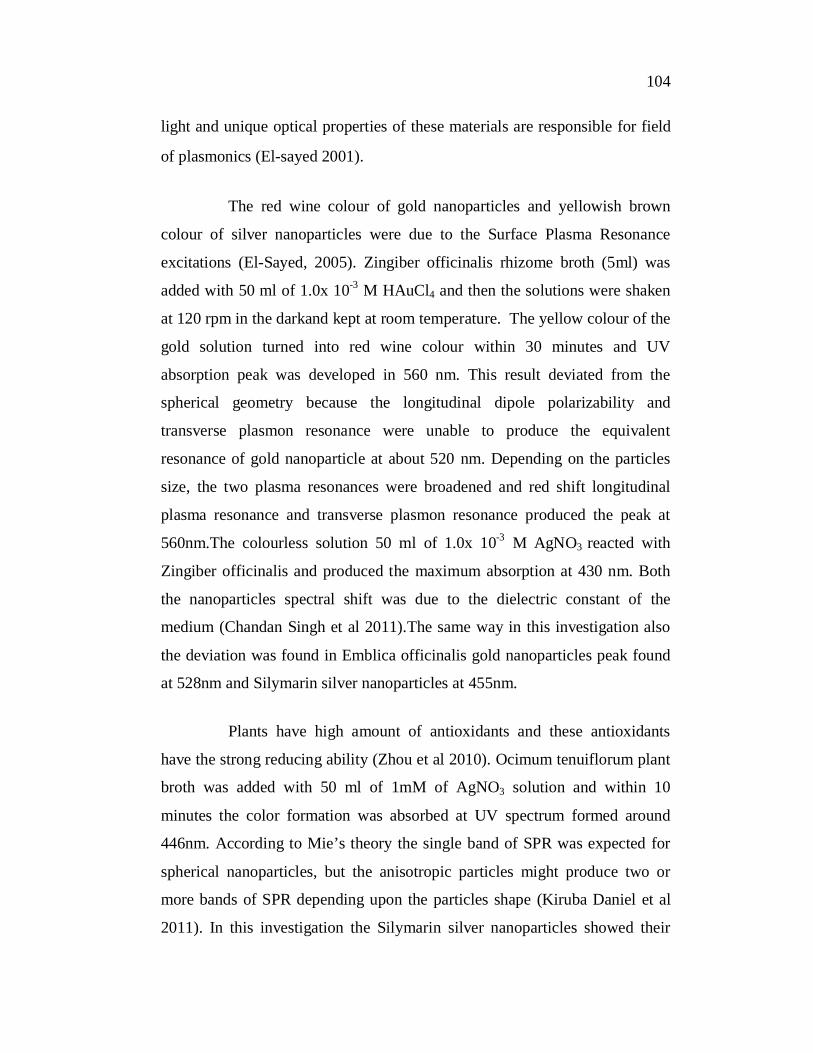
4.4 DISCUSSION
4.4.1 UV –VIS Spectroscopy
Nanoparticles have optical properties that are sensitive to size,
shape, refractive index near the nanoparticles surface. This property used in
spectroscopy, and it is a valuable tool to indentify and characterize these
materials. Silver and gold nanoparticles interact with specific wavelength of
104
light and unique optical properties of these materials are responsible for field
of plasmonics (El-sayed 2001).
The red wine colour of gold nanoparticles and yellowish brown
colour of silver nanoparticles were due to the Surface Plasma Resonance
excitations (El-Sayed, 2005). Zingiber officinalis rhizome broth (5ml) was
added with 50 ml of 1.0x 10⁻³ M HAuCl4 and then the solutions were shaken
at 120 rpm in the darkand kept at room temperature. The yellow colour of the
gold solution turned into red wine colour within 30 minutes and UV
absorption peak was developed in 560 nm. This result deviated from the
spherical geometry because the longitudinal dipole polarizability and
transverse plasmon resonance were unable to produce the equivalent
resonance of gold nanoparticle at about 520 nm. Depending on the particles
size, the two plasma resonances were broadened and red shift longitudinal
plasma resonance and transverse plasmon resonance produced the peak at
560nm.The colourless solution 50 ml of 1.0x 10⁻³ M AgNO3 reacted with
Zingiber officinalis and produced the maximum absorption at 430 nm. Both
the nanoparticles spectral shift was due to the dielectric constant of the
medium (Chandan Singh et al 2011).The same way in this investigation also
the deviation was found in Emblica officinalis gold nanoparticles peak found
at 528nm and Silymarin silver nanoparticles at 455nm.
Plants have high amount of antioxidants and these antioxidants
have the strong reducing ability (Zhou et al 2010). Ocimum tenuiflorum plant
broth was added with 50 ml of 1mM of AgNO3 solution and within 10
minutes the color formation was absorbed at UV spectrum formed around
446nm. According to Mie’s theory the single band of SPR was expected for
spherical nanoparticles, but the anisotropic particles might produce two or
more bands of SPR depending upon the particles shape (Kiruba Daniel et al
2011). In this investigation the Silymarin silver nanoparticles showed their

105
absorption peak at 455nm and SPR got shifted because of the particles size
and solubility nature of the plant source. Later the particles size was
confirmed by the SEM analysis and the sizes were 13.29nm, 22.49 nm and
24.49 nm.
Emblica officinalis silver nanoparticles showed the UV-Visible
peak at 528 nm. The same kind of results were reported earlier that the Cassia
auriculata 2 ml flower extract being added with 10 mg of chloroauria acid
dissolved in 100 ml distilled water. The ruby red colour formation of gold
nanoparticle was absorbed in UV-Vis absorption spectra and the peak was got
at 532 nm. The particle size ranged from 10 to 90 nm and the average size
was 28nm (Dhayananthaprabhu et al 2013).
Rapid synthesis of silver nanoparticles from Geranium leaf broth of
20ml was added with 1mM aqueous AgNO3.The formed silver nanoparticles
were observed stable for even after six weeks (Sastry et al 2003).
The fresh leafs of Phyllanthus amarus 50 ml of 5% of leaf extract
was treated with 1mM of AgNO3 and 1mM of chloroauric acid. The Surface
Plasmon Resonance spectra for silver nanoparticles were obtained at 420 nm
and gold nanoparticles were at 580 nm (Annamalai et al 2011).The aqueous
extract of Mirabilis jalapa flowers extract of 5 ml was added with 45 ml
0.002 M AuCl4. The UV –Visible spectrum was recorded at different
intervals and the SPR peak formed at 570 nm (Vankar &Bajpai 2010).The
band peak intensity increased with time but in our experiment after 72 hours
and after 30 days also the UV Spectrum was showing the same wavelength.
There results indicated that the Ocimum sanctum, Emblica officinalis and
Silymarin were behaved like a strong reducing and stabilizing agent during
the silver and gold nanoaparticles formation.
106
The aqueous extract of Terminalia catappa produced the gold
nanoparticles and strong resonance was at 524 nm and was clearly viewed
and this peak raised due to the surface plasmon vibrations excitation of gold
nanoparticles (Balaprasad Ankamwar2010).
The synthesis of silver nanoparticles from various plant extract of
Helianthus annuus (Asteraceae), Basella alba (Basellaceae), Oryza sativa,
Saccharum officinarum, Sorghum bicolour and Zea mays (Poaceae) showed
the peaks around 430 nm (Arangasamy Leela & Munusamy Vivekanandan
2008).The silver and gold nanoparitcles were synthesized from fungus
verticillium sp and the absorbances were found at 450 nm for silver
nanoparticle.
The gold nanoparticles were synthesized from actinomycete,
Thermomonospors sp., and its SPR peak found in 520nm for gold
nanoparticles (Sastry et al 2003). Phyllostachys sp leaves extract showed the
Plasmon surface resonance adsorption peak at 425 nm (Jegan et al 2011).
Euphorbia hirta weeds formed the silver nanoparticles in the reaction media
within 10 minutes, with absorbance peak at 430 nm. SEM image showed the
spherical shape with diameter range 40 – 50 nm (Elumalai et al 2010). The
similar results had been reported by Chandran et al 2006.
Mirablis jalapa flower produced the gold nanoparticle peak at
570nm (Vankar and Bajpuri 2010) Terminalia catappa leaf extract showed the
gold nanoparticle absorption peak at 524 nm (Balaprasad Ankamwar 2010)
Fruit extract of orange (citrous sinensis) papaya – (carica papayas) peach –
(prunus persica) and Lemon – (citrous limon) showed the UV spectrum band
centred at 565 nm, 590 nm peach – 530 nm and 900 nm – formed as the in
plane dipole resonanance and out of plane quadrupole resonance (Hao et al
2004, Millstone et al 2005).

107
Chenopodium album and obnoxious weed acts as mild reducing
agent and produces the silver and gold nanoparticles at 460 nm and 540 nm.
Both the particles ranged between 10-30 nm (Amarendra Dhardwivedi&
Krishna Gopal 2010). Desmodium triflorum demonstrates the UV visible
spectrum peak being observed at 425 nm for silver nanoparticles and 560 nm
for gold nanoparticles. The size of the particle ranges from 5-20nm (Naheed
Ahmed et al 2011).
Memecylon edule leaf extract synthesized the silver and gold
nanoparticle and UV-spectrum was observed at 475 nm for silver
nanoparticles and 560 nm for gold nanoparticles (Elavazhagan &
Arunachalam 2011). The leaf extract of Calotropis gigantea formed the silver
nanoparticles and UV spectrum was observed at 420 nm (Sivakumar et al
2011). Silver nanoparticles were produced using vitex negundo L two
UV – visible peaks being observed at 422 nm and 447 nm (Zargar et al 2011).
Acacia nilotica (Babool) leaf extract was used to synthesize of size
controlled gold nanoparticles and this plant showed the UV spectrum being
observed in 533 to 529 nm region (Majumdar et al 2013). Gnidia glauca
flower extract was used to synthesize gold nano particles and the UV
spectrum observed at 540 nm (Ghosh et al 2012). The green synthesis of
silver nanoparticles from Iresine herbstii leaf extract showed the reaction
mixture turn brownish gray color after seven days. The UV absorption peak
was absorbed at 460 nm (Dipankar & Murugan 2012).Only the silver
nanoparticle acted as antifungal as well as antibacterial agent (Jain et al
2009). All these earlier results supported the results of this investigation and
conformed the findings of silver and gold nanoparticles formation.
108
4.4.2 FTIR
FTIR measurements were used to investigate the reduction,
stabilizing and capping of silver or gold nanoparticles.The mid infrared
region interacts with the complex arrangement of atoms of the molecule and
produce IR absorption spectrum depending on the functional group of wide
range. Stretching and bending vibration varied after formulation was
observed. In this experiment FTIR spectrum of the aqueous extracts Ocimum
sanctum, Emblica officinalis and aqueous solution of Silymarin were
compared with silver and gold nanoparticles synthesised from the leaves
extract of Ocimum sanctum, Emblica officinalis and Silymarin. The reduction
shift and stretching and bending vibration were analysis was the important
character to be determined for the nanoparticles formation (Silverstein &
Webster 2002). It was done by comparing the aqueous crude form of Ocimum
sanctum leaf extract, Emblica officinalis fruit extract spectrum with its silver
and gold nanoparticles spectrum. The same way Silymarin crude extract
spectrum and its nanoparticles were compared. The FTIR spectrum of crude
extract of Ocimum sanctum was recorded as 3392.17, 2923.56, 2353.69,
1628.59, 1403.92, and 1017.27. The band 3392.17 was O-H stretch-alcohol
group it was shifted to 3407.60 O-H in alcoholic and phenolic compounds
(Kong & Yu 2007) in silver nanoparticles. The bands 2923.56 and 2356.96
were due to the presence of-H stretch- carboxylic acids and P-H stretch. The
two bands were completely shifted and form the next band formed at 1620.88
and indicating that C=N stretch. The new band formed in Ocimum sanctum at
1383.68 and indicating that C=N tertiary aromatic amine (Idoko et al 2013).
This band was slightly shifted from the Ocimum sanctum crude extract
(1628.59). O.S extract produced the band at1403.92 and1017.27, indicating
the O-H bend and N-O stretching. These two absorptions were shifted
to1020.16 and 596.861, and were responsible for C-N Amino axial
deformation and C-Br Stretch (Mohamed et al 2013).

109
In Ocimum sanctum gold nanoparticles the band formed at
3392.17, 2923.56, 2356.96 and ascribed that O-H stretch-alcohol, O-H
stretch- carboxylic acids, P-H stretch and shifted from its crude extract
absorption peaks 3392.17, 2923.56 and 2356.96.The Ocimum sanctum gold
nanoparticle showed the peak at 1612.20 and were responsible for C=N
stetch (Mohamed et al 2013). The new bands of 1384.64, 1072.23 and
616.145 were responsible for C-N stretching, C-H Bend Alkenes, C=C-H / C-
H Bend Alkenes (Idoko et al 2013, Mohamed et al 2013).
The FTIR spectrum of crude extract of E.O had peaks at 3290.93,
2923.56, 2853.17, 2364.30, 2354.66, 2327.66, 1719.23, 1457.92, and
1018.23.The band 3290.93 was ascribed to -NH2 groupand it was shifted to
3355.53 in silver nanoparticles. The bands 2923.56 and 2364.30 were due to
the presence of aromatic C-H stretch and they got shifted to 2924.52 and
2361.41 in silver nanoparticles.Another C-H stretch band 2853.17 was not
shifted in silver nanoparticles. The bands 2354.66 and 1719.23 were due to
C-O bond and they were shifted to 2326.70 and 1382.71 leading to the
formation of the N-O stretching. The silver nanoparticles band 1039.44 was
responsible for C-O-C stretching. The Emblica officinalis fruit extract
band 666.285 was shifted to 667.25 and it was responsible for C-H stretch
(Jackson &Mantsch1990).
Emblica officinalis gold nanoparticles produced strong bands at
3370.96 and 2350.80 indicating the NH2 stretch and C-O bond (Idoko et al
2013). The C=C stretch formed during the gold nanopaticles of Emblica
officinalis extract. The C-N Aliphatic amine was formed at 1022.09.
The Silymarin functional peaks of 1653.34, 1509.03, 1083.8,
823.455 were responsible for N=C oxazolone ring, N-O stretching, C-O
group and C-Cl alkyl halides being maintained in Silymarin silver
nanoparticles (1639.2, 1510.95, 1082.83, 819.598) also. The Silymarin band

110
3444.24 and 2936.56 aromatic C-H stretches were shifted to 3406.64 as N-H
stretch. The Silymarin bands 1271.82 and 1018.23 were responsible for C-N
amines were shifted as 1273.75 and 1027 (C-OH stretch).The new band
1027.87 formed C-O-C stretching in Silymarin nanoparticles. The Silymarin
gold peaks were obtained in 3415.31, 2931.27, 2345.98, 1638.23, 1510.95,
1464.67, 1271.82, and 1160.94. The band 3415.31 was responsible for N-H
stretch while the band 2931.27 was responsible for Aliphatic C-H Stretch.
The band 2345.98 was responsible for C-O bond and 1638.23 indicating the
C-H Stretch. The N-O functional group stretching was formed in 1510.95 and
C-H alkane was formed in 1464.67. The Aromatic amines(C-N) peak formed
in1271.82. The band 1160.94 indicated the C-N Alkylhalides in Silymarin
gold nanoparticles.
The absorption peak around 1627 and 1635 due to the stretching
vibration of -C=C, the peaks 1375 and 1383 cm-1 were most probably the
functional group of –N-O functional group. In silver nanoparticle due to the
existence of NO3- in the residual solution the peak formed at 1383 cm-1
(Luo et al 2005).The stretching vibration of C=O was absorbed at 1739 and –
C-O peaks absorbed at 1026 and 1021 cm-1 (Chandan Singh et al 2011).
4.4.3 XRD
In XRD measurement the silver nanoparticles formation was
confirmed by the peak value and pattern of the lattice plane and similar
observations were reported earlier (Ahmad et al 2007, Christensen et al
2011). A number of Bragg reflections at 2 values of silver and gold which
correspond to the (111), (200), (220) and (311) sets of lattice planes were
observed in silver and gold nanoparticles produced in an earlier report
(Ahmad et al 2007).

111
The JCPDF file no 04-0783 was indicating the silver nanoparticles
formation by earlier reports (Fan et al 2009, Chook et al 2012). In this
investigation also silver nanoparticles produced from Ocimum sanctum,
Emblica officinalis and Silymarin shows the same lattice plan and
observation. For gold nanoparticles JCPDF file no 04-0784 confirmed the
gold nanoparticles formation by Narajanan & Sakhivel, 2008,
Dhayananthaprabhu et al 2013. In this investigation the same kind of results
were obtained. A few intense additional and yet unassigned peaks were also
noticed in the vicinity of characteristic peaks of silver and gold nanoparticles
of Ocimum sanctum, Emblica officinalis and Silymarin. The unassigned
peaks could be produced due to the crystallization of bioorganic phase that
occurred on the surface of the nanoparticles (Ahmad & Shrama 2012). The
morphology of the particles formed consisted of a mixture of spherical and
plates with face centred cubic (111), (200), (220) and (311) structure of silver
and gold nanoparticles. The average size of the gold nanoparticles was thus
determined in SEM analysis. The XRD pattern thus clearly illustrates that the
silver gold nanoparticle synthesized from leafs extracts of ocimum sanctum,
fruit extract of Emblica officinalis and aqueous solution of Silymarin were
crystalline in nature.
4.4.4 SEM
SEM analysis was to be done to study the surface morphology and
to estimate the obtained nanoparticles having the structure of rectangle, rod,
triangle, and spherical shapes to be viewed. Depending upon the particle size
the UV spectrum, FTIR values and XRD value were obtained. The particles
average size was analyzed and the results are listed here: silver nanoparticles
of ocimum sanctum have 20 nm and its gold nanoparticles were 27 nm.
Emblica officinalis synthesized silver nanoparticles had the average size

112
52 nm and gold nanoparticles 43 nm. The same way the Silymarin
synthesized silver and gold nanoparticles produced the average size 20 nm
and 24 nm respectively. The rectangle, triangle, spherical shaped
nanoparticles were identified in this study. These results showed that the
particles formed similar size and produced the nanoparticles. The same kinds
of shapes were reported by the earlier work by Zheng et al 2011 and
morphology and size of the silver nanoparticles were identified by Forough &
Farhadi 2010.
4.4.5 Volumetric estimation of silver and gold ions
The silver and gold ions present in thesilver and gold nanoparticles
synthesized using the extracts of Ocimum sanctum, Emblica officinalis and
Silymarin contained very less amount of silver and gold ions and this amount
does not cause any side effects in the liver cells. This was further confirmed
in chapter 6 invivo study. However, further studies are warranted to
standardize these results.