Embed Size (px)
Citation preview

Effects Determinations for Chlorpyrifos
Table of Contents1 Introduction........................................................................................22 Summary of Effects Determinations......................................................23 Effects Determinations of No Effect.......................................................34 Effects Determinations of NLAA - No overlap.........................................45 Effects Determinations of NLAA/LAA: Weight-of-Evidence (WoE) Analysis56 Effects Determinations of NLAA/LAA: Downstream Dilution...................67 Effects Determinations of NLAA/LAA: Qualitative Analyses.....................6
7.1 Sea Turtle Analysis.........................................................................................................7
7.2 Whale and Deep Sea fish Analysis................................................................................16
7.3 Marine Mammals (excluding Whales) Analysis............................................................24
7.4 Cave Dwelling Invertebrate Species Analysis...............................................................34
7.5 Cattle Ear Tag Use Analysis..........................................................................................42
7.6 Mosquito Adulticide Analysis.......................................................................................42
7.7 Seed Treatment and Granular Treatment Analysis......................................................43
8 Refined Risk Analysis for 13 Listed Bird Species: TIM-MCnest Analysis....439 Additional Information relevant for Step 3: ECx and Web-ICE Analyses. .43
4-1

1 Introduction
For 1835 listed species, including endangered, threatened, candidate and proposed species, and 794 designated critical habitats, a “No Effect” (NE), “Not Likely to Adversely Affect” (NLAA) or a “Likely to Adversely Affect” (LAA) determination is made. For each species and designated critical habitat, the effects determination is based on the methodology previously described in Section 1.4 of the Problem Formulation or a more qualitative analysis, depending on the listed species’ life history, unique habitat attributes (e.g., deep ocean habitat), and/or the chemical use pattern overlap. These determinations are described further below.
2 Summary of Effects Determinations
Tables 4-2.1 and 4-2.2 below summarize the effects determinations for all species and designated critical habitats including a count of the number of species by taxon in each effects determination category. Effects determinations are summarized for each individual species and critical habitat in APPENDIX 4-1 (this table is provided in Excel format due to its large size). APPENDIX 4-1 (‘Summary Table All Calls’ tab) is organized into 8 major taxa: birds, mammals, amphibians, reptiles, terrestrial invertebrates, fish, aquatic invertebrates and plants. Species are listed by taxa, then alphabetically according to scientific name, then by species identification number. For each species, the table includes an effects determination for both the species and their critical habitat, if applicable, as well as an indication of how the effects determination was reached (e.g., terrestrial weight-of-evidence analysis, qualitative analysis – sea turtles, etc.). Each group of effects determinations is further described below.
TABLE. 4-2.1. Summary of Species Effects Determinations for Chlorpyrifos (Counts by Taxon).
TAXON
STEP 1 EFFECTS DETERMINATIONS STEP 2 EFFECTS DETERMINATIONS
TotalsNO EFFECT
MAY EFFECT
NOT LIKELY TO ADVERSLY AFFECT
LIKELY TO ADVERSELY AFFECT
Amphibians 0 40 1 39 40Aquatic Invertebrates 0 220 1 219 220
Birds 5 103 12 91 108Fish 0 193 5 188 193Mammals 2 107 20 87 109Plants 0 961 2 959 961Reptiles 0 48 0 48 48Terrestrial Invertebrates 9 147 0 147 156
Total 16 1819 41 1778 1835
Percent of total 1 99 2 97
4-2

TABLE. 4-2.2 Summary of Critical Habitat Effects Determinations for Chlorpyrifos (Counts by Taxon).
TAXON
STEP 1 EFFECTS DETERMINATIONS STEP 2 EFFECTS DETERMINATIONS
TotalsNO EFFECT
MAY EFFECT
NOT LIKELY TO ADVERSLY AFFECT
LIKELY TO ADVERSELY AFFECT
Amphibians 0 25 0 25 25Aquatic Invertebrates 0 75 0 75 75
Birds 0 31 0 31 31Fish 0 106 0 106 106Mammals 0 32 5 27 32Plants 0 462 3 459 462Reptiles 0 17 0 17 17Terrestrial Invertebrates 0 46 2 44 46
Total 0 794 10 784 794
Percent of total 0 100 2 98
3 Effects Determinations of No Effect
The Step 1 “No Effect/May Affect” analysis determines if a listed species or its designated critical habitat requires further analysis due to the potential of co-occurrence with the action area. A critical habitat determination may differ from the species determination when the critical habitat extends outside of the species range. The spatial footprint of the action area includes the pesticide footprint based on all labeled uses for the chemical and offsite transport due to both spray drift and downstream dilution. Additional information on how the action area was developed can be found in ATTACHMENT 1-3, and additional information on the downstream dilution analysis can be found in APPENDIX 3-5. The species’ range geospatial files used in this analysis were provided by the U.S. Fish and Wildlife Service (USFWS) and the National Marine Fisheries Service (NMFS).
When no co-occurrence is identified between the listed species range (including designated critical habitat) and the action area, the species and its designated critical habitat receives a “No Effect” determination. A “May Affect” determination is given if co-occurrence exists, moving the species and/or its designated critical habitat to Step 2 for further analysis. Co-occurrence is determined by overlaying the action area and with the species range and designated critical habitat using ArcGIS v10.4.
“No Effect” determinations were made for species with no designated critical habitat that met at least one of the following criteria: a) the species is presumed by the U.S. Fish and Wildlife Service (USFWS) to be extinct; b) the species no longer occurs in the US; or c) the species exists only in captivity. Species categorized as “presumed extinct” are often difficult to ascertain based on the frequent updates to information. It is possible that the effects determination for species in this category may change if new or different information becomes available.
“No Effect” determinations are made due to presumed extinction for 16 species including 5 species of birds, 2 species of mammals and 9 species of terrestrial invertebrates (APPENDIX 4-1).
4-3

Of the remaining 1819 listed species not presumed to be extinct, all remaining listed species overlap with the chlorpyrifos action area, and receive a “May Affect” determination and further consideration in Step 2. (APPENDIX 4-1). All 794 designated critical habitat locations co-occur within the action areas for chlorpyrifos, and receive a “May Affect” determination.
4 Effects Determinations of NLAA - No overlap
The Step 2 overlap analysis uses the results from the Step 1 analysis to calculate the percent overlap of the species range or its designated critical habitat with each use site included in the action area; see ATTATCHMENT 1-6 for results of the Step 1 and Step 2 analysis. Additional information on how the action area and use sites are developed can be found in ATTATCHMENT 1-3.
Species of interest are identified by determining percent of the ranges and/or designated critical habitats of listed species that overlaps directly with the areas of effect (i.e., potential use sites plus the spray drift effects area). In order to calculate the percent overlap, first the total use site acres within the species range is calculated from the total number of co-occurring use site raster cells (i.e., pixel size at the limit of resolution). To calculate the percent overlap, the total use site acres is divided by the total acres of the species range occurring within the spatial extent of the use site.
One known source of error within spatial datasets is positional accuracy and precision. The National Standard for Spatial Data Accuracy outlines the accepted method for calculating the horizontal accuracy of a spatial dataset (FGDC 1998)1. To prevent false precision when calculating area and the percent overlap, only two significant digits should be considered for decision purposes given the reported 60 meters of horizontal accuracy for the Cropland Data Layer (CDL).
An effects determination of “Not Likely to Adversely Affect” is reached for 13 species that were “presumed extinct” based on information gathered in review of the 5 year status review but did not meet the additional criteria to receive a no effect determination. “Not Likely to Adversely Affect” determinations are reached for 1 amphibian species, 8 species of birds, 3 species of mammals and 1 terrestrial invertebrate species s (APPENDIX 4-1). It is possible that the effect determination for species in this category may change if new information becomes available. Critical habitat for “presumed extinct” species was assessed further before making a determination specific to the critical habitat.
“Not Likely to Adversely Affect” determinations are made for species and/or critical habitats occurring exclusively on the uninhabited Northwestern Hawaiian Islands of Nihoa and Laysan Island. Based on the 2000 U.S Census, the human population of these islands is zero2. As a result, human presence on these islands is expected to be zero to extremely low and the potential exposure to chlorpyrifos is considered to be discountable. Consequently, “Not Likely to Adversely Affect” determinations were made for 4 birds species, and 2 flowering plants species found only on these islands and their associated critical habitat,and for the critical habitat for an additional flowering plant species (APPENDIX 4-1).
1 Federal Geographic Data Committee. FGDC-STD-001-1998. Content standard for digital geospatial metadata (revised June 1998). Federal Geographic Data Committee. Washington, D.C.2 Hawaii. Dept. of Business, Economic Development and Tourism. Research and Economic Analysis Division. Statistics and Data Support Branch. State of Hawaii data book; a statistical abstract. Honolulu: 2006.
4-4

Midway Islands, the pacific island coral atolls and Mona Island of Puerto Rico have low human populations ranging from 7-150 people, based on the 2000 U.S Census2. While human impact is expected to be low on these islands, the possibility of exposure is not discountable and the 5 species and/or critical habitats occurring exclusively on these islands are considered further.
Other Minor Outlaying U.S Islands such as, Wake Island, the additional Northwestern Hawaiian Islands and minor islands of Hawaii were also considered. However, none of the listed species occur exclusively in these locations. Therefore, exposure is not discountable based on location alone, and these species were considered further before making a determination.
A “Not Likely to Adversely Affect” determination is made for those species and/or designated critical habitats for which the use site (including off-site transport) and range overlap is less than 1% after rounding for significant digits. All species with 1% or greater overlap were assessed further before assigning an effects determination. A critical habitat determination may differ from the species determination when the critical habitat extends outside of the species range or the location and size increases the impact due to spray to 1% or greater.
All of the remaining 1800 species and 794 designated critical habitat locations have greater than 1% overlap and are assessed further before assigning an effects determination.
Species that only co-occur within the cattle ear tag footprint were assessed in the cattle ear tag analysis and excluded from this analysis; additional information on the cattle ear tag analysis can be found in section 7.6. Sea turtles, whales and deep sea fish, marine mammals (excluding whales), cave dwelling invertebrate species, lichens and pinnipeds and otters, were assessed in separate analyses and excluded from this analysis; additional information on these analyses can be found in section 7.
5 Effects Determinations of NLAA/LAA: Weight of Evidence Analysis
A weight-of-evidence (WoE) analysis, as described in Section 1.4.2.2 of the Problem Formulation, is used to make effects determinations on 1686 species and 763 critical habitats. The weight of evidence analysis was completed by producing “matrices” that capture the multiple lines of evidence. Direct effects considered for listed animals included effects on mortality, growth, reproduction, behavior and sensory function and indirect effects considered included impacts to prey/dietary items, habitat and obligate organisms. For plants, lines of evidence considered included mortality, growth, and reproduction and indirect effects considered included impacts to pollinators, habitat and obligate organisms. Additional lines of evidence addressing direct and indirect effects due to chemical mixtures and stressors and effects due to abiotic stressors (see ATTACHMENT 4-1) were also considered if an effects determination could not be reached based on the direct and indirect lines of evidence alone ( i.e., if LAA determination was reached based on the direct/indirect lines, analysis of additional data was not conducted). Depending on the species primary habitat, a terrestrial or aquatic weight of evidence matrix was completed. Some species life history dictated the need for both a terrestrial and aquatic weight of evidence matrix to be created to fully characterize potential risk to the species. If the listed species spent limited time in a different habitat, a second matrix was not developed; rather, an indication of the additional aquatic or terrestrial exposure was included in the primary matrix (e.g., the lower keys marsh rabbit, a terrestrial species which spends time in wetland/marsh environment). Information gathered from the species range, overlap with the chemical use patterns, dietary items, EECs for both terrestrial
4-5

and aquatic exposures, and indirect relationships and effects are integrated into each species matrix to make the determination of risk and confidence in data with a corresponding high, medium or low rating. Criteria used to determine if a line of evidence warrants a high, medium or low rating are described in ATTACHMENT 1-9. For designated critical habitats, any potential for direct or indirect effects to a listed species, based on the lines of evidence, are considered for the effects determination, regardless if the listed species is present within and/or currently inhabits the designated critical habitat (as not all designated critical habitats are currently occupied by individuals of a listed species).
Summary results for the species determinations based on the weight of evidence matrices are contained in APPENDIX 4-1 (‘Summary’ tab) and are denoted as either “TerrWoE”, “AquaWoE” or “TerrWoE and AquaWoE” as the source of the effects determination. Additional worksheets in APPENDIX 4-1 include total call counts for species, summary information on individual lines of evidence for each species and a key to file locations for each species. Detailed matrices for all species are located in APPENDIX 4-3, organized by species taxa and order. A detailed discussion of the weight of evidence matrices, including how exceedances of thresholds were determined and detailed discussion of each risk line, is included in ATTACHMENT 4-1. Criteria used to determine if a line of evidence warranted a high, medium or low rating are described in ATTACHMENT 1-9.
6 Effects Determinations of NLAA/LAA: Downstream Dilution
While exposure to pesticide use is evaluated near the range of the species taking into account use overlap, runoff, and spray drift from nearby fields, the impact of upstream contributions of pesticide use is assessed via the downstream dilution analysis. EPA does not currently have an approved flowing water model to allow for the evaluation of downstream processes (e.g., advection dispersion, turbulent mixing, aquatic degradation, etc.) over long stream distances. Instead, EPA uses the percent use area for watershed catchments as a surrogate for potential pesticide contributions and potential sources of dilution. More details of the approach and the discussion of the downstream dilution analysis are provided in APPENDIX 3-5.
Because of the widespread use of chlorpyrifos and the uncertainty with where the mosquito adulticide, wide area, and non-agricultural uses could occur, the entire United States is considered the action area for chlorpyrifos for Step 1. For Step 2, again due to the uncertainty with where the adulticide, wide area, and non-agricultural uses could occur, any of these uses could potentially occur in any watershed, resulting in pesticide contribution to a receiving stream, negating the need to assess downstream dilution for Step 2. A process is being developed to evaluate EECs in upstream reaches, as well as for the streams in the species ranges and critical habitat, for Step 3 in order to address the contribution of the upstream sources to the existing EECs.
7 Effects Determinations of NLAA/LAA: Qualitative Analyses
Not all listed species were included in the WoE effects determinations presented in Section 5. Section 7 contains the effect determinations for these listed species based on qualitative analyses. Potential risk to these listed species were assessed qualitatively because EPA does not currently have methods available to adequately estimate potential exposures for these species. In many cases, these species live exclusively (i.e., whales, deep fish) or primarily (i.e., sea turtles, marine mammals) in marine
4-6

environments, or are cave dwellers (invertebrate species). Other qualitative analyses focus on certain uses (i.e., cattle ear tag use, seed and granular treatment) for which reliable exposure methods are not available as current terrestrial methods are suited for foliar [flowable] applications.
7.1 Sea Turtle Analysis
This assessment considers the effects of chlorpyrifos on 9 listed species of sea turtles, including 2 listings of the loggerhead (different DPSs), 6 listings of the green, the leatherback, the hawksbill, kemp’s ridley and 2 listings of the olive ridley sea turtle. The biological information (e.g., diet, habitat) used in this assessment for each species is included in ATTACHMENT 1-14.
Sea turtles spend the vast majority of their lives in aquatic habitats. Hatchling, juvenile and adult sea turtles forage in offshore and nearshore coastal habitats, including estuaries3. Adult sea turtles use ocean habitats during the majority of their lives. In addition, green sea turtles use freshwater streams and rivers during part of their lifecycle. None of the other listed sea turtles use freshwater habitats. While in aquatic habitats, exposure to chlorpyrifos via contaminated dietary items is assessed (see Table 4-7.1 for dietary information per species). Other exposure routes (e.g., dermal) are not assessed in aquatic habitats because methods are not available to estimate exposures via non-dietary routes. Other routes of exposure are assessed in terrestrial habitats (i.e., beaches). Sea turtles utilize beaches to lay their eggs, while some species use beaches to bask. As a result, eggs, hatchlings and adults may be exposed to chlorpyrifos from spray drift transport from treatment sites that are adjacent to nesting sites. Exposure routes of concern include inhalation and dermal interception of spray droplets on the day of the application. Since sea turtles do not forage while on land, dietary exposure while in terrestrial habitats is not expected.
Table 4-7.1. Diet information for listed sea turtlesScientific Name Common Name Plants Invertebrates Fish
Caretta caretta Loggerhead sea turtle (North Pacific Ocean DPS) Yes Yes Yes
Caretta caretta Loggerhead sea turtle (Northwest Atlantic Ocean DPS) Yes Yes Yes
Chelonia mydas Green sea turtle (Central North Pacific DPS) Yes No No
Chelonia mydas Green sea turtle (Central South Pacific DPS) Yes No No
Chelonia mydas Green sea turtle (Central West Pacific DPS) Yes No No
Chelonia mydas Green sea turtle (East Pacific DPS) Yes No No
Chelonia mydas Green sea turtle (North Atlantic DPS) Yes No No
Chelonia mydas Green sea turtle (South Atlantic DPS) Yes No No
Dermochelys coriacea Leatherback sea turtle No Yes No
3 There are differences between the species in habitat use by life stage and some are primarily offshore during certain stages. For example, leatherback and olive ridley turtles spend the majority of their time as juveniles and adults in the open ocean and use the nearshore habitats far less frequently than other species. Habitat descriptions for each species can be found at http://www.nmfs.noaa.gov/pr/species/esa/listed.htm#turtles.
4-7

Scientific Name Common Name Plants Invertebrates FishEretmochelys imbricata Hawksbill sea turtle Yes Yes No
Lepidochelys kempii Kemp's ridley sea turtle No Yes No
Lepidochelys olivacea Olive ridley sea turtle (Mexican nesting population) Yes Yes Yes
Lepidochelys olivacea Olive ridley sea turtle Yes Yes Yes
This document provides the risk assessment used to assess exposures and potential effects to sea turtles on beaches and in their aquatic habitats. Indirect effects to prey and habitat are also assessed in aquatic habitats. Effects determinations for the species and their designated critical habitats are based on the risk assessments that integrate the weight of evidence based on exposure, available effects data and the uncertainties associated with these data.
Risk Assessment for Aquatic Habitats: Direct Effects
Dietary toxicity data
As indicated above, dietary exposure is assessed for aquatic habitats. There is only one dietary toxicity study available for reptiles exposed to chlorpyrifos. In this study (E159933) a NOAEC of 2.38 mg a.i./kg-diet was established based on brain cholinesterase inhibition in lacertid lizards (Podarcis bocagei) (this is a lower sublethal threshold than established in birds). As a result, toxicity data available for birds are used as a surrogate for reptiles for all but the sublethal threshold. For dietary exposure, the avian threshold for mortality and the sublethal threshold for reptiles are 1.6 and 2.38 mg a.i./kg-diet, respectively (see Table 2-5.2 of Chapter 2). Other endpoints considered in this analysis include the lowest avian LC50 (i.e., 203 mg a.i./kg-diet) and the NOEC and LOEC where effects to avian reproduction were observed (i.e., 25 and 125 mg a.i./kg-diet, respectively).
When considering bioaccumulation in aquatic organisms, pesticide uptake occurs through two routes: respiration of water and consumption (dietary) of contaminated food items. Bioaccumulation is limited by the extent to which a pesticide is eliminated (through respiration or fecal elimination) or metabolized to non-toxic degradates. Chlorpyrifos is not expected to accumulate over time in prey because it is not persistent in aqueous environments (Chapter 3), and is readily excreted and metabolized by animals4,5. For this assessment, respiration is considered the primary uptake and the BCF values for chlorpyrifos in aquatic plants, invertebrates and fish are used predict short term uptake of chlorpyrifos in aquatic organisms that represent the prey of listed sea turtles. In this approach, the BCF values for the three relevant food items are used to translate toxicity thresholds to aquatic concentrations that would constitute a potential risk from dietary exposure (the threshold is divided by the BCF). Since a BCF represents the ratio of the chemical concentration in animal tissue (mg a.i./kg-diet) to the concentration in water (mg a.i./L-water), this approach assumes that the threshold is equivalent to the chemical concentration in animal tissue.
4 In a 10-day chicken metabolism study, (MRID 00161743), recoveries of 88.4-94.5% of the total dose was found in the excreta. Residues did not accumulate in eggs (<0.05% of the total radioactivity). 5In a rat metabolism study (MRID 40458901), after 48 hours, 82% of the dose was eliminated via the urine as TCP and the glucuronide and sulfate conjugates of TCP.
4-8

As noted in Chapter 3 (exposure characterization), the KABAM6-estimated BCF for plants is 2407. This value is uncertain because it is based on a model estimate that does not account for metabolism of chlorpyrifos by plants. For aquatic invertebrates and fish, several empirically based values are available from different studies (3 invertebrate species, 6 fish species), leading to increased confidence in available values. Minimum, maximum and mean of empirical BCF values for aquatic invertebrates and fish are provided in Table 4-7.2. These BCFs were used to estimate aqueous concentrations sufficient to exceed the thresholds and endpoints where effects were observed (i.e., lowest LC50 and reproduction LOAEC). Given that these BCF values are based on steady state, it is necessary to compare EECs that are representative of the time to steady state for chlorpyrifos. Based on the Log Kow of chlorpyrifos (4.7), steady state is reached in approximately 16 days. Therefore, in this assessment, bounded water concentrations (using 4-day averages and 21-day averages) are compared to the values in Table 4-7.2.
Table 4-7.2. Aqueous concentrations defining dietary exposures of concern for sea turtles (all ages).
Food item Description of BCF
BCF value
Aqueous concentration (µg a.i./L) above which there is concern for dietary exposure
Mortality threshold
Lowest LC50
Sublethal threshold*
Lowest NOEC for
repro
Lowest LOEC for repro
Aquatic plants KABAM estimate 2407 1 84 1 10 52
Aquatic invertebrates
lowest of empirical 400 4 508 6 63 313
mean of empirical 585 3 347 4 43 214
highest of empirical 874 2 232 3 29 143
Fish
lowest of empirical 440 4 461 5 57 284
mean of empirical 1513 1 134 2 17 83
highest of empirical 5100 <0.01 40 <0.01 5 25
*Based on AChE inhibition
There is considerable uncertainty in using birds as surrogates for reptiles and lizards as surrogates for sea turtles as it is assumed that they will have similar responses to chlorpyrifos. The actual sensitivities of reptiles to chlorpyrifos relative to birds or lizards to sea turtles is unknown. Given that chlorpyrifos’ toxicity is attributed to metabolic transformation to the oxon degradate, differences in metabolic rates of birds and reptiles may lead to different sensitivities. Since birds are warm blooded and reptiles are cold blooded, it is expected that the metabolic rates of reptiles will be lower than those of birds. Limited data are available to examine the differences in toxicity of birds and cold-blooded species. Therefore, there is low confidence associated with the robustness and relevance of use of the available avian and reptile toxicity data as a surrogate for sea turtles.
Exposures in estuaries and near shore areas
6 Kow (based) Aquatic BioAccumulation Model. See Chapter 3 for discussion of how the plant BCF was estimated.
4-9

There is a great deal of uncertainty in estimating potential chlorpyrifos exposures in estuaries and near-shore areas of the ocean because the existing fate and transport models do not account for water stratification, tidal flux, and complex currents that occur in these habitats (i.e., bins 8 and 9). As noted in the problem formulation (Chapter 1), estimates developed for aquatic Bin 2 are used as surrogate exposure levels for intertidal nearshore waterbodies (Bin 8), and estimates developed using aquatic Bin 3 are used as surrogate exposure levels for subtidal nearshore waterbodies (Bin 9). Additionally, aquatic Bin 5 is used as a surrogate for tidal pools occurring during low tide (aquatic Bin 8). The 4-day average EECs for bins 2, 3, and 5, which include both runoff and drift, are 0.64 – 743, 0.72 – 1150, and 0.025-3,950 µg a.i./L, respectively (EECs are presented in APPENDIX 3-4; values based on HUCs 1-3, 8, 12, 13, 17-21, which are relevant to the species ranges). The 21-day average EECs for bins 2, 3, and 5, are 0.37 – 681, 0.24 – 932, and 0.016-1,460 µg a.i./L, respectively (based on HUCs 1-3, 8, 12, 13, 17-21). These 1-in-15 year 4-day and 21-day average EECs exceed several of the concentrations that represent threshold and endpoint exceedances listed in Table 4-7.2. Therefore, there is concern for potential direct effects to sea turtles exposed via diet while in estuaries and near shore habitats.
It should be noted that these estimates of exposure are highly conservative, since they represent the highest 4-day and 21-day average concentrations estimated in a 15 year period. They do not necessarily represent concentrations that would be considered likely in estuary and near shore areas. In addition, there is a high degree of uncertainty related to the representativeness of bins 2, 3, and 5 for estuaries. It is questionable whether bin 2, which is a small water body has sufficient volume to hold an adult sea turtle.
EECs resulting from drift only transport into estuaries are provided in Tables 4-7.3 (ground spray applications of 6 lb a.i./A) (max single application rate) and 4-7.4 (aerial application of 4 lb a.i./A) (max single application rate). For bins 2 and 5, located within several hundred meters of treatment sites, EECs are at levels that pose a risk to turtles.
Table 4-7.3. Aquatic EECs (µg a.i./L) resulting from spray drift from ground application at 6 lb a.i./A. Distances represent different distances between application site and water body. EECs are instantaneous values.
Distance (m)EEC by Bin
2 3 4 50 4846 227 33 5491
30 170 15 5 17360 76 7 3 7790 47 4 2 47
120 33 3 1 33150 25 2 1 25180 20 2 0.9 20210 17 2 0.7 17240 14 1 0.6 14270 12 1 0.5 12300 11 1 0.5 11304 11 1 0.5 11
4-10

Table 4-7.4. Aquatic EECs (µg a.i./L) resulting from spray drift from aerial application at 4 lb a.i./A. Distances represent different distances between application site and water body. EECs are instantaneous values.
Distance (m)EEC by Bin
2 3 4 50 2735 230 66 2825
30 944 89 33 95360 603 58 24 60790 452 44 19 454
120 365 36 15 367150 309 30 13 309180 268 26 12 269210 238 24 11 238240 214 21 10 215270 195 19 9 196300 180 18 8 180304 178 18 8 178330 167 166 8 167360 156 155 7 156390 146 145 7 146420 138 137 6 138450 130 129 6 130480 124 123 6 124510 118 117 5 118540 112 112 5 113570 108 107 5 108600 103 103 5 103630 99 99 5 99660 96 95 4 96690 92 92 4 92720 89 89 4 89750 86 86 4 86780 84 83 4 84793 82 82 4 82
Exposures in Off-Shore Habitats
It is expected that, given the large volume of water in oceans, and the lack of persistence of chlorpyrifos, this chemical will be sufficiently diluted to not be of concern for adult sea turtles in deep water ocean habitats. In addition, since chlorpyrifos is readily metabolized and does not accumulate in aquatic organisms, exposure via consumption of aquatic plants, invertebrates, and fish is not of concern.
It should be noted that this approach differs from that taken above for smaller, near shore habitats (e.g., estuaries). In these areas, short term concentration of chlorpyrifos in aquatic prey of sea turtles is
4-11

considered because concentrations may be higher in water and chlorpyrifos could concentrate for a short term period in prey of sea turtles. The use of empirically based bioconcentration factors allows for consideration of metabolism and for uptake in prey (fish, invertebrates) via the major route of exposure (i.e., respiration).
Exposures in freshwater environments (for Green Sea Turtle only)
Aquatic bins that are used as surrogates for estimating exposures to green sea turtles in freshwater habitats are bins 3 and 4 (ATTACHMENT 1-10). The 1-in-15 year 4-day average EECs, which include both runoff and drift, derived for these bins are on the order of 0.72 – 1150 and 0.6 – 1180 ug a.i./L (Bin 3 and 4 EECs are presented in APPENDIX 3-4; values based on HUCs 1-3, 8, 12, 13, 17-21). The 1-in-15 year 21-day average EECs derived for bins 3 and 4 are 0.24 – 932 and 0.23 – 843 ug a.i./L, respectively. Both the 1-in-15 year 4-day and 21-day average EECs exceed several of the concentrations that represent threshold and endpoint exceedances listed in Table 4-7.2. Therefore, there is concern for potential direct effects to green sea turtles exposed via diet while in freshwater habitats.
Risk Assessment for Aquatic Habitats: Indirect Effects
Table 4-7.5 summarizes the thresholds used to assess indirect effects to sea turtles through impacts to diet (aquatic plants, invertebrates and fish) or habitat (plants). Details of how these values were derived are provided in Chapter 2.
Table 4-7.5. Thresholds for indirect effects (µg a.i./L).Taxa Mortality threshold Sublethal thresholdAquatic plants 140 140Aquatic invertebrates 0.0125 0.0003Fish 0.355 0.251
For estuaries and near shore ocean habitats, 1-in-15 year average daily EECs estimated for bins 2, 3, and 5 are on the order of 2 – 13,600 µg a.i./L (capped at chlorpyrifos’ solubility limit) (EECs for bins 2, 3, and 5 are presented in APPENDIX 3-4,). These values are above thresholds for mortality and sublethal thresholds for aquatic plants, aquatic invertebrates and fish (Table 4-7.5).
For sea turtles in the off shore habitats, indirect effects due to loss of prey or habitat are not expected. This is due to the effect of dilution in deep water ocean environments in which the adult sea turtles are found.
For freshwater habitats used by the green sea turtle, 1-in-15 year average daily EECs estimated for bins 3 and 4 are on the order of 2 - 13,600 ug a.i./L (capped at chlorpyrifos’ solubility limit). These values are above thresholds for mortality and sublethal thresholds for aquatic invertebrates, fish, and plants suggesting indirect effects may occur due to possible reductions in these resources (Table 4-7.5).
Risk Assessment for Terrestrial Habitats (i.e., Beaches)
Spray drift transport from use sites adjacent to beaches could potentially result in exposures to eggs, hatchlings (leaving the nest; dermal exposure) and adults (laying eggs or basking; dermal exposure).
4-12

When considering exposures to eggs, no toxicity data are available where reptile or bird eggs were exposed to chlorpyrifos. Although there is a potential for chlorpyrifos exposure to eggs, the likelihood of this type of exposure is expected to be low for various reasons, including: 1) sea turtle nests are unlikely to be located near treated fields as these areas are likely to be disturbed, 2) it is expected that spray drift deposition will be intercepted by sand that covers sea turtle nests, substantially decreasing the exposure of eggs to chlorpyrifos transported via spray drift; and 3) since eggs are laid most frequently at night and most chlorpyrifos applications are assumed to occur during the day, eggs are not expected to be uncovered at times when spray drift exposure is most likely to occur. Therefore, although risk to sea turtle eggs from the use of chlorpyrifos cannot be precluded, the potential for risk is considered low because of the low potential for exposure.
Regarding the risks associated with dermal exposure to hatchlings and adults, toxicity data are not available for dermal exposures involving reptiles or birds for chlorpyrifos. However, in order for an exposure to occur, the application must occur either on the day when turtles are basking, when a female lays eggs or when the hatchlings leave the nest. Additionally, there is uncertainty associated with the likelihood of exposure because on the day of application, chlorpyrifos would have to be transported by wind blowing from the application site toward the beach. Table 4-7.6 provides a summary of the percentage of time the wind is blowing from a certain direction at different locations. These data suggest that prevailing winds blow from inland toward the ocean up to 30% of the time (independent of when chlorpyrifos is likely to be applied). Furthermore, the duration of potential exposures would be limited. For hatchlings, the potential for dermal exposures would only occur during their movement from their nesting site to the water – which occurs fairly rapidly (for predator avoidance). Once in the water, it is expected that any residues not immediately absorbed would be washed off. For females that are laying eggs, potential dermal exposures would occur for one night during their movement from the water to the nesting site, and then from the nesting site to the water. The number of clutches laid per year varies by species (e.g., Loggerhead and green sea turtles nest 2-5 times per year, Leatherbacks will nest 7-10 times per year), so, there may be differences in the likelihood of exposure among species. Taken together, the chances of dermal exposure to chlorpyrifos and resulting effects, although they cannot be precluded, are expected to be low.
Table 4-7.6. Wind Direction Percentage Summary for meteorological stations on the coast of the Continental US.
Station North South East WestEast Coast
Miami FL 24 23 40 12*Vero Beach FL 15 21 31 15*Charleston SC 24 25 20 25*Wilmington NC 24 22 18 25*Norfolk VA 25 26 21 24*Atlantic City NJ 26 22 14 29*Boston MA 26 17 17 39*Portland ME 30 24 13 31*
West CoastSan Diego CA 33 18 8* 33
Santa Barbara CA 11* 23 17 26
San Francisco CA 25 13 10* 48
4-13

Station North South East WestAstoria OR 15 26 25* 28
Source: EPA’s SCRAM website (http://www3.epa.gov/ttn/scram/surfacemetdata.htm). North – 304 to 34 degrees, East – 34 to 124 degrees, South – 124 to 214 degrees, West – 214 to 304 degrees*Winds blow from inland toward the ocean. Due to calm winds (winds < 1 m/s), where wind directions can be uncertain; percentages may not sum to 100%.
Inhalation exposures to hatchlings and adults
Toxicity data are not available for inhalation exposures involving reptiles nor are data available for the typical surrogate taxa (i.e., birds). In an acute inhalation study with laboratory rats, no mortality was observed at 0.2 mg a.i./mL-air, which is equivalent to 200 mg/m3 (MRID 00146507). Two subchronic inhalation toxicity studies (MRIDs 40013901, 40166501, 40908401) in the rat are available using vapor phase chlorpyrifos which show no ChE effects up to a concentration of 20.6 ppb (287 μg/m3 or 0.082 mg/kg/day). In a special acute inhalation study (MRID 48139303), exposure to particulate chlorpyrifos for six hours with 72 hour recovery resulted in significant lung ChE inhibition at the lowest concentration tested of 3.7 mg/m3 (3700 μg/m3), which is a LOAEL. Additionally, two acute inhalation studies on the saturated vapor phase have been performed on the parent chlorpyrifos and chlorpyrifos oxon (MRID 49119501 and 49210101, respectively). In these studies, female rats were exposed for 6 hours to chlorpyrifos or its oxon at concentrations of 17.7 ppb (254 μg/m3) or 2.58 ppb (35.3 μg/m3). There were no statistically-significant decreases in ChE activity in the RBC, lung, brain or plasma tissues. These acute studies along with the subchronic inhalation studies with vapor phase chlorpyrifos support low toxicity from acute exposure to the saturated vapor of chlorpyrifos or its oxon. The relative sensitivities of reptiles and mammals are unknown, leading to uncertainty associated with the representativeness of the available toxicity data for sea turtles. However, based on the limited available data, inhalation exposure is not considered to be of concern.
Effects Determinations
The effect determination is “likely to adversely affect” (LAA) based on exposures in near shore saltwater habitats (for all listed sea turtles) and freshwater habitats (for the green sea turtle) for direct effects through dietary exposure and indirect effects through impacts to prey. There is also some concern for risk due to dermal exposures resulting from spray drift transport to adult and juvenile turtles on beaches. Although there is a high degree of overlap of exposure estimates and thresholds and other toxicity endpoints (i.e., “high risk”), the confidence associated with the LAA determination is low due to uncertainties associated with the available toxicity data and the exposure estimates. In cases where critical habitat has been designated for a listed sea turtle, an LAA determination is also made for the critical habitat, based on the same considerations for direct and indirect effects (Table 4-7.7).
4-14

Table 4-7.7. Summary of the Effects Determinations for Chlorpyrifos and Listed sea turtles and Their Designated Critical Habitat(s).
Scientific Name
Common Name
Listing Status
*
FWS/NMFS Specie
s ID
Risk (Direct Effects)
Confidence (Direct Effects)
Risk (Indirec
t Effects)
Confidence (Indirect Effects)
Species Call?
Critical Habitat Call?
Caretta caretta
Loggerhead sea turtle
(North Pacific Ocean DPS)
E 9941 High Low High Low LAA NA**
Caretta caretta
Loggerhead sea turtle(Northwest
Atlantic Ocean DPS)
T 9707 High Low High Low LAA LAA
Chelonia mydas
Green sea turtle
(Central North Pacific DPS)
T 168 High Low High Low LAA LAA
Chelonia mydas
Green sea turtle
(Central South Pacific DPS)
E 169 High Low High Low LAA LAA
Chelonia mydas
Green sea turtle
(Central West
Pacific DPS)
E 170 High Low High Low LAA LAA
Chelonia mydas
Green sea turtle (East
Pacific DPS)
T 167 High Low High Low LAA LAA
Chelonia mydas
Green sea turtle (North Atlantic
DPS)
T 171 High Low High Low LAA LAA
Chelonia mydas
Green sea turtle (South Atlantic
DPS)
T 172 High Low High Low LAA LAA
Dermochelys coriacea
Leatherback sea turtle E 154 High Low High Low LAA LAA
4-15

Eretmochelys imbricata
Hawksbill sea turtle E 153 High Low High Low LAA LAA
Lepidochelys kempii
Kemp's ridley sea
turtleE 155 High Low High Low LAA NA**
Lepidochelys olivacea
Olive ridley sea turtle(Mexican nesting
population)
E 5989 High Low High Low LAA NA**
Lepidochelys olivacea
Olive ridley sea turtle T 160 High Low High Low LAA NA**
*E = endangered, T = threatened**Not applicable because critical habitat has not been designated for this species.
7.2 Whale and Deep Sea Fish Analysis
7.2.1. Cetaceans
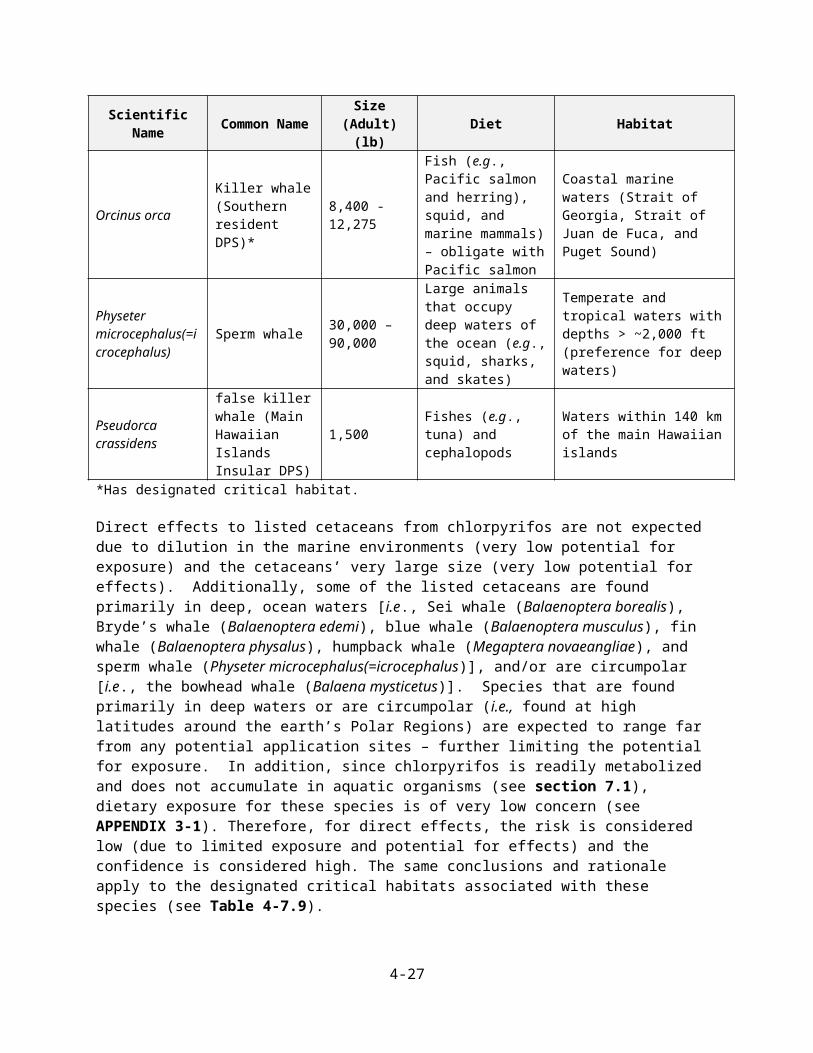
There are currently 11 cetaceans found in the U.S. that are federally listed as endangered or threatened or that are candidates for listing (i.e., Balaena mysticetus, Balaenoptera borealis, Balaenoptera edeni, Balaenoptera musculus, Balaenoptera physalus, Delphinapterus leucas, Eubalaena glacialis, Eubalaena japonica, Megaptera novaeangliae, Orcinus orca, Physeter microcephalus(=icrocephalus), and Pseudorca crassidens) (see Table 4-7.8 and ATTACHMENT 1-13 for details). Four of these species have designated critical habitat(s) (i.e., Delphinapterus leucas, Eubalaena glacialis, Eubalaena japonica, and Orcinus orca). All of these species are large mammals (ranging from 1,500 to 320,000 lb) and are found entirely in marine environments. Because EPA does not currently have methods available to adequately estimate potential exposures to listed cetaceans, potential risks to listed cetaceans are assessed qualitatively. Additionally, because it is not possible with current methodologies to adequately estimate exposures for these species, the effects determinations will be based on weighting for general risks and confidence (i.e., it is not possible to apply weights for risk and confidence associated with each specific line of evidence).
TABLE 4-7.8. Listed Cetacean Species (Found in the US).Scientific Name Common Name Size (Adult)
(lb) Diet Habitat
Balaena mysticetus Bowhead whale 150,000 –
200,000
Invertebrates (e.g., krill, copepods, amphipods) and fish
Circumpolar (summer in ice-free waters adjacent to the Arctic Ocean, and are otherwise associated with sea ice)
Balaenoptera borealis Sei whale 100,000
Invertebrates (e.g., copepods, krill, and cephalopods) and small-schooling fish
Subtropical to subpolar waters; usually found in deeper waters of oceanic areas far from the coastline
Balaenoptera edeni
Bryde’s whale 90,000 Plankton (like krill and copepods), crustaceans (like red
Circumglobal (tropical, subtropical, and temperate ocean waters from 40o South
4-16

Scientific Name Common Name Size (Adult) (lb) Diet Habitat
crabs and shrimp), schooling fish (like anchovies, herring, mackerel, pilchards, and sardines)
to 40o North)
Balaenoptera musculus Blue whale 320,000 Krill and pelagic crabs Marine waters (primarily
offshore distribution)
Balaenoptera physalus Fin whale 165,000
Pelagic crustaceans (e.g., krill) and schooling fish (e.g., herring)
Marine waters (globally)
Delphinapterus leucas
Beluga whale (Cook Inlet DPS)* 3,000 - 3,300
Marine invertebrates (e.g., crabs, shrimp, clams) and marine and anadromous fish (e.g., cod and salmon)
Circumpolar (found in shallow coastal waters; spend the ice-free months in the upper Cook Inlet, and expand their distribution south into more offshore waters of the middle Cook Inlet)
Eubalaena glacialis North Atlantic Right Whale* 140,000
Copepods and other small invertebrates (e.g., krill)
Primarily found in coastal or shelf waters in temperate to subarctic latitudes, but may go into deeper waters
Eubalaena japonica
North Pacific Right Whale* 140,000
Zooplankton (i.e., copepods, euphausids, and cyprids)
Shallow coastal waters. Though movements over deep waters are known to occur
Megaptera novaeangliae Humpback whale 77,000
Small schooling fish (e.g., herring) and large zooplankton (e.g., krill)
Marine waters over and near edges of continental shelves throughout all ocean basins
Orcinus orcaKiller whale (Southern resident DPS)*
8,400 - 12,275
Fish (e.g., Pacific salmon and herring), squid, and marine mammals) – obligate with Pacific salmon
Coastal marine waters (Strait of Georgia, Strait of Juan de Fuca, and Puget Sound)
Physeter microcephalus(=icrocephalus)
Sperm whale 30,000 – 90,000
Large animals that occupy deep waters of the ocean (e.g., squid, sharks, and skates)
Temperate and tropical waters with depths > ~2,000 ft (preference for deep waters)
Pseudorca crassidens
false killer whale (Main Hawaiian Islands Insular DPS)
1,500 Fishes (e.g., tuna) and cephalopods
Waters within 140 km of the main Hawaiian islands
*Has designated critical habitat.
Direct effects to listed cetaceans from chlorpyrifos are not expected due to dilution in the marine environments (very low potential for exposure) and the cetaceans’ very large size (very low potential for effects). Additionally, some of the listed cetaceans are found primarily in deep, ocean waters [ i.e., Sei whale (Balaenoptera borealis), Bryde’s whale (Balaenoptera edemi), blue whale (Balaenoptera musculus), fin whale (Balaenoptera physalus), humpback whale (Megaptera novaeangliae), and sperm
4-17

whale (Physeter microcephalus(=icrocephalus)], and/or are circumpolar [i.e., the bowhead whale (Balaena mysticetus)]. Species that are found primarily in deep waters or are circumpolar (i.e., found at high latitudes around the earth’s Polar Regions) are expected to range far from any potential application sites – further limiting the potential for exposure. In addition, since chlorpyrifos is readily metabolized and does not accumulate in aquatic organisms (see section 7.1), dietary exposure for these species is of very low concern (see APPENDIX 3-1). Therefore, for direct effects, the risk is considered low (due to limited exposure and potential for effects) and the confidence is considered high. The same conclusions and rationale apply to the designated critical habitats associated with these species (see Table 4-7.9).
For indirect effects (i.e., reductions in whales’ prey), due to the effect of dilution in the types of marine environments in which the listed cetaceans are found and distance from potential use sites, risks from the potential loss of marine invertebrate and vertebrate prey are not expected. Therefore, for the listed cetaceans that rely wholly on marine prey [i.e., bowhead whale, Bryde’s whale, Sei whale, blue whale, fin whale, North Atlantic right whale, North Pacific right whale, humpback whale, sperm whale, false killer whale (Main Hawaiian Islands Insular DPS)], indirect effects from the potential loss of prey are not expected. For these species the risk for indirect effects is considered low (due to limited exposure) and the confidence is considered high. The same conclusions and rationale apply to the designated critical habitats associated with these species. Therefore, a “Not Likely to Adversely Affect” (NLAA) effects determination is made for the bowhead whale, Bryde’s whale, Sei whale, blue whale, fin whale, North Atlantic right whale, North Pacific right whale, humpback whale, sperm whale, false killer whale (Main Hawaiian Islands Insular DPS), and for the designated critical habitat associated with the North Atlantic Right Whale DPS and the North Pacific Right Whale DPS.
There are currently two listed species of cetaceans that feed on both marine and anadromous prey items - Beluga whale (Cook Inlet DPS) and the killer whale (Southern resident DPS). The Beluga whale relies on a variety of aquatic invertebrate and vertebrate prey items. Many of its prey species are wholly marine, while some of its fish prey are anadromous species. While many Beluga whales are circumpolar, the Cook Inlet DPS of Beluga whales is found primarily in the Cook Inlet (off the Gulf of Alaska in Southcentral Alaska). These Beluga whales are found in both shallow coastal areas and in deeper waters, depending on the time of year. Although, there are some potential chlorpyrifos use sites found in Southcentral Alaska, they are limited and largely removed from coastal areas. A limited amount of land is used for grains and fruits and vegetables, based on USDA’s census of agriculture data for Alaska (2012). Most of these crops are grown in the interior of the state (e.g., near Fairbanks). Although, there are some potential chlorpyrifos use sites found in Southcentral Alaska (e.g., forage (hay, alfalfa)), they are limited and largely removed from coastal areas7. Therefore, the likelihood that exposures will reach the estuarine/marine environments at concentrations high enough to impact a large marine mammal, such as a Beluga whale, is expected to be very low. Furthermore, as stated earlier, since chlorpyrifos is readily metabolized and does not accumulate in aquatic organisms, dietary exposure for this species is of very low concern. Therefore, direct effects from the use of these chemicals are not expected. Additionally, the Beluga whales rely on several prey items (most of which are wholly marine), and, the potential use sites are limited and largely removed from coastal areas. Because of these factors, for the Beluga whale the risk for indirect effects is considered low (due to limited exposure potential) and the confidence is considered high. The same conclusions and rationale apply to the designated critical habitat associated with this species. Therefore, a “Not Likely to Adversely Affect” (NLAA) effects determination is made for the Beluga whale and its designated critical habitat.
7 An overlap analysis was not conducted for aquatic species, therefore, the extent of overlap in ranges and potential chlorpyrifos use sites is not available.
4-18

The killer whale (Southern resident DPS), is found in the Strait of Georgia, Strait of Juan de Fuca, and Puget Sound, and is an obligate with Pacific salmon (which are anadromous). As discussed previously, direct effects to listed killer whales are not expected. However, because the Pacific salmon, on which the killer whales depend, may be exposed to and adversely impacted by chlorpyrifos in the Pacific Northwest before reaching the marine environment (see APPENDIX 4-3) for details on the potential for indirect effects associated with fish prey), there is a potential for indirect effects to this species due to a loss of prey items. Because the listed killer whales are obligates with Pacific salmon, the potential risk associated with a loss of this prey item is considered high, and the confidence is considered high (see APPENDIX 4-3). The same conclusions and rationale apply to the designated critical habitat associated with this species. Therefore, a “Likely to Adversely Affect” (LAA) determination is made for the killer whale (Southern resident DPS) and its designated critical habitat from the use of chlorpyrifos based on indirect effects (i.e., potential impacts to prey).
4-19

Table 4-7.9. Summary of the Effects Determinations for Chlorpyrifos and Listed Cetaceans and Their Designated Critical Habitat(s).
Scientific Name Common Name
Listing Status* FWS/NMFS
Species ID
Risk (Direct Effects)
Confidence (Direct Effects)
Risk (Indirect Effects)
Confidence (Indirect Effects)
Species Call?
Critical Habitat Call?
Balaena mysticetus Bowhead whale E 3133 Low High Low High NLAA NA**Balaenoptera borealis Sei whale E 1769 Low High Low High NLAA NA**Balaenoptera edemi Bryde’s whale C 178 Low High Low High NLAA NA**Balaenoptera musculus Blue whale E 3199 Low High Low High NLAA NA**
Balaenoptera physalus Fin whale E 3096 Low High Low High NLAA NA**
Delphinapterus leucas Beluga whale (Cook Inlet DPS) E 10144 Low High Low High NLAA NLAA
Eubalaena glacialis North Atlantic Right Whale E 2510 Low High Low High NLAA NLAAEubalaena japonica North Pacific Right Whale E 10145 Low High Low High NLAA NLAAMegaptera novaeangliae Humpback whale E 5623 Low High Low High NLAA NA**
Orcinus orca Killer whale (Southern resident DPS) E 9126 Low High High Medium LAA LAA
Physeter microcephalus(=icrocephalus)
Sperm whale E 4719 Low High Low High NLAA NA**
Pseudorca crassidensFalse killer whale (Main Hawaiian Islands Insular DPS)
E 10700 Low High Low High NLAA NA**
*E = endangered; C = candidate species**Not applicable because critical habitat has not been designated for this species.
4-20

7.2.2. Sharks
There is currently one listed shark species (including three DPSs found in US waters) [i.e., the scalloped hammerhead shark (Eastern Pacific DPS; Central and Southwest Atlantic DPS, and Indo-West Pacific DPS) (Sphyrna lewini)] and three candidate shark species found in the US [i.e., the cusk shark (Brosme brosme); oceanic whitetip shark (Carcharhinus longimanus); and porbeagle shark (Lamna nasus)] (Table 4-7.10). None of these species have designated critical habitat. All four of the species (including all three scalloped hammerhead shark DPSs) are found entirely in marine environments. Because EPA does not currently have methods available to adequately estimate potential exposures to ocean-dwelling species, potential risks to listed sharks are assessed qualitatively, and the effects determinations will be based on weighting for general risks and confidence (i.e., it is not possible to apply weights for risk and confidence associated with each specific line of evidence).
TABLE 4-7.10. Listed and Candidate Shark Species (Found in the US).Scientific Name Common Name Diet Habitat
Sphyrna lewini
Scalloped hammerhead shark (Eastern Pacific DPS)
Crustacean, teleosts, cephalopods, and rays
Coastal pelagic species that can also be found in ocean waters (to depths up to 1,000 m); found in temperate and tropical seas
Scalloped hammerhead shark (Central and Southwest Atlantic DPS)Scalloped hammerhead shark (Indo-West Pacific DPS)
Brosme brosme Cusk sharkCrustaceans, fish, and echinoderms
Marine; deep water with depths > 100m and water temperatures of 30 to 50oF
Carcharhinus longimanus Oceanic whitetip shark
Fish, sea turtles, sea birds, gastropods, squid, crustaceans, and mammalian carrion (dead whales and dolphins)
Usually found offshore in waters >600 ft deep
Lamna nasus Porbeagle shark Fish and squids Usually found offshore
Direct effects to the listed and candidate sharks from chlorpyrifos are not expected due to dilution in the marine environments (very low potential for exposure). Additionally, the cusk, oceanic whitetip, and porbeagle sharks are only (or primarily) found in deep waters and, thus, are expected to range far from any potential application sites – further limiting the potential for exposure. In addition, since chlorpyrifos is readily metabolized and does not accumulate in aquatic organisms, dietary exposure for shark species is of very low concern. Therefore, for direct effects, the risk is considered low (due to limited exposure and potential for effects) and the confidence is considered high (see Table 4-7.11).
For indirect effects (i.e., reductions in sharks’ prey), due to the effect of dilution in the types of marine environments in which the listed sharks are found, risks from the potential loss of marine invertebrate
4-21

and vertebrate prey are not expected. Therefore, for the listed and candidate sharks, which rely wholly on marine prey, indirect effects from the potential loss of prey are not expected. For these species the risk for indirect effects is considered low (due to limited exposure) and the confidence is considered high. Therefore, a “Not Likely to Adversely Affect” (NLAA) effects determination is made for the scalloped hammerhead shark (Eastern Pacific DPS; Central and Southwest Atlantic DPS; and Indo-West Pacific DPS),the cusk shark, the oceanic whitetip shark, and the porbeagle shark.
4-22

Table 4-7.11. Summary of the Effects Determinations for Chlorpyrifos and Listed and Candidate Sharks.
Scientific Name Common Name Listing Status* ID number
Risk (Direct Effects)
Confidence (Direct Effects)
Risk (Indirect Effects)
Confidence (Indirect Effects)
Species Call?
Critical Habitat Call?
Sphyrna lewini Scalloped hammerhead shark (Eastern Pacific DPS) E 10733 Low High Low High NLAA NA**
Sphyrna lewini Scalloped hammerhead shark (Central and Southwest Atlantic DPS)
E 10734 Low High Low High NLAA NA**
Sphyrna lewini Scalloped hammerhead shark (Indo-West Pacific DPS) T 10736 Low High Low High NLAA NA**
Brosme brosme Cusk shark C NMFS137 Low High Low High NLAA NA**Carcharhinus longimanus Oceanic whitetip shark C NMFS175 Low High Low High NLAA NA**
Lamna nasus Porbeagle shark C NMFS176 Low High Low High NLAA NA***E = endangered, T = threatened, C = candidate**Not applicable because critical habitat has not been designated for this species.
4-23

7.3 Marine Mammals (excluding Whales) Analysis
This assessment considers the effects of chlorpyrifos on 11 listed species of seals, sea lion, and walrus (pinnipeds), sea otters (mustelids), a manatee (sirenid) and the polar bear (Table 4-7.12). The biological information (e.g., diet, habitat) used in this assessment for each species is included in ATTACHMENT 1-13. This assessment does not consider listed whales (cetaceans) (see Section 7.2.1 for the listed whale assessment).
Table 4-7.12. Listed pinniped, mustelid and other marine mammal species considered in this analysis.
Scientific Name Common NameListing Status
*
Critical Habitat?
FWS/NMFS Species ID
(ENTITY_ID)Arctocephalus townsendi Guadalupe fur seal T No 3318
Enhydra lutris kenyoni Northern sea otter (Southwest Alaska DPS) T Yes 5232
Enhydra lutris nereis Southern sea otter T No 45Erignathus barbatus Bearded Seal (Beringia) T No 10381Eumetopias jubatus Steller sea lion (Western DPS) E Yes 7115Neomonachus schauinslandi Hawaiian monk seal E Yes 2891Odobenus rosmarus ssp. Divergens Pacific walrus C No 9709
Phoca largha Spotted seal (Southern DPS) T No NMFS182Phoca vitulina richardii Pacific harbor seal (Iliamna lake) C No NMFS159Trichechus manatus West Indian Manatee E Yes 7Ursus maritimus Polar bear T No 8861
*E=endangered; T=threatened, C = candidate
Species-specific exposures to chlorpyrifos are determined based on habitat use. All of the species considered here utilize marine habitats, especially to forage. Manatees and Steller sea lions forage in freshwater, as well as marine, habitats. While in aquatic habitats, exposure to chlorpyrifos via contaminated dietary items is assessed. Other exposure routes (e.g., dermal) are not assessed in aquatic habitats because methods are not available to estimate exposures via non-dietary routes. When considering the pinnipeds and mustelids, all 9 listed species consume invertebrates (e.g., cephalopods, crabs) that are considered benthic. All 9 species also consume fish. In addition, one species (Steller sea lion) eats birds and marine mammals. The pacific walrus also eats marine mammals (seals). The polar bear primarily consumes marine mammals, such as seals. The manatee is unique among the marine mammals in that it is an herbivore, consuming algae and aquatic plants. This species is also unique in that it forages in freshwater, as well as marine, habitats. With the exception of the manatee, all of the species assessed here also utilize terrestrial habitats, especially for breeding. Exposure routes of concern in terrestrial habitats include inhalation and dermal interception of spray droplets on the day of the application. Table 4-7.13 summarizes the diets and habitats of the species included in this assessment.
4-24

Table 4-7.13. Summary of diets and habitats of listed marine mammals included in this assessment.Listed species Habitat(s) DietSeals (pinnipeds) and sea otters (mustelids)
terrestrial (haul-outs), intertidal nearshore, subtidal nearshore Benthic invertebrates, fish
Steller sea lion and Pacific walrus (pinnipeds)
terrestrial (haul-outs), intertidal nearshore, subtidal nearshore, and offshore marine
Benthic invertebrates, fish, marine mammals, birds
Polar bearterrestrial, intertidal nearshore, subtidal nearshore, and offshore marine, offshore marine
Marine mammals
Manatee freshwater habitats, marine nearshore, subtidal nearshore, offshore marine Algae, aquatic plants
This qualitative analysis provides the risk assessment used to assess exposures and potential effects to marine mammals (excluding whales) in their aquatic and terrestrial habitats. Indirect effects to prey and habitat are also assessed in aquatic habitats. Effects determinations for the species and their designated critical habitats are based on the risk assessments that integrate the weight of evidence based on exposure, available effects data and the uncertainties associated with these data.
Risk Assessment for Aquatic Habitats: Direct Effects
Dietary toxicity data
As indicated above, dietary exposure is assessed for aquatic habitats. Dose-based mammalian thresholds reported in Chapter 2 are converted to dietary based values8 using standard laboratory conversion factors (6.67x for mice and 20x for rats, WHO 20099). These values are included in Table 4-7.14. These values are used in combination with BCF values for aquatic prey in order to calculate aquatic concentrations that would constitute a potential risk from dietary exposure. In this approach, the threshold or endpoint (dietary based) is divided by the BCF. Since a BCF represents the ratio of the chemical concentration in animal tissue (mg a.i./kg-diet) to the concentration in water (mg a.i./L-water), this approach assumes that the threshold is equivalent to the chemical concentration in animal tissue.
8 Given the uncertainty in scaling the toxicity value across 2-6 orders of magnitude, dose-based exposures are not generated. Concentration-based exposures are compared directly to available concentration-based dietary toxicity endpoints.9 World Health Organization. 2009. Principles and methods for the risk assessment of chemicals in food, Annex 2, dose conversion table. Environmental health criteria 240.
4-25
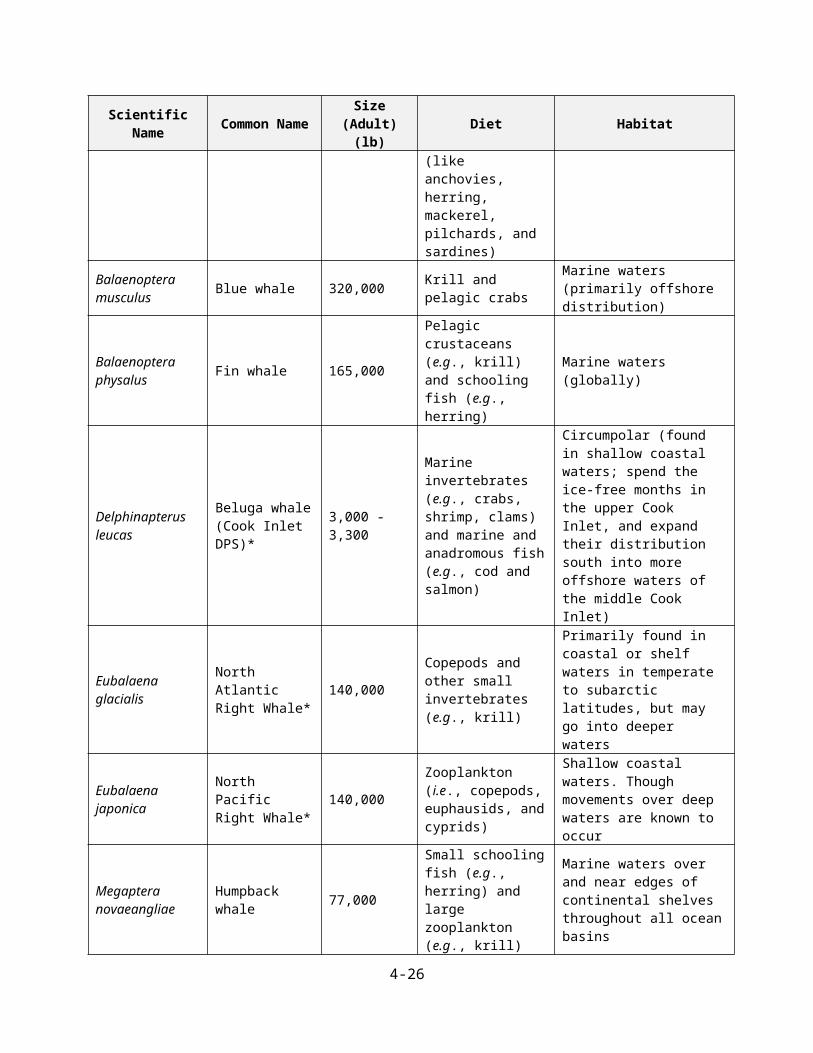
Table 4-7.14. Dietary based endpoint values calculated from dose-based thresholds and endpoints.
Threshold or
endpointEffect
Dose-based Value (mg a.i./kg-bw)
Dietary-based value (mg a.i./kg-
food)*
Test species Source
Direct (1/million) Mortality 5.2 34.7
Mouse(Mus musculus)
Based on LD50 = 60 mg/kg-bw, slope = 4.5; E93364Indirect
(1/10) Mortality 31 206.8
LD50 Mortality 60 400
DirectSublethal
(AChE inhibition)
0.03 0.6Rat
(Rattus norvegicus)
Based on RBC Cholinesterase inhibition;
MRID 44556901,MRID 44648101 and MRID
48139301IndirectSublethal
(AChE inhibition)
0.5 10
Direct and indirect
Reproduction NOEC 1 20 Rat
(Rattus norvegicus)E82431
Reproduction LOEC 5 100
*Calculated using standard laboratory conversion factors of 6.67x for mice and 20x for rats (WHO 2009). AChE = acetyl-cholinesterase**See chapter 2 for additional information on these data. When considering bioaccumulation in aquatic organisms, pesticide uptake occurs through two routes: respiration of water and consumption (dietary) of contaminated food items. Bioaccumulation is limited by the extent to which a pesticide is eliminated (through respiration or fecal elimination) or metabolized to non-toxic degradates. Chlorpyrifos is not expected to accumulate over time in prey because it is not persistent in aqueous environments (Chapter 3) and is readily metabolized and excreted by animals.10,11 For this assessment, respiration is considered the primary uptake and the BCF values for chlorpyrifos in aquatic plants, invertebrates, and fish are used predict short term uptake of chlorpyrifos in aquatic organisms that represent the prey of listed marine mammals. Chlorpyrifos exposures to listed marine mammals that eat air breathing animals that consume fish or other aquatic organism (e.g., birds, seals) are considered discountable because they are not expected to take up chlorpyrifos through respiration, chlorpyrifos does not accumulate through the diet, and once they consume chlorpyrifos through prey, it is expected that it will be metabolized by the birds and mammals.
As noted in Chapter 3 (exposure characterization), the KABAM12-estimated BCF for plants is 2407. This value is uncertain because it is based on a model estimate that does not account for metabolism of chlorpyrifos by plants. For aquatic invertebrates and fish, several empirically based values are available from different studies (3 invertebrate species, 6 fish species), leading to increased confidence in available values. Minimum, maximum and mean of empirical BCF values for aquatic invertebrates and fish are provided in Table 4-7.15. These BCFs are used to estimate aqueous concentrations sufficient to exceed the thresholds and endpoints where effects are observed (i.e., lowest LC50 and reproduction LOAEC). Given that these BCF values are based on steady state, it is necessary to compare EECs that are
10 In a 10-day chicken metabolism study, (MRID 00161743), recoveries of 88.4-94.5% of the total dose was found in the excreta. Residues did not accumulate in eggs (<0.05% of the total radioactivity)11 In a rat metabolism study (MRID 40458901), after 48 hours, 82% of the dose was eliminated via the urine as TCP and the glucuronide and sulfate conjugates of TCP. 12 Kow (based) Aquatic BioAccumulation Model. See Chapter 3 for discussion of how the plant BCF was estimated.
4-26
representative of the time to steady state for chlorpyrifos. Based on the Log Kow of chlorpyrifos (4.7), steady state is reached in approximately 16 days. Therefore, in this assessment, bounded water concentrations (using 4-day averages and 21-day averages) are compared to the values in Table 4-7.15.
Table 4-7.15. Aqueous concentrations defining dietary exposures of concern for marine mammals (excluding whales)
Food item Description of BCF
BCF value
Aqueous concentration (µg a.i./L) above which there is concern for dietary exposure
Mortality threshold
Lowest LC50
Sublethal threshold
Lowest NOEC for
reproduction
Lowest LOEC for
reproduction
Aquatic plants KABAM estimate 2407 14 86 <0.01 8 42
Aquatic invertebrates
lowest of empirical 400 87 518 2 50 250
mean of empirical 585 59 354 1 34 171
highest of empirical 874 40 237 1 23 114
Fish
lowest of empirical 440 79 470 1 45 227
mean of empirical 1513 23 137 <0.01 <0.01 66
highest of empirical 5100 7 41 <0.01 5 20
There are notable uncertainties in using the available toxicity data for mammals to represent those of pinnipeds, mustelids, manatees and bears. The available toxicity data are primarily based on rodent test species. No data are available for orders represented by the marine mammal species considered in this assessment. There is uncertainty in the relative sensitivities of laboratory rats and mice to the assessed species.
Exposures in estuaries and near shore areas
There is a great deal of uncertainty in estimating potential chlorpyrifos exposures in estuaries and near-shore areas of the ocean because the existing fate and transport models do not account for water stratification, tidal flux, and complex currents that occur in these habitats (i.e., bins 8 and 9). As noted in the problem formulation (Chapter 1), estimates developed for aquatic bin 2 are generally used as surrogate exposure levels for intertidal nearshore waterbodies (bin 8), and estimates developed using aquatic bin 3 are generally used as surrogate exposure levels for subtidal nearshore waterbodies (bin 9). Additionally, aquatic bin 5 is generally used as a surrogate for tidal pools occurring during low tide (aquatic bin 8).
EECs for bins 2, 3, and 5, which include both runoff and drift, are 0.64 – 743, 0.72 – 1150, and 0.025-3,950 µg a.i./L, respectively (EECs are presented in APPENDIX 3-4; values based on HUCs 1-3, 8, 12, 13, 17-21, which are relevant to the species ranges). The 21-day average EECs for bins 2, 3, and 5, are 0.37 – 681, 0.24 – 932, and 0.016-1,460 µg a.i./L, respectively (based on HUCs 1-3, 8, 12, 13, 17-21). These 1-in-15 year 4-day and 21-day average EECs exceed the mortality and sublethal thresholds (Table 4-7.15) for marine mammals that ingest aquatic plants, invertebrates and fish. Therefore, there is concern for
4-27

potential direct effects to marine mammals exposed via diet (aquatic plants, invertebrates and fish) while in estuaries and near shore habitats. Most of the dietary items are not expected to contain concentrations that would exceed the lowest available LC50 or reproduction LOAEC for mammals (Table 4-7.15). Therefore, the risk is considered medium.
It should be noted that there is a great deal of uncertainty surrounding the EECs for listed pinnipeds, mustelids and manatees. The marine bins selected for these species (bins 8 and 9) cannot be modeled, so surrogate freshwater bins (2, 3, and 5) are used. Bins 2 and 3 are used to represent low and high tide periods, with bin 5 representing a tidal pool. The EECs for these bins reflect contributions from both runoff and spray drift from treated areas adjacent to the waterbodies, which may not typically occur for intertidal and subtidal nearshore waterbodies which have beaches between the treated area and the leading edge of the water. Fate data (e.g., hydrolysis, metabolism) are not available for chlorpyrifos in saltwater environments, so it is uncertain how representative the EECs are for a marine environment. While the flowing bins (bins 2 and 3) are being used to represent the exchange of water expected in the marine bins due to the tides, there is uncertainty in how well these bins reflect the turbulent, mixing nature of the 12-hour tidal cycle and the EECs that may be present. The surrogate bins have lower depths and widths than the bins they are designed to represent: a 0.1 m depth and 1-2 m width for bins 2 and 5 compared to 0.5 m depth and 50 m width for bin 8 and a 1 m depth and 8 m width for bin 3 compared to 5 m depth and 50 m width for bin 9. While the smaller bins (bins 2 and 5) could be used for rearing juveniles, it is uncertain if these surrogate bins could hold sufficient volume to contain adult pinnipeds, mustelids and manatees. The additional depth and width assigned to bins 8 and 9 could also result in lower EECs based on the additional water volume and hence dilution.
Monitoring data are available for chlorpyrifos in estuaries13. The maximum reported concentration is 0.5 µg a.i./L (15% detection frequency), which is above some of the aqueous concentrations of concern in 4-7.15. It should be noted that the utility of these data are limited in that they represent ambient monitoring data for which the applications of chlorpyrifos in the watershed of the sampled waterbodies are not defined and are not expected to capture peak exposures.
EECs resulting from drift only transport into estuaries are provided in Tables 4-7.16 (ground spray applications of 6 lb a.i./A-max single application rate) and 4-7.17 (aerial application of 4 lb a.i./A-max single application rate). Exceedances of thresholds vary by bin and distance. EECs for water bodies located near treated fields are most likely to exceed sublethal and mortality thresholds.
Table 4-7.16. Aquatic EECs (µg a.i./L) resulting from spray drift from ground application at 6 lb a.i./A. Distances represent different distances between application site and water body. EECs are instantaneous values.
Distance (m)EEC by Bin
2 3 4 50 4846 227 33 5491
30 170 15 5 17360 76 7 3 7790 47 4 2 47
120 33 3 1 33
13 STORET and National Water Quality Information system (NWIS)- Water Quality Portal https://www3.epa.gov/storet/dbtop.html Accessed 3/28/16
4-28

Distance (m)EEC by Bin
2 3 4 5150 25 2 1 25180 20 2 0.9 20210 17 2 0.7 17240 14 1 0.6 14270 12 1 0.5 12300 11 1 0.5 11304 11 1 0.5 11
Table 4-7.17. Aquatic EECs (µg a.i./L) resulting from spray drift from aerial application at 4 lb a.i./A. Distances represent different distances between application site and water body. EECs are instantaneous values.
Distance (m)EEC by Bin
2 3 4 50 2735 230 66 2825
30 944 89 33 95360 603 58 24 60790 452 44 19 454
120 365 36 15 367150 309 30 13 309180 268 26 12 269210 238 24 11 238240 214 21 10 215270 195 19 9 196300 180 18 8 180304 178 18 8 178330 167 166 8 167360 156 155 7 156390 146 145 7 146420 138 137 6 138450 130 129 6 130480 124 123 6 124510 118 117 5 118540 112 112 5 113570 108 107 5 108600 103 103 5 103630 99 99 5 99660 96 95 4 96690 92 92 4 92720 89 89 4 89750 86 86 4 86780 84 83 4 84
4-29

Distance (m)EEC by Bin
2 3 4 5793 82 82 4 82
Exposures in Off-Shore Habitats
It is expected that, given the large volume of water in oceans, and the lack of persistence of chlorpyrifos, this chemical will be sufficiently diluted to not be of concern for marine mammals in deep water ocean habitats. In addition, since chlorpyrifos is readily metabolized and does not accumulate in aquatic organisms, exposure via consumption of aquatic plants, invertebrates, fish and marine mammals is not of concern.
It should be noted that this approach differs from that taken above for smaller, near shore habitats (e.g., estuaries). In these areas, short term concentration of chlorpyrifos in aquatic prey of marine mammals is considered because concentrations may be higher in water and chlorpyrifos could concentrate for a short term period in prey of marine mammals. The use of empirically based bioconcentration factors allows for consideration of metabolism and for uptake in prey (fish, invertebrates) via the major route of exposure (i.e., respiration).
Exposures in freshwater environments (for Manatee only)
Aquatic bins that are used as surrogates for estimating exposures to manatees in freshwater habitats are bins 3 and 4 (ATTATCHMENT 1-10). The 1-in-15 year 4-day average EECs, which include both runoff and drift, derived for these bins are on the order of 0.72 – 1150 and 0.6 – 1180 µg a.i./L (Bin 3 and 4 EECs are presented in APPENDIX 3-4; values based on HUCs 1-3, 8, 12, 13, 17-21). The 1-in-15 year 21-day average EECs derived for bins 3 and 4 are on the order of 0.24 – 932 µg a.i./L and 0.23 – 843, respectively. These 1-in-15 year 4-day and 21-day average EECs exceed the concentrations that represent sublethal (<0.01 µg a.i./L) and mortality (14 µg a.i./L) threshold exceedances listed in Table 4-7.15 for aquatic plant dietary items. These concentrations also exceed the Lowest reproduction NOAEC and LOAEC values (8 and 42 µg a.i./L, respectively). Therefore, there is concern (high risk) for potential direct effects to manatees exposed via diet while in freshwater habitats.
Risk Assessment for Aquatic Habitats: Indirect Effects
Table 4-7.18 summarizes the thresholds used to assess indirect effects to marine mammals through impacts to diet (aquatic plants, invertebrates and fish) or habitat (plants). Details of how these values were derived are provided in Chapter 2.
Table 4-7.18. Thresholds for indirect effects (µg a.i./L).Taxa Mortality threshold Sublethal thresholdAquatic plants 140 140Aquatic invertebrates 0.0125 0.0003Fish 0.355 0.251
For estuaries and near shore ocean habitats, 1-in-15 year average daily EECs estimated for bins 2, 3, and 5 are on the order of 2 – 13,600 µg a.i./L (capped at chlorpyrifos’ solubility limit) (EECs for bins 2, 3, and
4-30

5 are presented in APPENDIX 3-4). These values are above thresholds for mortality and sublethal thresholds for aquatic plants, aquatic invertebrates and fish (Table 4-7.18).
For marine mammals in the off shore habitats, indirect effects due to loss of prey or habitat are not expected. This is due to the effect of dilution in deep water ocean environments in which the mammals are found.
For freshwater habitats used by the manatee, 1-in-15 year average daily EECs estimated for bins 3 and 4 are on the order of 2 - 13,600 µg a.i./L (capped at chlorpyrifos’ solubility limit). These values are above the threshold for aquatic plants, therefore, there is concern (high risk) for potential indirect effects to manatees from effects to plant dietary items and habitat in freshwater habitats.
Risk Assessment for Terrestrial Habitats
This section considers potential exposures to marine mammals (excluding whales) in terrestrial habitats. Relative to risks due to dietary exposures in aquatic habitats, risks in terrestrial habitats are expected to be lower.
Dermal exposures
Dermal exposure due to spray drift transport is of potential concern for mammals in terrestrial areas adjacent to treated sites. Several studies examined chlorpyrifos toxicity related to dermal exposure in mammals, including in rats, rabbits, guinea pigs, dogs, and cows. Effects in these studies included mortality, skin and eye irritation, and cholinesterase inhibition (see Chapter 2 for details). For acute mortality from dermal exposure in rats, the LD50 is 202 mg a.i./kg (MRID 44209102/Accession No. 112115). Dermal cholinesterase (ChE) inhibition data are available from a 21-day and 4-day probe study (MRID 40972801) in rats which together establish a NOAEL of 5 mg/kg/day and LOAEL of 10 mg/kg/day based on plasma and red blood cell ChE inhibition. In addition to the submitted studies, there are 16 studies associated with dermal exposure of chlorpyrifos in the ECOTOX database with mostly measured effects on enzymatic and cellular changes. While there are five different units reported, thus, making a direct comparison between reported results difficult, a screen of the data did not indicate toxicity values that are more sensitive than the NOAEL of 5 mg/kg/day. Dermal spray doses are calculated using the rat body weight (350 g; WHO 2009) and application rates of 1 and 6 lb a.i./A (see ATTACHMENT 1-7, Section 7c for methodology). The estimated exposure values for the rat are 8.9 and 53 mg a.i./kg-bw for the 1 and 6 lb a.i./A rates, respectively. These exposure values are less than the acute LD50 value, but exceed the NOAEL for ChE inhibition, thus there is the potential for sublethal effects.
There is uncertainty associated with concluding that dermal exposures of chlorpyrifos will pose a risk to marine mammals. There is uncertainty associated with the likelihood of exposure because on the day of application, the pesticide must be transported by wind blowing from the application site toward the beach. Table 4-7.19 provides a summary of the percentage of time the wind is blowing from a certain direction. These data suggest that prevailing winds blow from inland toward the ocean up to 30% of the time (independent of when chlorpyrifos is likely to be applied).
4-31
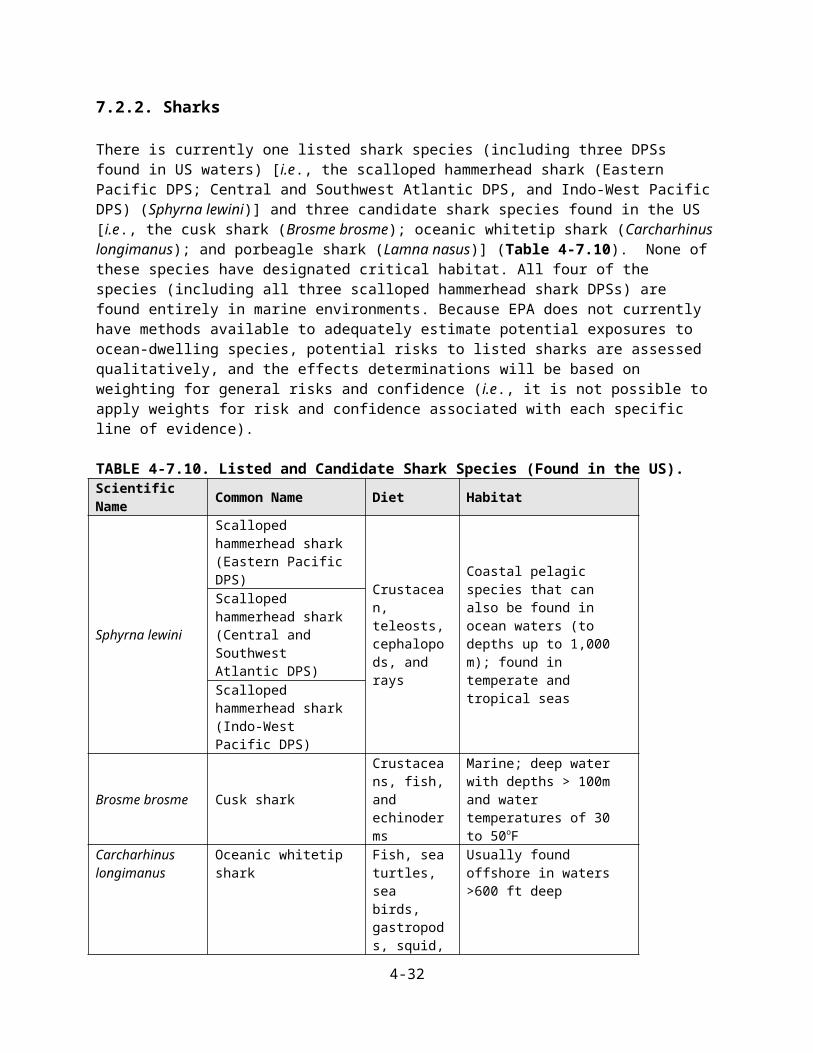
Table 4-7.19. Wind Direction Percentage Summary for meteorological stations on the coast of the Continental US.
Station North South East WestEast Coast
Miami FL 24 23 40 12*Vero Beach FL 15 21 31 15*Charleston SC 24 25 20 25*Wilmington NC 24 22 18 25*Norfolk VA 25 26 21 24*Atlantic City NJ 26 22 14 29*Boston MA 26 17 17 39*Portland ME 30 24 13 31*
West CoastSan Diego CA 33 18 8* 33
Santa Barbara CA 11* 23 17 26
San Francisco CA 25 13 10* 48
Astoria OR 15 26 25* 28Source: EPA’s SCRAM website (http://www3.epa.gov/ttn/scram/surfacemetdata.htm). North – 304 to 34 degrees, East – 34 to 124 degrees, South – 124 to 214 degrees, West – 214 to 304 degrees*Winds blow from inland toward the ocean. Due to calm winds (winds < 1 m/s), where wind directions can be uncertain, percentages may not sum to 100%.
Inhalation exposures
Multiple inhalation studies are available for chlorpyrifos. Two subchronic inhalation toxicity studies (MRIDs 40013901, 40166501, 40908401) in the rat are available using vapor phase chlorpyrifos which show no ChE effects up to a concentration of 20.6 ppb (287 μg/m3 or 0.082 mg/kg/day). In a special acute inhalation study, female rats were exposed by nose only to atmospheric concentrations of up to 53.9 mg/m3 of particulate chlorpyrifos for six hours and allowed an additional 72 hours to recover (MRID 48139303). Consistent and significant lung ChE inhibition were noted at the lowest concentration tested of 3.7 mg/m3 (3700 μg/m3), which is a LOAEL. Two acute inhalation studies on the saturated vapor phase have been performed on the parent chlorpyrifos and chlorpyrifos oxon (MRID 49119501 and 49210101, respectively). In these studies, female rats were exposed by nose only to a saturated vapor of chlorpyrifos or its oxon for 6 hours at a time-weighted concentration of 17.7 ppb (254 μg/m3) (MRID 49119501) or 2.58 ppb (35.3 μg/m3) (MRID 49210101), respectively. There were no statistically-significant decreases in ChE activity in the RBC, lung, brain or plasma tissues. These acute studies along with the subchronic inhalation studies with vapor phase chlorpyrifos support low toxicity from acute exposure to the saturated vapor of chlorpyrifos or its oxon.
Air monitoring data are available from several sources (see Chapter 3; Table 3-14 for details), and the maximum concentration reported (27.7 μg/m3) is from Tulare, CA (application site)14 and the highest ambient value4 reported (1.34 μg/m3) is from Lindsay, CA. With reported effects at levels of 3700 μg/m3, based on the reported air concentrations, inhalation exposure is not considered to be of concern. As noted above, there is uncertainty associated with the available surrogate test species and their relative sensitivities to the assessed species.
14 California Air Resource Board (CARB)
4-32

Effects Determinations
The effect determinations for the Guadalupe fur seal, southern sea otter, Steller sea lion, Hawaiian monk seal, and Pacific harbor seal are “likely to adversely affect” (LAA) based on exposures in near shore saltwater habitats for direct effects through dietary and dermal exposure and indirect effects through impacts to prey. The determination for the West Indian Manatee is also LAA based on potential direct effects in saltwater and freshwater habitats used by this species. Although there is a high degree of overlap of exposure estimates and thresholds and other toxicity endpoints (i.e., “high risk”), the confidence associated with the LAA determination is low due to uncertainties associated with the available toxicity data and the exposure estimates. In cases where critical habitat has been designated (i.e., for Steller sea lion, Hawaiian monk seal and West Indian Manatee), an LAA determination is also made for the critical habitat, based on the same considerations for direct and indirect effects (Table 4-7.20).
Several of the species included in this assessment only occur in waters of the US and terrestrial areas that are in Alaska. These species include the northern sea otter, the bearded seal, the pacific walrus, the spotted seal, and the polar bear. When considering USDA’s census of agriculture data for Alaska (2012), a limited amount of land was used for grains and fruits and vegetables, with most use acres for forage crops (e.g., hay, alfalfa, silage). Most of these crops are grown in the interior of the state (e.g., near Fairbanks). Although, there are some potential chlorpyrifos use sites found in Southcentral Alaska (e.g., forage (hay, alfalfa)), they are limited and largely removed from coastal areas15. Additionally, while chlorpyrifos is registered as a mosquitocide, as this use is intended to protect public health usually in urban areas, use of chlorpyrifos in areas where these species are located [e.g., ice shelfs, Federal wildlife refuges (Aleutian Islands)], is anticipated to be unlikely. Therefore, the potential chlorpyrifos use sites are limited in nature in areas that may be near the northern sea otter, the bearded seal, the pacific walrus, the spotted seal and the polar bear. Therefore, NLAA determinations are made for these five species (Table 4-7.20). For the designated critical habitat of the northern sea otter, an NLAA determination is also made.
15 An overlap analysis was not conducted for aquatic species, therefore, the extent of overlap in ranges and potential chlorpyrifos use sites is not available.
4-33
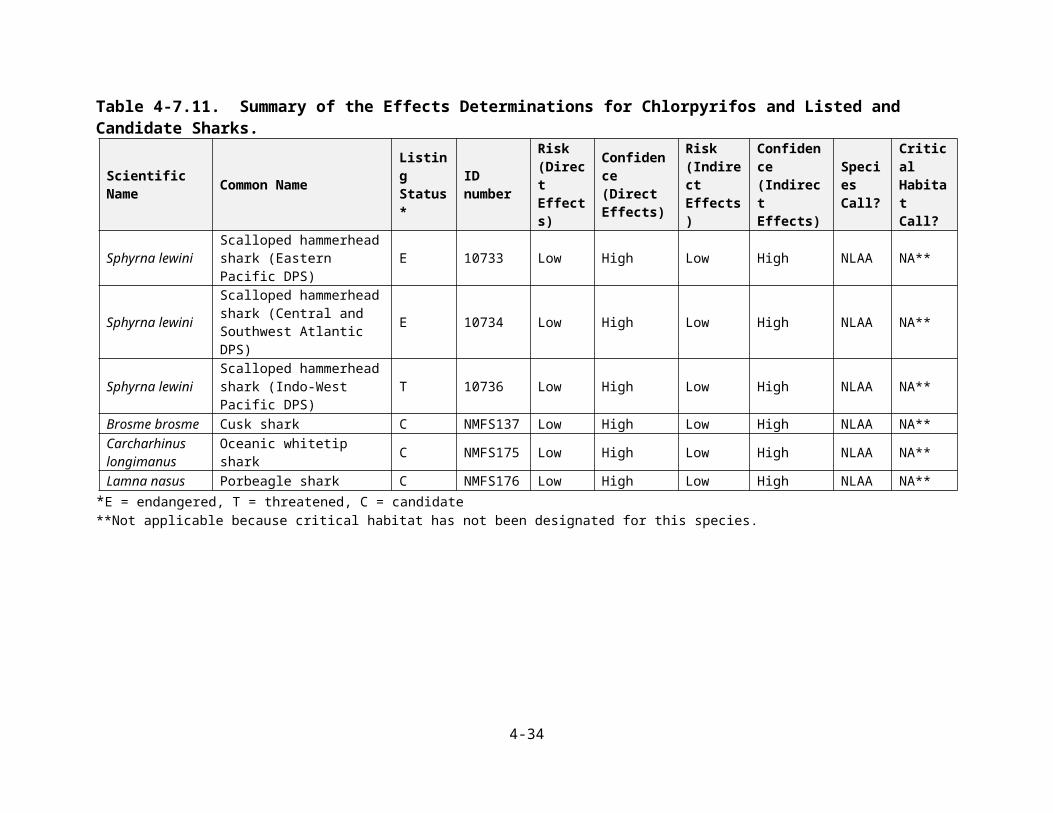
Table 4-7.20. Summary of the Effects Determinations for Chlorpyrifos and Listed Marine Mammals (excluding whales) and Their Designated Critical Habitats.
Scientific Name
Common Name
Listing Status
*
FWS/NMFS
Species ID
Risk (Direct Effects)
Confidence (Direct Effects)
Risk (Indirec
t Effects)
Confidence (Indirect
Effects)
Species Call?
Critical
Habitat Call?
Arctocephalus townsendi
Guadalupe fur seal T 3318 High Low High Low LAA NA**
Enhydra lutris kenyoni
Northern sea otter (Southwest Alaska DPS)
T 5232 Low High Low High NLAA NLAA
Enhydra lutris nereis
Southern sea otter T 45 High Low High Low LAA NA**
Erignathus barbatus
Bearded Seal (Beringia)
T 10381 Low High Low High NLAA NA**
Eumetopias jubatus
Steller sea lion (Western DPS)
E 7115 High Low High Low LAA LAA
Neomonachus schauinslandi
Hawaiian monk seal E 2891 High Low High Low LAA LAA
Odobenus rosmarus ssp. Divergens
Pacific walrus C 9709 Low High Low High NLAA NA**
Phoca largha
Spotted seal (Southern DPS)
T NMFS182 Low High Low High NLAA NA**
Phoca vitulina richardii
Pacific harbor seal (Iliamna lake)
C NMFS159 High Low High Low LAA NA**
Trichechus manatus
West Indian Manatee
E 7 High Low Low High LAA LAA
Ursus maritimus Polar bear T 8861 Low High Low High NLAA NA**
*E = endangered, T = threatened, C = candidate**Not applicable because critical habitat has not been designated for this species.
7.4 Cave Dwelling Invertebrate Species Analysis
Currently, there are 22 terrestrial invertebrate species that are only found in caves; all of them only use terrestrial environments and rely wholly on terrestrial food sources [i.e., Kauai cave wolf or pe'e pe'e maka 'ole spider, Coffin Cave mold beetle, Helotes mold beetle, Robber Baron Cave meshweaver,
4-34
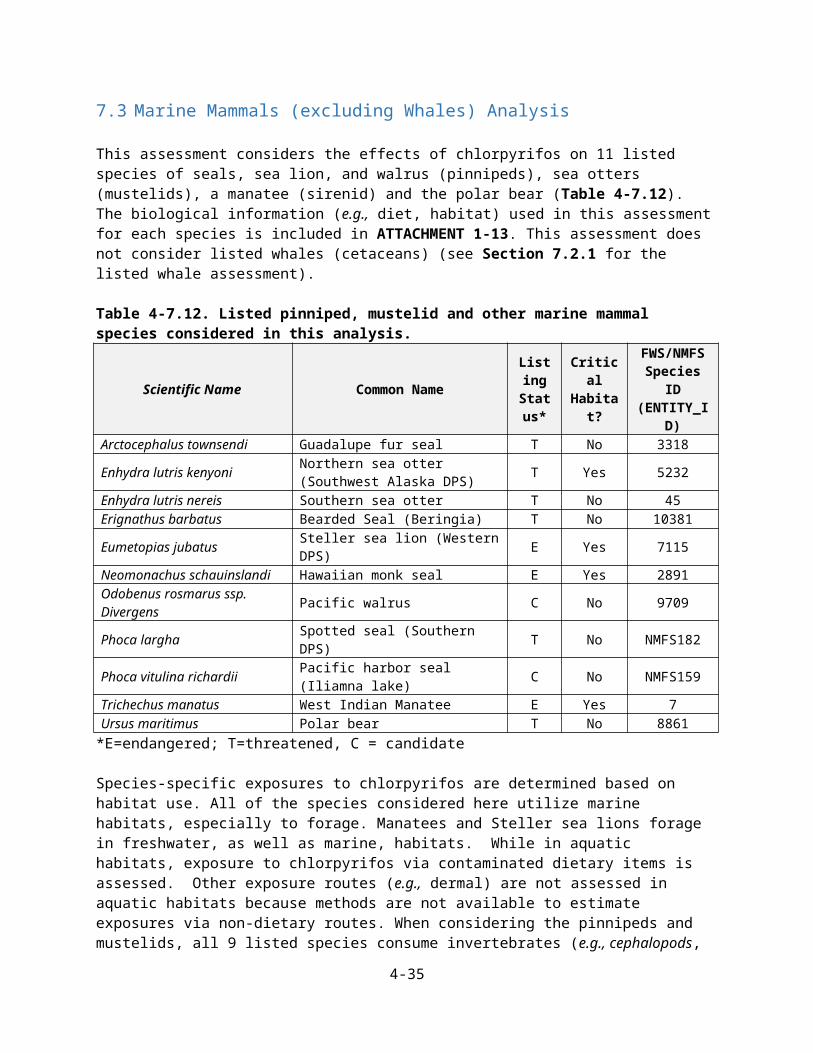
Madla's Cave meshweaver, Braken Bat Cave meshweaver, Government Canyon Bat Cave meshweaver, Tooth Cave spider, Government Canyon Bat Cave spider, Clifton Cave beetle, Icebox Cave beetle, Tatum Cave beetle, Louisville Cave beetle, Ground beetle [unnamed (Rhadine exilis)], Ground beetle [unnamed (Rhadine infernalis)], Tooth Cave ground beetle, Kauai cave amphipod, Tooth Cave pseudoscorpion, Kretschmarr Cave mold beetle, Cokendolpher Cave harvestman, Bee Creek Cave harvestman, and Bone Cave harvestman]. None of these species are known to have obligate relationships. Eleven of the species have designated critical habitats [i.e., Kauai cave wolf or pe'e pe'e maka 'ole spider, Helotes mold beetle, Robber Baron Cave meshweaver, Madla's Cave meshweaver, Braken Bat Cave meshweaver, Government Canyon Bat Cave meshweaver, Tooth Cave spider, Ground beetle [unnamed (Rhadine exilis)], Ground beetle [unnamed (Rhadine infernalis)], Kauai cave amphipod, and Cokendolpher Cave harvestman].
Because EPA does not currently have methods available to precisely estimate potential exposures to listed cave-dwelling terrestrial invertebrates, potential risks are assessed qualitatively and characterized using exposure estimates for potential forage items outside the cave. The likelihood of exposure is dependent in part upon foraging behavior (e.g., subterranean only versus inside and outside the cave) and the potential for transport of contaminated forage or substrates into the cave. Additionally, although none of the listed species of cave-dwelling terrestrial invertebrates discussed in this section have aquatic life stages, it is uncertain whether and to what extent they may be exposed to pesticide residues in water which percolate through permeable soils in karst cave systems. Thus, the following effects determinations are based on weighting for general risks and confidence (i.e., it is not possible to apply weights for risk and confidence associated with each specific line of evidence).
For animals found only in cave interiors, exposure via spray drift is not likely due to multiple drift interception areas typically associated with caves (both outside and within cave systems). Additionally, potential runoff events that could transport pesticides to the interior of a cave system are not expected to result in significant exposure to terrestrial animals found within most caves. Therefore, direct pesticide exposures to most cave-dwelling terrestrial invertebrates from pesticide applications made outside of their cave systems are not generally expected. The exception is for those species that are found in cave systems with permeable substrates (e.g., karst cave formations or sink holes) where pesticide contamination via runoff and recharge is more likely if pesticides are used in the vicinity of the cave systems. All of the currently listed cave-dwelling terrestrial invertebrates live in such environments, i.e., karst systems, sinkholes, or similar subterranean habitats overlain by permeable substrates) (see ATTACHMENT 1-20). For all of these species, pesticides have been listed as a cause of concern by the US Fish and Wildlife Service (e.g., see http://ecos.fws.gov/docs/federal_register/fr3497.pdf).
For terrestrial cave-dwelling species, there is also a potential for exposure to pesticides from the ingestion of food items that originate from outside of a cave. Based on the available information (see the species profiles, ATTACHMENT 1-20, Supplemental Information 3 for details), all of the currently listed terrestrial cave-dwelling invertebrate species appear to rely, to some degree, on dietary items that originate from exterior sources (see Table 4-7.21).
4-35

Table 4-7.21. Listed Cave-Dwelling Terrestrial Invertebrates and Their Diets.
Scientific Name Common Name Diet Origin of the Dietary Item(s)
Adelocosa anops Spider, Kauai cave wolf or pe'e pe'e maka 'ole
Kauai cave amphipod, other cave-inhabiting arthropods, and alien species of arthropods that enter the cave system.
Exterior to the cave; Within the cave
Batrisodes texanus Beetle, Coffin Cave moldExamples of diet nutrient sources for this species include leaf litter fallen or washed in, animal droppings, and animal carcasses.
Exterior to the cave
Batrisodes venyivi Beetle, Helotes moldExamples of diet nutrient sources for this species include leaf litter fallen or washed in, animal droppings, and animal carcasses.
Exterior to the cave
Cicurina baronia Meshweaver, Robber Baron Cave
Examples of diet nutrient sources for this species include leaf litter fallen or washed in, animal droppings, and animal carcasses.
Exterior to the cave
Cicurina madla Meshweaver, Madla's Cave
Examples of diet nutrient sources for this species include leaf litter fallen or washed in, animal droppings, and animal carcasses.
Exterior to the cave
Cicurina venii Meshweaver, Braken Bat Cave
Examples of diet nutrient sources for this species include leaf litter fallen or washed in, animal droppings, and animal carcasses.
Exterior to the cave
Cicurina vesperaMeshweaver, Government Canyon Bat Cave
Examples of diet nutrient sources for this species include leaf litter fallen or washed in, animal droppings, and animal carcasses.
Exterior to the cave
Neoleptoeta myopica Spider, Tooth Cave
Examples of nutrient sources include leaf litter fallen or washed in, animal droppings, and animal carcasses
Exterior to the cave
Neoleptoneta microps
Spider, Government Canyon Bat Cave
Examples of diet nutrient sources for this species include leaf litter fallen or washed in, animal droppings, and animal carcasses.
Exterior to the cave
Pseudoanophthalmus caecus Beetle, Clifton Cave Small invertebrates and cave cricket eggs Exterior to the cave;
Within the cavePseudoanophthalmus frigidus Beetle, Icebox Cave Small invertebrates and cave cricket eggs Exterior to the cave;
Within the cavePseudoanophthalmus parvus Beetle, Tatum Cave Small invertebrates and cave cricket eggs Exterior to the cave;
Within the cavePseudoanophthalmus troglodytes Beetle, Louisville Cave Small invertebrates and cave cricket eggs Exterior to the cave;
Within the cave
Rhadine exilis Ground beetle, [unnamed]
Examples of diet nutrient sources for this species include leaf litter fallen or washed in, animal droppings, and animal carcasses.
Exterior to the cave
Rhadine infernalis Ground beetle, [unnamed]
Examples of diet nutrient sources for this species include leaf litter fallen or washed in, animal droppings, and animal carcasses.
Exterior to the cave
Rhadine persephone
Beetle, Tooth Cave ground
A variety of troglobites are known to feed on cave cricket eggs, feces, and/or on the adults and nymphs directly.
Exterior to the cave; Within the cave
Spelaeorchestia koloana Kauai cave amphipod
Roots of Pithecellobium dulce (Manila tamarind) and Ficus sp. (fig), rotting roots, sticks, branches, and other plant material washed into, or otherwise carried into caves, as well as the fecal material of other arthropods
Exterior to the cave; Within the cave
4-36

Scientific Name Common Name Diet Origin of the Dietary Item(s)
Tartarocreagris texana
Pseudoscorpion, Tooth Cave
Examples of diet nutrient sources for these species include leaf litter fallen or washed in, animal droppings, and animal carcasses.
Exterior to the cave
Texamaurops reddelli
Beetle, Kretschmarr Cave mold
Examples of nutrient sources include leaf litter fallen or washed in, animal droppings, and animal carcasses
Exterior to the cave
Texella cokendolpheri
Harvestman, Cokendolpher Cave
Examples of diet nutrient sources for this species include leaf litter fallen or washed in, animal droppings, and animal carcasses.
Exterior to the cave
Texella reddelli Harvestman, Bee Creek Cave Leaf litter, animals’ droppings and carcasses. Exterior to the cave
Texella reyesi Harvestman, Bone Cave Leaf litter, animals’ droppings and carcasses. Exterior to the cave
Kauai cave wolf spiders may ingest some arthropods that originate from outside of the cave, however, its diet is primarily made up of the Kauai cave amphipod (and other cave-inhabiting arthropods). For the Kauai cave amphipod, roots of terrestrial plants that extend into subterranean habitats serve as a primary food source, however, some nutritional sources that originate from outside the cave (e.g., washed in vegetative matter and feces) may also be ingested. Additionally, the Tooth Cave ground beetle is assumed to eat primarily cave crickets (eggs, nymphs, and adults). Cave cricket adults may forage outside of their cave system at night. In addition to cave cricket eggs, Clifton Cave, Icebox Cave, Tatum Cave, and Louisville Cave beetles eat cave invertebrates which originate primarily, but perhaps not exclusively, from within their caves. Therefore, Kauai cave wolf spiders, Kauai cave amphipods, Tooth Cave ground beetles, Clifton Cave beetles, Icebox Cave beetles, Tatum Cave beetles, and Louisville Cave beetles rely primarily, but not exclusively, on food items that originate from within their cave systems. Thus, there is a potential for exposure from the ingestion of contaminated prey/forage items, but current methods which assume that 100% of the diet is contaminated are not adequate for estimating such exposures.
Although the potential for exposure (i.e., the chance of a contaminated food item is washed into a cave and then ingested) is likely low, because chlorpyrifos is a broad spectrum insecticide that are highly toxic to a wide range of invertebrates. The potential for effects to a single individual of Kauai cave wolf spiders, Kauai cave amphipods, Tooth Cave ground beetles, Clifton Cave beetles, Icebox Cave beetles, Tatum Cave beetles, and Louisville Cave beetles cannot be precluded if they ingest a dietary item(s) that is contaminated with chlorpyrifos (see analysis below). Therefore, for direct effects to Kauai cave wolf spiders, Kauai cave amphipods, Tooth Cave ground beetles, Clifton Cave beetles, Icebox Cave beetles, Tatum Cave beetles, and Louisville Cave beetles from the use of chlorpyrifos, the potential for risk is ‘medium’ (i.e., there is a potential for effects if exposure occurs, but it’s not clear what effects would occur at the exposure concentrations), and the confidence is ‘low’ (e.g., potential exposures cannot be estimated, but they also cannot be precluded). The same is true for indirect effects related to the loss of potential prey items (that originate from outside of the caves). The same conclusions and rationale apply to the designated critical habitats associated with these species. Therefore, for Kauai cave wolf spiders,Kauai cave amphipods, Tooth Cave ground beetles, Clifton Cave beetles, Icebox Cave beetles, Tatum Cave beetles, and Louisville Cave beetles a Likely to Adversely Affect (LAA) determination is made for chlorpyrifos. Additionally, for the designated critical habitats associated with Kauai cave wolf spiders, Kauai cave amphipods, and Tooth Cave ground beetles a Likely to Adversely Affect (LAA) determination is made for chlorpyrifos.
4-37

The remaining listed cave-dwelling terrestrial invertebrate species appear to rely primarily on food items that are derived from exterior sources (i.e., leaf litter, animal droppings, and carcasses that may fall or be washed into their cave systems). Therefore, there is a potential for exposure if their food item(s) is contaminated with a pesticide. The EPA does not currently have methods for estimating the concentration of pesticides in leaf litter, animal feces, or carcasses that are found within cave systems. Again, because chlorpyrifos is a broad spectrum insecticide that is highly toxic to a wide range of invertebrates, the potential for effects to a single individual of a cave-dwelling invertebrate cannot be precluded if it ingests a contaminated food item.
For leaf litter, the foliar dissipation half-lives for chlorpyrifos is estimated to be 4 days (see APPENDIX 3-6). However, because of the sensitivity of terrestrial invertebrates to this chemical, the EECs on leaves are estimated to be high enough to exceed effects thresholds for weeks after spraying. For example, based on analyses using the TED tool, the dietary-based upper bound EECs on leaves sprayed with chlorpyrifos would be high enough to exceed the terrestrial invertebrate mortality threshold for 63 days and 71 days for an application rate of 1 lb a.i./acre and 4 lb a.i./acre, respectively. For the animal food items, the daily fraction retained in mammals and birds is approximately 0.82 for chlorpyrifos (see APPENDIX 3-6). Therefore, if a food item is contaminated with one of these chemicals outside of the cave, it could contain residues high enough to cause concern for a few days after exposure. Thus, there is a potential for exposure to and effects from chlorpyrifos to cave-dwelling invertebrates from the ingestion of contaminated leaf litter and carcasses.
Additionally, there is evidence in the literature indicating that animal feces (e.g., guano) and carcasses contaminated with pesticides (including some organophosphates) have been found in cave systems (e.g., Eidels, et al. 200716; Land 200117; MacFarland 199818; and Sandel 199919). Therefore, the potential for exposure is medium and the potential for exposure from the ingestion of contaminated feces and carcasses cannot be precluded. Furthermore, chlorpyrifos is highly toxic to a wide range of invertebrates. Therefore, for direct effects to Coffin Cave mold beetle, Helotes mold beetle, Robber Baron Cave meshweaver, Madla's Cave meshweaver, Braken Bat Cave meshweaver, Government Canyon Bat Cave meshweaver, Tooth Cave spider, Government Canyon Bat Cave spider, Ground beetle [unnamed (Rhadine exilis)], Ground beetle [unnamed (Rhadine infernalis)], Tooth Cave pseudoscorpion, Kretschmarr Cave mold beetle, Cokendolpher Cave harvestman, Bee Creek Cave harvestman, and Bone Cave harvestman , from the use of chlorpyrifos the potential for risk is ‘medium’ (i.e., there is a potential for effects if exposure occurs, but it’s not clear what effects would occur at the exposure concentrations), and the confidence is ‘medium’ (e.g., potential exposures cannot be estimated, but they also cannot be precluded). The same conclusions and rationale apply to the designated critical habitat associated with these species.
For potential indirect effects, chlorpyrifos use would have the potential to impact the availability of animal feces (by impacting the animals), carcasses, and leaf litter (by impacting terrestrial plants). The chance that the impacts on the availability of animal feces, carcasses, and leaf litter would reach a level
16 Eidels, R.R., J.O. Whitaker Jr., and D.W. Sparks 2007. Insecticide residues in bats and guano from Indiana. Proceedings of the Indiana Academy of Science, 116 (1): 50 – 57.17 Land, T.A. 2001. Population Size and Contaminant Exposure of Bats Using Caves on Fort Hood Military Base, Texas. M.S. thesis, Texas A&M University, College Station, Texas.18 McFarland, C.A. 1998. Potential Agricultural Insecticide Exposure of Indiana Bats (Myotis sodalis) in Missouri. M.S. thesis, University of Missouri, Columbia, Missouri.19 Sandel, J.K. 1999. Insecticides and Bridge-Roosting Colonies of Mexican Free-Tailed Bats (Tadarida brasiliensis) in Texas. M.S. thesis, Texas A&M University, College Station, Texas.
4-38

that would adversely affect the listed terrestrial invertebrates due to the loss of food, is very low, but cannot be precluded. Therefore, for indirect effects to Coffin Cave mold beetle, Helotes mold beetle, Robber Baron Cave meshweaver, Madla's Cave meshweaver, Braken Bat Cave meshweaver, Government Canyon Bat Cave meshweaver, Tooth Cave spider, Government Canyon Bat Cave spider, Ground beetle [unnamed (Rhadine exilis)], Ground beetle [unnamed (Rhadine infernalis)], Tooth Cave pseudoscorpion, Kretschmarr Cave mold beetle, Cokendolpher Cave harvestman, Bee Creek Cave harvestman, and Bone Cave harvestman from the use of chlorpyrifos, the potential for risk is ‘medium’ (i.e., there is a potential for effects if exposure occurs, but it’s not clear what effects would occur at the exposure concentrations), and the confidence is ‘low’ (e.g., potential exposures cannot be estimated, but they also cannot be precluded). The same conclusions and rationale apply to the designated critical habitat associated with this species.
Therefore, based on the potential for direct and indirect effects, for Coffin Cave mold beetle, Helotes mold beetle, Robber Baron Cave meshweaver, Madla's Cave meshweaver, Braken Bat Cave meshweaver, Government Canyon Bat Cave meshweaver, Tooth Cave spider, Government Canyon Bat Cave spider, Ground beetle [unnamed (Rhadine exilis)], Ground beetle [unnamed (Rhadine infernalis)], Tooth Cave pseudoscorpion, Kretschmarr Cave mold beetle, Cokendolpher Cave harvestman, Bee Creek Cave harvestman, and Bone Cave harvestman a “Likely to Adversely Affect” (LAA) determination is made for chlorpyrifos. Additionally, for the designated critical habitat associated with Helotes mold beetle, Robber Baron Cave meshweaver, Madla's Cave meshweaver, Braken Bat Cave meshweaver, Government Canyon Bat Cave meshweaver, Ground beetle [unnamed (Rhadine exilis)], Ground beetle [unnamed (Rhadine infernalis)], and Cokendolpher Cave harvestman, a “Likely to Adversely Affect” (LAA) determination is made for chlorpyrifos.
4-39

Table 4-21. Summary of the Effects Determinations for Chlorpyrifos and Listed Terrestrial Cave-Dwelling Invertebrates and Their Designated Critical Habitat(s)
Species name Common name Listing Status*
FWS Species
ID
Risk (Direct Effects)
Confidence (Direct Effects)
Risk (Indirect Effects)
Confidence (Indirect Effects)
Species Call?
Critical Habitat
Call?
Adelocosa anopsSpider, Kauai cave wolf or pe'e pe'e maka 'ole
E 463 Medium Low Medium Low LAA LAA
Batrisodes texanus Beetle, Coffin Cave mold E 447 Medium Medium Medium Low LAA NA**
Batrisodes venyivi Beetle, Helotes mold E 460 Medium Medium Medium Low LAA LAA
Cicurina baronia Meshweaver, Robber Baron Cave E 472 Medium Medium Medium Low LAA LAA
Cicurina madla Meshweaver, Madla's Cave E 471 Medium Medium Medium Low LAA LAA
Cicurina venii Meshweaver, Braken Bat Cave E 474 Medium Medium Medium Low LAA LAA
Cicurina vesperaMeshweaver, Government Canyon Bat Cave
E 473 Medium Medium Medium Low LAA LAA
Neoleptoneta myopica Spider, Tooth Cave E 467 Medium Medium Medium Low LAA LAA
Neoleptoneta microps Spider, Government Canyon Bat Cave E 470 Medium Medium Medium Low LAA NA**
Pseudoanophthalmus caecus Beetle, Clifton Cave C 5064 Medium Medium Medium Low LAA NA**
Pseudoanophthalmus frigidus Beetle, Icebox Cave C 2862 Medium Medium Medium Low LAA NA**
Pseudoanophthalmus parvus Beetle, Tatum Cave C 7134 Medium Medium Medium Low LAA NA**
Pseudoanophthalmus troglodytes
Beetle, Louisville Cave C 3379 Medium Medium Medium Low LAA NA**
Rhadine exilis Ground beetle, [unnamed] E 461 Medium Medium Medium Low LAA LAA
4-40
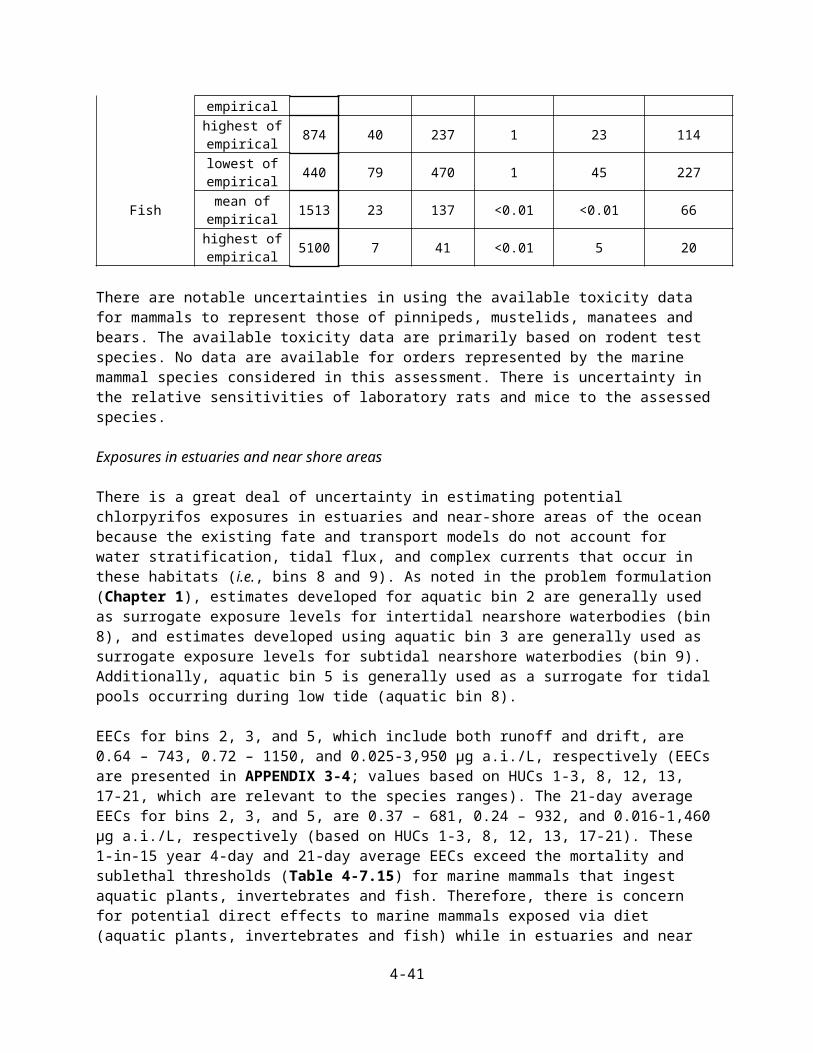
Species name Common name Listing Status*
FWS Species
ID
Risk (Direct Effects)
Confidence (Direct Effects)
Risk (Indirect Effects)
Confidence (Indirect Effects)
Species Call?
Critical Habitat
Call?
Rhadine infernalis Ground beetle, [unnamed] E 459 Medium Medium Medium Low LAA LAA
Rhadine persephone Beetle, Tooth Cave ground E 449 Medium Low Medium Low LAA NA**
Spelaeorchestia koloana Kauai cave amphipod E 485 Medium Low Medium Low LAA LAA
Tartarocreagris texana Pseudoscorpion, Tooth Cave E 466 Medium Medium Medium Low LAA NA**
Texamaurops reddelli Beetle, Kretschmarr Cave mold E 448 Medium Medium Medium Low LAA NA**
Texella cokendolpheri Harvestman, Cokendolpher Cave E 469 Medium Medium Medium Low LAA LAA
Texella reddelli Harvestman, Bee Creek Cave E 464 Medium Medium Medium Low LAA NA**
Texella reyesi Harvestman, Bone Cave E 465 Medium Medium Medium Low LAA NA**
*E = endangered**NA = Not applicable (i.e., there is no critical habitat designated for this species).
4-41

7.5 Cattle Ear Tag Use Analysis
Chlorpyrifos is used in cattle ear tags to control insect pests. Species of interest to this assessment were identified by overlapping ranges and designated critical habitats of listed species with sites where cattle ear tags could be used. Due to the unique application of the pesticide in a slow release plastic device applied to a cow’s ear, the same methodology used to assess other use patterns is not applicable to this use pattern and therefore the cattle ear tag analysis was completed separately (APPENDIX 4-4).
For chlorpyrifos, there are other uses (e.g., wide area use) that overlap with the spatial footprint relevant to the cattle ear tag use. Therefore, the assessment of cattle ear tags for chlorpyrifos alone is not sufficient to make species specific effects determinations. The analysis is used as part of the overall weight of evidence for uses of chlorpyrifos.
7.6 Mosquito Adulticide Analysis
Chlorpyrifos has uses that result in potential overlaps with most listed species ranges and designated critical habitats (i.e., mosquito adulticide and wide area use). Mosquito adulticide applications are unique for this chemical in that the pesticide is applied as an ultra-low volume (ULV) spray designed to target the flying adult vector, with a goal to suspend the pesticide in the air for a prolonged period of time. Due to the unique characteristics of this application, this analysis was conducted separately (APPENDIX 4-5).
The application rates for the mosquito adulticide uses are generally lower than those for other uses (e.g. agricultural and non-agricultural uses). Therefore, if a listed species range or critical habitat overlaps with other potential use sites, those uses are expected to be protective of the mosquito adulticide uses (i.e., potential exposures are expected to be higher with most of the non-mosquito adulticide uses). Two terrestrial species [i.e., Langford's tree snail (Partula langfordi) and the Pacific sheath-tailed Bat (Emballonura semicaudata rotensis)] are identified where the only use that overlaps with the species range is the mosquito adulticide.
As described in APPENDIX 4-5, for both of these species, a weight of evidence matrices is created for the mosquito adulticide use patterns. For the mosquito adulticide analysis, the TEDtool is modified to adjust for different spray drift properties associated with the ULV application and an application efficiency factor (e.g., a measure of how much active material lands on the spray block) is applied to the labeled application rate. Based on this analysis, an LAA determination is made for both species.
7.7 Seed Treatment and Granular Treatment Analysis
Chlorpyrifos has some registered seed treatment and granular/bait uses (see APPENDIX 1-3). Because exposures related to seed treatment and granular/bait uses are readily modeled using our current aquatic modeling approaches, these types of uses are incorporated into the aquatic exposure and WoE tools (PRZM/EXAMS and AquaWOE) used to help make effects determinations for listed aquatic species (and those that rely on aquatic species). However, these uses are not as easily incorporated into the current modeling approach for assessing terrestrial exposures to listed terrestrial species. Because flowable uses account for most of the use and usage of the three ESA pilot chemicals, including
4-42

chlorpyrifos, the current terrestrial exposure and WoE tools (TED and TerrWOE) that are used to help make effects determinations for listed terrestrial species (and those that rely on terrestrial species) were developed for flowable uses. Therefore, the seed treatment and granular/bait uses are not built into these tools. They are still considered, however, when making effects determinations. A discussion of the methods for assessing seed treatments and granular uses for terrestrial species are described in APPENDIX 4-6.
8 Refined Risk Analysis for 13 Listed Bird Species: TIM-MCnest Analysis
One of the major recommendations of the National Academy of Sciences was to utilize probabilistic methods for assessing risks of pesticides to listed species. A refined analysis is conducted on a subset of listed bird species to explore the utility of currently available probabilistic, refined methods for use in biological evaluations of listed species. The 13 species included in this analysis are the Florida grasshopper sparrow, San Clemente sage sparrow, Yellow-billed Cuckoo (Western DPS), Masked bobwhite (quail), Golden-cheeked warbler (=wood), Southwestern willow flycatcher, Inyo California towhee, Coastal California gnatcatcher, Kirtland's Warbler, Attwater's greater prairie-chicken,Lesser prairie-chicken, Black-capped Vireo and Least Bell's vireo. There is also potential utility for use of these methods in the biological opinions for these species. Additionally, this approach may inform future method development and data needs. A detailed description of this refined analysis is included in APPENDIX 4-7.
Two refined risk assessment models available for birds are used in this analysis, including the Terrestrial Investigation Model (TIM) and the Markov Chain Nest Productivity Model (MCnest). TIM estimates the probability and magnitude of mortality to exposed birds. MCnest estimates declines in fecundity associated with exposure. Both models incorporate species-specific life history parameters (e.g., diet), pesticide use information (e.g., crop, application rate), fate data (e.g., foliar dissipation half-life) and toxicity data. These models integrate toxicity data for mortality, growth, reproduction and behavioral effects.
TIM results
TIM is run to examine the likelihood of mortality to birds exposed to chlorpyrifos from mosquito adulticide, wide area (e.g., general outdoor use on perimeters, ant mounds, etc.) and pasture uses. These uses generally correspond with the highest overlap with the 13 birds species ranges. The following conclusions can be drawn:
- For mosquito adulticide, using the HC05 value from the avian SSD (conservative) for the LD50
value in the simulations, the probability of mortality to an exposed individual is variable depending on the species. Several species (e.g., Attwater's greater prairie-chicken, Inyo California towhee, Lesser prairie-chicken and Masked bobwhite) have <0.01% chance of mortality to one or more individuals whereas other species (e.g., Kirtland's Warbler, Black-capped Vireo, Golden-cheeked warbler, Southwestern willow flycatcher and Coastal California gnatcatcher) have greater than 99.9% chance of mortality to one or more individuals.
o There is uncertainty in this analysis due to model limitations, including the use of an aerial application with very fine to fine particle size to simulate the ultra-low volume application method used for mosquito adulticides and the model limit of 5 applications, when the number of applications could be higher.
4-43

o Applications were simulated using the labeled application rate for mosquito adulticide without an application efficiency factor applied.
- For wide area use, using the HC50 value from the avian SSD (central estimate) for the LD50 value in the simulations, there is a high probability (>99.9%) of mortality to an exposed individual for all simulated species.
- For pasture uses, using the HC50 value from the avian SSD (central estimate) for the LD 50 value in the simulations, there is a high probability (>99.9%) of mortality to an exposed individual for all simulated species.
For the wide area and pasture uses, which have application rates similar to many uses for chlorpyrifos (1 lb a.i./A), this provides additional evidence that if an individual is exposed, there is a high likelihood of mortality.
Probability distribution functions for different uses are compared to investigate the relative risks associated with different assumptions of toxicity. For mosquito adulticide use and conservative assumptions for the LD50 value, the largest magnitudes of mortality are observed for the California gnatcatcher (68-87%), least Bell’s vireo (59-77%), black-capped vireo (55-73%) and golden-cheeked warbler (55-70%) whereas the smallest values are seen for the Attwater’s prairie chicken, Inyo California towhee, lesser prairie chicken and masked bobwhite, all having less than 1% mortality. The wide area and pasture uses result in greater mortality overall than the mosquito adulticide use and the same general species trends, with all species having greater than 80% mortality to exposed individuals except for the Attwater’s prairie chicken, lesser prairie chicken and masked bobwhite. This information is considered useful in estimating the magnitude of effect in the portion of the population that is exposed and may be used in evaluating potential population-level impacts of chlorpyrifos on listed birds.
MCnest results
When considering impacts of chlorpyrifos to fecundity of the modeled birds, mortality is the major contributor to declines; however, reproductive effects do occur in surviving birds. Based on the MCnest analyses, approximately 6 of the 13 assessed species are impacted for the mosquito adulticide application using a conservative assumption for the LD50. The magnitude of reproductive decline varies widely between species. Large (80 -90%) reductions in number of broods are predicted for the golden-cheeked warbler and black capped vireo but no effect is predicted for the Attwater’s prairie chicken, Inyo California towhee and lesser prairie chicken. When the central estimate is used for the LD50, no reproductive impacts are predicted. For the wide area and pasture uses, reproductive impacts are predicted for the majority of species even when using the less conservative central LD50 estimate. Magnitude of reproductive declines ranged from 60-100% for all species except the Inyo California towhee (~21%). In general, applications made after the breeding period occur do not result in substantial declines in fecundity.
9 Additional Information relevant for Step 3: ECx and Web-ICE Analyses
Two additional analyses were conducted that may provide relevant information for the Step 3 process, though they did not factor into the weight of evidence approach employed for Step 2. The first analysis was an evaluation of available chronic toxicity data for chlorpyrifos for use in estimating ECx values
4-44

based on regression models in the Toxicity Response Analysis Program (TRAP) v1.22. More details on this analysis can be found in ATTACHMENT 4-2.
The second analysis is an evaluation of the Web-based Interspecies Correlation Estimation (Web-ICE) tool for use in assessing risks to listed species. This evaluation consists of two separate analyses. The first evaluates the ability of Web-Ice to predict toxicity values for each listed species of fish using data for standard test specie (i.e., rainbow trout, bluegill sunfish, and fathead minnow). While Web-ICE is able to predict direct toxicity of a chemical to 17 species of listed fish, the majority of listed species would rely on the availability of genus and family level models for toxicity predictions. An analysis of genus and family level models indicates that when these models are developed from the most sensitive value for each chemical they are generally protective of the most sensitive species within predicted taxa, including listed species, and are more protective than geometric means models. The second analysis explored the appropriateness of using tools such as Web-ICE to develop SSDs, in cases where empirical datasets for particular taxa are limited, by comparing empirically derived SSDs for chemicals with large datasets (e.g., chlorpyrifos) to SSDs derived from predicted datasets. More details on these analyses can be found in ATTACHMENT 4-3.
4-45