Embed Size (px)
Citation preview
4-1
Chapter 4 Evaluating the safety of geological disposal
4.1 Procedure for evaluating the safety of geological disposal The safety of geological disposal of TRU waste was performed in accordance with the safety
requirements discussed in Section 1.2. Here, a safety assessment methodology for geological disposal of
TRU waste is described taking into account the characteristics of TRU waste.
In a 1991 report on safety assessment methods, the OECD/NEA stated that, in addition to deterministic
consequence calculations, the approach to safety assessment should include, for example, uncertainty
analysis and sensitivity analysis and the use of natural analogue data as input for establishing reliability
(multiple methods and arguments). Furthermore, it was stated that the safety and performance assessments
are applied to a wide range of activities with the aim of gaining the understanding of those persons affected
by the disposal project (interested parties). The report reviewed the activities that are necessary to obtain an
adequate evaluation result, such as verification and validation of model, quality assurance, critical reviews
and international cooperation. However, there was insufficient consideration of “how to present and explain
the results of safety assessments in a clear and comprehensive way to decision-makers and the public”
(OECD/NEA, 1991).
When evaluating the safety of the geological disposal of TRU waste, it is essential to consider a generic
geological environment, the existence of multiple types of waste and the temporal and spatial variations in
the characteristics of barrier materials. Such considerations will inevitably involve the evaluation of
multiple uncertainties. In order to gain the confidence of the public, rather than simply that of
decision-makers (including experts) by considering such factors, it is important to take measures to review
thoroughly the effects of these multiple uncertainties and to present them in a way that is easily
understandable.
Here, we have employed an assessment system that aims to meet these goals. In Section 4.1.1 we present
the main components of the system. In Section 4.1.2 we provide an overview of a newly developed
top-down assessment approach, “a comprehensive sensitivity analysis method.” This method is capable of
more thoroughly analyzing the effects of the uncertainties included in the system described in Section 4.1.1
and of presenting the robustness of the assessment in a way that is easily understandable.
4.1.1 Safety assessment system In the 1991 report by the OECD/NEA mentioned above, a general approach to the long-term safety
assessment of disposal systems was proposed (OECD/NEA, 1991). This approach comprises the activities
shown below:
Scenario development
Model development and application
Integrated assessment / uncertainty and sensitivity analysis / regulatory criteria for disposal
Confidence building
4-2
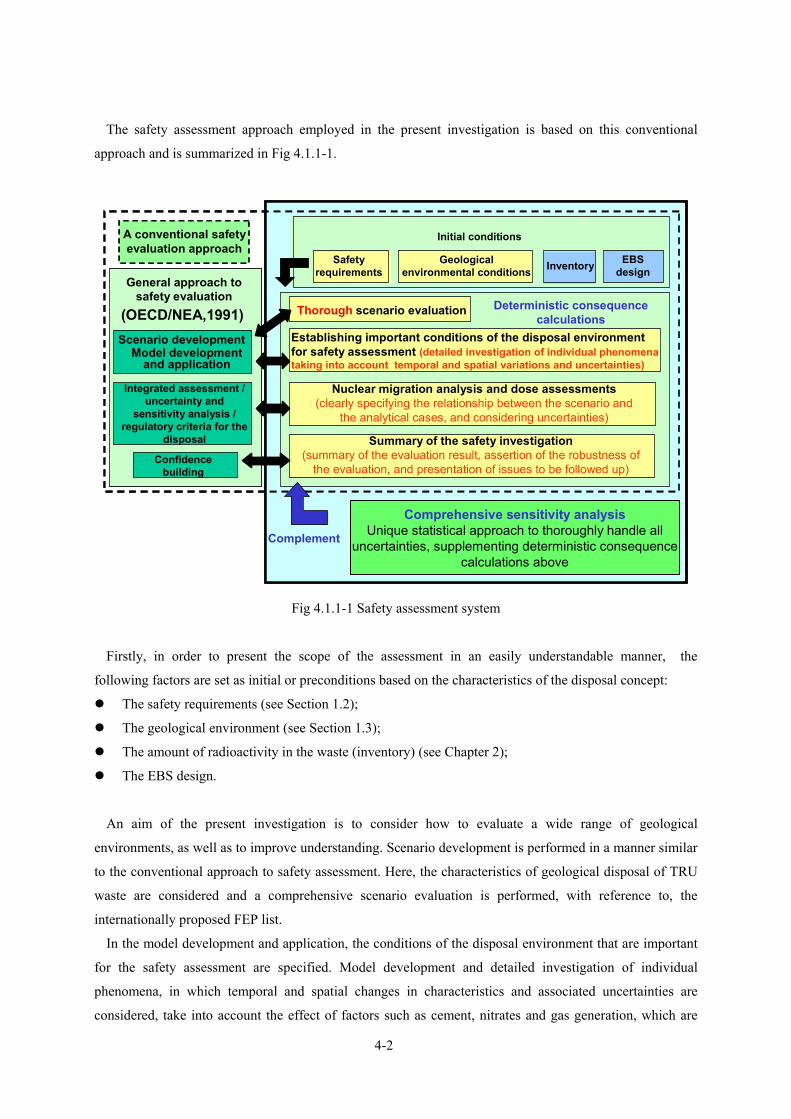
The safety assessment approach employed in the present investigation is based on this conventional
approach and is summarized in Fig 4.1.1-1.
Initial conditions
Geological environmental conditions
EBS design InventorySafety
requirements
Deterministic consequence calculations
Thorough scenario evaluation
Establishing important conditions of the disposal environment for safety assessment (detailed investigation of individual phenomena taking into account temporal and spatial variations and uncertainties)
(OECD/NEA,1991)Scenario development
Model development and application
Confidence building
Complement
A conventional safety evaluation approach
General approach to safety evaluation
Integrated assessment / uncertainty and
sensitivity analysis / regulatory criteria for the
disposal
Nuclear migration analysis and dose assessments(clearly specifying the relationship between the scenario and
the analytical cases, and considering uncertainties)
Summary of the safety investigation(summary of the evaluation result, assertion of the robustness of
the evaluation, and presentation of issues to be followed up)
Comprehensive sensitivity analysisUnique statistical approach to thoroughly handle all
uncertainties, supplementing deterministic consequence calculations above
Fig 4.1.1-1 Safety assessment system
Firstly, in order to present the scope of the assessment in an easily understandable manner, the
following factors are set as initial or preconditions based on the characteristics of the disposal concept:
The safety requirements (see Section 1.2);
The geological environment (see Section 1.3);
The amount of radioactivity in the waste (inventory) (see Chapter 2);
The EBS design.
An aim of the present investigation is to consider how to evaluate a wide range of geological
environments, as well as to improve understanding. Scenario development is performed in a manner similar
to the conventional approach to safety assessment. Here, the characteristics of geological disposal of TRU
waste are considered and a comprehensive scenario evaluation is performed, with reference to, the
internationally proposed FEP list.
In the model development and application, the conditions of the disposal environment that are important
for the safety assessment are specified. Model development and detailed investigation of individual
phenomena, in which temporal and spatial changes in characteristics and associated uncertainties are
considered, take into account the effect of factors such as cement, nitrates and gas generation, which are
4-3
typical for TRU waste disposal.
Integrated assessment, uncertainty and sensitivity analysis and regulatory criteria for disposal, are
considered in the nuclide migration analyses and dose assessments. In addition to setting each analytical
case according to the important environmental conditions of disposal (based on the investigation of
individual phenomena), the relationship between the scenario and the various analytical cases is clearly
specified to increase understanding of the analysis process. Furthermore, to assess the significance of
uncertainties in the scenarios, models and parameters underlying each analytical case, alternative cases
were evaluated using a deterministic method. Resulting dose is compared with regulatory guidelines in
overseas PA reports and natural radiation levels in Japan.
For confidence building the results of a thorough investigation of one scenario are summarised. In
addition to demonstrating the robustness of the safety assessment, these results highlight the issues that
must be addressed in the future.
Investigating the uncertainties in the analysis will lead to increased credibility of the assessment.
However, in order to thoroughly evaluate the effect of the uncertainties using a conventional deterministic
consequence calculation method, a huge number of alternative analytical cases will be needed. This
situation arises because it is necessary to consider the superimposition of multiple investigation cases and
the variations in the individual parameters. It can be expected that the resulting large quantity of output will
increase the difficulty of understanding the safety assessment result. Therefore, in the present work, a
newly developed top-down assessment approach, “comprehensive sensitivity analysis method” is
introduced and applied to evaluate the effects of the uncertainties of individual parameters and the
superimposition of parameter combinations. The comprehensive sensitivity analysis is developed to
complement the conventional deterministic consequence calculations, and make it possible to extract the
conditions of alternative options, in addition to presenting quantitatively the effects of the uncertainties and
the safety margins. It is also possible to define the issues that should be addressed in the future.
4-4
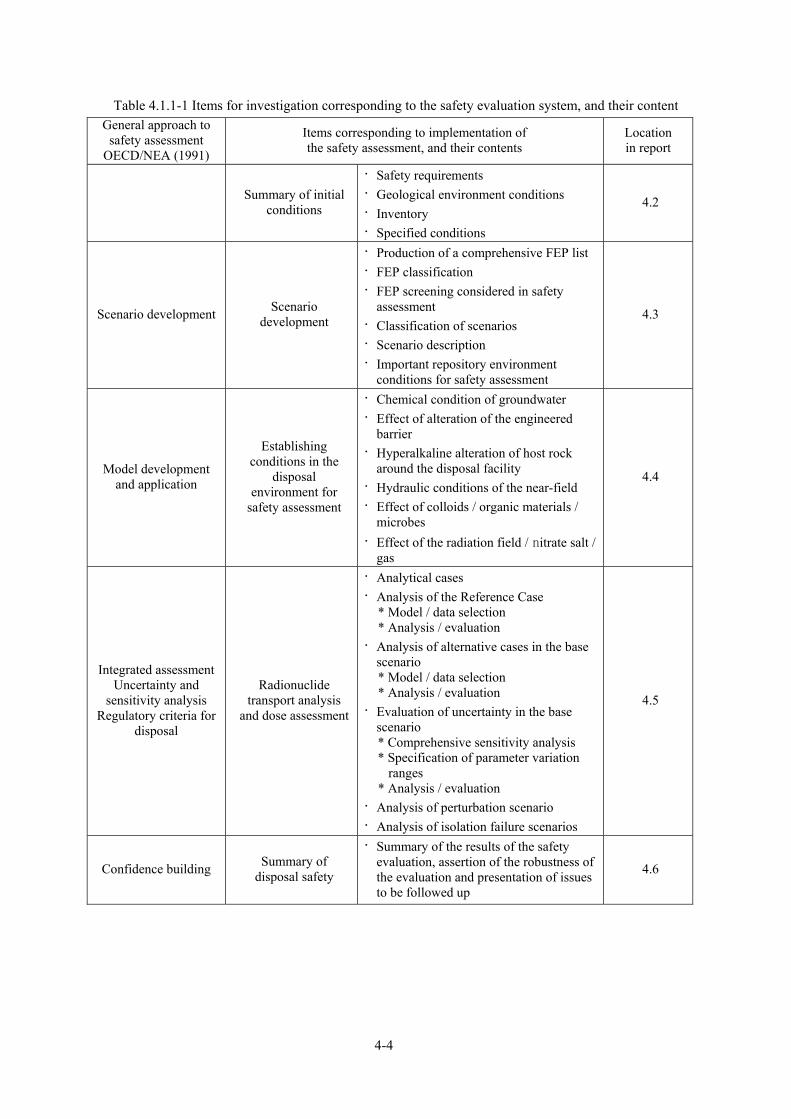
Table 4.1.1-1 Items for investigation corresponding to the safety evaluation system, and their content General approach to
safety assessment OECD/NEA (1991)
Items corresponding to implementation of the safety assessment, and their contents
Location in report
Summary of initial conditions
· Safety requirements · Geological environment conditions · Inventory · Specified conditions
4.2
Scenario development Scenario development
· Production of a comprehensive FEP list · FEP classification · FEP screening considered in safety
assessment · Classification of scenarios · Scenario description · Important repository environment
conditions for safety assessment
4.3
Model development and application
Establishing conditions in the
disposal environment for
safety assessment
· Chemical condition of groundwater · Effect of alteration of the engineered
barrier · Hyperalkaline alteration of host rock
around the disposal facility · Hydraulic conditions of the near-field · Effect of colloids / organic materials /
microbes · Effect of the radiation field / nitrate salt /
gas
4.4
Integrated assessment Uncertainty and
sensitivity analysis Regulatory criteria for
disposal
Radionuclide transport analysis
and dose assessment
· Analytical cases · Analysis of the Reference Case
* Model / data selection * Analysis / evaluation
· Analysis of alternative cases in the base scenario * Model / data selection * Analysis / evaluation
· Evaluation of uncertainty in the base scenario * Comprehensive sensitivity analysis * Specification of parameter variation
ranges * Analysis / evaluation
· Analysis of perturbation scenario · Analysis of isolation failure scenarios
4.5
Confidence building Summary of disposal safety
· Summary of the results of the safety evaluation, assertion of the robustness of the evaluation and presentation of issues to be followed up
4.6

4-5
4.1.2 Methods for evaluating the influence of uncertainties Previously, the influence of uncertainties that must be considered in safety assessments was evaluated by,
for example, comparing the analytical results of a Reference Case with the results of a number of
alternative cases. These cases have alternative values for some parameters that affect uncertainty of the
results (JNC, 2000; TRU Coordination Team, 2000). Potentially, the adequacy of the uncertainty evaluation
depends on the parameter ranges and the number of parameter combinations. However, a complete
evaluation would require a huge number of cases to be analyzed which is considered difficult to explain.
In this report, to complement the existing deterministic analytical methods, a comprehensive sensitivity
analysis is employed to extract combinations of parameter values (defined as “a successful condition”) that
result in doses less than the target value. These values are given for parameters that are identified to be of
relatively high importance. The importance of the parameters is determined by a statistical analysis of the
results obtained when individual parameters are sampled randomly. This complementary approach uses a
model that, as far as possible, comprehensively incorporates the various phenomena that occur within the
repository.
Figure 4.1.2-1 shows the characteristics of the comprehensive sensitivity analysis adopted for the
evaluation described in this report.
①
②
Concept of the comprehensive sensitivity analysis method
(1) Identification of important parameter and characteristic of impact on dose
1)
A nuclide migration model that as far as possible comprehensively incorporates the various phenomena
2)
Total sensitivity analysis based on a statistical method
Summary of safety evaluation
(Sv/
y)
Target dose
Result of deterministic consequence calculation
(Reference case)
Results of deterministic consequence calculationconsidering the uncertainty connected with individual phenomena
Max
imum
Dos
e
Time after disposal (years)
Result based on the Successful Condition
Advantages of comprehensive sensitivity analysis・ Comprehensive presentation of results given
by statistical analysis・Simplification of analysis cases definition
(ease of analyses)
・Understanding of system performance based on the successful condition deduced from key parameters (easy of understanding)
(2) Extraction of successful condition with estimation, identification and confirmation process
Quantification of the influence of uncertaintyQuantification of safety margins
③Presentation of alternative planning options
④Presentation of important issues
Figure 4.1.2-1 Characteristics of the comprehensive sensitivity analysis
The parameters considered to be important are indicated by the extent of variation in dose within the
specified parameter variation ranges and used to extract the successful conditions defined by combinations
4-6
of parameter values (threshold values) within the variation ranges of parameter values that would give a
dose below a specified target value.
By adopting this approach, it is possible to give the information below:
① Quantification of the influence of uncertainty and demonstration of the adequacy of safety
assessments;
② Quantification of safety margin to safety criteria and of parameter tolerance to changes in parameter
values;
③ Presentation of alternative planning options and of the prospect on the treatment of unresolved
problems;
④ Presentation of important issues to be researched.
By adopting this method, it is possible to effectively answer questions assumed from the results of the
deterministic consequence calculations such as whether or not there is greater parameter variation, or
whether other parameter combinations occur.
Up till now, estimating overall uncertainty has been attempted through the definition and calculation of
many analytical cases considering the wide range of parameter variations and parameter combinations. In
contrast, the comprehensive sensitivity analysis achieves this through a comprehensive presentation of
results given by random sampling. Also, it is possible to simplify the definition of the analytical cases and
improve understanding of results. Furthermore, it is possible ease understanding of system performance
based on the successful condition deduced from key parameters.
In this method, all the parameters are treated individually. However, the importance of inter-relationships
among parameter values, for example solubilities, distribution coefficients, porosity, diffusion coefficients
and hydraulic conductivities is pointed out by expert judgment. If correlations between parameters for
different nuclides in the same decay chain are not taken into account, it is possible that many results will be
based on geochemically unreasonable parameter combinations and be highly misleading. For this reason, it
is important to investigate thoroughly how correlations are introduced between combinations of parameter
values in cases when a nuclide in a decay series is important in the evaluation.
In the existing evaluation (TRU Coordination Team, 2000), the dominant nuclides contributing to the
dose from TRU waste are I-129 and C-14. In cases when these nuclides are dominant, it is considered that
the importance of consideration of correlations on combinations of parameter values is relatively small.
Therefore, under these conditions, to avoid the effects of new uncertainties connected with establishing
correlations between parameters, all the parameters are treated individually. The introduction of parameter
correlations is a key issue in cases when decay chain nuclides become important in the assessment.
The analytical results used in this method are described in Section 4.5.4 in this chapter.
4-7
4.2 Summary of initial conditions In this section, safety requirements, geological environment conditions, inventory and specified (EBS)
conditions described in Sections 1.2, 1.3 and Chapters 2 and 3 are revised and summarized as
pre-conditions for a safety assessment.
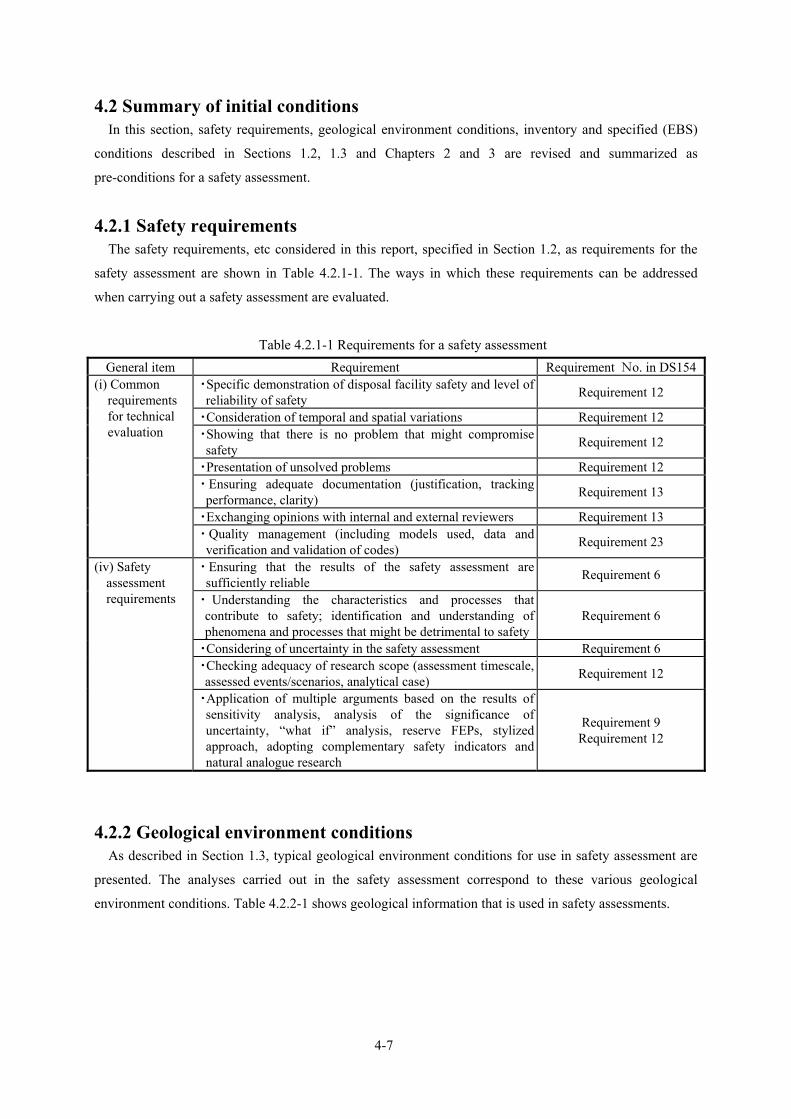
4.2.1 Safety requirements The safety requirements, etc considered in this report, specified in Section 1.2, as requirements for the
safety assessment are shown in Table 4.2.1-1. The ways in which these requirements can be addressed
when carrying out a safety assessment are evaluated.
Table 4.2.1-1 Requirements for a safety assessment General item Requirement Requirement No. in DS154
・Specific demonstration of disposal facility safety and level of reliability of safety Requirement 12
・Consideration of temporal and spatial variations Requirement 12 ・Showing that there is no problem that might compromise safety Requirement 12
・Presentation of unsolved problems Requirement 12 ・ Ensuring adequate documentation (justification, tracking performance, clarity) Requirement 13
・Exchanging opinions with internal and external reviewers Requirement 13
(i) Common requirements for technical evaluation
・ Quality management (including models used, data and verification and validation of codes) Requirement 23
・ Ensuring that the results of the safety assessment are sufficiently reliable Requirement 6
・ Understanding the characteristics and processes that contribute to safety; identification and understanding of phenomena and processes that might be detrimental to safety
Requirement 6
・Considering of uncertainty in the safety assessment Requirement 6 ・Checking adequacy of research scope (assessment timescale, assessed events/scenarios, analytical case) Requirement 12
(iv) Safety assessment requirements
・Application of multiple arguments based on the results of sensitivity analysis, analysis of the significance of uncertainty, “what if” analysis, reserve FEPs, stylized approach, adopting complementary safety indicators and natural analogue research
Requirement 9 Requirement 12
4.2.2 Geological environment conditions As described in Section 1.3, typical geological environment conditions for use in safety assessment are
presented. The analyses carried out in the safety assessment correspond to these various geological
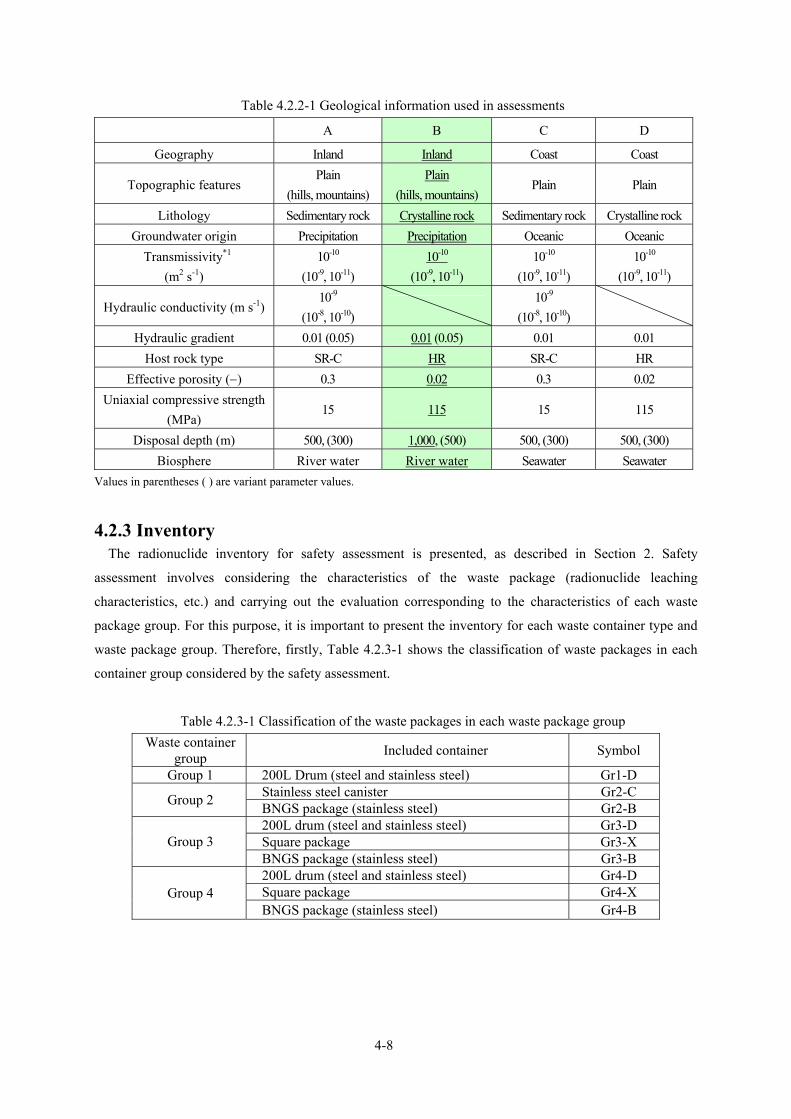
environment conditions. Table 4.2.2-1 shows geological information that is used in safety assessments.
4-8
Table 4.2.2-1 Geological information used in assessments
A B C D
Geography Inland Inland Coast Coast
Topographic features Plain
(hills, mountains) Plain
(hills, mountains) Plain Plain
Lithology Sedimentary rock Crystalline rock Sedimentary rock Crystalline rock Groundwater origin Precipitation Precipitation Oceanic Oceanic Transmissivity*1
(m2 s-1) 10-10
(10-9, 10-11) 10-10
(10-9, 10-11) 10-10
(10-9, 10-11) 10-10
(10-9, 10-11)
Hydraulic conductivity (m s-1) 10-9
(10-8, 10-10)
10-9 (10-8, 10-10)
Hydraulic gradient 0.01 (0.05) 0.01 (0.05) 0.01 0.01 Host rock type SR-C HR SR-C HR
Effective porosity (−) 0.3 0.02 0.3 0.02 Uniaxial compressive strength
(MPa) 15 115 15 115
Disposal depth (m) 500, (300) 1,000, (500) 500, (300) 500, (300) Biosphere River water River water Seawater Seawater
Values in parentheses ( ) are variant parameter values.
4.2.3 Inventory The radionuclide inventory for safety assessment is presented, as described in Section 2. Safety
assessment involves considering the characteristics of the waste package (radionuclide leaching
characteristics, etc.) and carrying out the evaluation corresponding to the characteristics of each waste
package group. For this purpose, it is important to present the inventory for each waste container type and
waste package group. Therefore, firstly, Table 4.2.3-1 shows the classification of waste packages in each
container group considered by the safety assessment.
Table 4.2.3-1 Classification of the waste packages in each waste package group Waste container
group Included container Symbol
Group 1 200L Drum (steel and stainless steel) Gr1-D Stainless steel canister Gr2-C Group 2 BNGS package (stainless steel) Gr2-B 200L drum (steel and stainless steel) Gr3-D Square package Gr3-X Group 3 BNGS package (stainless steel) Gr3-B 200L drum (steel and stainless steel) Gr4-D Square package Gr4-X Group 4 BNGS package (stainless steel) Gr4-B

4-9
Additionally, the temporal variation in the radionuclide inventory in each type of waste container is
shown in Figure 4.2.3-1 and numerical values are given in Table 4.2.3-2.
Figure 4.2.3-1 Temporal variation in radioactivity
1.E+10
1.E+11
1.E+12
1.E+13
1.E+14
1.E+15
1.E+16
1.E+17
1.E+18
1.E+19
1.E+20
1.E+00 1.E+01 1.E+02 1.E+03 1.E+04 1.E+05 1.E+06 1.E+07 1.E+08
時間(年)
放射
能(B
q)
Gr2-C
Gr4-D
Gr4-B
Gr2-B
Gr3-X
Gr3-D
Gr4-X
Gr1-D Gr3-B
Time (years)
Rad
ioac
tivity
(Bq)
1.E+10
1.E+11
1.E+12
1.E+13
1.E+14
1.E+15
1.E+16
1.E+17
1.E+18
1.E+19
1.E+20
1.E+00 1.E+01 1.E+02 1.E+03 1.E+04 1.E+05 1.E+06 1.E+07 1.E+08
時間(年)
放射
能(B
q)
Gr2-C
Gr4-D
Gr4-B
Gr2-B
Gr3-X
Gr3-D
Gr4-X
Gr1-D Gr3-B
Time (years)
Rad
ioac
tivity
(Bq)

4-10
Table 4.2.3-2 Model inventory for each waste package type used in safety assessment
(after 25 years of storage) (Bq) Half-life* Gr1-D Gr2-C Gr2-B Gr3-D Gr3-X Gr3-B Gr4-D Gr4-X Gr4-B
C-14 5.73E+03 0.0E+00 5.0E+14 3.3E+13 5.6E+12 7.0E+10 2.4E+13 8.4E+11 7.5E+09 4.0E+09 Cl-36 3.01E+05 0.0E+00 8.5E+12 1.8E+08 2.7E+11 1.4E+09 3.6E+04 1.3E+10 1.5E+08 4.3E+07
Co-60 5.27E+00 9.5E+04 5.7E+16 1.8E+15 1.9E+12 2.9E+11 1.8E+12 6.0E+13 3.1E+10 9.1E+13
Ni-59 8.00E+04 4.2E+03 7.0E+15 2.3E+14 8.6E+07 1.3E+09 0.0E+00 1.6E+12 1.4E+08 0.0E+00 Ni-63 9.20E+01 5.4E+05 9.6E+17 2.5E+16 9.9E+09 1.6E+11 0.0E+00 2.1E+14 1.8E+10 0.0E+00 Se-79 6.50E+04 3.0E+05 2.2E+12 0.0E+00 2.2E+09 6.4E+10 0.0E+00 4.4E+11 5.8E+09 0.0E+00
Sr-90 2.91E+01 2.8E+10 2.4E+17 1.6E+15 7.2E+14 5.8E+15 4.6E+11 7.8E+16 6.2E+14 2.8E+15
Zr-93 1.53E+06 1.4E+06 2.8E+14 1.6E+13 1.0E+10 2.8E+11 0.0E+00 6.1E+12 3.0E+10 0.0E+00 Nb-94 2.03E+04 2.5E+06 2.5E+15 9.2E+13 5.7E+05 2.0E+07 0.0E+00 5.0E+11 2.2E+06 0.0E+00 Mo-93 3.50E+03 2.9E+01 5.2E+13 0.0E+00 2.3E+06 8.7E+07 0.0E+00 1.2E+10 9.4E+06 0.0E+00
Tc-99 2.13E+05 0.0E+00 6.1E+14 7.0E+11 9.7E+10 2.0E+12 2.4E+08 4.0E+13 2.1E+11 2.5E+11
Pd-107 6.50E+06 8.0E+04 5.1E+11 0.0E+00 2.8E+08 1.6E+10 0.0E+00 1.6E+10 1.5E+09 0.0E+00 Sn-126 1.00E+05 5.7E+05 3.6E+12 0.0E+00 3.6E+09 1.1E+11 0.0E+00 2.4E+12 1.2E+10 0.0E+00
I-129 1.57E+07 5.1E+13 1.7E+11 1.2E+09 9.1E+11 4.8E+09 9.0E+10 2.9E+10 5.1E+08 4.6E+08
Cs-135 2.30E+06 3.3E+05 2.3E+12 1.0E+11 2.3E+09 6.6E+10 5.3E+06 8.8E+11 7.1E+09 6.4E+09 Cs-137 3.00E+01 4.0E+10 2.9E+17 1.2E+16 6.5E+14 8.2E+15 6.8E+11 1.1E+17 8.8E+14 9.3E+15 Cm-244 1.81E+01 6.1E+08 2.9E+15 1.1E+13 9.1E+12 6.9E+13 6.3E+09 6.2E+14 2.8E+12 8.1E+12
Pu-240 6.54E+03 2.8E+08 1.6E+15 2.5E+13 1.2E+13 3.3E+13 7.7E+09 1.5E+15 1.4E+12 1.5E+14
U-236 2.34E+07 1.9E+05 9.1E+11 1.5E+10 4.8E+09 2.2E+10 3.9E+06 2.1E+11 8.3E+08 4.7E+09 Th-232 1.41E+10 2.4E-04 4.9E+04 1.8E+01 6.8E+00 2.7E+01 4.8E-03 2.7E+02 1.0E+00 5.8E+00 Ra-228 6.70E+00 1.5E-04 4.7E+04 1.2E+01 4.7E+00 1.7E+01 3.1E-03 1.7E+02 6.6E-01 3.7E+00
Th-228 1.91E+00 1.1E+07 2.7E+12 1.0E+01 9.5E+09 6.5E+10 2.6E-03 2.5E+11 2.5E+09 3.1E+00
Cm-245 8.50E+03 1.7E+05 7.6E+11 0.0E+00 3.3E+09 1.9E+10 0.0E+00 1.9E+11 7.7E+08 0.0E+00 Pu-241 1.44E+01 1.3E+11 7.1E+17 1.1E+16 5.5E+15 1.5E+16 3.5E+12 6.6E+17 6.2E+14 6.8E+16 Am-241 4.32E+02 2.3E+09 1.1E+16 1.4E+14 1.1E+14 4.1E+14 5.2E+10 7.0E+15 4.0E+13 4.4E+14
Np-237 2.14E+06 1.3E+04 1.2E+12 1.1E+10 6.0E+09 3.0E+10 4.2E+06 1.2E+12 1.3E+09 6.5E+09
U-233 1.59E+05 7.8E+00 4.8E+09 1.2E+06 8.9E+05 4.0E+06 4.4E+02 1.5E+08 1.6E+05 5.6E+05 Th-229 7.34E+03 6.9E-02 1.4E+07 1.4E+03 2.4E+03 1.2E+04 5.1E-01 2.4E+05 4.5E+02 6.1E+02
Cm-246 4.73E+03 0.0E+00 4.0E+08 0.0E+00 1.9E+08 0.0E+00 0.0E+00 3.2E+08 0.0E+00 0.0E+00
Pu-242 3.87E+05 1.2E+06 6.7E+12 0.0E+00 2.0E+10 1.4E+11 0.0E+00 3.7E+12 5.8E+09 1.9E+11 U-238 4.47E+09 1.6E+05 7.6E+11 3.2E+10 1.2E+10 1.8E+10 4.6E+06 2.5E+11 6.9E+08 6.7E+09 U-234 2.45E+05 2.2E+06 5.5E+12 2.8E+11 6.6E+10 1.1E+11 4.8E+07 4.5E+12 4.6E+09 1.6E+11
Th-230 7.70E+04 1.6E+02 1.8E+08 2.9E+07 5.8E+06 2.6E+06 4.1E+03 3.1E+08 1.1E+05 7.6E+06
Ra-226 1.60E+03 8.3E-01 9.4E+05 1.6E+05 3.9E+04 1.1E+04 2.2E+01 1.7E+06 4.4E+02 3.7E+04 Pb-210 2.23E+01 1.8E-01 2.1E+05 3.4E+04 1.0E+04 2.1E+03 4.7E+00 3.7E+05 8.2E+01 7.7E+03 Am-243 7.38E+03 1.3E+07 1.9E+14 4.1E+11 1.5E+11 1.5E+12 2.2E+08 1.5E+13 6.2E+10 2.1E+11
Pu-239 2.41E+04 1.8E+08 9.8E+14 2.3E+13 8.9E+12 2.1E+13 5.0E+09 1.3E+15 8.4E+11 1.0E+14
U-235 7.04E+08 1.1E+04 5.4E+10 3.5E+09 1.2E+09 1.3E+09 2.9E+05 5.2E+10 4.8E+07 4.1E+08 Pa-231 3.28E+04 6.0E+00 3.2E+07 1.9E+06 7.9E+05 6.7E+05 1.5E+02 2.9E+07 2.5E+04 2.2E+05
Ac-227 2.18E+01 1.9E+00 1.1E+07 5.8E+05 3.0E+05 2.1E+05 4.8E+01 9.7E+06 7.8E+03 6.7E+04
* Half-life (years): Library data of ORIGEN2.1 used
4-11
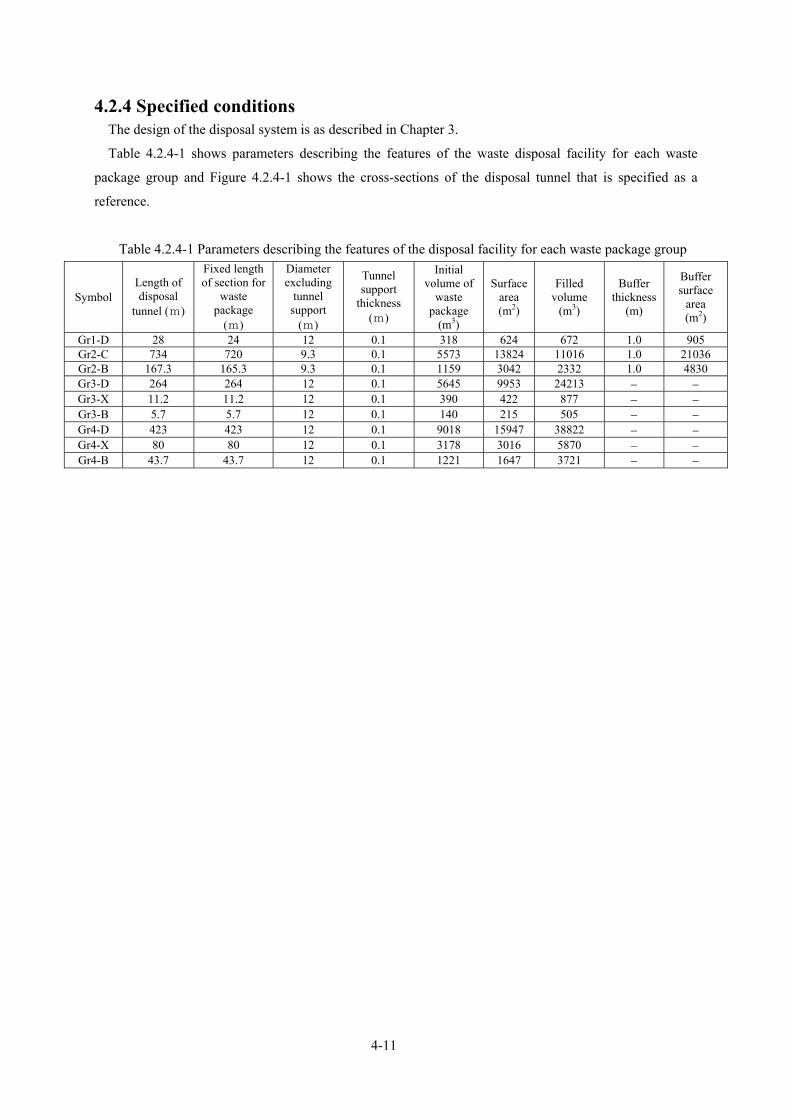
4.2.4 Specified conditions The design of the disposal system is as described in Chapter 3.
Table 4.2.4-1 shows parameters describing the features of the waste disposal facility for each waste
package group and Figure 4.2.4-1 shows the cross-sections of the disposal tunnel that is specified as a
reference.
Table 4.2.4-1 Parameters describing the features of the disposal facility for each waste package group
Symbol Length of disposal
tunnel (m)
Fixed length of section for
waste package
(m)
Diameter excluding
tunnel support
(m)
Tunnel support
thickness (m)
Initial volume of
waste package
(m3)
Surface area (m2)
Filled volume
(m3)
Buffer thickness
(m)
Buffer surface
area (m2)
Gr1-D 28 24 12 0.1 318 624 672 1.0 905 Gr2-C 734 720 9.3 0.1 5573 13824 11016 1.0 21036 Gr2-B 167.3 165.3 9.3 0.1 1159 3042 2332 1.0 4830 Gr3-D 264 264 12 0.1 5645 9953 24213 − − Gr3-X 11.2 11.2 12 0.1 390 422 877 − − Gr3-B 5.7 5.7 12 0.1 140 215 505 − − Gr4-D 423 423 12 0.1 9018 15947 38822 − − Gr4-X 80 80 12 0.1 3178 3016 5870 − − Gr4-B 43.7 43.7 12 0.1 1221 1647 3721 − −

4-12
Cross-section of disposal tunnel
Group 1
Disposal tunnel size Internal diameter 12 m
Thickness of support 0.1 m
Type of waste package ① 200L drum
① Gr1-D
Group 2
Disposal tunnel size Internal diameter 9.3 m
Thickness of support 0.1 m
Type of waste package ② Canister
③ BNGS package
② Gr2-C ③ Gr2-B
Group 3
④ Gr3-D ⑤ Gr3-X ⑥ Gr3-B
Disposal tunnel size Internal diameter 12 m
Thickness of support 0.1 m
Type of waste package ④ 200L drum ⑤ Square package
⑥ BNGS package
Group 4
⑦ Gr4-D ⑧ Gr4-X ⑨ Gr4-B
Disposal tunnel size Internal diameter 12m
Thickness of support 0.1m
Type of waste package ⑦ 200L drum ⑧ Square package
⑨ BNGS package
Figure 4.2.4-1 Cross-sections of disposal tunnels specified as a reference
1.6
1.2
9.3
4-13
4.3 Scenario development Generally, scenario development means describing the long-term behaviour of the repository, based on a
summary and integration of the basic scientific and technical information that is needed for safety
assessment. FEPs, (Features, Events and Processes) are abstracted from this important basic information,
giving consideration to the characteristics of the waste packages that are to be disposed of, repository
design and the geological conditions around the repository. By screening the comprehensively extracted
FEPs, the FEPs to be considered in the safety assessment are obtained. From this reduced set of FEPs, the
scenarios to be considered in the safety assessment is constructed.
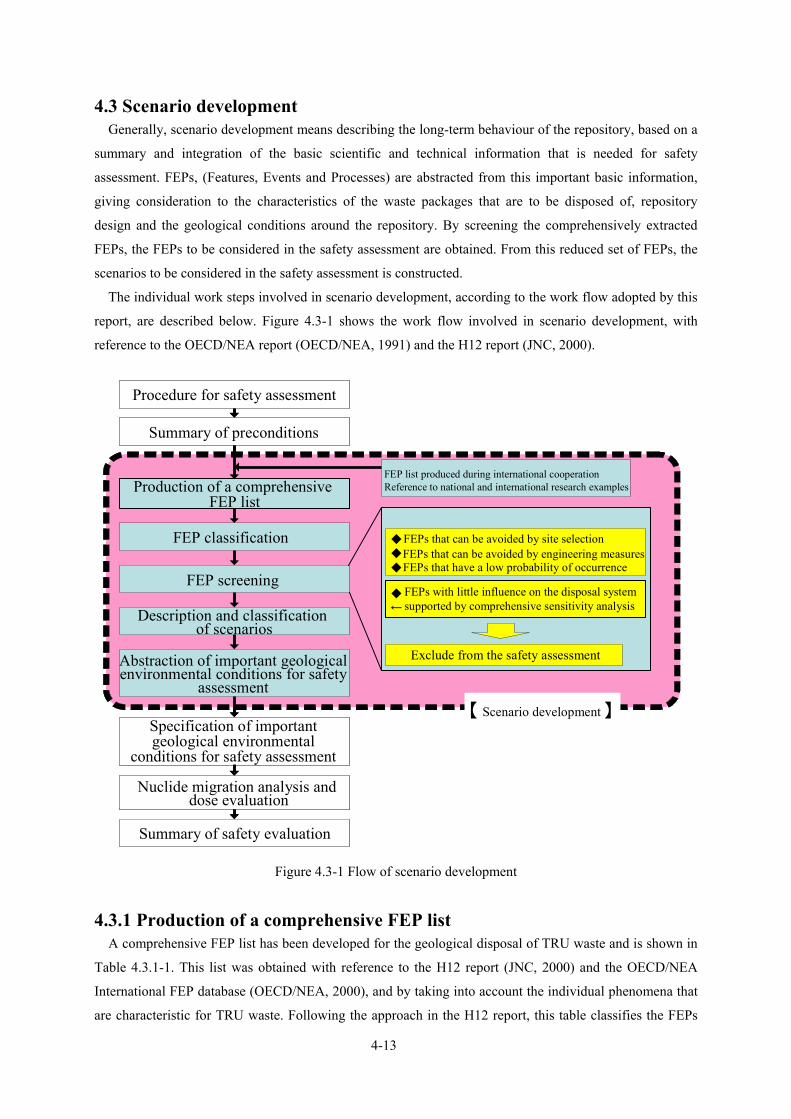
The individual work steps involved in scenario development, according to the work flow adopted by this
report, are described below. Figure 4.3-1 shows the work flow involved in scenario development, with
reference to the OECD/NEA report (OECD/NEA, 1991) and the H12 report (JNC, 2000).
Figure 4.3-1 Flow of scenario development
4.3.1 Production of a comprehensive FEP list A comprehensive FEP list has been developed for the geological disposal of TRU waste and is shown in
Table 4.3.1-1. This list was obtained with reference to the H12 report (JNC, 2000) and the OECD/NEA
International FEP database (OECD/NEA, 2000), and by taking into account the individual phenomena that
are characteristic for TRU waste. Following the approach in the H12 report, this table classifies the FEPs
Procedure for safety assessment
FEP classification
FEP screening
Description and classification of scenarios
安全評価
←
【 Scenario development 】
Summary of preconditions
Production of a comprehensive FEP list
Abstraction of important geological environmental conditions for safety
assessment
Specification of important geological environmental
conditions for safety assessment
Nuclide migration analysis and dose evaluation
Summary of safety evaluation
FEP list produced during international cooperationReference to national and international research examples
FEPs that can be avoided by site selectionFEPs that can be avoided by engineering measuresFEPs that have a low probability of occurrence
FEPs with little influence on the disposal systemsupported by comprehensive sensitivity analysis
Exclude from the safety assessment
4-14
according to the locations within the multibarrier system to which they apply (across each row) and their
related phenomena or functions (down each column).
[ Classification of location ]
・ Waste
・ Filler
・ Structural framework
・ Bentonite
・ Plug / grout / support / backfill
・ Host rock
[ Classification of phenomena ]
・ Thermal phenomena / characteristics
・ Hydraulic phenomena / characteristics
・ Mechanical phenomena / characteristics
・ Chemical phenomena / characteristics
・ Radiological phenomena / characteristics
・ Nuclide migration phenomena / characteristics
・ Phenomena that may potentially disturb the system (initial defects / natural phenomena /
human activities)
If this classification is compared to that in the H12 report, the organisation is essentially the same for
locations beyond the bentonite. However, taking into account the structure of the engineered barrier system
for the geological disposal of TRU waste, the classification is specified differently for the waste packages
and their surroundings.
Nevertheless, in the organization of phenomena, there is some overlap with the H12 report: ①
Phenomena connected with environmental conditions described as T (Thermal), H (Hydrological), M
(Mechanical), C (Chemical) and R (Radiological) that are shown on a phenomena classification diagram;
②nuclide migration phenomena; and ③system disturbances. Detailed FEPs that are classified as ①
environmental conditions and ②nuclide migration phenomena include phenomena that are characteristic
of the geological disposal of TRU waste (e.g. influences of cementitious materials, radionuclide migration
in gaseous form, etc.)

4-15
Table 4.3.1-1 Comprehensive FEP list for the geological disposal of TRU waste
Waste Filler Structural framework Buffer material Plug and grout/Support/Backfill Host rock(Secondary device)
Thermal WT-01 Waste packages’sthermophysical properties
MT-01 Filling materials’ thermophysicalproperties
ST-01 Structural framework’s thermophysical properties BT-01 Buffer materials’ thermophysical
properties XT-01 Secondary devices’ thermophysicalproperties
RT-01 Host rocks’ thermophysicalpropertiesPhenomena/
Characteristics WT-02 Waste package’s temperature MT-02 Filling materials’ temperature ST-02 Structural framework’s temperature BT-02 Buffer materials’ temperature XT-02 Secondary devices’ temperature RT-02 Host rocks’ temperatureWT-03 Waste package’s thermal expansion MT-03 Filling materials’ thermal expansion ST-03 Structural framework’s thermal
expansion BT-03 Buffer materials’ thermal expansion XT-03 Secondary devices’ thermal expansion
RT-03 Host rocks’ thermal expansionWT-04 Production of radioactive decay heat MT-04 Heating by absorption of γ-rays
from the waste packageST-04
MT-05 Heating by hydration ST-05 XT-04 Heating by hydrationHydraulic WH-01 Waste package’s hydraulic
characteristicsMH-01 Filling materials’ hydraulic
characteristicsSH-01 Structural framework’s hydraulic
characteristics BH-01 Buffer materials’ hydraulic characteristics XH-01 Secondary devices’ hydraulic
characteristicsRH-01 Host rocks’ thermophysical
propertiesPhenomena/Characteristics
WH-02 Waste package’s saturation MH-02 Filling materials’ saturation SH-02 Structural framework’s saturation BH-02 Buffer materials’ saturation XH-02 Secondary devices’ saturation RH-02 Host rocks’ saturationWH-03 Groundwater flow in waste package MH-03 Groundwater flow in filling material SH-03 Groundwater flow in structural
frameworkBH-03 Groundwater flow in buffer material XH-03 Groundwater flow in secondary devices RH-03 Groundwater flow in host rocks
Mechanical WM-01 Waste package’s mechanical properties
MM-01 Filling materials’ mechanical properties
SM-01 Structural framework’s mechanical properties
BM-01 Buffer materials’ mechanical properties
XM-01 Secondary devices’ mechanical properties RM-01 Host rocks’ mechanical properties
WM-02 Waste package’s stress MM-02 Filling materials’ stress/deformation SM-02 Structural framework’s stress/deformation
BM-02 Buffer materials’ stress/deformation XM-02 Secondary devices’ stress/ deformation RM-02 Host rocks’ stress
WM-03 Swelling of solid asphalt BM-03 Swelling of buffer material XM-03 Swelling of secondary devices RM-03 Host rocks’ creepWM-04Deformation of solid asphaltWM-05 Release from solid asphalt BM-05 Release from buffer material XM-05 Release from secondary devicesWM-06 Fracturing of solid asphalt MM-04 Fracturing of filling material SM-04 Fracturing of structural framework XM-06 Fracturing of secondary devicesWM-07 Waste package movement/settling SM-05 Structural framework’s
movement/settlingWM-08 Corrosion expansion of metal wasteSM-06 Corrosion expansion of
reinforcing steel XM-07 Corrosion expansion of rock boltsWM-09 Damage to external containerWM-10 Corrosion expansion of external
containerChemical WC-01 Waste package’s chemical
characteristicsMC-01 Filling materials’ chemical
characteristicsSC-01 Structural framework’s chemical
characteristicsBC-01 Buffer materials’ chemical
characteristicsXC-01 Secondary devices’ chemical
characteristicsRC-01 Host rocks’ chemical characteristics
WC-02 Solute transport in waste packages MC-02 Solute transport in filling materials SC-02 Solute transport in structural framework
BC-02 Solute transport in buffer materials XC-02 Solute transport in secondary devices RC-02 Solute transport in host rocks
WC-03 Waste package-groundwater reaction
MC-03 Filling materials’-groundwater reaction SC-03 Structural framework-groundater
reactionBC-03 Buffer materials-groundwater
reactionXC-03 Secondary devices-groundwater
reaction RC-03 Host rocks’-groundwater reactionWC-04 Chemical alteration of waste
packages (except corrosion)MC-04 Chemical alteration of filling
materials SC-04 Chemical alteration of structural framework
BC-04 Chemical alteration of buffer materials
XC-04 Chemical alteration of secondary devices
RC-04 Chemical alteration of host rocksWC-05 Corrosion of waste packageWC-06 Effect of organics in waste packages MC-05 Effect of organics in filling materials SC-05 Effect of organics BC-05 Effect of organics in buffer materials XC-05 Effect of organics RC-05 Effect of organics in host rocksWC-07 Effect of microbes in waste packagesMC-06 Effect of microbes in filling materialsSC-06 Effect of microbes BC-06 Effect of microbes in buffer materials XC-06 Effect of microbes RC-06 Effect of microbes in host rocksWC-08 Effect of colloids in waste packages MC-07 Effect of colloids in filling materials SC-07 Effect of colloids BC-07 Effect of colloids in buffer materials XC-07 Effect of colloids RC-07 Effect of colloids in host rocksWC-09 Effect of nitrate in waste packages MC-08 Effect of nitrate in filling materials SC-08 Effect of nitrate BC-08 Effect of nitrate in buffer materials XC-08 Effect of nitrate RC-08 Effect of nitrate in host rocksWC-10 Effect of sulphate in waste packages MC-09 Effect of sulphate in filling materials SC-09 Effect of sulphate BC-09 Effect of sulphate in buffer materials XC-09 Effect of sulphate RC-09 Effect of sulphate in host rocksWC-11 Effect of gas production in waste
packagesMC-10 Effect of gas production in filling
materialsSC-10 Effect of gas production in
structural frameworkBC-10 Effect of gas production in buffer
materialsXC-10 Effect of gas production in
secondary devicesRC-10 Effect of gas production in host
rocksWC-12 Effect of salt accumulation in waste
packagesMC-11 Effect of salt accumulation in filling
materialsSC-11 Effect of salt production in
structural frameworkBC-11 Effect of salt accumulation in buffer
materialsRadiological WR-01 Radionuclide decay/production in
the waste package MR-01 Radionuclide decay/production in the filling materials
SR-01 Radionuclide decay/production in the structural framework BR-01 Radionuclide decay/production in
buffer materials XR-01 Radionuclide decay/production in secondary devices
RR-01 Radionuclide decay/production in host rocks
WR-02 Radiolysis of waste package’s porewater
MR-02 Radiolysis of the filling materials’porewater
SR-02 Radiolysis of the structural framwork’s porewater
BR-02 Radiolysis of buffer materials’porewater XR-02 Radiolysis of secondary devices’
porewaterRR-02 Radiolysis of host rocks’ porewater
WR-03 Radiation damage of waste package MR-03 Radiation damage of filling materials SR-03 Radiation damage of structural framework
BR-03 Radiation damage of buffer materials XR-03 Radiation damage of secondary devices
RR-03 Radiation damage of host rocks
Nuclide migration
WN-01 Characteristics of mass transport in waste packages
MN-01 Characteristics of mass transport in the filling materials
SN-01 Characteristics of mass transport in the structural framework
BN-01 Characteristics of mass transport in the buffer material
XN-01 Characteristics of mass transport in the secondary devices
RN-01 Characteristics of mass transport in the host rock
WN-02 Nuclide release from porous matrixMN-02 Nuclide advection/dispersion SN-02 BN-02 XN-02 RN-02 Nuclide advection/dispersionWN-03 Nuclide release from impermeable
matrixMN-03 Nuclide diffusion SN-03 BN-03 XN-03 RN-03WN-04 Nuclide release from the exterior
surfaces of waste packagesWN-05 Nuclide sorption MN-04 Nuclide sorption SN-04 BN-04 XN-04
RN-04
WN-06 Nuclide precipitation/dissolution MN-05 Nuclide precipitation/dissolution SN-05 BN-05 XN-05RN-05
WN-07 Nuclide release in colloidal form MN-06 Nuclide migration in colloid form SN-06 BN-06 XN-06RN-06
WN-08 Nuclide release in gaseous form MN-07 Nuclide migration in gaseous form SN-07 BN-07 XN-07RN-07
WN-09 Variation in nuclides in form of nitrates
MN-08 Variation in nuclides in form of nitrates
SN-08 BN-08 XN-08RN-08RN-09 Criticality
WQ-01 Production/manufacturing faults inwaste packages
MQ-01 Production/manufacturing faults in filling material
SQ-01 Production/manufacturing faults in structural framework
BQ-01 Production/manufacturing faults in buffer material
XQ-01 Production/manufacturing faults in secondary devices
RQ-01 Failure of boring and tunnelSeals due to deterioration
Phenomenathat may potentially disturb the system
NP-01 Earthquake/Active faultingNP-02 Volcanism/Magmatic activity
NP-03 Uplift/SubsidenceNP-04 Climate/Sealevel change
NP-05 Meteorite impactHA-01 Boring (Investigation, exploration, underground applications, public works etc)
HA-02 Geological environment (Human activities)HA-03 Drilling/mining/other underground activities (Human intrusion)
HA-04 Water well drilling/samplingHA-05 Water management (Water storage/dam)
Phenomena/Characteristics
Phenomena/Characteristics
Phenomena/Characteristics
Phenomena/Characteristics
Heating by absorption of γ-rays from the waste packageHeating by hydration
Variation in nuclides in form of nitrates
Variation in nuclides in form of nitrates
Variation in nuclides in form of nitrates
Variation in nuclides in form of nitrates
Nuclide migration in gaseous form Nuclide migration in gaseous form Nuclide migration in gaseous formNuclide migration in gaseous formNuclide migration in colloid form Nuclide migration in colloid form Nuclide migration in colloid formNuclide migration in colloid formNuclide precipitation/dissolution Nuclide precipitation/dissolution Nuclide precipitation/dissolutionNuclide precipitation/dissolutionNuclide sorption Nuclide sorption Nuclide sorptionNuclide sorptionNuclide diffusion Nuclide diffusion Nuclide diffusion Nuclide diffusion
Nuclide advection/dispersion Nuclide advection/dispersion Nuclide advection/dispersion

4-16
4.3.2 FEP classification Using combinations of the comprehensive FEPs summarized in the preceding paragraphs, it is possible
to describe the future behavior of the geological disposal system for TRU waste. Considering the expected
function of each barrier and the main influences of these functions, as well as the final system classification
etc, the FEPs are classified and summary descriptions are given of the FEPs belonging to each category.
The FEPs are classified into the following 5 categories.
・ FEPs connected with safety requirements, geological environment condition, inventory and
EBS design
・ FEPs connected with the assumed or specified safety functions of the disposal system
・ FEPs that potentially influence the assumed or specified safety functions of the disposal
system
・ FEPs that potentially harm the assumed or specified safety functions of the disposal system
・ FEPs that potentially refute the assumed or specified safety functions of the disposal system
FEPs connected with the assumed or specified safety functions of the disposal system basically comprise
those concerned with the expected long-term safety performance of the disposal system. FEPs that
inherently cause the safety function to be inhibited are included in this category. These FEPs are connected
with the diversity of TRU waste, the radionuclides and, at the same time, organic matter and nitrate that are
unavoidably included in the waste packages. The FEPs connected with pre-conditions and FEPs connected
with the assumed or specified safety functions of the disposal system are used to construct the Reference
Scenario (and also the Reference Case) of the Base Scenario described below.
FEPs that potentially influence the assumed or specified safety functions of the disposal system comprise
those that are major factors inherent in the engineered barrier system that may act as important initiators of
phenomena that could potentially influence the disposal system’s safety functions. However, it is uncertain
whether these phenomena actually produce these effects. Additionally, the phenomena that are considered
may produce a relatively small influence. In the Base Scenario described below, scenarios (alternative
scenarios) other than the Reference Scenario are constructed using FEPs in this category.
FEPs that potentially harm the assumed or specified safety functions of the disposal system comprise
FEPs that are major perturbing factors external to, and independent of, the engineered barriers. The
included FEPs are important initiating phenomena that may potentially inhibit the disposal system from
exhibiting adequate safety functions. Fundamentally, these are FEPs connected with natural phenomena,
those connected with future human activities and those connected with engineering measures to rectify
initial defects. The Perturbation Scenarios described below are constructed using FEPs in this category.
FEPs that potentially refute the assumed or specified safety functions of the disposal system also
comprise FEPs are major perturbing factors external to, and independent of, the engineered barrier system
However, these FEPs have the potential to undermine the safety function of the repository system
connected with nuclide migration on groundwater scenario primarily. These FEPs are used to construct the
Isolation Failure Scenario described below.
Individual comprehensive FEPs that belong to each FEP category and integrated FEPs and the
4-17
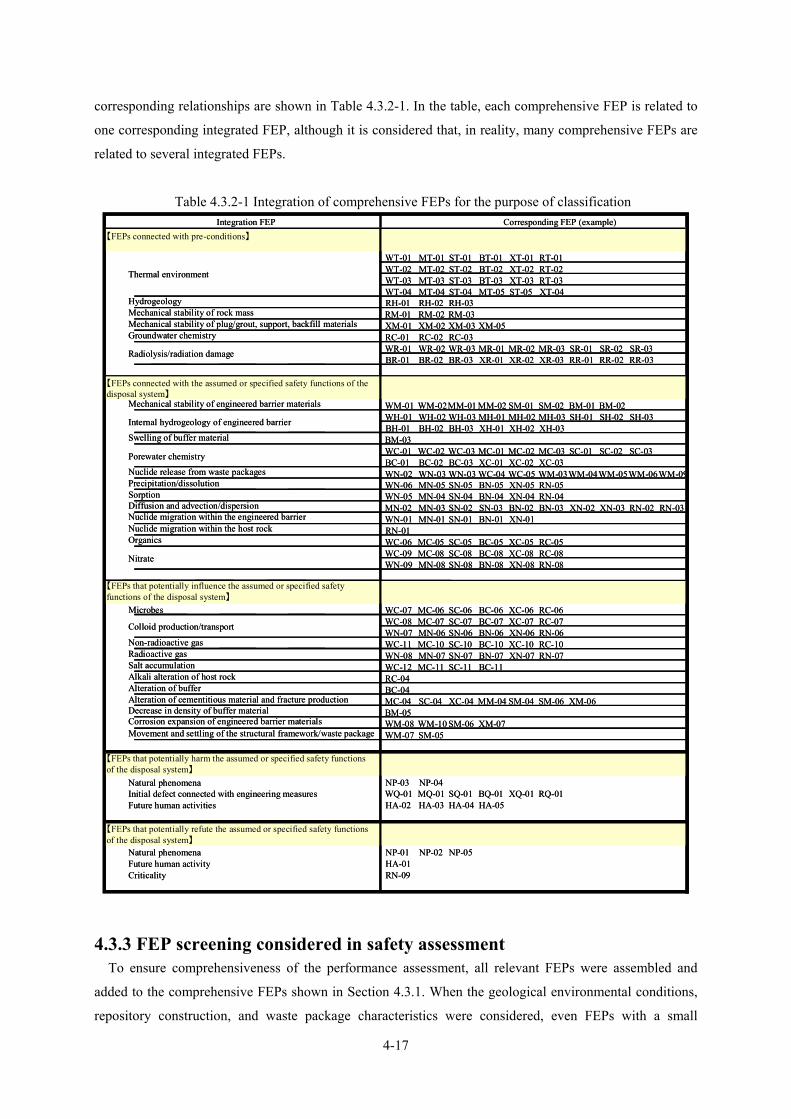
corresponding relationships are shown in Table 4.3.2-1. In the table, each comprehensive FEP is related to
one corresponding integrated FEP, although it is considered that, in reality, many comprehensive FEPs are
related to several integrated FEPs.
Table 4.3.2-1 Integration of comprehensive FEPs for the purpose of classification
4.3.3 FEP screening considered in safety assessment To ensure comprehensiveness of the performance assessment, all relevant FEPs were assembled and
added to the comprehensive FEPs shown in Section 4.3.1. When the geological environmental conditions,
repository construction, and waste package characteristics were considered, even FEPs with a small
Integration FEP Corresponding FEP (example)【FEPs connected with pre-conditions】
WT-01 MT-01 ST-01 BT-01 XT-01 RT-01WT-02 MT-02 ST-02 BT-02 XT-02 RT-02WT-03 MT-03 ST-03 BT-03 XT-03 RT-03WT-04 MT-04 ST-04 MT-05 ST-05 XT-04
Hydrogeology RH-01 RH-02 RH-03Mechanical stability of rock mass RM-01 RM-02 RM-03Mechanical stability of plug/grout, support, backfill materials XM-01 XM-02 XM-03 XM-05Groundwater chemistry RC-01 RC-02 RC-03
WR-01 WR-02 WR-03 MR-01 MR-02 MR-03 SR-01 SR-02 SR-03BR-01 BR-02 BR-03 XR-01 XR-02 XR-03 RR-01 RR-02 RR-03
【FEPs connected with the assumed or specified safety functions of the disposal system】
Mechanical stability of engineered barrier materials WM-01 WM-02MM-01 MM-02 SM-01 SM-02 BM-01 BM-02WH-01 WH-02 WH-03 MH-01 MH-02 MH-03 SH-01 SH-02 SH-03BH-01 BH-02 BH-03 XH-01 XH-02 XH-03
Swelling of buffer material BM-03WC-01 WC-02 WC-03 MC-01 MC-02 MC-03 SC-01 SC-02 SC-03BC-01 BC-02 BC-03 XC-01 XC-02 XC-03
Nuclide release from waste packages WN-02 WN-03 WN-03 WC-04 WC-05 WM-03WM-04WM-05WM-06WM-09Precipitation/dissolution WN-06 MN-05 SN-05 BN-05 XN-05 RN-05Sorption WN-05 MN-04 SN-04 BN-04 XN-04 RN-04Diffusion and advection/dispersion MN-02 MN-03 SN-02 SN-03 BN-02 BN-03 XN-02 XN-03 RN-02 RN-03Nuclide migration within the engineered barrier WN-01 MN-01 SN-01 BN-01 XN-01Nuclide migration within the host rock RN-01Organics WC-06 MC-05 SC-05 BC-05 XC-05 RC-05
WC-09 MC-08 SC-08 BC-08 XC-08 RC-08WN-09 MN-08 SN-08 BN-08 XN-08 RN-08
【FEPs that potentially influence the assumed or specified safety functions of the disposal system】
Microbes WC-07 MC-06 SC-06 BC-06 XC-06 RC-06WC-08 MC-07 SC-07 BC-07 XC-07 RC-07WN-07 MN-06 SN-06 BN-06 XN-06 RN-06
Non-radioactive gas WC-11 MC-10 SC-10 BC-10 XC-10 RC-10Radioactive gas WN-08 MN-07 SN-07 BN-07 XN-07 RN-07Salt accumulation WC-12 MC-11 SC-11 BC-11Alkali alteration of host rock RC-04Alteration of buffer BC-04Alteration of cementitious material and fracture production MC-04 SC-04 XC-04 MM-04 SM-04 SM-06 XM-06Decrease in density of buffer material BM-05Corrosion expansion of engineered barrier materials WM-08 WM-10 SM-06 XM-07Movement and settling of the structural framework/waste package WM-07 SM-05
【FEPs that potentially harm the assumed or specified safety functions of the disposal system】
Natural phenomena NP-03 NP-04Initial defect connected with engineering measures WQ-01 MQ-01 SQ-01 BQ-01 XQ-01 RQ-01Future human activities HA-02 HA-03 HA-04 HA-05
【FEPs that potentially refute the assumed or specified safety functions of the disposal system】
Natural phenomena NP-01 NP-02 NP-05Future human activity HA-01Criticality RN-09
Thermal environment
Colloid production/transport
Internal hydrogeology of engineered barrier
Nitrate
Porewater chemistry
Radiolysis/radiation damage
4-18
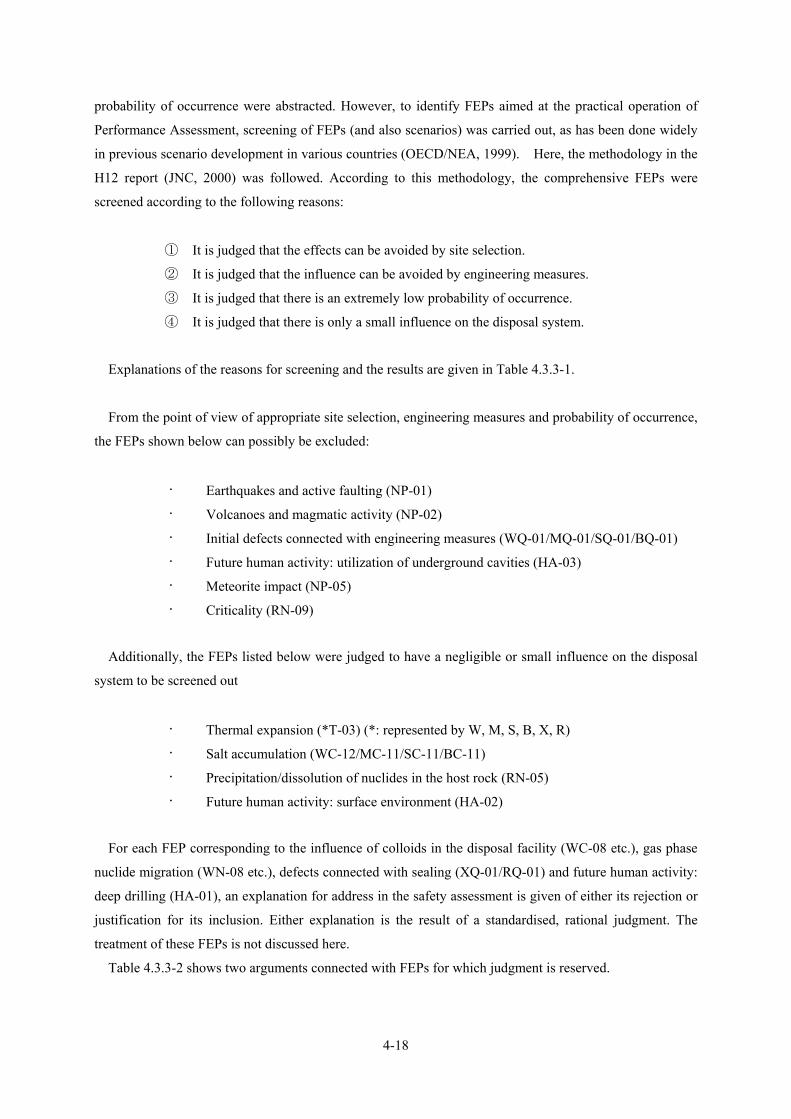
probability of occurrence were abstracted. However, to identify FEPs aimed at the practical operation of
Performance Assessment, screening of FEPs (and also scenarios) was carried out, as has been done widely
in previous scenario development in various countries (OECD/NEA, 1999). Here, the methodology in the
H12 report (JNC, 2000) was followed. According to this methodology, the comprehensive FEPs were
screened according to the following reasons:
① It is judged that the effects can be avoided by site selection.
② It is judged that the influence can be avoided by engineering measures.
③ It is judged that there is an extremely low probability of occurrence.
④ It is judged that there is only a small influence on the disposal system.
Explanations of the reasons for screening and the results are given in Table 4.3.3-1.
From the point of view of appropriate site selection, engineering measures and probability of occurrence,
the FEPs shown below can possibly be excluded:
· Earthquakes and active faulting (NP-01)
· Volcanoes and magmatic activity (NP-02)
· Initial defects connected with engineering measures (WQ-01/MQ-01/SQ-01/BQ-01)
· Future human activity: utilization of underground cavities (HA-03)
· Meteorite impact (NP-05)
· Criticality (RN-09)
Additionally, the FEPs listed below were judged to have a negligible or small influence on the disposal
system to be screened out
· Thermal expansion (*T-03) (*: represented by W, M, S, B, X, R)
· Salt accumulation (WC-12/MC-11/SC-11/BC-11)
· Precipitation/dissolution of nuclides in the host rock (RN-05)
· Future human activity: surface environment (HA-02)
For each FEP corresponding to the influence of colloids in the disposal facility (WC-08 etc.), gas phase
nuclide migration (WN-08 etc.), defects connected with sealing (XQ-01/RQ-01) and future human activity:
deep drilling (HA-01), an explanation for address in the safety assessment is given of either its rejection or
justification for its inclusion. Either explanation is the result of a standardised, rational judgment. The
treatment of these FEPs is not discussed here.
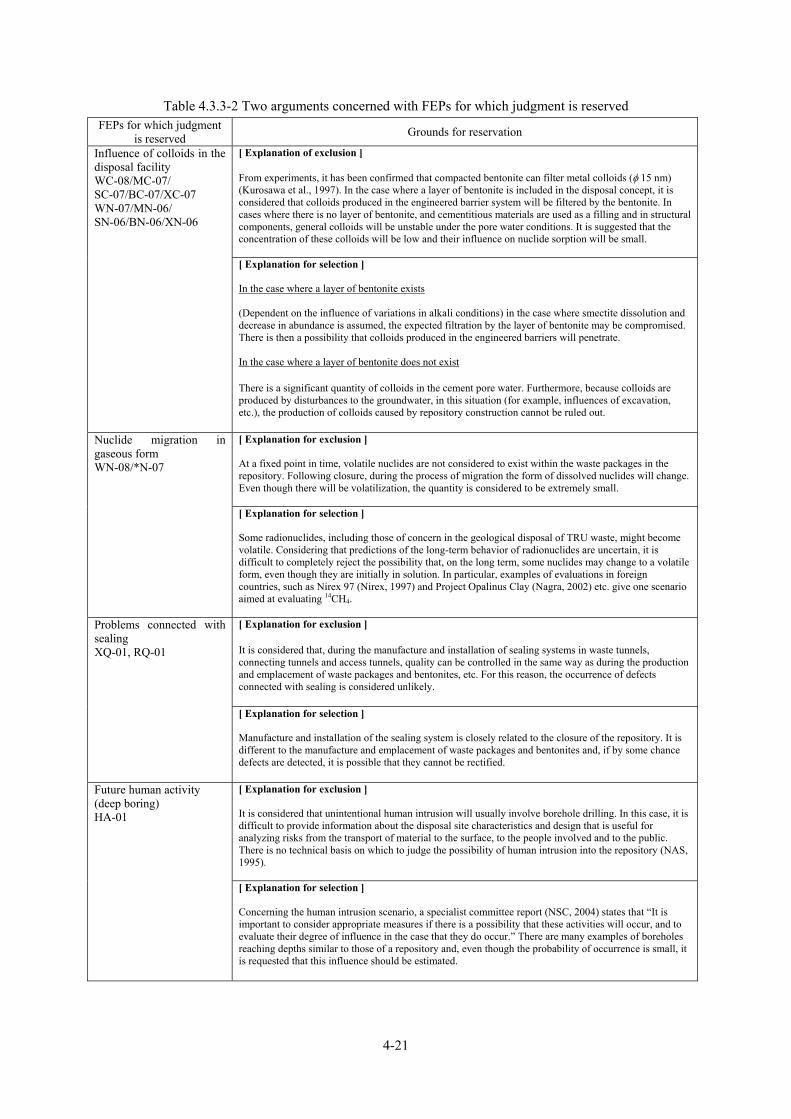
Table 4.3.3-2 shows two arguments connected with FEPs for which judgment is reserved.

4-19
Table 4.3.3-1 FEPs that can potentially be excluded from the safety assessment
(1) FEPs that can potentially be excluded from the viewpoint of appropriate site selection, engineering
measures and probability of occurrence (Reasons ①−③) Excluded FEP Grounds for exclusion
Earthquake/ active faulting NP-01
Fault activity for a period in the order of 100,000 years into the future can be considered as a continuation of activity that has occurred up to the present. Consequently, by maintaining an appropriate distance between individual active faults and the disposal facility, it is considered that the critical effects can be avoided. Furthermore, in Japan the probability of fault development in rocks without existing planes of weakness is small. For example, in the case where a new fault is produced, because the initial fault grows gradually as a belt of small-scale ruptures, there is a low probability that a large fault will grow rapidly, producing a large displacement. Even if it is assumed that such extremely low-probability active faulting will affect the geological disposal system, from trial risk calculations it is considered that the effect will be less than the upper limit proposed in other countries (JNC, 2000).
Volcanic/ magmatic activity NP-02
It is considered possible to evaluate the locations of future volcanic activity over timescales in the order of 105 years, based on the spatial and temporal variations in volcanic activity during past timescales in the order of 105 to 106 years. Therefore, if a repository is a suitable distance from present volcanic areas, it is considered possible to avoid large influences of volcanic activity. Trial risk calculations show that the probability of volcanic activity influencing the disposal system is extremely small. It is considered to be below the upper limit of influences proposed in other countries (JNC, 2000).
Initial defects connected with engineering measures WQ-01, MQ-01, SQ-01, BQ-01
By suitable quality management, it is considered possible to detect and rectify any defects that might arise from the methods employed in the manufacture of waste packages and bentonites. Therefore, initial defects due to engineering measures are considered to be very unlikely.
Future human activity (using underground excavations) HA-03
If the repository is constructed at an appropriate depth in a location with no natural resources, the possibility for direct human contact is small. It is considered that the utilization of underground spaces for mining, underground storage, geothermal resources, etc. can be avoided by suitable site selection.
Meteorite impact NP-05
Meteorite impact is a phenomenon that occurs randomly at the surface of the earth. According to the evaluations that have been performed to date, the frequencies of meteorite impacts that may have a direct effect at the depth of a HLW disposal facility range from 1.5×10⁻¹³ [km-2 y-1] (Goodwin et al., 1994) to 5×10⁻¹⁰ [km-2 y-1] (Diebold and Mueller, 1984). Consequently, it is considered that the possibility for the disposal system to be affected is extremely small.
Criticality RN-09
It has been pointed out that there is the possibility for criticality to develop autocatalytically if geological disposal of weapons-grade Pu is carried out (Bowman and Venneri, 1995). However, for such criticality to occur, various other processes are also necessary and the probability of these occurring is negligibly small. Provisionally, the energy released by criticality would be extremely small and it is judged that there would be no effect on the performance of the geological disposal system (Parks et al., 1995; Konynenburg, 1995). Furthermore Ahn et al. (1998) has discussed the possibility of criticality when geological disposal of solidified vitrified waste is undertaken. From the results, it is possible to evaluate the possibility of criticality if 40,000 vitrified waste packages are placed in an underground repository and it is assumed that all the released nuclides accumulate at a single locality. In the case where it is difficult for U to move within the medium, it has been shown that the accumulated quantity of U would be at most in the order of several moles, which is negligibly small. Provisionally, in the case where the accumulated U can move, and the host rock is granite with a porosity of more than 30%, the possibility of criticality phenomena can in reality be ruled out. From the above, the occurrence of criticality is considered unlikely.
4-20
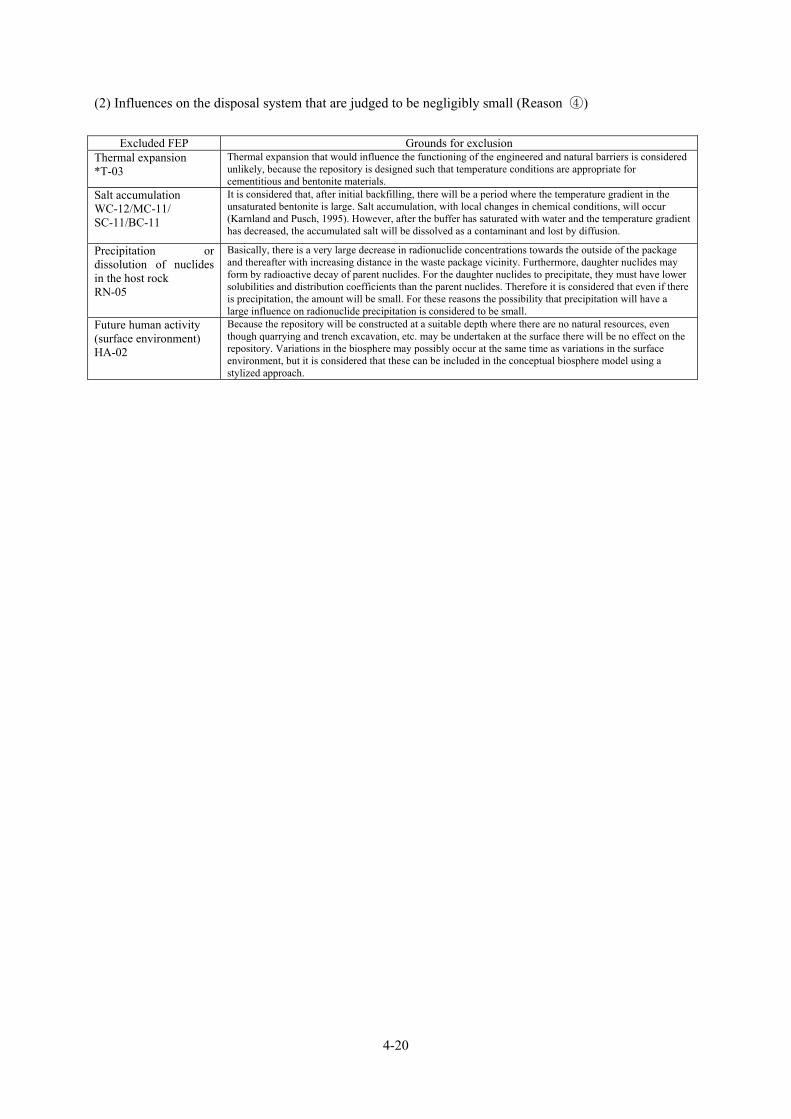
(2) Influences on the disposal system that are judged to be negligibly small (Reason ④)
Excluded FEP Grounds for exclusion Thermal expansion *T-03
Thermal expansion that would influence the functioning of the engineered and natural barriers is considered unlikely, because the repository is designed such that temperature conditions are appropriate for cementitious and bentonite materials.
Salt accumulation WC-12/MC-11/ SC-11/BC-11
It is considered that, after initial backfilling, there will be a period where the temperature gradient in the unsaturated bentonite is large. Salt accumulation, with local changes in chemical conditions, will occur (Karnland and Pusch, 1995). However, after the buffer has saturated with water and the temperature gradient has decreased, the accumulated salt will be dissolved as a contaminant and lost by diffusion.
Precipitation or dissolution of nuclides in the host rock RN-05
Basically, there is a very large decrease in radionuclide concentrations towards the outside of the package and thereafter with increasing distance in the waste package vicinity. Furthermore, daughter nuclides may form by radioactive decay of parent nuclides. For the daughter nuclides to precipitate, they must have lower solubilities and distribution coefficients than the parent nuclides. Therefore it is considered that even if there is precipitation, the amount will be small. For these reasons the possibility that precipitation will have a large influence on radionuclide precipitation is considered to be small.
Future human activity (surface environment) HA-02
Because the repository will be constructed at a suitable depth where there are no natural resources, even though quarrying and trench excavation, etc. may be undertaken at the surface there will be no effect on the repository. Variations in the biosphere may possibly occur at the same time as variations in the surface environment, but it is considered that these can be included in the conceptual biosphere model using a stylized approach.
4-21
Table 4.3.3-2 Two arguments concerned with FEPs for which judgment is reserved FEPs for which judgment
is reserved Grounds for reservation
[ Explanation of exclusion ] From experiments, it has been confirmed that compacted bentonite can filter metal colloids (φ 15 nm) (Kurosawa et al., 1997). In the case where a layer of bentonite is included in the disposal concept, it is considered that colloids produced in the engineered barrier system will be filtered by the bentonite. In cases where there is no layer of bentonite, and cementitious materials are used as a filling and in structural components, general colloids will be unstable under the pore water conditions. It is suggested that the concentration of these colloids will be low and their influence on nuclide sorption will be small.
Influence of colloids in the disposal facility WC-08/MC-07/ SC-07/BC-07/XC-07 WN-07/MN-06/ SN-06/BN-06/XN-06
[ Explanation for selection ] In the case where a layer of bentonite exists (Dependent on the influence of variations in alkali conditions) in the case where smectite dissolution and decrease in abundance is assumed, the expected filtration by the layer of bentonite may be compromised. There is then a possibility that colloids produced in the engineered barriers will penetrate. In the case where a layer of bentonite does not exist There is a significant quantity of colloids in the cement pore water. Furthermore, because colloids are produced by disturbances to the groundwater, in this situation (for example, influences of excavation, etc.), the production of colloids caused by repository construction cannot be ruled out. [ Explanation for exclusion ] At a fixed point in time, volatile nuclides are not considered to exist within the waste packages in the repository. Following closure, during the process of migration the form of dissolved nuclides will change. Even though there will be volatilization, the quantity is considered to be extremely small.
Nuclide migration in gaseous form WN-08/*N-07
[ Explanation for selection ] Some radionuclides, including those of concern in the geological disposal of TRU waste, might become volatile. Considering that predictions of the long-term behavior of radionuclides are uncertain, it is difficult to completely reject the possibility that, on the long term, some nuclides may change to a volatile form, even though they are initially in solution. In particular, examples of evaluations in foreign countries, such as Nirex 97 (Nirex, 1997) and Project Opalinus Clay (Nagra, 2002) etc. give one scenario aimed at evaluating 14CH4. [ Explanation for exclusion ] It is considered that, during the manufacture and installation of sealing systems in waste tunnels, connecting tunnels and access tunnels, quality can be controlled in the same way as during the production and emplacement of waste packages and bentonites, etc. For this reason, the occurrence of defects connected with sealing is considered unlikely.
Problems connected with sealing XQ-01, RQ-01
[ Explanation for selection ] Manufacture and installation of the sealing system is closely related to the closure of the repository. It is different to the manufacture and emplacement of waste packages and bentonites and, if by some chance defects are detected, it is possible that they cannot be rectified. [ Explanation for exclusion ] It is considered that unintentional human intrusion will usually involve borehole drilling. In this case, it is difficult to provide information about the disposal site characteristics and design that is useful for analyzing risks from the transport of material to the surface, to the people involved and to the public. There is no technical basis on which to judge the possibility of human intrusion into the repository (NAS, 1995).
Future human activity (deep boring) HA-01
[ Explanation for selection ] Concerning the human intrusion scenario, a specialist committee report (NSC, 2004) states that “It is important to consider appropriate measures if there is a possibility that these activities will occur, and to evaluate their degree of influence in the case that they do occur.” There are many examples of boreholes reaching depths similar to those of a repository and, even though the probability of occurrence is small, it is requested that this influence should be estimated.
4-22
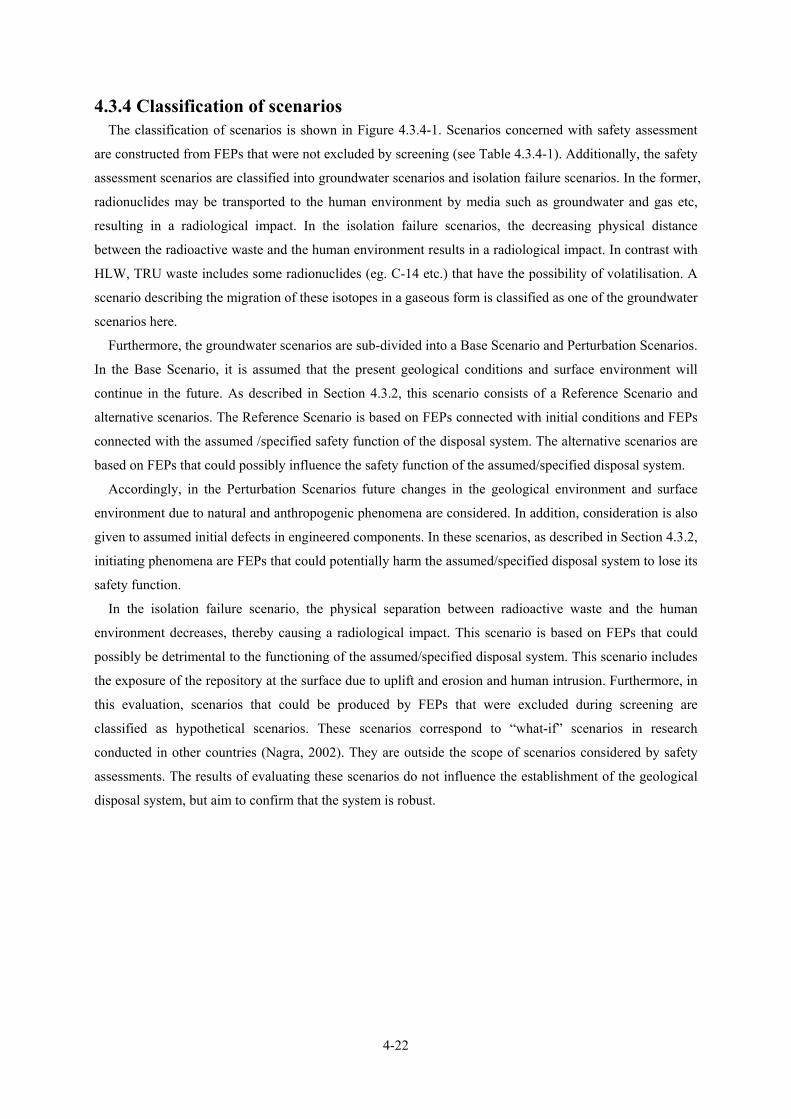
4.3.4 Classification of scenarios The classification of scenarios is shown in Figure 4.3.4-1. Scenarios concerned with safety assessment
are constructed from FEPs that were not excluded by screening (see Table 4.3.4-1). Additionally, the safety
assessment scenarios are classified into groundwater scenarios and isolation failure scenarios. In the former,
radionuclides may be transported to the human environment by media such as groundwater and gas etc,
resulting in a radiological impact. In the isolation failure scenarios, the decreasing physical distance
between the radioactive waste and the human environment results in a radiological impact. In contrast with
HLW, TRU waste includes some radionuclides (eg. C-14 etc.) that have the possibility of volatilisation. A
scenario describing the migration of these isotopes in a gaseous form is classified as one of the groundwater
scenarios here.
Furthermore, the groundwater scenarios are sub-divided into a Base Scenario and Perturbation Scenarios.
In the Base Scenario, it is assumed that the present geological conditions and surface environment will
continue in the future. As described in Section 4.3.2, this scenario consists of a Reference Scenario and
alternative scenarios. The Reference Scenario is based on FEPs connected with initial conditions and FEPs
connected with the assumed /specified safety function of the disposal system. The alternative scenarios are
based on FEPs that could possibly influence the safety function of the assumed/specified disposal system.
Accordingly, in the Perturbation Scenarios future changes in the geological environment and surface
environment due to natural and anthropogenic phenomena are considered. In addition, consideration is also
given to assumed initial defects in engineered components. In these scenarios, as described in Section 4.3.2,
initiating phenomena are FEPs that could potentially harm the assumed/specified disposal system to lose its
safety function.
In the isolation failure scenario, the physical separation between radioactive waste and the human
environment decreases, thereby causing a radiological impact. This scenario is based on FEPs that could
possibly be detrimental to the functioning of the assumed/specified disposal system. This scenario includes
the exposure of the repository at the surface due to uplift and erosion and human intrusion. Furthermore, in
this evaluation, scenarios that could be produced by FEPs that were excluded during screening are
classified as hypothetical scenarios. These scenarios correspond to “what-if” scenarios in research
conducted in other countries (Nagra, 2002). They are outside the scope of scenarios considered by safety
assessments. The results of evaluating these scenarios do not influence the establishment of the geological
disposal system, but aim to confirm that the system is robust.
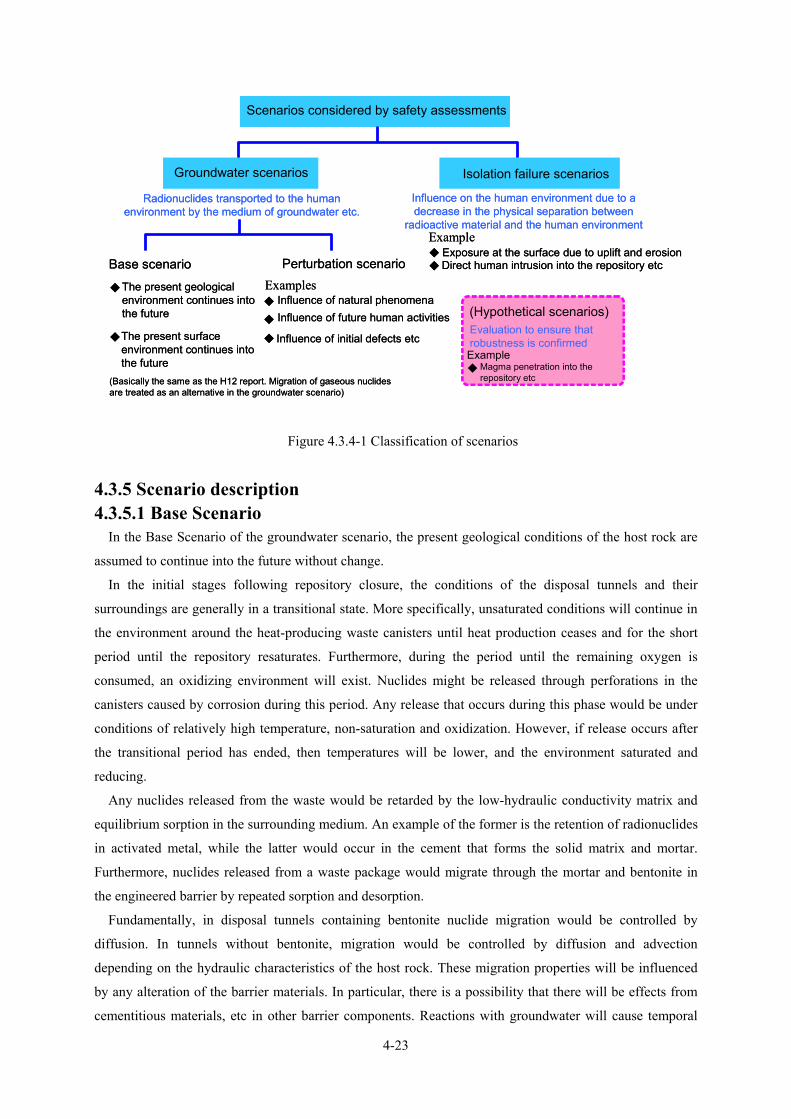
4-23
Examples
Example
Example
Scenarios considered by safety assessments
Groundwater scenarios Isolation failure scenarios
Radionuclides transported to the human environment by the medium of groundwater etc.
Influence on the human environment due to a decrease in the physical separation between
radioactive material and the human environment
Exposure at the surface due to uplift and erosionDirect human intrusion into the repository etcBase scenario Perturbation scenario
The present geological environment continues into the future
The present surface environment continues into the future
(Basically the same as the H12 report. Migration of gaseous nuclidesare treated as an alternative in the groundwater scenario)
Influence of natural phenomenaInfluence of future human activities
Influence of initial defects etc
(Hypothetical scenarios)Evaluation to ensure that robustness is confirmed
Magma penetration into the repository etc
Figure 4.3.4-1 Classification of scenarios
4.3.5 Scenario description 4.3.5.1 Base Scenario
In the Base Scenario of the groundwater scenario, the present geological conditions of the host rock are
assumed to continue into the future without change.
In the initial stages following repository closure, the conditions of the disposal tunnels and their
surroundings are generally in a transitional state. More specifically, unsaturated conditions will continue in
the environment around the heat-producing waste canisters until heat production ceases and for the short
period until the repository resaturates. Furthermore, during the period until the remaining oxygen is
consumed, an oxidizing environment will exist. Nuclides might be released through perforations in the
canisters caused by corrosion during this period. Any release that occurs during this phase would be under
conditions of relatively high temperature, non-saturation and oxidization. However, if release occurs after
the transitional period has ended, then temperatures will be lower, and the environment saturated and
reducing.
Any nuclides released from the waste would be retarded by the low-hydraulic conductivity matrix and
equilibrium sorption in the surrounding medium. An example of the former is the retention of radionuclides
in activated metal, while the latter would occur in the cement that forms the solid matrix and mortar.
Furthermore, nuclides released from a waste package would migrate through the mortar and bentonite in
the engineered barrier by repeated sorption and desorption.
Fundamentally, in disposal tunnels containing bentonite nuclide migration would be controlled by
diffusion. In tunnels without bentonite, migration would be controlled by diffusion and advection
depending on the hydraulic characteristics of the host rock. These migration properties will be influenced
by any alteration of the barrier materials. In particular, there is a possibility that there will be effects from
cementitious materials, etc in other barrier components. Reactions with groundwater will cause temporal
4-24
variations in pore water characteristics, pore structure and mineral formation, resulting in temporal
variations in the characteristics of nuclide migration in the engineered barrier system.
Nuclides released from the engineered barriers may migrate into the host rock via the excavation
disturbed zone. Groundwater and mass transport in the host rock can be divided into the case where
hydraulically conductive fractures are present (fractured medium) and cases where matrix porosity prevails
(porous medium). These media have different retention mechanisms. In a fracture network, nuclide
migration occurs by advection and the main retention mechanisms are sorption onto fracture-filling
minerals and diffusion into the matrix of the host rock (matrix diffusion). In the case of nuclide transport by
advection through the matrix porosity, retention is by sorption of nuclides on the surfaces of mineral grains.
From the hydrogological conditions at the site, it is conjectured that nuclides will migrate through the
host rock to the biosphere, via faults etc that connect to the GBI (Geosphere-Biosphere Interface). Hence,
humans will be affected by radiological exposure. There is uncertainty concerning the assumed pathways in
the biosphere that result in human exposure. A stylised approach whereby present environmental conditions
and lifestyles are extrapolated into the future (ICRP, 1999) is considered to be appropriate for specifying
biosphere models.
Based on the descriptions of the scenarios outlined above, and considering the previously mentioned
FEPs connected with initial and FEPs connected with the supposed/specified safety functions of the
disposal system, a reference scenario is specified. This scenario describes the probable future evolution of
the geological disposal system for TRU waste as follows:
① With the precondition that the repository is designed to rule out any effect of temperature on
the barrier materials, when radionuclides begin to escape from the waste containers, the
transitional conditions of the near-field have already past and saturated, reducing conditions
have returned. The scenario where radionuclide release begins during the period of
transitional conditions is considered by the next alternative scenario.
② In other technical fields (mechanics, chemistry, radiation fields), near-field behavior that is
considered to be of high probability is assumed. In particular, in the field of geochemistry,
reactions between groundwater that flows into the repository and barrier materials
(cementitious materials, bentonite materials, etc.) are considered.
③ Nitrate and organic matter contained in the waste react with the barriers and groundwater.
④ In highly fractured media with conductive fractures, nuclides that migrate through the host
rock are retarded by sorption onto fracture-filling minerals and by diffusion into the rock
matrix (matrix diffusion).
A wide range of materials are contained in the waste packages and engineered barriers. The
characteristics of these materials vary with time and the future evolution of the disposal system for TRU
waste is thus fundamentally complicated. Therefore, the base scenario is not entirely fixed. In order to
evaluate uncertainties concerned with the degree of influence of the phenomena included in the reference
scenario, as well as the effects of phenomena that are not included in the reference scenario, an alternative
4-25
scenario was specified. This alternative scenario considered the previously mentioned FEPs that may
influence the safety function of the assumed/specified disposal system. The characteristics of the alternative
scenario are summarized here:
⑤ The ability of the bentonite to retard water and its swelling characteristics are affected by the
alteration caused by cementitious materials.
⑥ The ability of the surrounding host rock to retain radionuclides is affected by the alteration of
cementitious materials.
⑦ In the case where radionuclide release begins while the near-field is in a transitional state,
nuclide migration is influenced by the transitional conditions (high temperature, unsaturated,
oxidizing conditions).
⑧ The nuclide migration is influenced by colloids, organic matter (natural) and microbes.
⑨ Nuclide migration is influenced by gas, etc.
4.3.5.2 Perturbation scenarios In the Base Scenario, a precondition is that the present geological conditions and surface environmental
conditions do not vary in future. In contrast, in the Perturbation Scenarios it is assumed that the geological
environment and the surface environment are affected by natural phenomena and future human activity.
Furthermore, also included in the Perturbation Scenarios are scenarios in which there are initial defects in
engineered components. It is assumed that these initial defects are unnoticed and remain, so that they may
significantly influence the disposal system.
The phenomena that initiate these Perturbation Scenarios are obtained from FEP screening and are given
below:
Natural Phenomena
- Uplift, erosion
- Climate, sea level change
Initial defects in engineered components
- Seal failure, etc.
Future human activity
- Drilling wells and water extraction
- Variations in pathways for nuclide migration caused by drilling water wells
4.3.5.3 Isolation failure scenarios In the isolation failure scenarios, the physical separation between the radioactive waste and the human
environment may decrease, resulting in a radiological impact. The phenomena that may initiate these
scenarios have been obtained by FEP screening. Among the natural phenomena, there is the case where
uplift and erosion continue over long time periods, causing the disposal system to be exposed at the surface.
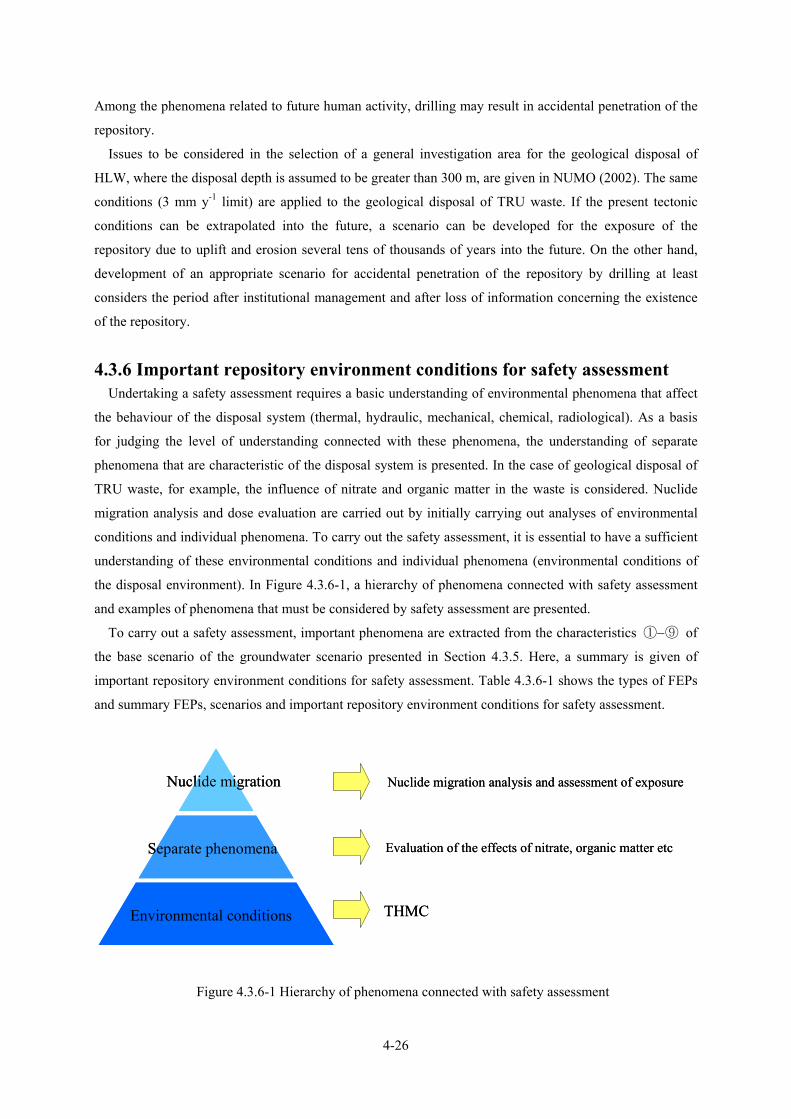
4-26
Among the phenomena related to future human activity, drilling may result in accidental penetration of the
repository.
Issues to be considered in the selection of a general investigation area for the geological disposal of
HLW, where the disposal depth is assumed to be greater than 300 m, are given in NUMO (2002). The same
conditions (3 mm y-1 limit) are applied to the geological disposal of TRU waste. If the present tectonic
conditions can be extrapolated into the future, a scenario can be developed for the exposure of the
repository due to uplift and erosion several tens of thousands of years into the future. On the other hand,
development of an appropriate scenario for accidental penetration of the repository by drilling at least
considers the period after institutional management and after loss of information concerning the existence
of the repository.
4.3.6 Important repository environment conditions for safety assessment Undertaking a safety assessment requires a basic understanding of environmental phenomena that affect
the behaviour of the disposal system (thermal, hydraulic, mechanical, chemical, radiological). As a basis
for judging the level of understanding connected with these phenomena, the understanding of separate
phenomena that are characteristic of the disposal system is presented. In the case of geological disposal of
TRU waste, for example, the influence of nitrate and organic matter in the waste is considered. Nuclide
migration analysis and dose evaluation are carried out by initially carrying out analyses of environmental
conditions and individual phenomena. To carry out the safety assessment, it is essential to have a sufficient
understanding of these environmental conditions and individual phenomena (environmental conditions of
the disposal environment). In Figure 4.3.6-1, a hierarchy of phenomena connected with safety assessment
and examples of phenomena that must be considered by safety assessment are presented.
To carry out a safety assessment, important phenomena are extracted from the characteristics ①−⑨ of
the base scenario of the groundwater scenario presented in Section 4.3.5. Here, a summary is given of
important repository environment conditions for safety assessment. Table 4.3.6-1 shows the types of FEPs
and summary FEPs, scenarios and important repository environment conditions for safety assessment.
THMC
Nuclide migration
Separate phenomena
Environmental conditions
Evaluation of the effects of nitrate, organic matter etc
Nuclide migration analysis and assessment of exposure
THMC
Nuclide migration
Separate phenomena
Environmental conditions
Evaluation of the effects of nitrate, organic matter etc
Nuclide migration analysis and assessment of exposure
Figure 4.3.6-1 Hierarchy of phenomena connected with safety assessment

4-27
Table 4.3.6-1 Types of FEPs, summary FEPs, scenarios and repository conditions that are important for safety assessment
FEP Type Summary FEPs Scenario Type Scenario sub-type Scenario sub-sub-typeImportant environmental conditions
etc for safety assessmentThermal environment Temperature influence 3.2.3.3
Hydrogeology Hydraulic field(re-flooding) 4.4.4Mechanical stability of the host rockMechanical stability of plugs etcMechanical stability of engineered barrier materialsSwelling of the bufferDecrease in density of the bufferCorrosion expansion of engineered barrier materialsWaste packages/structural members movement and settling
Mechanical conditions 3.3.2
Groundwater chemistry/porewaterchemistry Groundwater chemistry 4.4.1
Radiological analysis/radiation damage Radiological effects 4.4.8
Organic matter(included in the waste) Effects of organic matter(Contained in waste)4.4.6
Nitrate Effects of nitrate 4.4.9
Release of nuclides from the wastePrecipitation and dissolutionSorptionDiffusion and dispersive advectionNuclide migration in the EBSNuclide migration in the host rockAlteration of buffer materialAlteration and fracturing of cementitious materials
Effects of altertation of engineered barrier materials 4.4.2
Alkaline alteration of the host rockAlkaline alteration of surrounding host rock 4.4.3
Hydrogeology of the engineered barrierHydrogeological conditions of the near field (influence of geochemical alteration) 4.4.4
Production and migration of colloids Effects of colloids 4.4.5
Organic matter(Natural) Effects of organic matter (natural) 4.4.6
Microbes Effects of microbes 4.4.7
Unradioactive gas/radioactive gas Effects of gas and nuclides in gaseous form 4.4.10
Uplift and erosionClimate change, Sea level change
Initial defects connected with engineered components
Scenario concerned with initial defects Seal failureWell drilling and water extractionFormation of new migration paths by boring
Natural phenomena scenario Uplift and erosion 4.5.6
Hypothetical scenario Volcanoes, Magmatism(Magma intrusion)Future human activity Future human activity scenario Future accidental human intrusion 4.5.6
FEPs concerned with the preconditions of the disposal system
FEPs connected with the assumed/specified safety function of the disposal system
4.5.2
4.5.5
Future human activityScenario concerned with future human activities
Isolation Failure ScenarioFEPs that possiblyrefute the safety function of the supposed/specified disposal system
FEPs that harm the safety function in the supposed/specified disposal system
PerturbationScenario
Natural phenomena
FEPs that influence the safety fuinctionof the supposed/specified disposal system
Alternative scenario
Scenario concerned with natural phenomena
GroundwaterScenario
BaseScenario
Reference Scenario(Representative Scenario)
Natural phenomena
Nuclide migration
Corresponding report section FEP Type Summary FEPs Scenario Type Scenario sub-type Scenario sub-sub-type
Important environmental conditions etc for safety assessment
Thermal environment Temperature influence 3.2.3.3
Hydrogeology Hydraulic field(re-flooding) 4.4.4Mechanical stability of the host rockMechanical stability of plugs etcMechanical stability of engineered barrier materialsSwelling of the bufferDecrease in density of the bufferCorrosion expansion of engineered barrier materialsWaste packages/structural members movement and settling
Mechanical conditions 3.3.2
Groundwater chemistry/porewaterchemistry Groundwater chemistry 4.4.1
Radiological analysis/radiation damage Radiological effects 4.4.8
Organic matter(included in the waste) Effects of organic matter(Contained in waste)4.4.6
Nitrate Effects of nitrate 4.4.9
Release of nuclides from the wastePrecipitation and dissolutionSorptionDiffusion and dispersive advectionNuclide migration in the EBSNuclide migration in the host rockAlteration of buffer materialAlteration and fracturing of cementitious materials
Effects of altertation of engineered barrier materials 4.4.2
Alkaline alteration of the host rockAlkaline alteration of surrounding host rock 4.4.3
Hydrogeology of the engineered barrierHydrogeological conditions of the near field (influence of geochemical alteration) 4.4.4
Production and migration of colloids Effects of colloids 4.4.5
Organic matter(Natural) Effects of organic matter (natural) 4.4.6
Microbes Effects of microbes 4.4.7
Unradioactive gas/radioactive gas Effects of gas and nuclides in gaseous form 4.4.10
Uplift and erosionClimate change, Sea level change
Initial defects connected with engineered components
Scenario concerned with initial defects Seal failureWell drilling and water extractionFormation of new migration paths by boring
Natural phenomena scenario Uplift and erosion 4.5.6
Hypothetical scenario Volcanoes, Magmatism(Magma intrusion)Future human activity Future human activity scenario Future accidental human intrusion 4.5.6
FEPs concerned with the preconditions of the disposal system
FEPs connected with the assumed/specified safety function of the disposal system
4.5.2
4.5.5
Future human activityScenario concerned with future human activities
Isolation Failure ScenarioFEPs that possiblyrefute the safety function of the supposed/specified disposal system
FEPs that harm the safety function in the supposed/specified disposal system
PerturbationScenario
Natural phenomena
FEPs that influence the safety fuinctionof the supposed/specified disposal system
Alternative scenario
Scenario concerned with natural phenomena
GroundwaterScenario
BaseScenario
Reference Scenario(Representative Scenario)
Natural phenomena
Nuclide migration
Corresponding report section
4-28
4.4 Establishing conditions in the disposal environment for safety assessment
As described in Section 4.3.6, when carrying out a nuclide migration analysis and dose assessment, it is
important to understand environmental (Thermal/Hydraulic/Mechanical/Chemical/Radiological (THMCR))
conditions and to analyse closely related phenomena that are characteristic of the disposal system. This
chapter specifies those environmental conditions needed to analyse nuclide migration and radiation
exposure. The environmental conditions and phenomena that are important for safety assessment are
evaluated.
In Section 4.3.6, the environmental conditions and discrete phenomena are arranged hierarchically.
However, the definition of the hierarchy is complicated by the fact that these conditions and phenomena are
inter-related. For example, groundwater chemistry is affected by interactions with repository materials and
the original composition of groundwater in the disposal facility.
In this section, the descriptions of environmental conditions and phenomena take these relationships into
account.
4.4.1 Chemical condition of groundwater 4.4.1.1 Reference composition of groundwater
In the H12 report (JNC, 2000), fresh, alkaline groundwater (FRHP) and saline alkaline groundwater
(SRHP) were used as a reference groundwater (Yui et al., 1999a). FRHP was chosen as a reference
groundwater for geological disposal of TRU waste and SRHP was also considered because of the existence
of saline groundwater in Japan. However it was considered important to set the chemical composition of
the reference water by taking into account relevant factors for the safety of TRU waste disposal. In
particular pH, Eh, CO32-, HCO3
-, Cl-, SO42-, Mg2+, silicate ion and aluminate ion were considered to be the
important factors which have the potential to affect the safety of geological disposal of TRU waste.
4.4.1.2 Geochemical variations of groundwater caused by interaction with repository materials
The chemistry of groundwater in the TRU repository will be affected significantly by chemical reactions
with cementitious materials. The main feature of cementitious material is that its pore water is
hyperalkaline, due to the dissolution of NaOH and KOH, portlandite (Ca(OH)2) and calcium silicate
hydrates (C-S-H gels).
The chemistry of the cement pore water will change with time from Region I (> pH 13) in Figure
4.4.2.2-1 (Atkinson, 1985), where Na and K contents are high due to the dissolution of Na/KOH-rich
phases, to Region II, which is characterized by equilibrium with portlandite. Subsequently, in Region III,
the chemistry of the pore water is affected by dissolution of CSH gels. Eventually, the chemical conditions
of the pore water become similar to those of the surrounding groundwater. The occurrence of these
chemical changes is supported by numerous models and laboratory experiments (see 4.4.2.2). It is generally
considered that chemical interactions between groundwater and cementitious material will include reaction
with CO32- in the groundwater to precipitate calcite, reaction with SO4
2- to precipitate ettringite and gypsum,
4-29
and reaction with Cl- to form Friedel salt. Additionally, in cases where there are relatively high Mg2+
concentrations, as in seawater, it is considered that reactions involving Mg2+ will cause the precipitation of
Mg(OH)2 and magnesium silicate hydrates. By including these reactions, it is possible to carry out a
simulation of the pore water chemistry in cementitious material assuming equilibrium between the major
cement hydrates and groundwater (RWMC, 2005) and so the chemical conditions of pore water in the
waste and filling material regions can be estimated.
The hyperalkaline leachates from the cement affect the dissolution and precipitation of the primary and
secondary minerals that compose the bentonite As a result, the chemical conditions of the pore water in the
buffer are expected to change rapidly. For example, pH decreases owing to the dissolution of
montmorillonite and chalcedony and, consequently, the concentrations of silicate ions increase, thereby
influencing the precipitation of secondary minerals. The chemical conditions in the bentonite will also
depend on the type of secondary minerals that are generated, as well as spatio-temporal variations in the
chemical characteristics of the bentonite. Considering the uncertainty concerning the kinds of secondary
mineral etc, it is not possible to decide the chemical conditions of the pore water in the bentonite following
reaction with the leachates. Hence, in cases where the effects of chemical and mineralogical variations in
the bentonite are evaluated as part of the nuclide migration analysis, it is problematic to specify the
solubility and sorption distribution coefficients of radionuclides in altering bentonite.
4.4.2 Effect of alteration of the engineered barrier Chemical conditions in the TRU disposal facility and the mass transport properties of the cementitious
material change with time. High-pH pore water formed by the dissolution of cementitious material, enters
the adjacent bentonite buffer. As a result, the chemical conditions of the pore water in the bentonite change.
There is a possibility that the resulting alteration of the bentonite will cause the mass transport properties of
the buffer to change. It is important that these phenomena are reflected in evaluations of nuclide migration.
In this chapter, the spatio-temporal changes in chemical conditions in the engineered barrier and transport
properties of the material are evaluated.
4.4.2.1 Evaluation of long-term engineered barrier performance Various interactions between cement material and bentonite may occur. These alteration phenomena are
promoted by nonlinear coupled processes with positive and negative feedbacks (development of a complex
system; Metcalfe and Walker, 2004). It is not an entirely valid approach to understand such a complex
system by rigorously evaluating hypothetical, idealised, individual phenomena. Instead, it is necessary to
consider the effects of interactions between non-ideal phenomena globally. However, in this case, it is
extremely difficult to understand every process accurately. In many cases, the behaviour of the whole
system can be understood by evaluating the effects of combinations of all the component parts, not just
those processes that have similarly strong relationships. Of course, a gap in theoretical understanding may
exist. However, to address this complexity, realisations based on reasonable limiting cases can be used as a
basis for engineering judgments (Saito, 1998).
In this case, it is important to take appropriate measures to choose reasonable limits. In the case where

4-30
long-term variations in the engineered barrier are considered, consideration should be given to the mutual
influences between the various factors that contribute to the overall complexity, as follows:
- How far can the behaviour of the system be understood from current knowledge?
- In response to the above limits in understanding, what kind of conservative measures must be adopted?
4.4.2.2 Effect of cement-bentonite interactions on long-term performance As described in 4.4.2.1, it is difficult to estimate the overall effects of interactions between cementitious
materials and bentonites, since these constitute a nonlinear coupled system. However, there is considerable
chemical information concerning the most important aspects of the degradation behaviour of these two
engineered barrier components. By combining this information, it is possible, based on the present level of
knowledge, to predict ranges of probabilities for the effects of these interactions. In this section, before
making engineering decisions, knowledge concerning interactions between cementitious material and
bentonite, is summarised.
(1) Alteration of cementitious material
It is anticipated that cementitious material will be used in disposal tunnels, as a support, in the structural
framework and in filling material. Additionally such material might be used to fill waste packages. There
will be physical evolution, such as the opening and clogging of cracks, as well as chemical evolution when
the disposal facility is saturated with groundwater, such as changes in groundwater composition (including
pH), dissolution of initial minerals, and precipitation of secondary minerals, accompanied with reactions
among groundwater, wastes and cement hydrates.
This section mainly considers the alteration of cementitious materials on chemical condition in the
disposal facility. The effects of cracking are considered elsewhere, in an evaluation that does not consider
cementitious materials to have low hydraulic conductivities. In the manufacturing of cementitious material,
several types of cement are used, depending on the application and required properties. This section mainly
describes the alteration and the effects of alteration of OPC.
a. Hydration of cementitious material
Cement is hydrated and hardened. The time scale for a performance assessment is significantly longer
than that of cement hydration. Hence, when carrying out an evaluation of long-term alteration of
cementitious material, it is assumed that hydration has already proceeded sufficiently at the starting point of
analysis.
Cement hydrates are composed of many hydrates, represented by portlandite (Ca(OH)2), C-S-H gel,
ettringite, monosulphate and hydrotalcite (e.g. Taylor, 1997). By focusing on these hydrates it is possible to
model the dissolution behaviour of cementitious material, such as the generally used OPC, which is mainly
composed of Ca(OH)2 and C-S-H gel (ref. Table 4.4.2.2-1). However, mass transport in an actual disposal
environment occurs very slowly, and the alteration is spatially inhomogeneous. For these reasons
reprecipitation might occur when solutes in pore water that has been equilibrated with the cement hydrates
migrate into adjacent areas. It is necessary to consider the effect of minor hydrates, taking into account the

4-31
local concentration of particular minerals by reprecipitation. In the cases of cementitious materials that
incorporate specialised cement and mixed cement such as fly ash cement, difference of the major hydrates
from those of OPC should be noted.
b. Leaching of cement material
Soluble components are leached from cementitious material by contact with groundwater. As a result,
the groundwater’s composition, including its pH, changes, and the compositions of hydrates also vary.
In cases where OPC is used, the dissolution of Na and K occurs initially, and pH reaches levels above 13.
However, subsequently, the liquid phase becomes dominated by Ca and is equilibrated with Ca(OH)2,
which maintains the pH at about 12.5. Later, after leaching of Ca(OH)2 is completed, the Ca/Si ratio in the
C-S-H gel decreases by selective leaching of Ca. A consequence of these processes is that pH in the liquid
decreases continuously, as shown in Figure 4.4.2.2-1 (Atkinson, 1985).
As described previously, the compositions of hydrates in the cementitious materials used in specialised
cement and mixed cement such as fly ash cement are different from that of OPC. Hence the leachates have
different compositions. For example, in the case of fly ash cement, it is known that only low amounts of
relatively soluble Ca(OH)2 are generated (RWMC, 2005). As a result, the amounts of leachable Ca are
decreased. However, it is possible to evaluate the degradation of cement hydrates for fly ash cement by
using the same model as for OPC.
The chemical evolution of cement hydrates depends on the composition of groundwater. The variation of
hydrates caused by contact with meteoric water type synthetic groundwater are almost the same as those
caused by contact with deionised water (Iriya et al., 1999; RWMC, 2005). However, when synthetic
groundwater of which composition is similar to that of seawater contacts with cement hyrates, the pH and
hydrates show different variations and it is assumed that Friedel’s salt and brucite are formed (RWMC,
2005).
c. Reactions with chemical components that are assumed to occur in the disposal environment
In addition to reaction with groundwater, cementitious material might react with constituents that are
eluted from waste and bentonite. In this section, reactions with the chemical components which may affect
the alteration process among possible chemical components in groundwater, waste and bentonite are
described. The selected chemical components were NaNO3, carbonate, sulfate and chloride.

4-32
Table 4.4.2.2-1 Concrete and mortar components for evaluation
Solid phase* Concrete [mol/m3]
Mortar [mol/m3]
C3AH6 (Hydrogarnet) 134 215
C3FH6 (Iron hydrogarnet) 49 79
MH (Brucite) 147 237
C6As3H32 (Ettringite) 25 40
C4AsH12 (Monosulphate) 0 0
KOH 36 58
NaOH 23 37
C-S-H gel (Ca/Si mole ratio = 1.8) 1,938 3,121
CH (Portlandite) 879 1,415
Cl 1 1
2,817 4,536 Solid phase in Sugiyama model
C-S-H (CH)
C-S-H (S) 1,078 1,735
C/S mole ratio in whole solid phase (−) 2.61 2.61
Void ratio (−) 0.13 0.19
*The following form is followed except for KOH, NaOH. C: CaO, A: Al2O3, H: H2O, M: MgO, S: SiO2, s: SO3
(ref. Appendix of Chapter 3: assumed specifications and analytical values for cementitious material)
10.0
10.5
11.0
11.5
12.0
12.5
13.0
13.5
10 0 10 1 10 2 10 3 10 4
Cumulative amount of dissolution liquid (L) per 1 kg of cement paste
pH
Region I Region II Region III
10.0
10.5
11.0
11.5
12.0
12.5
13.0
13.5
10 0 10 1 10 2 10 3 10 4
Cumulative amount of dissolution liquid (L) per 1 kg of cement paste
pH
Region I Region II Region III
Figure 4.4.2.2-1 Variation in the pH of the cement leachate (Atkinson, 1985)
4-33
(a) Nitrate salt (NaNO3)
The effects of NaNO3 on the mechanical and hydraulical characteristics and alteration of cementitious
material has been evaluated (Takei et al., 2002, 2003; Fujita et al., 2003; Kaneko et al., 2004) and the
results are described below.
It is known that leaching of Ca(OH)2 is promoted by aqueous NaNO3 solution. The effects of NaNO3,
including the influence on Ca(OH)2 solubility, were evaluated by carrying out equilibrium calculations
using the Pitzer model for correction of activity coefficients. The calculations explain the dissolved Ca
concentrations under Region II conditions attained during a flow-through experiment using 1 mol (dm3)-1
NaNO3. These equilibrium calculations showed that, when the concentration of NaNO3 was varied through
a range of 0−6 mol (dm3)-1, a maximum Ca(OH)2 solubility was attained when the NaNO3 concentration
was 1 mol (dm3)-1 of NaNO3. This maximum solubility of Ca(OH)2 was about 1.5 times of that in deionised
water. Furthermore, it was found that monosulphate and carbono-monosulphate phases were changed into
NaNO3-monosulphate phases. However, monosulphate phases and carbono-monosulphate phases are not
major hydrates in cement paste and no other mineralogical changes were identified. These findings are
consistent with the relationships between porosity and unconfined compressive strength regarding to
solidified cement paste flushed by NaNO3 solutions can be explained by the empirical equation which is
derived from experimental data acquired using the cement paste flushed by deionised water. It is
recognized that dominant hydrates contributing to compressive strength were not degraded significantly.
However, flushing with NaNO3 solution case, despite NaNO3 promoting Ca dissolution, the hydraulic
conductivity increase is more moderate than that which occurs when flushed with deionised water.
Although the precise cause has not been identified, it is plausible that Na is connected with moderating the
hydraulic conductivity increase, since Na is concentrated in those solid phases from which Ca has been
leached. Immediately after switching the flushing solution from NaNO3 solution to deionised water, the
hydraulic conductivity increases rapidly. It is suggested that this increase possibly reflects the promotion of
Ca dissolution combined with the loss of Na from the solids in which it has been concentrated.
Formation of NH3 by reduction of NO3-, has not been found to affect the hydrate compositions, hydraulic
characteristics and mechanical strength of cementitiious material (Osawa et al., 2004).
(b) Carbonate
CO32- and HCO3
- are chemical species that cause neutralization (carbonation) of the cementitious
material. Calcite (CaCO3) is generated by reactions between HCO3- and CO3
2- in the groundwater and
Ca(OH)2 and C-S-H in the cement. A consequence could be that the strength of the hardened solid increases.
However, it is also possible that the strength of the hardened solid might decrease owing to the disruption
of binding between C-S-H phases. Previous work has reported that CaCO3 formation causes the high-pH
period to shorten (Atkinson and Guppy, 1988) and hydraulic conductivity to decrease (Shibata et al.,
2000).
(c) Sulfate
SO42- is a chemical species that causes the formation, in cement paste, of expanding secondary minerals,

4-34
such as ettringite and thaumasite (CaSiO3, CaSO4, CaCO3, 15H2O), leading to cracking and decrease in
strength. Aluminate hydrates, such as monosulphate phases that are incorporated into cementitious material,
react with SO42- and form ettringite. Additonally, dihydrate gypsum is generated by reaction with
portlandite. It is reported that, in the initial stages, formation of ettringite fills cavities and clogs cracks
(Onishi et al., 1998). However, it is also reported that formation of this mineral causes failure by expansion
(e.g. Japan Society of Civil Engineers, 2003).
Additionally, a decrease in the strength of the cementitious material due to the formation of thumasite of
which structure is similar to that of ettringite has been reported when carbonate coexists with sufficient
concentration of sulphate. (e.g. Ujike, 2002). It is also reported that thaumasite can be formed by reactions
with hydrates of cementitious material such as C-S-H and portlandite, if conditions, a low environmental
temperature, the inflowing water supplies CO32- continuously and contains high sulfate concentrations are
fulfilled (Yoshida and Yamada, 2005).
(d) Chloride
There are many reports that chloride promotes the corrosion of rebar within reinforced concrete (e.g.
Japan Cement Association, 1993). Chloride also affects the alteration of hardened cementitious material, by
reacting with aluminate hydrate to form Friedel’s salt. Additionally, it has been reported that pH may
increase when Friedel’s salt is formed by reactions between Cl- and hydrogarnet (Glasser et al., 1998).
(e) Reaction with other chemical components
Other chemical components that are considered to affect the alteration of cementitious material are Mg in
groundwater that is derived from seawater, and Si and Al components produced by dissolution of bentonite
in alkaline condition. In cases where there are high Mg concentrations in the liquid phase which contacts
the cement material, it is reported that Mg(OH)2 is formed by exchange of Ca for Mg in the cementitious
material, leading to a drop in pH (RWMC, 2005). It is considered that Si and Al components may generate
C-S-H and C-A-S-H phases by reacting with Ca ions supplied from the cementitious material.
d. Crystallization of cementitious material
(a) Crystallization by thermal alteration
Temperatures above 80°C may cause thermal alteration of the cement phases so the repository is
designed in such a way so as to prevent this temperature threshold from being exceeded. (ref. 3.2.2.2).
(b) Long-term maturation into stable crystals
Since the time scale considered for TRU waste disposal is very long, it is impossible to determine all the
mineral alteration by experiment. However the following alteration is considered to occur.
- Crystallization of gels to more stable minerals
- Decreasing surface areas of solid phases
Bradbury and Sarott (1995) described the phenomena as follows:
① Based on research into natural analogues of cementitious materials, partial crystallization of C-S-H gel
4-35
might occur over long time scales. However, this crystallization does not cause large changes in the
chemical environment, such as large decreases in pH. Furthermore, decreases in pH are not considered to
have a significant effect on sorption until a pH of 10 is reached.
② The sorption distribution coefficients of Pu and Am for synthesized crystalline calcium-silicate are
higher than those of unaltered cementitious material.
③ The decrease in contributing surface areas for sorption accompanied with crystallization is also
considered. However, no saturation of sorption sites is considered to occur, since the concentrations of
radionuclides are generally low. In any case, the effect on nuclide sorption seems to be small, perhaps
because the decrease in surface area is countered by potential nuclide uptake into the crystal structure
during the crystallization process.
Additionally, as described above, the temperature is regulated so as to prevent thermal alteration hence is
unlikely to affect nuclide retardation in the cementitious material.
e. Model for dissolution and precipitation of cement hydrates
In the interaction between cementitious material and bentonite, the cementitious material is a source term
for cations and OH-. The leaching of these components also causes alteration and degradation of the cement
material. Hence, it is important to understand the relationship between cement alteration and changes in the
concentrations of aqueous components. C-S-H gel is the main hydrate that is generated by cement
hydration, and is generally of low crystallinity, though not completely amorphous. The crystals have atoms
arranged in short cycles (Arai, 1991). Many experimental studies of C-S-H gel dissolution have been
reported (Greenberg et al., 1965; Fujii et al., 1981; Kalousek, 1954; Atkinson et al., 1987) and
thermodynamic dissolution models have been proposed to reproduce the experimental results. Berner
(1992), presented 2 solid phase models: Ca(OH)2 and CaH2SiO2, in the case where the Ca/Si ratio of the
C-S-H gel is above 1; and SiO2 and CaH2SiO2 in the case where the Ca/Si ration of the C-S-H gel is below
1. The equilibrium constant for dissolution of each solid phase was varied until a fit to the experimental
results was obtained.
Reardon (1992) proposed that, assuming the chemical composition of C-S-H gel is xCaO・SiO2・xH2O,
experimental results can be used to express the equilibrium constant for the dissolution reaction as a
function of the Ca/Si ratio. Glasser et al. (1998) also proposed a similar model. Additionally, Atkinson et al.
(1987)assumed that the C-S-H gel can be treated as a solid solution of Ca(OH)2 and hypothetical solid
phase of same composition as tobermorite in the case that the Ca/Si ratio is above 0.833. In the case that the
ratio is lower than this value, they considered the gel to be a solid solution of SiO2 and this hypothetical
solid phase. They used the Gibbs free energy of each solid phase to calculate the Gibbs free energy of the
C-S-H gel. Solid solution models by Börjesson et al. (1997) and Rahman et al. (1999a, 1999b) express the
dependency of Ca(OH)2 and CaH2SiO2 or SiO2 and CaH2SiO2 on the Ca/Si ratio using a Magules type
treatment of solid solution. These models reproduce the variations in Ca/Si of a liquid that is equilibrated
with the cement, but they do not consider the precipitation behaviour and variations in Ca/Si when the fluid
that contacts the C-S-H gel is not at equilibrium.
4-36
Sugiyama et al (2001) suggested a model based on a fact that the structure of the C-S-H gel can be
considered that Ca and H2O are located between the chains of SiO4 tetrahedra. They assumed that the
cement could be modelled as a non-ideal solid solution of Ca(OH)2 and SiO2 in spite of Ca/Si ratio.
Consequently, precipitation can be taken into account easily. They also proposed an extendable model in
which C-A-S-H gel is generated by taking up Al. In these models, log K for the dissolution reactions of the
various solid phases are expressed according to a Guggenheim mixing model proposed by Glynn (1991).
The parameter values are established by fitting the results of cement paste dissolution experiments. The
dependency of equilibrium constant of each model solid which is an end member of the solid solution on
the Ca/Si ratio is shown in Table 4.4.2.2-2. With this model it is possible to reproduce the dependence of
the pH, Ca and Si concentrations of the liquid phase on the solid’s Ca/Si ratio. It was considered that this
model is potentially applicable to the experiments other than single-system experiments by applying the
model to the experiments in which Ca precipitates as a result of the solution equilibrated with Ca(OH)2
contacting C-S-H gel, or in which ettringite coexists with C-S-H gel in dissolution experiment.
Additionally, as shown in Table 4.4.2.2-1, cementitious material includes hydrates other than C-S-H gel
and soluble components. It is possible to explain the results of liquid exchange experiments and mortar
flow-through experiments by supposing that the initial hydrates and secondary minerals in the cementitious
material are those shown in Table 4.4.2.2-3 (RWMC, 2005; Yamada et al., 2005). Hence, it is considered
that the initial hydrates and secondary minerals to be considered in evaluations of engineered barrier
alteration are those shown in Table 4.4.2.2-3. The effect of calcite generation by carbonate, ettringite
generation by sulfate, Friedel’s salt generation by chloride and brucite generation by Mg are reflected in the
following analysis. In addition, thaumasite, formed when sulfate and carbonate coexist under
low-temperature conditions (it is stable at < 15°C, and is formed particularly at a temperature lower than
about 5°C), is not taken into account since the temperatures at the disposal depths of 300−1,000m is
considered to be 24°C−45°C (JNC, 2000).
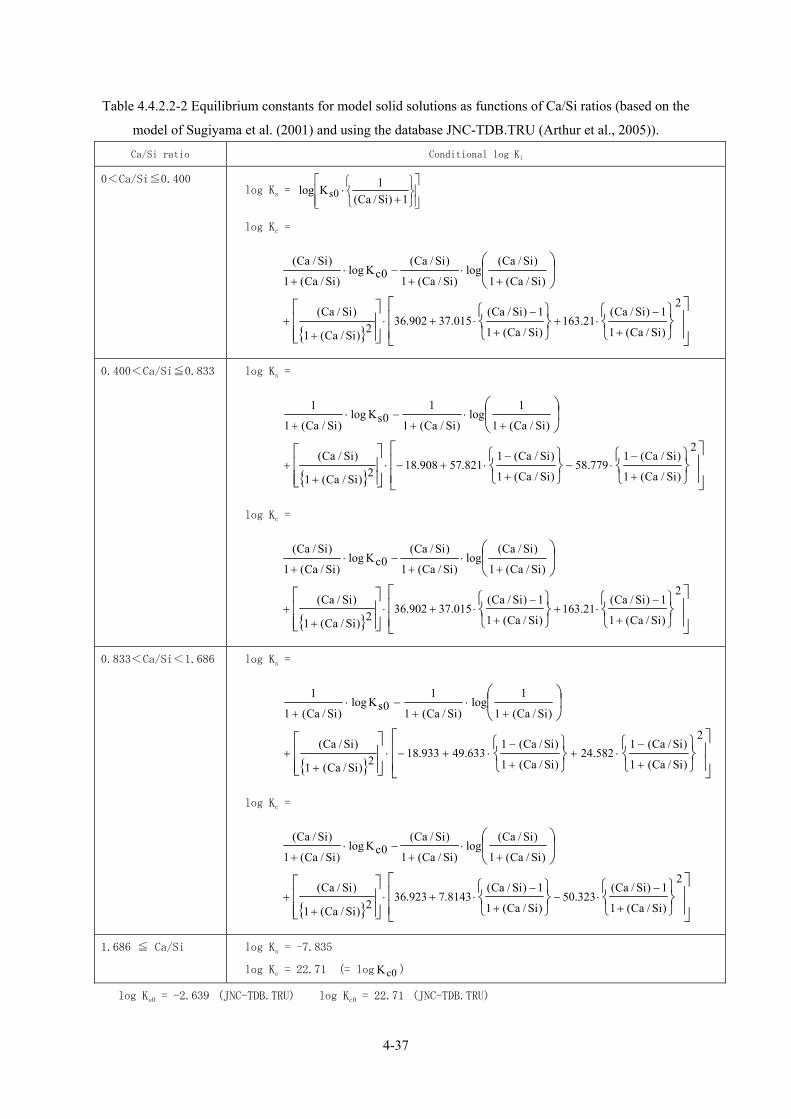
4-37
Table 4.4.2.2-2 Equilibrium constants for model solid solutions as functions of Ca/Si ratios (based on the
model of Sugiyama et al. (2001) and using the database JNC-TDB.TRU (Arthur et al., 2005)).
Ca/Si ratio Conditional log Ki
0<Ca/Si≦0.400 log Ks =
⎥⎥⎦
⎤
⎢⎢⎣
⎡
⎭⎬⎫
⎩⎨⎧
+⋅
1)Si/Ca(1Klog 0s
log Kc =
⎥⎥⎦
⎤
⎢⎢⎣
⎡
⎭⎬⎫
⎩⎨⎧
⎭⎬⎫
⎩⎨⎧
⎥⎥⎦
⎤
⎢⎢⎣
⎡
⎟⎠
⎞⎜⎝
⎛
+
−⋅+
+
−⋅+⋅
++
+⋅
+−⋅
+
2
)Si/Ca(1
1)Si/Ca(21.163
)Si/Ca(1
1)Si/Ca(015.37902.362)Si/Ca(1
)Si/Ca(
)Si/Ca(1
)Si/Ca(log
)Si/Ca(1
)Si/Ca(0cKlog
)Si/Ca(1
)Si/Ca(
0.400<Ca/Si≦0.833 log Ks =
⎥⎥⎦
⎤
⎢⎢⎣
⎡
⎭⎬⎫
⎩⎨⎧
⎭⎬⎫
⎩⎨⎧
⎥⎥⎦
⎤
⎢⎢⎣
⎡
⎟⎠
⎞⎜⎝
⎛
+
−⋅−
+
−⋅+−⋅
++
+⋅
+−⋅
+
2
)Si/Ca(1
)Si/Ca(1779.58
)Si/Ca(1
)Si/Ca(1821.57908.182)Si/Ca(1
)Si/Ca(
)Si/Ca(1
1log
)Si/Ca(1
10sKlog
)Si/Ca(1
1
log Kc =
⎥⎥⎦
⎤
⎢⎢⎣
⎡
⎭⎬⎫
⎩⎨⎧
⎭⎬⎫
⎩⎨⎧
⎥⎥⎦
⎤
⎢⎢⎣
⎡
⎟⎠
⎞⎜⎝
⎛
+
−⋅+
+
−⋅+⋅
++
+⋅
+−⋅
+
2
)Si/Ca(1
1)Si/Ca(21.163
)Si/Ca(1
1)Si/Ca(015.37902.362)Si/Ca(1
)Si/Ca(
)Si/Ca(1
)Si/Ca(log
)Si/Ca(1
)Si/Ca(0cKlog
)Si/Ca(1
)Si/Ca(
0.833<Ca/Si<1.686 log Ks =
⎥⎥⎦
⎤
⎢⎢⎣
⎡
⎭⎬⎫
⎩⎨⎧
⎭⎬⎫
⎩⎨⎧
⎥⎥⎦
⎤
⎢⎢⎣
⎡
⎟⎠
⎞⎜⎝
⎛
+
−⋅+
+
−⋅+−⋅
++
+⋅
+−⋅
+
2
)Si/Ca(1
)Si/Ca(1582.24
)Si/Ca(1
)Si/Ca(1633.49933.182)Si/Ca(1
)Si/Ca(
)Si/Ca(1
1log
)Si/Ca(1
10sKlog
)Si/Ca(1
1
log Kc =
⎥⎥⎦
⎤
⎢⎢⎣
⎡
⎭⎬⎫
⎩⎨⎧
⎭⎬⎫
⎩⎨⎧
⎥⎥⎦
⎤
⎢⎢⎣
⎡
⎟⎠
⎞⎜⎝
⎛
+
−⋅−
+
−⋅+⋅
++
+⋅
+−⋅
+
2
)Si/Ca(1
1)Si/Ca(323.50
)Si/Ca(1
1)Si/Ca(8143.7923.362)Si/Ca(1
)Si/Ca(
)Si/Ca(1
)Si/Ca(log
)Si/Ca(1
)Si/Ca(0cKlog
)Si/Ca(1
)Si/Ca(
1.686 ≦ Ca/Si log Ks = -7.835
log Kc = 22.71 (= log 0cK )
log Ks0 = -2.639 (JNC-TDB.TRU) log Kc0 = 22.71 (JNC-TDB.TRU)
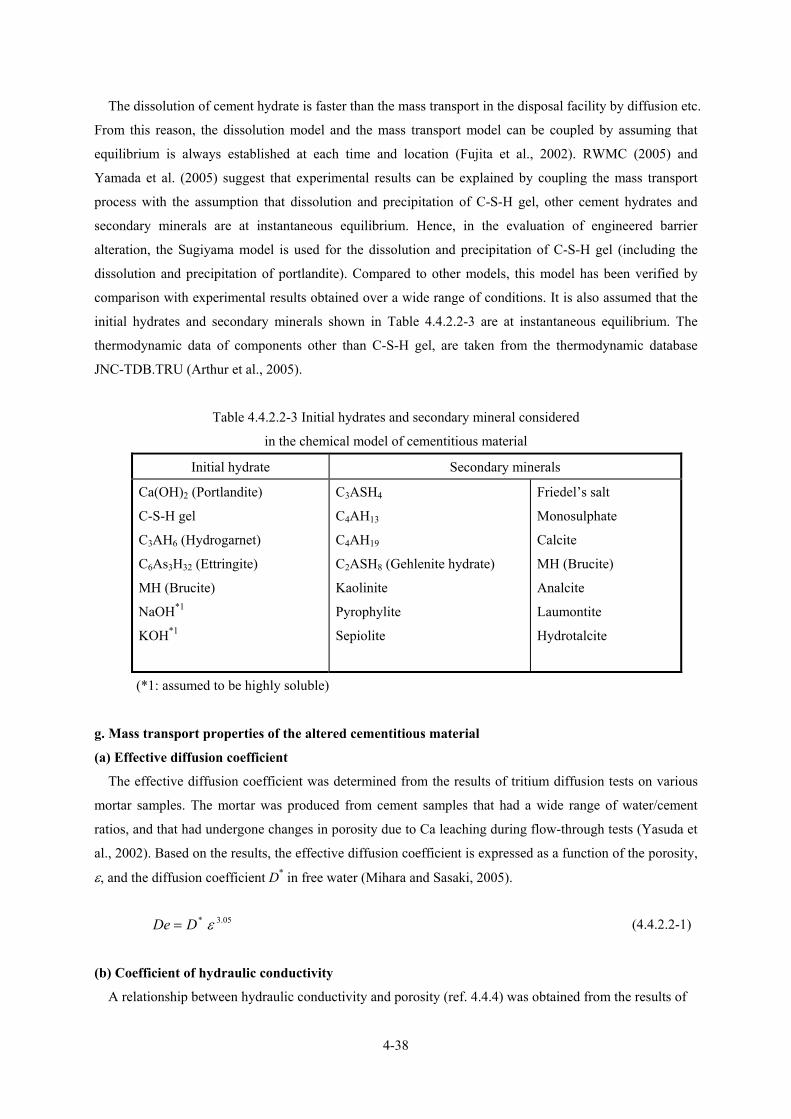
4-38
The dissolution of cement hydrate is faster than the mass transport in the disposal facility by diffusion etc.
From this reason, the dissolution model and the mass transport model can be coupled by assuming that
equilibrium is always established at each time and location (Fujita et al., 2002). RWMC (2005) and
Yamada et al. (2005) suggest that experimental results can be explained by coupling the mass transport
process with the assumption that dissolution and precipitation of C-S-H gel, other cement hydrates and
secondary minerals are at instantaneous equilibrium. Hence, in the evaluation of engineered barrier
alteration, the Sugiyama model is used for the dissolution and precipitation of C-S-H gel (including the
dissolution and precipitation of portlandite). Compared to other models, this model has been verified by
comparison with experimental results obtained over a wide range of conditions. It is also assumed that the
initial hydrates and secondary minerals shown in Table 4.4.2.2-3 are at instantaneous equilibrium. The
thermodynamic data of components other than C-S-H gel, are taken from the thermodynamic database
JNC-TDB.TRU (Arthur et al., 2005).
Table 4.4.2.2-3 Initial hydrates and secondary mineral considered
in the chemical model of cementitious material
Initial hydrate Secondary minerals
Ca(OH)2 (Portlandite)
C-S-H gel
C3AH6 (Hydrogarnet)
C6As3H32 (Ettringite)
MH (Brucite)
NaOH*1
KOH*1
C3ASH4
C4AH13
C4AH19
C2ASH8 (Gehlenite hydrate)
Kaolinite
Pyrophylite
Sepiolite
Friedel’s salt
Monosulphate
Calcite
MH (Brucite)
Analcite
Laumontite
Hydrotalcite
(*1: assumed to be highly soluble)
g. Mass transport properties of the altered cementitious material
(a) Effective diffusion coefficient
The effective diffusion coefficient was determined from the results of tritium diffusion tests on various
mortar samples. The mortar was produced from cement samples that had a wide range of water/cement
ratios, and that had undergone changes in porosity due to Ca leaching during flow-through tests (Yasuda et
al., 2002). Based on the results, the effective diffusion coefficient is expressed as a function of the porosity,
ε, and the diffusion coefficient D* in free water (Mihara and Sasaki, 2005).
05.3* εDDe = (4.4.2.2-1)
(b) Coefficient of hydraulic conductivity
A relationship between hydraulic conductivity and porosity (ref. 4.4.4) was obtained from the results of
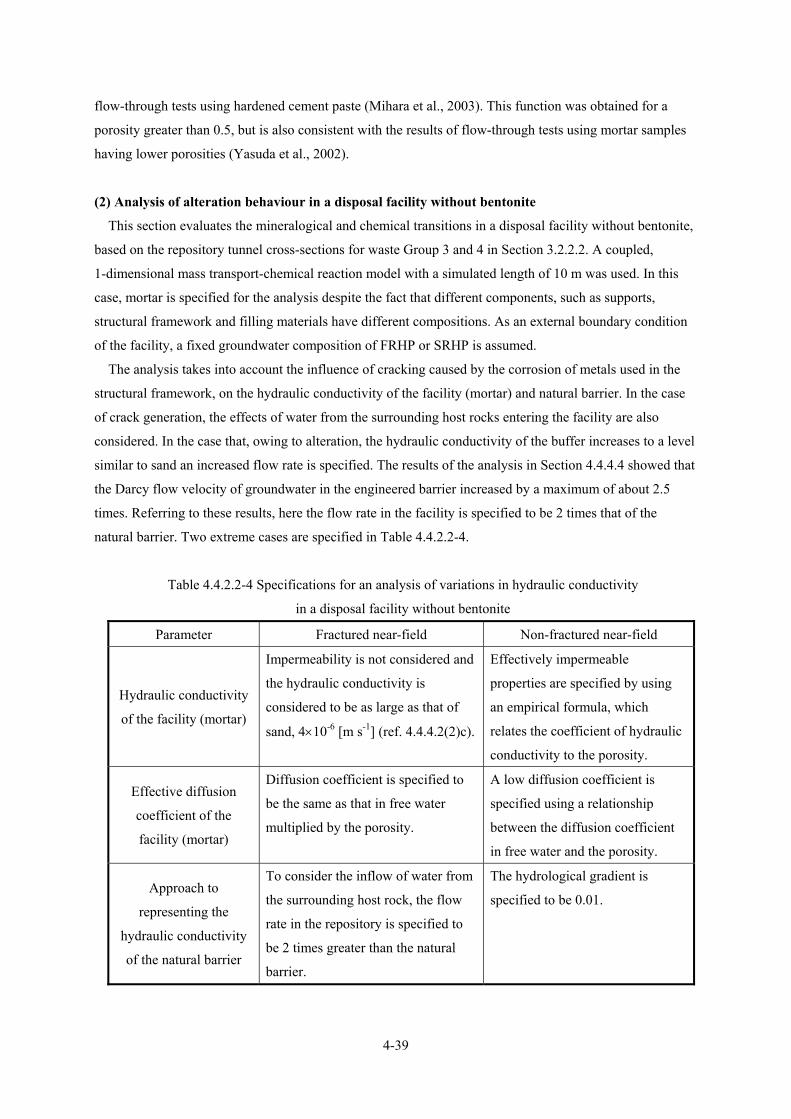
4-39
flow-through tests using hardened cement paste (Mihara et al., 2003). This function was obtained for a
porosity greater than 0.5, but is also consistent with the results of flow-through tests using mortar samples
having lower porosities (Yasuda et al., 2002).
(2) Analysis of alteration behaviour in a disposal facility without bentonite
This section evaluates the mineralogical and chemical transitions in a disposal facility without bentonite,
based on the repository tunnel cross-sections for waste Group 3 and 4 in Section 3.2.2.2. A coupled,
1-dimensional mass transport-chemical reaction model with a simulated length of 10 m was used. In this
case, mortar is specified for the analysis despite the fact that different components, such as supports,
structural framework and filling materials have different compositions. As an external boundary condition
of the facility, a fixed groundwater composition of FRHP or SRHP is assumed.
The analysis takes into account the influence of cracking caused by the corrosion of metals used in the
structural framework, on the hydraulic conductivity of the facility (mortar) and natural barrier. In the case
of crack generation, the effects of water from the surrounding host rocks entering the facility are also
considered. In the case that, owing to alteration, the hydraulic conductivity of the buffer increases to a level
similar to sand an increased flow rate is specified. The results of the analysis in Section 4.4.4.4 showed that
the Darcy flow velocity of groundwater in the engineered barrier increased by a maximum of about 2.5
times. Referring to these results, here the flow rate in the facility is specified to be 2 times that of the
natural barrier. Two extreme cases are specified in Table 4.4.2.2-4.
Table 4.4.2.2-4 Specifications for an analysis of variations in hydraulic conductivity
in a disposal facility without bentonite
Parameter Fractured near-field Non-fractured near-field
Hydraulic conductivity
of the facility (mortar)
Impermeability is not considered and
the hydraulic conductivity is
considered to be as large as that of
sand, 4×10⁻⁶ [m s-1] (ref. 4.4.4.2(2)c).
Effectively impermeable
properties are specified by using
an empirical formula, which
relates the coefficient of hydraulic
conductivity to the porosity.
Effective diffusion
coefficient of the
facility (mortar)
Diffusion coefficient is specified to
be the same as that in free water
multiplied by the porosity.
A low diffusion coefficient is
specified using a relationship
between the diffusion coefficient
in free water and the porosity.
Approach to
representing the
hydraulic conductivity
of the natural barrier
To consider the inflow of water from
the surrounding host rock, the flow
rate in the repository is specified to
be 2 times greater than the natural
barrier.
The hydrological gradient is
specified to be 0.01.

4-40
An example of the simulated variations in the chemical environment is shown in Figure 4.4.2.2-2. The
pH in the facility decreases with time, and the change in the outermost part is faster than that of the central
part (this is a general trend for all cases). The time scales for which different chemical conditions (Region I
and Region II) are maintained, based on the calculation results, are shown in Table 4.4.2.2-5. The tabulated
cases show different combinations of hydraulic conductivities (whether the cement is fractured or not) and
groundwater compositions (FRHP and SRHP). Region II conditions can be maintained for about 1,000
years when the cementitious material is fractured and about 10,000−20,000 years when there are no
fractures. The estimated period until start of Region III depends on the location in the repository (centre or
the outermost part) but is estimated to be about 1,000−10,000 years in the fractured repository and more
than 70,000−100,000 years when there are no fractures. The decrease of pH is faster in the cases of SRHP
than in those of FRHP. With SRHP, the period for which Region II is maintained when the cement is
fractured is half that in the case where the water is FRHP. Moreover, as shown in Section 4.4.2.2(1)c, the
solubility of Ca(OH)2 increases by up to 1.5 times in waste group 3, which includes NaNO3, so decreasing
the maintenance period for Region II may shorten up to 2/3 in the base case (above).
9.5
10.0
10.5
11.0
11.5
12.0
12.5
10 100 1000 10000 100000
Elapsed time [y]
pH
Outermost layer
1.25 m
2.5 m
Center of waste
13.5
13.0
9.5
10.0
10.5
11.0
11.5
12.0
12.5
10 100 1000 10000 100000
Elapsed time [y]
pH
Outermost layer
1.25 m
2.5 m
Center of waste
13.5
13.0
Figure 4.4.2.2-2 Evaluation result for chemical environment in disposal facility without bentonite
(FRHP−with fractured cement)
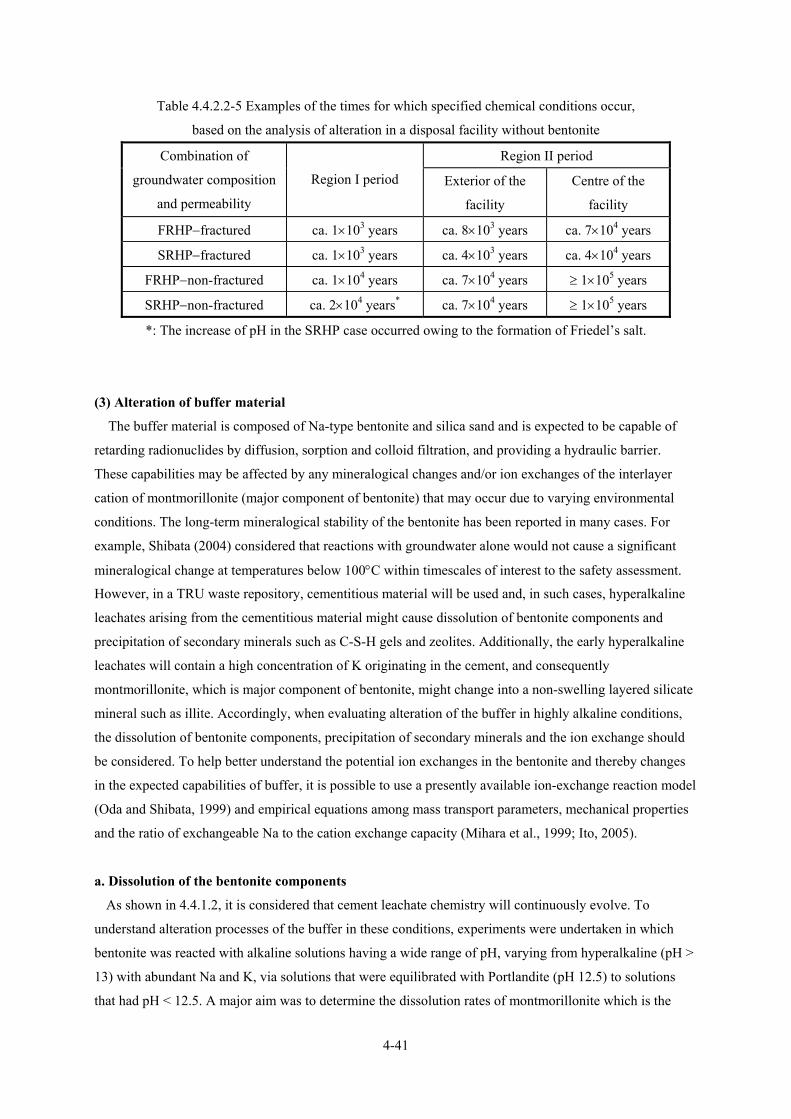
4-41
Table 4.4.2.2-5 Examples of the times for which specified chemical conditions occur,
based on the analysis of alteration in a disposal facility without bentonite
Region II period Combination of
groundwater composition
and permeability
Region I period Exterior of the
facility
Centre of the
facility
FRHP−fractured ca. 1×10³ years ca. 8×10³ years ca. 7×10⁴ years
SRHP−fractured ca. 1×10³ years ca. 4×10³ years ca. 4×10⁴ years
FRHP−non-fractured ca. 1×10⁴ years ca. 7×10⁴ years ≥ 1×10⁵ years
SRHP−non-fractured ca. 2×10⁴ years* ca. 7×10⁴ years ≥ 1×10⁵ years
*: The increase of pH in the SRHP case occurred owing to the formation of Friedel’s salt.
(3) Alteration of buffer material
The buffer material is composed of Na-type bentonite and silica sand and is expected to be capable of
retarding radionuclides by diffusion, sorption and colloid filtration, and providing a hydraulic barrier.
These capabilities may be affected by any mineralogical changes and/or ion exchanges of the interlayer
cation of montmorillonite (major component of bentonite) that may occur due to varying environmental
conditions. The long-term mineralogical stability of the bentonite has been reported in many cases. For
example, Shibata (2004) considered that reactions with groundwater alone would not cause a significant
mineralogical change at temperatures below 100°C within timescales of interest to the safety assessment.
However, in a TRU waste repository, cementitious material will be used and, in such cases, hyperalkaline
leachates arising from the cementitious material might cause dissolution of bentonite components and
precipitation of secondary minerals such as C-S-H gels and zeolites. Additionally, the early hyperalkaline
leachates will contain a high concentration of K originating in the cement, and consequently
montmorillonite, which is major component of bentonite, might change into a non-swelling layered silicate
mineral such as illite. Accordingly, when evaluating alteration of the buffer in highly alkaline conditions,
the dissolution of bentonite components, precipitation of secondary minerals and the ion exchange should
be considered. To help better understand the potential ion exchanges in the bentonite and thereby changes
in the expected capabilities of buffer, it is possible to use a presently available ion-exchange reaction model
(Oda and Shibata, 1999) and empirical equations among mass transport parameters, mechanical properties
and the ratio of exchangeable Na to the cation exchange capacity (Mihara et al., 1999; Ito, 2005).
a. Dissolution of the bentonite components
As shown in 4.4.1.2, it is considered that cement leachate chemistry will continuously evolve. To
understand alteration processes of the buffer in these conditions, experiments were undertaken in which
bentonite was reacted with alkaline solutions having a wide range of pH, varying from hyperalkaline (pH >
13) with abundant Na and K, via solutions that were equilibrated with Portlandite (pH 12.5) to solutions
that had pH < 12.5. A major aim was to determine the dissolution rates of montmorillonite which is the
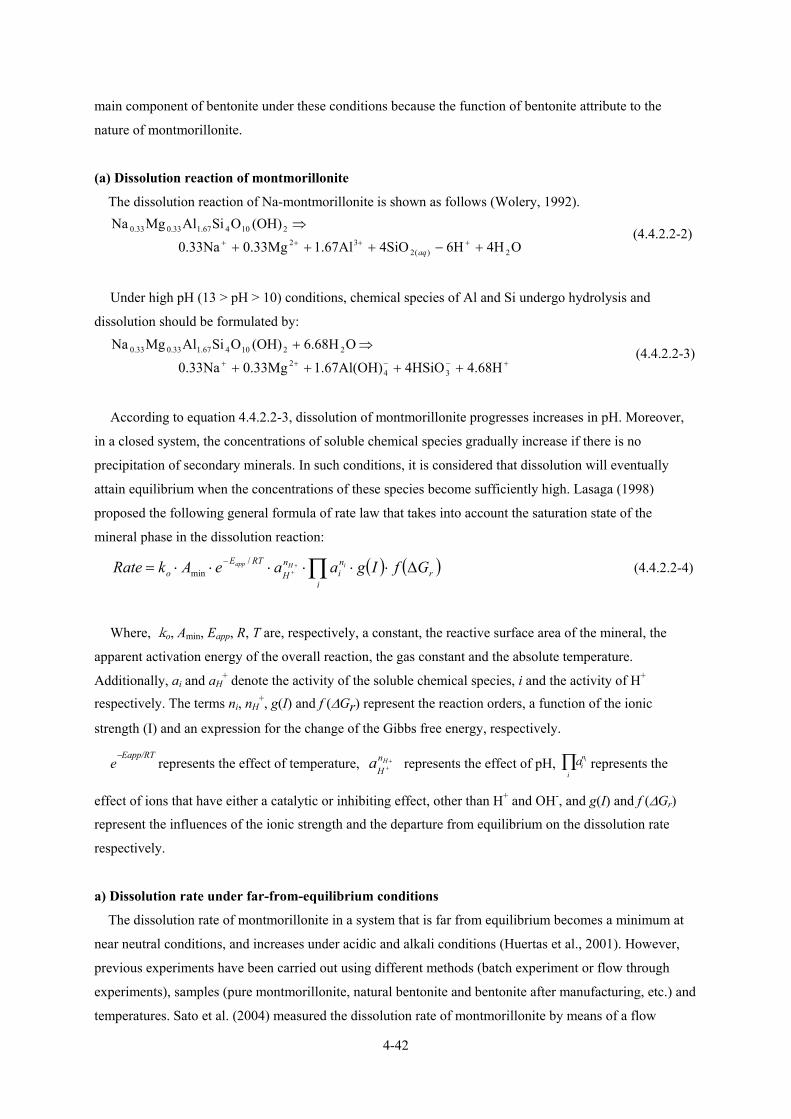
4-42
main component of bentonite under these conditions because the function of bentonite attribute to the
nature of montmorillonite.
(a) Dissolution reaction of montmorillonite
The dissolution reaction of Na-montmorillonite is shown as follows (Wolery, 1992).
O4H6H4SiO1.67Al0.33Mg0.33Na
(OH)OSiAlMgNa
2)(232
21041.670.330.33
+−+++
⇒++++
aq
(4.4.2.2-2)
Under high pH (13 > pH > 10) conditions, chemical species of Al and Si undergo hydrolysis and
dissolution should be formulated by:
+−−++ ++++
⇒+
H68.44HSiO1.67Al(OH)0.33Mg0.33Na
OH68.6(OH)OSiAlMgNa
342
221041.670.330.33 (4.4.2.2-3)
According to equation 4.4.2.2-3, dissolution of montmorillonite progresses increases in pH. Moreover,
in a closed system, the concentrations of soluble chemical species gradually increase if there is no
precipitation of secondary minerals. In such conditions, it is considered that dissolution will eventually
attain equilibrium when the concentrations of these species become sufficiently high. Lasaga (1998)
proposed the following general formula of rate law that takes into account the saturation state of the
mineral phase in the dissolution reaction:
( ) ( )∏ ∆⋅⋅⋅⋅⋅⋅= ++
−
ir
ni
nH
RTEo GfIgaaeAkRate iHapp /
min (4.4.2.2-4)
Where, ko, Amin, Eapp, R, T are, respectively, a constant, the reactive surface area of the mineral, the
apparent activation energy of the overall reaction, the gas constant and the absolute temperature.
Additionally, ai and aH+ denote the activity of the soluble chemical species, i and the activity of H+
respectively. The terms ni, nH+, g(I) and f (∆Gr) represent the reaction orders, a function of the ionic
strength (I) and an expression for the change of the Gibbs free energy, respectively.
e−Eapp/RT
represents the effect of temperature, ++
HnH
a represents the effect of pH, represents the
effect of ions that have either a catalytic or inhibiting effect, other than H+ and OH-, and g(I) and f (∆Gr)
represent the influences of the ionic strength and the departure from equilibrium on the dissolution rate
respectively.
a) Dissolution rate under far-from-equilibrium conditions
The dissolution rate of montmorillonite in a system that is far from equilibrium becomes a minimum at
near neutral conditions, and increases under acidic and alkali conditions (Huertas et al., 2001). However,
previous experiments have been carried out using different methods (batch experiment or flow through
experiments), samples (pure montmorillonite, natural bentonite and bentonite after manufacturing, etc.) and
temperatures. Sato et al. (2004) measured the dissolution rate of montmorillonite by means of a flow
∏i
ni
ia
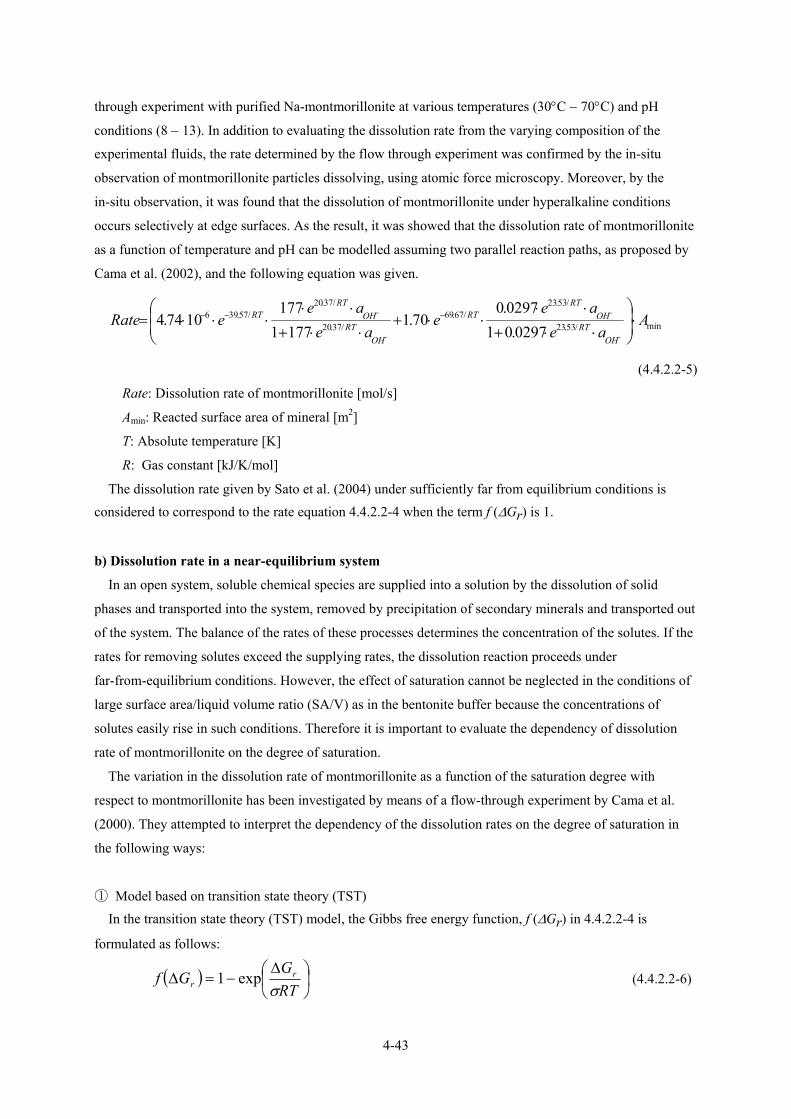
4-43
through experiment with purified Na-montmorillonite at various temperatures (30°C − 70°C) and pH
conditions (8 − 13). In addition to evaluating the dissolution rate from the varying composition of the
experimental fluids, the rate determined by the flow through experiment was confirmed by the in-situ
observation of montmorillonite particles dissolving, using atomic force microscopy. Moreover, by the
in-situ observation, it was found that the dissolution of montmorillonite under hyperalkaline conditions
occurs selectively at edge surfaces. As the result, it was showed that the dissolution rate of montmorillonite
as a function of temperature and pH can be modelled assuming two parallel reaction paths, as proposed by
Cama et al. (2002), and the following equation was given.
min/53.23
/53.23/67.69
/37.20
/37.20/57.396
0297.010297.0
70.11771
1771074.4 A
aeae
eae
aeeRate
OHRT
OHRT
RT
OHRT
OHRT
RT ⋅⎟⎟⎠
⎞⎜⎜⎝
⎛
⋅⋅+
⋅⋅⋅⋅+
⋅⋅+
⋅⋅⋅⋅⋅=
−
−
−
− −−−
(4.4.2.2-5)
Rate: Dissolution rate of montmorillonite [mol/s]
Amin: Reacted surface area of mineral [m2]
T: Absolute temperature [K]
R: Gas constant [kJ/K/mol]
The dissolution rate given by Sato et al. (2004) under sufficiently far from equilibrium conditions is considered to correspond to the rate equation 4.4.2.2-4 when the term f (∆Gr) is 1.
b) Dissolution rate in a near-equilibrium system
In an open system, soluble chemical species are supplied into a solution by the dissolution of solid
phases and transported into the system, removed by precipitation of secondary minerals and transported out
of the system. The balance of the rates of these processes determines the concentration of the solutes. If the
rates for removing solutes exceed the supplying rates, the dissolution reaction proceeds under
far-from-equilibrium conditions. However, the effect of saturation cannot be neglected in the conditions of
large surface area/liquid volume ratio (SA/V) as in the bentonite buffer because the concentrations of
solutes easily rise in such conditions. Therefore it is important to evaluate the dependency of dissolution
rate of montmorillonite on the degree of saturation.
The variation in the dissolution rate of montmorillonite as a function of the saturation degree with
respect to montmorillonite has been investigated by means of a flow-through experiment by Cama et al.
(2000). They attempted to interpret the dependency of the dissolution rates on the degree of saturation in
the following ways:
① Model based on transition state theory (TST) In the transition state theory (TST) model, the Gibbs free energy function, f (∆Gr) in 4.4.2.2-4 is
formulated as follows:
( ) ⎟⎠⎞
⎜⎝⎛ ∆−=∆
RTGGf r
r σexp1
(4.4.2.2-6)
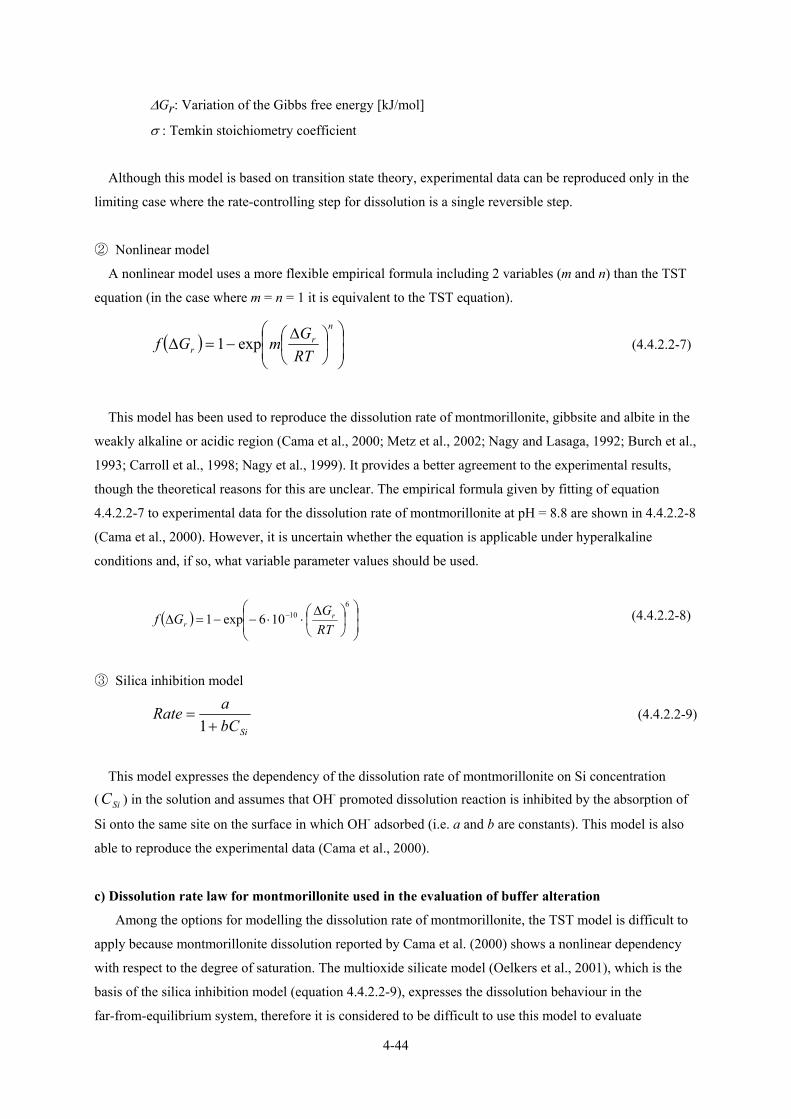
4-44
∆Gr: Variation of the Gibbs free energy [kJ/mol]
σ : Temkin stoichiometry coefficient
Although this model is based on transition state theory, experimental data can be reproduced only in the
limiting case where the rate-controlling step for dissolution is a single reversible step.
② Nonlinear model
A nonlinear model uses a more flexible empirical formula including 2 variables (m and n) than the TST
equation (in the case where m = n = 1 it is equivalent to the TST equation).
( ) ⎟⎟⎠
⎞⎜⎜⎝
⎛⎟⎠⎞
⎜⎝⎛ ∆−=∆
nr
r RTGmGf exp1 (4.4.2.2-7)
This model has been used to reproduce the dissolution rate of montmorillonite, gibbsite and albite in the
weakly alkaline or acidic region (Cama et al., 2000; Metz et al., 2002; Nagy and Lasaga, 1992; Burch et al.,
1993; Carroll et al., 1998; Nagy et al., 1999). It provides a better agreement to the experimental results,
though the theoretical reasons for this are unclear. The empirical formula given by fitting of equation
4.4.2.2-7 to experimental data for the dissolution rate of montmorillonite at pH = 8.8 are shown in 4.4.2.2-8
(Cama et al., 2000). However, it is uncertain whether the equation is applicable under hyperalkaline
conditions and, if so, what variable parameter values should be used.
( ) ⎟⎟⎠
⎞⎜⎜⎝
⎛⎟⎠⎞
⎜⎝⎛ ∆⋅⋅−−=∆ −
610106exp1
RTGGf r
r (4.4.2.2-8)
③ Silica inhibition model
SibCaRate
+=
1 (4.4.2.2-9)
This model expresses the dependency of the dissolution rate of montmorillonite on Si concentration
( SiC ) in the solution and assumes that OH- promoted dissolution reaction is inhibited by the absorption of
Si onto the same site on the surface in which OH- adsorbed (i.e. a and b are constants). This model is also
able to reproduce the experimental data (Cama et al., 2000).
c) Dissolution rate law for montmorillonite used in the evaluation of buffer alteration
Among the options for modelling the dissolution rate of montmorillonite, the TST model is difficult to
apply because montmorillonite dissolution reported by Cama et al. (2000) shows a nonlinear dependency
with respect to the degree of saturation. The multioxide silicate model (Oelkers et al., 2001), which is the
basis of the silica inhibition model (equation 4.4.2.2-9), expresses the dissolution behaviour in the
far-from-equilibrium system, therefore it is considered to be difficult to use this model to evaluate
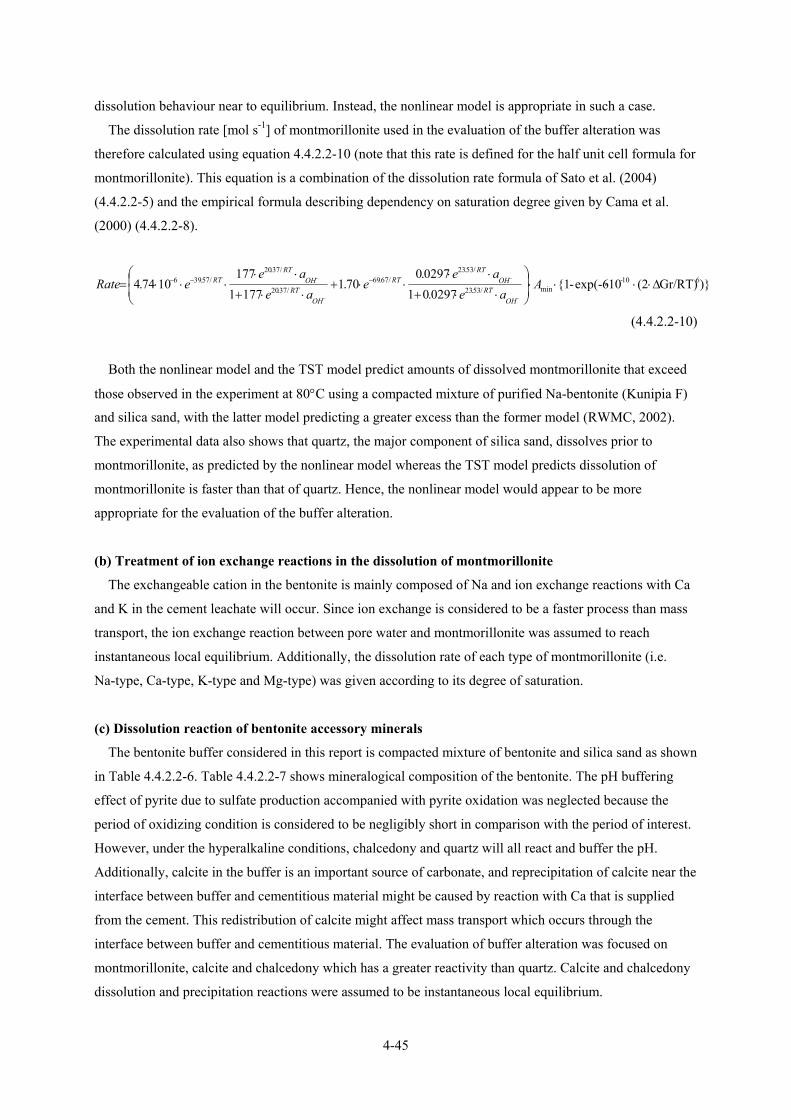
4-45
dissolution behaviour near to equilibrium. Instead, the nonlinear model is appropriate in such a case.
The dissolution rate [mol s-1] of montmorillonite used in the evaluation of the buffer alteration was
therefore calculated using equation 4.4.2.2-10 (note that this rate is defined for the half unit cell formula for
montmorillonite). This equation is a combination of the dissolution rate formula of Sato et al. (2004)
(4.4.2.2-5) and the empirical formula describing dependency on saturation degree given by Cama et al.
(2000) (4.4.2.2-8).
) Gr/RT)(2 10exp(-6-10297.01
0297.070.1
1771177
1074.4 6 10-min/53.23
/53.23/67.69
/37.20
/37.20/57.396 ∆⋅⋅⋅⋅⋅⎟
⎟⎠
⎞⎜⎜⎝
⎛
⋅⋅+
⋅⋅⋅⋅+
⋅⋅+
⋅⋅⋅⋅⋅=
−
−
−
− −−− Aae
aee
aeae
eRateOH
RTOH
RTRT
OHRT
OHRT
RT
(4.4.2.2-10)
Both the nonlinear model and the TST model predict amounts of dissolved montmorillonite that exceed
those observed in the experiment at 80°C using a compacted mixture of purified Na-bentonite (Kunipia F)
and silica sand, with the latter model predicting a greater excess than the former model (RWMC, 2002).
The experimental data also shows that quartz, the major component of silica sand, dissolves prior to
montmorillonite, as predicted by the nonlinear model whereas the TST model predicts dissolution of
montmorillonite is faster than that of quartz. Hence, the nonlinear model would appear to be more
appropriate for the evaluation of the buffer alteration.
(b) Treatment of ion exchange reactions in the dissolution of montmorillonite
The exchangeable cation in the bentonite is mainly composed of Na and ion exchange reactions with Ca
and K in the cement leachate will occur. Since ion exchange is considered to be a faster process than mass
transport, the ion exchange reaction between pore water and montmorillonite was assumed to reach
instantaneous local equilibrium. Additionally, the dissolution rate of each type of montmorillonite (i.e.
Na-type, Ca-type, K-type and Mg-type) was given according to its degree of saturation.
(c) Dissolution reaction of bentonite accessory minerals
The bentonite buffer considered in this report is compacted mixture of bentonite and silica sand as shown
in Table 4.4.2.2-6. Table 4.4.2.2-7 shows mineralogical composition of the bentonite. The pH buffering
effect of pyrite due to sulfate production accompanied with pyrite oxidation was neglected because the
period of oxidizing condition is considered to be negligibly short in comparison with the period of interest.
However, under the hyperalkaline conditions, chalcedony and quartz will all react and buffer the pH.
Additionally, calcite in the buffer is an important source of carbonate, and reprecipitation of calcite near the
interface between buffer and cementitious material might be caused by reaction with Ca that is supplied
from the cement. This redistribution of calcite might affect mass transport which occurs through the
interface between buffer and cementitious material. The evaluation of buffer alteration was focused on
montmorillonite, calcite and chalcedony which has a greater reactivity than quartz. Calcite and chalcedony
dissolution and precipitation reactions were assumed to be instantaneous local equilibrium.
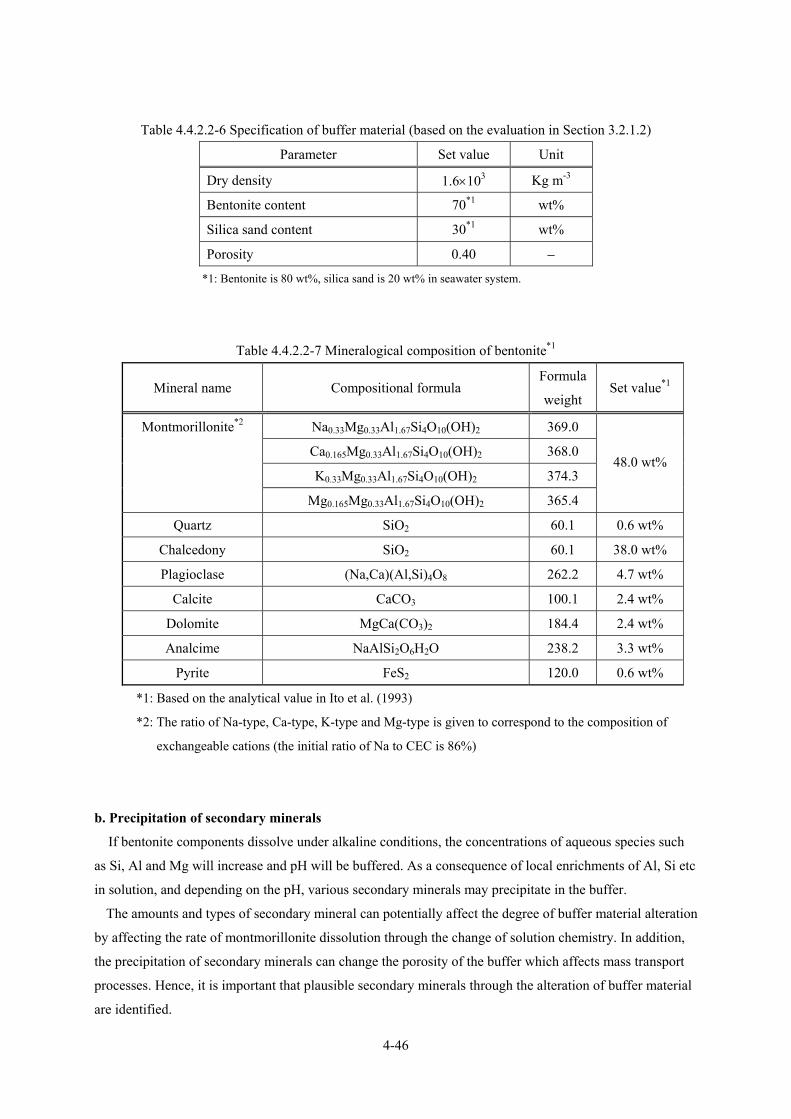
4-46
Table 4.4.2.2-6 Specification of buffer material (based on the evaluation in Section 3.2.1.2)
Parameter Set value Unit
Dry density 1.6×10³ Kg m-3
Bentonite content 70*1 wt%
Silica sand content 30*1 wt%
Porosity 0.40 −
*1: Bentonite is 80 wt%, silica sand is 20 wt% in seawater system.
Table 4.4.2.2-7 Mineralogical composition of bentonite*1
Mineral name Compositional formula Formula
weight Set value*1
Na0.33Mg0.33Al1.67Si4O10(OH)2 369.0
Ca0.165Mg0.33Al1.67Si4O10(OH)2 368.0
K0.33Mg0.33Al1.67Si4O10(OH)2 374.3
Montmorillonite*2
Mg0.165Mg0.33Al1.67Si4O10(OH)2 365.4
48.0 wt%
Quartz SiO2 60.1 0.6 wt%
Chalcedony SiO2 60.1 38.0 wt%
Plagioclase (Na,Ca)(Al,Si)4O8 262.2 4.7 wt%
Calcite CaCO3 100.1 2.4 wt%
Dolomite MgCa(CO3)2 184.4 2.4 wt%
Analcime NaAlSi2O6H2O 238.2 3.3 wt%
Pyrite FeS2 120.0 0.6 wt%
*1: Based on the analytical value in Ito et al. (1993)
*2: The ratio of Na-type, Ca-type, K-type and Mg-type is given to correspond to the composition of
exchangeable cations (the initial ratio of Na to CEC is 86%)
b. Precipitation of secondary minerals
If bentonite components dissolve under alkaline conditions, the concentrations of aqueous species such
as Si, Al and Mg will increase and pH will be buffered. As a consequence of local enrichments of Al, Si etc
in solution, and depending on the pH, various secondary minerals may precipitate in the buffer.
The amounts and types of secondary mineral can potentially affect the degree of buffer material alteration
by affecting the rate of montmorillonite dissolution through the change of solution chemistry. In addition,
the precipitation of secondary minerals can change the porosity of the buffer which affects mass transport
processes. Hence, it is important that plausible secondary minerals through the alteration of buffer material
are identified.
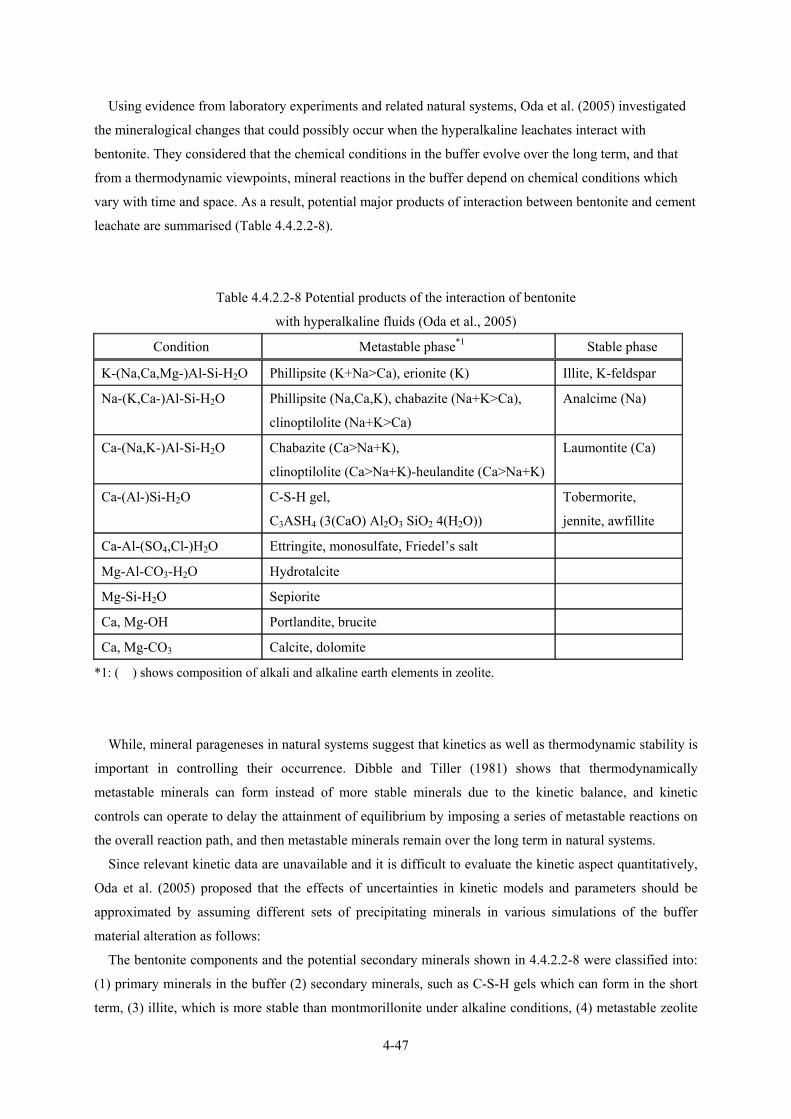
4-47
Using evidence from laboratory experiments and related natural systems, Oda et al. (2005) investigated
the mineralogical changes that could possibly occur when the hyperalkaline leachates interact with
bentonite. They considered that the chemical conditions in the buffer evolve over the long term, and that
from a thermodynamic viewpoints, mineral reactions in the buffer depend on chemical conditions which
vary with time and space. As a result, potential major products of interaction between bentonite and cement
leachate are summarised (Table 4.4.2.2-8).
Table 4.4.2.2-8 Potential products of the interaction of bentonite
with hyperalkaline fluids (Oda et al., 2005)
Condition Metastable phase*1 Stable phase
K-(Na,Ca,Mg-)Al-Si-H2O Phillipsite (K+Na>Ca), erionite (K) Illite, K-feldspar
Na-(K,Ca-)Al-Si-H2O Phillipsite (Na,Ca,K), chabazite (Na+K>Ca),
clinoptilolite (Na+K>Ca)
Analcime (Na)
Ca-(Na,K-)Al-Si-H2O Chabazite (Ca>Na+K),
clinoptilolite (Ca>Na+K)-heulandite (Ca>Na+K)
Laumontite (Ca)
Ca-(Al-)Si-H2O C-S-H gel,
C3ASH4 (3(CaO) Al2O3 SiO2 4(H2O))
Tobermorite,
jennite, awfillite
Ca-Al-(SO4,Cl-)H2O Ettringite, monosulfate, Friedel’s salt
Mg-Al-CO3-H2O Hydrotalcite
Mg-Si-H2O Sepiorite
Ca, Mg-OH Portlandite, brucite
Ca, Mg-CO3 Calcite, dolomite
*1: ( ) shows composition of alkali and alkaline earth elements in zeolite.
While, mineral parageneses in natural systems suggest that kinetics as well as thermodynamic stability is
important in controlling their occurrence. Dibble and Tiller (1981) shows that thermodynamically
metastable minerals can form instead of more stable minerals due to the kinetic balance, and kinetic
controls can operate to delay the attainment of equilibrium by imposing a series of metastable reactions on
the overall reaction path, and then metastable minerals remain over the long term in natural systems.
Since relevant kinetic data are unavailable and it is difficult to evaluate the kinetic aspect quantitatively,
Oda et al. (2005) proposed that the effects of uncertainties in kinetic models and parameters should be
approximated by assuming different sets of precipitating minerals in various simulations of the buffer
material alteration as follows:
The bentonite components and the potential secondary minerals shown in 4.4.2.2-8 were classified into:
(1) primary minerals in the buffer (2) secondary minerals, such as C-S-H gels which can form in the short
term, (3) illite, which is more stable than montmorillonite under alkaline conditions, (4) metastable zeolite

4-48
and (5) thermodynamically stable zeolite and K-feldspar. Mineralogical evolution paths of aluminosilicate
minerals were summarised as shown in Fig.4.4.2.2-3 on the basis of the evidence from laboratory
experiments and related natural systems. Based on the pathways shown in Fig.4.4.2.2-3, the correlation
among five mineral groups was defined as shown in Fig.4.4.2.2-4. In other words, multiple scenarios for
mineralogical evolution of the buffer material were considered, for a case where formation of relatively
metastable phases may be dominant for long periods, a case where metastable phases may change to more
stable phases rapidly so that metastable phases disappear quickly, a case where the transformation proceeds
so slowly that metastable phases can exist with stable phases and a case where local thermodynamic
equilibrium may be attained in relatively short periods.
To demonstrate hypothetical kinetic driving forces in the simulations, at first, instantaneous equilibrium
was assumed for all precipitation reactions of the secondary minerals mentioned above. This assumption
corresponds to infinite precipitation rates for all secondary mineral groups. On the other hand, if secondary
mineral groups were removed from the analytical system, it assumes that there were zero precipitation rates
for secondary minerals. By taking this approach, the impacts of mineral paragenetic uncertainty on the
evaluation of the buffer material alteration over the long term were bounded.
Hence, combinations of mineral groups assumed in the analyses for the buffer alteration were given
according to the scenarios as shown in Fig.4.4.2.2-4.
On the other hand, smectite minerals other than montmorillonite may form as a result of reactions among
groundwater, cementitious material and bentonite. For example, the possibility that high-Mg saponite might
precipitate has been suggested (Inoue, 2004). The transformation of montmorillonite to beidellite under
highly alkaline and saline conditions has also been reported (Karnland et al., 2004). However, the swelling
properties and low permeability of saponite is equal to or better than those of montmorillonite (Villar and
Rivas, 1994). Additionally, the swelling properties of the Ca-type bentonite of which the main component
is beidellite are equal to or better than those of the Ca-type bentonite of which main component is
montmorillonite (Huang and Chen, 2004). Therefore, it is not plausible that mineral variations within the
smectitic mineral group will cause a significant degradation of the functions of buffer material. Hence, in
this report smectitic minerals other than montmorillonite were not specified as secondary minerals.
イライトIllite
Metastable zeolite Stable phase (stable zeolite, potassium feldspar)
Non -crystalline smectite
イライトIllite
Metastable zeolite Stable phase (stable zeolite, potassium feldspar)
Non -crystalline smectite
Figure 4.4.2.2-3 Outline of the mineralogical consequences of aluminosilicate mineral (Oda et al., 2005)
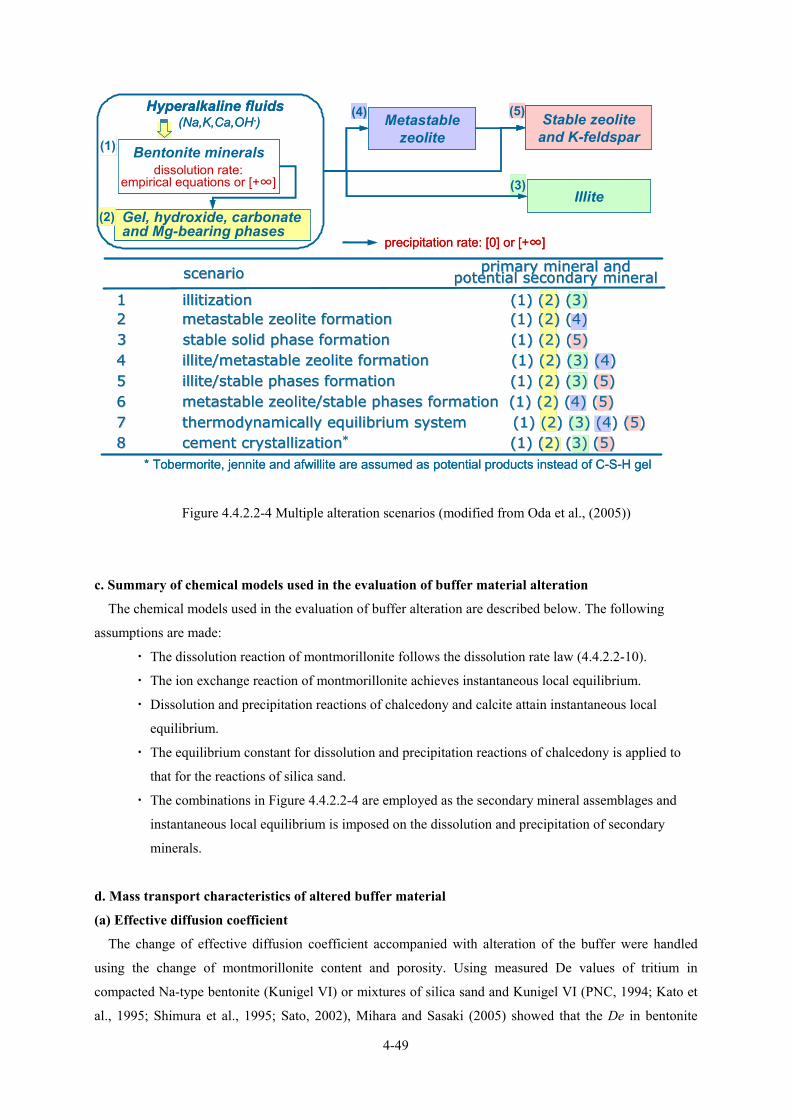
4-49
Figure 4.4.2.2-4 Multiple alteration scenarios (modified from Oda et al., (2005))
c. Summary of chemical models used in the evaluation of buffer material alteration
The chemical models used in the evaluation of buffer alteration are described below. The following
assumptions are made:
・ The dissolution reaction of montmorillonite follows the dissolution rate law (4.4.2.2-10).
・ The ion exchange reaction of montmorillonite achieves instantaneous local equilibrium.
・ Dissolution and precipitation reactions of chalcedony and calcite attain instantaneous local
equilibrium.
・ The equilibrium constant for dissolution and precipitation reactions of chalcedony is applied to
that for the reactions of silica sand.
・ The combinations in Figure 4.4.2.2-4 are employed as the secondary mineral assemblages and
instantaneous local equilibrium is imposed on the dissolution and precipitation of secondary
minerals.
d. Mass transport characteristics of altered buffer material
(a) Effective diffusion coefficient
The change of effective diffusion coefficient accompanied with alteration of the buffer were handled
using the change of montmorillonite content and porosity. Using measured De values of tritium in
compacted Na-type bentonite (Kunigel VI) or mixtures of silica sand and Kunigel VI (PNC, 1994; Kato et
al., 1995; Shimura et al., 1995; Sato, 2002), Mihara and Sasaki (2005) showed that the De in bentonite
* Tobermorite, jennite and afwillite are assumed as potential products instead of C-S-H gel
Illite
Stable zeoliteand K-feldspar
Metastablezeolite
Gel, hydroxide, carbonate and Mg-bearing phases
(2)
(3)
(4) (5)
Bentonite minerals(1)
11 illitizationillitization (1) (2) (3)(1) (2) (3)2 2 metastablemetastable zeolitezeolite formation formation (1) (2) (4)(1) (2) (4)
44 illite/metastableillite/metastable zeolitezeolite formation (1) (2) (3) (4)formation (1) (2) (3) (4)55 illiteillite/stable phases formation /stable phases formation (1) (2) (3) (5)(1) (2) (3) (5)
33 stable solid phase formation stable solid phase formation (1) (2) (5)(1) (2) (5)
6 6 metastablemetastable zeolitezeolite/stable phases formation (1) (2) (4) (5)/stable phases formation (1) (2) (4) (5)
88 cement crystallizationcement crystallization* * (1) (2) (3) (5)(1) (2) (3) (5)
scenarioscenario primary mineral andprimary mineral andpotential secondary mineralpotential secondary mineral
dissolution rate: empirical equations or [+∞]
precipitation rate: [0] or [+∞]
Hyperalkaline fluids (Na,K,Ca,OH-)
77 thermodynamically equilibrium system (1) (2) (3) (4) (5)thermodynamically equilibrium system (1) (2) (3) (4) (5)
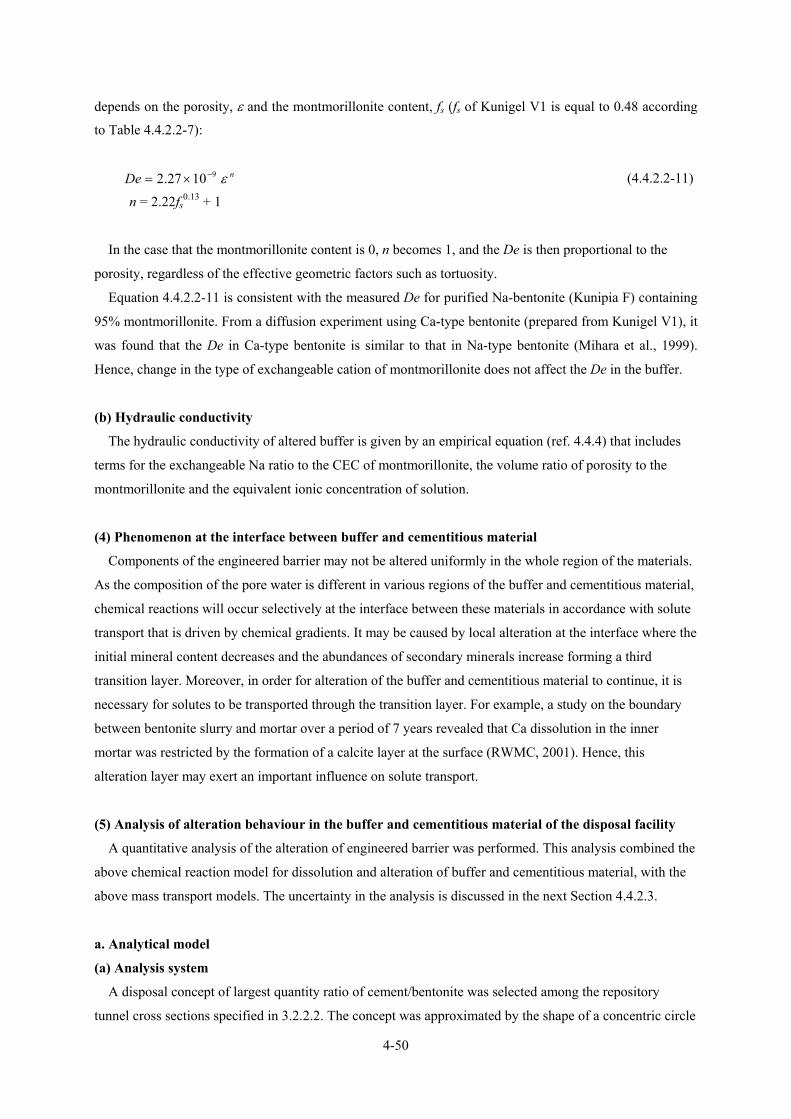
4-50
depends on the porosity, ε and the montmorillonite content, fs (fs of Kunigel V1 is equal to 0.48 according
to Table 4.4.2.2-7):
nDe ε91027.2 −×= (4.4.2.2-11)
n = 2.22fs0.13 + 1
In the case that the montmorillonite content is 0, n becomes 1, and the De is then proportional to the
porosity, regardless of the effective geometric factors such as tortuosity.
Equation 4.4.2.2-11 is consistent with the measured De for purified Na-bentonite (Kunipia F) containing
95% montmorillonite. From a diffusion experiment using Ca-type bentonite (prepared from Kunigel V1), it
was found that the De in Ca-type bentonite is similar to that in Na-type bentonite (Mihara et al., 1999).
Hence, change in the type of exchangeable cation of montmorillonite does not affect the De in the buffer.
(b) Hydraulic conductivity
The hydraulic conductivity of altered buffer is given by an empirical equation (ref. 4.4.4) that includes
terms for the exchangeable Na ratio to the CEC of montmorillonite, the volume ratio of porosity to the
montmorillonite and the equivalent ionic concentration of solution.
(4) Phenomenon at the interface between buffer and cementitious material
Components of the engineered barrier may not be altered uniformly in the whole region of the materials.
As the composition of the pore water is different in various regions of the buffer and cementitious material,
chemical reactions will occur selectively at the interface between these materials in accordance with solute
transport that is driven by chemical gradients. It may be caused by local alteration at the interface where the
initial mineral content decreases and the abundances of secondary minerals increase forming a third
transition layer. Moreover, in order for alteration of the buffer and cementitious material to continue, it is
necessary for solutes to be transported through the transition layer. For example, a study on the boundary
between bentonite slurry and mortar over a period of 7 years revealed that Ca dissolution in the inner
mortar was restricted by the formation of a calcite layer at the surface (RWMC, 2001). Hence, this
alteration layer may exert an important influence on solute transport.
(5) Analysis of alteration behaviour in the buffer and cementitious material of the disposal facility
A quantitative analysis of the alteration of engineered barrier was performed. This analysis combined the
above chemical reaction model for dissolution and alteration of buffer and cementitious material, with the
above mass transport models. The uncertainty in the analysis is discussed in the next Section 4.4.2.3.
a. Analytical model
(a) Analysis system
A disposal concept of largest quantity ratio of cement/bentonite was selected among the repository
tunnel cross sections specified in 3.2.2.2. The concept was approximated by the shape of a concentric circle
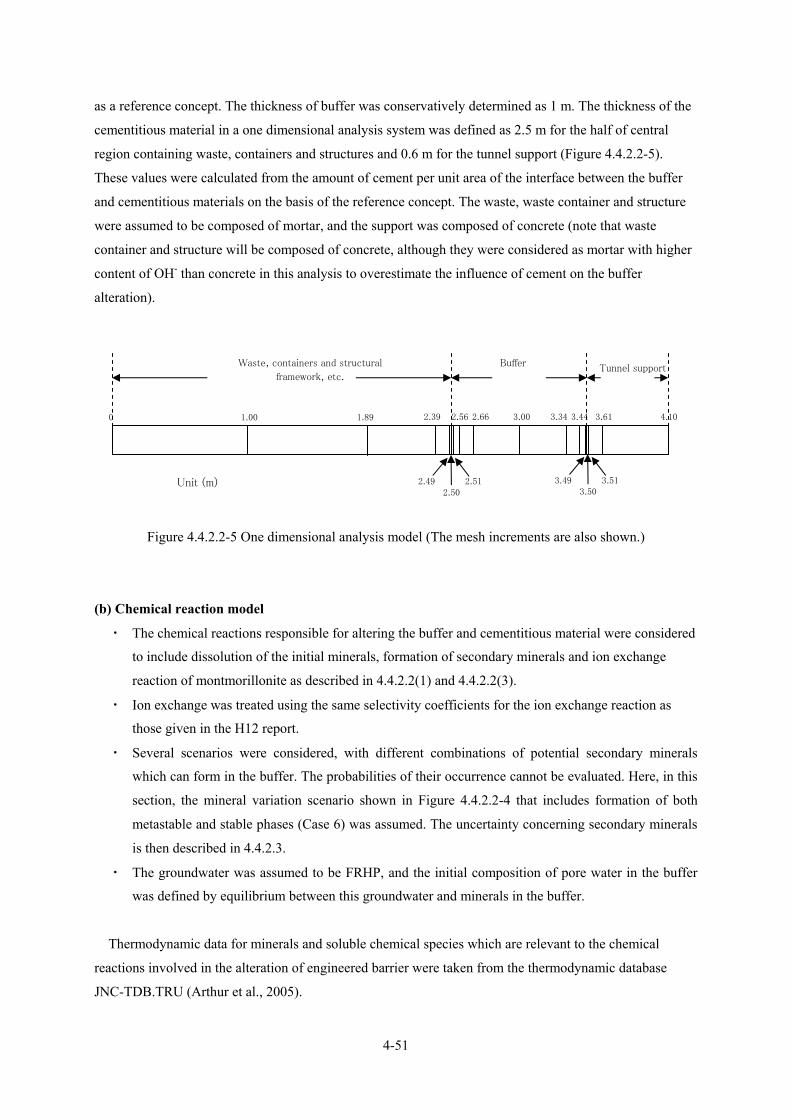
4-51
as a reference concept. The thickness of buffer was conservatively determined as 1 m. The thickness of the
cementitious material in a one dimensional analysis system was defined as 2.5 m for the half of central
region containing waste, containers and structures and 0.6 m for the tunnel support (Figure 4.4.2.2-5).
These values were calculated from the amount of cement per unit area of the interface between the buffer
and cementitious materials on the basis of the reference concept. The waste, waste container and structure
were assumed to be composed of mortar, and the support was composed of concrete (note that waste
container and structure will be composed of concrete, although they were considered as mortar with higher
content of OH- than concrete in this analysis to overestimate the influence of cement on the buffer
alteration).
Figure 4.4.2.2-5 One dimensional analysis model (The mesh increments are also shown.)
(b) Chemical reaction model
・ The chemical reactions responsible for altering the buffer and cementitious material were considered
to include dissolution of the initial minerals, formation of secondary minerals and ion exchange
reaction of montmorillonite as described in 4.4.2.2(1) and 4.4.2.2(3).
・ Ion exchange was treated using the same selectivity coefficients for the ion exchange reaction as
those given in the H12 report.
・ Several scenarios were considered, with different combinations of potential secondary minerals
which can form in the buffer. The probabilities of their occurrence cannot be evaluated. Here, in this
section, the mineral variation scenario shown in Figure 4.4.2.2-4 that includes formation of both
metastable and stable phases (Case 6) was assumed. The uncertainty concerning secondary minerals
is then described in 4.4.2.3.
・ The groundwater was assumed to be FRHP, and the initial composition of pore water in the buffer
was defined by equilibrium between this groundwater and minerals in the buffer.
Thermodynamic data for minerals and soluble chemical species which are relevant to the chemical
reactions involved in the alteration of engineered barrier were taken from the thermodynamic database
JNC-TDB.TRU (Arthur et al., 2005).
0 1.00 1.89 2.39 2.56 2.66 3.00 3.34 3.44 3.61 4.10
2.492.50
2.51 3.49 3.50
3.51
Waste, containers and structural
framework, etc.
Buffer Tunnel support
Unit (m)
4-52
(c) Mass transport model
Only diffusion was considered as the mechanism for mass transport due to the following reason. Using
experimental data and the empirical formula (4.4.4), the hydraulic conductivity of the hypothetically
degraded buffer (montmorillonite has all converted into Ca-type and about 60% of it has disappeared) is
estimated to be less than 10-10 m s-1. De values of the buffer with such degradation are estimated to be in
the order of 10-10 m2 s-1 from equation 4.4.2.2-11. In this case, assuming the hydrological gradient of 0.01
for “Reference Case,” the Darcy flow velocity in the region of the buffer is estimated to be 10-12 m s-1. In
the case that the representative length of the buffer is 1 m, the Peclet number becomes 10-2. Therefore
diffusion is the dominant mechanism for mass transport.
The variation of De in the engineered barrier caused by alteration of buffer and cementitious material
was expressed by the empirical formula described in (1) and (3). The mechanical phenomena were not
included and the porosity change was calculated only from the change in volume of each mineral caused by
the chemical reactions. The mechanical effects are considered in 4.4.2.3.
(d) Boundary condition
The realistic exterior boundary condition includes heterogeneity and uncertainty in hydrogeological
characteristics of the natural barrier. For example, there may be heterogeneity of permeability place by
place even in same site. Owing to a lack of information, essentially site-specific average hydraulic
conductivities and in-situ hydraulic conductivities, can not be determined. The following extreme
conditions were given analytical cases for bounding the impact of uncertainty relevant to the exterior
boundary conditions on the evaluation of the engineered barrier alteration:
・ A case in which it is assumed that there is a highly permeable zone such as a fracture zone and that the
boundary condition has a constant concentration fixed at the surrounding groundwater composition.
・ A case in which it is assumed that the host rock is of extremely low hydraulic conductivity giving a
zero flux boundary condition.
Additionally, a case where there is a significant increase of hydraulic conductivity in a concrete tunnel
support by its degradation, the degraded support may become the prevailing flow path for groundwater. In
this case, the pH of the pore water in the support may remarkably drop and degree of alteration of buffer
from outside may be decreased. By contrast, the alteration of buffer from inside may not be affected by the
elevation of hydraulic conductivites in support region because dominant mass transport mechanism within
buffer may remain diffusion. Hence, such an effect is not considered in the analysis.
This section describes the analytical results in the case where there is a constant concentration fixed at
the groundwater concentration (FRHP) as the exterior boundary condition. The case where there is a zero
flux at the boundary is describe in 4.4.2.3.
b. Analytical results
The temporal variation of pH, porosity and the distribution of mineral components in the engineered
barrier after 100,000 years, is shown in Figures 4.4.2.2-6 to 4.4.2.2-8.

4-53
Figure 4.4.2.2-6 Temporal variation of pH distribution
Figure 4.4.2.2-7 Temporal variation of porosity distribution
Poro
sity
ratio
[-]
Poro
sity
ratio
[-]
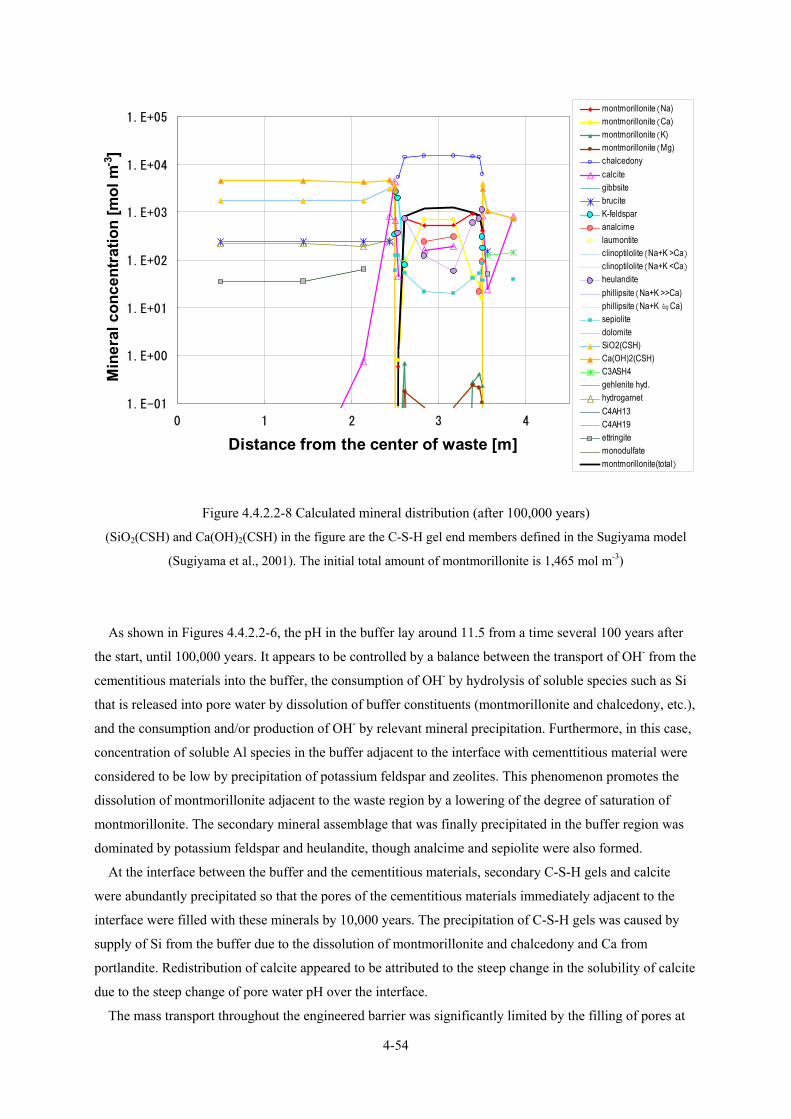
4-54
Figure 4.4.2.2-8 Calculated mineral distribution (after 100,000 years)
(SiO2(CSH) and Ca(OH)2(CSH) in the figure are the C-S-H gel end members defined in the Sugiyama model
(Sugiyama et al., 2001). The initial total amount of montmorillonite is 1,465 mol m-3)
As shown in Figures 4.4.2.2-6, the pH in the buffer lay around 11.5 from a time several 100 years after
the start, until 100,000 years. It appears to be controlled by a balance between the transport of OH- from the
cementitious materials into the buffer, the consumption of OH- by hydrolysis of soluble species such as Si
that is released into pore water by dissolution of buffer constituents (montmorillonite and chalcedony, etc.),
and the consumption and/or production of OH- by relevant mineral precipitation. Furthermore, in this case,
concentration of soluble Al species in the buffer adjacent to the interface with cementtitious material were
considered to be low by precipitation of potassium feldspar and zeolites. This phenomenon promotes the
dissolution of montmorillonite adjacent to the waste region by a lowering of the degree of saturation of
montmorillonite. The secondary mineral assemblage that was finally precipitated in the buffer region was
dominated by potassium feldspar and heulandite, though analcime and sepiolite were also formed.
At the interface between the buffer and the cementitious materials, secondary C-S-H gels and calcite
were abundantly precipitated so that the pores of the cementitious materials immediately adjacent to the
interface were filled with these minerals by 10,000 years. The precipitation of C-S-H gels was caused by
supply of Si from the buffer due to the dissolution of montmorillonite and chalcedony and Ca from
portlandite. Redistribution of calcite appeared to be attributed to the steep change in the solubility of calcite
due to the steep change of pore water pH over the interface.
The mass transport throughout the engineered barrier was significantly limited by the filling of pores at
1.E-01
1.E+00
1.E+01
1.E+02
1.E+03
1.E+04
1.E+05
0 1 2 3 4
Distance from the center of waste [m]
Min
eral
con
cent
ratio
n [m
ol m
-3]
montmorillonite(Na)montmorillonite(Ca)montmorillonite(K)montmorillonite(Mg)chalcedonycalcitegibbsitebruciteK-feldsparanalcimelaumontiteclinoptilolite(Na+K >Ca)
clinoptilolite(Na+K <Ca)
heulanditephillipsite(Na+K >>Ca)phillipsite(Na+K ≒Ca)sepiolitedolomiteSiO2(CSH)Ca(OH)2(CSH)C3ASH4gehlenite hyd.hydrogarnetC4AH13C4AH19ettringitemonodulfatemontmorillonite(total)
4-55
the interface. As a result, the chemical condition of the waste region lay between Region I and II for
100,000 years.
Na-type was dominantly montmorillonite for several ten thousand years since the concentration of
competitive Ca species in the pore water decreased by the consumption due to the precipitation of
secondary minerals such as Ca-rich zeolite in the buffer. In addition, this was attributed to that supply of Ca
from the cementitious region was limited by the filling of pores at the interface.
c. Effects on nuclide confinement
The results from b. show that after 100,000 years, about 80% of the montmorillonite is preserved in the
buffer over the two central cells divided into irregular sizes, which correspond to 68 cm thickness of the
100 cm buffer. Furthermore, a significant porosity increase in the buffer was calculated in the parts near to
the interface. However, the porosities in most other parts of the buffer were not changed, since the overall
amount of dissolution was small and the volume of the solid phase was compensated by the precipitation of
secondary minerals. This result means that the volume ratio of porosity to montmorillonite was kept so low
as the equivalent hydraulic conductivity of the buffer lay within the order of 10-12 [m s-1] for the long term.
Hence, it is indicated that the effective function of the buffer as a hydraulic barrier can be maintained after
100,000 years.
On the other hand, there is a concern for cementation. If precipitated secondary minerals bind the
particles of primary minerals of bentonite buffer, the buffer may be cemented by secondary minerals and
lose the plasticity and swelling property. The cementation has been considered as a critical process since it
may reduce or eliminate the key properties of bentonite buffer as mentioned above. Measurements of the
swelling capacity of artificially degraded bentonite which was prepared under highly alkaline and high
temperature conditions, have revealed that the swelling capacity is not lost in case where the proportion of
preserved montmorillonite is above 70% (Ichige and Honda, 2005).
From the analytical result, it seems that the precipitation of secondary minerals such as C-S-H gels does
not affect the capabilities of the whole buffer material since they precipitate locally near the interface. The
analysis shows that potassium feldspar and zeolites precipitated. However 80% of montmorillonite
preserved in most regions of the buffer even after 100,000 years, hence the swelling capacity of the buffer
is not expected to be lost according to the results of the previous experiments. Considering these results, the
possibility of cementation and its impact on the functions of the buffer was neglected in this report.
From the above evaluation, it is considered that the degree of alteration of the buffer will be so slight
after 100,000 years as to maintain the function as the hydraulic barrier. Therefore diffusion continuously
dominates the nuclide migration process within the engineered barrier for 100,000 years. It is shown that
alteration causes significant pore filling, which improves the barrier performance of nuclides confinement.
However, it should be noted that these results include uncertainties accompanied with several hypotheses.
4-56
4.4.2.3 Uncertainty in current knowledge and treatment of uncertainty in the nuclide migration analysis
Predictions of the effects of engineered barrier alteration on barrier performance as described in 4.4.2.2,
include uncertainty because there are several assumptions which have not yet been confirmed. In such
cases, based on the evaluation results, appropriate measures should be taken.
(1) Information about uncertainty
a. Dissolution rate law of montmorillonite
As described previously, it is considered that reliable data are available from current studies for the
dissolution rates of montmorillonite in far-from-equilibrium conditions with high liquid-solid ratios. A
decrease in the dissolution rate near to equilibrium has been observed at pH 8.8, and this result shows that
assumptions of both instantaneous equilibrium and TST type saturation dependency are too pessimistic for
evaluating the dissolution kinetics of montmorillonite. Under the current conditions, it is appropriate to use
a reproducible nonlinear experimental rate law. Furthermore, a model based on transition state theory and
an instantaneous equilibrium model were applied to the assessments as hypothetical model options in order
to bound the uncertainty.
b. Types of secondary minerals
There are large uncertainties in the type of secondary minerals that occur and their transitions over the
relevant time scales. Hence the probability of the mineral combinations existing in the scenarios described
in Section 4.4.2.2(3) cannot be evaluated. In Section 4.4.2.2, an analysis is performed assuming the
formation of metastable zeolite and stable phases (stable zeolite and K-feldspar). The analysis also assumed
the general co-existence of minerals such as C-S-H gels ((1) and (2) group in Figure 4.4.2.2-4). In contrast,
in this section, the following scenarios were supposed and the same kind of analyses as that in Section
4.4.2.2 were carried out:
・ Metastable zeolite and stable phases are formed at an extremely slow rate, and generally co-existent
minerals such as C-S-H gel and illite are formed relatively rapidly (Case 1 in Figure 4.4.2.2-4).
・ It is assumed that stable phases and illite are produced relatively rapidly and metastable zeolite does
not coexist or does exist for only a short time. In other words, the cases of stable phase formation
and those of the formation of both stable phases and illite in addition to general co-existent minerals
such as C-S-H gels (Case 3 and 5 in Figure 4.4.2.2-4) were assumed.
・ It is assumed that the formation of stable phases are extremely slow and that the existence of
metastable zeolites is sustained over a long term from the initial stage. The formation of general
co-existent minerals such as C-S-H gels were also assumed (Cases 2 and 4 in Figure 4.4.2.2-4).
Among previous cases, Cases 1, 3 and 5 (the cases for no formation of metastable zeolite) resulted in
insignificant quantities of montmorillonite being dissolved during a period of 100,000 years. The result
suggests that the bentonite was more stable in the cases for no formation of metastable zeolite than in those
4-57
for formation of metastable zeolite.
The spatial distributions of minerals after 100,000 years in the case where metastable zeolite is formed,
but stable zeolite and K-feldspar are not formed, is shown in Figure 4.4.2.3-1 (Case 4). The temporal
changes of pH for the same case are shown in Figure 4.4.2.3-2. In this case, significant quantities of
phillipsite and heulandite appeared, and the dissolusion of montmorillonite was promoted. The amount of
dissolution during 100,000 years was higher than the analytical result in 4.4.2.2. In this case, effective
impermeability will be maintained for 100,000 years because more than 70% of the montmorillonite
remained in 50cm of the bentonite (and more than 60% of montmorillonite remained in 70 cm) even after
100,000 years.
The calculated changes in chemical conditions show that the region of the waste could maintain the
states of Region I−Region II of cementitious material for 100,000 years and the condition of pH > 11 could
be maintained in the pore water of bentonite buffer from several 100 to 100,000 years. The change of ion
type in the montmorillonite was classified into 2 cases: cases (Cases 3 and 5) where Ca-type was formed
early (in the order of 10,000 years) since Ca-rich metastable zeolite was not produced; and cases (Cases 1,
2 and 4) where Na type was dominant for 100,000 years because of the consumption of Ca by the
formation of meta-stable zeolite (Cases 2 and 4) or no consumption of Na by the formation of zeolite
minerals (Case 1). The results suggest the kinds and quantities of secondary minerals may affect the
spatio-temporal variation of interlayer cation of montmorillonite. However, from the extent of the
evaluation of both in Section 4.4.2.2 and in this section, it can be stated that the effectively impermeable
characteristics of bentonite buffer will be maintained for 100,000 years even if Ca-type montmorillonite
forms at an early time.
As in the cases in Section 4.4.2.2, the pore space in the region near the interface between cementitious
material and the bentonite was almost filled by the precipitation of secondary mineral in all the assumed
cases, improving the performance of the engineered barrier for retaining nuclides.
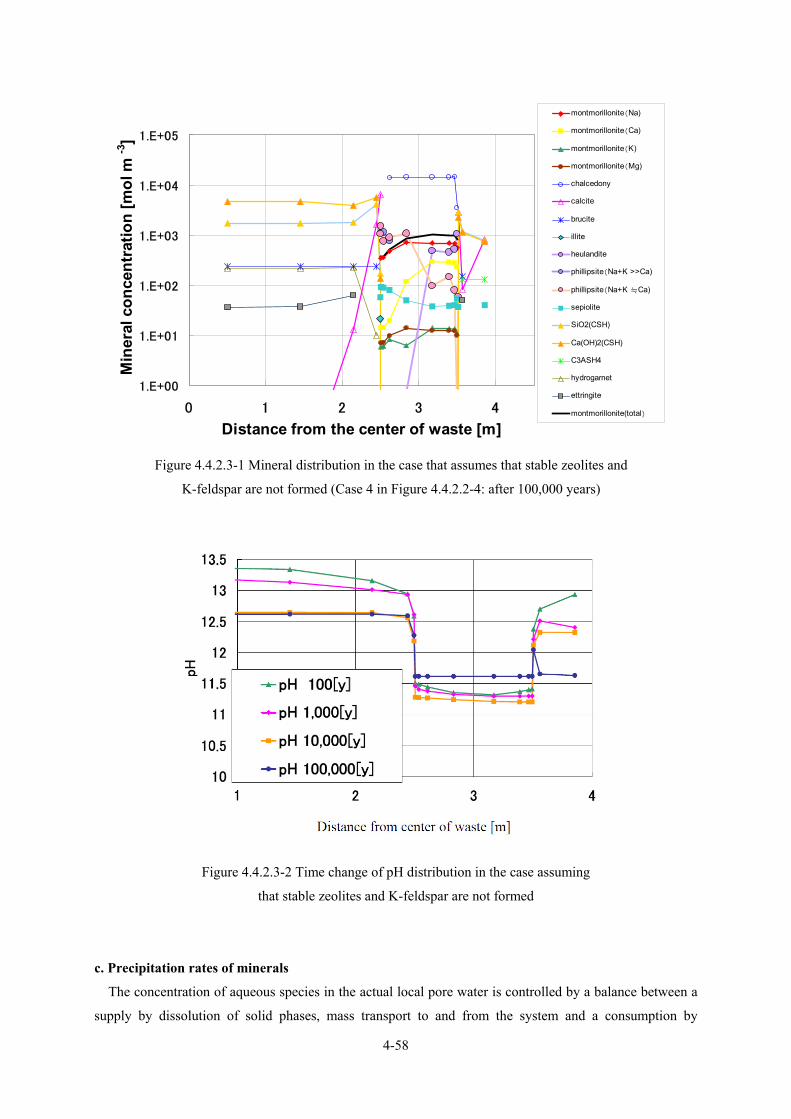
4-58
Figure 4.4.2.3-1 Mineral distribution in the case that assumes that stable zeolites and
K-feldspar are not formed (Case 4 in Figure 4.4.2.2-4: after 100,000 years)
Figure 4.4.2.3-2 Time change of pH distribution in the case assuming
that stable zeolites and K-feldspar are not formed
c. Precipitation rates of minerals
The concentration of aqueous species in the actual local pore water is controlled by a balance between a
supply by dissolution of solid phases, mass transport to and from the system and a consumption by
1.E+00
1.E+01
1.E+02
1.E+03
1.E+04
1.E+05
0 1 2 3 4
Distance from the center of waste [m]
Min
eral
con
cent
ratio
n [m
ol m
-3]
montmorillonite(Na)
montmorillonite(Ca)
montmorillonite(K)
montmorillonite(Mg)
chalcedony
calcite
brucite
illite
heulandite
phillipsite(Na+K >>Ca)
phillipsite(Na+K ≒Ca)
sepiolite
SiO2(CSH)
Ca(OH)2(CSH)
C3ASH4
hydrogarnet
ettringite
montmorillonite(total)
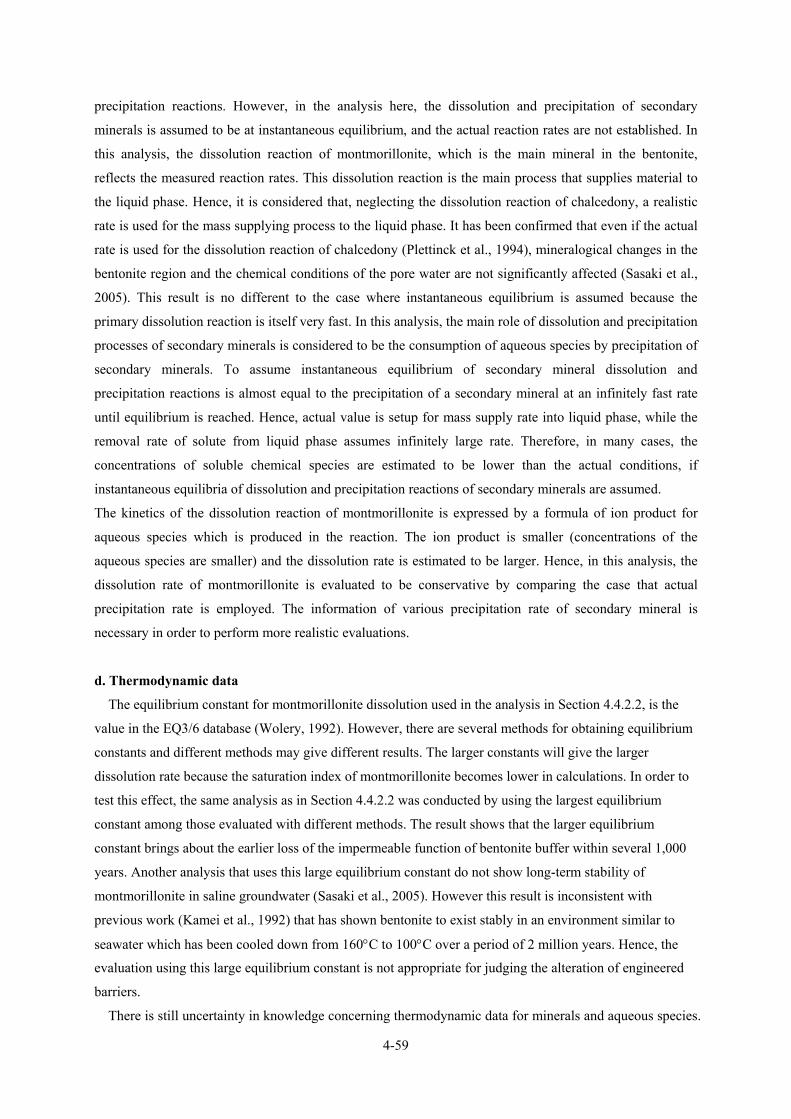
4-59
precipitation reactions. However, in the analysis here, the dissolution and precipitation of secondary
minerals is assumed to be at instantaneous equilibrium, and the actual reaction rates are not established. In
this analysis, the dissolution reaction of montmorillonite, which is the main mineral in the bentonite,
reflects the measured reaction rates. This dissolution reaction is the main process that supplies material to
the liquid phase. Hence, it is considered that, neglecting the dissolution reaction of chalcedony, a realistic
rate is used for the mass supplying process to the liquid phase. It has been confirmed that even if the actual
rate is used for the dissolution reaction of chalcedony (Plettinck et al., 1994), mineralogical changes in the
bentonite region and the chemical conditions of the pore water are not significantly affected (Sasaki et al.,
2005). This result is no different to the case where instantaneous equilibrium is assumed because the
primary dissolution reaction is itself very fast. In this analysis, the main role of dissolution and precipitation
processes of secondary minerals is considered to be the consumption of aqueous species by precipitation of
secondary minerals. To assume instantaneous equilibrium of secondary mineral dissolution and
precipitation reactions is almost equal to the precipitation of a secondary mineral at an infinitely fast rate
until equilibrium is reached. Hence, actual value is setup for mass supply rate into liquid phase, while the
removal rate of solute from liquid phase assumes infinitely large rate. Therefore, in many cases, the
concentrations of soluble chemical species are estimated to be lower than the actual conditions, if
instantaneous equilibria of dissolution and precipitation reactions of secondary minerals are assumed.
The kinetics of the dissolution reaction of montmorillonite is expressed by a formula of ion product for
aqueous species which is produced in the reaction. The ion product is smaller (concentrations of the
aqueous species are smaller) and the dissolution rate is estimated to be larger. Hence, in this analysis, the
dissolution rate of montmorillonite is evaluated to be conservative by comparing the case that actual
precipitation rate is employed. The information of various precipitation rate of secondary mineral is
necessary in order to perform more realistic evaluations.
d. Thermodynamic data
The equilibrium constant for montmorillonite dissolution used in the analysis in Section 4.4.2.2, is the
value in the EQ3/6 database (Wolery, 1992). However, there are several methods for obtaining equilibrium
constants and different methods may give different results. The larger constants will give the larger
dissolution rate because the saturation index of montmorillonite becomes lower in calculations. In order to
test this effect, the same analysis as in Section 4.4.2.2 was conducted by using the largest equilibrium
constant among those evaluated with different methods. The result shows that the larger equilibrium
constant brings about the earlier loss of the impermeable function of bentonite buffer within several 1,000
years. Another analysis that uses this large equilibrium constant do not show long-term stability of
montmorillonite in saline groundwater (Sasaki et al., 2005). However this result is inconsistent with
previous work (Kamei et al., 1992) that has shown bentonite to exist stably in an environment similar to
seawater which has been cooled down from 160°C to 100°C over a period of 2 million years. Hence, the
evaluation using this large equilibrium constant is not appropriate for judging the alteration of engineered
barriers.
There is still uncertainty in knowledge concerning thermodynamic data for minerals and aqueous species.

4-60
However, there is little necessity for using data that gives an excessively conservative evaluation of the
alteration of the engineered barrier.
e. Stability of pore filling secondary minerals
The analytical results of Sections 4.4.2.2 and 4.4.2.3(1)b, show that pore filling by secondary minerals
occurs on the mortar side of the interface. The porosity increases in a limited zone of the bentonite side
where the increase of porosity due to dissolution of initial minerals exceeds decrease of porosity due to the
precipitation of secondary minerals. These results suggest the possibility that the alteration phase is not
mechanically stable. In addition to this, if release of the gas generated in the waste region and water flow in
cracks which are formed by gas pressure etc. are also taken into account, it is considered that the
pore-fillings will be intermittent. Reactions between natural cement, groundwater and host rocks in
Maqarin, Jordan are considered to have resulted in repeated closure and opening of fractures (Alexander
and Smellie, 1998). Hence, filling of pores by secondary minerals does not always limit mass transport.
Intermittent solute and nuclide migration can occur because of repeated partial destruction and re-clogging
of defect formed by the destruction. For bounding the uncertainty arising from the consequence of the
partial destruction and re-clogging of the engineered barrier, an analysis is carried out assuming that the
effective diffusion coefficient does not decrease with a decrease in porosity. The results are shown in
Figure 4.4.2.3-3 (the specification of secondary minerals is the same as Case 6).
In the analysis in Section 4.4.2.2, the OH-, Na+ and K+ ions were effectively confined in the cementitious
material by pore-filling over the long term. In contrast, OH- easily migrated into bentonite buffer in this
analysis and therefore the amount of dissolved montmorillonite was greater than that in Section 4.4.2.2.
Ca-type was dominant montmorillonite in a wider region of buffer in this analysis than in Section 4.4.2.2,
since competitive Na and K had migrated to the outside of the system and after which Ca was supplied
continuously by cement minerals.
In this case, 70% of the montmorillonite remained in the 70 cm of bentonite buffer after 100,000 years.
There is considered to be a negligible increase in permeability, even though Ca-type montmorilloinite
forms and the gel density of montmorillonite decreases (weight of montmorillonite in unit volume of buffer
per sum of volumes of bentonite and pore in unit volume of buffer). It is also considered that the buffer
does not lose its swelling capability as a result of cementation as mentioned in 4.4.2.2(5)c. Hence the
effectively impermeable characteristics of the bentonite will be little affected, and it is considered that they
will be maintained for 100,000 years. The pH change in the engineered barrier progressed more rapidly
than in the analytical case that considered pore filling. In the absence of pore filling, it was estimated that in
the waste, the duration of Region I is approximately several 1,000 years, while the duration of Region II is
approximately several 10,000 years (after 100,000 years Region III is distributed around 20 cm from the
outer edge of the waste region). In the bentonite region, pH of more than 11 was maintained until several
10,000 years and the pH decreased below 11 after 100,000 years.

4-61
Figure 4.4.2.3-3 Mineral distribution in the case that assumes that the porosity does not change
(after 100,000 years)
f. Uncertainty concerning the exterior boundary condition
In the analysis in Section 4.4.2.2, the exterior boundary condition is fixed at the composition of FRHP.
As described in Section 4.4.2.2(4)a, the same analysis is performed with a zero flux boundary, so as to
evaluate uncertainty included in the boundary condition. It is revealed that there is no significant difference
between the two cases except the maintenance of the Region I-II for 100,000 years in the region of the
support in the case of zero flux boundary. In the case that the phenomenon of pore filling occurs at the
boundary of cementitious material and bentonite buffer, it is estimated that the effects of the exterior
boundary condition on chemical and mineralogical transitions in both waste and bentonite buffer regions
are small for 100,000 years.
g. Mechanical effects
This section describes analyses of coupled mass transport-chemical reactions by using a one dimensional
model which does not perform coupling with mechanics. Mechanical effects are evaluated in Section
3.3.2.2, and use the evaluation of host rock creep obtained below.
A mechanical analysis is carried out using a two-dimensional model assuming the highly evolved
condition of an engineered barrier. The creep of host rock is estimated to be several cm. However, even if
the displacement of host rock is tentatively assumed to be 15cm, the deformation of the bentonite is
estimated to be less than 10cm. The compression of the disposal facility by host rock creep and the
1.E-01
1.E+00
1.E+01
1.E+02
1.E+03
1.E+04
1.E+05
0 1 2 3 4
Distance from the center of waste[m]
Min
eral
con
cent
ratio
n [m
ol m
-3]
montmorillonite(Na)montmorillonite(Ca)montmorillonite(K)montmorillonite(Mg)chalcedonycalcitegibbsitebruciteK-feldsparanalcimelaumontiteclinoptilolite(Na+K >Ca)
clinoptilolite(Na+K <Ca)
heulanditephillipsite(Na+K >>Ca)phillipsite(Na+K ≒Ca)sepiolitedolomiteSiO2(CSH)Ca(OH)2(CSH)C3ASH4gehlenite hyd.hydrogarnetC4AH13C4AH19ettringitemonodulfatemontmorillonite(total)
4-62
deformation are considered to be relatively small. Therefore, the effects on the porosity of the bentonite
buffer and the partial density of montmorillonite can be neglected.
If spatial heterogeneity of smectite gel density due to smectite dissolution occurs, redistribution of
smectite gel density by displacement is considered to occur for achieving stress balance because swelling
pressure of buffer is a function of smectite gel density. Okutsu et al., (2005) assessed the mechanical
impacts of the partial drop of smectite gel density due to the dissolution of the smectite.
The assessment shows the displacement and redistribution is not significant because of deformation
resistance of buffer material. However there is no experimental evidence.
Both “redistribution neglecting case” and “case of perfect homogenization of smectite gel density” were
employed for bounding the uncertainty arising from the redistribution of smectite gel density. The analyses
show there is no significant difference in terms of permeability between previous cases for 105 years.
However, if the area of altered bentonite expands more, the permeability for “case of perfect
homogenization” can show the significantly higher value than that for “redistribution neglecting case.”
(2) Treatment of nuclide migration
The long-term evolution of chemical environment of a disposal facility without bentonite is evaluated in
Section 4.4.2.2(2). In this part, the conditions for a radionuclide migration analysis in the facilities with
bentonite is determined by reflecting the previous evaluations on the evolution of engineered barrier due to
the interaction between cementitious materials and bentonite. The evaluated plausible extent of the
behaviuor of the cement-bentonite system and their associated uncertainty were taken into account for the
determination.
① Plausible case on the basis of available information (Realistic case); There is sufficient
montmorillonite remaining in the 70cm central part of the bentonite, the effectively impermeable
characteristics of the bentonite are expected to be maintained for at least 100,000 years. Moreover,
because the precipitation of pore-filling secondary minerals occurs near the interface between
cementitious material and bentonite, nuclide migration is significantly prevented in this area. From
these results, it is considered that the alteration of the engineered barrier has a positive effect on the
radionuclide retention function. However, it is necessary to note that there may be effects from
fractures formed by external factors and inhomogeneous reactions.
② Conservative case; It is assumed that the pore filling effect of the secondary minerals in the
interfacial altered layer will not restrict diffusion because of mechanical instability of altered zone.
This means that the initial effective diffusion coefficients of the cementitious material and bentonite
will be constant in future. In this case, the effectively impermeable characteristics of the bentonite will
be guaranteed for at least 100,000 years since sufficient montmorillonite remains.
③ Hypothetical case; The following conditions are considered to have low probabilities:

4-63
montmorillonite dissolution is promoted by constantly unsaturated conditions because the equilibrium
constant for montmorillonite solubility is larger than that present in the standard database; the
dissolution of montmorillonite is promoted since the dissolution rate law for montmorillonite under
highly alkaline conditions follows the instantaneous equilibrium model. In these hypothetical cases,
the effective impermeability of the bentonite will be lost after several 1,000 years.
4.4.2.4 Summary There are various uncertainties concerning alteration of the engineered barrier resulting from interactions
between cementitious material and bentonite. However, based on present knowledge, the alteration will
possibly improve the nuclide retention function, while not adversely affecting the long-term performance of
the geological repository for TRU waste. One conservative assumption from the nuclide migration analysis
is that the bentonite prevents significant advective water flow for at least 100,000 years. Under these
circumstances, in accordance with the initial effective diffusion coefficient in the bentonite and cement
material, it is adequate for nuclide migration analyses that nuclide release from the engineered barrier is
assumed to continue for the period. There are various uncertainties in current knowledge concerning the
alteration process of the engineered barrier system because the process is non-linear coupled system
consists of various elementary processes. Evaluations of hypothetical cases, such as where the buffer loses
its capability to prevent significant water flow after several 1,000 years, help to respond to these
uncertainties.
4.4.2.5 Future issues In order to reduce the uncertainty inherent in the present evaluation and to improve its reliability, it is
important to address the following issues:
Increase in knowledge on thermodynamic data and reaction rates, and incorporating this knowledge
in the evaluation.
Increase knowledge on the changes in barrier characteristics that may occur during alteration,
including alteration of cement material and bentonite, taking into account the variety of chemical
environments and barrier specifications.
The details of the former task are;
・ Improve understanding of mineral dissolution and precipitation rates, including experimental
verification of the reaction rate laws for montmorillonite dissolution under near-equilibrium
conditions, and reflecting this knowledge in the evaluation.
・ Improvement of the reliability of thermodynamic data for aqueous chemical species, primary
minerals composing the engineered barrier and secondary minerals under hyperalkaline conditions.
・ Increase knowledge on solution chemistry in small pores, such as those within the engineered barrier,
in which pore water is strongly influenced by the solid surface, and reflecting this knowledge in the
evaluation.
4-64
Detailed issues of the latter task are;
・ Improved understanding of the influence of groundwater chemistry and specification of engineered
barrier system (materials and construction conditions) on interactions between groundwater and
engineered barriers.
・ Variations in the hydraulic and mechanical characteristics of the components of the engineered
barrier caused by alteration (e.g. cementation of bentonite, fracturing of cement material and filling
of fractures by mineral precipitation).
4.4.3 Hyperalkaline alteration of host rock around the disposal facility As described in Section 4.4.2, the pH of pore water in a disposal facility that incorporates cement reaches
12 to 13. Additionally, the Ca concentration becomes high as a result of the dissolution of hydrates that
comprise the cement. The concentrations of Na and K are also high initially, owing to cement alteration.
This pore water will move into the surrounding host rock and will change the groundwater composition,
resulting in a region within the host rock that contains high-pH groundwater or a high pH plume. Chemical
reactions between the surrounding rock and this high-pH plume include the dissolution of primary minerals
and the precipitation of secondary minerals. It is reported that this alteration may affect nuclide migration,
since the dissolution and alteration of the surrounding basement rock might change the groundwater
composition, the chemical environment, the capacity to sorb radionuclides and the pore structure (Rochelle
et al., 1992; Savage et al., 1992; Adler et al., 1999).
As a contribution to the analysis of radionuclide migration, this section promotes an understanding of the
alteration of the surrounding rocks by a high-pH plume flowing from the disposal facility.
4.4.3.1 Types of surrounding host rock The evaluation in this report is aimed to be applicable for a wide range of geological environments
ranging from crystalline to sedimentary rocks (see Table 1 in the Executive Summary). Information about
mineral and chemical compositions is required for these rocks. However, each of the rock types can show a
range of mineral compositions. Therefore, the evaluation was carried out by assuming the rocks to contain
mineral proportions that refer to those appearing in the classification diagram for igneous rocks (The
Association for the Geological Collaboration in Japan, 1996) of the International Union of Geological
Sciences (IUGS). Additionally, the concentrations of the main chemical constituents of the rocks are given
for standard rock materials by the Geological Survey of Japan (The Association for the Geological
Collaboration in Japan, 1996).
4.4.3.2 Knowledge of the chemical alteration of surrounding host rocks by a high-pH plume
The experimental investigation of hyperalkaline alteration of the surrounding rock has been carried out
mainly for silica and silicate minerals, etc. (Savage et al., 1998ab). Leaching experiments using Ca(OH)2
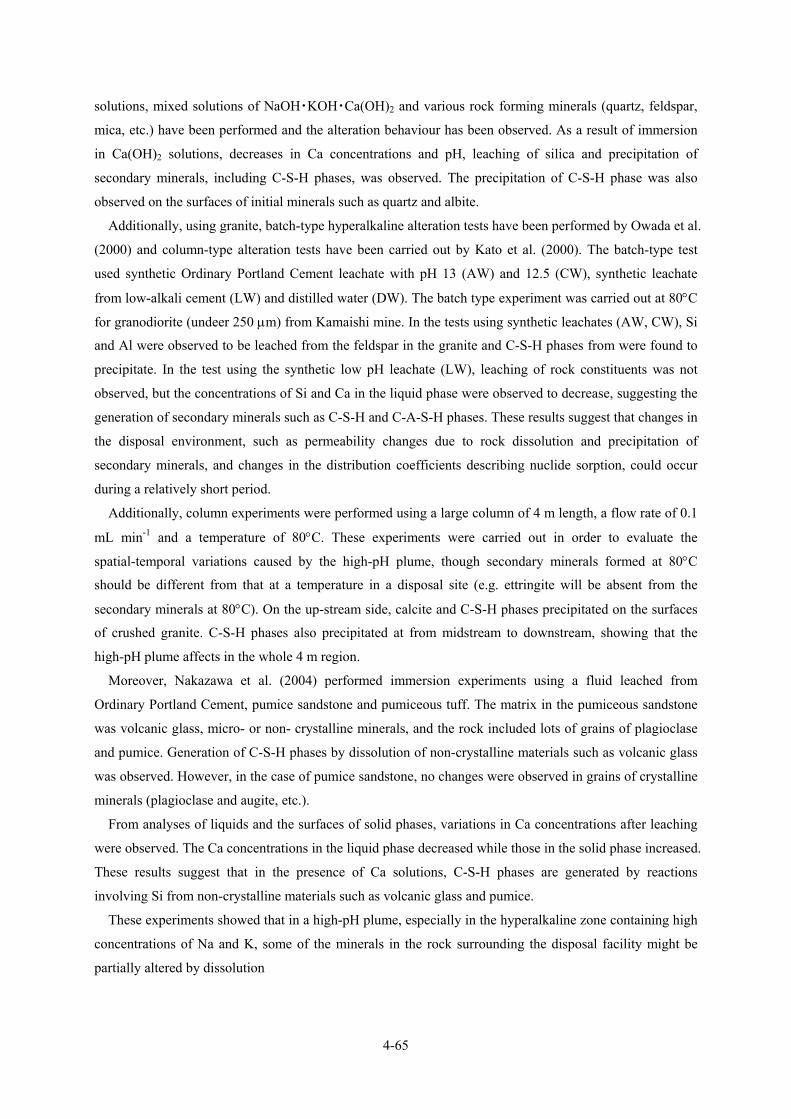
4-65
solutions, mixed solutions of NaOH・KOH・Ca(OH)2 and various rock forming minerals (quartz, feldspar,
mica, etc.) have been performed and the alteration behaviour has been observed. As a result of immersion
in Ca(OH)2 solutions, decreases in Ca concentrations and pH, leaching of silica and precipitation of
secondary minerals, including C-S-H phases, was observed. The precipitation of C-S-H phase was also
observed on the surfaces of initial minerals such as quartz and albite.
Additionally, using granite, batch-type hyperalkaline alteration tests have been performed by Owada et al.
(2000) and column-type alteration tests have been carried out by Kato et al. (2000). The batch-type test
used synthetic Ordinary Portland Cement leachate with pH 13 (AW) and 12.5 (CW), synthetic leachate
from low-alkali cement (LW) and distilled water (DW). The batch type experiment was carried out at 80°C
for granodiorite (undeer 250 µm) from Kamaishi mine. In the tests using synthetic leachates (AW, CW), Si
and Al were observed to be leached from the feldspar in the granite and C-S-H phases from were found to
precipitate. In the test using the synthetic low pH leachate (LW), leaching of rock constituents was not
observed, but the concentrations of Si and Ca in the liquid phase were observed to decrease, suggesting the
generation of secondary minerals such as C-S-H and C-A-S-H phases. These results suggest that changes in
the disposal environment, such as permeability changes due to rock dissolution and precipitation of
secondary minerals, and changes in the distribution coefficients describing nuclide sorption, could occur
during a relatively short period.
Additionally, column experiments were performed using a large column of 4 m length, a flow rate of 0.1
mL min-1 and a temperature of 80°C. These experiments were carried out in order to evaluate the
spatial-temporal variations caused by the high-pH plume, though secondary minerals formed at 80°C
should be different from that at a temperature in a disposal site (e.g. ettringite will be absent from the
secondary minerals at 80°C). On the up-stream side, calcite and C-S-H phases precipitated on the surfaces
of crushed granite. C-S-H phases also precipitated at from midstream to downstream, showing that the
high-pH plume affects in the whole 4 m region.
Moreover, Nakazawa et al. (2004) performed immersion experiments using a fluid leached from
Ordinary Portland Cement, pumice sandstone and pumiceous tuff. The matrix in the pumiceous sandstone
was volcanic glass, micro- or non- crystalline minerals, and the rock included lots of grains of plagioclase
and pumice. Generation of C-S-H phases by dissolution of non-crystalline materials such as volcanic glass
was observed. However, in the case of pumice sandstone, no changes were observed in grains of crystalline
minerals (plagioclase and augite, etc.).
From analyses of liquids and the surfaces of solid phases, variations in Ca concentrations after leaching
were observed. The Ca concentrations in the liquid phase decreased while those in the solid phase increased.
These results suggest that in the presence of Ca solutions, C-S-H phases are generated by reactions
involving Si from non-crystalline materials such as volcanic glass and pumice.
These experiments showed that in a high-pH plume, especially in the hyperalkaline zone containing high
concentrations of Na and K, some of the minerals in the rock surrounding the disposal facility might be
partially altered by dissolution

4-66
4.4.3.3 Impact analysis for hyperalkaline alteration of rocks surrounding a facility
As described previously, alkali components that are transported from cement in a disposal facility might
cause the following effects by reactions with the natural barrier surrounding the disposal facility.
A change in the pore structure might occur as a result of mineral dissolution of mineral within the host
rock and the generation of secondary minerals. Consequently the coefficient of hydraulic conductivity and
the diffusion coefficient may be affected. Moreover, changes in groundwater composition and the
mineralogical composition of host rocks may affect the sorption coefficient of nuclides. Variations in
groundwater compositions may affect the solubility of nuclides.
In this report, it is difficult to specify specific mineral compositions since it is aimed to consider general
geological conditions. Hence, to evaluate the influence of alkalis, specifications for the nuclide migration
analysis were based on the above investigation results and past experimental results. Minerals that are
highly reactive with alkalis were selected.
(1) Analytical conditions
In this evaluation, disposal tunnels for waste group 4, without bentonite components, were evaluated. A
disposal tunnel with a circular cross-section of 12 m diameter (Figure 4.2.4-1) was evaluated using a one
dimensional model. In this evaluation it was considered that the hyperalkaline plume broadens downstream
from the disposal tunnel. Therefore, the simulation extended from the host rock 30 m upstream of the
repository to 200 m downstream of the disposal facility. The composition and groundwater head at the
upstream and downstream boundaries were considered to be constant. The modelled region is shown in
Figure 4.4.3-1.
In this evaluation, the host rock is assumed to composed of silica minerals that may easily react with the
hyperalkaline leachate. Several types of silica mineral were considered, such as amorphous silica and the
crystalline minerals quartz, cristobalite and chalcedony. However, from these minerals, the relatively
crystalline mineral chalcedony was selected for the analysis, since this mineral is considered to occur in the
fresh groundwater system and to exist in bentonite. Additionally, amorphous silica and clay minerals were
also considered to be fracture-filling minerals that may undergo reactions with the leachate. Chalcedony
was assumed to comprise 10 wt% of the host rock. In contrast, the amount of fracture-filling amorphous
silica was considered to be trivial and was set to 0.1 wt%. However, since tuff contains large quantities of
amorphous materials such as volcanic glass, a case was implemented in which the amount of amorphous
silica was increased from 0.01 wt% to 10 wt%. The quantity of clay minerals was assumed to be 0.1 wt%,
and the evaluation was performed using data for montmorillonite. The minerals considered in each barrier
are summarized in Table 4.4.3-2. Here, it is considered that the reactivity of minerals other than those that
react with alkalis is extremely low. Since the dissolution of crystalline minerals in the host rock is slow and
when the flow velocity of groundwater is fast, equilibrium will not be achieved and it was considered that
the quantity dissolved would be controlled by the dissolution rate. Hence, the dissolution rate was
considered in the case of chalcedony. On the other hand, since amorphous silica has a high reactivity, it was
treated as being at instantaneous equilibrium. Similarly, the model regarded montmorillonite dissolution to
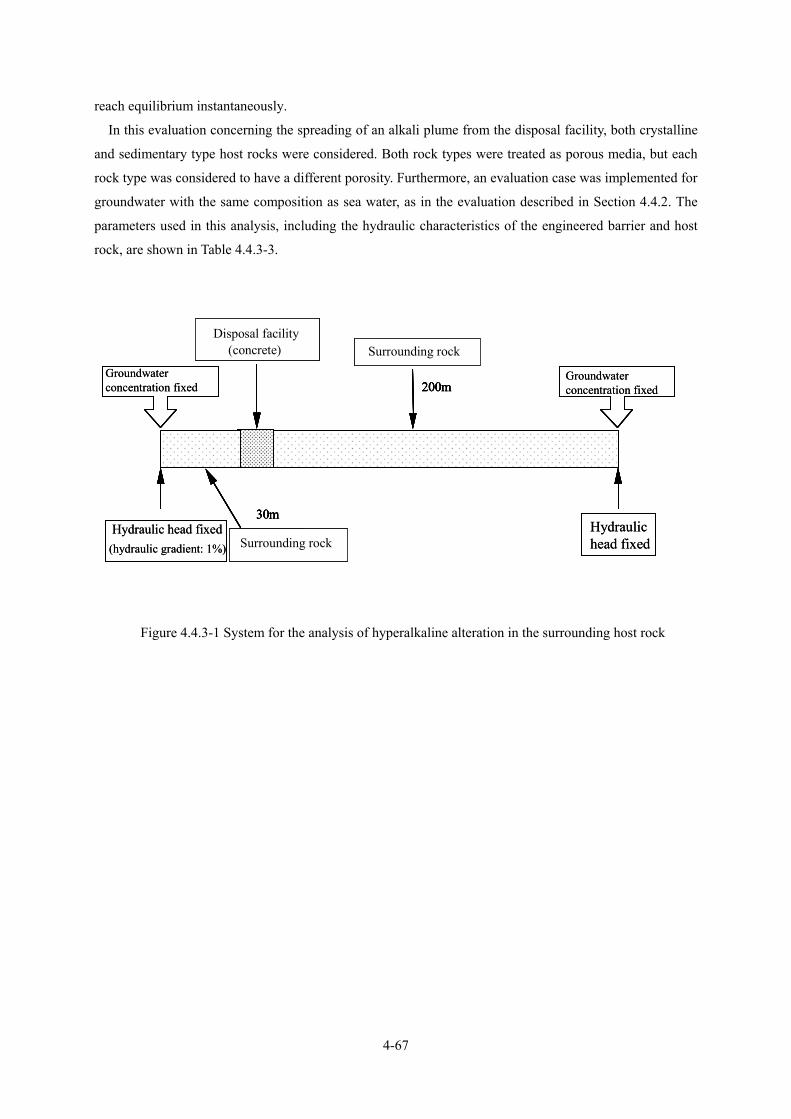
4-67
reach equilibrium instantaneously.
In this evaluation concerning the spreading of an alkali plume from the disposal facility, both crystalline
and sedimentary type host rocks were considered. Both rock types were treated as porous media, but each
rock type was considered to have a different porosity. Furthermore, an evaluation case was implemented for
groundwater with the same composition as sea water, as in the evaluation described in Section 4.4.2. The
parameters used in this analysis, including the hydraulic characteristics of the engineered barrier and host
rock, are shown in Table 4.4.3-3.
処分施設(コンクリート)
30m
200m
周辺岩盤
周辺岩盤
Disposal facility(concrete)
30m
200 m
Surrounding rock
Surrounding rock
Hydraulic head fixed(hydraulic gradient: 1%)
Hydraulic head fixed
Groundwaterconcentration fixed
Groundwaterconcentration fixed
処分施設(コンクリート)
30m
200m
周辺岩盤
周辺岩盤
Disposal facility(concrete)
30m
200 m
Surrounding rock
Surrounding rock
Hydraulic head fixed(hydraulic gradient: 1%)
Hydraulic head fixed
Groundwaterconcentration fixed
Groundwaterconcentration fixed
Figure 4.4.3-1 System for the analysis of hyperalkaline alteration in the surrounding host rock
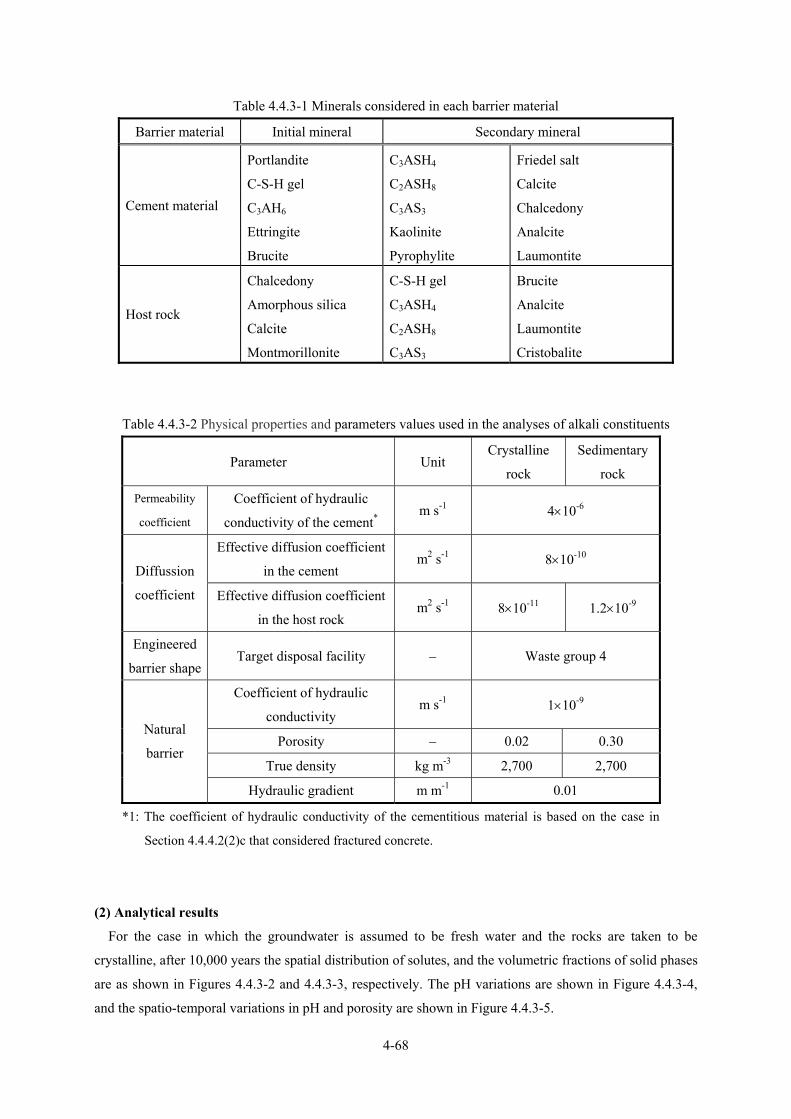
4-68
Table 4.4.3-1 Minerals considered in each barrier material
Barrier material Initial mineral Secondary mineral
Cement material
Portlandite
C-S-H gel
C3AH6
Ettringite
Brucite
C3ASH4
C2ASH8
C3AS3
Kaolinite
Pyrophylite
Friedel salt
Calcite
Chalcedony
Analcite
Laumontite
Host rock
Chalcedony
Amorphous silica
Calcite
Montmorillonite
C-S-H gel
C3ASH4
C2ASH8
C3AS3
Brucite
Analcite
Laumontite
Cristobalite
Table 4.4.3-2 Physical properties and parameters values used in the analyses of alkali constituents
Parameter Unit Crystalline
rock
Sedimentary
rock
Permeability
coefficient
Coefficient of hydraulic
conductivity of the cement* m s-1 4×10⁻⁶
Effective diffusion coefficient
in the cement m2 s-1 8×10⁻¹⁰
Diffussion
coefficient Effective diffusion coefficient
in the host rock m2 s-1 8×10-11 1.2×10⁻⁹
Engineered
barrier shape Target disposal facility − Waste group 4
Coefficient of hydraulic
conductivity m s-1 1×10⁻⁹
Porosity − 0.02 0.30
True density kg m-3 2,700 2,700
Natural
barrier
Hydraulic gradient m m-1 0.01
*1: The coefficient of hydraulic conductivity of the cementitious material is based on the case in
Section 4.4.4.2(2)c that considered fractured concrete.
(2) Analytical results
For the case in which the groundwater is assumed to be fresh water and the rocks are taken to be
crystalline, after 10,000 years the spatial distribution of solutes, and the volumetric fractions of solid phases
are as shown in Figures 4.4.3-2 and 4.4.3-3, respectively. The pH variations are shown in Figure 4.4.3-4,
and the spatio-temporal variations in pH and porosity are shown in Figure 4.4.3-5.
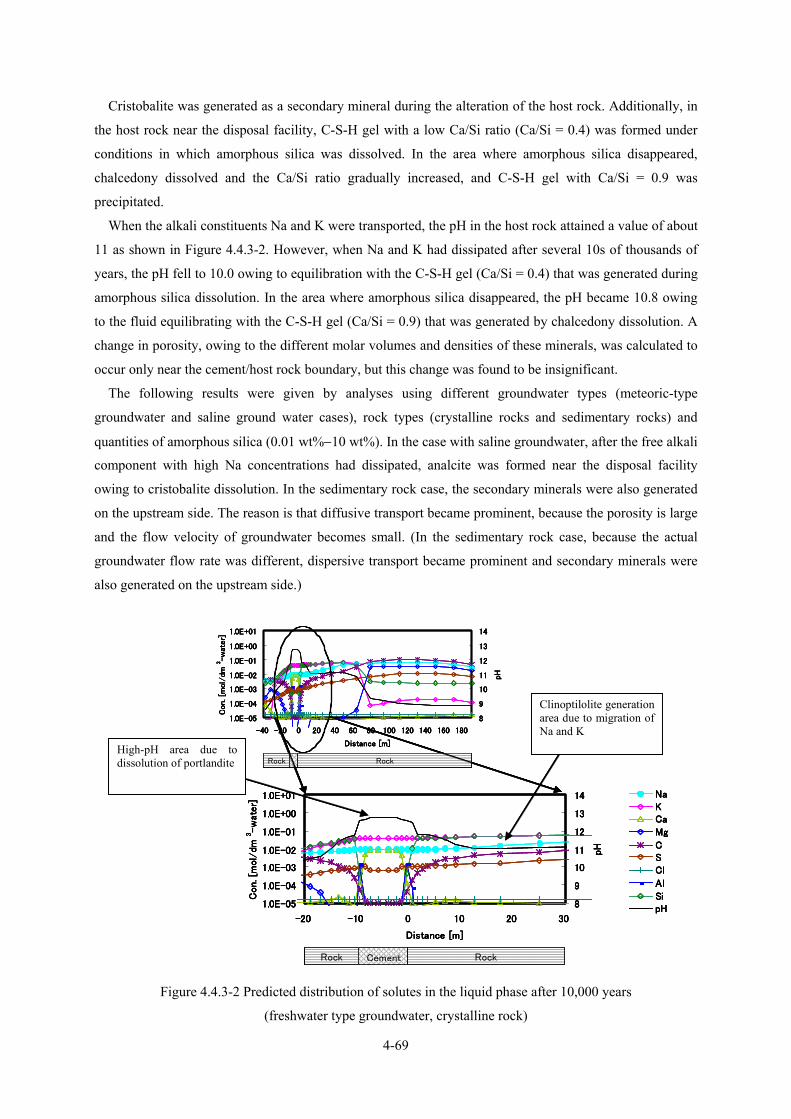
4-69
Cristobalite was generated as a secondary mineral during the alteration of the host rock. Additionally, in
the host rock near the disposal facility, C-S-H gel with a low Ca/Si ratio (Ca/Si = 0.4) was formed under
conditions in which amorphous silica was dissolved. In the area where amorphous silica disappeared,
chalcedony dissolved and the Ca/Si ratio gradually increased, and C-S-H gel with Ca/Si = 0.9 was
precipitated.
When the alkali constituents Na and K were transported, the pH in the host rock attained a value of about
11 as shown in Figure 4.4.3-2. However, when Na and K had dissipated after several 10s of thousands of
years, the pH fell to 10.0 owing to equilibration with the C-S-H gel (Ca/Si = 0.4) that was generated during
amorphous silica dissolution. In the area where amorphous silica disappeared, the pH became 10.8 owing
to the fluid equilibrating with the C-S-H gel (Ca/Si = 0.9) that was generated by chalcedony dissolution. A
change in porosity, owing to the different molar volumes and densities of these minerals, was calculated to
occur only near the cement/host rock boundary, but this change was found to be insignificant.
The following results were given by analyses using different groundwater types (meteoric-type
groundwater and saline ground water cases), rock types (crystalline rocks and sedimentary rocks) and
quantities of amorphous silica (0.01 wt%−10 wt%). In the case with saline groundwater, after the free alkali
component with high Na concentrations had dissipated, analcite was formed near the disposal facility
owing to cristobalite dissolution. In the sedimentary rock case, the secondary minerals were also generated
on the upstream side. The reason is that diffusive transport became prominent, because the porosity is large
and the flow velocity of groundwater becomes small. (In the sedimentary rock case, because the actual
groundwater flow rate was different, dispersive transport became prominent and secondary minerals were
also generated on the upstream side.)
1.0E-05
1.0E-04
1.0E-03
1.0E-02
1.0E-01
1.0E+00
1.0E+01
-40 -20 0 20 40 60 80 100 120 140 160 180
Distance [m]
Con.
[m
ol/dm
3-w
ater]
8
9
10
11
12
13
14
pH
Rock Rock
1.0E-05
1.0E-04
1.0E-03
1.0E-02
1.0E-01
1.0E+00
1.0E+01
-20 -10 0 10 20 30
Distance [m]
Con. [
mol/
dm3-w
ate
r]
8
9
10
11
12
13
14
pH
NaKCaMg
CSCl
AlSipH
Rock RockCement
1.0E-05
1.0E-04
1.0E-03
1.0E-02
1.0E-01
1.0E+00
1.0E+01
-40 -20 0 20 40 60 80 100 120 140 160 180
Distance [m]
Con.
[m
ol/dm
3-w
ater]
8
9
10
11
12
13
14
pH
Rock Rock
1.0E-05
1.0E-04
1.0E-03
1.0E-02
1.0E-01
1.0E+00
1.0E+01
-20 -10 0 10 20 30
Distance [m]
Con. [
mol/
dm3-w
ate
r]
8
9
10
11
12
13
14
pH
NaKCaMg
CSCl
AlSipH
Rock RockCement
Clinoptilolite generation area due to migration of Na and K
High-pH area due to dissolution of portlandite
1.0E-05
1.0E-04
1.0E-03
1.0E-02
1.0E-01
1.0E+00
1.0E+01
-40 -20 0 20 40 60 80 100 120 140 160 180
Distance [m]
Con.
[m
ol/dm
3-w
ater]
8
9
10
11
12
13
14
pH
Rock Rock
1.0E-05
1.0E-04
1.0E-03
1.0E-02
1.0E-01
1.0E+00
1.0E+01
-20 -10 0 10 20 30
Distance [m]
Con. [
mol/
dm3-w
ate
r]
8
9
10
11
12
13
14
pH
NaKCaMg
CSCl
AlSipH
Rock RockCement
1.0E-05
1.0E-04
1.0E-03
1.0E-02
1.0E-01
1.0E+00
1.0E+01
-40 -20 0 20 40 60 80 100 120 140 160 180
Distance [m]
Con.
[m
ol/dm
3-w
ater]
8
9
10
11
12
13
14
pH
Rock Rock
1.0E-05
1.0E-04
1.0E-03
1.0E-02
1.0E-01
1.0E+00
1.0E+01
-20 -10 0 10 20 30
Distance [m]
Con. [
mol/
dm3-w
ate
r]
8
9
10
11
12
13
14
pH
NaKCaMg
CSCl
AlSipH
Rock RockCement
Clinoptilolite generation area due to migration of Na and K
High-pH area due to dissolution of portlandite
Figure 4.4.3-2 Predicted distribution of solutes in the liquid phase after 10,000 years
(freshwater type groundwater, crystalline rock)
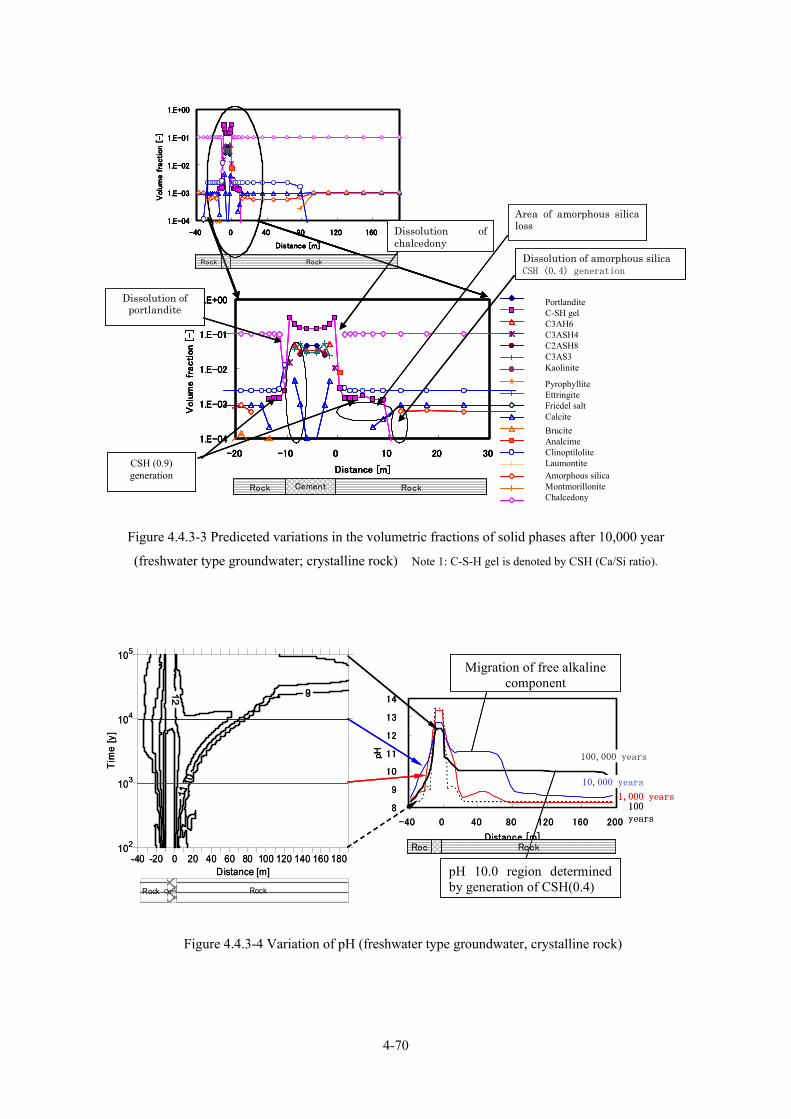
4-70
1.E-04
1.E-03
1.E-02
1.E-01
1.E+00
-40 0 40 80 120 160
Distance [m]
Volu
me f
raction [
-]
Rock Rock
1.E-04
1.E-03
1.E-02
1.E-01
1.E+00
-20 -10 0 10 20 30
Distance [m]
Volu
me f
raction [
-]
ポルトランダイト
C-S-Hゲル
C3AH6
C3ASH4
C2ASH8
C3AS3
カオリナイト
パイロフィライト
エトリンガイト
フリーデル氏塩
カルサイト
ブルーサイト
アナルサイム
クリノタイロライト
ローモンタイト
非晶質シリカ
モンモリロナイト
カルセドニ
Rock RockCement
1.E-04
1.E-03
1.E-02
1.E-01
1.E+00
-40 0 40 80 120 160
Distance [m]
Volu
me f
raction [
-]
Rock Rock
1.E-04
1.E-03
1.E-02
1.E-01
1.E+00
-20 -10 0 10 20 30
Distance [m]
Volu
me f
raction [
-]
ポルトランダイト
C-S-Hゲル
C3AH6
C3ASH4
C2ASH8
C3AS3
カオリナイト
パイロフィライト
エトリンガイト
フリーデル氏塩
カルサイト
ブルーサイト
アナルサイム
クリノタイロライト
ローモンタイト
非晶質シリカ
モンモリロナイト
カルセドニ
Rock RockCement
Dissolution of chalcedony
Dissolution of portlandite
CSH (0.9) generation
Dissolution of amorphous silicaCSH (0.4) generation
Area of amorphous silica loss
PortlanditeC-SH gelC3AH6C3ASH4C2ASH8C3AS3
Amorphous silicaMontmorilloniteChalcedony
BruciteAnalcimeClinoptiloliteLaumontite
PyrophylliteEttringiteFriedel saltCalcite
Kaolinite
1.E-04
1.E-03
1.E-02
1.E-01
1.E+00
-40 0 40 80 120 160
Distance [m]
Volu
me f
raction [
-]
Rock Rock
1.E-04
1.E-03
1.E-02
1.E-01
1.E+00
-20 -10 0 10 20 30
Distance [m]
Volu
me f
raction [
-]
ポルトランダイト
C-S-Hゲル
C3AH6
C3ASH4
C2ASH8
C3AS3
カオリナイト
パイロフィライト
エトリンガイト
フリーデル氏塩
カルサイト
ブルーサイト
アナルサイム
クリノタイロライト
ローモンタイト
非晶質シリカ
モンモリロナイト
カルセドニ
Rock RockCement
1.E-04
1.E-03
1.E-02
1.E-01
1.E+00
-40 0 40 80 120 160
Distance [m]
Volu
me f
raction [
-]
Rock Rock
1.E-04
1.E-03
1.E-02
1.E-01
1.E+00
-20 -10 0 10 20 30
Distance [m]
Volu
me f
raction [
-]
ポルトランダイト
C-S-Hゲル
C3AH6
C3ASH4
C2ASH8
C3AS3
カオリナイト
パイロフィライト
エトリンガイト
フリーデル氏塩
カルサイト
ブルーサイト
アナルサイム
クリノタイロライト
ローモンタイト
非晶質シリカ
モンモリロナイト
カルセドニ
Rock RockCement
Dissolution of chalcedony
Dissolution of portlandite
CSH (0.9) generation
Dissolution of amorphous silicaCSH (0.4) generation
Area of amorphous silica loss
PortlanditeC-SH gelC3AH6C3ASH4C2ASH8C3AS3
Amorphous silicaMontmorilloniteChalcedony
BruciteAnalcimeClinoptiloliteLaumontite
PyrophylliteEttringiteFriedel saltCalcite
Kaolinite
Figure 4.4.3-3 Prediceted variations in the volumetric fractions of solid phases after 10,000 year
(freshwater type groundwater; crystalline rock) Note 1: C-S-H gel is denoted by CSH (Ca/Si ratio).
8
9
10
11
12
13
14
-40 0 40 80 120 160 200
Distance [m]
pH
Roc Rock
Migration of free alkaline component
pH 10.0 region determined by generation of CSH(0.4)
100,000 years
10,000 years
1,000 years100 years
-40 -20 0 20 40 60 80 100 120 140 160 180Distance [m]
102
103
104
105
Tim
e [y
]
Rock Cement Rock
Figure 4.4.3-4 Variation of pH (freshwater type groundwater, crystalline rock)
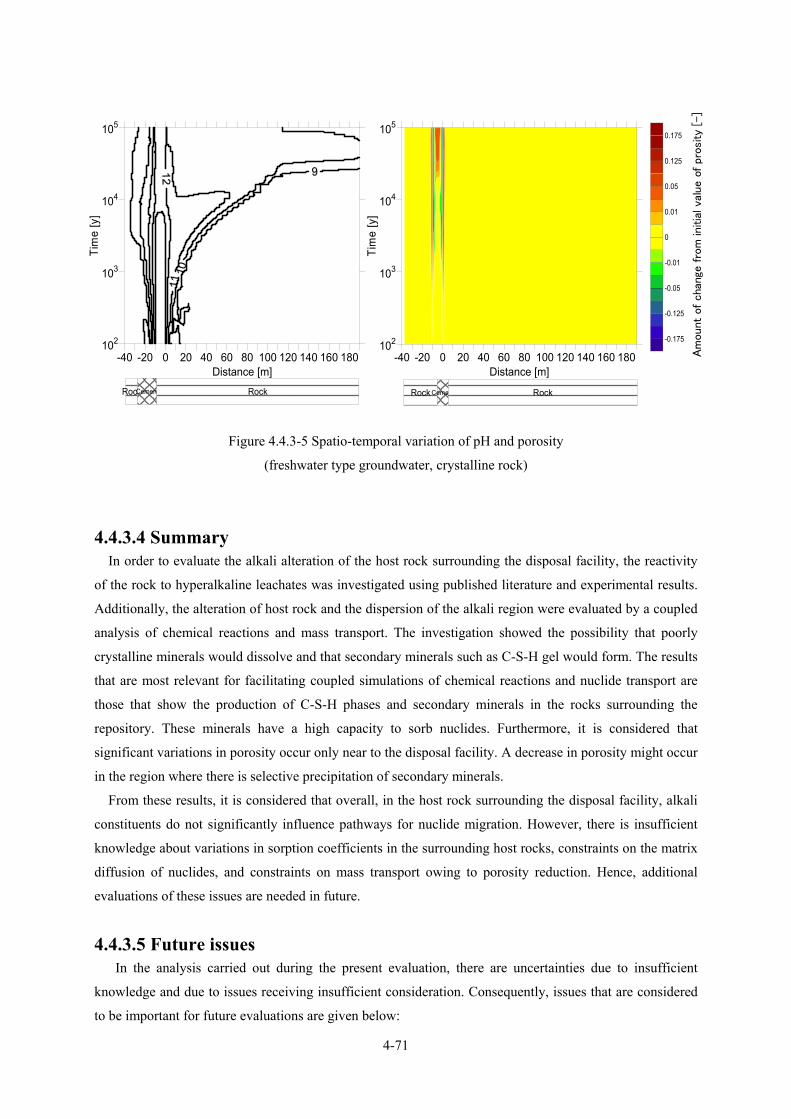
4-71
Figure 4.4.3-5 Spatio-temporal variation of pH and porosity
(freshwater type groundwater, crystalline rock)
4.4.3.4 Summary In order to evaluate the alkali alteration of the host rock surrounding the disposal facility, the reactivity
of the rock to hyperalkaline leachates was investigated using published literature and experimental results.
Additionally, the alteration of host rock and the dispersion of the alkali region were evaluated by a coupled
analysis of chemical reactions and mass transport. The investigation showed the possibility that poorly
crystalline minerals would dissolve and that secondary minerals such as C-S-H gel would form. The results
that are most relevant for facilitating coupled simulations of chemical reactions and nuclide transport are
those that show the production of C-S-H phases and secondary minerals in the rocks surrounding the
repository. These minerals have a high capacity to sorb nuclides. Furthermore, it is considered that
significant variations in porosity occur only near to the disposal facility. A decrease in porosity might occur
in the region where there is selective precipitation of secondary minerals.
From these results, it is considered that overall, in the host rock surrounding the disposal facility, alkali
constituents do not significantly influence pathways for nuclide migration. However, there is insufficient
knowledge about variations in sorption coefficients in the surrounding host rocks, constraints on the matrix
diffusion of nuclides, and constraints on mass transport owing to porosity reduction. Hence, additional
evaluations of these issues are needed in future.
4.4.3.5 Future issues In the analysis carried out during the present evaluation, there are uncertainties due to insufficient
knowledge and due to issues receiving insufficient consideration. Consequently, issues that are considered
to be important for future evaluations are given below:
-40 -20 0 20 40 60 80 100 120 140 160 180Distance [m]
102
103
104
105
Tim
e [y
]
RockCement Rock
-40 -20 0 20 40 60 80 100 120 140 160 180Distance [m]
102
103
104
105
Tim
e [y
]
-0.175
-0.125
-0.05
-0.01
0
0.01
0.05
0.125
0.175
RockCement Rock
Am
oun
t of ch
ange
fro
m ini
tial
val
ue o
f pro
sity
[-]
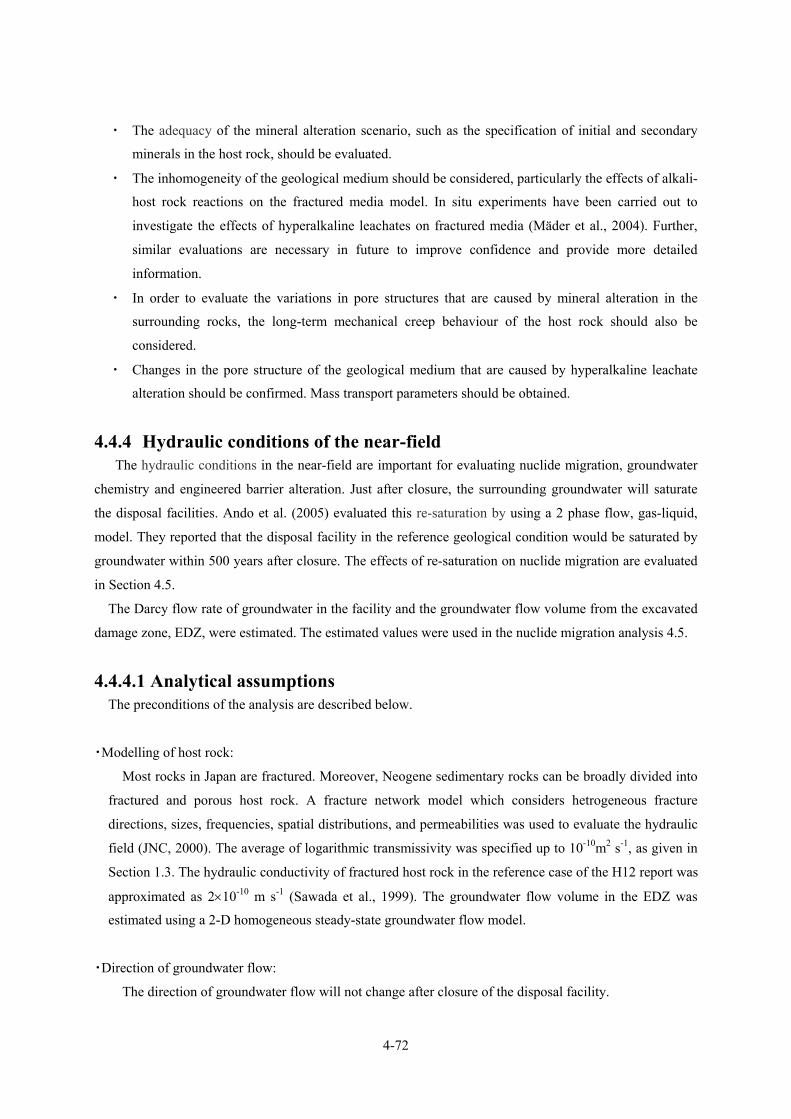
4-72
・ The adequacy of the mineral alteration scenario, such as the specification of initial and secondary
minerals in the host rock, should be evaluated.
・ The inhomogeneity of the geological medium should be considered, particularly the effects of alkali-
host rock reactions on the fractured media model. In situ experiments have been carried out to
investigate the effects of hyperalkaline leachates on fractured media (Mäder et al., 2004). Further,
similar evaluations are necessary in future to improve confidence and provide more detailed
information.
・ In order to evaluate the variations in pore structures that are caused by mineral alteration in the
surrounding rocks, the long-term mechanical creep behaviour of the host rock should also be
considered.
・ Changes in the pore structure of the geological medium that are caused by hyperalkaline leachate
alteration should be confirmed. Mass transport parameters should be obtained.
4.4.4 Hydraulic conditions of the near-field The hydraulic conditions in the near-field are important for evaluating nuclide migration, groundwater
chemistry and engineered barrier alteration. Just after closure, the surrounding groundwater will saturate
the disposal facilities. Ando et al. (2005) evaluated this re-saturation by using a 2 phase flow, gas-liquid,
model. They reported that the disposal facility in the reference geological condition would be saturated by
groundwater within 500 years after closure. The effects of re-saturation on nuclide migration are evaluated
in Section 4.5.
The Darcy flow rate of groundwater in the facility and the groundwater flow volume from the excavated
damage zone, EDZ, were estimated. The estimated values were used in the nuclide migration analysis 4.5.
4.4.4.1 Analytical assumptions The preconditions of the analysis are described below.
・Modelling of host rock:
Most rocks in Japan are fractured. Moreover, Neogene sedimentary rocks can be broadly divided into
fractured and porous host rock. A fracture network model which considers hetrogeneous fracture
directions, sizes, frequencies, spatial distributions, and permeabilities was used to evaluate the hydraulic
field (JNC, 2000). The average of logarithmic transmissivity was specified up to 10-10m2 s-1, as given in
Section 1.3. The hydraulic conductivity of fractured host rock in the reference case of the H12 report was
approximated as 2×10⁻¹⁰ m s-1 (Sawada et al., 1999). The groundwater flow volume in the EDZ was
estimated using a 2-D homogeneous steady-state groundwater flow model.
・Direction of groundwater flow:
The direction of groundwater flow will not change after closure of the disposal facility.

4-73
・Consideration of alteration of the EBS:
Cementitious material is used in the disposal facility. The changes in the hydraulic characteristics of
the cementitious material are considered. For groundwater flow calculation, parameters are selected
considering the alteration of the EBS. Time dependency of parameters are not considered in the
calculation.
4.4.4.2 Model and data for hydrogeological analyses (1) Mathematical modeling
a. Governing equations
In the general hydraulic analysis, the tunnels of the disposal facility are assumed for simplicity to be of
circular cross-section. Hence, a cylindrical 2 dimensional mathematical model is used.
The equation for steady-state groundwater flow is as follows, where the Darcy flow velocity, v of the
groundwater is based on Darcy's Law:
)1,(),(θθ ∂∂
∂∂
==P
rrPKvvv r (4.4.4.2-1)
0)(1)(1=
∂∂
+∂∂
θθv
rrv
rr r (4.4.4.2-2)
Here, K is the hydraulic conductivity and P is the hydraulic head. P is a function of θ and r.
b. Boundary conditions
The boundary condition is specified as follows if the centre of the disposal facility is the origin and the
disposal tunnel has a circular cross-section.
・Centre of disposal tunnel (r = 0) 0=P
・Furthest distance from disposal facility (r >> radius of repository tunnel) )cos(θhrP −=
Here, h is the hydraulic gradient.
c. Analysed groundwater flux and average Darcy flow velocity in each area
The following analysis is given for the above hydraulic head, P in the governing equations. Here, A and
B are constants which depend on the radius of the disposal tunnels, the coefficient of hydraulic conductivity
and the hydraulic gradient.
( )θθ cos1),( ⎟⎠⎞
⎜⎝⎛ +=
rBrArP (4.4.4.2-3)
The groundwater flow volume Qr which passes through each area is given by the following formula:

4-74
∫−=2/
2/
),(π
πθ
θ drdrrdPkQr (4.4.4.2-4)
In this analysis, the value of rQ is for 1/2 the internal surface area of each region (the external surface
area of the waste packages in the part with waste packages), and is regarded as an average Darcy flow.
(2) Data
a. Hydrological gradient
A hydraulic gradient of 0.01 in the plane of the model is used. The hydraulic gradient has a linear
relationship with respect to the Darcy flow velocity of groundwater.
b. Radius of repository tunnels in the disposal facility
In current repository designs being considered in Japan tunnel diameters range from 9 to 12 m. Here, 12
m is used as this would have a large groundwater flow volume.
c. Hydraulic conductivity
・ Host rock
A hydraulic conductivity of 2×10⁻¹⁰ m s-1 is specified, based on the fracture network model described
before.
・ Cementitious material
The cementitious material is gradually leached over a long time period, and simultaneously its hydraulic
conductivity changes. In order to evaluate the long-term variation, Mihara et al. (2003) examined the
relationship between the hydraulic conductivity (K [ms-1]) and porosity (θ [−]), based on flow-through
experiments using hardened cement samples. If the porosity of a sample that has been altered by flowing
water is known, the hydraulic conductivity can be specified. The observed relationship which is reported by
Mihara et al. is shown in Figure 4.4.4-1.
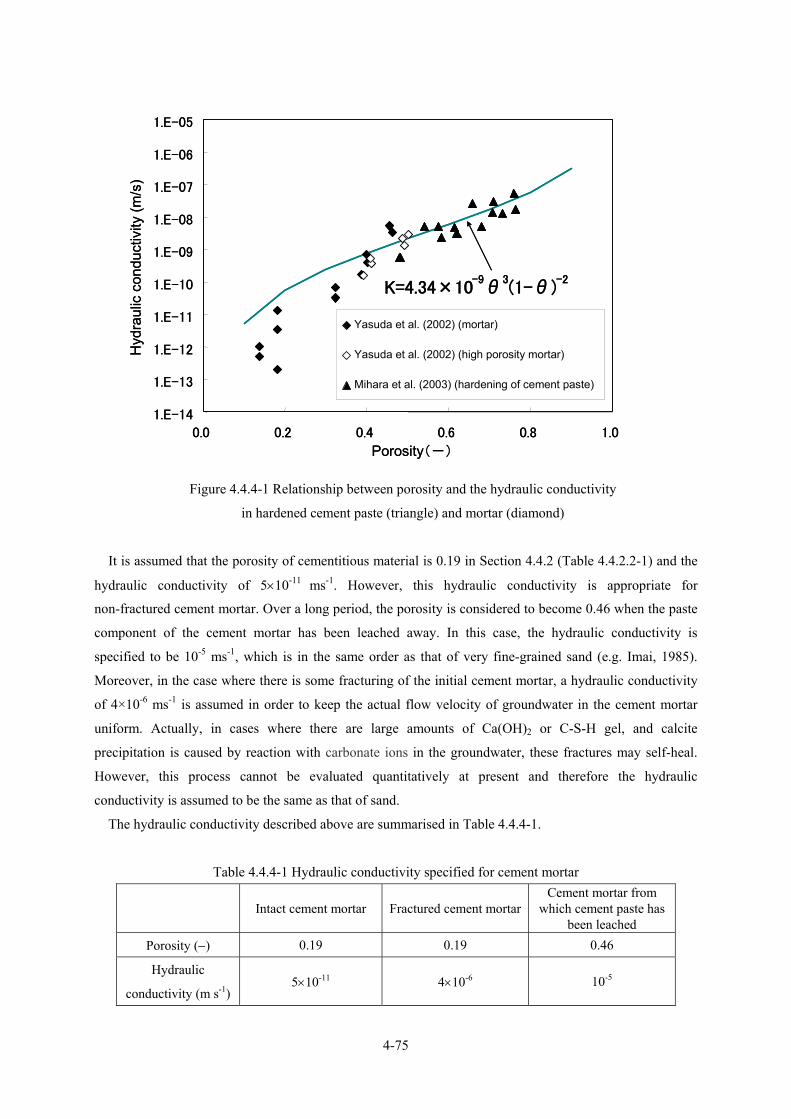
4-75
1.E-14
1.E-13
1.E-12
1.E-11
1.E-10
1.E-09
1.E-08
1.E-07
1.E-06
1.E-05
0.0 0.2 0.4 0.6 0.8 1.0
Porosity(-)
Hyd
raul
ic c
ondu
ctiv
ity (m
/s)
Yasuda et al. (2002) (mortar)
Yasuda et al. (2002) (high porosity mortar)
Mihara et al. (2003) (hardening of cement paste)
K=4.34×10⁻⁹
θ3(1-θ)
-2
1.E-14
1.E-13
1.E-12
1.E-11
1.E-10
1.E-09
1.E-08
1.E-07
1.E-06
1.E-05
0.0 0.2 0.4 0.6 0.8 1.0
Porosity(-)
Hyd
raul
ic c
ondu
ctiv
ity (m
/s)
Yasuda et al. (2002) (mortar)
Yasuda et al. (2002) (high porosity mortar)
Mihara et al. (2003) (hardening of cement paste)
K=4.34×10⁻⁹
θ3(1-θ)
-2
Figure 4.4.4-1 Relationship between porosity and the hydraulic conductivity
in hardened cement paste (triangle) and mortar (diamond)
It is assumed that the porosity of cementitious material is 0.19 in Section 4.4.2 (Table 4.4.2.2-1) and the
hydraulic conductivity of 5×10-11 ms-1. However, this hydraulic conductivity is appropriate for
non-fractured cement mortar. Over a long period, the porosity is considered to become 0.46 when the paste
component of the cement mortar has been leached away. In this case, the hydraulic conductivity is
specified to be 10-5 ms-1, which is in the same order as that of very fine-grained sand (e.g. Imai, 1985).
Moreover, in the case where there is some fracturing of the initial cement mortar, a hydraulic conductivity
of 4×10⁻⁶ ms-1 is assumed in order to keep the actual flow velocity of groundwater in the cement mortar
uniform. Actually, in cases where there are large amounts of Ca(OH)2 or C-S-H gel, and calcite
precipitation is caused by reaction with carbonate ions in the groundwater, these fractures may self-heal.
However, this process cannot be evaluated quantitatively at present and therefore the hydraulic
conductivity is assumed to be the same as that of sand.
The hydraulic conductivity described above are summarised in Table 4.4.4-1.
Table 4.4.4-1 Hydraulic conductivity specified for cement mortar
Intact cement mortar Fractured cement mortarCement mortar from
which cement paste has been leached
Porosity (−) 0.19 0.19 0.46
Hydraulic
conductivity (m s-1) 5×10-11 4×10⁻⁶ 10-5
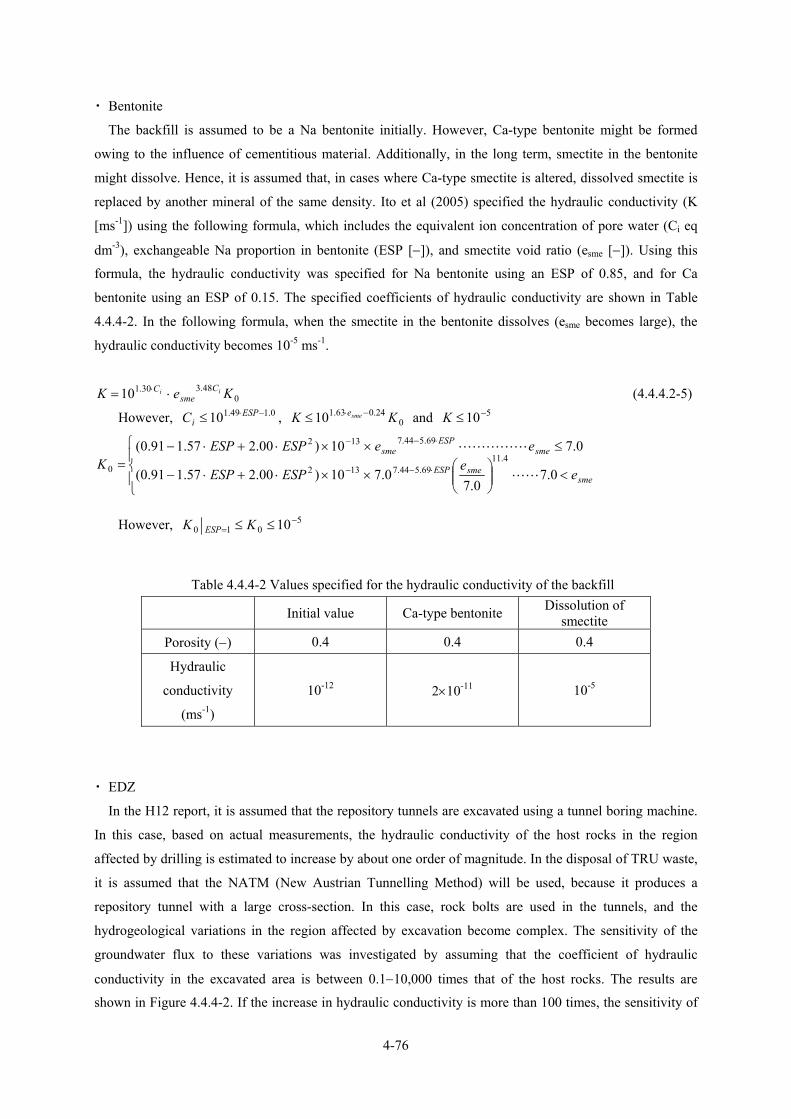
4-76
・ Bentonite
The backfill is assumed to be a Na bentonite initially. However, Ca-type bentonite might be formed
owing to the influence of cementitious material. Additionally, in the long term, smectite in the bentonite
might dissolve. Hence, it is assumed that, in cases where Ca-type smectite is altered, dissolved smectite is
replaced by another mineral of the same density. Ito et al (2005) specified the hydraulic conductivity (K
[ms-1]) using the following formula, which includes the equivalent ion concentration of pore water (Ci eq
dm-3), exchangeable Na proportion in bentonite (ESP [−]), and smectite void ratio (esme [−]). Using this
formula, the hydraulic conductivity was specified for Na bentonite using an ESP of 0.85, and for Ca
bentonite using an ESP of 0.15. The specified coefficients of hydraulic conductivity are shown in Table
4.4.4-2. In the following formula, when the smectite in the bentonite dissolves (esme becomes large), the
hydraulic conductivity becomes 10-5 ms-1.
048.330.110 KeK ii C
smeC ⋅= ⋅ (4.4.4.2-5)
However, 0.149.110 −⋅≤ ESPiC , 0
24.063.110 KK smee −⋅≤ and 510−≤K
⎪⎩
⎪⎨
⎧
<⎟⎟⎠
⎞⎜⎜⎝
⎛××⋅+⋅−
≤××⋅+⋅−= ⋅−−
⋅−−
smesmeESP
smeESP
sme
ee
ESPESP
eeESPESPK
0.70.7
0.710)00.257.191.0(
0.710)00.257.191.0(4.11
69.544.7132
69.544.7132
0
However, 5010 10−
= ≤≤ KK ESP
Table 4.4.4-2 Values specified for the hydraulic conductivity of the backfill
Initial value Ca-type bentonite Dissolution of smectite
Porosity (−) 0.4 0.4 0.4
Hydraulic
conductivity
(ms-1)
10-12 2×10-11 10-5
・ EDZ
In the H12 report, it is assumed that the repository tunnels are excavated using a tunnel boring machine.
In this case, based on actual measurements, the hydraulic conductivity of the host rocks in the region
affected by drilling is estimated to increase by about one order of magnitude. In the disposal of TRU waste,
it is assumed that the NATM (New Austrian Tunnelling Method) will be used, because it produces a
repository tunnel with a large cross-section. In this case, rock bolts are used in the tunnels, and the
hydrogeological variations in the region affected by excavation become complex. The sensitivity of the
groundwater flux to these variations was investigated by assuming that the coefficient of hydraulic
conductivity in the excavated area is between 0.1−10,000 times that of the host rocks. The results are
shown in Figure 4.4.4-2. If the increase in hydraulic conductivity is more than 100 times, the sensitivity of
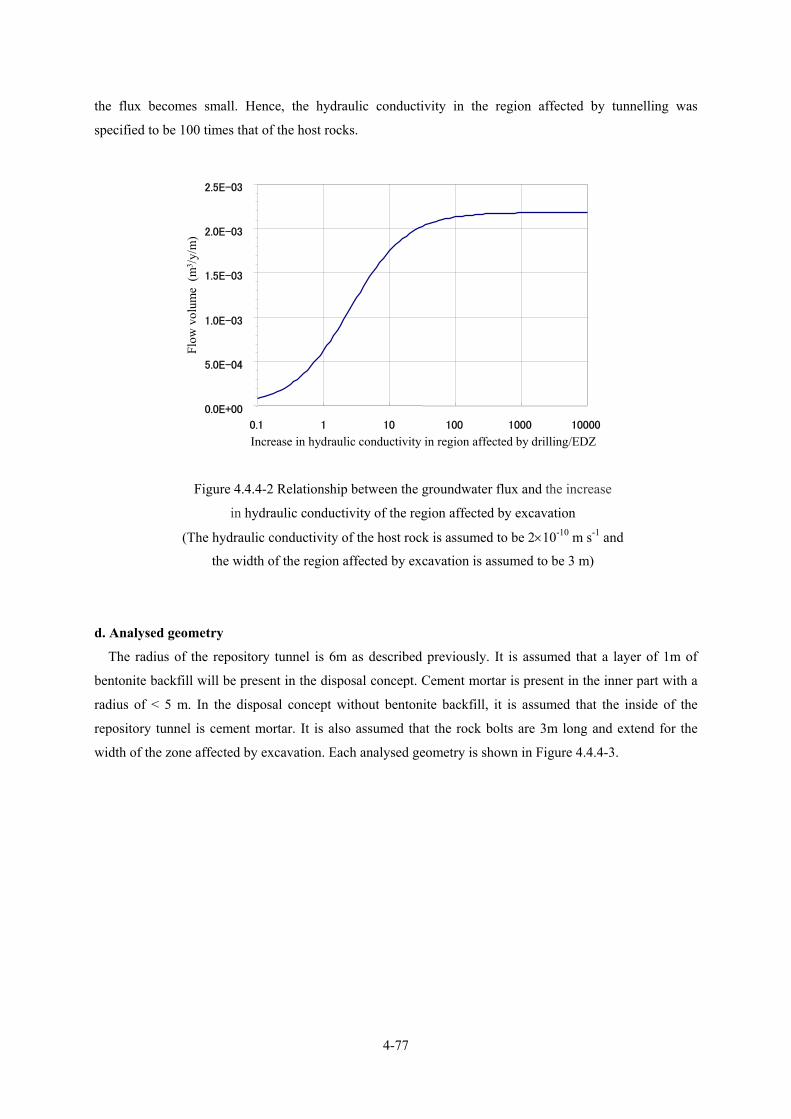
4-77
the flux becomes small. Hence, the hydraulic conductivity in the region affected by tunnelling was
specified to be 100 times that of the host rocks.
0.0E+00
5.0E-04
1.0E-03
1.5E-03
2.0E-03
2.5E-03
0.1 1 10 100 1000 10000
Increase in hydraulic conductivity in region affected by drilling/EDZ
Flow
vol
ume
(m3 /y
/m)
0.0E+00
5.0E-04
1.0E-03
1.5E-03
2.0E-03
2.5E-03
0.1 1 10 100 1000 10000
Increase in hydraulic conductivity in region affected by drilling/EDZ
Flow
vol
ume
(m3 /y
/m)
Figure 4.4.4-2 Relationship between the groundwater flux and the increase
in hydraulic conductivity of the region affected by excavation
(The hydraulic conductivity of the host rock is assumed to be 2×10⁻¹⁰ m s-1 and
the width of the region affected by excavation is assumed to be 3 m)
d. Analysed geometry
The radius of the repository tunnel is 6m as described previously. It is assumed that a layer of 1m of
bentonite backfill will be present in the disposal concept. Cement mortar is present in the inner part with a
radius of < 5 m. In the disposal concept without bentonite backfill, it is assumed that the inside of the
repository tunnel is cement mortar. It is also assumed that the rock bolts are 3m long and extend for the
width of the zone affected by excavation. Each analysed geometry is shown in Figure 4.4.4-3.
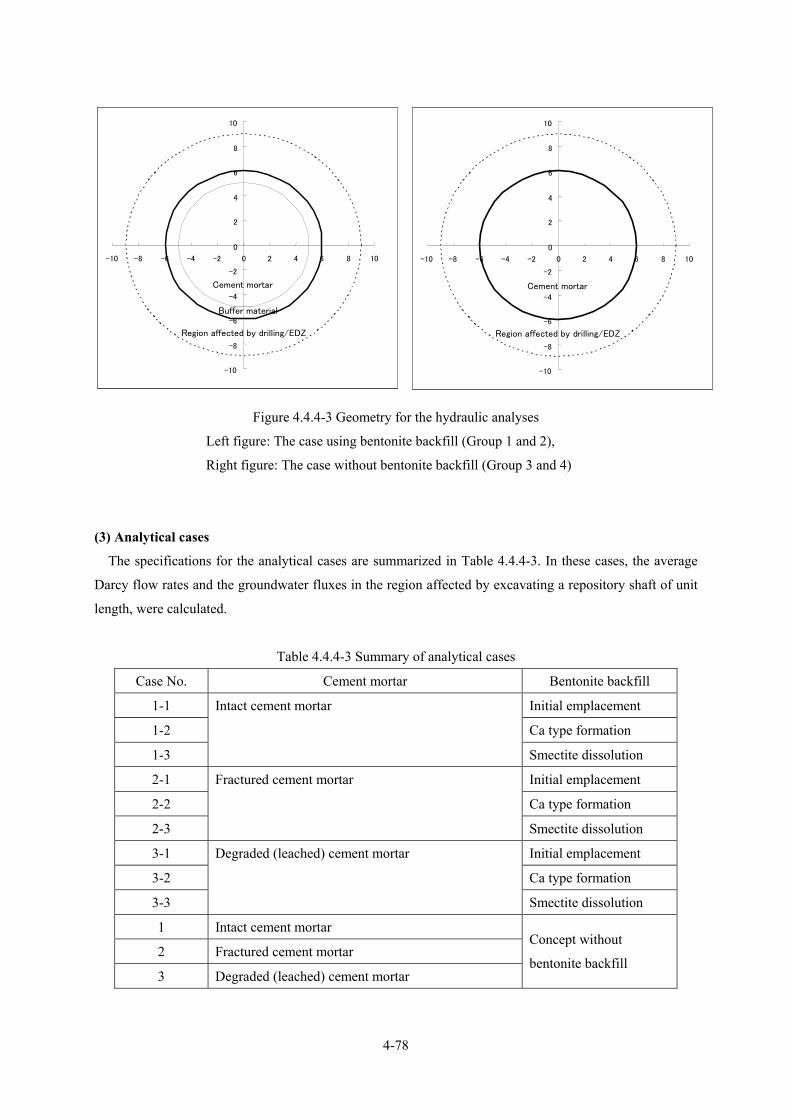
4-78
-10
-8
-6
-4
-2
0
2
4
6
8
10
-10 -8 -6 -4 -2 0 2 4 6 8 10
Cement mortar
Buffer material
-10
-8
-6
-4
-2
0
2
4
6
8
10
-10 -8 -6 -4 -2 0 2 4 6 8 10
Cement mortar
Region affected by drilling/EDZRegion affected by drilling/EDZ
-10
-8
-6
-4
-2
0
2
4
6
8
10
-10
-10
-8
-6
-4
-2
0
2
4
6
8
10
-10 -8 -6 -4 -2 0 2 4 6 8 10
Cement mortar
Buffer material
-10
-8
-6
-4
-2
0
2
4
6
8
10
-10 -8
-10
-8
-6
-4
-2
0
2
4
6
8
10
-10 -8 -6 -4 -2 0 2 4 6 8 10
Cement mortar
Region affected by drilling/EDZRegion affected by drilling/EDZ
Figure 4.4.4-3 Geometry for the hydraulic analyses
Left figure: The case using bentonite backfill (Group 1 and 2),
Right figure: The case without bentonite backfill (Group 3 and 4)
(3) Analytical cases
The specifications for the analytical cases are summarized in Table 4.4.4-3. In these cases, the average
Darcy flow rates and the groundwater fluxes in the region affected by excavating a repository shaft of unit
length, were calculated.
Table 4.4.4-3 Summary of analytical cases
Case No. Cement mortar Bentonite backfill
1-1 Initial emplacement
1-2 Ca type formation
1-3
Intact cement mortar
Smectite dissolution
2-1 Initial emplacement
2-2 Ca type formation
2-3
Fractured cement mortar
Smectite dissolution
3-1 Initial emplacement
3-2 Ca type formation
3-3
Degraded (leached) cement mortar
Smectite dissolution
1 Intact cement mortar
2 Fractured cement mortar
3 Degraded (leached) cement mortar
Concept without
bentonite backfill
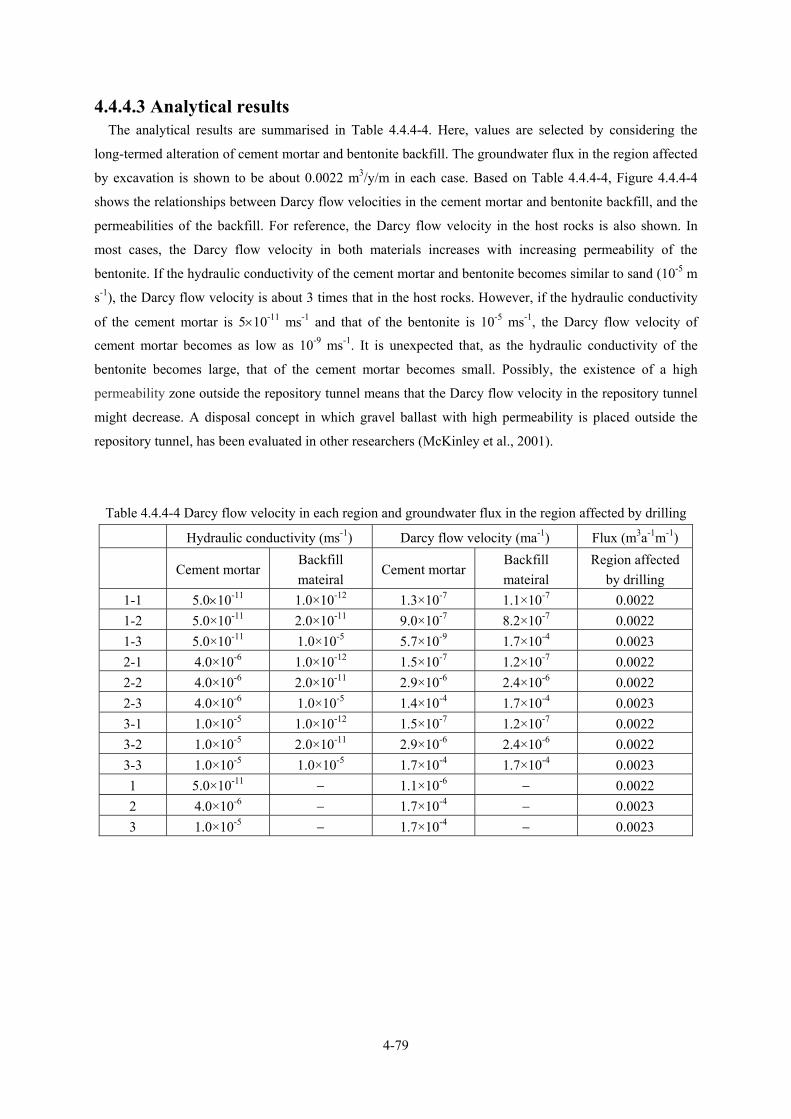
4-79
4.4.4.3 Analytical results The analytical results are summarised in Table 4.4.4-4. Here, values are selected by considering the
long-termed alteration of cement mortar and bentonite backfill. The groundwater flux in the region affected
by excavation is shown to be about 0.0022 m3/y/m in each case. Based on Table 4.4.4-4, Figure 4.4.4-4
shows the relationships between Darcy flow velocities in the cement mortar and bentonite backfill, and the
permeabilities of the backfill. For reference, the Darcy flow velocity in the host rocks is also shown. In
most cases, the Darcy flow velocity in both materials increases with increasing permeability of the
bentonite. If the hydraulic conductivity of the cement mortar and bentonite becomes similar to sand (10-5 m
s-1), the Darcy flow velocity is about 3 times that in the host rocks. However, if the hydraulic conductivity
of the cement mortar is 5×10-11 ms-1 and that of the bentonite is 10-5 ms-1, the Darcy flow velocity of
cement mortar becomes as low as 10-9 ms-1. It is unexpected that, as the hydraulic conductivity of the
bentonite becomes large, that of the cement mortar becomes small. Possibly, the existence of a high
permeability zone outside the repository tunnel means that the Darcy flow velocity in the repository tunnel
might decrease. A disposal concept in which gravel ballast with high permeability is placed outside the
repository tunnel, has been evaluated in other researchers (McKinley et al., 2001).
Table 4.4.4-4 Darcy flow velocity in each region and groundwater flux in the region affected by drilling
Hydraulic conductivity (ms-1) Darcy flow velocity (ma-1) Flux (m3a-1m-1)
Cement mortar Backfill mateiral
Cement mortarBackfill mateiral
Region affected by drilling
1-1 5.0×10⁻¹¹ 1.0×10⁻¹² 1.3×10⁻⁷ 1.1×10⁻⁷ 0.0022 1-2 5.0×10⁻¹¹ 2.0×10⁻¹¹ 9.0×10⁻⁷ 8.2×10⁻⁷ 0.0022 1-3 5.0×10⁻¹¹ 1.0×10⁻⁵ 5.7×10⁻⁹ 1.7×10⁻⁴ 0.0023 2-1 4.0×10⁻⁶ 1.0×10⁻¹² 1.5×10⁻⁷ 1.2×10⁻⁷ 0.0022 2-2 4.0×10⁻⁶ 2.0×10⁻¹¹ 2.9×10⁻⁶ 2.4×10⁻⁶ 0.0022 2-3 4.0×10⁻⁶ 1.0×10⁻⁵ 1.4×10⁻⁴ 1.7×10⁻⁴ 0.0023 3-1 1.0×10⁻⁵ 1.0×10⁻¹² 1.5×10⁻⁷ 1.2×10⁻⁷ 0.0022 3-2 1.0×10⁻⁵ 2.0×10⁻¹¹ 2.9×10⁻⁶ 2.4×10⁻⁶ 0.0022 3-3 1.0×10⁻⁵ 1.0×10⁻⁵ 1.7×10⁻⁴ 1.7×10⁻⁴ 0.0023 1 5.0×10⁻¹¹ − 1.1×10⁻⁶ − 0.0022 2 4.0×10⁻⁶ − 1.7×10⁻⁴ − 0.0023 3 1.0×10⁻⁵ − 1.7×10⁻⁴ − 0.0023
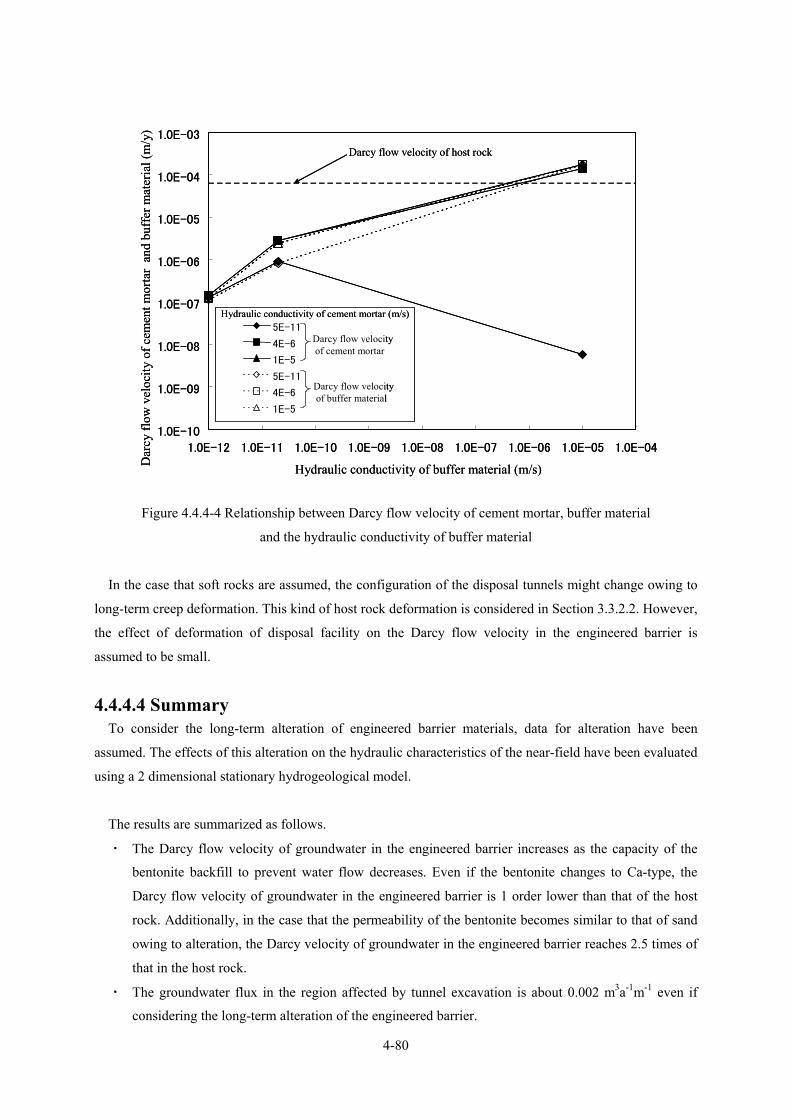
4-80
Figure 4.4.4-4 Relationship between Darcy flow velocity of cement mortar, buffer material
and the hydraulic conductivity of buffer material
In the case that soft rocks are assumed, the configuration of the disposal tunnels might change owing to
long-term creep deformation. This kind of host rock deformation is considered in Section 3.3.2.2. However,
the effect of deformation of disposal facility on the Darcy flow velocity in the engineered barrier is
assumed to be small.
4.4.4.4 Summary To consider the long-term alteration of engineered barrier materials, data for alteration have been
assumed. The effects of this alteration on the hydraulic characteristics of the near-field have been evaluated
using a 2 dimensional stationary hydrogeological model.
The results are summarized as follows.
・ The Darcy flow velocity of groundwater in the engineered barrier increases as the capacity of the
bentonite backfill to prevent water flow decreases. Even if the bentonite changes to Ca-type, the
Darcy flow velocity of groundwater in the engineered barrier is 1 order lower than that of the host
rock. Additionally, in the case that the permeability of the bentonite becomes similar to that of sand
owing to alteration, the Darcy velocity of groundwater in the engineered barrier reaches 2.5 times of
that in the host rock.
・ The groundwater flux in the region affected by tunnel excavation is about 0.002 m3a-1m-1 even if
considering the long-term alteration of the engineered barrier.
1.0E-10
1.0E-09
1.0E-08
1.0E-07
1.0E-06
1.0E-05
1.0E-04
1.0E-03
1.0E-12 1.0E-11 1.0E-10 1.0E-09 1.0E-08 1.0E-07 1.0E-06 1.0E-05 1.0E-04
Hydraulic conductivity of buffer material (m/s)Dar
cy fl
ow v
eloc
ity o
f cem
ent m
orta
r an
d bu
ffer
mat
eria
l (m
/y)
5E-11
4E-6
1E-5
5E-11
4E-6
1E-5
Darcy flow velocityof cement mortar
Darcy flow velocityof buffer material
Hydraulic conductivity of cement mortar (m/s)
Darcy flow velocity of host rock
4-81
4.4.4.5 Future issues This evaluation used a simple model, based on knowledge from the H12 report. In order to evaluate the
hydrogeology of the near-field in more detail, the following is needed:
・ Evaluation the groundwater fluxes in regions affected by excavation in various other rock types (i.e.
not just the rock types examined in this report).
・ Further evaluations for TRU waste disposal taking into account progress with hydrogeological
research at Tono (crystalline rocks) and Horonobe (sedimentary rocks).
4.4.5 Effects of colloids Colloids exist in all natural waters (e.g. McCarthy et al., 1993) and it is assumed that colloids will be
produced by EBS components and wastes and as a result of chemical disturbances. It is assumed that the
migration of radionuclides that are bound to colloids will be quite different from the migration of
radioactive nuclides are present in groundwater as ions. This migration process is called Colloid-Facilitated
Transportation (hereafter, “CFT”) (e.g. Ryan et al., 1996).
This section evaluates the effects of colloids that have been generated in the engineered barrier and
natural barrier of a disposal facility. Considerable information concerning nuclide migration analysis is
summarised.
4.4.5.1 Effect of colloids in the EBS The types of colloids that are generated by constructing the disposal facility and waste emplacement are
summarised here. The behaviour of colloids in the EBS is evaluated by means of nuclide migration analysis
modelling.
(1) Colloids generated/pre-existing in the EBS
The main types of colloids that are generated or pre-existing in the EBS are as follows (Avogadro et al.,
1984; Ramsay, 1988; Fujita et al., 1997):
① true colloids such as actinides, etc.
② corrosion products of metals and glass
③ clay minerals such as bentonite
④ cement colloids
It is assumed that organic polymers such as cellulose and its decomposition products in the waste may form
complexes with radionuclides and affect transport in a similar fashion to colloids. These effects are
described in Section 4.4.6. Additionally, it is also considered that similar effects are caused by microbes
and metabolic materials produced by microbes. These effects are described in Section 4.4.7.
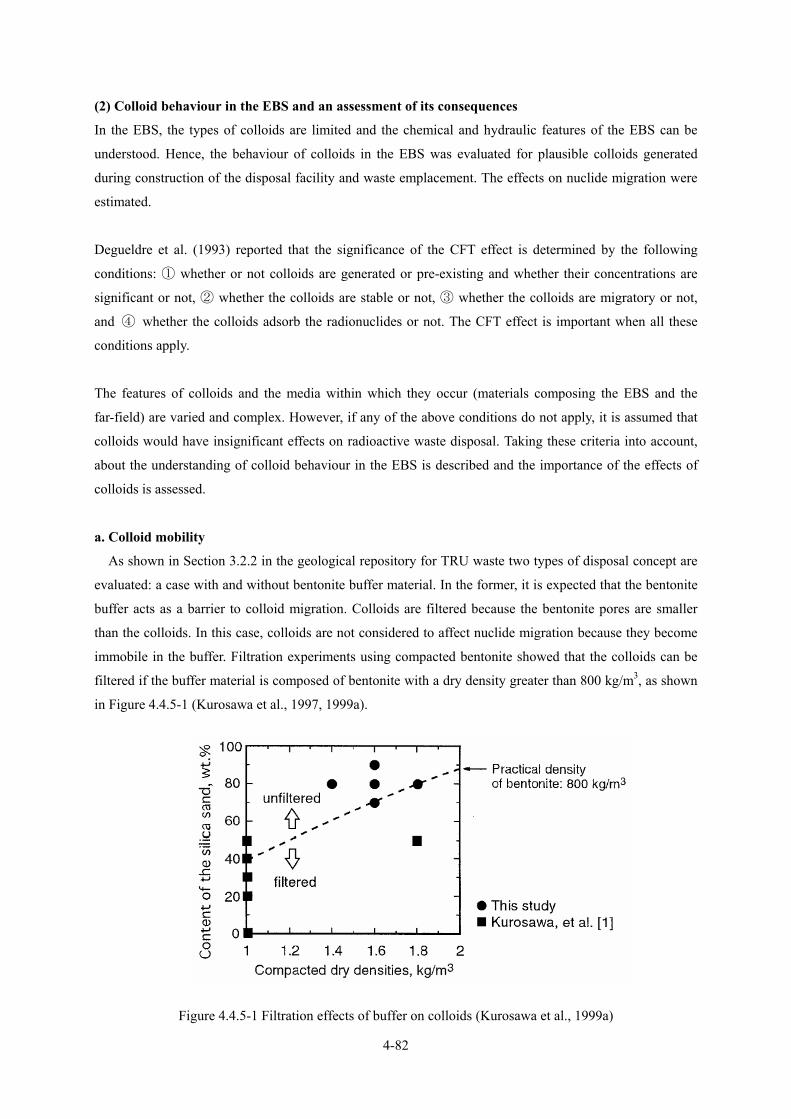
4-82
(2) Colloid behaviour in the EBS and an assessment of its consequences
In the EBS, the types of colloids are limited and the chemical and hydraulic features of the EBS can be
understood. Hence, the behaviour of colloids in the EBS was evaluated for plausible colloids generated
during construction of the disposal facility and waste emplacement. The effects on nuclide migration were
estimated.
Degueldre et al. (1993) reported that the significance of the CFT effect is determined by the following
conditions: ① whether or not colloids are generated or pre-existing and whether their concentrations are
significant or not, ② whether the colloids are stable or not, ③ whether the colloids are migratory or not,
and ④ whether the colloids adsorb the radionuclides or not. The CFT effect is important when all these
conditions apply.
The features of colloids and the media within which they occur (materials composing the EBS and the
far-field) are varied and complex. However, if any of the above conditions do not apply, it is assumed that
colloids would have insignificant effects on radioactive waste disposal. Taking these criteria into account,
about the understanding of colloid behaviour in the EBS is described and the importance of the effects of
colloids is assessed.
a. Colloid mobility
As shown in Section 3.2.2 in the geological repository for TRU waste two types of disposal concept are
evaluated: a case with and without bentonite buffer material. In the former, it is expected that the bentonite
buffer acts as a barrier to colloid migration. Colloids are filtered because the bentonite pores are smaller
than the colloids. In this case, colloids are not considered to affect nuclide migration because they become
immobile in the buffer. Filtration experiments using compacted bentonite showed that the colloids can be
filtered if the buffer material is composed of bentonite with a dry density greater than 800 kg/m3, as shown
in Figure 4.4.5-1 (Kurosawa et al., 1997, 1999a).
Figure 4.4.5-1 Filtration effects of buffer on colloids (Kurosawa et al., 1999a)
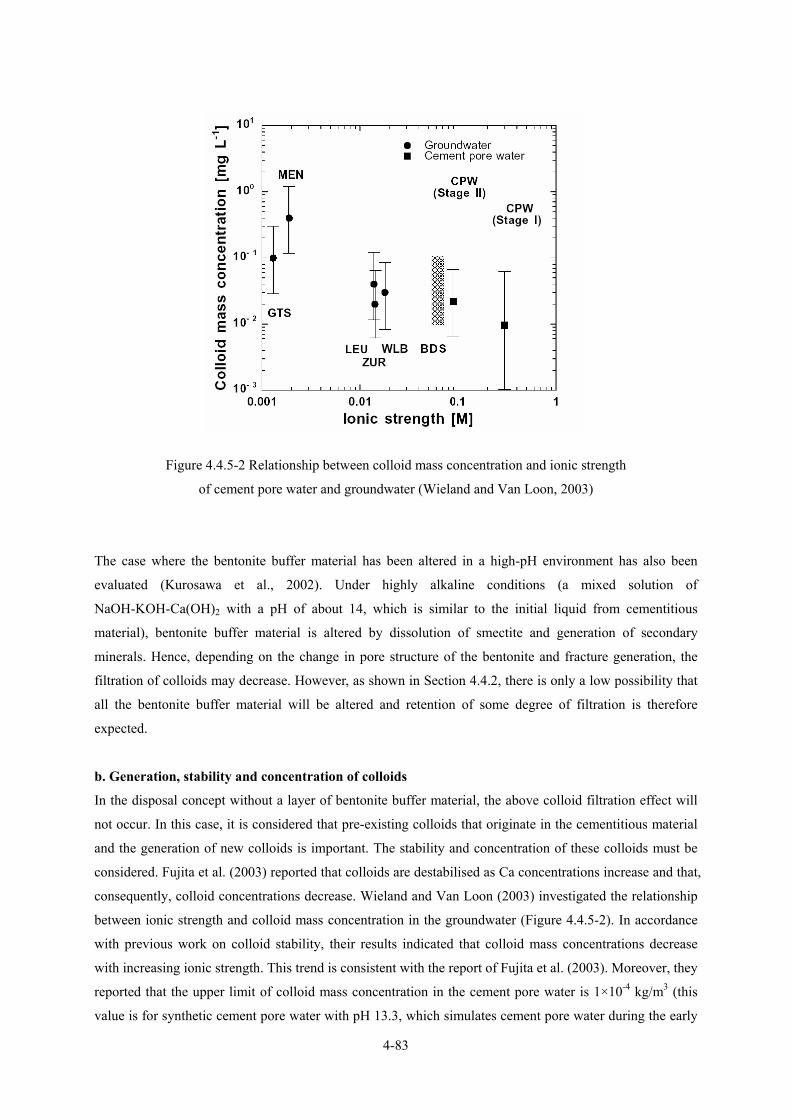
4-83
Figure 4.4.5-2 Relationship between colloid mass concentration and ionic strength
of cement pore water and groundwater (Wieland and Van Loon, 2003)
The case where the bentonite buffer material has been altered in a high-pH environment has also been
evaluated (Kurosawa et al., 2002). Under highly alkaline conditions (a mixed solution of
NaOH-KOH-Ca(OH)2 with a pH of about 14, which is similar to the initial liquid from cementitious
material), bentonite buffer material is altered by dissolution of smectite and generation of secondary
minerals. Hence, depending on the change in pore structure of the bentonite and fracture generation, the
filtration of colloids may decrease. However, as shown in Section 4.4.2, there is only a low possibility that
all the bentonite buffer material will be altered and retention of some degree of filtration is therefore
expected.
b. Generation, stability and concentration of colloids
In the disposal concept without a layer of bentonite buffer material, the above colloid filtration effect will
not occur. In this case, it is considered that pre-existing colloids that originate in the cementitious material
and the generation of new colloids is important. The stability and concentration of these colloids must be
considered. Fujita et al. (2003) reported that colloids are destabilised as Ca concentrations increase and that,
consequently, colloid concentrations decrease. Wieland and Van Loon (2003) investigated the relationship
between ionic strength and colloid mass concentration in the groundwater (Figure 4.4.5-2). In accordance
with previous work on colloid stability, their results indicated that colloid mass concentrations decrease
with increasing ionic strength. This trend is consistent with the report of Fujita et al. (2003). Moreover, they
reported that the upper limit of colloid mass concentration in the cement pore water is 1×10⁻⁴ kg/m3 (this
value is for synthetic cement pore water with pH 13.3, which simulates cement pore water during the early
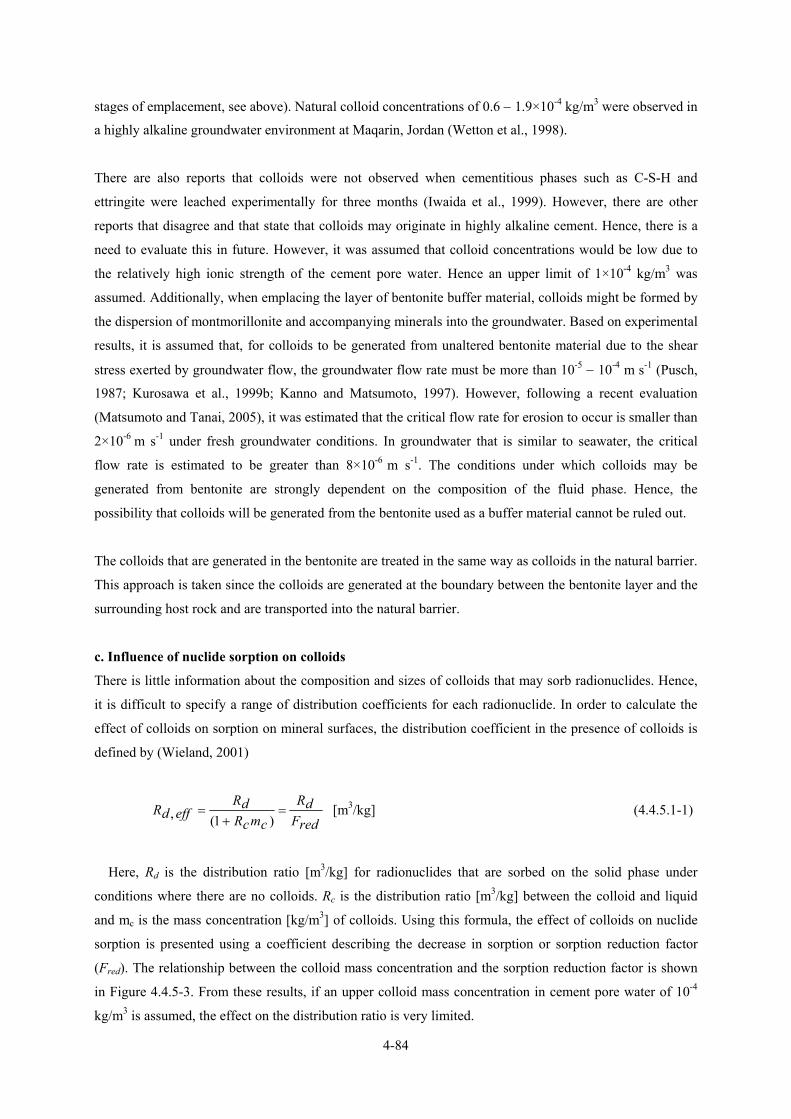
4-84
stages of emplacement, see above). Natural colloid concentrations of 0.6 − 1.9×10⁻⁴ kg/m3 were observed in
a highly alkaline groundwater environment at Maqarin, Jordan (Wetton et al., 1998).
There are also reports that colloids were not observed when cementitious phases such as C-S-H and
ettringite were leached experimentally for three months (Iwaida et al., 1999). However, there are other
reports that disagree and that state that colloids may originate in highly alkaline cement. Hence, there is a
need to evaluate this in future. However, it was assumed that colloid concentrations would be low due to
the relatively high ionic strength of the cement pore water. Hence an upper limit of 1×10⁻⁴ kg/m3 was
assumed. Additionally, when emplacing the layer of bentonite buffer material, colloids might be formed by
the dispersion of montmorillonite and accompanying minerals into the groundwater. Based on experimental
results, it is assumed that, for colloids to be generated from unaltered bentonite material due to the shear
stress exerted by groundwater flow, the groundwater flow rate must be more than 10-5 − 10-4 m s-1 (Pusch,
1987; Kurosawa et al., 1999b; Kanno and Matsumoto, 1997). However, following a recent evaluation
(Matsumoto and Tanai, 2005), it was estimated that the critical flow rate for erosion to occur is smaller than
2×10⁻⁶ m s-1 under fresh groundwater conditions. In groundwater that is similar to seawater, the critical
flow rate is estimated to be greater than 8×10⁻⁶ m s-1. The conditions under which colloids may be
generated from bentonite are strongly dependent on the composition of the fluid phase. Hence, the
possibility that colloids will be generated from the bentonite used as a buffer material cannot be ruled out.
The colloids that are generated in the bentonite are treated in the same way as colloids in the natural barrier.
This approach is taken since the colloids are generated at the boundary between the bentonite layer and the
surrounding host rock and are transported into the natural barrier.
c. Influence of nuclide sorption on colloids
There is little information about the composition and sizes of colloids that may sorb radionuclides. Hence,
it is difficult to specify a range of distribution coefficients for each radionuclide. In order to calculate the
effect of colloids on sorption on mineral surfaces, the distribution coefficient in the presence of colloids is
defined by (Wieland, 2001)
redFdR
cmcRdR
effdR =+
=)1(, [m3/kg] (4.4.5.1-1)
Here, Rd is the distribution ratio [m3/kg] for radionuclides that are sorbed on the solid phase under
conditions where there are no colloids. Rc is the distribution ratio [m3/kg] between the colloid and liquid
and mc is the mass concentration [kg/m3] of colloids. Using this formula, the effect of colloids on nuclide
sorption is presented using a coefficient describing the decrease in sorption or sorption reduction factor
(Fred). The relationship between the colloid mass concentration and the sorption reduction factor is shown
in Figure 4.4.5-3. From these results, if an upper colloid mass concentration in cement pore water of 10-4
kg/m3 is assumed, the effect on the distribution ratio is very limited.
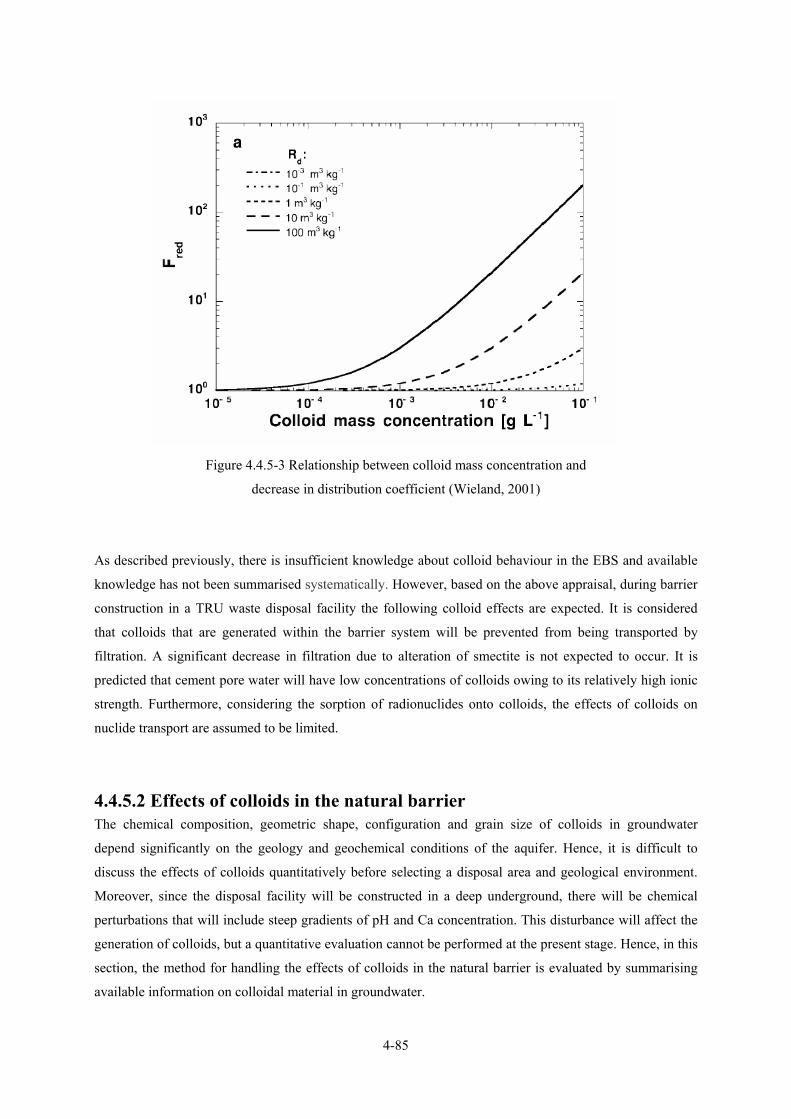
4-85
Figure 4.4.5-3 Relationship between colloid mass concentration and
decrease in distribution coefficient (Wieland, 2001)
As described previously, there is insufficient knowledge about colloid behaviour in the EBS and available
knowledge has not been summarised systematically. However, based on the above appraisal, during barrier
construction in a TRU waste disposal facility the following colloid effects are expected. It is considered
that colloids that are generated within the barrier system will be prevented from being transported by
filtration. A significant decrease in filtration due to alteration of smectite is not expected to occur. It is
predicted that cement pore water will have low concentrations of colloids owing to its relatively high ionic
strength. Furthermore, considering the sorption of radionuclides onto colloids, the effects of colloids on
nuclide transport are assumed to be limited.
4.4.5.2 Effects of colloids in the natural barrier The chemical composition, geometric shape, configuration and grain size of colloids in groundwater
depend significantly on the geology and geochemical conditions of the aquifer. Hence, it is difficult to
discuss the effects of colloids quantitatively before selecting a disposal area and geological environment.
Moreover, since the disposal facility will be constructed in a deep underground, there will be chemical
perturbations that will include steep gradients of pH and Ca concentration. This disturbance will affect the
generation of colloids, but a quantitative evaluation cannot be performed at the present stage. Hence, in this
section, the method for handling the effects of colloids in the natural barrier is evaluated by summarising
available information on colloidal material in groundwater.
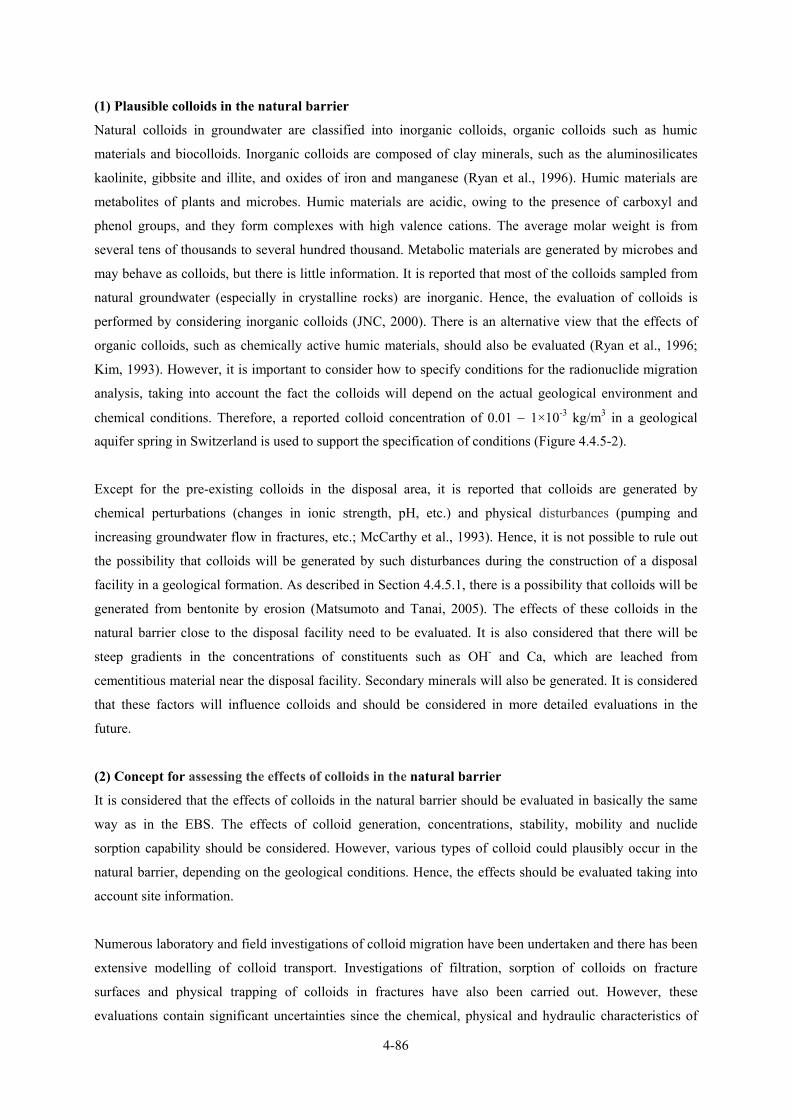
4-86
(1) Plausible colloids in the natural barrier
Natural colloids in groundwater are classified into inorganic colloids, organic colloids such as humic
materials and biocolloids. Inorganic colloids are composed of clay minerals, such as the aluminosilicates
kaolinite, gibbsite and illite, and oxides of iron and manganese (Ryan et al., 1996). Humic materials are
metabolites of plants and microbes. Humic materials are acidic, owing to the presence of carboxyl and
phenol groups, and they form complexes with high valence cations. The average molar weight is from
several tens of thousands to several hundred thousand. Metabolic materials are generated by microbes and
may behave as colloids, but there is little information. It is reported that most of the colloids sampled from
natural groundwater (especially in crystalline rocks) are inorganic. Hence, the evaluation of colloids is
performed by considering inorganic colloids (JNC, 2000). There is an alternative view that the effects of
organic colloids, such as chemically active humic materials, should also be evaluated (Ryan et al., 1996;
Kim, 1993). However, it is important to consider how to specify conditions for the radionuclide migration
analysis, taking into account the fact the colloids will depend on the actual geological environment and
chemical conditions. Therefore, a reported colloid concentration of 0.01 − 1×10⁻³ kg/m3 in a geological
aquifer spring in Switzerland is used to support the specification of conditions (Figure 4.4.5-2).
Except for the pre-existing colloids in the disposal area, it is reported that colloids are generated by
chemical perturbations (changes in ionic strength, pH, etc.) and physical disturbances (pumping and
increasing groundwater flow in fractures, etc.; McCarthy et al., 1993). Hence, it is not possible to rule out
the possibility that colloids will be generated by such disturbances during the construction of a disposal
facility in a geological formation. As described in Section 4.4.5.1, there is a possibility that colloids will be
generated from bentonite by erosion (Matsumoto and Tanai, 2005). The effects of these colloids in the
natural barrier close to the disposal facility need to be evaluated. It is also considered that there will be
steep gradients in the concentrations of constituents such as OH- and Ca, which are leached from
cementitious material near the disposal facility. Secondary minerals will also be generated. It is considered
that these factors will influence colloids and should be considered in more detailed evaluations in the
future.
(2) Concept for assessing the effects of colloids in the natural barrier
It is considered that the effects of colloids in the natural barrier should be evaluated in basically the same
way as in the EBS. The effects of colloid generation, concentrations, stability, mobility and nuclide
sorption capability should be considered. However, various types of colloid could plausibly occur in the
natural barrier, depending on the geological conditions. Hence, the effects should be evaluated taking into
account site information.
Numerous laboratory and field investigations of colloid migration have been undertaken and there has been
extensive modelling of colloid transport. Investigations of filtration, sorption of colloids on fracture
surfaces and physical trapping of colloids in fractures have also been carried out. However, these
evaluations contain significant uncertainties since the chemical, physical and hydraulic characteristics of
4-87
host rocks are site-specific and depend on the geological environment conditions and their heterogeneities.
Due to the considerable range of colloidal characteristics, lack of information and heterogeneities in the
chemical/physical/hydraulic properties of the medium for colloid transport, quantitative evaluations of
colloid behavior in natural barriers cannot be performed at present.
The effects of colloids on nuclide migration are estimated by considering the CFT effect, since colloids
behave as radionuclide carriers in a different way to ions. For example, in the H12 report (JNC, 2000), the
evaluation assumed that colloid transportation occurred without effects such as matrix diffusion and
sorption onto fracture surfaces. Uncertainty is inevitable in any evaluation of the effects of colloids in
natural barriers. However, it is possible to estimate the colloid effect in the natural barrier by taking these
uncertainties into account.
4.4.5.3 Summary The effects of colloids on nuclide migration are classified into effects within the EBS and effects within the
natural barrier. The treatment is based on a summary of information about colloid behaviour and a
summary of information that must be considered by a nuclide migration analysis. The effects of colloids in
the EBS are estimated to be small, owing to filtration by bentonite, low concentrations and small influences
on sorption on the rock. The effects of colloids in the natural barrier are difficult to evaluate due to the
wide variety of colloid characteristics and a lack of information about the transport properties and
heterogeneity of the geological medium. However, although the transport behaviour of colloids and its
effects cannot be determined precisely, it is possible to estimate the effects of CFT on transport.
4.4.5.4 Future issues As described previously, there is uncertainty in the evaluation of colloid behaviour in the natural barrier
because of insufficiency of knowledge. In future, the following issues should be considered.
・ Clarification of the conditions under which colloids are generated in groundwater near the disposal
facility
・ Accumulation of information about colloids in natural barriers, understanding their behaviour and
development of an evaluation model
・ Acquisition of sorption distribution coefficients for colloids and data on the irreversibility of
sorption
4-88
4.4.6 Effects of organic materials Sources of organic material in a TRU waste disposal facility are waste, groundwater and EBS material.
Organic materials affect solubility and sorption distribution coefficients of nuclides by complexation with
organic materials and its decomposing products. Hence, assessments of nuclide migration must take into
account the possibility that organic materials affect these parameters.
Organic materials also affect gas generation and EBS materials (e.g. CO2 gas generation and nutralisation
of cementitius material). Such effects are described in the sections on gas and microbes below.
4.4.6.1 Organic materials considered Organic material is not included in Group 1 TRU waste. A certain amount of organic material (mainly
cotton waste, etc.) is included in Group 2 waste of JAEA. A seperation procedure is used to remove this
organic material, but it is assumed that 0.1% will remain in the waste (Kurakata et al., 1996). The waste in
Group 3 includes low-level liquid waste from Tokai reprocessing plant of JAEA that has been solidified in
bitumen. Also included in this group is bituminised waste that will be returned by AREVA (France). The
total amount of bitumen that will be disposed of in a geological repository is estimated to be 2.60×10⁶ kg. It
is considered that Group 4 waste will not include organic material since incineration treatment will be
applied. Additionally, cement chemical admixtures (mainly water reducing agents) may include organic
material. Such admixtures are used in both the construction of cementitious filling materials and the
structural framework. The amount of the water-reducing agent is estimated to be about 0.3 - 3% of the
cement weight (Japan Concrete Admixture Association, 2003). According to a reported analysis of water-
reducing agent, the proportion of total organic carbon in the agent is estimated to be about 9 wt% (Iriya et
al., 2000). In addition to organic material in waste compounds and construction materials in the disposal
facility, natural organic material in groundwater such as humic materials is included.
4.4.6.2 Effects of organic materials from waste (1) Effect of cotton waste in Group 2 waste
Greenfield et al. (1992) measured the solubility of Pu in leachates of various organic materials in the
presence of cementitious material. In the leachates from organic materials such as nylon and polystyrene,
no increase in solubility was observed. However, in the leachate from cellulose solubility increased by
about seven orders of magnitude. Therefore, Iso-Saccharinic Acid (ISA) which is a degradation product of
cellulose is considered to be an important organic material in the assessment of nuclide migration.
Additionally, Bradbury and Sarott (1994) estimated a solubility enhanced factor (SEF) and a sorption
reducing factor (SRF) for use in nuclide migration analyses. SEF and SRF depend on the ISA concentration
and nuclide type. A conservative value for nuclide solubility can be calculated by multiplying its solubility
in the absence of ISA by SEF. Similarly, a conservative value for nuclide sorption coefficient can be
calculated by dividing the coefficient’s value in the absence of ISA by the SRF. In the case where the ISA
concentration is less than 1×10⁻⁶ mol/dm3, SEF and SRF are 1 for each nuclide, and increase in solubility
4-89
while decreases in sorption coefficients do not occur. As described before, the main component of organic
material in Group 2 waste is cellulosic material such as cotton waste. Hence, Honda and Mihara (2004)
evaluated the effect by assuming that organic material in Group 2 waste is all cellulose that decomposes
fully into ISA. The effect of ISA was re-evaluated using the latest estimated waste inventory because the
previous evaluation was based on the amount of material in the 1st TRU progress report. According to the
case for no release of ISA from the repository in the previous evaluation, the concentration of ISA in the
pore water of the facility was evaluated assuming the sorption of ISA onto cement hydrates. This case gave
the highest concentration of ISA because the transport of ISA to the outside was neglected and all the
cellulose was assumed to be broken down to ISA. This approach gave a maximum estimate of 5×10⁻⁶
mol/dm3 , which is more than the 1.0×10⁻⁶ mol/dm3 limit noted above. Therefore the effect of ISA should be
considered by the nuclide migration analysis.
(2) Effect of bitumen in Group 3 waste
If bitumen is degraded in the disposal environment and changes to soluble organic species, the species
might affect nuclide migration. Greenfield et al. (1997) perfomed leaching tests on bitumen for a period of
2 years. They used a liquid:solid ratio of 20:1, a low oxygen atmosphere and a liquid temperature of 80°C.
There were various environmental conditions with and without cementitious material and with NaNO3
concentrations of 0 - 3 mol/dm3. It was observed that the concentration of total organic carbon (TOC) in the
leachate was not dependent on the leaching time, suggesting that the leached organic compounds did not
result from the progressive decomposition of bitumen. The co-existance of concrete and NaNO3 did not
promote the decomposition of bitumen. A solubility test was performed using the leachate. The solubility of
Pu was not affected by the soluble organic species in the leachate, of which concentration reached to
several tens of ppm as TOC. Therefore they concluded that effective ligands for Pu are hardly generated in
reducing and alkaline environment. These results suggest that significant degradation of bitumen would not
occur in the disposal facility and that the impact of degradation of bitumen on nuclide solubility would not
be significant. Greenfield et al. (1997) also tested the degradation of bitumen by α-radiation. Under
low-oxygen conditions with co-existing cement, the solubility of Pu in the leachate from degraded bitumen
was measured and was found to be only 2×10-11 - 8×10⁻⁹ mol/dm3 and the effect of the leachate can
therefore be ignored. Additionally, Van Loon and Kopajtic (1990) performed a bitumen degradation test
using γ-emitters. They reported that the chemical form of soluble nuclides is not significantly changed.
Considering these findings, the chemical impact of bitumen degradation on nulcide migration is considered
to be small.
(3) Effect of solvent waste included in Group 3 waste
Bituminised waste classified in the Group 3 are solidified solvents that are used in reprocessing, including
TBP and its degradation products (DBP and MBP). These components may form complexes with
radionuclides and might affect nuclide solubilities and sorption distribution coefficients. Hence, complex
formation with these solvent components and their degradation materials have been evaluated (Shibata et
4-90
al., 2005). The evaluation of the effects of these waste solutions considers that complexes with U(Ⅳ) and
Pu(Ⅳ) in DBP are stronger than those with TBP in dilute nitric acid solution (1.0×10⁻² mol/dm3). It is also
considered that the amounts of TBP and MBP in that waste are less than the amount of DBP. Therefore
DBP was employed as a representative among TBP and its degradation products. The concentration of
these components in the waste solution is evaluated as 1.4×10⁻² mol/dm3 and all of them are assumed to be
DBP. Using the JAEA thermodynamic database, the solubilities of Ni(Ⅱ), Am(Ⅲ), Pu(Ⅳ), Th(Ⅳ) and
U(Ⅳ) were calculated over the range of DBP concentarationof 10-6 - 1 mol/dm3 in cement pore fluid.
However, in this region no effect on solubility was observed and the dominant chemical species were
hydroxyl species. The similar calculation was done for the outside of the disposal facility, using fresh
groundwater (FRHP). It was found that only the solubility of Ni increased when the DBP concentration was
above 10-2 mol/dm3. However, this DBP concentration corresponds to the concentration in pore water
within the waste packages. The concentration in the natural barrier will be lower than that in pore water in
waste packages and consequently is ignored. Max and Keiling (1989) measured the solubility of NaU2O7,
NpO2(OH), Pu(OH)4, AgI and CsNO3 in solutions that were saturated with TBP or DPB and equilibrated
with halite, cement degradation materials and Fe-oxyhydroxide. They confirmed that the exsistence of TBP
and DBP do not significantly affect the solubility. These experimental results also support the results of the
solubility calculations described previously.
4.4.6.3 Effect of cement additives The main cement additive used in the disposal facility is considered to be a water-reducing agent. This
agent was evaluated since it is a surface-active agent and can form complexes with radionuclides.
Greenfield et al. (1998) measured the solubilities of Pu, U, Am and Tc using cementitious leachate to which
a diluted high performance AE water-reducing agent was added. They reported that the solubility of each
nuclide increases with increasing concentration of high performance AE water-reducing agent
(naphthalenesulfonic acid system and polycarboxylate system). On the other hand, Ewart et al. (1991)
measured the sorption distribution coefficient of Pu using a cementitious solid phase to which one of four
types of water-reducing agents (naphthalenesulphonate, melamine formaldehyde, sodium lignosulphonate
and sodium gluconate) had been added. The results showed that the addition of these water-reducing agents
does not affect the sorption distribution coefficient of Pu.
The observations of Greenfield et al. (1998) and Ewart et al. (1991) gave different trends, which may
possibly have been caused by the differing chemical characteristics of the different agents used. However, it
is considered that this result may partly reflect different experimental conditions, i.e. Greenfield et al.
(1998) added water-reducing agent after the solid phase had been removed from the solution. However,
Ewart et al. (1991) added water-reducing agent during cement hydration and used leachate from the
solidified cement. Another difference is that Greenfield et al. (1998) peformed solubility measurements
without a cement solid phase being present, while Ewart et al. (1991) measured sorption distribution
coefficients in the presence of a co-exsisting cementitious solid phase.
4-91
For the case where the added water-reducing agent is sodium gluconate, Bradbury and Van Loon (1998)
calculated the concentration of the agent in cement pore water assuming the sorption of gluconic acid on
hardened cement paste. Since gluconic acid is sorbed onto the cement paste, the concentration in the pore
water was estimated to be 3×10⁻⁵ mol/dm3.
Generally, water-reducing agents commonly show a high degree of sorption onto solid cement phases
because of their original function. This explains why the experiments of Ewart et al. (1991) did not show
any significant effects of admixing. Moreover, the organic components that are leached from hardened
cement paste, to which a high performance AE water-reducing agent had been added, have quite different
molecular mass distributions from those of the original high performance AE water-reducing agent. The
latter is replaced by organic materials with lower molecular masses (Iriya et al., 2000). This phenomenon
also explains why the experimental results of Greenfield et al. (1998) and Ewart et al. (1991) are different.
Actually, the experimental conditions of Ewart et al. (1991) are more similar to conditions in a repository
than those of Greenfield. Based on their results, the effects are estimated to be small. Additionally, if the
difference of the results attributes to the difference of agents, the one that shows the smallest effect should
can be chosen, as demonstrated by the experimental results of Ewart et al. (1991).
4.4.6.4 Effects of natural organic material The types and concentrations of natural organic materials in groundwater are considered to depend on
location and the geological environment. However the geological conditions of the disposal site have not
been determined. Therefore the magnitude of the effect of natural organic material was understood from the
results of nuclide migration analyses which were conducted using a conservative distribution coefficient
based on actual examples of measurements as done in H12 report (JNC, 2000).
4.4.6.5 Summary Natural organic material was treated as in the H12 report and engineered organic materials (bitumen, waste
solutions, cellulose and cement additives) were evaluated. The following results were obtained:
・ From the current data, the effects of bitumen on the solubilities and sorption behaviour of nuclides
are small.
・ The impacts of waste solvents (TBP and DBP) on solubilities and sorption distribution coefficients,
are small.
・ It is estimated that the effects of cement additives in disposal facilities containing solid cement
phases are small. Additionally, it is possible to select admixing agents that would have only small
effects on nuclide behavior.
・ It is assumed that all the inseparable organic material in hulls and ends change into ISA. The
evaluation of nuclide migration is considered to be conservative if it is assumed that the
4-92
concentration of ISA in pore water in the disposal facility is 5×10⁻⁶ mol/dm3.
4.4.6.6 Future issues The following issues are considered to be important for future consideration:
・ Improvement of knowledge about the decomposition behaviour of organic materials present in waste
and concrete and the impacts of their degradation products on both barrier material and behaviour of
nuclides.
・ Evaluation of the promotion of redox reactions between bitumen and nitrate by the catalytic action
(e.g. microbial action).
4.4.7 Effects of microbes The anaerobic condition of the geological repository and the presence of cement will maintain a highly
alkaline environment (> pH 12.5) for a long period. Previously, it was considered that microbes would not
be active in such an environment but recent studies have revealed that, even at several hundred metres
depth, various microbes can be active under anaerobic conditions in neutral to mildly alkaline pH
conditions (Sasamoto et al., 1996; Murakami et al., 2003). Moreover, there have been reports of microbes
that are active in aerobic, highly alkaline environments (Horikoshi and Akiba, 1993) and extremely
anaerobic alkaline microbes that are active at pH 8.5 - 12.5 (Takai et al., 2001). Additionally, there are
reports that microbes which are active in neutral to alkaline environments adapted to higher alkaline
conditions with pH 12.5 (Fujiwara and Kawashima, 2002). Hence, the effects of microbial activity in a
geological repository for TRU waste cannot be ignored.
At present, research into the effects of microbes in waste repositories is being carried out in various
countries. A classification of these effects is summarized in Table 4.4.7-1. However, not all microbes
would affect all locations within a disposal facility for TRU waste. Instead, specific microbial activity
would occur only over certain periods and locations under which suitable environmental conditions for
specific microbes occur.
The factors that influence microbial activity in geological environments can be divided into primary
environmental factors of deep underground (microbe types, redox conditions, temperature, pressure, etc.)
and external factors (waste characteristics, structure of the disposal facility, organic material in the disposal
facility, etc.). The types of microbe that are active in the disposal environment depend strongly on the
geological environment of the disposal site. It is also considered that the external factors might change,
depending on the site characteristics. Hence, at present it is difficult to determine the above influencing
factors and to evaluate the microbial activities.
In Japan and in other countries, in order to evaluate the effects of microbes quantitatively, the rate of gas
generation and geochemical conditions have been modelled (Arter et al., 1991; Agg, 1993; Yim et al.,

4-93
1996; Humphreys et al., 1995; Wang and Papenguth, 1996; Kanno et al., 2004). However, as described
previously, it is difficult to decide on the input parameters at present because of uncertainty concerning the
influencing factors. Hence, the qualitative estimations based on the estimated environmental conditions and
an evaluation based on the material balance under conservative assumptions were conducted in this section.
Table 4.4.7-1 Effects of microbial activity
Process Phenomenon Degree
of influence
Complex formation ・Production of complexing agents
Colloid formation ・Behaviour of microbe as colloids ・Generation of colloids
N
pH change ・ Production of acid (organic/inorganic) ・Production of complexing agents
Oxidation-reduction reaction
・Consumption of oxygen ・Natural redox reactions ・Reduction of nuclides
Effect on solubility and soption
Sorption/incorporation of nuclides
・Nuclide sorption onto cell walls and cell membranes ・Incorporation of nuclides into cells ・ Coating of mineral surface by biological slime
N,P
Cementitious material alteration
・Alteration by acid production
Metal corrosion ・Direct metal corrosion ・Metal corrosion by metabolites
Bitumen alteration ・Biological decomposition
Effect on EBS (direct effect)
Bentonite alteration ・Alteration by metabolites
N
Effect on engineered and natural barriers (indirect effect)
Closure of pores ・Pore filling by biological slime ・Pores filling by metabolites
P
N Others Gas generation
・A biological gas generation ・A biological gas consumption P
N: Possibility that the process has negative impact on the safety of the disposal facility. P: Possibility that the process has positive effect on the safety of the disposal facility.

4-94
4.4.7.1 Microbial activity in a geological repository for TRU waste The materials which form the nutrients for microbial activity in each waste group are: cellulose in Group 2
waste (in JAEA waste about 0.1 wt% cotton; Kurakata et al., 1996), bitumen (waste solidification matrix),
nitrate salt (from fluids produced by the PUREX reprocessing method) , TBPs (TBP and the its degradation
products (DBP and MBP)) in Group 3 waste, and cement additives (water–reducing agents, etc.), natural
organic materials (humic substances, etc.) and inorganic salts (nitrate salts, sulfate salts etc.) from
groundwater in all the waste groups.
It is estimated that the accumulated inflow of humic substances from groundwater over a period of about
100,000 years will only be as much as about 1/10 (Groups 1 and 2)to about 1/25 (Groups 3 and 4) of the
amounts in the cement additives, even if it is assumed that the disposal facility becomes more permeable.
Additionally, humic substances are the final decomposition products of microbial activity. Thus, it is
considered that humic substances are difficult for microbes to metabolise and decompose (e.g. EIC net,
2005). Furthermore, if humic substances are metabolised and decomposed, the effects would be similar to
those induced by microbial metabolism of the cement additives, etc. Hence, if the effects of microbial
metabolism of cement additives, etc. are considered, the effects of microbial metabolism of the humic
substances can be ignored.
The studies of denitrifying bacteria, sulphate-reducing bacteria (SRB) and methanogens, etc. deep
underground have been reported (Motamedi and Pedersen, 1998; Kotelnikova et al., 1998; Chang et al.,
2001; Naganuma et al., 2002). It is considered that denitrifying bacteria, SRB, methanogens, and bacteria
that can decompose cement additives, cellulose, bitumen and TBPs. would be important in a geological
repository for TRU waste. The substrates and microbial activities in a geological repository are summarised
in Table 4.4.7-2.
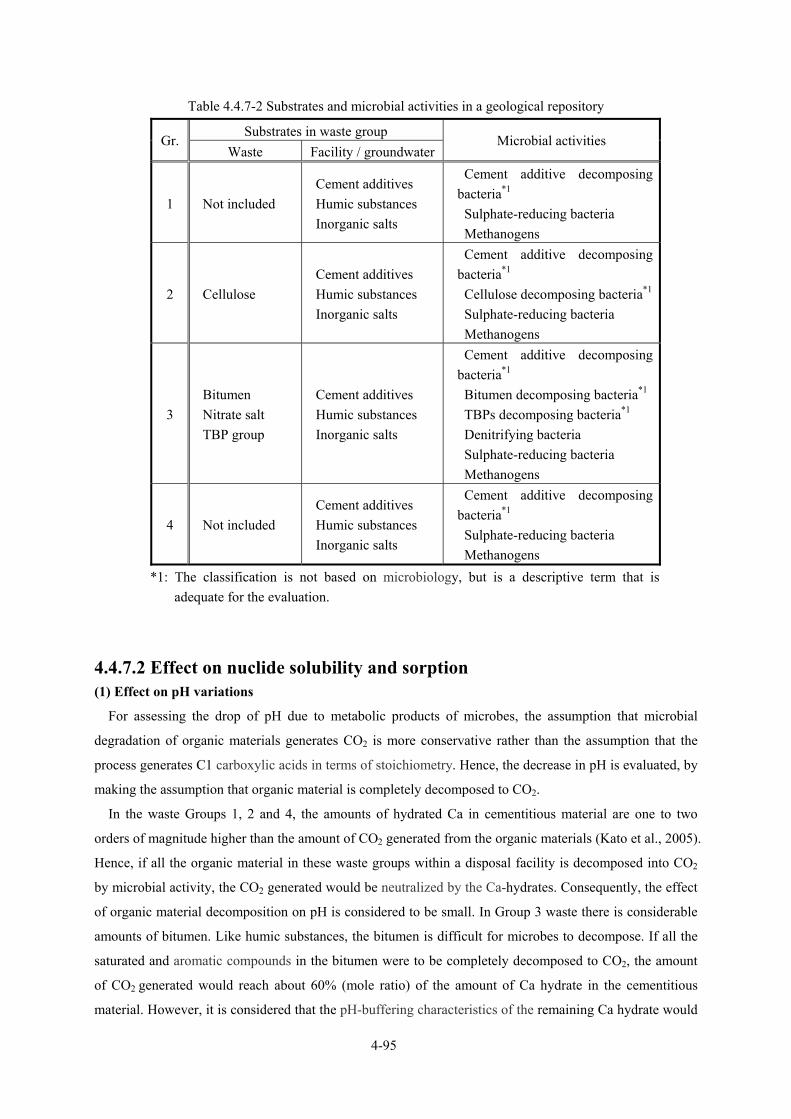
4-95
Table 4.4.7-2 Substrates and microbial activities in a geological repository
Substrates in waste group Gr.
Waste Facility / groundwaterMicrobial activities
1 Not included Cement additives Humic substances Inorganic salts
Cement additive decomposing bacteria*1 Sulphate-reducing bacteria Methanogens
2 Cellulose Cement additives Humic substances Inorganic salts
Cement additive decomposing bacteria*1 Cellulose decomposing bacteria*1 Sulphate-reducing bacteria Methanogens
3 Bitumen Nitrate salt TBP group
Cement additives Humic substances Inorganic salts
Cement additive decomposing bacteria*1 Bitumen decomposing bacteria*1 TBPs decomposing bacteria*1 Denitrifying bacteria Sulphate-reducing bacteria Methanogens
4 Not included Cement additives Humic substances Inorganic salts
Cement additive decomposing bacteria*1 Sulphate-reducing bacteria Methanogens
*1: The classification is not based on microbiology, but is a descriptive term that is adequate for the evaluation.
4.4.7.2 Effect on nuclide solubility and sorption (1) Effect on pH variations
For assessing the drop of pH due to metabolic products of microbes, the assumption that microbial
degradation of organic materials generates CO2 is more conservative rather than the assumption that the
process generates C1 carboxylic acids in terms of stoichiometry. Hence, the decrease in pH is evaluated, by
making the assumption that organic material is completely decomposed to CO2.
In the waste Groups 1, 2 and 4, the amounts of hydrated Ca in cementitious material are one to two
orders of magnitude higher than the amount of CO2 generated from the organic materials (Kato et al., 2005).
Hence, if all the organic material in these waste groups within a disposal facility is decomposed into CO2
by microbial activity, the CO2 generated would be neutralized by the Ca-hydrates. Consequently, the effect
of organic material decomposition on pH is considered to be small. In Group 3 waste there is considerable
amounts of bitumen. Like humic substances, the bitumen is difficult for microbes to decompose. If all the
saturated and aromatic compounds in the bitumen were to be completely decomposed to CO2, the amount
of CO2 generated would reach about 60% (mole ratio) of the amount of Ca hydrate in the cementitious
material. However, it is considered that the pH-buffering characteristics of the remaining Ca hydrate would
4-96
be maintained (Kato et al., 2005). Additionally, the activity of TBPs-degrading bacteria might cause
generation of free phosphoric acid. However, phosphoric ion is precipitated as insoluble hydroxyapatite
〔Ca10(PO4)6(OH)2〕, causing the ion’s concentration in pore water to decrease to about 10-6mol/dm3 (Takei
et al., 2002). The amount of phosphoric acid that is released by microbial decomposition of TBPs is about 5
orders of magnitude lower than the amount of Ca hydrate the cementitious material. Hence, changes in the
amount of phosphoric acid that is generated by TBPs composition, is considered to have only a small effect
on pH.
(2) Effect on complex formation
The metabolic products of bacteria such as decomposed cement additives,cellulose,bitumen and TBPs,
might act as complexing agents. However, there is little knowledge about the microbial metabolism of
organic material in a repository. Consequently, the evaluation of complex formation between radionuclides
and metabolic products of microbes is difficult. Complex formation with organic material that originates
from cotton in Group 2 waste is evaluated by assuming that the all the organic material is cellulose and that
it is completely decomposed to ISA. The results are reflected in the analysis of nuclide migration(Section
4.4.6).
Hence, the formation of complexes between nuclides and microbial metabolites of organic materials,
except for cellulose, is an issue for future consideration.
(3) Effects of colloid formation, nuclide sorption and incorporation
In a disposal facility where buffer material is used, colloids will be formed by microbial activity
(including microbes that sorb or contain nuclides) have no negative influence by filtration effect of buffer
material during the period while a buffer performance is maintained. In contrast, there is little knowledge
concerning colloid generation by microbes when the buffer material is altered and the filtration capability is
lost. There is also little knowledge about the effects of colloids produced by microbes in disposal facilities
without buffer material. Evaluation of these matters is difficult. Hence, the effects of colloid formation by
microbial activity are an issue for future consideration.
(4) Effects of changing redox conditions
The disposal environment becomes anaerobic owing to the activity of aerobic microbes and the
consumption of oxidized chemical species by metal corrosion etc. after the facility’s closure. After the
establishment of an anaerobic environment, suitable microbes for the temporal redox condition will
dominate the microbial activity in the repository during period of time in which the original redox
condition deep underground is recovered. Microbial activities can promote the recovery of the reducing
condition by consuming oxidising species but do not generate an oxidising condition. Therefore the
negative impact of microbial activity on the solubility and sorption of nuclides by changing the redox
condition is considered to be negligible.

4-97
4.4.7.3 Effects on the engineered and natural barriers (1) Effect of alteration of cementitious material
As described above in Section 4.4.7.2(1), for all the waste groups, the total amount of CO2 which is
generated from included organic material is smaller than the amount of Ca hydrate in cementitious material.
Additionally, phosphoric ions in Group 3 is precipitated as insoluble hydroxyapatite. Such neutralization
and precipitation reactions result in leaching of Ca. However, except for Group 3 waste, the amount of Ca
hydrate in the cementitious material is more than 1 or 2 orders larger than the amounts leached. Hence, the
influence on the alteration of cementitious material is considered to be small except in the disposal tunnels
for Group 3 waste. The metabolism and decomposition of bitumen by microbes does not occur over a short
period. As described before, these are considered to be long-term reactions because the bitumen consists of
organic material that cannot be used easily by microbes. However, eventually about 60%(mole ratio)of the
Ca hydrates in cementitious material can combine with CO2 generated from bitumen (Kato et al., 2005). It
is considered that this process will affect significantly the use of cementitious material as a general
construction material. However, since the required capabilities of cementitious material for long-term are
pH buffering and nuclide sorption, predictive evaluations were performed for the case where CO2 is
generated from bitumen quickly. The results showed that cementitious material from which 60% of Ca is
leached and is precipitated as CaCO3 by reacting with CO2 originating from bitumen, keeps pH within
Region III. The dose was almost the same as that of the reference case even when the nuclide migration
analysis was performed with Region III conditions maintained throughout (Kato et al., 2005). Hence, these
effects on nuclide migration are considered to be small.
(2) Effect on metal corrosion
It is considered that the effects of organic acid and phosphoric acid on metal corrosion are small since
these acids, which are generated by microbes, are neutralized by Ca hydrates in cementitious material.
Additionally, the activity of SRB is inhibited in compacted bentonite (Nishimura et al., 1999).
Moreover, in experimental simulations, there is no difference in the corrosion rate of carbon steel when
there is H2S gas purging (the simulation case in which SRB are active) or when there is nitrogen gas
purging (the simulation case in which SRB are not active; Taniguchi et al., 2001). Hence, if SRB activity
is assumed to occur, it is considered that the effects on metal corrosion and gas generation resulting from
corrosion are small.
(3) Effect on bitumen alteration
There is little knowledge concerning the effect of microbes on the nuclide containment properties of
bitumen, which is used as a matrix to solidify radioactive liquid waste. It is therefore difficult to evaluate
the significance of this alteration.
(4) Effect on bentonite alteration
It is considered that organic cations that are generated by microbial activity enter into the inter-layer of
4-98
smectite. Since smectite is the main mineral composing the bentonite, the bentonite’s capabilities are
changed. Organic cations are mostly nitrogen compounds, and especially, amine compounds
(Kagaku-Daijiten-Henshu-Iinkai, 1987). However, Group 1 and 2 wastes in disposal facilities that include
bentonite buffer materials, contain only small amounts of organic matrices, and nitrogen compounds are
not taken into the repository. Moreover, it is reported that the concentrations of natural nitrogen-bearing
organic material in groundwater is small (Nagao, 1995; JNC, 2000). Furthermore, cement additives that do
not contain nitrogen compounds can be selected. Hence, there is considered to be little possibility that
organic cations generated by microbes enter into the inter-layer of smectite and change the capabilities of
the bentonite. Moreover, as described in Section 4.4.7.2(1), extreme pH variations are not caused by
microbes. Therefore there is also little possibility that there will be alteration of bentonite owing to
microbially mediated pH changes.
(5) Effect on porosity filling
The formation of biofilms and CaCO3 can fill the pores of the disposal system. There is also a possibility
that this process would restrict the transportation of groundwater. Hence, void sealing by microbial activity
works dominantly to enhance the confinement function of disposal system.
4.4.7.4 Effect on gas generation The main gases generated by microbial activity in the disposal environment are CO2 (total microbial
activity) and N2 (activity of denitrifying bacteria). In the repository environment CO2 is fixed as CaCO3.
Since the amount of Ca hydrate in the cementitious material is larger than the amount of CO2 generated
(Kato et al., 2005), the effect of CO2 generation on the disposal system in terms of impacts of gas
generation is considered to be small. Additionally, there is a possibility that CH4 is generated. The impacts
of the previous gas generation process by microbial activities is included in evaluation of both the effects of
the gas generation (Section 4.4.10) and the nitrate salt effect (Section 4.4.9.).
In the case that methanogens are present, it is possible that radioactive gas species containing 14C (14CH4)
are generated. A nuclide migration analysis for the case in which all the C-14 becomes CH4 is described in
Section 4.4.10.
4.4.7.5 Summary It is considered that the following effects of microbial activity have little impact on the safety of the
geological repository for TRU waste: the effects of pH variation; redox reactions; alteration of cementitious
materials; metal corrosion; bitumen alteration; bentonite alteration; void sealing; and gas generation(except
for 14CH4 generation). The impacts of complexation with metabolic products on solubility and sorption
behaviour of nuclides, colloid formation (including the colloidal behaviour of microbes) and the generation
of radioactive gases containing 14C are considered to be issues for future consideration.
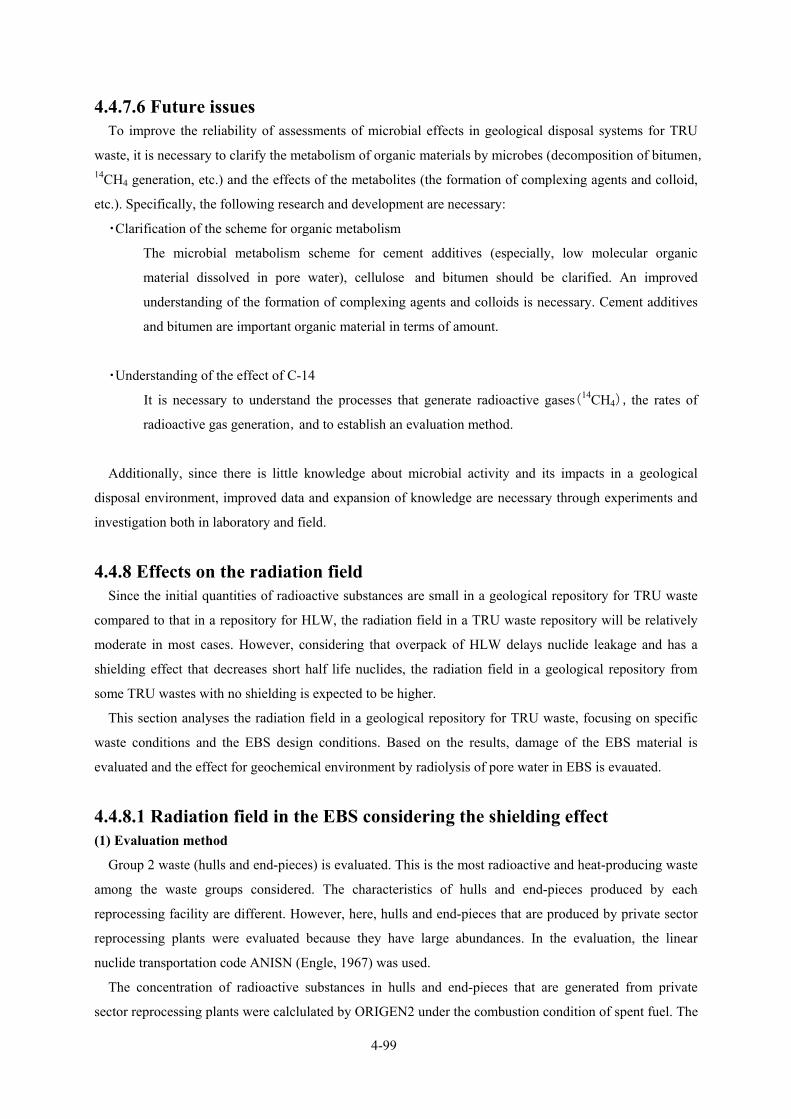
4-99
4.4.7.6 Future issues To improve the reliability of assessments of microbial effects in geological disposal systems for TRU
waste, it is necessary to clarify the metabolism of organic materials by microbes (decomposition of bitumen,
14CH4 generation, etc.) and the effects of the metabolites (the formation of complexing agents and colloid,
etc.). Specifically, the following research and development are necessary:
・Clarification of the scheme for organic metabolism
The microbial metabolism scheme for cement additives (especially, low molecular organic
material dissolved in pore water), cellulose and bitumen should be clarified. An improved
understanding of the formation of complexing agents and colloids is necessary. Cement additives
and bitumen are important organic material in terms of amount.
・Understanding of the effect of C-14
It is necessary to understand the processes that generate radioactive gases(14CH4),the rates of
radioactive gas generation,and to establish an evaluation method.
Additionally, since there is little knowledge about microbial activity and its impacts in a geological
disposal environment, improved data and expansion of knowledge are necessary through experiments and
investigation both in laboratory and field.
4.4.8 Effects on the radiation field Since the initial quantities of radioactive substances are small in a geological repository for TRU waste
compared to that in a repository for HLW, the radiation field in a TRU waste repository will be relatively
moderate in most cases. However, considering that overpack of HLW delays nuclide leakage and has a
shielding effect that decreases short half life nuclides, the radiation field in a geological repository from
some TRU wastes with no shielding is expected to be higher.
This section analyses the radiation field in a geological repository for TRU waste, focusing on specific
waste conditions and the EBS design conditions. Based on the results, damage of the EBS material is
evaluated and the effect for geochemical environment by radiolysis of pore water in EBS is evauated.
4.4.8.1 Radiation field in the EBS considering the shielding effect (1) Evaluation method
Group 2 waste (hulls and end-pieces) is evaluated. This is the most radioactive and heat-producing waste
among the waste groups considered. The characteristics of hulls and end-pieces produced by each
reprocessing facility are different. However, here, hulls and end-pieces that are produced by private sector
reprocessing plants were evaluated because they have large abundances. In the evaluation, the linear
nuclide transportation code ANISN (Engle, 1967) was used.
The concentration of radioactive substances in hulls and end-pieces that are generated from private
sector reprocessing plants were calclulated by ORIGEN2 under the combustion condition of spent fuel. The
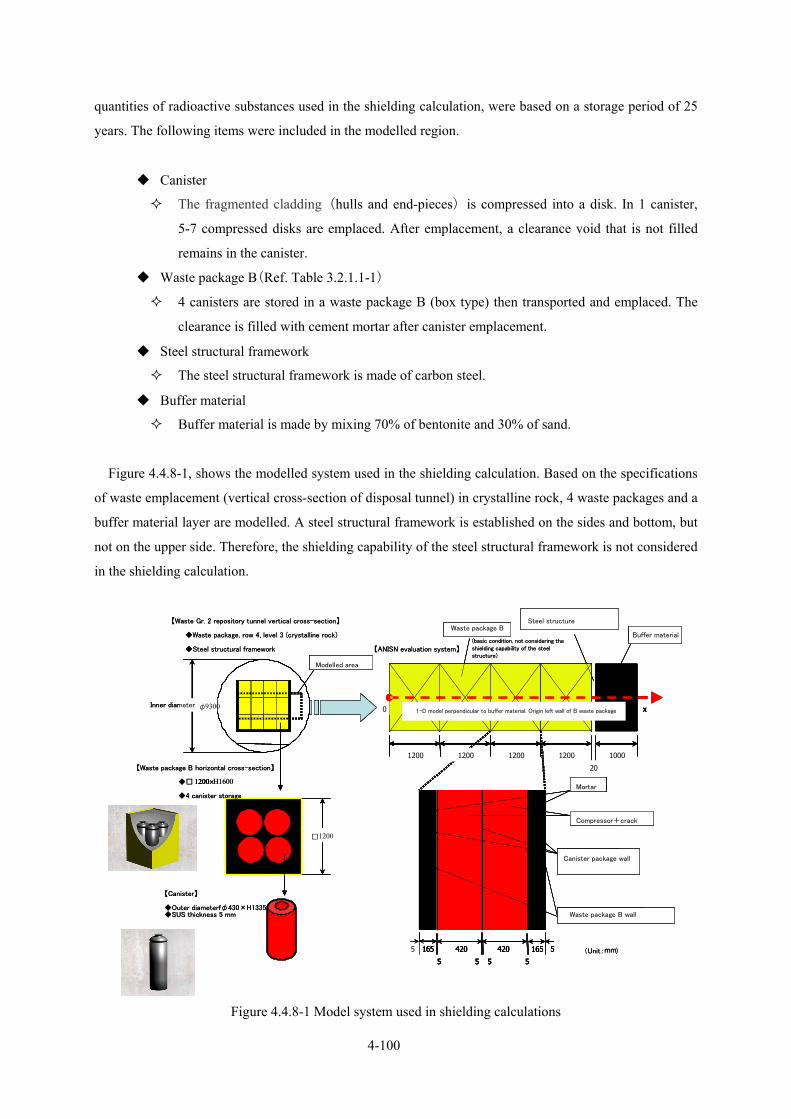
4-100
quantities of radioactive substances used in the shielding calculation, were based on a storage period of 25
years. The following items were included in the modelled region.
Canister
The fragmented cladding (hulls and end-pieces) is compressed into a disk. In 1 canister,
5-7 compressed disks are emplaced. After emplacement, a clearance void that is not filled
remains in the canister.
Waste package B(Ref. Table 3.2.1.1-1)
4 canisters are stored in a waste package B (box type) then transported and emplaced. The
clearance is filled with cement mortar after canister emplacement.
Steel structural framework
The steel structural framework is made of carbon steel.
Buffer material
Buffer material is made by mixing 70% of bentonite and 30% of sand.
Figure 4.4.8-1, shows the modelled system used in the shielding calculation. Based on the specifications
of waste emplacement (vertical cross-section of disposal tunnel) in crystalline rock, 4 waste packages and a
buffer material layer are modelled. A steel structural framework is established on the sides and bottom, but
not on the upper side. Therefore, the shielding capability of the steel structural framework is not considered
in the shielding calculation.
【Waste package B horizontal cross-section】
1200×H1600
内径φ9300
1200
Outer diameterfφ430×H1335
モデル化する領域
1200 1200 1200 1200 1000
20
緩衝材
5 420165 420 165 5
5555
モルタル
廃棄体パッケージB容器壁
キャニスタ容器壁
圧縮体+隙間
左端の廃棄体パッケージB容器壁を始点に右方向へ緩衝材まで直交1次元0 x
【Waste Gr. 2 repository tunnel vertical cross-section】
Waste package, row 4, level 3 (crystalline rock)
Steel structural framework
1200
4 canister storage
Inner diameter φ9300
1200
【Canister】
SUS thickness 5 mm
Modelled area
1200 1200 1200 1200 10001200 1200 1200 1200 1000
20
Waste package BSteel structure
Buffer material
5 420165 420 165 5
5555
Mortar
Waste package B wall
Canister package wall
Compressor+crack
1-D model perpendicular to buffer material. Origin left wall of B waste package0 x
【ANISN evaluation system】(basic condition, not considering the shielding capability of the steel structure)
(Unit:mm)
【Waste package B horizontal cross-section】
1200×H1600
内径φ9300
1200
Outer diameterfφ430×H1335
モデル化する領域
1200 1200 1200 1200 10001200 1200 1200 1200 1000
20
緩衝材
5 420165 420 165 5
5555
モルタル
廃棄体パッケージB容器壁
キャニスタ容器壁
圧縮体+隙間
左端の廃棄体パッケージB容器壁を始点に右方向へ緩衝材まで直交1次元0 x
【Waste Gr. 2 repository tunnel vertical cross-section】
Waste package, row 4, level 3 (crystalline rock)
Steel structural framework
1200
4 canister storage
Inner diameter φ9300
1200
【Canister】
SUS thickness 5 mm
Modelled area
1200 1200 1200 1200 10001200 1200 1200 1200 1000
20
Waste package BSteel structure
Buffer material
5 420165 420 165 5
5555
Mortar
Waste package B wall
Canister package wall
Compressor+crack
1-D model perpendicular to buffer material. Origin left wall of B waste package0 x
【ANISN evaluation system】(basic condition, not considering the shielding capability of the steel structure)
(Unit:mm)
Figure 4.4.8-1 Model system used in shielding calculations

4-101
(2) Evaluation result
The spatial distributions of the air-kerma rate in the model system at 1 year and 1,000 years are shown in
Figure 4.4.8-2. Though the shielding calculation is aimed at primary γ-rays, secondary γ-rays and neutron
radiation, the contribution by primary γ-rays is most significant. When the air-kerma rate after 1,000 years
is compared with that at 1 year in the same figure, it is seen that there is no significant change in spatial
distribution, though a decrease of 2 orders of magnitude. Moreover, in the model system in which 4 waste
packages of type B are included, the air-kerma rate in each waste package B is almost the same and the 4
packages show almost the same air-kerma rate distribution.
A comparison between the absorbed dose rate on the surface of 19 cm thick overpack surrounding HLW
canister (JNC, 2000) and that on the surface of waste package B, without overpack, is shown in Table
4.4.8-1. Although the HLW has greater quantities of included radioactive substances, the lack of overpack
means that hulls and end-pieces in TRU waste give a γ-ray absorbed dose rate that is 3 orders of magnitude
higher.
Table 4.4.8-1 Comparison of absorbed dose rate on waste surfaces
[Gy/y]
HLW TRU waste
γ-ray ~3×101 ~4×10⁴
Neutron
radiation ~4×10⁻¹ ~5×10⁻¹
HLW condition:50 years storage,thickness of overpack 19cm,
value at overpack surface
TRU waste condition:25 years storage,without overpack,
value at surface of waste package B
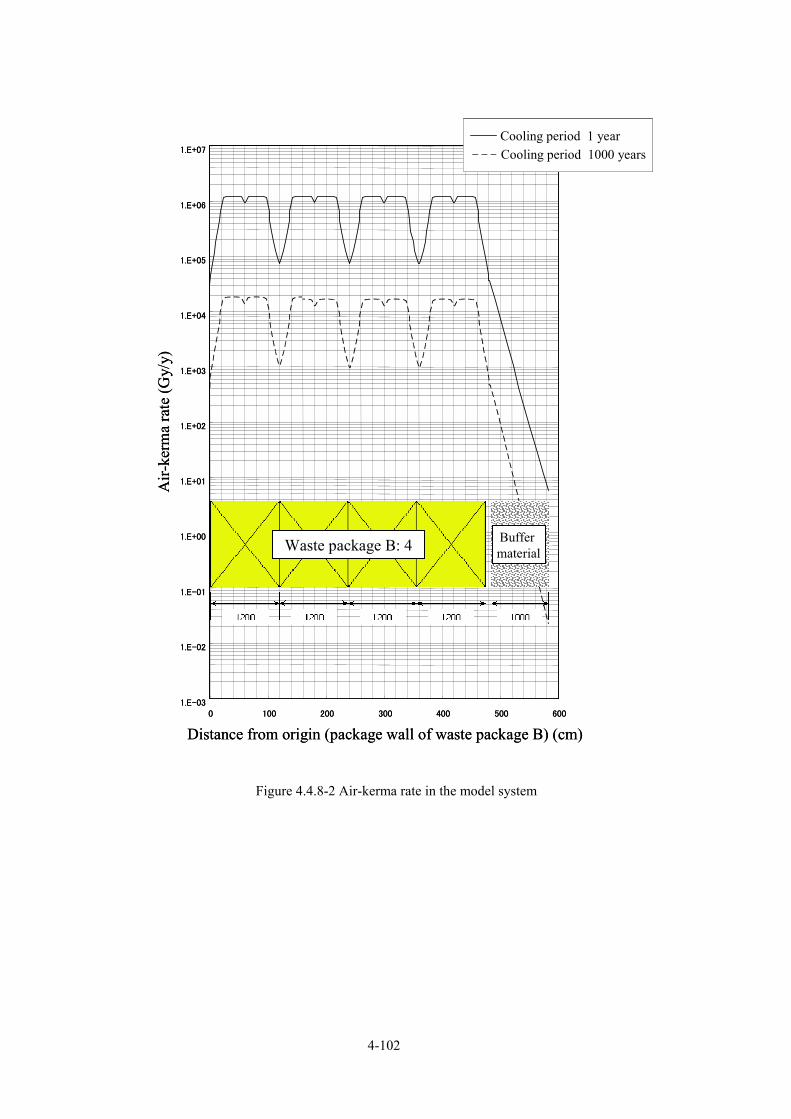
4-102
Figure 4.4.8-2 Air-kerma rate in the model system
1.E-03
1.E-02
1.E-01
1.E+00
1.E+01
1.E+02
1.E+03
1.E+04
1.E+05
1.E+06
1.E+07
0 100 200 300 400 500 600
Distance from origin (package wall of waste package B) (cm)
Air-
kerm
a ra
te(G
y/y)
Cooling period 1 yearCooling period 1000 years
Waste package B: 4 Buffer material
1.E-03
1.E-02
1.E-01
1.E+00
1.E+01
1.E+02
1.E+03
1.E+04
1.E+05
1.E+06
1.E+07
0 100 200 300 400 500 600
Distance from origin (package wall of waste package B) (cm)
Air-
kerm
a ra
te(G
y/y)
Cooling period 1 yearCooling period 1000 yearsCooling period 1 yearCooling period 1000 years
Waste package B: 4 Buffer material
4-103
4.4.8.2 Exposure damage to EBS material (1) Cementituous material
From experimental results, the radiation effect on cementituous material which is used as a solidified
matrix or grout is reported to be 9-12 MGy of γ-exposure as follows (Wilding et al., 1991):
・ In most samples significant changes were not observed.
・ In some samples, discoloration on surfaces was observed.
・ In the case of BFS/OPC grout, denudation,fracturing and deformation were observed.
In addition, from experimental results, the radiation effect on cementituous material which is used in
reinforced concrete is reported to be a maximum of 1.7×10⁸Gy of γ-exposure as follows(Yamada et al.,
1984).
・ There is a decrease of about 10% in compressive strength under heating conditions. However, there
is no significant difference between experimental heating and heating by γ-exposure. Hence, the
decrease of compressive strength owing to heating is more significant than the decrease caused by
exposure damage.
・ Since the elastic modulus is sensitive to the effect of temperature and moisture content, the dynamic
elastic modulus is decreased more due to the effect of air curing or heating than as a result of
γ-exposure.
・ From the measurement of neutralization depths, there is no difference in the degree of neutralization
with and without of γ-exposure.
・ The pore sizes of cement pastes with 55% of water/cement ratio which undergo air curing and
γ-exposure shows almost same the distribution and there is no significant difference in the amounts
of all pore sizes.
From existing knowledge, it is considered that exposure damage is insignificant. The amount of
absorbed dose by the cement mortar is almost the same or more smaller than that of the total amount of
radiation in the current study (ca. 30MGy in 1,000 years, ref. Figure 4.4.8-3). Even if the exposure is
continued for the long term, the overall cement mortar performance will be maintained though there may be
some local changes near the surfaces of canisters.
(2) Bentonite material
The radiation effect on the smectite structure of bentonite material generally does not result in significant
structural alteration (e.g., Ewing, 1984).
Pusch et al. (1993) report that, in exposure experiments using Co-60 and MX-80, there is no significant
change in the smectite structure (until 3.27×10⁷Gy). However, the loss of feldspar and the alteration of
small montmorillonite grains are also reported.
Based on 9.5×10⁷Gy γ-exposure experiments, it is reported that there is no significant effect on the
hydrogeological properties of bentonite (Grauer, 1986). It is also reported that the ion exchange capacity of
montmorillonite is increased during experimental exposure to γ-rays, using Co-60, until a maximum of
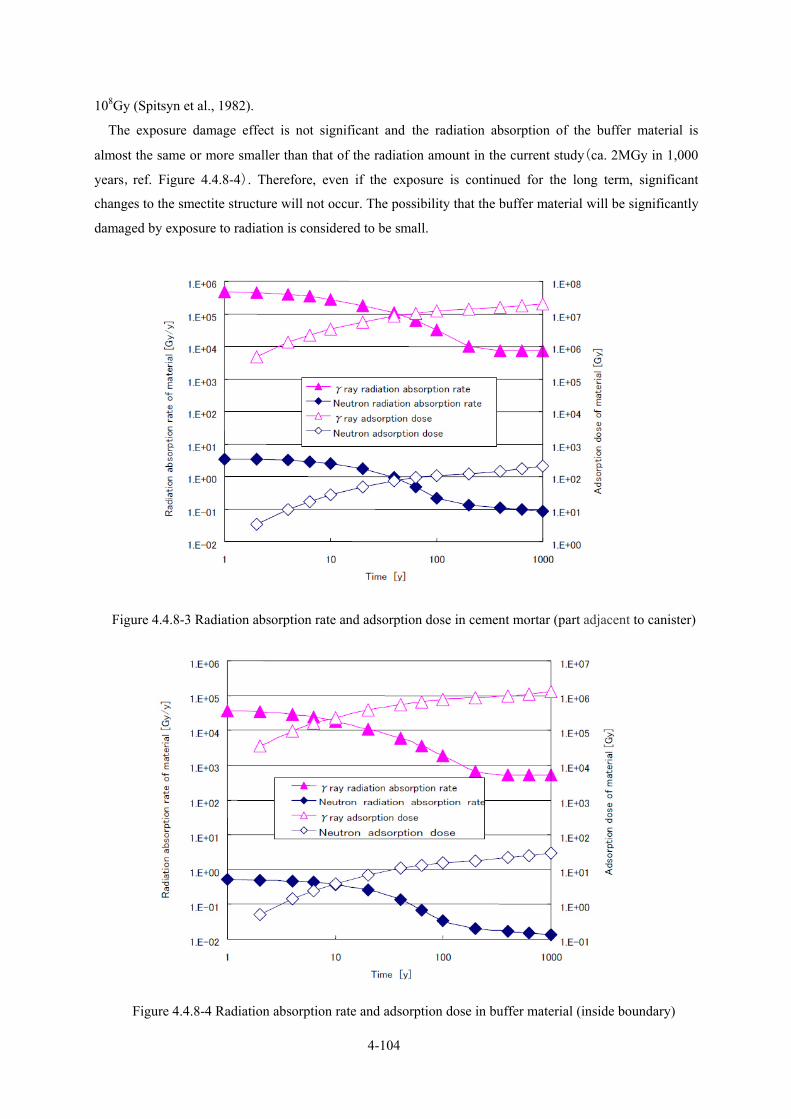
4-104
108Gy (Spitsyn et al., 1982).
The exposure damage effect is not significant and the radiation absorption of the buffer material is
almost the same or more smaller than that of the radiation amount in the current study(ca. 2MGy in 1,000
years,ref. Figure 4.4.8-4). Therefore, even if the exposure is continued for the long term, significant
changes to the smectite structure will not occur. The possibility that the buffer material will be significantly
damaged by exposure to radiation is considered to be small.
Figure 4.4.8-3 Radiation absorption rate and adsorption dose in cement mortar (part adjacent to canister)
Figure 4.4.8-4 Radiation absorption rate and adsorption dose in buffer material (inside boundary)
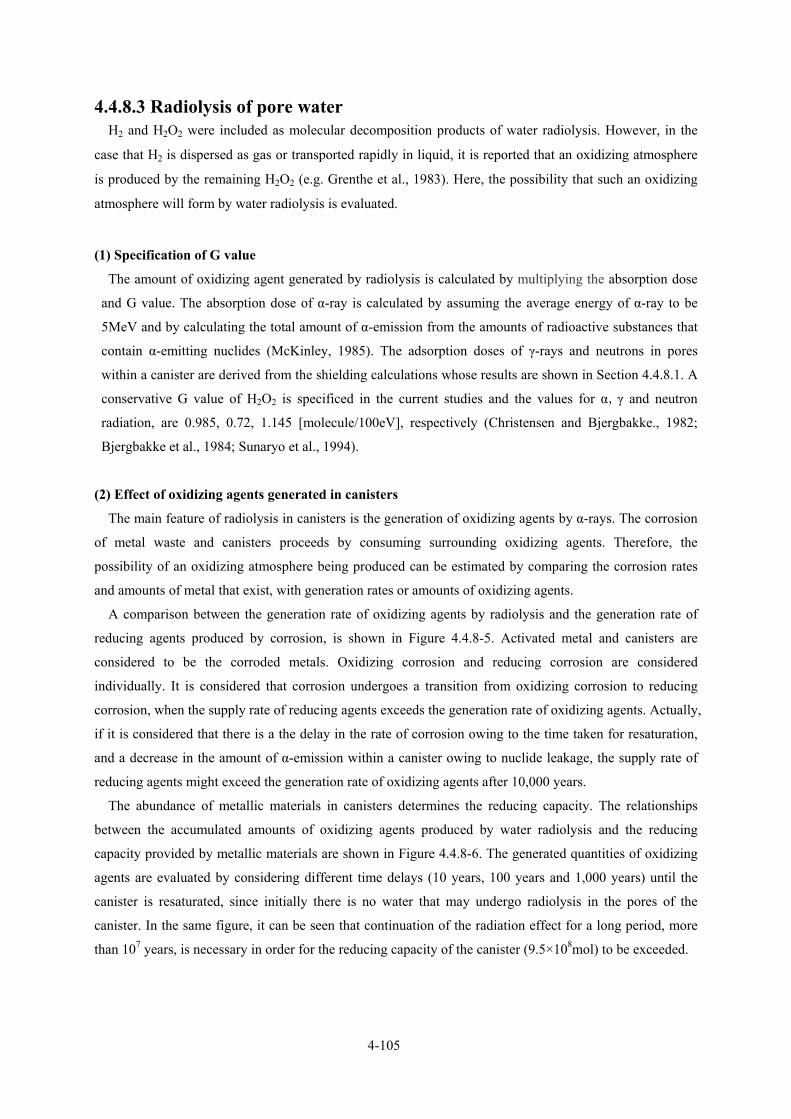
4-105
4.4.8.3 Radiolysis of pore water H2 and H2O2 were included as molecular decomposition products of water radiolysis. However, in the
case that H2 is dispersed as gas or transported rapidly in liquid, it is reported that an oxidizing atmosphere
is produced by the remaining H2O2 (e.g. Grenthe et al., 1983). Here, the possibility that such an oxidizing
atmosphere will form by water radiolysis is evaluated.
(1) Specification of G value
The amount of oxidizing agent generated by radiolysis is calculated by multiplying the absorption dose
and G value. The absorption dose of α-ray is calculated by assuming the average energy of α-ray to be
5MeV and by calculating the total amount of α-emission from the amounts of radioactive substances that
contain α-emitting nuclides (McKinley, 1985). The adsorption doses of γ-rays and neutrons in pores
within a canister are derived from the shielding calculations whose results are shown in Section 4.4.8.1. A
conservative G value of H2O2 is specificed in the current studies and the values for α,γ and neutron
radiation, are 0.985, 0.72, 1.145 [molecule/100eV], respectively (Christensen and Bjergbakke., 1982;
Bjergbakke et al., 1984; Sunaryo et al., 1994).
(2) Effect of oxidizing agents generated in canisters
The main feature of radiolysis in canisters is the generation of oxidizing agents by α-rays. The corrosion
of metal waste and canisters proceeds by consuming surrounding oxidizing agents. Therefore, the
possibility of an oxidizing atmosphere being produced can be estimated by comparing the corrosion rates
and amounts of metal that exist, with generation rates or amounts of oxidizing agents.
A comparison between the generation rate of oxidizing agents by radiolysis and the generation rate of
reducing agents produced by corrosion, is shown in Figure 4.4.8-5. Activated metal and canisters are
considered to be the corroded metals. Oxidizing corrosion and reducing corrosion are considered
individually. It is considered that corrosion undergoes a transition from oxidizing corrosion to reducing
corrosion, when the supply rate of reducing agents exceeds the generation rate of oxidizing agents. Actually,
if it is considered that there is a the delay in the rate of corrosion owing to the time taken for resaturation,
and a decrease in the amount of α-emission within a canister owing to nuclide leakage, the supply rate of
reducing agents might exceed the generation rate of oxidizing agents after 10,000 years.
The abundance of metallic materials in canisters determines the reducing capacity. The relationships
between the accumulated amounts of oxidizing agents produced by water radiolysis and the reducing
capacity provided by metallic materials are shown in Figure 4.4.8-6. The generated quantities of oxidizing
agents are evaluated by considering different time delays (10 years, 100 years and 1,000 years) until the
canister is resaturated, since initially there is no water that may undergo radiolysis in the pores of the
canister. In the same figure, it can be seen that continuation of the radiation effect for a long period, more
than 107 years, is necessary in order for the reducing capacity of the canister (9.5×10⁸mol) to be exceeded.
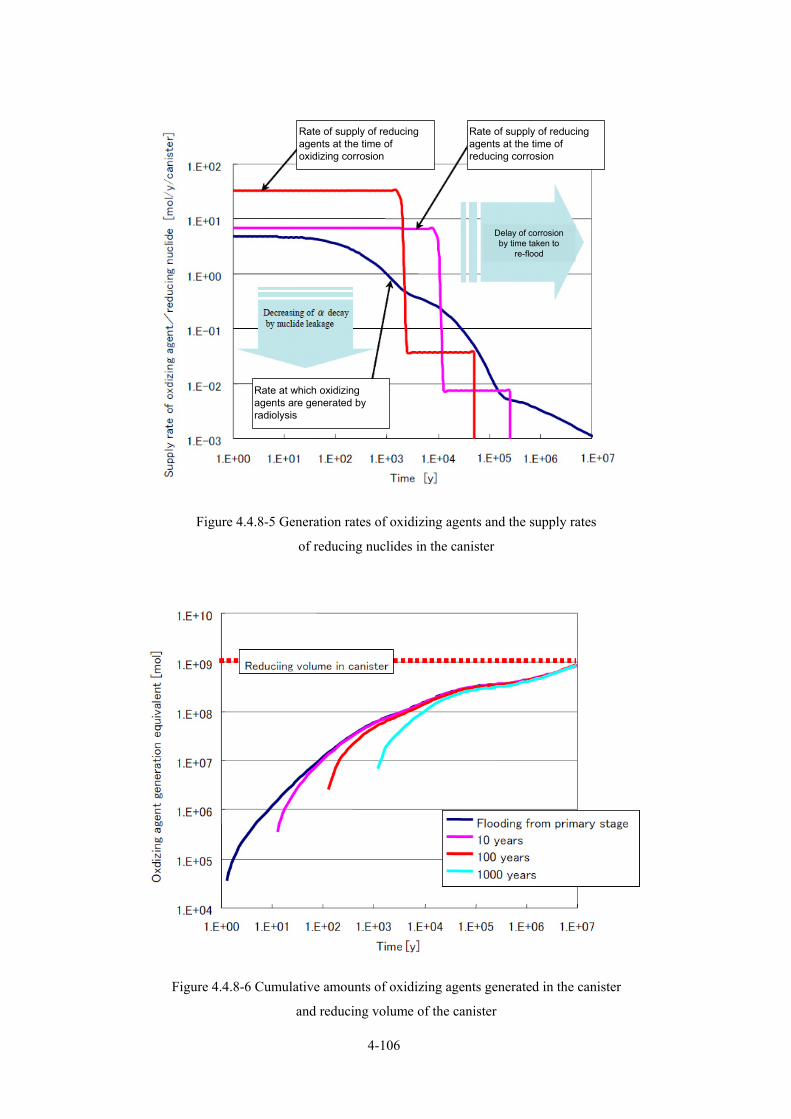
4-106
Figure 4.4.8-5 Generation rates of oxidizing agents and the supply rates
of reducing nuclides in the canister
Figure 4.4.8-6 Cumulative amounts of oxidizing agents generated in the canister
and reducing volume of the canister
Rate of supply of reducing agents at the time of oxidizing corrosion
Rate of supply of reducing agents at the time of reducing corrosion
Rate at which oxidizing agents are generated by radiolysis
Delay of corrosion by time taken to
re-flood
Rate of supply of reducing agents at the time of oxidizing corrosion
Rate of supply of reducing agents at the time of reducing corrosion
Rate at which oxidizing agents are generated by radiolysis
Delay of corrosion by time taken to
re-flood

4-107
(3) Effects of oxidizing agent generation in mortar and buffer material
Oxidizing agents generated by γ-ray penetration are the main feature of radiolysis of mortar and buffer
material. The space-time distributions of concentrations of oxidizing agents in these areas are shown as
follows:
(Mortar: mLx <≤0 )
)exp()(),(),(2
2
xtRx
txCDt
txCmmm λ−⋅+
∂∂
=∂
∂ (4.4.8-1)
(Buffer material: bmm LLxL +≤< )
),('4
15)exp()(),(),(2
2
txCVSAkxtR
xtxCD
ttxC
bbb −−⋅+∂
∂=
∂∂ λ (4.4.8-2)
),(100
)()( bmi
AvtGE
tR iii ==
ε (4.4.8-3)
(Boundary condition)
bmm LLLxattxC +== ,,00),( (4.4.8-4)
),( txC :Concentration of oxidizing agent [mol/m3]
iD :Effective diffusion coefficient of the medium i [m2/s]
iλ :Linear absorption coefficient at medium i [1/m]
'k :Rate constant for oxidizing agent loss by pyrite oxidation [m/s]
SA :Surface area of pyrite [m2]
V :Volume of pore water[m3]
iε :Porosity of medium i [m2/s]
G :G value of oxidizing agent generation [molecule/100eV]
)(tEi :Absorption dose of pore water in medium i [eV/(m3 s)]
Av :Avogadro's number [molecule/mol]
In the area of the buffer material, loss of pyrite by oxidition is considered as well as diffusion migration
of the oxidizing agent and generation of oxidizing agents by γ-ray penetration.
These formulae are analyzed using the conditions in Table 4.4.8-2, and concentrations of oxdizing agents
generated by radiolysis in mortar and buffer materials are evaluated. The results are shown in Figure
4.4.8-7.
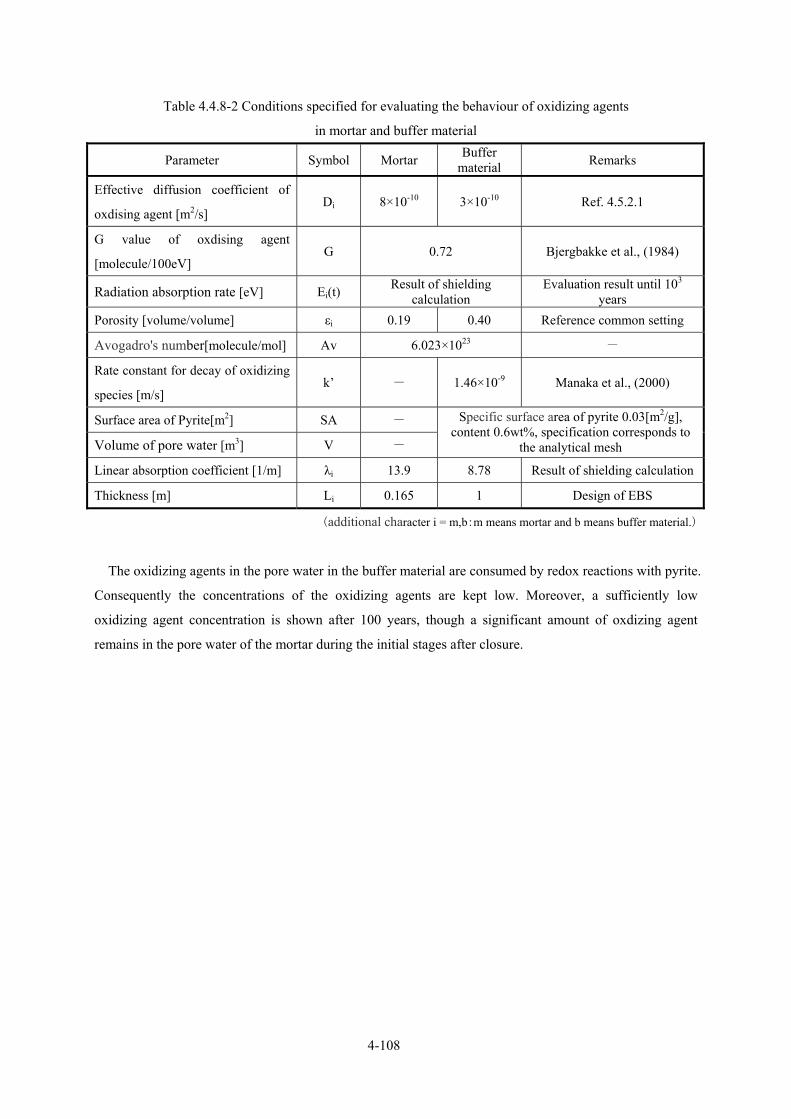
4-108
Table 4.4.8-2 Conditions specified for evaluating the behaviour of oxidizing agents
in mortar and buffer material
Parameter Symbol Mortar Buffer material Remarks
Effective diffusion coefficient of
oxdising agent [m2/s] Di 8×10⁻¹⁰ 3×10⁻¹⁰ Ref. 4.5.2.1
G value of oxdising agent
[molecule/100eV] G 0.72 Bjergbakke et al., (1984)
Radiation absorption rate [eV] Ei(t) Result of shielding
calculation Evaluation result until 103
years Porosity [volume/volume] εi 0.19 0.40 Reference common setting
Avogadro's number[molecule/mol] Av 6.023×10²³ -
Rate constant for decay of oxidizing
species [m/s] k’ - 1.46×10⁻⁹ Manaka et al., (2000)
Surface area of Pyrite[m2] SA -
Volume of pore water [m3] V -
Specific surface area of pyrite 0.03[m2/g], content 0.6wt%, specification corresponds to
the analytical mesh
Linear absorption coefficient [1/m] λi 13.9 8.78 Result of shielding calculation
Thickness [m] Li 0.165 1 Design of EBS
(additional character i = m,b:m means mortar and b means buffer material.)
The oxidizing agents in the pore water in the buffer material are consumed by redox reactions with pyrite.
Consequently the concentrations of the oxidizing agents are kept low. Moreover, a sufficiently low
oxidizing agent concentration is shown after 100 years, though a significant amount of oxdizing agent
remains in the pore water of the mortar during the initial stages after closure.
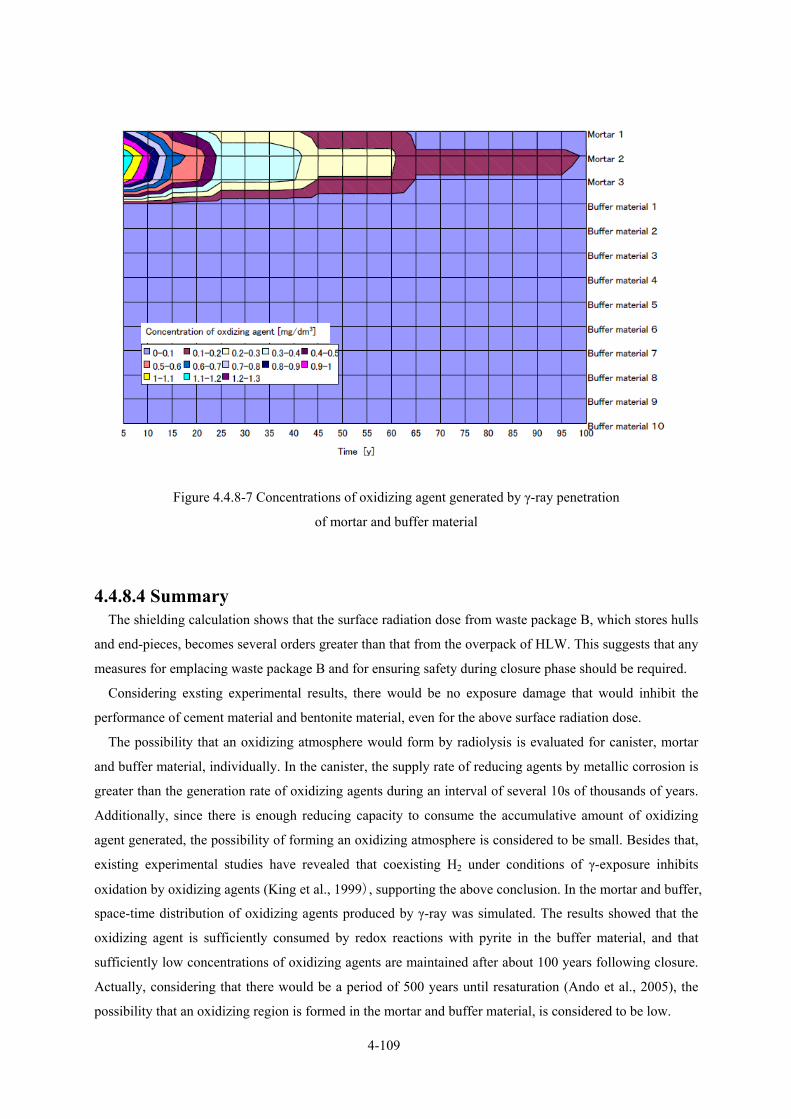
4-109
Figure 4.4.8-7 Concentrations of oxidizing agent generated by γ-ray penetration
of mortar and buffer material
4.4.8.4 Summary The shielding calculation shows that the surface radiation dose from waste package B, which stores hulls
and end-pieces, becomes several orders greater than that from the overpack of HLW. This suggests that any
measures for emplacing waste package B and for ensuring safety during closure phase should be required.
Considering exsting experimental results, there would be no exposure damage that would inhibit the
performance of cement material and bentonite material, even for the above surface radiation dose.
The possibility that an oxidizing atmosphere would form by radiolysis is evaluated for canister, mortar
and buffer material, individually. In the canister, the supply rate of reducing agents by metallic corrosion is
greater than the generation rate of oxidizing agents during an interval of several 10s of thousands of years.
Additionally, since there is enough reducing capacity to consume the accumulative amount of oxidizing
agent generated, the possibility of forming an oxidizing atmosphere is considered to be small. Besides that,
existing experimental studies have revealed that coexisting H2 under conditions of γ-exposure inhibits
oxidation by oxidizing agents (King et al., 1999), supporting the above conclusion. In the mortar and buffer,
space-time distribution of oxidizing agents produced by γ-ray was simulated. The results showed that the
oxidizing agent is sufficiently consumed by redox reactions with pyrite in the buffer material, and that
sufficiently low concentrations of oxidizing agents are maintained after about 100 years following closure.
Actually, considering that there would be a period of 500 years until resaturation (Ando et al., 2005), the
possibility that an oxidizing region is formed in the mortar and buffer material, is considered to be low.
4-110
4.4.8.5 Future issues In order to ensure the evaluation of a geological repository system for TRU waste, the following issues
concerning the effects of the radiation field should be considered.
① Radiation protection at construction, operation and closure
In the evaluation of disposal technology in Chapter 3 it was concluded that radiation protection during
construction, operation and closure must be ensured by using remote handling technology. However, this
conclusion is not based on the shielding calculation results, which consider the conditions of each kind of
waste and the structures of the disposal facilities. In future, in order to ensure radiation protection during
construction, operation and closure, a detailed shielding calculation should be performed to envisage more
appropriate facility designs.
② Knowledge of radiolysis of actual water, considering the effects of coexisting components
The radiolysis of water is a complicated process, related to the concentrations of radicals, ions, excited
molecules and various solutes. Actual pore water contains various coexisting components and the
rate-determining process of radiolysis is not completely understood. Moreover, in this evaluation, based on
experimental facts about radiolysis in a pure water system, G values of decomposition products are
established. However, actual G values in real pore water might not always be consistent with the values
specified above. Hence, the radiolysis characteristics of water in the presence of other components, is
considered to be an important issue for future consideration.
4.4.9 Nitrate salt effects 4.4.9.1 Generation of nitrate with organic material inclusions and impact
assessment In Japan, the spent fuel from nuclear power plants is reprocessed and U and Pu are recovered. At present,
the PUREX method is the mainstream reprocessing method, and is used in Japan. This method produces
nitrate salt (mainly, NaNO3) which would also be disposed of in a TRU waste disposal facility if special
treatments are not performed. Such wastes that include nitrate salts is classified as Group 3 waste. The total
amount of nitrate salts to be disposed of is estimated to be about 3.25×10⁶ kg.
Nitrate salt might affect the functions of components of the disposal facility and the behaviour of
radionuclides. Hence, the presence of nitrate salts should be reflected in nuclide migration analyses. The
NO3- might be reduced to N2 and/or NH3 by microbes and by reactions with reducing materials such as
metal. Hence, an evaluation of the effects of nitrate should include the effects of chemical species that are
produced from NO3-. Consequently, in this section, the chemical transitions of NO3
- are evaluated. Based
on the results, the effects on cementitious material, the solubilites and the sorption distribution coefficients
of radionuclides are evaluated.
4.4.9.2 Chemical transition of nitrate ions NO3
- might be reduced by existing reducing material (metal and organic material). However, in order to
4-111
promote the reduction of NO3-, catalytic effects, such as may occur on the surfaces of metals or iron
hydroxides, are necessary (Sazarashi et al., 1999; Wada et al., 2002). Hence, the reduction process of NO3-
by metal is modelled as a combination of water reduction reactions, reduction of NO3- to produce NO2
-,
reduction of NO2- to produce NH3 and dissolution of carbon steel (Honda et al., 2005). A rate parameter has
been experimentally measured for each reaction. Moreover, since the reduction of NO3- by denitrifying
bacteria cannot be rejected, this bacterial effect is considered by the above chemical reaction model (Kato
et al., 2005). This chemical model and one- dimensional material transportation process are combined and
used as an assessment model.
Using this assessment model, NH3 concentrations and the rates of gas generation (H2 by corrosion and N2
by the activity of denitrifying bacteria) in the disposal facility have been calculated (Masuda et al., 2005).
In the case for giving the highest concentration of NH3 (constant metal corrosion rate of 0.1µm/y, no
increase of permeability by fractureing), the concentration of NH3 reaches a maximum of 0.8mol/dm3. The
generation of H2 by corrosion is inhibited by competition between the NO3- reduction reaction and the H2
generating reaction. However, the concentration of nitrate salt in the pore water of the disposal facility is
decreased as the nitrate is transported out from the disposal facility over time. When the activity of pore
water becomes appropriate (>0.94) for microbial activity, N2 generation is started by denitrifying bacteria.
Moreover, since the inhibitation effect of nitrate to hydrogen gas generation will be diminished as the NO3
concentration decreases, the total gas generation rate becomes larger than H2 generation rate from metal
corrosion in the absence of nitrate. However, the period when this occurs is limited, because after a certain
decrease in NO3- concentration occurs there is a decrease in the activity of denitrifying bacteria. The
maximum rate of total gas generation becomes 1.4 times the H2 generation rate by metal corrosion in the
absence of nitrate.
4.4.9.3 Effect of nitrate salt on cementitious material The effects of nitrate salt on the mechanical properties, hydraulic characteristics and alteration of cement
have been evaluated (Takei et al., 2002; 2003; Fujita, 2003; Kaneko et al., 2004). From these evaluations,
as described previously, there are insignificant impacts on variation of mineral assemblage of cementitious
material, as described before (4.4.2.1). However, it has been revealed that the ionic strength is increased by
dissolution of nitrate salt and that the solubility of portlandite is changed. The dissolution of Ca is promoted,
depending on the concentration of nitrate salt. However, the greatest increased solubility is 1.5 times of that
in ion-exchanged water.
The relationship between the porosity and unconfined compressive strength of cement paste, is the same
when a NaNO3 solution is passed through or when ion exchange water is passed through. The same
formula can be used to explain the relationship in both cases. This fact also suggests that there is no
significant mineralogical change in the cement paste. For NH3, there was no observed effect on the
mineralogical composition, hydraulic characteristics and mechanical strength of the cementitious material
(Osawa et al., 2004).
4-112
4.4.9.4 Effect on solubility of radionuclides and sorption distribution coefficients
(1) Redox conditions
The inside of a disposal facility for Group 3 waste and its neighbourhood should be oxidizing, since
NO3- exists at a concentration near to saturation with NaNO3. Hence, the oxidizing states of radionuclides
might be different from those that would occur under the initial natural reducing conditions underground.
The form of the solubility limiting solid phases and/or dominant soluble chemical species are changed.
These changes might result in variations in solubilities and/or sorption distribution coefficients. Hence, in
the nuclide migration analysis for a disposal facility for Group 3 waste, it is important to specify solubilities
and sorption distribution coefficients assuming oxidizing condition.
(2) Effects of complex formation
In a disposal facility for Group 3 waste, NO3- or NH3 and radionuclides from NO3
- might form
complexes. The solublity and sorption behaviour of radionuclides might be affected by these complexation.
Actinoid nuclides that are considered to have comlexation tendency with NO3- were evaluated to
determine the effects of nitrate salt. Dominant soluble chemical species of actinoids with trivalent (Am)
and tetravalent (Np,Pu and U) forms were evaluated using the JNC-TDB (Yui et al., 1999b) and the
NEA-TDB (Guillaumont et al., 2003) because a significant increase in the solubility and decrease in
sorption distribution coefficient did not occur if soluble nitric acid complexes became dominant soluble
chemical species. All these nuclides were dominantly in the form of hydrolysed species under the pH
conditions of cement pore water. Nitric acid complexes did not dominate the chemical speciation even at
low pH values, if the total concentration of carbonic acid was that of the reference goundwater(about
10-3mol/dm3). Hence, inside and outside a disposal facility for Group 3 waste, the NO3- effect on
solubilities and sorption distribution coefficients of actinoids with trivalent and tetravalent species is
considered to be small. The sorption distribution coefficient of Am and Th on hardened cement paste and
tuff is not decreased by coexisting NO3- (Morooka et al., 2004), supporting the above evaluation result.
Under the oxidizing conditions in which NaNO3 is saturated, U(VI), Pu(VI) and Np(V) might be
dominate chemical forms. Hence, complexation with nitrate ions under highly oxidizing conditions was
evaluated using the JNC-TDB. It was found that nitrate complexes did not dominate the chemical species in
the diposal facility. However, NpO2NO3 was found to be a dominant chemical species in lower pH, if the
NO3- concentration was above 0.15mol/dm3. This result suggests the possibility that the increase in
solubility and decrease in sorption distrtibution coefficient of Np(V) might occur outside the facility.
However, this chemical species is not selected in the NEA-TDB, and the pros and cons of this chemical
species selection should be discussed.
The effect of NH3 has been considered by a thermodynamic evaluation of amine complex formation with
radionuclides (Ochs et al., 2003). NH3 of Lewis base can form a complex with metal ion of Lewis acid.
However, since NH3 is a “soft” base, it is especially difficult for NH3 to form complexes with lanthanoids
or actinoids. Hence, it is considered that “soft” and/or “B” type cation forms amine complexes easily (e.g.
4-113
Stumm and Morgan, 1996). Additionally, Ochs et al. (2003) evaluate the effect of NH3 concentration on the
solubility of NiO (cr) by using a previously obtained stabilization constant. As a result, it is estimated that
there is an increase in solubility of about 20% when 1 mol/dm3 is reached. The solubility becomes three
orders of magnitude larger in solutions with a 5mol/dm3 NH3 concentration. The solubility of Ni was
evaluated by changing the NH3 concentration in experiments (Miyamoto et al., 2005). A significant
increase in solubility was observed in a 0.1mol/dm3 solution, and a 3-4 orders of magnitude solubility
increase were observed in a 1mol/dm3 solution. Considering that the maximum NH3 concentration in pore
water of the disposal facility is 0.8 mol/dm3 (Ochs et al.,2003), there is a possibility that the solubilities
and sorption distribution coefficients of Ni, Pd, Sn, Nb, Co and Pb, which have a tendency of forming
amine complexes, can be affected.
(3) Effects on soluble elements
The sorption distribution coefficients of C (organic type (formaldehyde) and inorganic type), I, Cl and Cs,
might be affected by nitrate salt and NH3 by a different mechanism to the above soluble complex formation
(e.g. competition with nitrate ion and its counter ion). The effect of nitrate solution and NH3 on the sorption
distribution coefficient of C (organic type (formaldehyde) and inorganic type), I, Cl and Cs on hardened
cement paste and tuff has been evaluated (Morooka et al., 2004). The sorption distribution coefficient of Cs
on hardened cement paste is not significantly affected by nitrate salt. However, for the organic carbon, Cl
and I, a decrease in the sorption distribution coefficient by nitrate salt was observed. The sorption
distribution coefficient of Cs on tuff shows a significant decrease by addition of NaNO3, though the effect
of nitrate salt was not observed for C (inorganic and organic), Cl and I. A decrease in the sorption
distribution coefficient of organic C on tuff by NH3 was observed. However, the effect is covered by
considering the effect of nitrate salt. Moreover, the effect of nitrate salt on the sorption distribution
coefficients of organic carbon on cementitious material (OPC and OPC/BFS=1/9) and sedimentary rock
were evaluated, and supports the above result (Sasou et al., 2004).
4.4.9.5 Summary ・ The maximum NH3 concentration in the disposal facility was estimated by modelling to be
0.8mol/dm3. An increase in solubility and a decrease in sorption distribution coefficients by amine
complex formation cannot be neglected for elements that easily form complexes with NH3.
・ In the early stages of disposal, the generation of H2 by corrosion is inhibited by competition with the
reduction reaction of NO3-. However, in the period with the fastest gas generation rate, total gas
generation rate (H2 by metal corrosion + N2 by microbial activities) exceeds H2 gas generation rate
by corrosion without nitrate. The total generation rate of gas in this case is 1.4 times faster than in
the case that only H2 is generated by metal corrosion.
・ If NaNO3 solution is passed through cementitious material, Ca dissolution might be promoted; the
dissolution rate of Ca is 1.5 times larger than that when ion-exchanged waste is used. The
relationship between the unconfined compressive strength and porosity of hardened cement paste
4-114
through which NaNO3 is passed, can be expressed by the same formula as that which is used when
the fluid is ion-exchanged water. Hence, the decreasing strength of the altered paste is explained by
an increase in porosity.
・ The setting of solubility and sorption distribution coefficients for oxidizing conditions is necessary
because the disposal facility for Group 3 waste and its surroundings are oxidized owing to the large
amount of NO3-.
・ In order to evaluate the effect on solubilities and sorption distribution coefficients of nitric complex
formation, the dominant chemical species of actinoid elements were evaluated. However, for the
trivalent and tetravalent actinoids, nitrate complexes do not become dominant chemical species
under alkaline conditions. Moreover, in a sorption experiment using NaNO3 solution (3mol/dm3), no
effects on sorption distribution coefficients in hardened cement paste and tuff were observed with
and without nitrate and ammonia. Considering the oxidizing conditions caused by NO3-, Np(V),U
(VI) and Pu(VI) were evaluated by using the thermodynamic database JNC-TDB. As a result, it was
shown that there is no influence on the conditions in the disposal facility. However, the Np (V)
species NpO2NO3 become dominant in lower pH, suggesting that there may be an influence outside
the repository. However, in the current NEA-TDB thermodynamic database, this complex is not
selected.
・ A decrease in the sorption distribution coefficients of soluble C (organic type), Cl and I on hardened
cement paste were observed in the presence of nitrate salt.
・ A decrease in the sorption distribution coefficient of Cs on tuff was observed in the presence of
nitrate salt.
・ A decrease in the sorption distribution coefficient of soluble C (organic type) on hardened cement
paste was observed in the presence of nitrate salt. However, the extent of the effect is covered by
considering the effect of the nitrate salt.
4.4.9.6 Future issues The following are considered to be areas that require futher study:
・ changes in the chemical forms of NO3- in geological media and improving knowledge about the
effects on groundwater chemistry and the effects on nuclide oxidation states;
・ the evaluation of nitrate plumes in geological media, taking into account the chemical transitions of
NO3 within the geological media;
・ Data acquisition for the solubilities and sorption distribution coefficients of nuclides in solutions
with high concentrations of NaNO3 and clarification of the threshold concentration of nitrate salt,
under which the effect of nitrate salt on solubility and sorption of nuclides can be neglected.
Moreover, the following issue is considered to be important for future research.
・ An evaluation of the mechanical effect of swelling pressure due to the osmotic pressure on solidified
bitumen.

4-115
4.4.10 Quantification of gas effects and the behaviour of gaseous nuclides The waste and structural components in repository tunnels generate gases by metal corrosion, microbial
degradation of organic material and radiolysis. The pore pressure will rise and the pore water will be
expelled from the disposal facility by displacement of generated gas. Hence, it might affect the long-term
safety of the facility. In the 1st TRU report, the mechanical effects of pore pressure buildup in the barriers
and enhanced release of contaminated pore water were considered to be evaluation targets among these
potential effects. In this section, considering the accumulation of knowledge about gas transport and
improvements in evaluation techniques, non-radioactive gas generation and migration analyses are clarified
in Section 4.4.10.1 (Ando et al., 2005). The pore pressure distribution in the EBS are used to confirm the
mechanical integrity of the barriers. The effect of forcing out of contaminated water is included in the
safety evaluation. Based on international evaluations of the gas effect (OECD/NEA, 2001; Rodwell and
Norris, 2003), the quantities of generated radioactive gas and the migration analysis of gaseous
radionuclides (Ando et al., 2005) are also evaluated by considering those radionuclides that are transported
in gaseous form. These results are also included in the safety evaluation.
4.4.10.1 Generation and migration of non-radiogenic gases (1) Method for evaluating gas generation rate and data
In repository, various types of gas generation by reduction of groundwater caused by metal corrosion,
microbial degradation of organic materials and radiolysis of groundwater or waste is expected. The
evaluation method for gas generation and data which is considering these features is described below.
a. Method for evaluating gas generation rate
(a) Metal corrosion
The metals in the disposal facility that are considered, are carbon steel and stainless steel, which are used
for drums and structures, and zircaloy and inconel, which are used for fuel assemblies. It is assumed that
hydrogen gas is generated by corrosion of these metals under reducing conditions.
(b) Degradation of organic materials by microbes
Bitumen and cellulose are considered to be the representative organic materials in the disposal facility. It
is expected that gas generation occurs by microbial degradation of these organic materials. As described in
Section 4.4.7, the gases that are generated mainly by microbial activity in the disposal facility are CO2
(almost all microbes), N2 (denitrifying bacteria) and CH4 (methanogens). In this report, it is assumed that
all amounts of cellulose is decomposed into gas completely. It is also assumed that aliphatic and aromatic
hydrocarbons without asphalten and resin are the subjects of microbial attack in bitumen. The component
of aliphatic and aromatic hydrocarbons in bitumen is assumed 56%, based on experimental data obtained
by blown bitumen.
4-116
(c) Radiolysis
Pore water and organic materials in the wastes and the backfill will be decomposed by radiation from
radionuclides in the waste, and gases such as hydrogen will be generated. In cases that organic materials are
irradiated, C-H bonds of organic materials are split and hydrogen radicals are generated. These radicals can
react with organic materials and with other hydrogen radicals to produce hydrogen gas. Moreover, H・ and
OH・ are generated by the radiolysis of water, and water molecules emit electrons under the high-energy
radiation. These electrons generate dipole momentum in water molecules, and stabilized as aqueous
electrons (eaq). The reaction that produces hydrogen gas occurs between reactive H・, OH・ and eaq (EPRI,
1998).
b. Data for evaluation
(a) Metal corrosion
The rates of gas generation by metal corrosion were specified based on experimental measurements
(Mihara et al., 2002; Nishimura et al., 2003). The reported values are equivalent corrosion rates that were
calculated from the measured hydrogen gas generation rates of carbon steel, stainless steel and zircaloy at
30~50 under alkaline conditions.
An experimentally determined corrosion rate for carbon steel of 1.0×10⁻⁷m/y (experimental conditions:
pH=10.5, Cl- concentration 20,000 ppm at 35 for 200-500 days) was used for the evaluation. In the case
of stainless steel, an experimentally determined rate of 2.0×10⁻⁸m/y (experimental conditions: pH=12.4,Cl-
concentration=3,200ppm at 35 for 600 days) was used. The value for stainless steel was also used for
inconel. For zircaloy, a corrosion rate of 5.0×10⁻⁹m/y (experimental conditions: pH=12.4 , Cl-
concentration=3,200ppm at 35 for 600 days) was used.
(b) Microbial degradation of organic materials
The data concerning gas generation by microbial degradation of organic material under alkaline
conditions is extremely limited. In this report, data specified for the evaluation of a low-level radioactive
waste repository (SFR) in Sweden were used (Moreno et al., 2001). A rate of 8.9×10⁻⁵mol/g/y
(2.0×10⁻⁶STPm3/g/y in ref.) was used for cellulose and bitumen.
(c) Radiolysis
G values for H2 gas generation were estimated as input data for calculating the amount of gas generated
by radiolysis of water and bitumen. These values were collected and classified by Müller et al.(1992). For
water, values of 0.05 molecules/100eV were assumed for β γ-rays and 0.5 molecule/100eV for α-ray.
Additionally, for bitumen, G values of 0.26 molecule/100eV for β γ-rays and 0.72 molecule/100eV for
α-ray were assumed.
(d) Content and form of metals and organic materials
The quantities of gas source materials in the disposal facility were estimated by calculating the amounts
of metal and organic matter in the wastes, structure materials, liner and EDZ in each waste group and in
4-117
each disposal tunnel.
The metals were assumed to have a plate shape. Materials with unknown thickness were treated as if
their thickness were 1.6 mm, which is equivalent to the thickness of drums. The endpieces were treated as
plates with estimated outer dimensions of 213.5mm×213.5mm,thickness of 22.9mm and height of 93.4mm.
The thickness of the endpieces as the plate was estimated to be 18.4mm from the calculation:
volume/(surface area/2). The hulls were taken to be 0.57mm thick, as most thin PWR fuel cladding. Steel
(H-type steel)for liner was assumed to form plates, the thickness of which was assumed to be 9mm. Since
rock bolts have a diameter of 25mm, equivalent thickness as the plate shape was estimated to be 12.5mm.
All organic material except for cellulose and bitumen were evaluated as though it was cellulose.
c. Calculated gas generation rates
The rate of gas generation in the repository tunnels by metal corrosion, microbial degradation and
radiolysis in each waste group, was calculated. As an example of crystalline bedrock, the maximum
cumulative amount of generated gas and the maximum gas generation rate in 1m length of repository
tunnels, are shown for each waste group in Figure 4.4.10.1-1. The case with the largest gas annual
generation rate was for wastes contained in 200L drum in Group 4 waste, which included metal waste with
a large specific surface area, and gave a rate of 98.0 mol/m/y. The rate of 57.4 mol/m/y given by Group 4
waste in square packages followed. Since the maximum gas generation rate affects pore pressure buildup
and the volume of expelled pore water, for conservative assessment, the highest gas generation rate for
each waste group was specified in the gas migration analysis. The rates were calculated for Groups 2, 3 and
4 wastes by specifying wastes contained in canisters, 200Ldrums and 200L drums, respectively. The largest
cumulative amount of gas generation of 5.51×10⁶ mol/m, was given by waste form of Group 4 in square
packages. This package contains the largest amount of metal waste. The next largest amount was 3.74×10⁶
mol/m, given by Group 3 wastes in square packages. Furthermore, lower gas production amount were
given by wastes in 200L drums of Group 3 waste and wastes in canisters of Group 2 waste gave even lower
gas production.
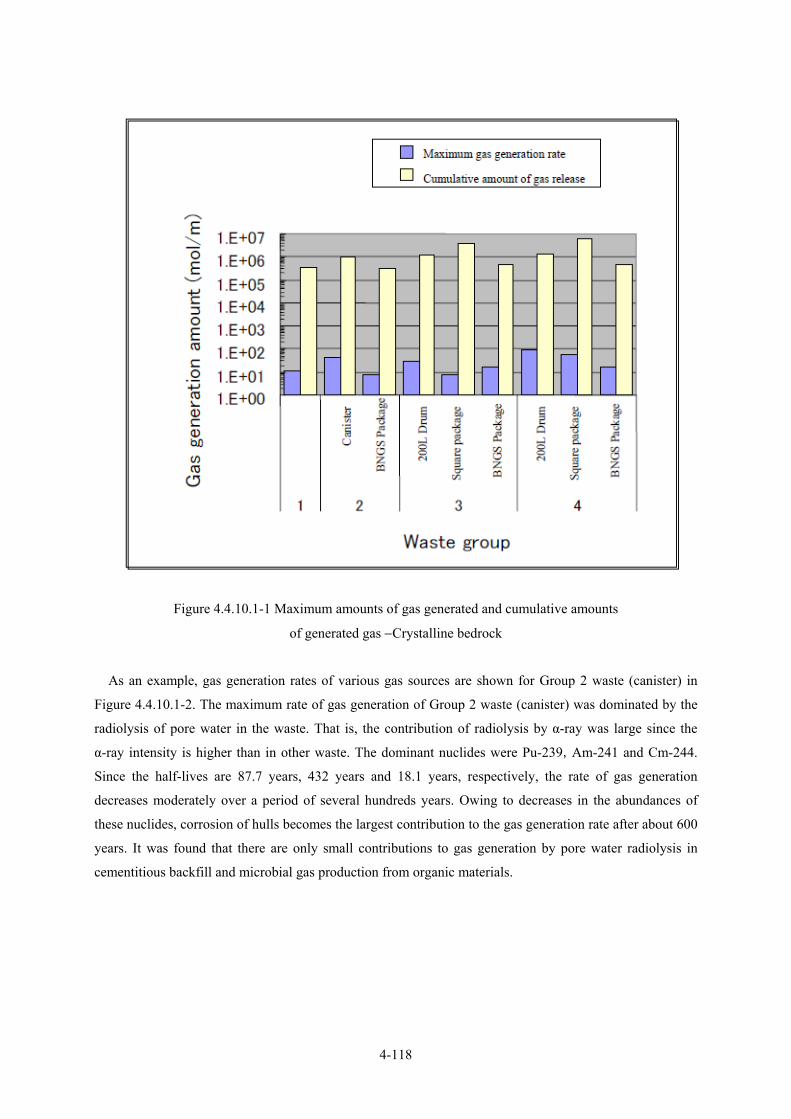
4-118
Figure 4.4.10.1-1 Maximum amounts of gas generated and cumulative amounts
of generated gas −Crystalline bedrock
As an example, gas generation rates of various gas sources are shown for Group 2 waste (canister) in
Figure 4.4.10.1-2. The maximum rate of gas generation of Group 2 waste (canister) was dominated by the
radiolysis of pore water in the waste. That is, the contribution of radiolysis by α-ray was large since the
α-ray intensity is higher than in other waste. The dominant nuclides were Pu-239,Am-241 and Cm-244.
Since the half-lives are 87.7 years, 432 years and 18.1 years, respectively, the rate of gas generation
decreases moderately over a period of several hundreds years. Owing to decreases in the abundances of
these nuclides, corrosion of hulls becomes the largest contribution to the gas generation rate after about 600
years. It was found that there are only small contributions to gas generation by pore water radiolysis in
cementitious backfill and microbial gas production from organic materials.
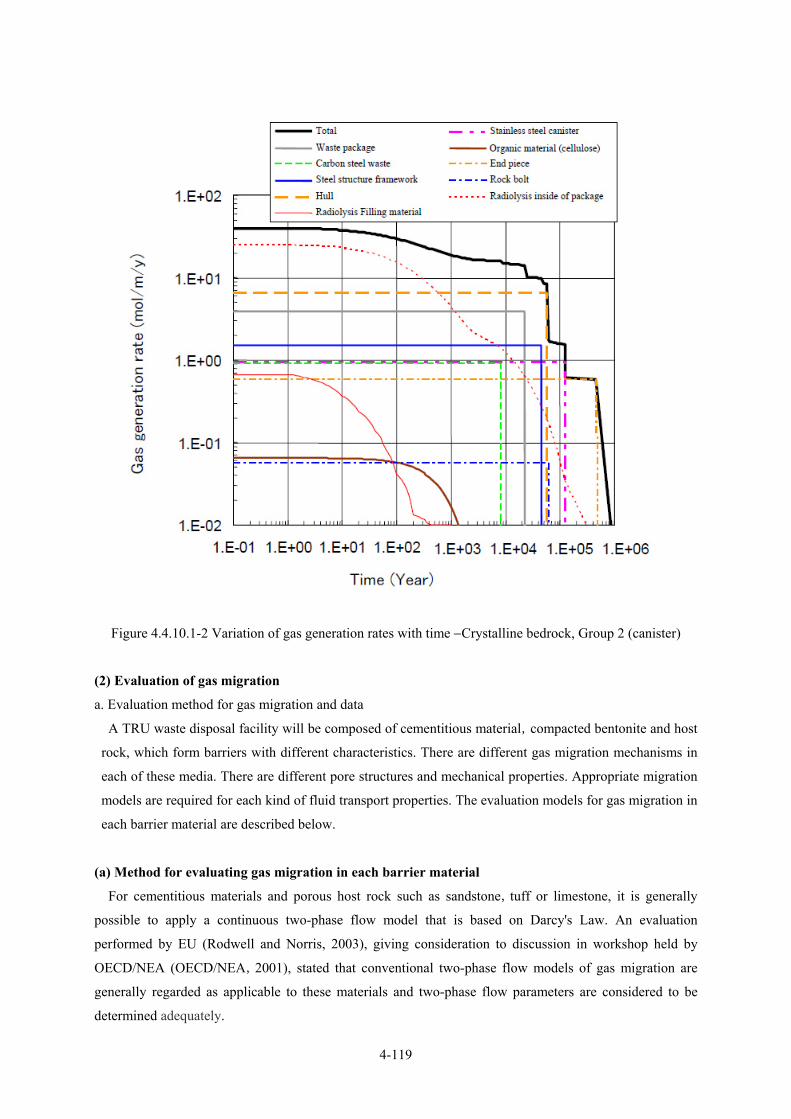
4-119
Figure 4.4.10.1-2 Variation of gas generation rates with time −Crystalline bedrock, Group 2 (canister)
(2) Evaluation of gas migration
a. Evaluation method for gas migration and data
A TRU waste disposal facility will be composed of cementitious material,compacted bentonite and host
rock, which form barriers with different characteristics. There are different gas migration mechanisms in
each of these media. There are different pore structures and mechanical properties. Appropriate migration
models are required for each kind of fluid transport properties. The evaluation models for gas migration in
each barrier material are described below.
(a) Method for evaluating gas migration in each barrier material
For cementitious materials and porous host rock such as sandstone,tuff or limestone, it is generally
possible to apply a continuous two-phase flow model that is based on Darcy's Law. An evaluation
performed by EU (Rodwell and Norris, 2003), giving consideration to discussion in workshop held by
OECD/NEA (OECD/NEA,2001), stated that conventional two-phase flow models of gas migration are
generally regarded as applicable to these materials and two-phase flow parameters are considered to be
determined adequately.

4-120
The behaviour of gas migration in swelling clay material, such as bentonite, is characterised by a distinctive
threshold gas entry pressure that depends on density and mineral composition of the clay (Tanai et al, 1999),
the permeability changed by gas pressure and very small amount of expelled pore water by gas migration.
Hence, it is not certain that conventional two-phase flow-models are properly applicable to the gas
transport mechanisms operating in clay materials. (Horseman and Harrington, 1997; Rodwell and Norris,
2003). However, well established models to simulate gas transport mechanisms in swelling clay is not
available at present. Therefore, some modelling efforts to reflect formation of a preferential pathway and
permeability change that depends on gas pressure were carried out based on the continuous two-phase flow
model. By the application of specified two-phase flow parameters to reproduce gas migration behavior in
clay materials (Yamamoto et al., 1999), Kozeny-Carmen relationship for permeability determination, a
model for pressure effects on permeability and a model for reproducing breakthrough/shut-in behavior,
better reproducibility of the breakthrough pressure and the amount of expelled gas and water were
achieved.
In the case of fractured rock, it was considered that migration pathways would form by displacement of
pore water in fractures. In the migration analysis of two-phase flow, attempts were made to apply fracture
bundle model (FBM) and fracture network model (FNM), but these are insufficiently practical. An
application of continuous two-phase flow model in combination with dual porosity model or dual
permeability model to fractured rock is practical in the field of oil resource engineering and geothermal
dynamics. The specification of two-phase flow parameters and considering heterogeneity is discussed.
However, based on the OECD/NEA discussion, an EU evaluation (Rodwell and Norris, 2003) reported that
application of the current continuous gas-liquid two-phase flow model is apropriate.
(b) Mathematical model and analysis code
A continuous two-phase flow model based on Darcy's Law was used. The multi-component, multi-phase
fluids flow simulator TOUGH2 (Pruess and Battistelli, 1999) was used since it has been evaluated
sufficiently in the past studies (Nagra,2002; Baker et al., 1997). The Kozeny-Carman relationship and
models to simulate changes of permeability by stress and breakthrough/shut-in behaviours of transport
pathways (Bentonite Domain Module (Tanai and Yamamoto, 2003) were incorporated into TOUGH2 code,
in order to reproduce features of migration in preferential pathways.
(c) Analysis data
This analysis used parameters for buffer material that were specified using the Bentonite Domain
Module of enhanced TOUGH2, based on gas injection experiments performed under conditions of drainage
and constant volume (Yamamoto et al., 2004). Additionally, two-phase flow parameters of barriers other
than buffer were specified using a conventional two-phase flow model that was implemented using the
original TOUGH2 code (Yamamoto et al., 2000). Two-phase flow parameters for cementitious back fill
and host rocks were specified by using a continuous two-phase flow model. As far as possible these
parameter values were based on the results of gas injection tests and the capillary pressure tests on the
drainage side.
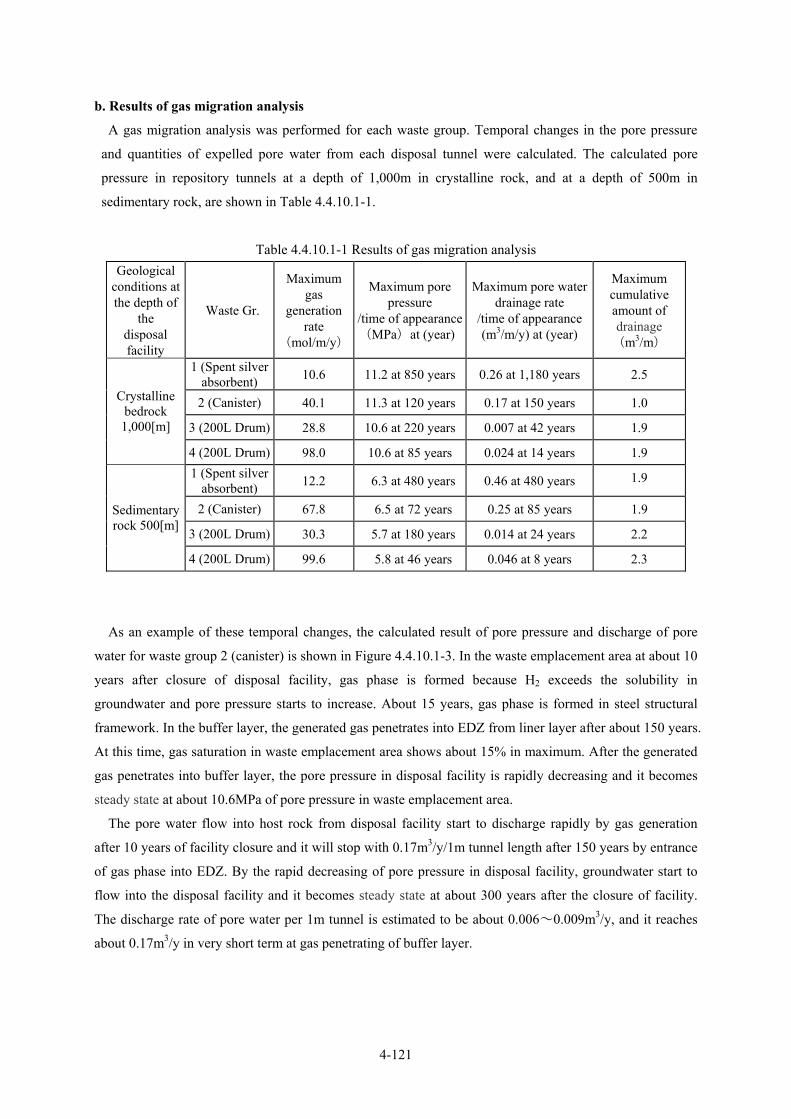
4-121
b. Results of gas migration analysis
A gas migration analysis was performed for each waste group. Temporal changes in the pore pressure
and quantities of expelled pore water from each disposal tunnel were calculated. The calculated pore
pressure in repository tunnels at a depth of 1,000m in crystalline rock, and at a depth of 500m in
sedimentary rock, are shown in Table 4.4.10.1-1.
Table 4.4.10.1-1 Results of gas migration analysis Geological
conditions at the depth of
the disposal facility
Waste Gr.
Maximum gas
generation rate
(mol/m/y)
Maximum pore pressure
/time of appearance(MPa) at (year)
Maximum pore water drainage rate
/time of appearance (m3/m/y) at (year)
Maximum cumulative amount of drainage (m3/m)
1 (Spent silver absorbent) 10.6 11.2 at 850 years 0.26 at 1,180 years 2.5
2 (Canister) 40.1 11.3 at 120 years 0.17 at 150 years 1.0
3 (200L Drum) 28.8 10.6 at 220 years 0.007 at 42 years 1.9
Crystalline bedrock 1,000[m]
4 (200L Drum) 98.0 10.6 at 85 years 0.024 at 14 years 1.9 1 (Spent silver
absorbent) 12.2 6.3 at 480 years 0.46 at 480 years 1.9
2 (Canister) 67.8 6.5 at 72 years 0.25 at 85 years 1.9
3 (200L Drum) 30.3 5.7 at 180 years 0.014 at 24 years 2.2
Sedimentary rock 500[m]
4 (200L Drum) 99.6 5.8 at 46 years 0.046 at 8 years 2.3
As an example of these temporal changes, the calculated result of pore pressure and discharge of pore
water for waste group 2 (canister) is shown in Figure 4.4.10.1-3. In the waste emplacement area at about 10
years after closure of disposal facility, gas phase is formed because H2 exceeds the solubility in
groundwater and pore pressure starts to increase. About 15 years, gas phase is formed in steel structural
framework. In the buffer layer, the generated gas penetrates into EDZ from liner layer after about 150 years.
At this time, gas saturation in waste emplacement area shows about 15% in maximum. After the generated
gas penetrates into buffer layer, the pore pressure in disposal facility is rapidly decreasing and it becomes
steady state at about 10.6MPa of pore pressure in waste emplacement area.
The pore water flow into host rock from disposal facility start to discharge rapidly by gas generation
after 10 years of facility closure and it will stop with 0.17m3/y/1m tunnel length after 150 years by entrance
of gas phase into EDZ. By the rapid decreasing of pore pressure in disposal facility, groundwater start to
flow into the disposal facility and it becomes steady state at about 300 years after the closure of facility.
The discharge rate of pore water per 1m tunnel is estimated to be about 0.006~0.009m3/y, and it reaches
about 0.17m3/y in very short term at gas penetrating of buffer layer.

4-122
Figure 4.4.10.1-3 Example results from a gas migration analysis −Crystalline bedrock, Group 2 (canister)
(Left: Variation of pore pressure in the disposal facility, Right: Variation of pore water drainage rate)
4.4.10.2 Generation and migration of radioactive gas (1) Evaluation aimed at gaseous radioactive nuclides
In the GASNET of EU project (Rodwell and Norris, 2003), the effect of radioactive gas on safety
assessment is shown as follows.
The production of radioactive gases is insignificant relative to non radioactive gases in terms of volume,
but the possibility of the radiological effect should be considered. As radioactive nuclide in gaseous form,
C-14,H-3,Rn-222,I-129 and Kr-87 were considered. And it was expected that only C-14 introduced the
radiation hazard after repository closure from the potential gaseous chemical forms, half life,amount of
radioactive substance. As plausible gas including C-14, CO2 and CH4 are considered. However, since CO2
is highly soluble and it forms CaCO3 by reaction with Ca in cement pore water, it is considered that this
chemical form is not able to reach to the surface. Hence, CH4 including C-14(14CH4) was considered as
gaseous radioactive material to be estimated in this evaluation.
To estimate effects of radioactive methane, waste groups with largest amount of C-14 and CH4
generation were considered. Hence, the14CH4 release rates for waste group 3 which has largest amount of
bitumen and thus highest CH4 generation and waste group 2 with highest C-14 content were evaluated in
this section.
Time (Years)
Pres
sure
(Pa)
Waste package/fillStructural membersBufferSupport
Host rock
Time (Years)
Pore
wat
erdr
aina
ge ra
te (k
g/0.
5 m
/yea
r)
Excavation disturbed zone
Time (Years)
Pres
sure
(Pa)
Waste package/fillStructural membersBufferSupport
Host rock
Time (Years)
Pore
wat
erdr
aina
ge ra
te (k
g/0.
5 m
/yea
r)
Time (Years)
Pore
wat
erdr
aina
ge ra
te (k
g/0.
5 m
/yea
r)
Excavation disturbed zone
Waste / filler
10000.0
Time (Years)
Pres
sure
(Pa)
Waste package/fillStructural membersBufferSupport
Host rock
Time (Years)
Pore
wat
erdr
aina
ge ra
te (k
g/0.
5 m
/yea
r)
Excavation disturbed zone
Time (Years)
Pres
sure
(Pa)
Waste package/fillStructural membersBufferSupport
Host rock
Time (Years)
Pore
wat
erdr
aina
ge ra
te (k
g/0.
5 m
/yea
r)
Time (Years)
Pore
wat
erdr
aina
ge ra
te (k
g/0.
5 m
/yea
r)
Excavation disturbed zone
Waste / filler
10000.0

4-123
(2) Amounts of radioactive gas generated
a. Method for calculating amounts generated
(a) Waste Group 2
Group 2 waste consists of compacted hulls and end-pieces including highest C-14 content. It was
assumed that all of C-14 contained is discharged as CH4. In the case of hulls, it is known that 20 % of C-14
content exists in the surface oxide layer and other 80% exists in bulk metal. Hence, it was assumed that
C-14 in surface oxide layer is discharged as CH4 instantaneously into pore water at the time of site closure.
Moreover, it considers that C-14 in the bulk metal of hulls, end-pieces and other material (stainless steel
and other metal parts) is released congruently with corrosion loss of each metal as CH4 into pore water.
The evaluation for corrosion in waste group 2 is calculated for hulls (zircaloy), end-pieces (stainless
steel) and other metal parts. (It assumed that corrosion rate is the same as that of stainless steel.) Their C-14
content was estimated to be 66% in hulls (zircaloy), 34% in stainless steel and other metal parts. It also
assumed that the C-14 content per weight of stainless steel and other metal parts is the same and that it
contains 0.22 in stainless steel and 0.12 in other metal parts. Gas generation rates and equivalent corrosion
rates considered that the cathode reaction under the reducing atmosphere is dominated by reduction of
water and H2 generation. However for the zircaloy, 4 times of the equivalent corrosion rate was used since a
certain quantity of produced H2 is absorbed into the zircaloy (Honda et al., 2005).
(b) Waste Group 3
The waste group 3 is the group which includes bituminized waste thus has the highest content of organic
materials. Since the CH4 ratio in generated gases by microbial degradation of bitumen remains considerable
uncertainty at present, it assumed that all of C-14 in the waste group 3 is released as CH4 in proportion to
microbialy degraded amount of bitumen as a conservative approach.
b. Calculation amount generated
The calculated maximum release rate of C-14 and maximum generation rate of 14CH4 per unit length of
disposal tunnel for waste group 2 (canister), and waste group 3 (200L Drum) are summarized in Table
4.4.10.2-1. The maximum released rate of C-14 in waste group 2 and 3 in crystalline rock are about 109
Bq/m/y and 7×10⁵Bq/m/y respectively. Moreover, the maximum generation rate of 14CH4 of waste group 2
and 3 in crystalline rock are about 4×10⁻²mol/m/y and 3×10⁻⁷mol/m/y respectively. The discharge rate per
unit tunnel length of waste group 2 is different depending on the host rock condition which causes
difference of cross sectional area of disposal tunnel.
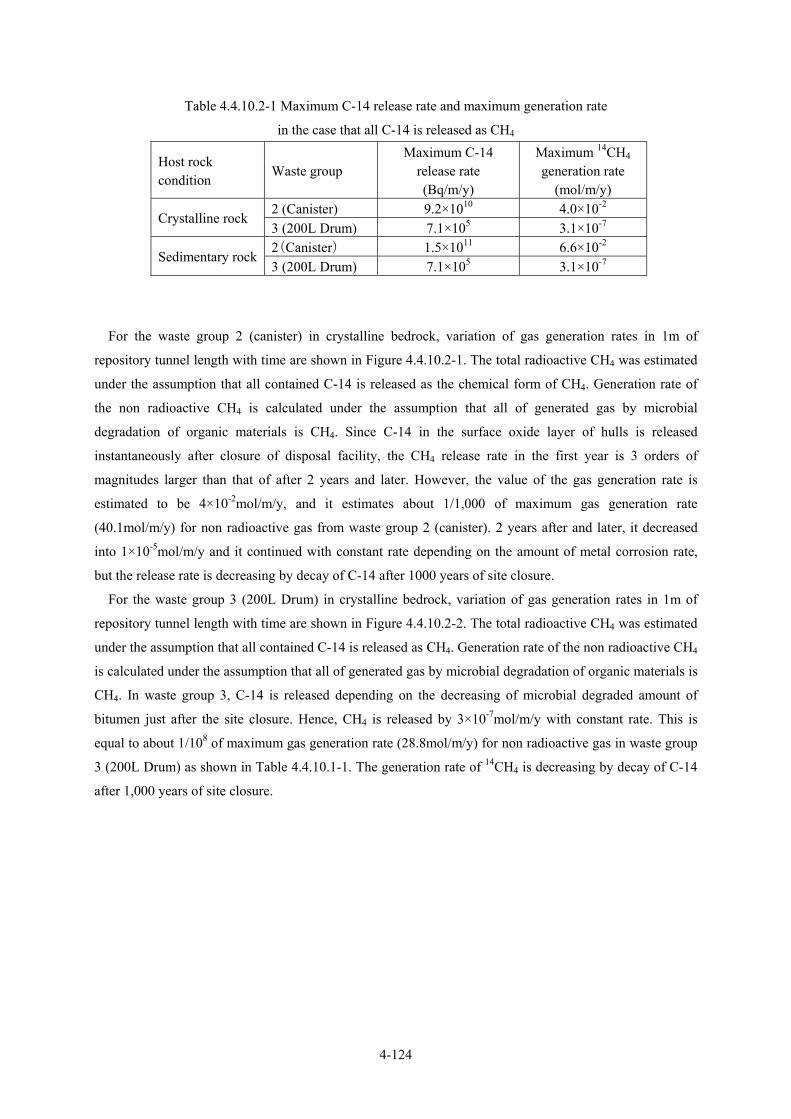
4-124
Table 4.4.10.2-1 Maximum C-14 release rate and maximum generation rate
in the case that all C-14 is released as CH4
Host rock condition
Waste group Maximum C-14
release rate (Bq/m/y)
Maximum 14CH4 generation rate
(mol/m/y) 2 (Canister) 9.2×10¹⁰ 4.0×10⁻²
Crystalline rock 3 (200L Drum) 7.1×10⁵ 3.1×10⁻⁷ 2(Canister) 1.5×10¹¹ 6.6×10⁻²
Sedimentary rock 3 (200L Drum) 7.1×10⁵ 3.1×10⁻⁷
For the waste group 2 (canister) in crystalline bedrock, variation of gas generation rates in 1m of
repository tunnel length with time are shown in Figure 4.4.10.2-1. The total radioactive CH4 was estimated
under the assumption that all contained C-14 is released as the chemical form of CH4. Generation rate of
the non radioactive CH4 is calculated under the assumption that all of generated gas by microbial
degradation of organic materials is CH4. Since C-14 in the surface oxide layer of hulls is released
instantaneously after closure of disposal facility, the CH4 release rate in the first year is 3 orders of
magnitudes larger than that of after 2 years and later. However, the value of the gas generation rate is
estimated to be 4×10⁻²mol/m/y, and it estimates about 1/1,000 of maximum gas generation rate
(40.1mol/m/y) for non radioactive gas from waste group 2 (canister). 2 years after and later, it decreased
into 1×10⁻⁵mol/m/y and it continued with constant rate depending on the amount of metal corrosion rate,
but the release rate is decreasing by decay of C-14 after 1000 years of site closure.
For the waste group 3 (200L Drum) in crystalline bedrock, variation of gas generation rates in 1m of
repository tunnel length with time are shown in Figure 4.4.10.2-2. The total radioactive CH4 was estimated
under the assumption that all contained C-14 is released as CH4. Generation rate of the non radioactive CH4
is calculated under the assumption that all of generated gas by microbial degradation of organic materials is
CH4. In waste group 3, C-14 is released depending on the decreasing of microbial degraded amount of
bitumen just after the site closure. Hence, CH4 is released by 3×10⁻⁷mol/m/y with constant rate. This is
equal to about 1/108 of maximum gas generation rate (28.8mol/m/y) for non radioactive gas in waste group
3 (200L Drum) as shown in Table 4.4.10.1-1. The generation rate of 14CH4 is decreasing by decay of C-14
after 1,000 years of site closure.

4-125
Figure 4.4.10.2-1 14CH4 generation rate −Crystalline bedrock, Group 2 (canister)
Figure 4.4.10.2-2 14CH4 generation rate −Crystalline bedrock (Group 3: 200L drum)
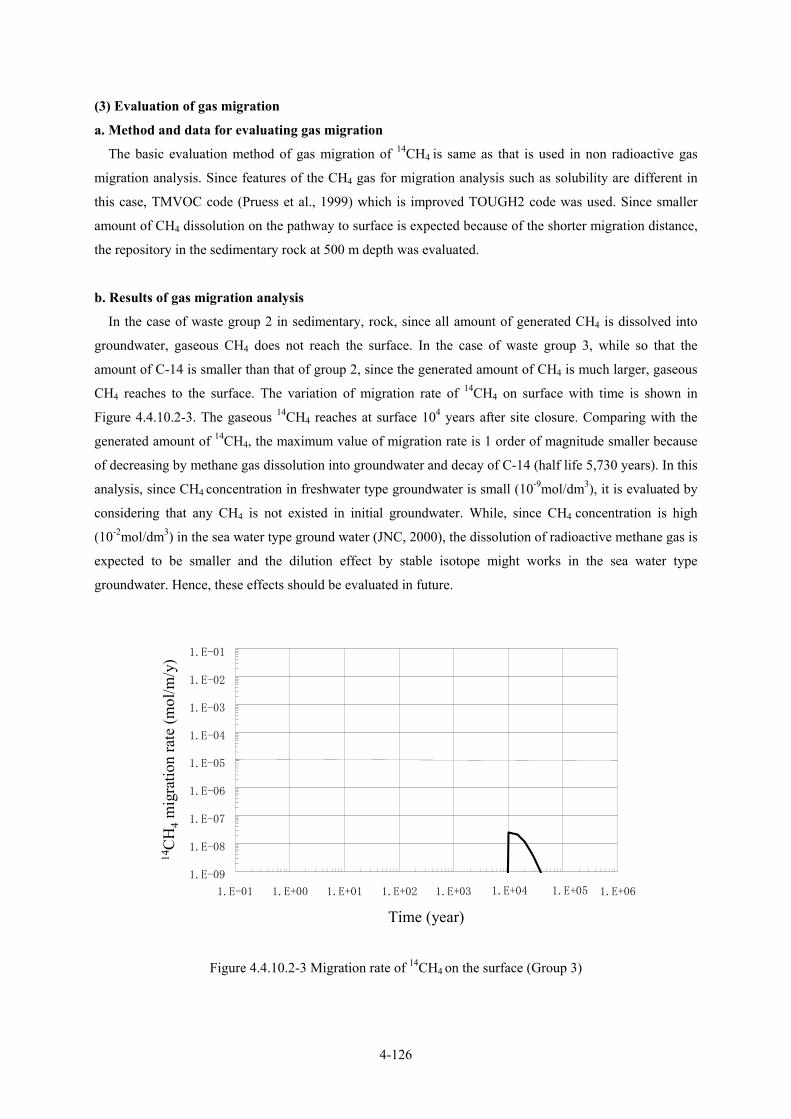
4-126
(3) Evaluation of gas migration
a. Method and data for evaluating gas migration
The basic evaluation method of gas migration of 14CH4 is same as that is used in non radioactive gas
migration analysis. Since features of the CH4 gas for migration analysis such as solubility are different in
this case, TMVOC code (Pruess et al., 1999) which is improved TOUGH2 code was used. Since smaller
amount of CH4 dissolution on the pathway to surface is expected because of the shorter migration distance,
the repository in the sedimentary rock at 500 m depth was evaluated.
b. Results of gas migration analysis
In the case of waste group 2 in sedimentary, rock, since all amount of generated CH4 is dissolved into
groundwater, gaseous CH4 does not reach the surface. In the case of waste group 3, while so that the
amount of C-14 is smaller than that of group 2, since the generated amount of CH4 is much larger, gaseous
CH4 reaches to the surface. The variation of migration rate of 14CH4 on surface with time is shown in
Figure 4.4.10.2-3. The gaseous 14CH4 reaches at surface 104 years after site closure. Comparing with the
generated amount of 14CH4, the maximum value of migration rate is 1 order of magnitude smaller because
of decreasing by methane gas dissolution into groundwater and decay of C-14 (half life 5,730 years). In this
analysis, since CH4 concentration in freshwater type groundwater is small (10-9mol/dm3), it is evaluated by
considering that any CH4 is not existed in initial groundwater. While, since CH4 concentration is high
(10-2mol/dm3) in the sea water type ground water (JNC, 2000), the dissolution of radioactive methane gas is
expected to be smaller and the dilution effect by stable isotope might works in the sea water type
groundwater. Hence, these effects should be evaluated in future.
Figure 4.4.10.2-3 Migration rate of 14CH4 on the surface (Group 3)
1.E-09
1.E-08
1.E-07
1.E-06
1.E-05
1.E-04
1.E-03
1.E-02
1.E-01
1.E-01 1.E+00 1.E+01 1.E+02 1.E+03 1.E+061.E+04 1.E+05
Time (year)
14C
H4
mig
ratio
n ra
te (m
ol/m
/y)
1.E-09
1.E-08
1.E-07
1.E-06
1.E-05
1.E-04
1.E-03
1.E-02
1.E-01
1.E-01 1.E+00 1.E+01 1.E+02 1.E+03 1.E+061.E+04 1.E+05
Time (year)
14C
H4
mig
ratio
n ra
te (m
ol/m
/y)
4-127
4.4.10.3 Summary For each waste group, the gas generation rates by metal corrosion, microbial degradation of organic
materials and radiolysis were calculated. The maximum generation rate is estimated to be 7 to 100mol/m/y
per 1m of repository tunnel, and it is revealed that the contribution of metal corrosion is the largest except
for waste group 2 which shows the highest contribution of gas generation mechanism was radiolysis by
α-emitting nuclides.
The pore pressure build up from initial groundwater pressure in crystalline rock by gas generation shows
1.3 to 1.4MPa in waste group 1 and 2, and about 0.7MPa in waste group 3 and 4 which are constructed
without buffer material. The mechanical stability of EBS is evaluated based on this result. The maximum
discharge rate of pore water per 1m length of the disposal tunnel with buffer material of waste group 2 is
0.006 to 0.009m3/m/y (0.17m3/m/y in very short period). In the tunnel without buffer material, the
maximum discharge rate of pore water in waste group 4 is 0.018 to 0.024m3/m/y. These results were used
as for one scenario in the safety assessment.
The calculated amount of radioactive gas based on the conservative assumption shows 4×10⁻²mol/m/y
for CH4 in waste group 2 (canister) in crystalline rock and it is equal to about 1/1,000 of 40.1mol/m/y of
non radioactive gas generation. After more than two years, it decreases to 1×10⁻⁵mol/m/y. In waste group 3
(200L Drum), CH4 is released with constant rate of 3×10⁻⁷mol/m/y which is equivalent to about 1/108 of
gas generation rate of non radioactive gases.
The results of migration analysis of radioactive gas for 14CH4 show that in the case of waste group 2 the
gaseous 14CH4 does not reach to surface because of dissolution of methane gas into groundwater.
Dissolution of all generated radioactive gas in aquifer was assumed as a reference for the evaluation of
effect of gaseous radionuclides in EN2002 (Nagra, 2002). However, in the case of group 3, gaseous 14CH4
reaches to the surface since the generated amount of methane gas is much larger. The maximum migration
rate at surface is about 3×10⁻⁸mol/m/y in this case.
4.4.10.4 Future issues In the evaluation of gas generation rates, the gas generation rate from metal is held. In future, more
realistic evalutations that consider the temporal change of metal corrosion rate, evaluation of gas generation
rate by microbial degradation under repository conditions and development of long-term microbial gas
generation models are needed.
In gas migration assessment, especially transport properties in clay material are affected by stress field,
thus it is necessary to develope gas-liquid migration models combined with stress analysis models.
Moreover, transport parameter values evaluated from different experimental conditions of effective clay
dry density,chemical condition of groundwater,stress condition and saturation condition. In order to
evaluate re-saturation process, data collection of two-phase flow parameters for inhibition processes
including hysteresis feature of clay materials are necessary. It is also necessary to acquire two-phase flow
parameter data for different rock types and to perform realistic assessment of gaseous radioactive migration
to surface by development of gas migration model in fractured rock. Furthermore, more realistic evaluation
is able to be achieved by development of analytical tool combined appropriate models for each transport

4-128
media and by the validation of the analysis tool using in-situ test results.
For the evaluation of radioactive gas generation rate, since it is assumed that all of contained C-14 in
waste is released as CH4 gas at the present time, it is necessary that acquisition of release rate data of C-14
as a gaseous chemical species and generation rate data of gaseous radioactive material from bituminized
waste and investigation of radioactive gas generation model are performed. In the migration evaluation of
radioactive gas, in the modeled mixed gas system of 14CH4 and non radioactive gases, isotope dilution with
dissolved gas is neglected conservatively, while the assumption of 0 initial concentration of dissolved non
radioactive gas in groundwater is unconservative. Further examination of these assumptions is needed.
Moreover, the model which is combined with the transition model of CH4 to other chemical species
assimilated by ecological system, such as CO2, should be investigated and validated.
In this section, various environmental conditions important for safety assessment and the investigation of
new insight, analysis and evaluation related to discrete phenomena were described. The evaluation results
of the environmental (Thermal/Hydraulic/Mechanical/Chemical/Radiological) conditions and the discrete
phenomena are summarized in Figures 4.4.10.4-1 and 4.4.10.4-2, respectively.
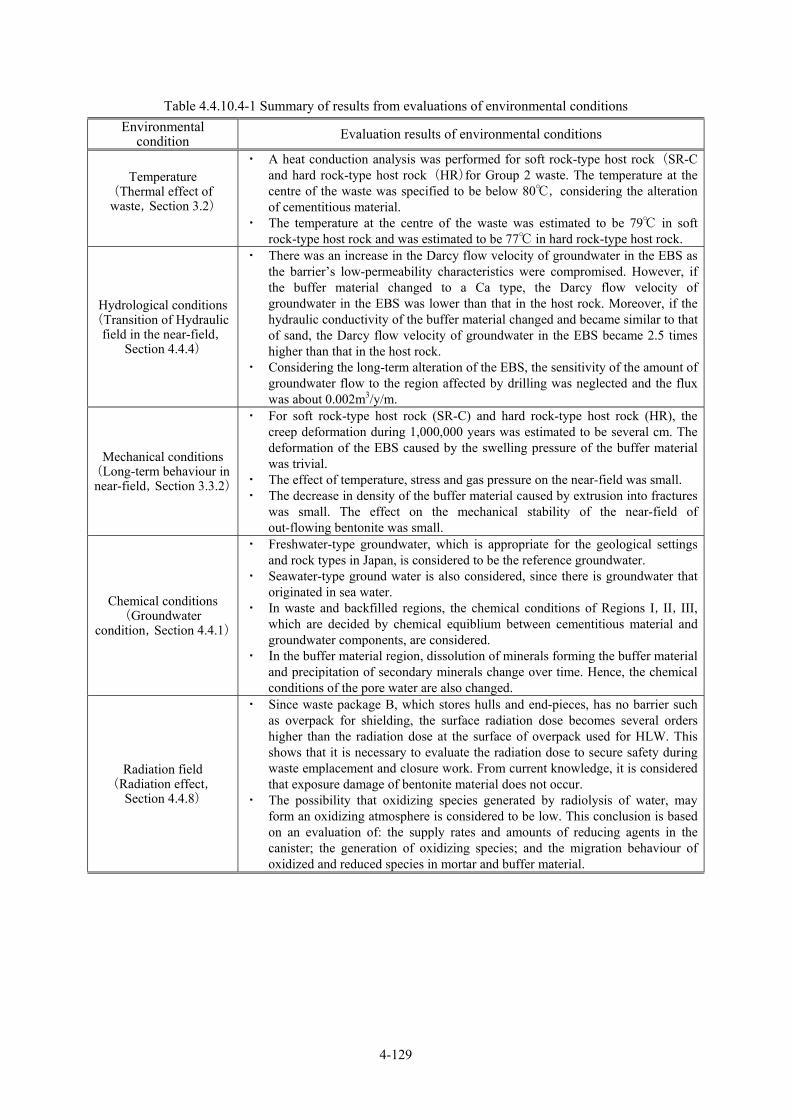
4-129
Table 4.4.10.4-1 Summary of results from evaluations of environmental conditions Environmental
condition Evaluation results of environmental conditions
Temperature (Thermal effect of waste,Section 3.2)
・ A heat conduction analysis was performed for soft rock-type host rock (SR-C and hard rock-type host rock (HR)for Group 2 waste. The temperature at the centre of the waste was specified to be below 80, considering the alteration of cementitious material.
・ The temperature at the centre of the waste was estimated to be 79 in soft rock-type host rock and was estimated to be 77 in hard rock-type host rock.
Hydrological conditions (Transition of Hydraulic field in the near-field,
Section 4.4.4)
・ There was an increase in the Darcy flow velocity of groundwater in the EBS as the barrier’s low-permeability characteristics were compromised. However, if the buffer material changed to a Ca type, the Darcy flow velocity of groundwater in the EBS was lower than that in the host rock. Moreover, if the hydraulic conductivity of the buffer material changed and became similar to that of sand, the Darcy flow velocity of groundwater in the EBS became 2.5 times higher than that in the host rock.
・ Considering the long-term alteration of the EBS, the sensitivity of the amount of groundwater flow to the region affected by drilling was neglected and the flux was about 0.002m3/y/m.
Mechanical conditions (Long-term behaviour in near-field,Section 3.3.2)
・ For soft rock-type host rock (SR-C) and hard rock-type host rock (HR), the creep deformation during 1,000,000 years was estimated to be several cm. The deformation of the EBS caused by the swelling pressure of the buffer material was trivial.
・ The effect of temperature, stress and gas pressure on the near-field was small. ・ The decrease in density of the buffer material caused by extrusion into fractures
was small. The effect on the mechanical stability of the near-field of out-flowing bentonite was small.
Chemical conditions (Groundwater
condition,Section 4.4.1)
・ Freshwater-type groundwater, which is appropriate for the geological settings and rock types in Japan, is considered to be the reference groundwater.
・ Seawater-type ground water is also considered, since there is groundwater that originated in sea water.
・ In waste and backfilled regions, the chemical conditions of Regions I,II,III, which are decided by chemical equiblium between cementitious material and groundwater components, are considered.
・ In the buffer material region, dissolution of minerals forming the buffer material and precipitation of secondary minerals change over time. Hence, the chemical conditions of the pore water are also changed.
Radiation field (Radiation effect,
Section 4.4.8)
・ Since waste package B, which stores hulls and end-pieces, has no barrier such as overpack for shielding, the surface radiation dose becomes several orders higher than the radiation dose at the surface of overpack used for HLW. This shows that it is necessary to evaluate the radiation dose to secure safety during waste emplacement and closure work. From current knowledge, it is considered that exposure damage of bentonite material does not occur.
・ The possibility that oxidizing species generated by radiolysis of water, may form an oxidizing atmosphere is considered to be low. This conclusion is based on an evaluation of: the supply rates and amounts of reducing agents in the canister; the generation of oxidizing species; and the migration behaviour of oxidized and reduced species in mortar and buffer material.
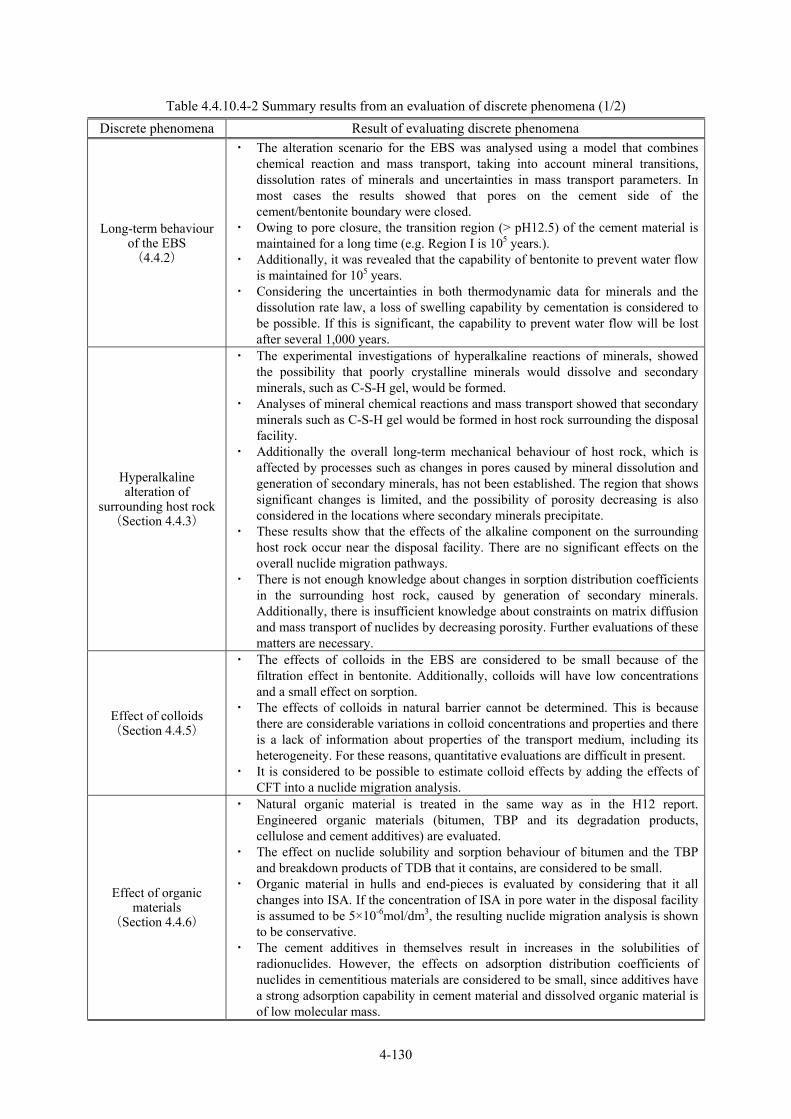
4-130
Table 4.4.10.4-2 Summary results from an evaluation of discrete phenomena (1/2) Discrete phenomena Result of evaluating discrete phenomena
Long-term behaviour of the EBS
(4.4.2)
・ The alteration scenario for the EBS was analysed using a model that combines chemical reaction and mass transport, taking into account mineral transitions, dissolution rates of minerals and uncertainties in mass transport parameters. In most cases the results showed that pores on the cement side of the cement/bentonite boundary were closed.
・ Owing to pore closure, the transition region (> pH12.5) of the cement material is maintained for a long time (e.g. Region I is 105 years.).
・ Additionally, it was revealed that the capability of bentonite to prevent water flow is maintained for 105 years.
・ Considering the uncertainties in both thermodynamic data for minerals and the dissolution rate law, a loss of swelling capability by cementation is considered to be possible. If this is significant, the capability to prevent water flow will be lost after several 1,000 years.
Hyperalkaline alteration of
surrounding host rock (Section 4.4.3)
・ The experimental investigations of hyperalkaline reactions of minerals, showed the possibility that poorly crystalline minerals would dissolve and secondary minerals, such as C-S-H gel, would be formed.
・ Analyses of mineral chemical reactions and mass transport showed that secondary minerals such as C-S-H gel would be formed in host rock surrounding the disposal facility.
・ Additionally the overall long-term mechanical behaviour of host rock, which is affected by processes such as changes in pores caused by mineral dissolution and generation of secondary minerals, has not been established. The region that shows significant changes is limited, and the possibility of porosity decreasing is also considered in the locations where secondary minerals precipitate.
・ These results show that the effects of the alkaline component on the surrounding host rock occur near the disposal facility. There are no significant effects on the overall nuclide migration pathways.
・ There is not enough knowledge about changes in sorption distribution coefficients in the surrounding host rock, caused by generation of secondary minerals. Additionally, there is insufficient knowledge about constraints on matrix diffusion and mass transport of nuclides by decreasing porosity. Further evaluations of these matters are necessary.
Effect of colloids (Section 4.4.5)
・ The effects of colloids in the EBS are considered to be small because of the filtration effect in bentonite. Additionally, colloids will have low concentrations and a small effect on sorption.
・ The effects of colloids in natural barrier cannot be determined. This is because there are considerable variations in colloid concentrations and properties and there is a lack of information about properties of the transport medium, including its heterogeneity. For these reasons, quantitative evaluations are difficult in present.
・ It is considered to be possible to estimate colloid effects by adding the effects of CFT into a nuclide migration analysis.
Effect of organic materials
(Section 4.4.6)
・ Natural organic material is treated in the same way as in the H12 report. Engineered organic materials (bitumen, TBP and its degradation products, cellulose and cement additives) are evaluated.
・ The effect on nuclide solubility and sorption behaviour of bitumen and the TBP and breakdown products of TDB that it contains, are considered to be small.
・ Organic material in hulls and end-pieces is evaluated by considering that it all changes into ISA. If the concentration of ISA in pore water in the disposal facility is assumed to be 5×10⁻⁶mol/dm3, the resulting nuclide migration analysis is shown to be conservative.
・ The cement additives in themselves result in increases in the solubilities of radionuclides. However, the effects on adsorption distribution coefficients of nuclides in cementitious materials are considered to be small, since additives have a strong adsorption capability in cement material and dissolved organic material is of low molecular mass.

4-131
Table 4.4.10.4-2 Summary results from an evaluation of discrete phenomena (2/2) Discrete phenomena Result of evaluating discrete phenomena
Effect of microbes (Section 4.4.7)
・ Microbial activity in disposal facilities for each group of waste has been summarised. The evaluation covered: formation of complexes; pH changes; redox reactions; concrete alteration; metal corrosion; bentonite alteration; pore closure and microbial effects on gas generation.
・ Amounts of organic material/CO2 generated from organic material and TBP, and amounts of nitrogen and phosphoric acid generated were evaluated. It was concluded that the generation of redox-sensitive species, colloid formation and the generation of radioactive gaseous chemical species might affect the disposal system. However, since uncertainties about microbial activity are significant and validation of specified parameters is difficult, these are issues for future consideration.
・ Other microbial effects on the disposal system are considered to be small.
Effect of nitrate salts (Section 4.4.9)
・ The calculated maximum ammonia concentration in the disposal facility is 0.8mol/dm3. An increase in metal solubility by formation of amine complexes cannot be neglected.
・ In the early stages of disposal, the generation of hydrogen by decomposition is limited. However, if NO3
- concentration is decreasing and the activity of water is above 0.94, denitrifying bacteria are active and generate nitrogen. The total gas generation rate then increases.
・ The dissolution of Ca is promoted if NaNO3 is transported. The relationship between unconfined compressive strength and the porosity of cement paste, in the case that the NaNO3 solution is transported, is represented by a formula for the case where ion-exchanged water is present. That is, a decrease in strength of the altered part of the paste is explained by an increase in porosity.
・ Using the current thermodynamic database, nitric acid complexes of actinoids are not calculated to dominate the chemical species under the alkaline conditions of Region I and II.
・ An experiment using NaNO3 solution (3mol/dm3) revealed that the presence of nitric acid and ammonia have no effect on sorption distribution coefficients in OPC paste and tuff.
・ A decrease in the sorption distribution coefficients are observed for sorption of organic carbon in Cl and I cement paste and for sorption of Cs in tuff.
Effect of gas (Section 4.4.10)
・ From the analyses of gas generation and migration, the increasing inpressure in the disposal facility is estimated to be 1.3~1.4MPa for Group 1 and 2 wastes in crystalline rock. The possibility of mechanical damageto the buffer material being caused by such a pressure increase is considered to be small.
・ In cases where tunnels contain buffer material, Group 2 waste shows the maximum pore water outflow rate from the EBS caused by gas generation. This rate is 0.006 to 0.009m3/y. In the case where a tunnel does not contain buffer material, waste Group 4 shows a maximum value of0.018to 0.024m3/y.
・ For Group 2 and 3 waste, the amount of gas reaching into the biosphere is analysed based on the hypothesis that all the C-14 is incorporated into CH4. The amount of gas that reaches the biosphere was calculated. The results showed that the gas is substantially dissolved in the groundwater. Consequently, there is little possibility that gas will reach the biosphere. Additionally, for Group 3 waste, the greatest amount of CH4 produced is 3 x 10⁻⁸ mol/m/y (per unit length of tunnel).
4-132
4.5 Radionuclide transport analysis and dose assessment
TRU waste typically includes a wide variety of waste materials, such as metal, nitrates and organic material.
I-129 and C-14 are the key radionuclides that dominate dose. The amounts of radionuclides (inventory) in
TRU wastes are lower than those in high-level waste (HLW) and the heat generation of TRU waste is also
lower than that of HLW. Hence in the disposal concept for TRU waste no overpack is required. Except for
metal-containing waste belonging to Group 2, the waste packages are not expected to fulfil the function of
restricting radionuclide release. Additionally, since heat generation is small, wastes can be emplaced
together in tunnels with large cross-sections, with void spaces between wastes being filled with cement
mortar.
The variety of materials used may have an impact on the disposal environment and this is a cause of
uncertainty in safety assessments of TRU waste disposal. Considering the features of a geological
repository for TRU waste in Japan, and the fact that the repository site has not yet been selected, in order to
demonstrate safety, a conservative disposal analysis that takes into account various uncertainties is
necessary.
An OECD/NEA report (OECD/NEA, 2004) suggests that the evaluation of uncertainty should be included
in safety assessment in order to improve reliability. Hence, in this section, radionuclide transport analyses
and dose assessments are performed using an existing deterministic approach (deterministic consequence
calculation) (OECD/NEA, 1991) and a newly developed top-down assessment approach, “a comprehensive
sensitivity analysis method” (Ooi et al., 2004), to complement the exisiting approach from the point of view
of uncertainty.
The specifications and methods used in analytical cases based on the disposal environment conditions
outlined in Section 4.4 are described in Section 4.5.1. The radionuclide transport database and the
deterministic consequence calculation used in the Reference Case of the base scenario of the groundwater
scenario in Section 4.5.1 is described in Section 4.5.2. The deterministic consequence calculation, which is
also applied to the alternative cases of the base scenario (alternative scenario) of the groundwater scenario,
is described in Section 4.5.3, and the results of comprehensive sensitivity analyses are described in Section
4.5.4. An analysis of the perturbation scenario of the groundwater scenario is described in Section 4.5.5,
and the resuts of an assessment of the isolation failure scenario are described in Section 4.5.6.
4.5.1 Analytical cases Analytical cases are specified based on analyses of individual phenomena described in Section 4.4 and take
into account model and parameter uncertainties (Table 4.5.1-1). The reference scenario analytical case in
the base scenario of the groundwater scenario is termed the Reference Case. Other analytical cases in the
base scenario are termed alternative cases. The type of uncertainty/case and the assessment method used
(deterministic consequence calculation or comprehensive sensitivity analysis) in each analytical case are
4-133
shown in Table 4.5.1-1. The type of uncertainty/case considered are as follows:
① Reference Case of the groundwater scenario
Reference scenario analytical case in the groundwater scenario, which is based on the most likely
phenomena in the TRU waste repository. This forms the base case, under the influence of uncertainty,
against which alternative cases are compared.
② Groundwater scenario uncertainty
Analytical case which considers possible phenomena that are not considered in the Reference Case.
The range of possible phenomena affecting dose in the assessment is a source of uncertainty.
③ Groundwater scenario uncertainty (hypothetical setting)
Analytical case taking into account possible phenomena for which knowledge or data is sparse. The
use of hypothetical parameter values is a source of uncertainty.
④ Groundwater model/parameter uncertainty
Uncertainy relating to selection of models and parameters used in assessments.
⑤ Analysis of perturbation scenarios
Analytical cases that consider the impact of future human activity and alteration of the natural
barrier over the long term
⑥ Analysis of the isolation failure scenario
Case where the repository is penetrated by accidental drilling or is exposed at the surface due to
uplift and erosion
In this section, the influence of these uncertainties is assessed using deterministic consequence calculations
supplemented with a comprehensive sensitiviy analysis for ② − ④
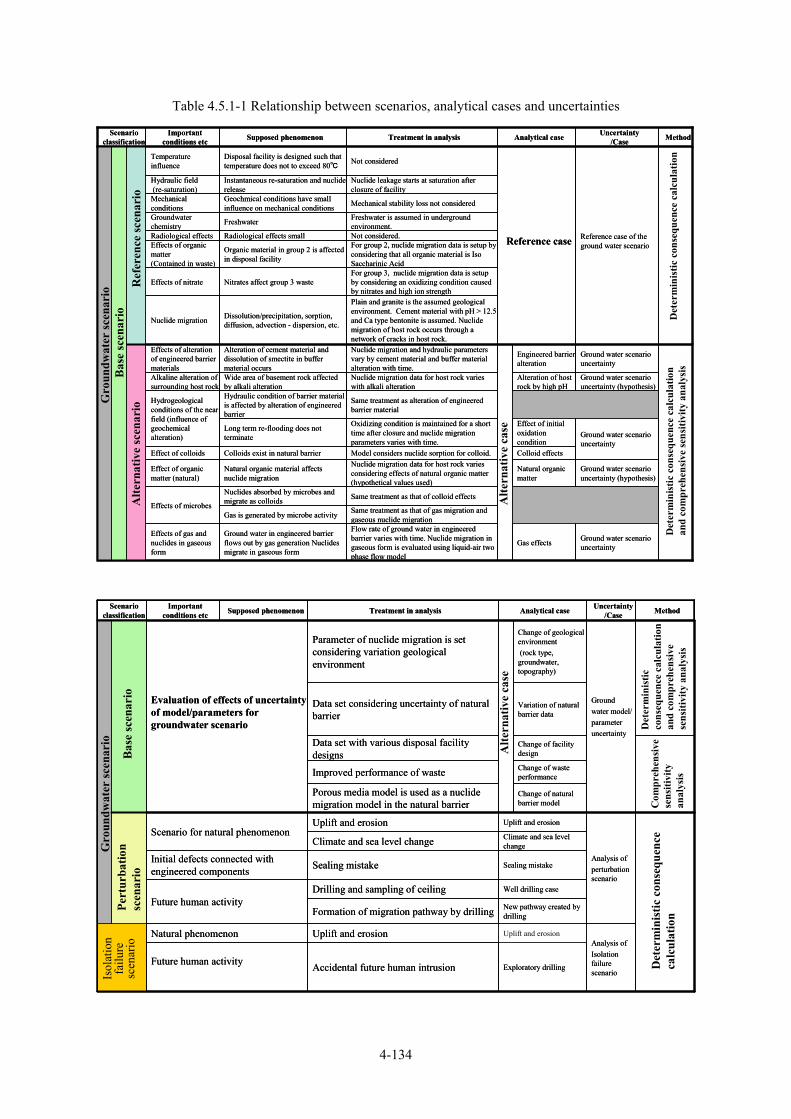
4-134
Table 4.5.1-1 Relationship between scenarios, analytical cases and uncertainties
Ground water scenario uncertainty
Effect of initial oxidation condition
Oxidizing condition is maintained for a short time after closure and nuclide migration parameters varies with time.
Long term re-flooding does not terminate
Gas effects
Natural organic matter
Colloid effects
Alteration of host rock by high pH
Engineered barrier alteration
Ground water scenario uncertainty
Flow rate of ground water in engineered barrier varies with time. Nuclide migration in gaseous form is evaluated using liquid-air two phase flow model
Ground water in engineered barrier flows out by gas generation Nuclides migrate in gaseous form
Effects of gas and nuclides in gaseous form
Same treatment as alteration of engineered barrier material
Hydraulic condition of barrier material is affected by alteration of engineered barrier
Hydrogeological conditions of the near field (influence of geochemical alteration)
Same treatment as that of gas migration and gaseous nuclide migrationGas is generated by microbe activity
Ground water scenario uncertainty (hypothesis)
Nuclide migration data for host rock varies with alkali alteration
Wide area of basement rock affected by alkali alteration
Alkaline alteration of surrounding host rock
Scenario classification
Nuclides absorbed by microbes and migrate as colloids
Natural organic material affects nuclide migration
Colloids exist in natural barrier
Alteration of cement material and dissolution of smectite in buffer material occurs
Dissolution/precipitation, sorption, diffusion, advection - dispersion, etc.
Nitrates affect group 3 waste
Organic material in group 2 is affected in disposal facility
Radiological effects small
Freshwater
Geochmical conditions have small influence on mechanical conditions
Instantaneous re-saturation and nuclide release
Disposal facility is designed such that temperature does not to exceed 80
Supposed phenomenon
Reference case
Analytical case Method
For group 2, nuclide migration data is setup by considering that all organic material is IsoSaccharinic Acid
Effects of organic matter (Contained in waste)
Freshwater is assumed in underground environment.
Groundwater chemistry
Same treatment as that of colloid effectsEffects of microbes
Ground water scenario uncertainty (hypothesis)
Nuclide migration data for host rock varies considering effects of natural organic matter (hypothetical values used)
Effect of organic matter (natural)
Model considers nuclide sorption for colloid.Effect of colloids
Plain and granite is the assumed geological environment. Cement material with pH > 12.5 and Ca type bentonite is assumed. Nuclide migration of host rock occurs through a network of cracks in host rock.
Nuclide migration
For group 3, nuclide migration data is setup by considering an oxidizing condition caused by nitrates and high ion strength
Effects of nitrate
Mechanical stability loss not consideredMechanical conditions
Nuclide leakage starts at saturation after closure of facility
Hydraulic field(re-saturation)
Ground water scenario uncertainty
Nuclide migration and hydraulic parameters vary by cement material and buffer material alteration with time.
Effects of alteration of engineered barrier materials
Not considered.Radiological effects Reference case of the ground water scenario
Not consideredTemperature influence
Uncertainty/CaseTreatment in analysisImportant
conditions etc
Ground water scenario uncertainty
Effect of initial oxidation condition
Oxidizing condition is maintained for a short time after closure and nuclide migration parameters varies with time.
Long term re-flooding does not terminate
Gas effects
Natural organic matter
Colloid effects
Alteration of host rock by high pH
Engineered barrier alteration
Ground water scenario uncertainty
Flow rate of ground water in engineered barrier varies with time. Nuclide migration in gaseous form is evaluated using liquid-air two phase flow model
Ground water in engineered barrier flows out by gas generation Nuclides migrate in gaseous form
Effects of gas and nuclides in gaseous form
Same treatment as alteration of engineered barrier material
Hydraulic condition of barrier material is affected by alteration of engineered barrier
Hydrogeological conditions of the near field (influence of geochemical alteration)
Same treatment as that of gas migration and gaseous nuclide migrationGas is generated by microbe activity
Ground water scenario uncertainty (hypothesis)
Nuclide migration data for host rock varies with alkali alteration
Wide area of basement rock affected by alkali alteration
Alkaline alteration of surrounding host rock
Scenario classification
Nuclides absorbed by microbes and migrate as colloids
Natural organic material affects nuclide migration
Colloids exist in natural barrier
Alteration of cement material and dissolution of smectite in buffer material occurs
Dissolution/precipitation, sorption, diffusion, advection - dispersion, etc.
Nitrates affect group 3 waste
Organic material in group 2 is affected in disposal facility
Radiological effects small
Freshwater
Geochmical conditions have small influence on mechanical conditions
Instantaneous re-saturation and nuclide release
Disposal facility is designed such that temperature does not to exceed 80
Supposed phenomenon
Reference case
Analytical case Method
For group 2, nuclide migration data is setup by considering that all organic material is IsoSaccharinic Acid
Effects of organic matter (Contained in waste)
Freshwater is assumed in underground environment.
Groundwater chemistry
Same treatment as that of colloid effectsEffects of microbes
Ground water scenario uncertainty (hypothesis)
Nuclide migration data for host rock varies considering effects of natural organic matter (hypothetical values used)
Effect of organic matter (natural)
Model considers nuclide sorption for colloid.Effect of colloids
Plain and granite is the assumed geological environment. Cement material with pH > 12.5 and Ca type bentonite is assumed. Nuclide migration of host rock occurs through a network of cracks in host rock.
Nuclide migration
For group 3, nuclide migration data is setup by considering an oxidizing condition caused by nitrates and high ion strength
Effects of nitrate
Mechanical stability loss not consideredMechanical conditions
Nuclide leakage starts at saturation after closure of facility
Hydraulic field(re-saturation)
Ground water scenario uncertainty
Nuclide migration and hydraulic parameters vary by cement material and buffer material alteration with time.
Effects of alteration of engineered barrier materials
Not considered.Radiological effects Reference case of the ground water scenario
Not consideredTemperature influence
Uncertainty/CaseTreatment in analysisImportant
conditions etc
Gro
undw
ater
scen
ario
Bas
e sc
enar
ioR
efer
ence
scen
ario
Alte
rnat
ive
scen
ario
Alte
rnat
ive
case
Det
erm
inis
tic c
onse
quen
ce c
alcu
latio
nD
eter
min
istic
con
sequ
ence
cal
cula
tion
and
com
preh
ensi
ve se
nsiti
vity
ana
lysi
s
Future human activity
Natural phenomenon
Future human activity
Initial defects connected with engineered components
Scenario for natural phenomenon
Porous media model is used as a nuclide migration model in the natural barrier
Sealing mistake
Change of waste performance
Change of facility design
Variation of natural barrier data
Change of natural barrier model
Change of geological environment (rock type,
groundwater, topography)
Well drilling caseDrilling and sampling of ceiling
Exploratory drilling
Uplift and erosion
New pathway created by drilling
Climate and sea level change
Uplift and erosion
Analysis of Isolation failure scenarioAccidental future human intrusion
Sealing mistake
Climate and sea level change
Scenario classification
Uplift and erosion
Formation of migration pathway by drilling
Uplift and erosion
Supposed phenomenon Analytical case Method
Improved performance of waste
Data set with various disposal facility designs
Data set considering uncertainty of natural barrier
Analysis of perturbation scenario
Ground water model/parameter uncertainty
Parameter of nuclide migration is set considering variation geological environment
Evaluation of effects of uncertainty of model/parameters for groundwater scenario
Uncertainty/CaseTreatment in analysisImportant
conditions etc
Future human activity
Natural phenomenon
Future human activity
Initial defects connected with engineered components
Scenario for natural phenomenon
Porous media model is used as a nuclide migration model in the natural barrier
Sealing mistake
Change of waste performance
Change of facility design
Variation of natural barrier data
Change of natural barrier model
Change of geological environment (rock type,
groundwater, topography)
Well drilling caseDrilling and sampling of ceiling
Exploratory drilling
Uplift and erosion
New pathway created by drilling
Climate and sea level change
Uplift and erosion
Analysis of Isolation failure scenarioAccidental future human intrusion
Sealing mistake
Climate and sea level change
Scenario classification
Uplift and erosion
Formation of migration pathway by drilling
Uplift and erosion
Supposed phenomenon Analytical case Method
Improved performance of waste
Data set with various disposal facility designs
Data set considering uncertainty of natural barrier
Analysis of perturbation scenario
Ground water model/parameter uncertainty
Parameter of nuclide migration is set considering variation geological environment
Evaluation of effects of uncertainty of model/parameters for groundwater scenario
Uncertainty/CaseTreatment in analysisImportant
conditions etc
Gro
undw
ater
scen
ario
Bas
e sc
enar
io
Alte
rnat
ive
case
Det
erm
inis
tic c
onse
quen
ce
calc
ulat
ion
Det
erm
inis
tic
cons
eque
nce
calc
ulat
ion
and
com
preh
ensi
ve
sens
itivi
ty a
naly
sis
Pert
urba
tion
scen
ario
Isol
atio
n fa
ilure
sc
enar
io
Com
preh
ensi
ve
sens
itivi
ty
anal
ysis
4-135
4.5.2 Analysis of the Reference Case The deterministic consequence calculation of the Reference Case is described in this section. The
assumptions used in the calculation, radionuclide transport datasets, radionuclide transport analytical
models, biosphere models and data, model chain, analytical results and summary are described in sections
4.5.2.1, 4.5.2.2, 4.5.2.3-4.5.2.5, 4.5.2.6, 4.5.2.7, 4.5.2.8 and 4.5.2.9, respectively.
4.5.2.1 Assumptions in the analysis The disposal concept assumptions, radionuclide transport pathways and analytical results of the
deterministic consequence calculations for the Reference Case are summarised below.
(1) Disposal concept
The depth of the disposal facility is assumed to be 1,000 m in crystalline rock (Figure 4.2.4-1). This ensures
reducing groundwater conditions.
(2) Radionuclide transport pathway analysis
・Radionuclide transport pathway in the engineered barrier system:
In the engineered barrier system, radionuclide leaching from the waste and migration through the
buffer and filling materials into the host rock are analyzed. In the Reference Case, waste packages are
present but their radionuclide containment capability is not taken into account. Hence, radionuclides
are assumed to dissolve rapidly from the waste and migrate into the filling material, with the exception
of activation products in stainless steel and ends such as zircaloy.
・Radionuclide transport pathways in the host rock:
Radionuclide migration from the engineered barrier system into the host rock and faults is modelled
based on the radionuclide transport analsysis performed in H12 report (JNC, 2000). In this analysis,
complex geological structures are not considered and the disposal facility is located at a distance of
100 m from a fault. It is assumed that radionuclides migrate in groundwater to the fault which is
located downstream of the facility.
・Radionuclide transport pathways in faults:
An analysis is performed of radionuclide transport through the host rock and into the biosphere
(aquifer) via a fault. A sediment layer above the host rock is assumed to be 200 m thick and it is
assumed that an aquifer is present between the sediment layer and the host rock.
Since the disposal depth is assumed to be 1,000 m, the radionuclide transport distance through the
fault is assumed to be 800 m.
・Radionuclide transport and dose in the biosphere:
It is assumed that radionuclides that migrate from the disposal facility into the host rock will

4-136
eventually enter the biosphere (aquifer) via the fault (Figure 4.5.2-1).
Figure 4.5.2-1 Radionuclide transport pathway in the Reference Case
(3) Assessment period and output from analytical results
The output of analytical results are radionuclide transport rates (Bq/y) and dose (Sv/y) for each waste
Group. In the H12 report, an assessment period of 107 years was considered. In the evaluation in the 1st
performance assemment report for TRU waste it was revealed that the maximum dose was reached after
several 10,000 years and was not exceeded even after 107 years. Hence, the time period for the analyses
was set at 107 years.
(4) Target radionuclides
Radionuclides with high toxicity are selected as target radionuclides for analysis, as in the 1st performance
assemment report for TRU waste disposal and the H12 report. Radionuclides which can be treated as
being in equilibrium with their parent radionuclides are considered in the biosphere assessment.
C-14, Cl-36, Co-60, Ni-59, Ni-63, Se-79, Sr-90, Zr-93
Nb-94 (Nb-93m), Mo-93, Tc-99, Pd-107, Sn-126, I-129, Cs-135, Cs-137
Cm-244→Pu-240→U-236→Th-232→Ra-228→Th-228
Cm-245→Pu-241→Am-241→Np-237→U-233→Th-229
Cm-246→Pu-242→U-238→U-234→Th-230→Ra-226→Pb-210 (Po-210)
Am-243→Pu-239→U-235→Pa-231→Ac-227
4-137
Note: The underlined radionuclides are target radionuclides used in radionuclide transport analyses.
U-234 is taken as the parent radionuclide and Am-242m→Pu-238 is considered in the radionuclide
transport analysis in the engineered barriers. U-234 is added to the radionuclides used in the
analysis. Nb-93m and Po-210 are assumed to be in radioactive equilibrium with their parent
radionuclides.
4.5.2.2 Dataset for radionuclide transport analysis (RAMDA: RAdionuclides Migration DAtaset)
Radionuclide solubilities, effective diffusion coefficients and sorption distribution coefficients (for cement
mortar, bentonite and rock) were specified in a dataset for radionuclide transport analysis (RAMDA,
Mihara and Sasaki (2005)). This dataset considers the chemical variations in the engineered barriers for
TRU waste disposal. Data used in the Reference Case are taken from this database as outlined below.
(1) Solubilities ( eC* )
Radionuclide solubilities are strongly affected by the chemical composition and pH of pore water in cement
mortar. The pH of the pore water and the long-term chemical evolution in cement mortar are divided into 3
regions (Regions I, II and III in Figure 4.4.2.2-1). Based on calculations using a geochemical equilibrium
model (JNC-TDB) (Yoshida and Shibata, 2005), the solubilities of elements for which there are insufficient
thermodynamic data are defined by referring to chemical analogues and/or experimental data.
(2) Effective diffusion coefficients ( eDe ) For cement mortar, the effective diffusion coefficient is specified as a function of porosity based on
measurements of tritium. Moreover, for cracked cement mortar, the diffusion coefficient in pore water is
set as being the same as that in free water. For buffer material, the effective diffusion coefficient is also
specified as a function of porosity and amount of smectite, which is obtained from experimental data.
(3) Sorption distribution coefficients ( eα ) Sorption distribution coefficients for each element in cement mortar are specified for Regions I, II and III
as described in (1). Pore spacing in the cement mortar is considered to be much larger than that in the
buffer material. The specific surface area is kept roughly constant and does not depend on the degree of
granulation of hardened cement paste (Bradbury and Sarott, 1994). The measured values obtained from
batch-type sorption experiments are applied.
For buffer material, the sorption distribution coefficients are specified for bentonite below pH 11, bentonite
above pH 11 and altered bentonite above pH 11. Since it has been reported that pore water in the buffer
material has different properties to those of free water (e.g. Torikai et al., 1996), the sorption distribution
coefficient is not applied directly in the radionuclide transport assessment. As in the H12 report, the
4-138
sorption distribution coefficient is specified from the diffusion coefficient of radionuclides in compacted
bentonite.
The sorption distribution coefficient of host rock is specified based on data for each rock type, ionic
strength and redox conditions, and by referring to the H12 report.
Sorption distribution coefficients are obtained from experimental data. However, in cases where there are
no experimental data, the values are estimated from radionuclides that have similar chemical properties.
4.5.2.3 Models and parameters of the engineered barriers In the radionuclide transport analysis in the engineered barrier system, radionuclide dissolution from the
waste, retardation and decay of radionuclides in the filling material and buffer material are evaluated.
Radionuclides in the host rock that have penetrated the buffer and filling materials are then evaluated.
Here, a model concept for radionuclide transport analysis in the engineered barriers is described and a
mathematical model is established.
(1) Radionuclide transport analysis model in the engineered barriers
The model outline, mathematical formulation and analysis code for radionuclide transport in the engineered
barriers in the Reference Case are described here.
a. Model outline
In order to construct a model for radionuclide transport in the engineered barriers, the following
assumptions are assumed.
・ The temperature in the disposal facility remains below 80. Taking into account an envisaged 1,000
m disposal depth, the host rock temperature is estimated to be 45.
・ The disposal facility is rapidly saturated by groundwater after repository closure.
・ Radionuclides (activation products) in metal of Group 2 waste dissolve into the filling material due to
metal corrosion. For other waste, the radionuclides dissolve rapidly into the filling material after
closure of the repository.
・ The pH of the pore water in the filling material remains above 12.5 (Regions I, II) over the long term
due to the dissolution of cement hydrates.
・ The composition of the pore water of the filling material is controlled by chemical equilibulium of
cement hydrates and groundwater. In the case where buffer material is used, the solubility of
radionuclides is based on the composition of pore water in the filling material. In the case where buffer
material is not used, it is assumed that colloids will form.
・ The concentration of radionuclides in the pore water of filling material is constrained by solubility.
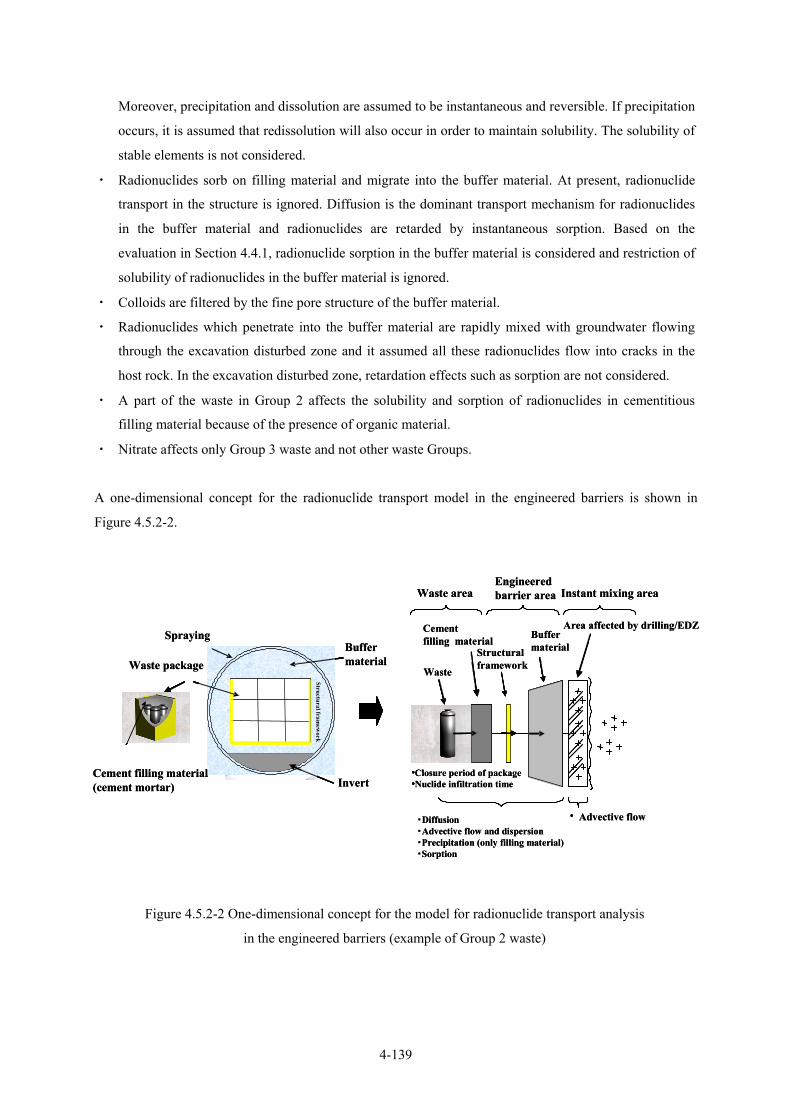
4-139
Moreover, precipitation and dissolution are assumed to be instantaneous and reversible. If precipitation
occurs, it is assumed that redissolution will also occur in order to maintain solubility. The solubility of
stable elements is not considered.
・ Radionuclides sorb on filling material and migrate into the buffer material. At present, radionuclide
transport in the structure is ignored. Diffusion is the dominant transport mechanism for radionuclides
in the buffer material and radionuclides are retarded by instantaneous sorption. Based on the
evaluation in Section 4.4.1, radionuclide sorption in the buffer material is considered and restriction of
solubility of radionuclides in the buffer material is ignored.
・ Colloids are filtered by the fine pore structure of the buffer material.
・ Radionuclides which penetrate into the buffer material are rapidly mixed with groundwater flowing
through the excavation disturbed zone and it assumed all these radionuclides flow into cracks in the
host rock. In the excavation disturbed zone, retardation effects such as sorption are not considered.
・ A part of the waste in Group 2 affects the solubility and sorption of radionuclides in cementitious
filling material because of the presence of organic material.
・ Nitrate affects only Group 3 waste and not other waste Groups.
A one-dimensional concept for the radionuclide transport model in the engineered barriers is shown in
Figure 4.5.2-2.
Figure 4.5.2-2 One-dimensional concept for the model for radionuclide transport analysis
in the engineered barriers (example of Group 2 waste)
•Closure period of package•Nuclide infiltration time
・Diffusion・Advective flow and dispersion・Precipitation (only filling material)・Sorption
•
Invert
構造躯体
Engineered barrier area
BuffermaterialStructural
framework
Cement filling material
Area affected by drilling/EDZ
Waste
••
Waste area Instant mixing area
• Advective flow
構造躯体
Waste package
Spraying
Structural framew
ork
Cement filling material(cement mortar)
Buffermaterial
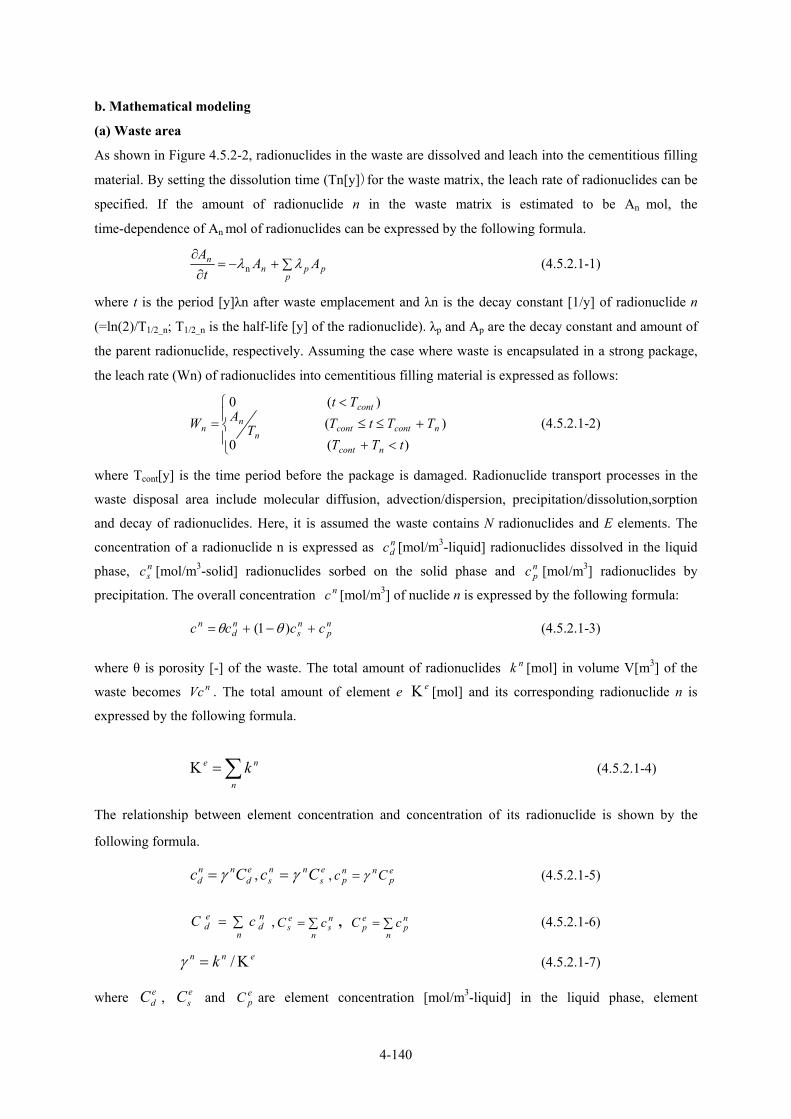
4-140
b. Mathematical modeling
(a) Waste area
As shown in Figure 4.5.2-2, radionuclides in the waste are dissolved and leach into the cementitious filling
material. By setting the dissolution time (Tn[y])for the waste matrix, the leach rate of radionuclides can be
specified. If the amount of radionuclide n in the waste matrix is estimated to be An mol, the
time-dependence of An mol of radionuclides can be expressed by the following formula.
pp
pnn AAt
A∑+−=
∂∂
λλn (4.5.2.1-1)
where t is the period [y]λn after waste emplacement and λn is the decay constant [1/y] of radionuclide n
(=ln(2)/T1/2_n; T1/2_n is the half-life [y] of the radionuclide). λp and Ap are the decay constant and amount of
the parent radionuclide, respectively. Assuming the case where waste is encapsulated in a strong package,
the leach rate (Wn) of radionuclides into cementitious filling material is expressed as follows:
⎪⎩
⎪⎨
⎧
<+
+≤≤
<
=
)(0)(
)(0
tTTTTtTT
ATt
W
ncont
ncontcontn
ncont
n
(4.5.2.1-2)
where Tcont[y] is the time period before the package is damaged. Radionuclide transport processes in the
waste disposal area include molecular diffusion, advection/dispersion, precipitation/dissolution,sorption
and decay of radionuclides. Here, it is assumed the waste contains N radionuclides and E elements. The
concentration of a radionuclide n is expressed as ndc [mol/m3-liquid] radionuclides dissolved in the liquid
phase, nsc [mol/m3-solid] radionuclides sorbed on the solid phase and n
pc [mol/m3] radionuclides by
precipitation. The overall concentration nc [mol/m3] of nuclide n is expressed by the following formula:
np
ns
nd
n cccc +−+= )1( θθ (4.5.2.1-3)
where θ is porosity [-] of the waste. The total amount of radionuclides nk [mol] in volume V[m3] of the
waste becomes nVc . The total amount of element e eΚ [mol] and its corresponding radionuclide n is
expressed by the following formula.
∑=Κn
ne k (4.5.2.1-4)
The relationship between element concentration and concentration of its radionuclide is shown by the
following formula.
ed
nnd Cc γ= , e
snn
s Cc γ= , ep
nnp Cc γ= (4.5.2.1-5)
∑=n
nd
ed cC , ∑=
n
ns
es cC , ∑=
n
np
ep cC (4.5.2.1-6)
enn k Κ= /γ (4.5.2.1-7)
where edC , e
sC and epC are element concentration [mol/m3-liquid] in the liquid phase, element
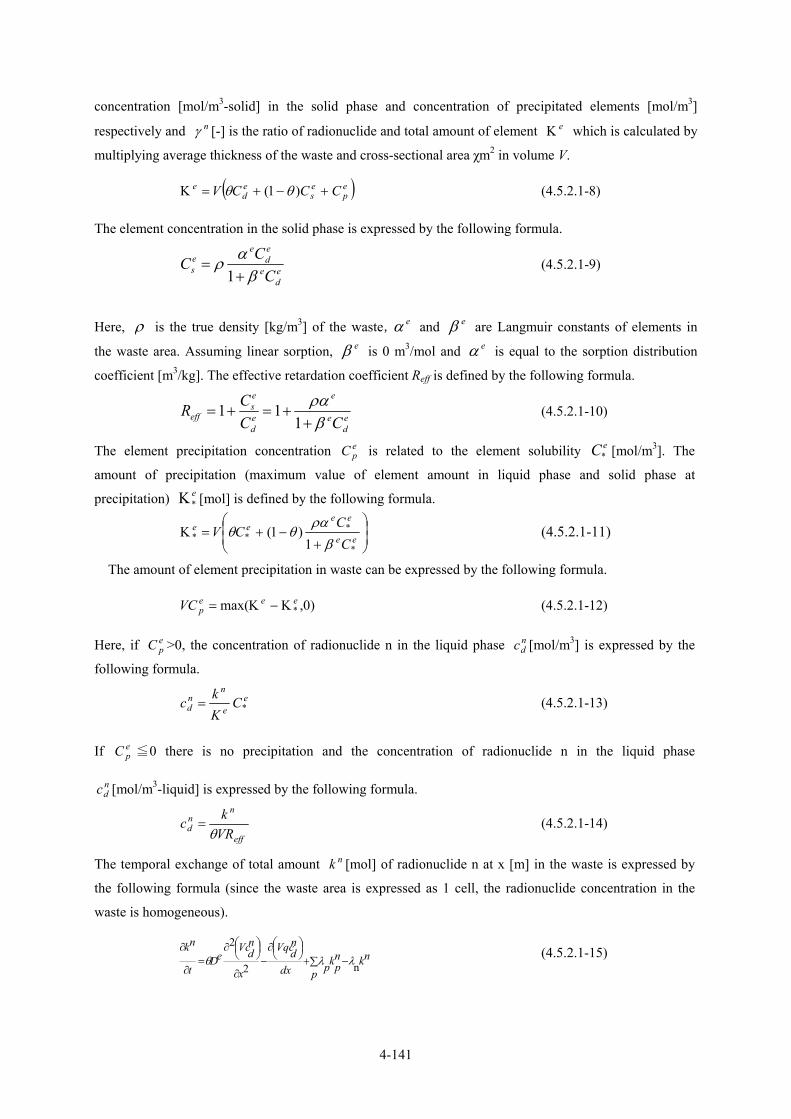
4-141
concentration [mol/m3-solid] in the solid phase and concentration of precipitated elements [mol/m3]
respectively and nγ [-] is the ratio of radionuclide and total amount of element eΚ which is calculated by
multiplying average thickness of the waste and cross-sectional area χm2 in volume V.
( )ep
es
ed
e CCCV +−+=Κ )1( θθ (4.5.2.1-8)
The element concentration in the solid phase is expressed by the following formula.
ed
e
ed
ees C
CCβ
αρ+
=1
(4.5.2.1-9)
Here, ρ is the true density [kg/m3] of the waste,eα and eβ are Langmuir constants of elements in
the waste area. Assuming linear sorption, eβ is 0 m3/mol and eα is equal to the sorption distribution
coefficient [m3/kg]. The effective retardation coefficient Reff is defined by the following formula.
ed
e
e
ed
es
eff CCCR
βρα+
+=+=1
11 (4.5.2.1-10)
The element precipitation concentration epC is related to the element solubility eC* [mol/m3]. The
amount of precipitation (maximum value of element amount in liquid phase and solid phase at
precipitation) e*Κ [mol] is defined by the following formula.
⎟⎟⎠
⎞⎜⎜⎝
⎛
+−+=Κ
ee
eeee
CC
CV*
*** 1
)1(β
ραθθ (4.5.2.1-11)
The amount of element precipitation in waste can be expressed by the following formula.
)0,max( *eee
pVC Κ−Κ= (4.5.2.1-12)
Here, if epC >0, the concentration of radionuclide n in the liquid phase n
dc [mol/m3] is expressed by the
following formula.
ee
nnd C
Kkc *= (4.5.2.1-13)
If epC ≦0 there is no precipitation and the concentration of radionuclide n in the liquid phase
ndc [mol/m3-liquid] is expressed by the following formula.
eff
nnd VR
kcθ
= (4.5.2.1-14)
The temporal exchange of total amount nk [mol] of radionuclide n at x [m] in the waste is expressed by
the following formula (since the waste area is expressed as 1 cell, the radionuclide concentration in the
waste is homogeneous).
nknpk
p pdx
ndVqc
x
ndVc
eDt
nk
n2
2
λλθ −∑+⎟⎠⎞⎜
⎝⎛∂
−∂
⎟⎠⎞⎜
⎝⎛∂
=∂
∂ (4.5.2.1-15)
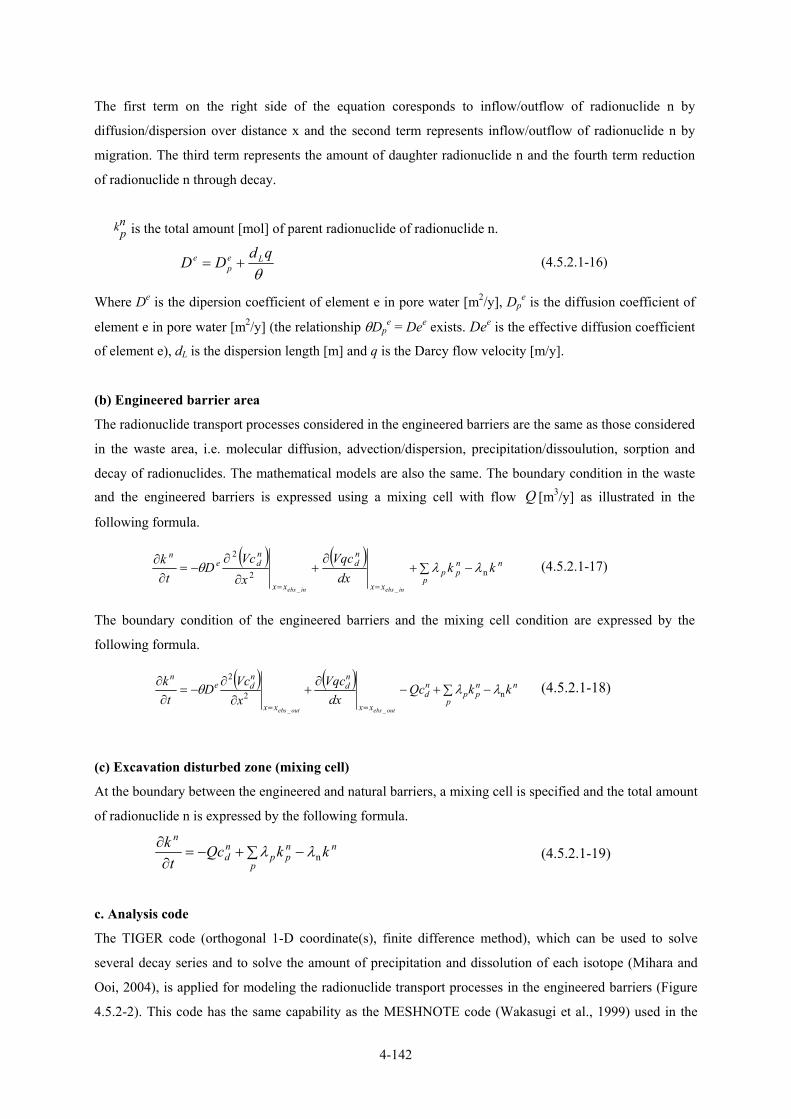
4-142
The first term on the right side of the equation coresponds to inflow/outflow of radionuclide n by
diffusion/dispersion over distance x and the second term represents inflow/outflow of radionuclide n by
migration. The third term represents the amount of daughter radionuclide n and the fourth term reduction
of radionuclide n through decay.
is the total amount [mol] of parent radionuclide of radionuclide n.
θqdDD Le
pe += (4.5.2.1-16)
Where De is the dipersion coefficient of element e in pore water [m2/y], Dpe is the diffusion coefficient of
element e in pore water [m2/y] (the relationship θDpe = Dee exists. Dee is the effective diffusion coefficient
of element e), dL is the dispersion length [m] and q is the Darcy flow velocity [m/y].
(b) Engineered barrier area
The radionuclide transport processes considered in the engineered barriers are the same as those considered
in the waste area, i.e. molecular diffusion, advection/dispersion, precipitation/dissoulution, sorption and
decay of radionuclides. The mathematical models are also the same. The boundary condition in the waste
and the engineered barriers is expressed using a mixing cell with flow Q [m3/y] as illustrated in the
following formula.
( ) ( ) nnp
pp
xx
nd
xx
nde
nkk
dxVqc
xVc
Dt
k
inebsinebs
n2
2
__
λλθ −∑+∂
+∂
∂−=
∂∂
==
(4.5.2.1-17)
The boundary condition of the engineered barriers and the mixing cell condition are expressed by the
following formula.
( ) ( ) nnp
pp
nd
xx
nd
xx
nde
nkkQc
dxVqc
xVcD
tk
outebsoutebs
n2
2
__
λλθ −∑+−∂
+∂
∂−=
∂∂
==
(4.5.2.1-18)
(c) Excavation disturbed zone (mixing cell)
At the boundary between the engineered and natural barriers, a mixing cell is specified and the total amount
of radionuclide n is expressed by the following formula.
nnp
pp
nd
nkkQc
tk
nλλ −∑+−=∂∂
(4.5.2.1-19)
c. Analysis code
The TIGER code (orthogonal 1-D coordinate(s), finite difference method), which can be used to solve
several decay series and to solve the amount of precipitation and dissolution of each isotope (Mihara and
Ooi, 2004), is applied for modeling the radionuclide transport processes in the engineered barriers (Figure
4.5.2-2). This code has the same capability as the MESHNOTE code (Wakasugi et al., 1999) used in the
npk
4-143
H12 report and outputs from both are compared (Mihara and Ooi, 2004).
(2) Data
a. Cross-sectional shape of the disposal tunnel
The emplacement density of waste in the disposal tunnel depends on the shape of the package for each
waste type. Hence, in the radionuclide transport analysis in the engineered barrier system, several disposal
tunnel cross-sections are used (Table 4.2.4-1 in Section 4.2.4).
b. Inventory
The inventory described in Section 4.2.3 is used. Since there is the possiblity that some C-14 is organic
(Yamaguchi et al.1999), the chemical form of some C-14 is also treated as organic in the model. The
low-level waste (Gr3-B) of BNGS in Group 3 is assumed to be inorganic since C-14 exists as BaCO3.
c. Containment function of the waste package
The radionuclide containment function of the waste package is not taken into account. Hence, it is assumed
that waste comes into contact with groundwater after closure.
d. Radionuclides in metal in Group 2 waste
As described in Section 4.5.2.3(1)a, it is assumed that the radionuclides in metal in this waste group
dissolve with metal corrosion. Hence, the percentatge of radionuclides in the metal should be specified. For
each metal in Group 2 waste, the percentage of C-14, Cl-36, Co-60, Ni-59, Ni-63, Se-79, Zr-93, Nb-94 and
Mo-93 is specified. Representative metals considered in Group 2 waste are zircaloy used as an insulator for
fuel rods, stainless steel upper and lower nozzles in fuel assemblies and inconel lattice supports of fuel rods.
The radionuclide percentages in these metals are summarized in Table 4.5.2-1. It has been reported that
20% of an insulator (zircaloy) of spent fuel is oxidized (Yamaguchi et al., 1999) and that 20% of activation
products exist the oxidized film.
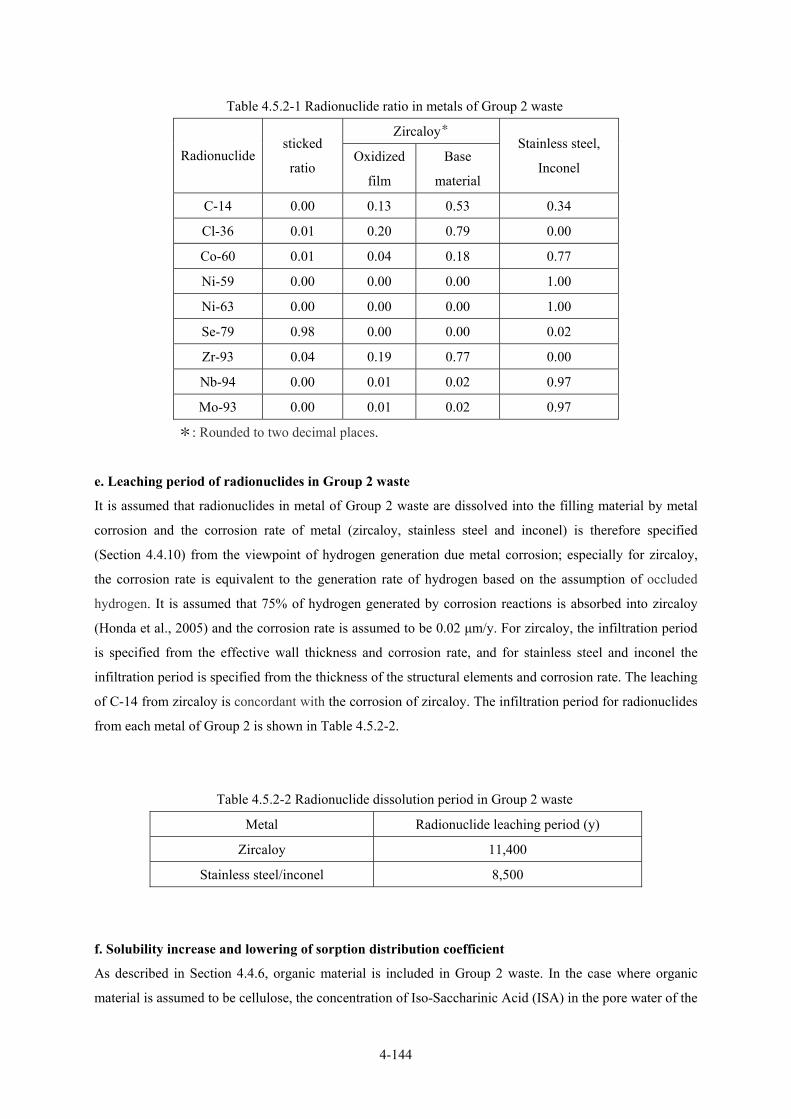
4-144
Table 4.5.2-1 Radionuclide ratio in metals of Group 2 waste
Zircaloy*
Radionuclide sticked
ratio Oxidized
film
Base
material
Stainless steel,
Inconel
C-14 0.00 0.13 0.53 0.34
Cl-36 0.01 0.20 0.79 0.00
Co-60 0.01 0.04 0.18 0.77
Ni-59 0.00 0.00 0.00 1.00
Ni-63 0.00 0.00 0.00 1.00
Se-79 0.98 0.00 0.00 0.02
Zr-93 0.04 0.19 0.77 0.00
Nb-94 0.00 0.01 0.02 0.97
Mo-93 0.00 0.01 0.02 0.97
*: Rounded to two decimal places.
e. Leaching period of radionuclides in Group 2 waste
It is assumed that radionuclides in metal of Group 2 waste are dissolved into the filling material by metal
corrosion and the corrosion rate of metal (zircaloy, stainless steel and inconel) is therefore specified
(Section 4.4.10) from the viewpoint of hydrogen generation due metal corrosion; especially for zircaloy,
the corrosion rate is equivalent to the generation rate of hydrogen based on the assumption of occluded
hydrogen. It is assumed that 75% of hydrogen generated by corrosion reactions is absorbed into zircaloy
(Honda et al., 2005) and the corrosion rate is assumed to be 0.02 µm/y. For zircaloy, the infiltration period
is specified from the effective wall thickness and corrosion rate, and for stainless steel and inconel the
infiltration period is specified from the thickness of the structural elements and corrosion rate. The leaching
of C-14 from zircaloy is concordant with the corrosion of zircaloy. The infiltration period for radionuclides
from each metal of Group 2 is shown in Table 4.5.2-2.
Table 4.5.2-2 Radionuclide dissolution period in Group 2 waste
Metal Radionuclide leaching period (y)
Zircaloy 11,400
Stainless steel/inconel 8,500
f. Solubility increase and lowering of sorption distribution coefficient
As described in Section 4.4.6, organic material is included in Group 2 waste. In the case where organic
material is assumed to be cellulose, the concentration of Iso-Saccharinic Acid (ISA) in the pore water of the

4-145
filling material does not exceed 10-5 mol/dm3 (cf. Section 4.4.6.2). Solubility enhancement factors (SEF)
for actinides and Tc (Bradbury and Sarott, 1994) are shown in Table 4.5.2-3. If the concentration of ISA is
10-5 mol/dm3, the solubility of tetravalent and trivalent actinides increases by a factor of 20.
Table 4.5.2-3 Solubility enhancement factors (SEF) for actinides and Tc (Bradbury and Sarott, 1994)
ISA
concentration
(mol/dm3)
Pu(Ⅳ) Am(Ⅲ) Th(Ⅳ) U(Ⅵ) Np(Ⅳ) Tc(Ⅳ)
10-6 1 1 1 1 1 1
10-5 20 20 20 1 1 1
10-4 500 500 500 2 2 1
10-3 20,000 20,000 20,000 100 100 10
10-2 1,000,000 1,000,000 1,000,000 5,000 5,000 500
Based on these results, for the actinides with tetravalent and trivalent bonds, the SEF is set to a
conservative value of 20. The effect of ISA is ignored as this has previously been reported as being small
(Bradbury and Sarott, 1994). Bradbury and Sarott (1994) reports that the sorption reduction factor (SRF)
is assumed to be equal to SEF; SEF and SRF are specified as shown in Table 4.5.2-4.
Table 4.5.2-4 Specified values for solubility enhancement factor (SEF) and sorption reduction factor (SRF)
Element SEF and SRF
Pu, Th, U, Np, Pa 20
Am, Cm, Ac 20
Zr, Sn 20
Other elements 1
g. Solubility
Alkaline (pH >12.5) conditions in the filling material are maintained over the long term as described in
Section 4.4.2. For setting the solubility in Region I (pH 13.2) and Region II (pH 12.5) in the radionuclide
migration dataset, RAMDA, large values are used. The solubility of Groups 1 and 2 is considered for parts
with cementitious filling material and it is assumed that not all radionuclides are precipitated in buffer
material, as described in Section 4.5.2.3(1)a. For Groups 3 and 4, buffer material is not used, radionuclides
do not precipitate and the effects of colloid formation are considered from a conservative point of view.
The solubilities of each element are shown in Table 4.5.2-5.
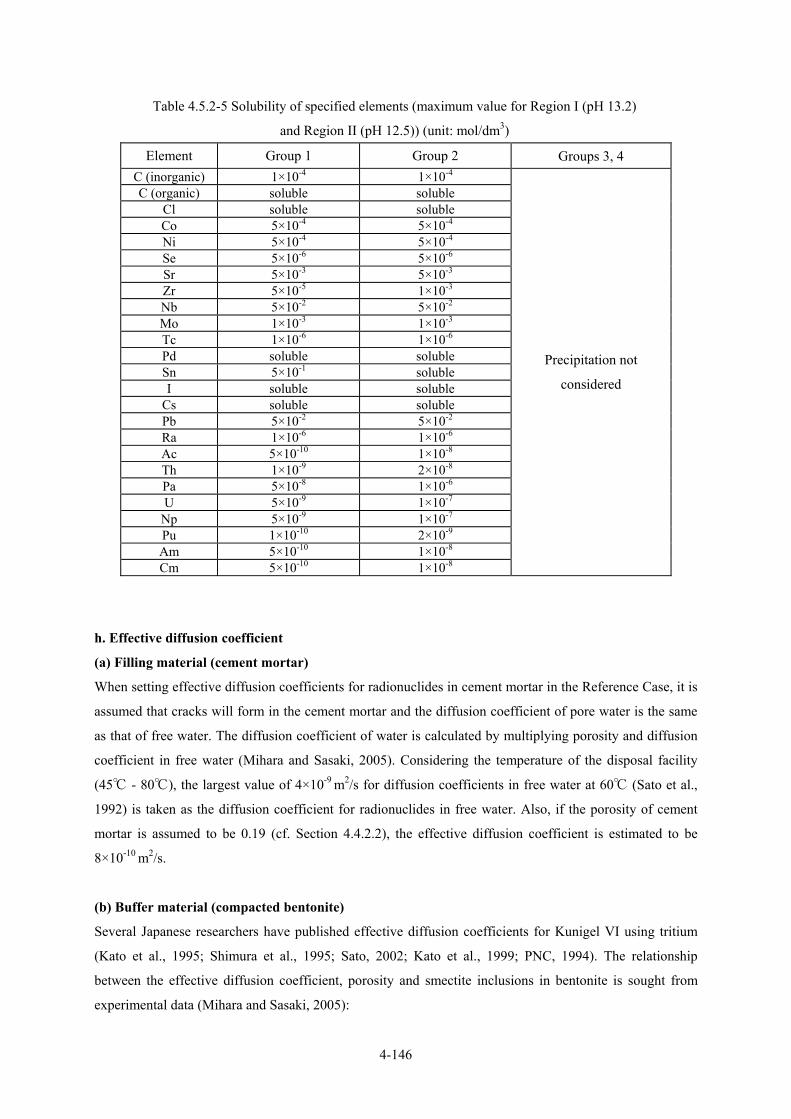
4-146
Table 4.5.2-5 Solubility of specified elements (maximum value for Region I (pH 13.2)
and Region II (pH 12.5)) (unit: mol/dm3)
Element Group 1 Group 2 Groups 3, 4 C (inorganic) 1×10⁻⁴ 1×10⁻⁴ C (organic) soluble soluble
Cl soluble soluble Co 5×10⁻⁴ 5×10⁻⁴ Ni 5×10⁻⁴ 5×10⁻⁴ Se 5×10⁻⁶ 5×10⁻⁶ Sr 5×10⁻³ 5×10⁻³ Zr 5×10⁻⁵ 1×10⁻³ Nb 5×10⁻² 5×10⁻² Mo 1×10⁻³ 1×10⁻³ Tc 1×10⁻⁶ 1×10⁻⁶ Pd soluble soluble Sn 5×10⁻¹ soluble I soluble soluble
Cs soluble soluble Pb 5×10⁻² 5×10⁻² Ra 1×10⁻⁶ 1×10⁻⁶ Ac 5×10⁻¹⁰ 1×10⁻⁸ Th 1×10⁻⁹ 2×10⁻⁸ Pa 5×10⁻⁸ 1×10⁻⁶ U 5×10⁻⁹ 1×10⁻⁷
Np 5×10⁻⁹ 1×10⁻⁷ Pu 1×10⁻¹⁰ 2×10⁻⁹ Am 5×10⁻¹⁰ 1×10⁻⁸ Cm 5×10⁻¹⁰ 1×10⁻⁸
Precipitation not
considered
h. Effective diffusion coefficient
(a) Filling material (cement mortar)
When setting effective diffusion coefficients for radionuclides in cement mortar in the Reference Case, it is
assumed that cracks will form in the cement mortar and the diffusion coefficient of pore water is the same
as that of free water. The diffusion coefficient of water is calculated by multiplying porosity and diffusion
coefficient in free water (Mihara and Sasaki, 2005). Considering the temperature of the disposal facility
(45 - 80), the largest value of 4×10⁻⁹ m2/s for diffusion coefficients in free water at 60 (Sato et al.,
1992) is taken as the diffusion coefficient for radionuclides in free water. Also, if the porosity of cement
mortar is assumed to be 0.19 (cf. Section 4.4.2.2), the effective diffusion coefficient is estimated to be
8×10⁻¹⁰ m2/s.
(b) Buffer material (compacted bentonite)
Several Japanese researchers have published effective diffusion coefficients for Kunigel VI using tritium
(Kato et al., 1995; Shimura et al., 1995; Sato, 2002; Kato et al., 1999; PNC, 1994). The relationship
between the effective diffusion coefficient, porosity and smectite inclusions in bentonite is sought from
experimental data (Mihara and Sasaki, 2005):
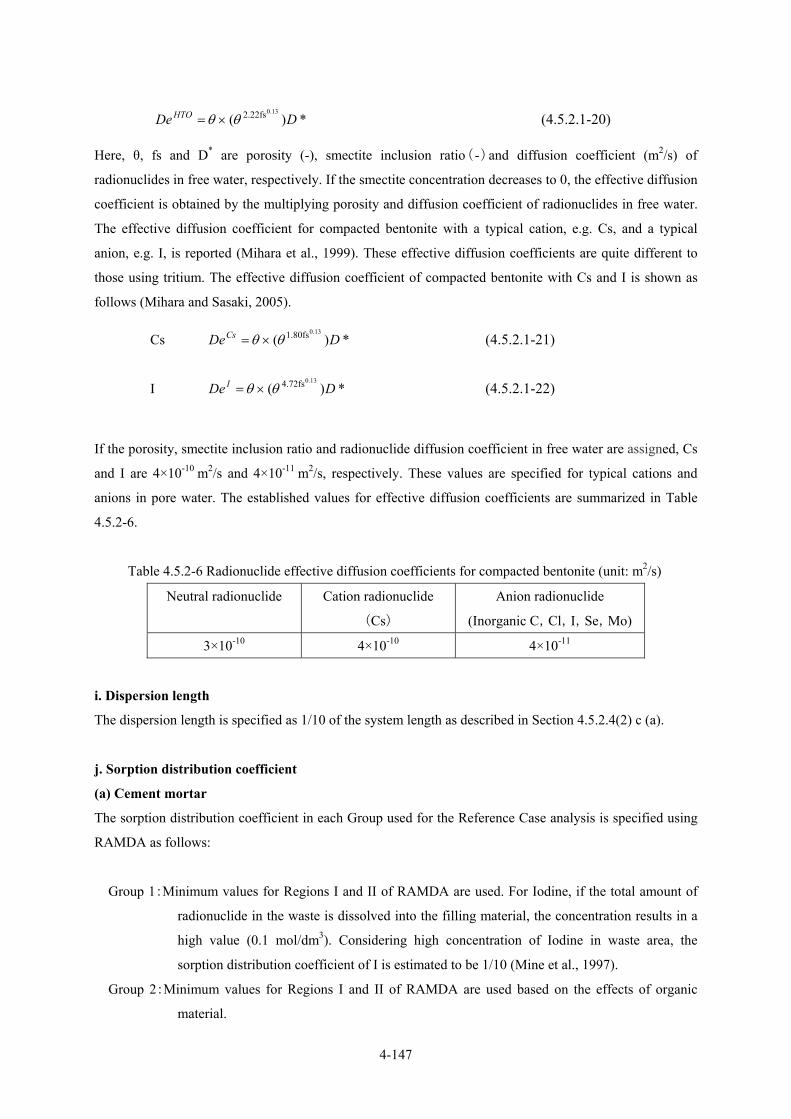
4-147
*)(0.132.22fs DDe HTO θθ ×= (4.5.2.1-20)
Here, θ, fs and D* are porosity (-), smectite inclusion ratio(-)and diffusion coefficient (m2/s) of
radionuclides in free water, respectively. If the smectite concentration decreases to 0, the effective diffusion
coefficient is obtained by the multiplying porosity and diffusion coefficient of radionuclides in free water.
The effective diffusion coefficient for compacted bentonite with a typical cation, e.g. Cs, and a typical
anion, e.g. I, is reported (Mihara et al., 1999). These effective diffusion coefficients are quite different to
those using tritium. The effective diffusion coefficient of compacted bentonite with Cs and I is shown as
follows (Mihara and Sasaki, 2005).
Cs *)(0.131.80fs DDeCs θθ ×= (4.5.2.1-21)
I *)(0.134.72fs DDe I θθ ×= (4.5.2.1-22)
If the porosity, smectite inclusion ratio and radionuclide diffusion coefficient in free water are assigned, Cs
and I are 4×10⁻¹⁰ m2/s and 4×10-11 m2/s, respectively. These values are specified for typical cations and
anions in pore water. The established values for effective diffusion coefficients are summarized in Table
4.5.2-6.
Table 4.5.2-6 Radionuclide effective diffusion coefficients for compacted bentonite (unit: m2/s)
Neutral radionuclide Cation radionuclide
(Cs)
Anion radionuclide
(Inorganic C,Cl,I,Se,Mo)
3×10⁻¹⁰ 4×10⁻¹⁰ 4×10-11
i. Dispersion length
The dispersion length is specified as 1/10 of the system length as described in Section 4.5.2.4(2) c (a).
j. Sorption distribution coefficient
(a) Cement mortar
The sorption distribution coefficient in each Group used for the Reference Case analysis is specified using
RAMDA as follows:
Group 1:Minimum values for Regions I and II of RAMDA are used. For Iodine, if the total amount of
radionuclide in the waste is dissolved into the filling material, the concentration results in a
high value (0.1 mol/dm3). Considering high concentration of Iodine in waste area, the
sorption distribution coefficient of I is estimated to be 1/10 (Mine et al., 1997).
Group 2:Minimum values for Regions I and II of RAMDA are used based on the effects of organic
material.

4-148
Group 3:Minimum values for Regions I and II of RAMDA are used considering the effects of nitrates
and an oxidizing environment of seawater type groundwater.
Group 4:Minimum values for Regions I and II of RAMDA are used.
Sorption distribution coefficients for cement mortar are summarized in Table 4.5.2-7.

4-149
Table 4.5.2-7 Sorption distribution coefficients for elements in cement mortar (unit: m3/kg)
Group 1 Group 2 Group 3 Group 4 C
(inorganic) 0.25 0.25 0.25 0.25
C (organic) 0.00025 0.00025 0 0.00025
Cl 0 0 0 0
Co 0.0125 0.0125 0.0125 0.0125
Ni 0.0125 0.0125 0.0125 0.0125
Se 0.0025 0.0025 0 0.0025
Sr 0.00125 0.00125 0.00125 0.00125
Zr 2.5 0.125 2.5 2.5
Nb 0 0 0 0
Mo 0.0025 0.0025 0.00025 0.0025
Tc 2.5 2.5 0 2.5
Pd 0.0125 0.0125 0.0125 0.0125
Sn 2.5 0.125 2.5 2.5
I 0.000125 0.00125 0 0.00125
Cs 0.0025 0.0025 0.0025 0.0025
Pb 0.0125 0.0125 0.0125 0.0125
Ra 0.00125 0.00125 0.00125 0.00125
Ac 0.25 0.0125 0.25 0.25
Th 0.25 0.0125 0.25 0.25
Pa 0.25 0.0125 0.25 0.25
U 0.25 0.0125 0.025 0.25
Np 0.25 0.0125 0.25 0.25
Pu 0.25 0.0125 0.025 0.25
Am 0.25 0.0125 0.25 0.25
Cm 0.25 0.0125 0.25 0.25
(b) Buffer material (compacted bentonite)
For the sorption distribution coefficient of each element used for analysis in the Reference Case, the
minimum value for the sorption distribution coefficient for bentonite (< pH 11 and > pH 11) is selected
from the RAMDA data. The selected sorption distribution coefficients are summarized in Table 4.5.2-8.
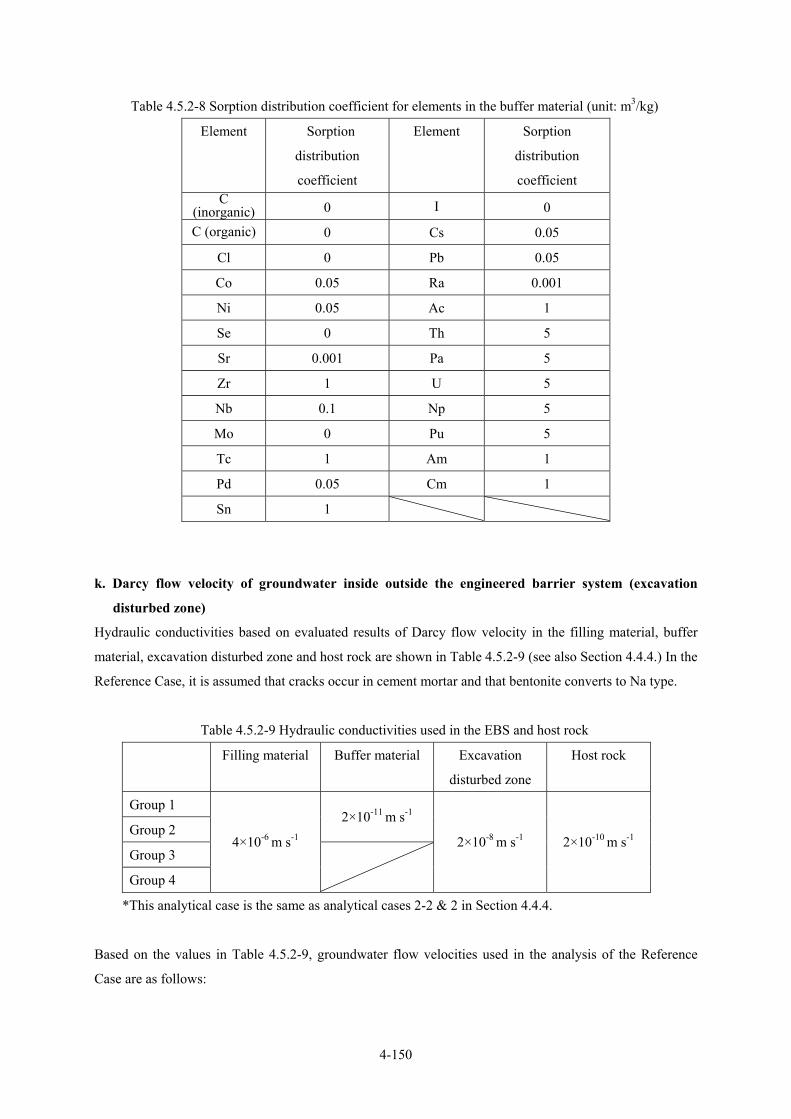
4-150
Table 4.5.2-8 Sorption distribution coefficient for elements in the buffer material (unit: m3/kg)
Element Sorption
distribution
coefficient
Element Sorption
distribution
coefficient C
(inorganic) 0 I 0
C (organic) 0 Cs 0.05
Cl 0 Pb 0.05
Co 0.05 Ra 0.001
Ni 0.05 Ac 1
Se 0 Th 5
Sr 0.001 Pa 5
Zr 1 U 5
Nb 0.1 Np 5
Mo 0 Pu 5
Tc 1 Am 1
Pd 0.05 Cm 1
Sn 1
k. Darcy flow velocity of groundwater inside outside the engineered barrier system (excavation
disturbed zone)
Hydraulic conductivities based on evaluated results of Darcy flow velocity in the filling material, buffer
material, excavation disturbed zone and host rock are shown in Table 4.5.2-9 (see also Section 4.4.4.) In the
Reference Case, it is assumed that cracks occur in cement mortar and that bentonite converts to Na type.
Table 4.5.2-9 Hydraulic conductivities used in the EBS and host rock
Filling material Buffer material Excavation
disturbed zone
Host rock
Group 1
Group 2 2×10-11 m s-1
Group 3
Group 4
4×10⁻⁶ m s-1
2×10⁻⁸ m s-1 2×10⁻¹⁰ m s-1
*This analytical case is the same as analytical cases 2-2 & 2 in Section 4.4.4.
Based on the values in Table 4.5.2-9, groundwater flow velocities used in the analysis of the Reference
Case are as follows:
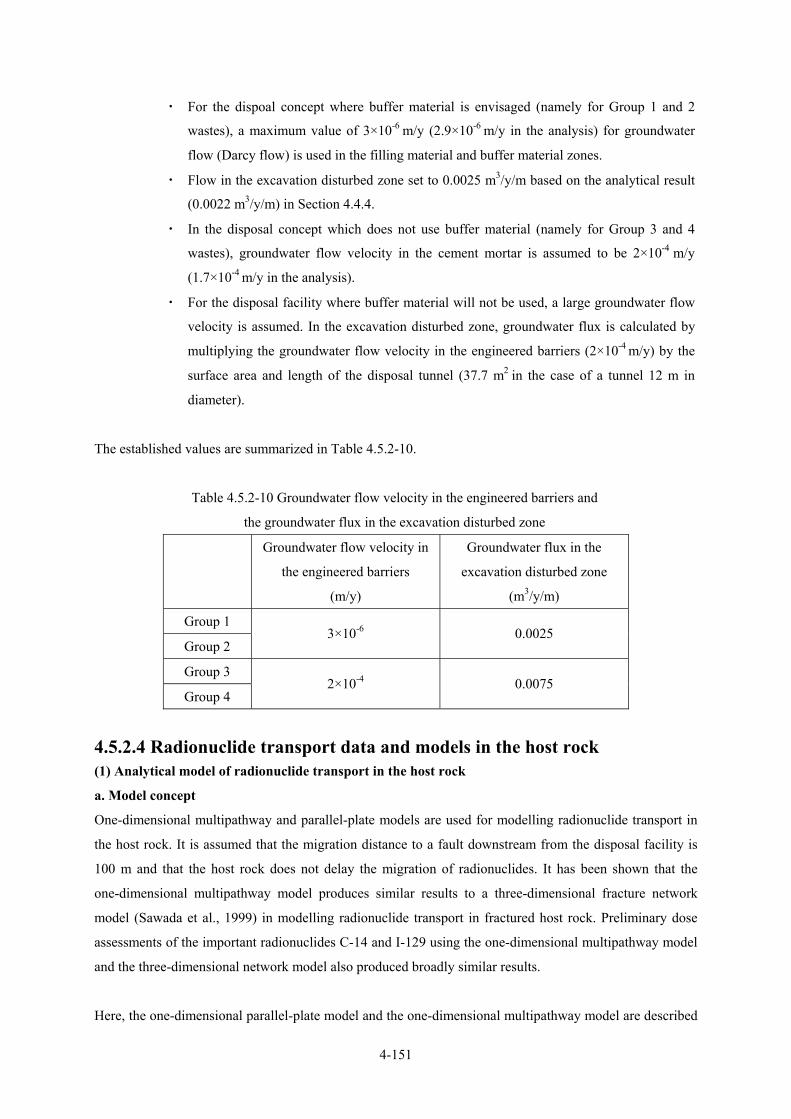
4-151
・ For the dispoal concept where buffer material is envisaged (namely for Group 1 and 2
wastes), a maximum value of 3×10⁻⁶ m/y (2.9×10⁻⁶ m/y in the analysis) for groundwater
flow (Darcy flow) is used in the filling material and buffer material zones.
・ Flow in the excavation disturbed zone set to 0.0025 m3/y/m based on the analytical result
(0.0022 m3/y/m) in Section 4.4.4.
・ In the disposal concept which does not use buffer material (namely for Group 3 and 4
wastes), groundwater flow velocity in the cement mortar is assumed to be 2×10⁻⁴ m/y
(1.7×10⁻⁴ m/y in the analysis).
・ For the disposal facility where buffer material will not be used, a large groundwater flow
velocity is assumed. In the excavation disturbed zone, groundwater flux is calculated by
multiplying the groundwater flow velocity in the engineered barriers (2×10⁻⁴ m/y) by the
surface area and length of the disposal tunnel (37.7 m2 in the case of a tunnel 12 m in
diameter).
The established values are summarized in Table 4.5.2-10.
Table 4.5.2-10 Groundwater flow velocity in the engineered barriers and
the groundwater flux in the excavation disturbed zone
Groundwater flow velocity in
the engineered barriers
(m/y)
Groundwater flux in the
excavation disturbed zone
(m3/y/m)
Group 1
Group 2 3×10⁻⁶ 0.0025
Group 3
Group 4 2×10⁻⁴ 0.0075
4.5.2.4 Radionuclide transport data and models in the host rock (1) Analytical model of radionuclide transport in the host rock
a. Model concept
One-dimensional multipathway and parallel-plate models are used for modelling radionuclide transport in
the host rock. It is assumed that the migration distance to a fault downstream from the disposal facility is
100 m and that the host rock does not delay the migration of radionuclides. It has been shown that the
one-dimensional multipathway model produces similar results to a three-dimensional fracture network
model (Sawada et al., 1999) in modelling radionuclide transport in fractured host rock. Preliminary dose
assessments of the important radionuclides C-14 and I-129 using the one-dimensional multipathway model
and the three-dimensional network model also produced broadly similar results.
Here, the one-dimensional parallel-plate model and the one-dimensional multipathway model are described

4-152
(JNC, 2000).
(a) One-dimensional parallel-plate model
The one-dimensional parallel-plate model is widely used in performance assessments of geological
repositories by modelling radionuclide transport in fractured host rocks. In this model, the flow in the rock
matrix is ignored and radionuclide transport by advection/dispersion in cracks, diffusion (matrix diffusion)
into the rock matrix from cracks and sorption onto the surface of mineral grains in the rock matrix are
considered. The concept of the one-dimensional parallel-plate model is shown in Figure 4.5.2-3.
Figure 4.5.2-3 Conceptual illustration of the one-dimensional parallel-plate model
used in radionuclide transport analysis in the natural barrier
The model simplifications are as follows:
・ The representation of mechanical dispersion by a fracture network structure is characterised by length
of dispersion.
・ Sorption on mineral surfaces in the rock matrix is assumed to be rapid/reversible.
・ Since secondary minerals were observed in fractures at the Kamaishi mine, radionuclide transport
retardation through sorption on such minerals is expected. In the model, this is not considered to be
conservative since the quantitative evaluation of infill minerals in fractures is difficult.
・ Retardation by diffusion in fractures without groundwater flow is conservatively ignored.
・ Since there is insufficient knowledge of the effects of colloids, organic material and microbes on
radionuclide transport, these are not considered in the Reference Case and are evaluated in alternative
cases.
・ The effects of density-driven flow due to thermal convection and the marine-meteoric water interface
are not considered.
4-153
(b) One-dimensional multipathway model
This model is used to determine the radionuclide release rate gn (t) by summing the radionuclide release
rates in discretized segments and weighting with a probability distribution function of transmissivities in
the host rock (Sawada et al., 1999). The radionuclide release rate in each segment is calculated using the
one-dimensional parallel-plate model.
∑=
++++=
=
I
iini
InInnnn
tThptThptThptThptThptg
1
332211
),(),(....),(),(),()( (4.5.2.1-23)
Where I :total number of segments [-](=number of node points)
ip :probability distribution of ith fracture [-]
),( tTh in :radionuclide release rate from ith fracture in time t [moles/y]
iT :median value of transimissivity in segment I [m2/s]
t :time [y]
The suffixes n and i represent radionuclide and segment number, respectively. The same transmissivities
are obtained from the one-dimensional multipathway model when discretization is above 12 segments
(Sawada et al., 1999). Hence, 12 segments are used in order to determine transmissivity using the
one-dimensional multipathway model.
b. Mathematical formulation
(a) Governing equation
Similar radionuclide transport processes to those in the engineered barrier area are considered in the
natural barrier and fault area. However, matrix diffusion of radionuclides from fracture surfaces is
considered because of the fracturing properties of the host rock. Hence, radionuclide transport is given by
the following formula.
( ) ( ) nnnp
pp
nd
nde
nFkk
xVqc
xVc
Dt
k δλλθ +−∑+∂
∂−
∂
∂=
∂∂
n2
2
(4.5.2.1-24)
Where δ is matrix diffusion area [m2/m3] per volume of a single fracture. nF [mol/y] of radionuclide n diffuses into the matrix from the fracture as follows.
0
_
=∂∂
=y
nmmemn
yk
DF θ (4.5.2.1-25)
Here y : perpendicular distance from the fracture surface into the matrix [m] nmk : total amount of radionuclide n in matrix [mol]
emD _ :diffusion coefficient of element e in pore water in matrix [m2/y] mθ : porosity in matrix [‐]
4-154
( ) nnp
pp
ndemm
nm kk
xVc
Dt
kn2
2_ λλθ −∑+
∂
∂=
∂∂ (4.5.2.1-26)
(b) Boundary conditions
The initial concentration of radionuclides in fracture and matrix is set to 0. Also, radionuclide transport
from the engineered barriers in each waste group is given as an intial condition.
The initial condition in the fracture surface is shown in equation 4.5.2.1-25 and the initial condition with
matrix diffusion at maximum depth d [m] is expressed as follows.
0=∂∂
=dy
nd
yc (4.5.2.1-27)
c. Analytical code
The mathematical model based on the radionuclide transport processes in the natural barrier is shown in
Figure 4.5.2-3. The analysis can be carried out using the TIGER code as described before. It is shown that
radionuclide transport in the geophere can be modeled more correctly with TIGER compared with the
MATRICS code (Shirakawa et al., 2000; Mihara and Ooi, 2004).
(2) Data
a. Hydraulic gradient
Few data exist for defining deep hydraulic gradients. In H12, the highest frequency value (0.01) of
published groundwater gradients was selected for the Reference Case. Based on actual measurements
around the Tono mine, it is revelaed that the hydraulic gradient at 500 m or deeper is smaller than that near
the surface.
In this report, 0.01 is also selected for the Reference Case.
b. Fracture parameters
(a) Transmissivity distribution (f(x)) of fractures
Based on in situ hydraulic tests at the Kamaishi mine, Sawada et al. (1999) showed that transmissivity
could be modeled using a normal distribution (equation 4.5.2.1-28). In this evaluation, log (x) of
transmissivity follows a normal distribution and the mean log value of transmissivity is -8.99 and the
standard deviation (σ) is 1.07. In the H12 report, the depth of the disposal facility was assumed to be 1,000
m and the log mean value (µ) is considered to be -9.99 by considering the depth dependence of hydraulic
conductivity. In this report, this transmissivity distribution is used and 3σ is considered to be the range of
transmissivity. Hence, the maximum value of transmissivity is estimated to be 10-7 m2/s.
)2
)(exp(21)( 2
2
σµ
σπ−
−=xxf (4.5.2.1-28)
4-155
(b) Darcy flow velocity of groundwater in fractures
Using discretized transmissivities (Tn[m2/s]), the Darcy flow velocity (νn[m/s]) and matrix diffusion
area/fracture volume ratio(δ[m2/m3])in fractures are calculated using equations 4.5.2.1-29 and 30 below
(Sawada et al., 1999).
iTv nn ×= 5.0 (4.5.2.1-29)
Ω×=
×Ω×⎟⎟⎠
⎞⎜⎜⎝
⎛=
n
nn
T
iv
1
15.0δ
(4.5.2.1-30)
where i is the hydraulic gradient (0.01[-] is specified) and Ω is the matrix diffusion area ratio[-].
c. Radionuclide transport parameters
(a) Macroscopic dispersion length
Macroscopic dispersion is observed in heterogeneous rock masses and generally exhibits a longitudinal
dispersion length that increases as the transport distances increases. The longitudinal dispersion length for
transport distances of 10-1,000 m was assumed to be 1/10 of the transport distance (PNC, 1992). 1/10 of
the transport distance was also assumed in the H12 report and again here. In other words, for 100 m
transport distance in the host rock, the dispersion length is 10 m.
(b) Matrix diffusion depth
The heterogeneity of the rock matrix and the coating of fracture surfaces with altered minerals complicate
the modeling of diffusion from fractures into the matrix (Sawada et al., 1999). From limited natural
analogue studies, the depth of matrix diffusion is estimated to be 0.03 - 0.1 m. However, matrix diffusion
depths estimated from natural analogue research are considered to be minimum values and a conservative
value of 0.1 m was used for the radionuclide transport analysis in H12 (JNC, 2000). This conservative
value is also used in this report.
(c) Proportion of fracture surface from which radionuclides can diffuse into the matrix
The H12 report shows that the proportion of fracture surface from which radionuclides can diffuse into the
matrix varies depending on the vertical stress on the fracture surface. It was reported that the percentage of
accessible surface area was 0.85-0.92, 0.58-0.85 and 0.58-0.70 for vertical stresses of 3 MPa, 33 MPa and
85 MPa, respectively (Pyrak-Nolte et al., 1987). The vertical stress on the fracture surfaces around the
disposal facility at 1,000 m depth depends on the origin and orientation of the fracture. If stress due to the
rock overburden is 27 MPa (density of granite 2.7 Mg/m3×1,000 m), the effective fracture area ratio would
be 0.58-0.7. The lower value is specified and 0.5 is considered in this evaluation.
4-156
(d) Porosity
Based on a literature review by Sato et al. (1992), the average porosity of granite is considered to be around
0.019. The average porosity around unaltered fractures in the Kamaishi mine is 0.023 and 0.032, and the
porosity around fractures is relatively large (Sato et al., 1997). In this report, a constant value of 0.02 is
used for matrix porosity including unaltered zones and surrounding parts of fractures.
(e) Dry density
An average value for crystalline rock (acid rock) of 2.64 Mg/m3 (Taniguchi et al., 1999) is assumed. The
calculated true density using the porosity above is 2.7 Mg/m3.
(f) Effective diffusion coefficient
The effective diffusion coefficient of granite is known to be dependent on pore size, connectivity and
flection. Here the same value as that used in H12 (3×10-12 m2/s) is assumed.
(g) Sorption distribution coefficients
The sorption distribution coefficients in the RAMDA database for each element in granite are used for
Group 1, 2 and 4 wastes. Since some of the wastes in Group 3 have large amounts of soluble nitrates, data
in RAMDA that include ionic strength and oxidizing effects are used. The assumed values for sorption
distribution coefficient are summarized in Table 4.5.2-11.
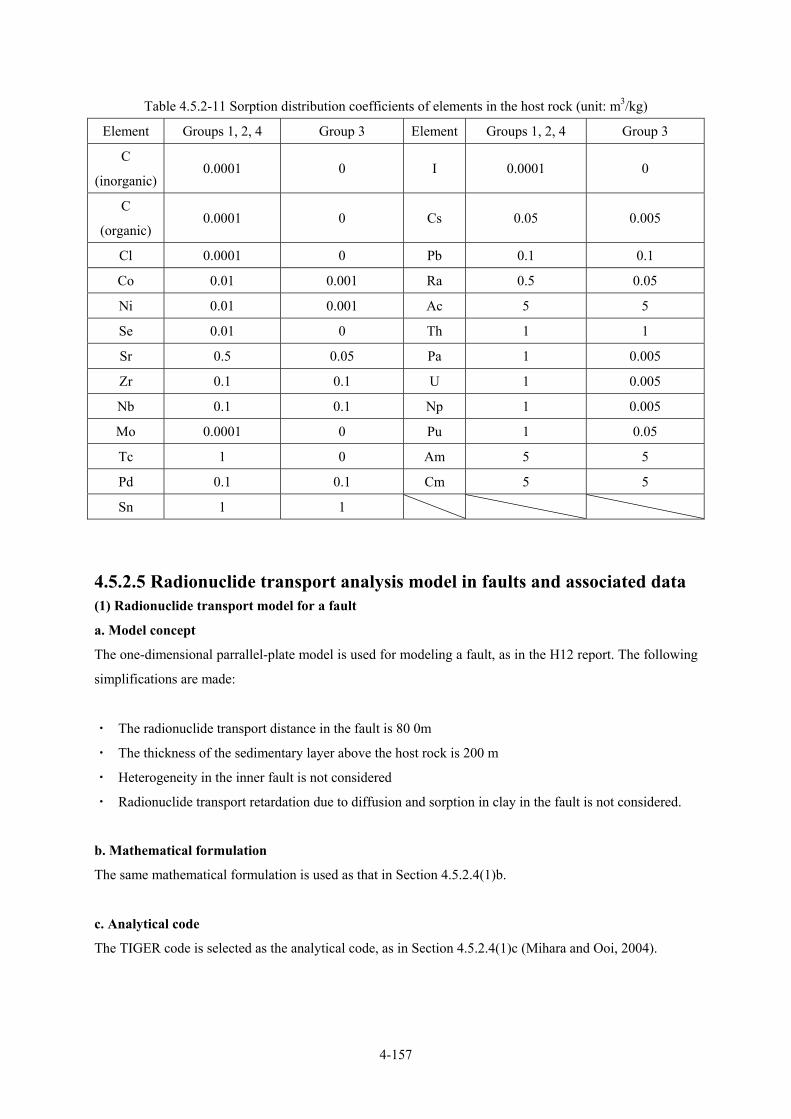
4-157
Table 4.5.2-11 Sorption distribution coefficients of elements in the host rock (unit: m3/kg)
Element Groups 1, 2, 4 Group 3 Element Groups 1, 2, 4 Group 3
C
(inorganic) 0.0001 0 I 0.0001 0
C
(organic) 0.0001 0 Cs 0.05 0.005
Cl 0.0001 0 Pb 0.1 0.1
Co 0.01 0.001 Ra 0.5 0.05
Ni 0.01 0.001 Ac 5 5
Se 0.01 0 Th 1 1
Sr 0.5 0.05 Pa 1 0.005
Zr 0.1 0.1 U 1 0.005
Nb 0.1 0.1 Np 1 0.005
Mo 0.0001 0 Pu 1 0.05
Tc 1 0 Am 5 5
Pd 0.1 0.1 Cm 5 5
Sn 1 1
4.5.2.5 Radionuclide transport analysis model in faults and associated data (1) Radionuclide transport model for a fault
a. Model concept
The one-dimensional parrallel-plate model is used for modeling a fault, as in the H12 report. The following
simplifications are made:
・ The radionuclide transport distance in the fault is 80 0m
・ The thickness of the sedimentary layer above the host rock is 200 m
・ Heterogeneity in the inner fault is not considered
・ Radionuclide transport retardation due to diffusion and sorption in clay in the fault is not considered.
b. Mathematical formulation
The same mathematical formulation is used as that in Section 4.5.2.4(1)b.
c. Analytical code
The TIGER code is selected as the analytical code, as in Section 4.5.2.4(1)c (Mihara and Ooi, 2004).
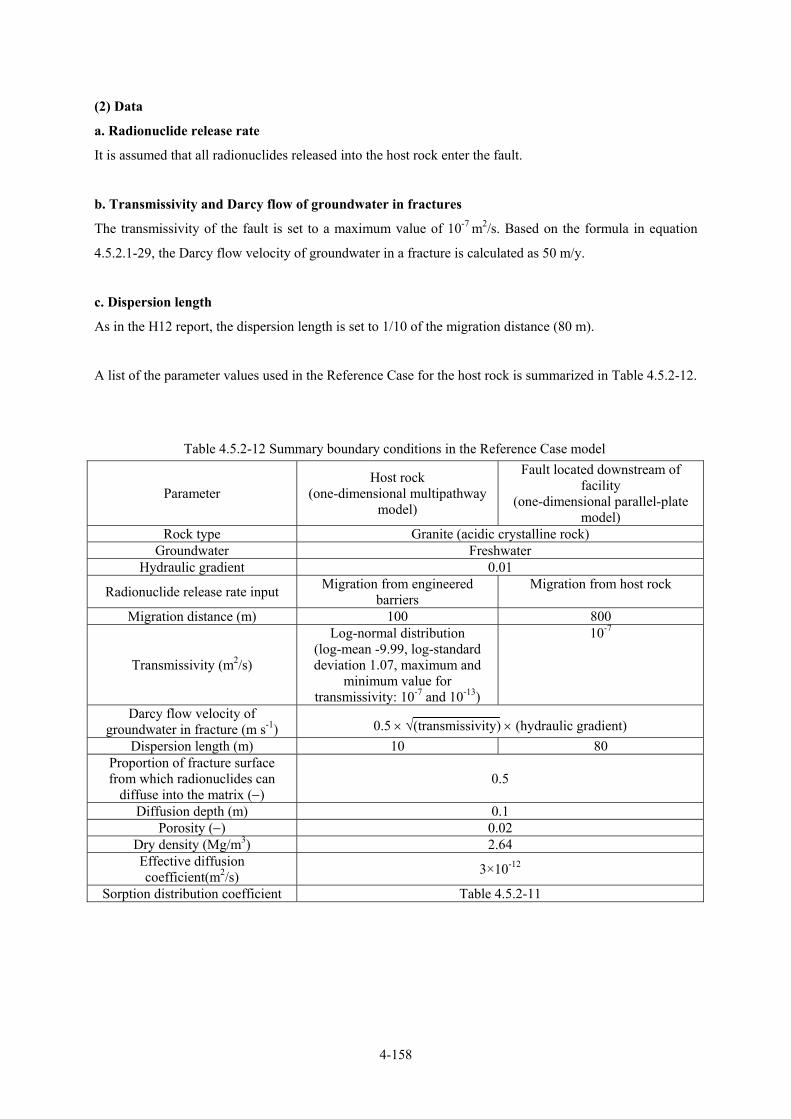
4-158
(2) Data
a. Radionuclide release rate
It is assumed that all radionuclides released into the host rock enter the fault.
b. Transmissivity and Darcy flow of groundwater in fractures
The transmissivity of the fault is set to a maximum value of 10-7 m2/s. Based on the formula in equation
4.5.2.1-29, the Darcy flow velocity of groundwater in a fracture is calculated as 50 m/y.
c. Dispersion length
As in the H12 report, the dispersion length is set to 1/10 of the migration distance (80 m).
A list of the parameter values used in the Reference Case for the host rock is summarized in Table 4.5.2-12.
Table 4.5.2-12 Summary boundary conditions in the Reference Case model
Parameter Host rock
(one-dimensional multipathway model)
Fault located downstream of facility
(one-dimensional parallel-plate model)
Rock type Granite (acidic crystalline rock) Groundwater Freshwater
Hydraulic gradient 0.01
Radionuclide release rate input Migration from engineered barriers
Migration from host rock
Migration distance (m) 100 800
Transmissivity (m2/s)
Log-normal distribution (log-mean -9.99, log-standard deviation 1.07, maximum and
minimum value for transmissivity: 10-7 and 10-13)
10-7
Darcy flow velocity of groundwater in fracture (m s-1) 0.5 × √(transmissivity) × (hydraulic gradient)
Dispersion length (m) 10 80 Proportion of fracture surface from which radionuclides can
diffuse into the matrix (−) 0.5
Diffusion depth (m) 0.1 Porosity (−) 0.02
Dry density (Mg/m3) 2.64 Effective diffusion coefficient(m2/s) 3×10-12
Sorption distribution coefficient Table 4.5.2-11
4-159
4.5.2.6 Biosphere model and data The biosphere model considers a plain topography and a fresh water system which is evaluated by applying
the same compartment model as used in the H12 report. The dose conversion factors for farming,
freshwater fishing and marine water fishing exposure groups are estimated. The radionuclides that are
relevant for TRU waste that were not considered in the H12 report were added to the biosphere model and
dose conversion factors for each radionuclide are summarized in Table 4.5.2-13. From this, the farming
group is identified as the dominant group. These dose values are used in the radionuclide transport analysis
described below. In the calculation of dose conversion factors, the effects of naturally occuring stable
isotopes are not considered. These need to be evaluated in future biosphere assessments.
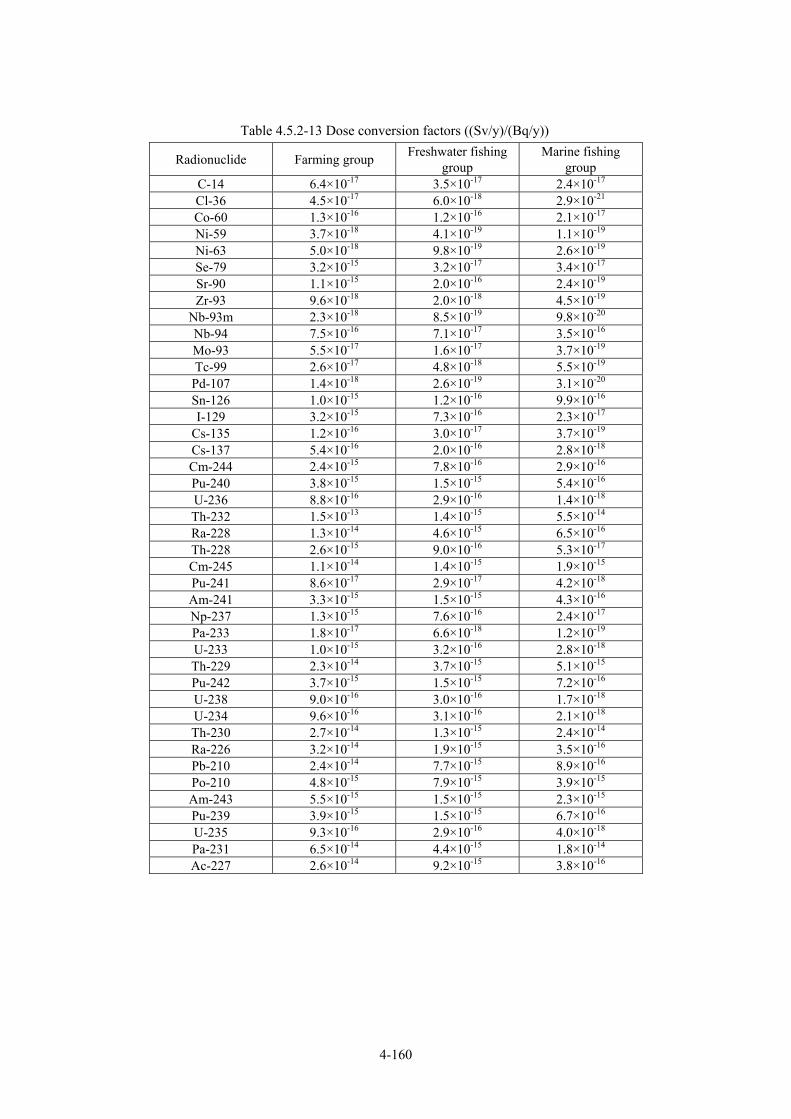
4-160
Table 4.5.2-13 Dose conversion factors ((Sv/y)/(Bq/y))
Radionuclide Farming group Freshwater fishing group
Marine fishing group
C-14 6.4×10⁻¹⁷ 3.5×10⁻¹⁷ 2.4×10⁻¹⁷ Cl-36 4.5×10⁻¹⁷ 6.0×10⁻¹⁸ 2.9×10⁻²¹ Co-60 1.3×10⁻¹⁶ 1.2×10⁻¹⁶ 2.1×10⁻¹⁷ Ni-59 3.7×10⁻¹⁸ 4.1×10⁻¹⁹ 1.1×10⁻¹⁹ Ni-63 5.0×10⁻¹⁸ 9.8×10⁻¹⁹ 2.6×10⁻¹⁹ Se-79 3.2×10⁻¹⁵ 3.2×10⁻¹⁷ 3.4×10⁻¹⁷ Sr-90 1.1×10⁻¹⁵ 2.0×10⁻¹⁶ 2.4×10⁻¹⁹ Zr-93 9.6×10⁻¹⁸ 2.0×10⁻¹⁸ 4.5×10⁻¹⁹
Nb-93m 2.3×10⁻¹⁸ 8.5×10⁻¹⁹ 9.8×10⁻²⁰ Nb-94 7.5×10⁻¹⁶ 7.1×10⁻¹⁷ 3.5×10⁻¹⁶ Mo-93 5.5×10⁻¹⁷ 1.6×10⁻¹⁷ 3.7×10⁻¹⁹ Tc-99 2.6×10⁻¹⁷ 4.8×10⁻¹⁸ 5.5×10⁻¹⁹
Pd-107 1.4×10⁻¹⁸ 2.6×10⁻¹⁹ 3.1×10⁻²⁰ Sn-126 1.0×10⁻¹⁵ 1.2×10⁻¹⁶ 9.9×10⁻¹⁶ I-129 3.2×10⁻¹⁵ 7.3×10⁻¹⁶ 2.3×10⁻¹⁷
Cs-135 1.2×10⁻¹⁶ 3.0×10⁻¹⁷ 3.7×10⁻¹⁹ Cs-137 5.4×10⁻¹⁶ 2.0×10⁻¹⁶ 2.8×10⁻¹⁸ Cm-244 2.4×10⁻¹⁵ 7.8×10⁻¹⁶ 2.9×10⁻¹⁶ Pu-240 3.8×10⁻¹⁵ 1.5×10⁻¹⁵ 5.4×10⁻¹⁶ U-236 8.8×10⁻¹⁶ 2.9×10⁻¹⁶ 1.4×10⁻¹⁸ Th-232 1.5×10⁻¹³ 1.4×10⁻¹⁵ 5.5×10⁻¹⁴ Ra-228 1.3×10⁻¹⁴ 4.6×10⁻¹⁵ 6.5×10⁻¹⁶ Th-228 2.6×10⁻¹⁵ 9.0×10⁻¹⁶ 5.3×10⁻¹⁷ Cm-245 1.1×10⁻¹⁴ 1.4×10⁻¹⁵ 1.9×10⁻¹⁵ Pu-241 8.6×10⁻¹⁷ 2.9×10⁻¹⁷ 4.2×10⁻¹⁸ Am-241 3.3×10⁻¹⁵ 1.5×10⁻¹⁵ 4.3×10⁻¹⁶ Np-237 1.3×10⁻¹⁵ 7.6×10⁻¹⁶ 2.4×10⁻¹⁷ Pa-233 1.8×10⁻¹⁷ 6.6×10⁻¹⁸ 1.2×10⁻¹⁹ U-233 1.0×10⁻¹⁵ 3.2×10⁻¹⁶ 2.8×10⁻¹⁸ Th-229 2.3×10⁻¹⁴ 3.7×10⁻¹⁵ 5.1×10⁻¹⁵ Pu-242 3.7×10⁻¹⁵ 1.5×10⁻¹⁵ 7.2×10⁻¹⁶ U-238 9.0×10⁻¹⁶ 3.0×10⁻¹⁶ 1.7×10⁻¹⁸ U-234 9.6×10⁻¹⁶ 3.1×10⁻¹⁶ 2.1×10⁻¹⁸ Th-230 2.7×10⁻¹⁴ 1.3×10⁻¹⁵ 2.4×10⁻¹⁴ Ra-226 3.2×10⁻¹⁴ 1.9×10⁻¹⁵ 3.5×10⁻¹⁶ Pb-210 2.4×10⁻¹⁴ 7.7×10⁻¹⁵ 8.9×10⁻¹⁶ Po-210 4.8×10⁻¹⁵ 7.9×10⁻¹⁵ 3.9×10⁻¹⁵ Am-243 5.5×10⁻¹⁵ 1.5×10⁻¹⁵ 2.3×10⁻¹⁵ Pu-239 3.9×10⁻¹⁵ 1.5×10⁻¹⁵ 6.7×10⁻¹⁶ U-235 9.3×10⁻¹⁶ 2.9×10⁻¹⁶ 4.0×10⁻¹⁸ Pa-231 6.5×10⁻¹⁴ 4.4×10⁻¹⁵ 1.8×10⁻¹⁴ Ac-227 2.6×10⁻¹⁴ 9.2×10⁻¹⁵ 3.8×10⁻¹⁶

4-161
4.5.2.7 Safety assessment model chain The model chain used in the analysis of the Reference Case is summarized here. Initial conditions,
boundary conditions and parameters used in the radionuclide transport analysis are described in sections
4.5.2.3 and 4.5.2.6. Figure 4.5.2-4 illustrates the model chain and main data flow for the radionuclide
transport analysis used for the Reference Case calculations.
Code
Data
Groundwater flow rate through EDZ
Groundwater composition
Porewater composition
Solubilities of radioactive elements
Inventory
Release rate
Release rate
Release rate
Heat generation
Temperature
FracMan /Mafic
PHREEQE
PHREEQEC
PHREEQEC
ASTEA-MACS
ORIGEN-2
TIGER
TIGER
TIGER
AMBER
Hydraulic Solubility Temperature WasteWaste Host rock Fault Biosphere
Nuclide migration
Fractureproperties
Thermodynamic data(minerals)
Thermodynamic data(elements)
Metal corrosion rate
Diffusion coefficient, sorption distribution coefficient
Transmissi-vities
Diffusion coefficientsorption distributioncoefficient
GroundwaterChemistry
PorewaterChemistry
Figure 4.5.2-4 Model chain used in the safety assessment and associated flow
of information for TRU waste disposal
4.5.2.8 Analysis results (1) Radionuclide release rates from the engineered barrier
Release rates of radionuclides from the engineered barriers in each waste Group and release rates for each
radionuclide are shown in Figures 4.5.2-5 and 4.5.2-6, respectively. For Group 3 and 4 where there is no
buffer material, the radionuclide release rates reach a maximum just after closure of the disposal facility.
Group 4 waste show the highest release rates from the engineered barriers. Group 2 has the largest amount
of radioactive material, but the radionuclide release rates are reduced by the buffer material. Group 3 shows
the same level of release rates as Group 2 if no buffer material is used. Group 1 has low volumes of
radioactive material and has the lowest release rates.
Sr-90,Cs-137 and Pu-241 are the dominant radionuclides and all belong to Group 4. The dominant
radionuclide during the early stage is C-14 (organic) from Group 3 and then C-14 from metal in Group 2
dominates release rates. The radionuclide release rate in Group 1 is controlled by I-129.
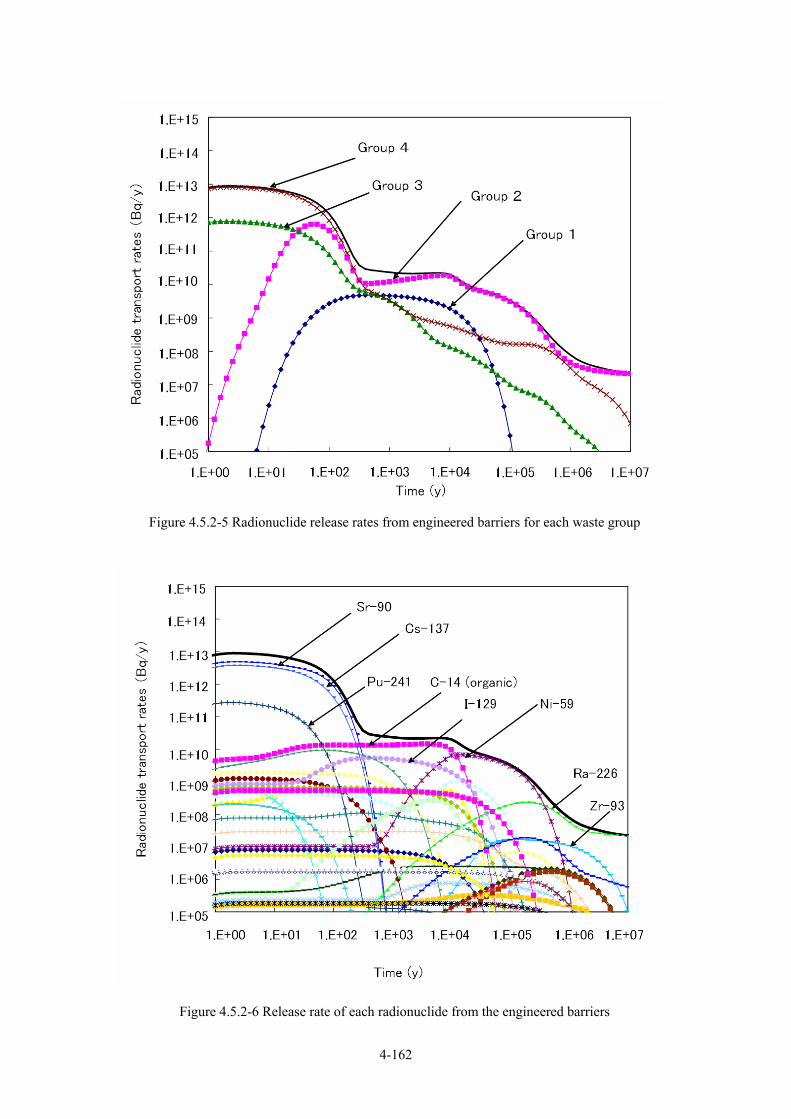
4-162
Figure 4.5.2-5 Radionuclide release rates from engineered barriers for each waste group
Figure 4.5.2-6 Release rate of each radionuclide from the engineered barriers
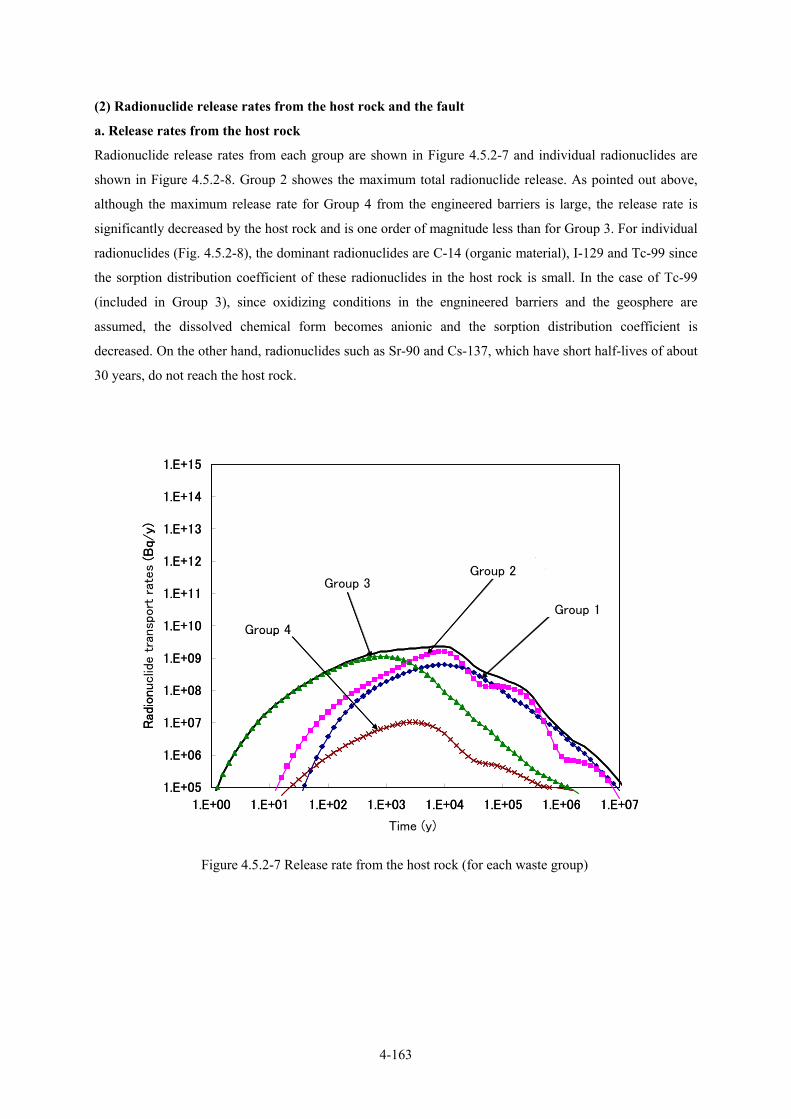
4-163
(2) Radionuclide release rates from the host rock and the fault
a. Release rates from the host rock
Radionuclide release rates from each group are shown in Figure 4.5.2-7 and individual radionuclides are
shown in Figure 4.5.2-8. Group 2 showes the maximum total radionuclide release. As pointed out above,
although the maximum release rate for Group 4 from the engineered barriers is large, the release rate is
significantly decreased by the host rock and is one order of magnitude less than for Group 3. For individual
radionuclides (Fig. 4.5.2-8), the dominant radionuclides are C-14 (organic material), I-129 and Tc-99 since
the sorption distribution coefficient of these radionuclides in the host rock is small. In the case of Tc-99
(included in Group 3), since oxidizing conditions in the engnineered barriers and the geosphere are
assumed, the dissolved chemical form becomes anionic and the sorption distribution coefficient is
decreased. On the other hand, radionuclides such as Sr-90 and Cs-137, which have short half-lives of about
30 years, do not reach the host rock.
1.E+05
1.E+06
1.E+07
1.E+08
1.E+09
1.E+10
1.E+11
1.E+12
1.E+13
1.E+14
1.E+15
1.E+00 1.E+01 1.E+02 1.E+03 1.E+04 1.E+05 1.E+06 1.E+07
時間(y)
移行
率(B
q/y)
グループ4
グループ3グループ2
グループ1
Time (y)
Rad
ionuclid
e t
ransp
ort
rat
es
(Bq/
y)
Group 1
Group 2Group 3
Group 4
1.E+05
1.E+06
1.E+07
1.E+08
1.E+09
1.E+10
1.E+11
1.E+12
1.E+13
1.E+14
1.E+15
1.E+00 1.E+01 1.E+02 1.E+03 1.E+04 1.E+05 1.E+06 1.E+07
時間(y)
移行
率(B
q/y)
グループ4
グループ3グループ2
グループ1
Time (y)
Rad
ionuclid
e t
ransp
ort
rat
es
(Bq/
y)
Group 1
Group 2Group 3
Group 4
Figure 4.5.2-7 Release rate from the host rock (for each waste group)

4-164
1.E+05
1.E+06
1.E+07
1.E+08
1.E+09
1.E+10
1.E+11
1.E+12
1.E+13
1.E+14
1.E+15
1.E+00 1.E+01 1.E+02 1.E+03 1.E+04 1.E+05 1.E+06 1.E+07
時間(y)
移行
率(B
q/y)
C-14(無機)
Se-79
C-14(有機) Mo-93
Cl-36
Ni-59
I-129Tc-99
Zr-93
(organic)
(inorganic)
Rad
ionuclid
e t
ransp
ort
rat
es
(Bq/
y)
Time (y)
1.E+05
1.E+06
1.E+07
1.E+08
1.E+09
1.E+10
1.E+11
1.E+12
1.E+13
1.E+14
1.E+15
1.E+00 1.E+01 1.E+02 1.E+03 1.E+04 1.E+05 1.E+06 1.E+07
時間(y)
移行
率(B
q/y)
C-14(無機)
Se-79
C-14(有機) Mo-93
Cl-36
Ni-59
I-129Tc-99
Zr-93
(organic)
(inorganic)
Rad
ionuclid
e t
ransp
ort
rat
es
(Bq/
y)
Time (y)
Figure 4.5.2-8 Release rates from the host rock (individual radionuclides)
b. Radionuclide release rates to the biosphere via the fault
Radionuclide release rates to the biosphere via the fault from each group are shown in Figure 4.5.2-9 and
release rates of individual radionuclides are shown in Figure 4.5.2-10. The maximum rate shows the same
value as that for the host rock. Since groundwater flow velocity in in the fault is large (50 m/y), no decrease
in radionuclide release rates through the fault is observed. However, the release rates are delayed.
The nuclide release rates from the engineered barriers, host rock and fault are shown in Figure 4.5.2-11.
Compared with the radionuclide release rates from the engineered barriers and radionuclide transport from
the host rock and fault, the difference is significant up to several 100 years after disposal. The difference
between the two values is about 1 order of magnitude after 100 years. The radionuclide release rates in the
host rock and the fault are almost the same after several 100 years.
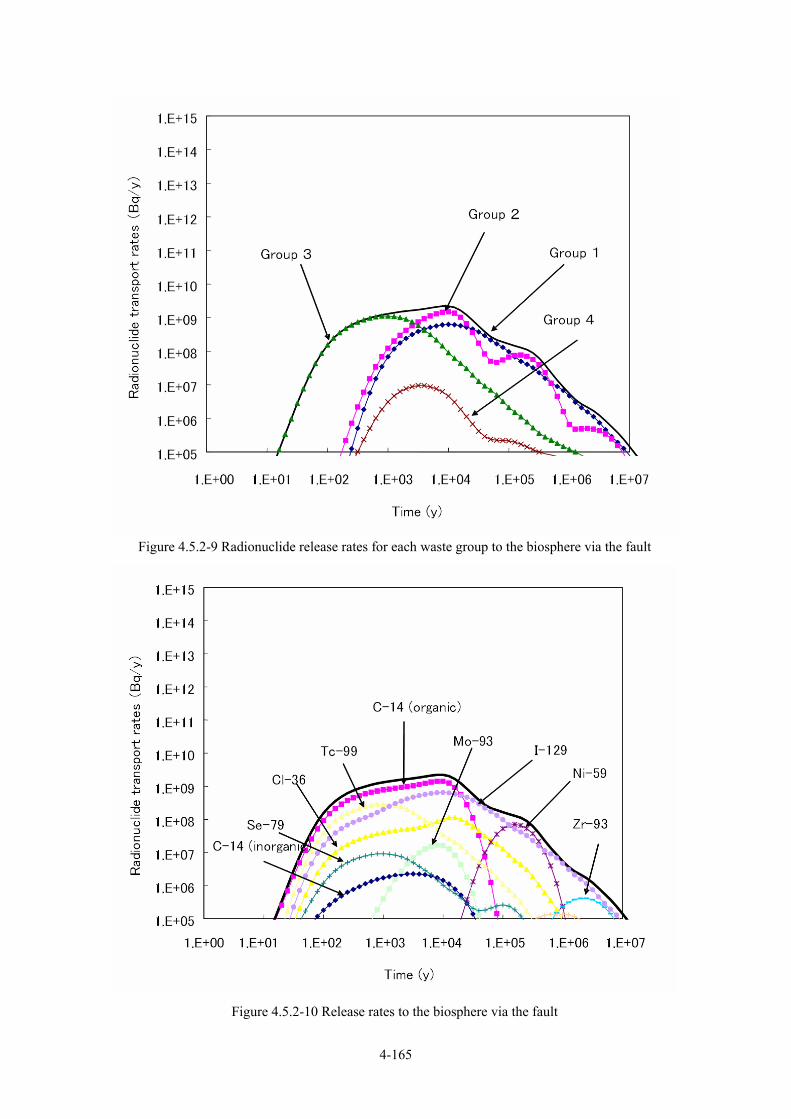
4-165
Figure 4.5.2-9 Radionuclide release rates for each waste group to the biosphere via the fault
Figure 4.5.2-10 Release rates to the biosphere via the fault
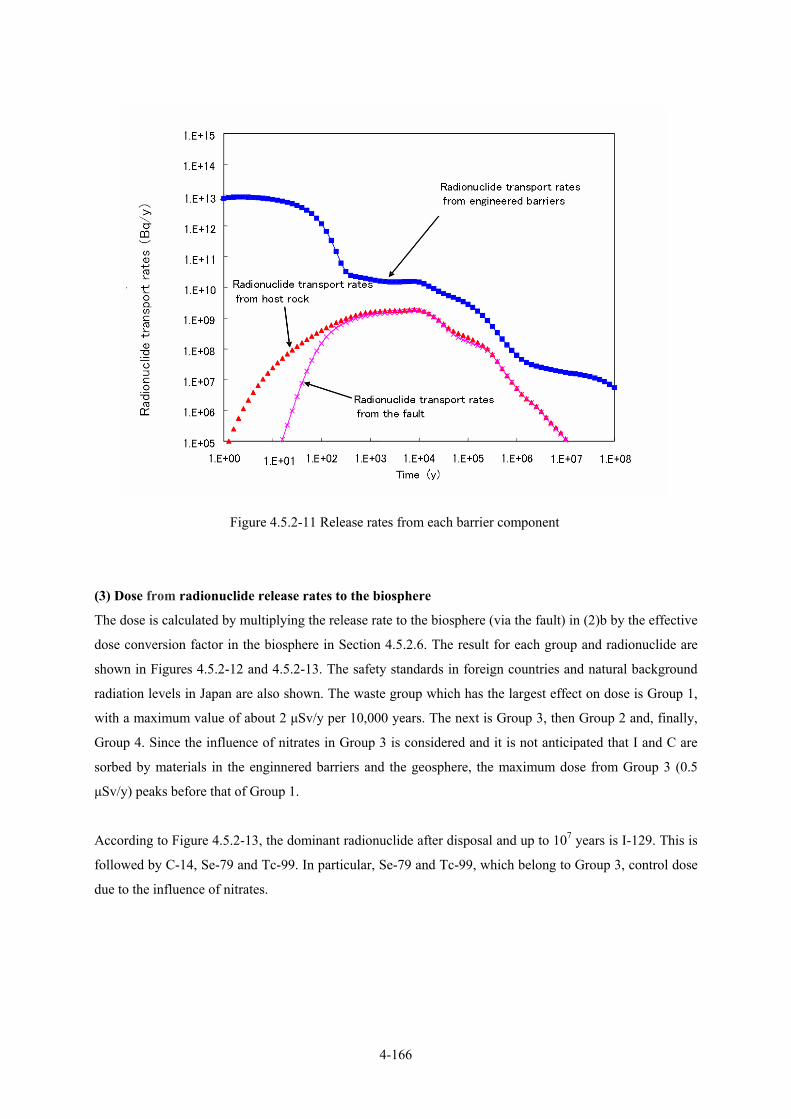
4-166
Figure 4.5.2-11 Release rates from each barrier component
(3) Dose from radionuclide release rates to the biosphere
The dose is calculated by multiplying the release rate to the biosphere (via the fault) in (2)b by the effective
dose conversion factor in the biosphere in Section 4.5.2.6. The result for each group and radionuclide are
shown in Figures 4.5.2-12 and 4.5.2-13. The safety standards in foreign countries and natural background
radiation levels in Japan are also shown. The waste group which has the largest effect on dose is Group 1,
with a maximum value of about 2 µSv/y per 10,000 years. The next is Group 3, then Group 2 and, finally,
Group 4. Since the influence of nitrates in Group 3 is considered and it is not anticipated that I and C are
sorbed by materials in the enginnered barriers and the geosphere, the maximum dose from Group 3 (0.5
µSv/y) peaks before that of Group 1.
According to Figure 4.5.2-13, the dominant radionuclide after disposal and up to 107 years is I-129. This is
followed by C-14, Se-79 and Tc-99. In particular, Se-79 and Tc-99, which belong to Group 3, control dose
due to the influence of nitrates.
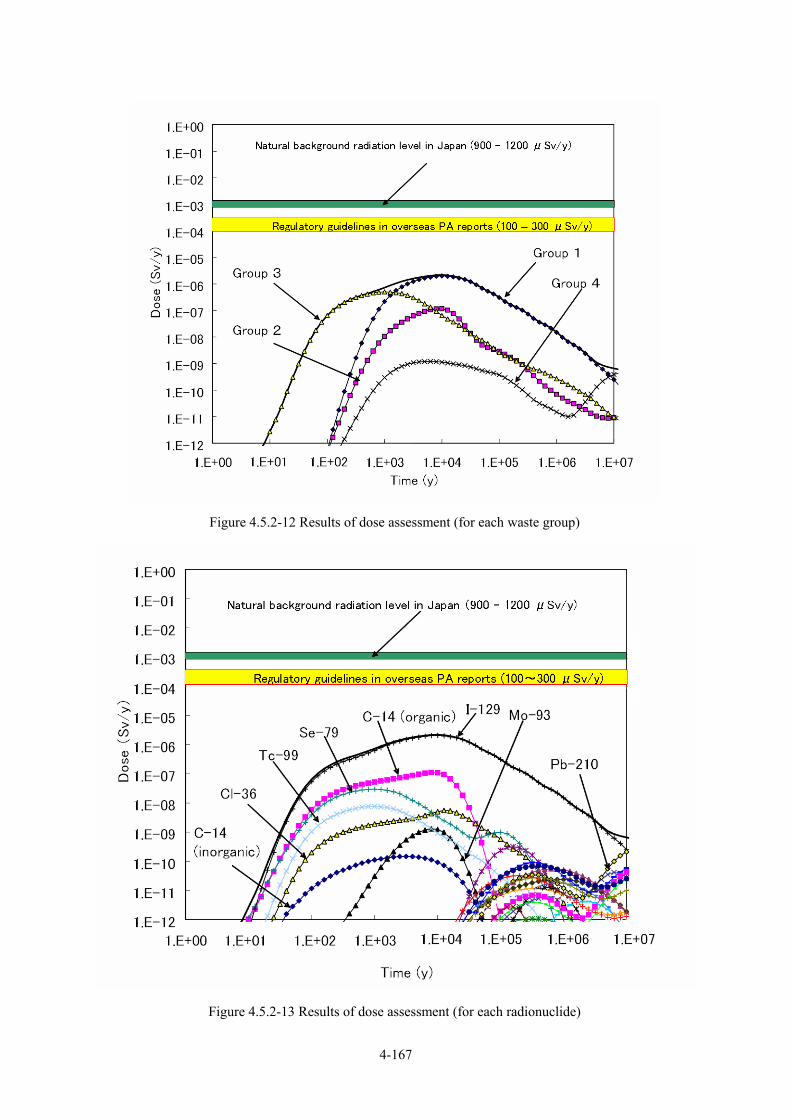
4-167
Figure 4.5.2-12 Results of dose assessment (for each waste group)
Figure 4.5.2-13 Results of dose assessment (for each radionuclide)
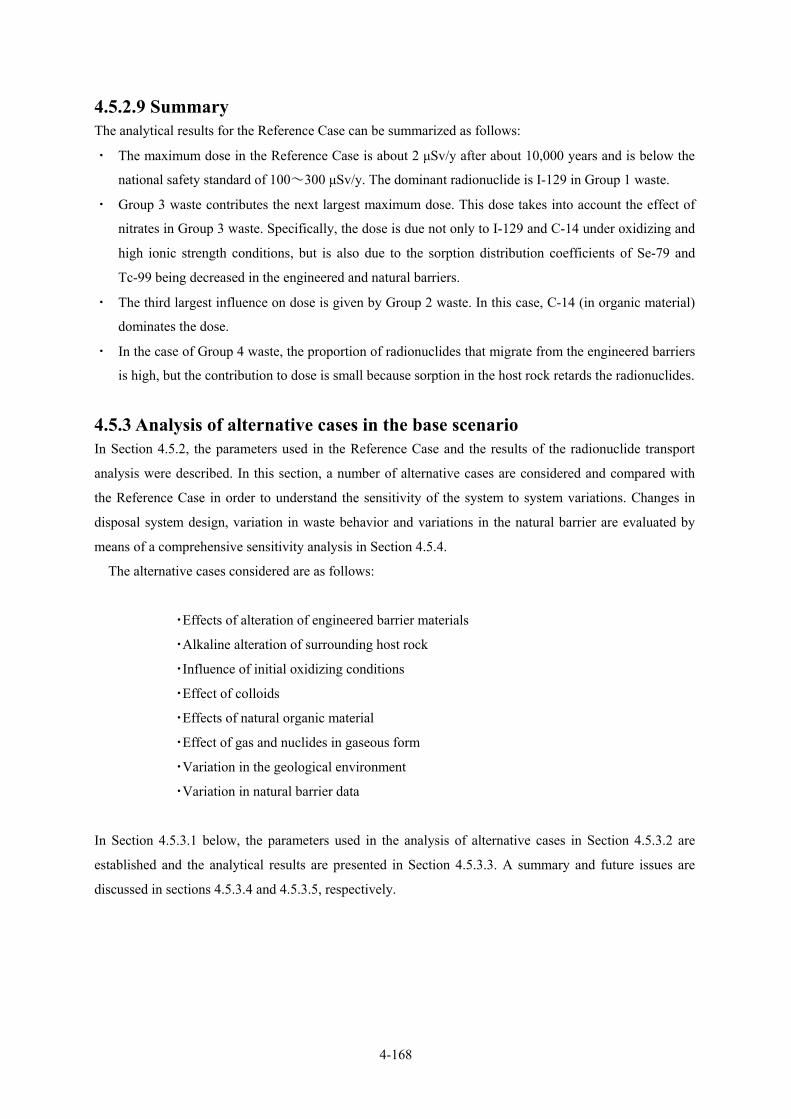
4-168
4.5.2.9 Summary The analytical results for the Reference Case can be summarized as follows:
・ The maximum dose in the Reference Case is about 2 µSv/y after about 10,000 years and is below the
national safety standard of 100~300 µSv/y. The dominant radionuclide is I-129 in Group 1 waste.
・ Group 3 waste contributes the next largest maximum dose. This dose takes into account the effect of
nitrates in Group 3 waste. Specifically, the dose is due not only to I-129 and C-14 under oxidizing and
high ionic strength conditions, but is also due to the sorption distribution coefficients of Se-79 and
Tc-99 being decreased in the engineered and natural barriers.
・ The third largest influence on dose is given by Group 2 waste. In this case, C-14 (in organic material)
dominates the dose.
・ In the case of Group 4 waste, the proportion of radionuclides that migrate from the engineered barriers
is high, but the contribution to dose is small because sorption in the host rock retards the radionuclides.
4.5.3 Analysis of alternative cases in the base scenario In Section 4.5.2, the parameters used in the Reference Case and the results of the radionuclide transport
analysis were described. In this section, a number of alternative cases are considered and compared with
the Reference Case in order to understand the sensitivity of the system to system variations. Changes in
disposal system design, variation in waste behavior and variations in the natural barrier are evaluated by
means of a comprehensive sensitivity analysis in Section 4.5.4.
The alternative cases considered are as follows:
・Effects of alteration of engineered barrier materials
・Alkaline alteration of surrounding host rock
・Influence of initial oxidizing conditions
・Effect of colloids
・Effects of natural organic material
・Effect of gas and nuclides in gaseous form
・Variation in the geological environment
・Variation in natural barrier data
In Section 4.5.3.1 below, the parameters used in the analysis of alternative cases in Section 4.5.3.2 are
established and the analytical results are presented in Section 4.5.3.3. A summary and future issues are
discussed in sections 4.5.3.4 and 4.5.3.5, respectively.
4-169
4.5.3.1 Model expansion necessary for analysing the alternative cases Radionuclide transport analyses are carried out for each of the above-mentioned alternative cases and the
basic analytical model used in the Reference Case is expanded by including the following individual
phenomena (Ooi et al., 2004):
① Temporal variation in hydraulic and chemical degradation of the engineered barriers
② Colloids in the natural barrier
③ Expulsion of groundwater in the engineered barriers through gas generation
(1) Alteration of engineered barrier materials over the long term
In order to consider the degradation of cementitious material and alteration due to the reaction between a
high-pH plume and the buffer material, the temporal variation of the cement filling and the buffer material
are modelled and incorporated into a radionuclide transport analysis. Sorption distribution coefficients,
effective diffusion coefficients, porosity, solubility in the cement filling material, the hydraulic
conductivity of the filling material and the buffer material are treated as time-dependent parameters. When
calculating the permeability of cement filling material, high permeablilties and cracks are conservatively
assumed. This parameter is not time-dependent.
(2) Colloid model
Radionuclide sorption on colloids in fracture groundwater is incorporated into the radionuclide transport
analysis model. The effect of colloids is analyzed using the model in the H12 report (JNC, 2000), in which
radionuclide sorption on colloids is assumed to be linear, instantaneous and reversible.
(3) Gas model
Metal waste corrodes in water and this continues in a reducing atomosphere, producing hydrogen gas. It is
also expected that gas will be produced as a result of radiolysis of groundwater by waste and by microbes.
Some of the gas generated in the waste is transfered to the outer engineered barriers by dissolution in
groundwater. In the case where gas generation is large, gas forms and forces out the same volume of
groundwater. In the disposal system with buffer material, gas might also create a pathway in the buffer
material. A simple model is developed where groundwater in the engineered barriers is displaced by gas
generation, resulting in increased flow velocity in the engineered barriers. This is then incorporated into
the radionuclide transport analysis model (Ooi et al., 2004).
(4) Analytical environment and assumptions
OZONE (Takase et al., 2002) was selected as the analytical code for modeling colloids and gas since it has
the same function as TIGER, in addition to being very versatile. Output from OZONE has been verified by
Miki et al. (2003) by comparison with output from TIGER using the same dataset, and again here in this
report by comparison with the output for the Reference Case. In the evaluation of the alternative cases,

4-170
I-129, C-14, Cs-137 and the Am-241 series including Np-23 and Th-229 (Am-241, Np-237, U-233,
Th-229) are considered. 107 years is assumed as the assessment period, as in the Reference Case.
4.5.3.2 Parameters used in alternative cases (1) Effects of alteration of engineered barrier materials
In the analysis of alteration of cementitious material and buffer material by a high-pH plume (cf. Section
4.4.2), it is suggested that, if the uncertainty in thermodynamic data for minerals, dissolution rates and loss
of swelling of the buffer material due to cementation is siginificant, the low permeable function of buffer
material might be lost after several thousands years. Under realistic conditions, it is assumed that the low
permeable function of the buffer material is maintained during 105 years. If alteration of the buffer material
is assumed, the uncertainty in the pore water composition in Section 4.4.1 is taken into account and
solubility limits and sorption are ignored. Based on these assumptions, the following cases are assumed as
alternative cases:
① The low permeable function is lost at 1,000 years and the sorption distribution coefficients,
solubilities and effective diffusion coefficients of cementitious filling material and buffer
material change.
② Loss of low permeable function of the buffer material and variation in sorption distribution
coefficients occur after 104 years.
③ Loss of low permeable function of the buffer material and variation in sorption distribution
coefficients occur after 105 years.
④ Loss of low permeable function of the buffer material and variation in sorption distribution
coefficients occur after 106 years.
The analytical cases and parameters are shown in Table 4.5.3-1.
4-171
Table 4.5.3-1 Summary of parameters in alternative cases for effects of alteration
of the engineered barrier materials
Case 1 Case 2 Case 3 Case 4
Solubility mol/dm 3(Maximum value in Region I and II (RAMDA database* used)
Considers decrease in low permeable function
of buffer material
Sorption distribution coefficient of cementitious filling material
m3/kgData for Region I, IIMinimum value of (RAMDA)
Sorption distribution coefficient of buffer material
m3/kg
Data for pH > 11, pH ≤ 11
Minimum value of (RAMDA)
Considers dissolution of smectite in buffer material and assumes that the partition coefficient is 0 after dissolution of smectite
Hydraulic conductivity ofcementitious filling material m/s 4×10 -6
Hydraulic conductivityof buffer material m/s 2×10 -11 Considers the low permeable
function of buffer material
Porosity of cementitiousfilling material - 0.19
Considers the outflowof cement paste
Porosity of buffer material - 0.4
Effective diffusion coefficient of cementitious filling material
m2/s 8×10 -10
Effective diffusion coefficient of buffer material
m2/s
(Group 1)4×10 -11
(Group 2)3×10 -10
Before alteration: The value for nuclide which contributes to dose is adopted
After alteration: Considers smectite dissolution in buffer material
Start of parameter variation in engineered barrier
y - 1×10 3 1×10 4 1×10 5 1×10 6Assumes parameter variation at time in left column
RemarksParameter Unit Reference Case
Changes to 1×10⁻⁵
-
Alteration of engineered barriers
Changes to soluble type
Minimum value in Region I, II and III (RAMDA)
Changes to 0
-
Changes to 2×10⁻⁹
Changes to 0.46
-
*RAMDA is radionuclide transport data set in Section 4.5.1 (Mihara and Sasaki, 2005).
For detailed solubility and sorption distribution coefficients, refer to Appendix 4A p2.
(2) Alteration of the host rock by a high-pH plume
In the analysis of alkaline effects on the host rock (cf. Section 4.4.3) it is assumed that the variation in
porosity with mineral precipitation and dissolution is insignificant. It is also noted that the uncertainty
regarding secondary mineral formation by hyperalkaline reaction of initial minerals in the host rock and
the behaviour of the high-pH plume in fractured media are issues that need to be evaluated in the future.
Hence, it is recognised that large uncertainties still surround the influence of high pH conditions on host
rocks. It is also suggested that the precipitation of secondary minerals on fracture surfaces by the reaction
between the high-pH plume and the host rock in fractured media results in a decrease in the effective
diffusion coefficient of the matrix and a decrease in the proportion of fracture surface from which nuclides
can diffuse into the matrix.
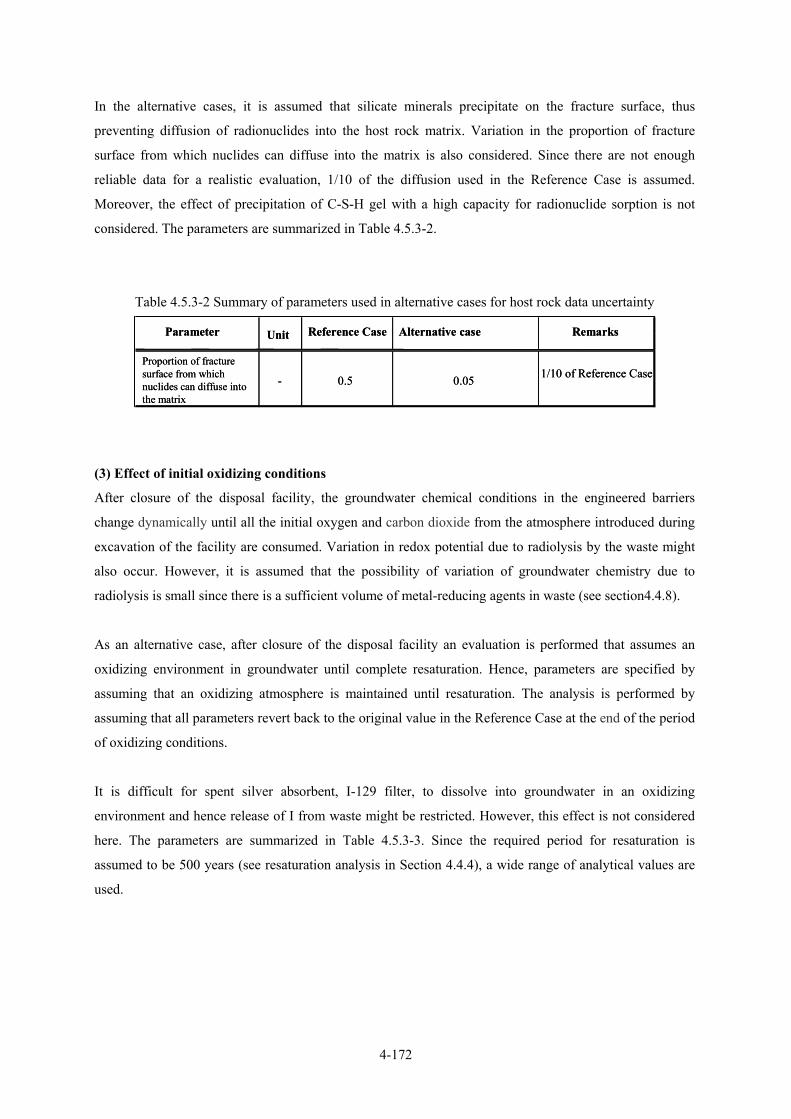
4-172
In the alternative cases, it is assumed that silicate minerals precipitate on the fracture surface, thus
preventing diffusion of radionuclides into the host rock matrix. Variation in the proportion of fracture
surface from which nuclides can diffuse into the matrix is also considered. Since there are not enough
reliable data for a realistic evaluation, 1/10 of the diffusion used in the Reference Case is assumed.
Moreover, the effect of precipitation of C-S-H gel with a high capacity for radionuclide sorption is not
considered. The parameters are summarized in Table 4.5.3-2.
Table 4.5.3-2 Summary of parameters used in alternative cases for host rock data uncertainty
Proportion of fracture surface from which nuclides can diffuse into the matrix
- 0.5 0.05 1/10 of Reference Case
Alternative case RemarksParameter Unit Reference Case
Proportion of fracture surface from which nuclides can diffuse into the matrix
- 0.5 0.05 1/10 of Reference Case
Alternative case RemarksParameter Unit Reference Case
(3) Effect of initial oxidizing conditions
After closure of the disposal facility, the groundwater chemical conditions in the engineered barriers
change dynamically until all the initial oxygen and carbon dioxide from the atmosphere introduced during
excavation of the facility are consumed. Variation in redox potential due to radiolysis by the waste might
also occur. However, it is assumed that the possibility of variation of groundwater chemistry due to
radiolysis is small since there is a sufficient volume of metal-reducing agents in waste (see section4.4.8).
As an alternative case, after closure of the disposal facility an evaluation is performed that assumes an
oxidizing environment in groundwater until complete resaturation. Hence, parameters are specified by
assuming that an oxidizing atmosphere is maintained until resaturation. The analysis is performed by
assuming that all parameters revert back to the original value in the Reference Case at the end of the period
of oxidizing conditions.
It is difficult for spent silver absorbent, I-129 filter, to dissolve into groundwater in an oxidizing
environment and hence release of I from waste might be restricted. However, this effect is not considered
here. The parameters are summarized in Table 4.5.3-3. Since the required period for resaturation is
assumed to be 500 years (see resaturation analysis in Section 4.4.4), a wide range of analytical values are
used.
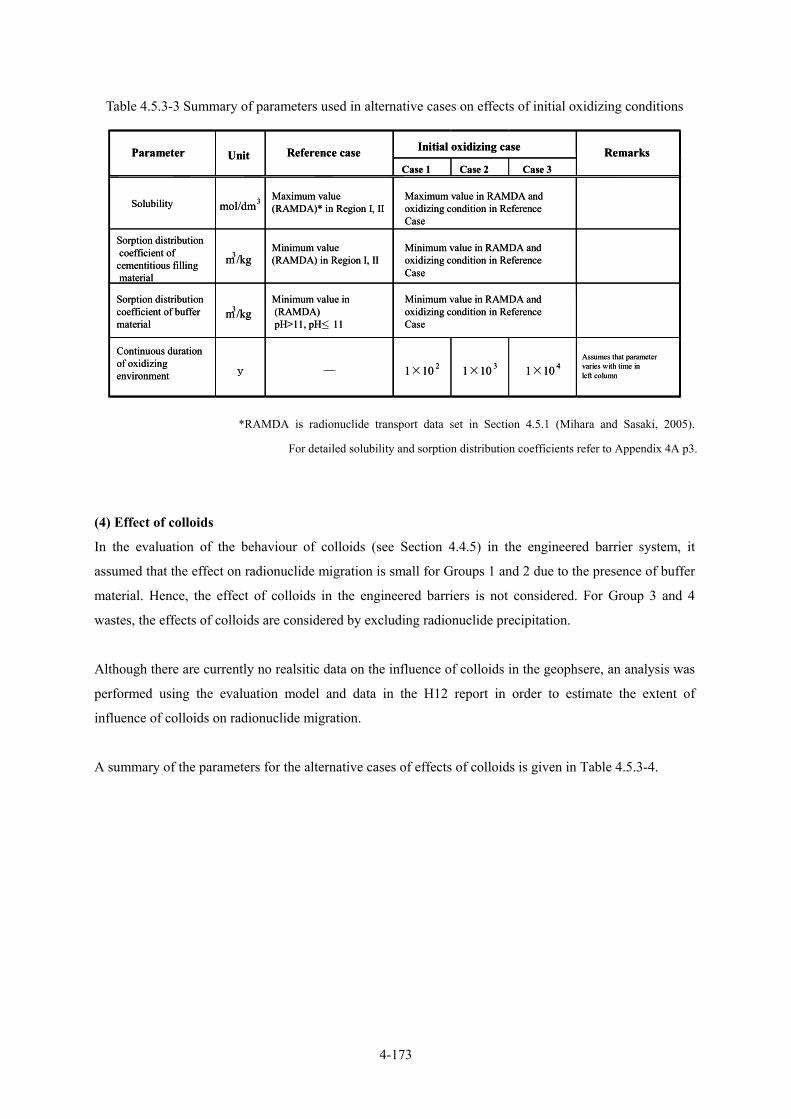
4-173
Table 4.5.3-3 Summary of parameters used in alternative cases on effects of initial oxidizing conditions
Case 1 Case 2 Case 3
Solubility mol/dm3 Maximum value (RAMDA)* in Region I, II
Sorption distributioncoefficient of
cementitious fillingmaterial
m3/kgMinimum value (RAMDA) in Region I, II
Sorption distribution coefficient of buffer material
m3/kgMinimum value in(RAMDA)pH>11, pH<=11
Continuous duration of oxidizing environment y ― 1×10 2 1×10 3 1×10 4
Assumes that parameter varies with time in left column
Remarks
Minimum value in RAMDA and oxidizing condition in Reference Case
Parameter Unit Reference case Initial oxidizing case
Maximum value in RAMDA and oxidizing condition in Reference Case
Minimum value in RAMDA and oxidizing condition in Reference Case
*RAMDA is radionuclide transport data set in Section 4.5.1 (Mihara and Sasaki, 2005).
For detailed solubility and sorption distribution coefficients refer to Appendix 4A p3.
(4) Effect of colloids
In the evaluation of the behaviour of colloids (see Section 4.4.5) in the engineered barrier system, it
assumed that the effect on radionuclide migration is small for Groups 1 and 2 due to the presence of buffer
material. Hence, the effect of colloids in the engineered barriers is not considered. For Group 3 and 4
wastes, the effects of colloids are considered by excluding radionuclide precipitation.
Although there are currently no realsitic data on the influence of colloids in the geophsere, an analysis was
performed using the evaluation model and data in the H12 report in order to estimate the extent of
influence of colloids on radionuclide migration.
A summary of the parameters for the alternative cases of effects of colloids is given in Table 4.5.3-4.
≤
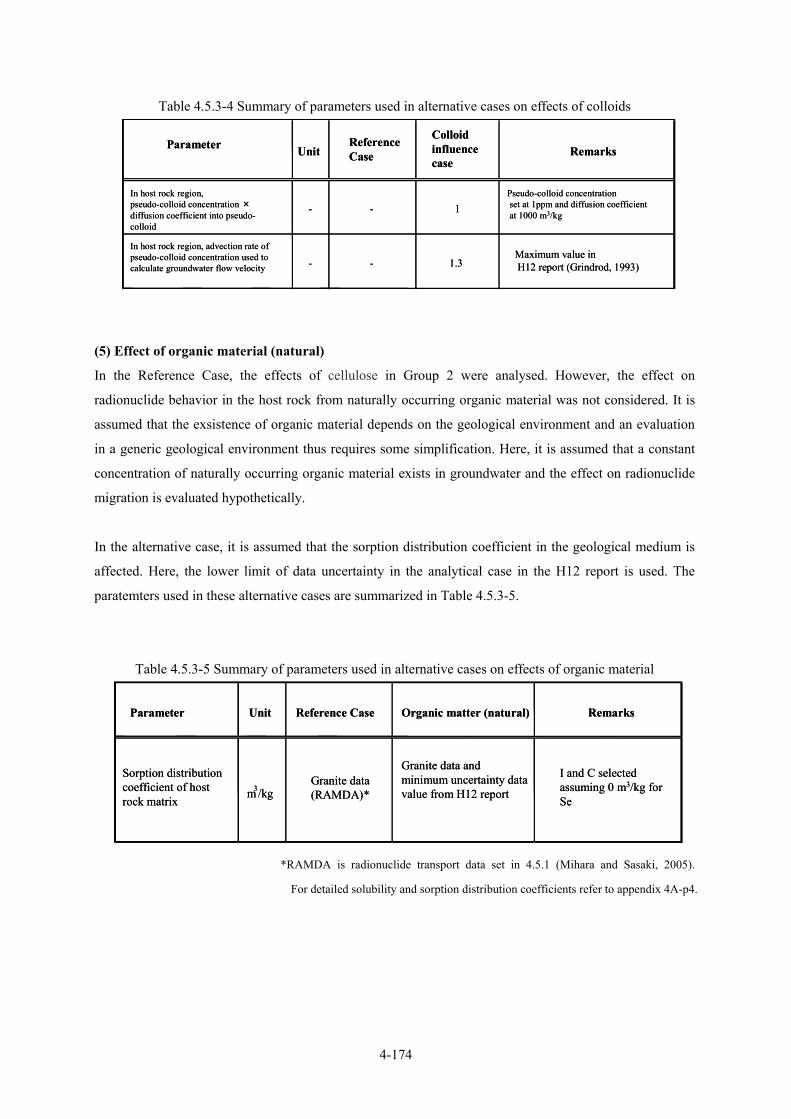
4-174
Table 4.5.3-4 Summary of parameters used in alternative cases on effects of colloids
(5) Effect of organic material (natural)
In the Reference Case, the effects of cellulose in Group 2 were analysed. However, the effect on
radionuclide behavior in the host rock from naturally occurring organic material was not considered. It is
assumed that the exsistence of organic material depends on the geological environment and an evaluation
in a generic geological environment thus requires some simplification. Here, it is assumed that a constant
concentration of naturally occurring organic material exists in groundwater and the effect on radionuclide
migration is evaluated hypothetically.
In the alternative case, it is assumed that the sorption distribution coefficient in the geological medium is
affected. Here, the lower limit of data uncertainty in the analytical case in the H12 report is used. The
paratemters used in these alternative cases are summarized in Table 4.5.3-5.
Table 4.5.3-5 Summary of parameters used in alternative cases on effects of organic material
*RAMDA is radionuclide transport data set in 4.5.1 (Mihara and Sasaki, 2005).
For detailed solubility and sorption distribution coefficients refer to appendix 4A-p4.
In host rock region, pseudo-colloid concentration ×diffusion coefficient into pseudo-colloid
- - 1Pseudo-colloid concentrationset at 1ppm and diffusion coefficientat 1000 m3/kg
In host rock region, advection rate of pseudo-colloid concentration used to calculate groundwater flow velocity - - 1.3
Maximum value inH12 report (Grindrod, 1993)
RemarksParameter UnitReferenceCase
Colloid influencecase
Parameter Unit Reference Case Organic matter (natural) Remarks
Sorption distribution coefficient of host rock matrix
m3/kgGranite data(RAMDA)*
Granite data and minimum uncertainty data value from H12 report
I and C selected assuming 0 m3/kg for Se
Parameter Unit Reference Case Organic matter (natural) Remarks
Sorption distribution coefficient of host rock matrix
m3/kgGranite data(RAMDA)*
Granite data and minimum uncertainty data value from H12 report
I and C selected assuming 0 m3/kg for Se

4-175
(6) Gas influence
In the gas influence case in Section 4.4.10, the possibility of mechanical deformation of the buffer and the
excavation disturbed zone was considered to be small. The influence of gas generation on groundwater
flow in the natural barrier was also considered to be small. In the groundwater migration scenario, nuclide
migration is increased by the forcing out of groundwater from the engineered barrier system. Hence, the
expulsion of contaminated water depending on gas generation from each waste group is used to evaluate
gas influence (Table 4.4.10.1-1). The parameters are summarized in Table 4.5.3-6.
Migration analyses of radionuclides in gaseous form (see Section 4.4.10) for Groups 2 and 3, which have
large amounts of gas generation, are used to evaluate the amount of gas which reaches the
biosphere,assuming that the total amount of C-14 in waste is CH4(g). The result of this analysis shows that,
since CH4 from Group 2 is almost completely dissolved into groundwater, there is only a small likelihood
of CH4 reaching the biosphere in gaseous form. Moreover, the maximum CH4 generated from Group 3 is
estimated to be 3×10⁻⁸ mol/m/y (per length of tunnel).
Assuming that such gaseous CH4 reaches the biosphere and dissolves in the aquifer, the dose is calculated
using dose conversion factors based on the river water/plain model. From this, the estimated dose for
radionuclide migration in gaseous form is around 1×10⁻⁹ Sv/y, which is significantly smaller than that for
groundwater migration (around 2×10⁻⁶ Sv/y).
Table 4.5.3-6 Summary of parameters used in alternative cases on gas influences
(7) Alternative geological environments
a. Alternative rock types
The same six generic rock types used in the H12 report are used again here. The radionuclide transport
model in the natural barrier assumes a fractured sedimentary rock for the alternative case and the
one-dimensional multipathway model is used. Effective porosity, effective diffusion coefficient and
distribution coefficient are specified for each rock type. For Neogene rocks (hard), variation of disposal
depth takes into account the length of nuclide transport along a fault, which is set at 300 m. The parameters
Group 1 Group 2 Group 3 Group 4
Total drainagem3/m - 2.6 1.0 1.9 1.9
Maximum drainagevelocity m3/m/y - 0.26 0.17 0.007 0.024
Start time of drainage y - 1000 100 30 10
Drainage period y - Total drainage/maximum drainage velocity
Parameter Unit ReferenceCase
Waste groupGroup 1 Group 2 Group 3 Group 4
Total drainagem3/m - 2.6 1.0 1.9 1.9
Maximum drainagevelocity m3/m/y - 0.26 0.17 0.007 0.024
Start time of drainage y - 1000 100 30 10
Drainage period y - Total drainage/maximum drainage velocity
Parameter Unit ReferenceCase
Waste group
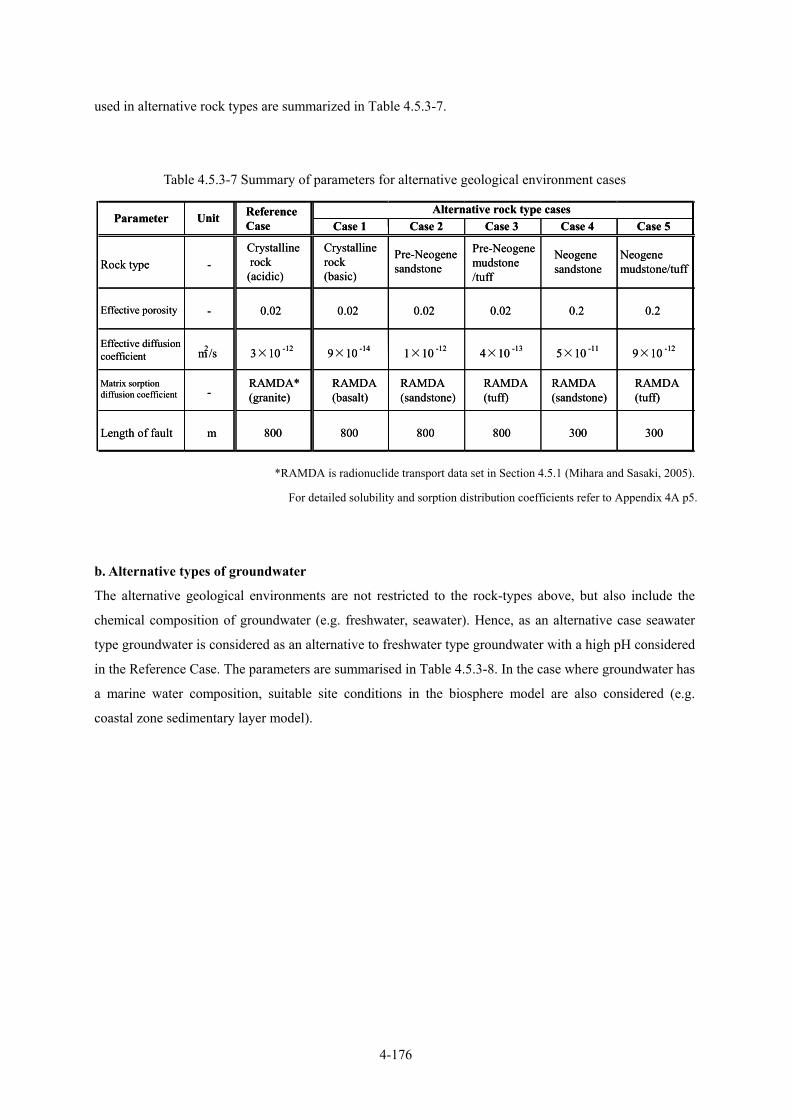
4-176
used in alternative rock types are summarized in Table 4.5.3-7.
Table 4.5.3-7 Summary of parameters for alternative geological environment cases
*RAMDA is radionuclide transport data set in Section 4.5.1 (Mihara and Sasaki, 2005).
For detailed solubility and sorption distribution coefficients refer to Appendix 4A p5.
b. Alternative types of groundwater
The alternative geological environments are not restricted to the rock-types above, but also include the
chemical composition of groundwater (e.g. freshwater, seawater). Hence, as an alternative case seawater
type groundwater is considered as an alternative to freshwater type groundwater with a high pH considered
in the Reference Case. The parameters are summarised in Table 4.5.3-8. In the case where groundwater has
a marine water composition, suitable site conditions in the biosphere model are also considered (e.g.
coastal zone sedimentary layer model).
Rock type -Crystallinerock
(acidic)
Crystallinerock(basic)
Pre-Neogenesandstone
Pre-Neogenemudstone /tuff
Neogenesandstone
Neogenemudstone/tuff
Effective porosity - 0.02 0.02 0.02 0.02 0.2 0.2
Effective diffusioncoefficient m2/s 3×10 -12 9×10 -14 1×10 -12 4×10 -13 5×10 -11 9×10 -12
Matrix sorption diffusion coefficient -
RAMDA*(granite)
RAMDA(basalt)
RAMDA(sandstone)
RAMDA(tuff)
RAMDA(sandstone)
RAMDA(tuff)
Length of fault m 800 800 800 800 300 300
Parameter Unit Reference Case
Alternative rock type casesCase 1 Case 2 Case 3 Case 4 Case 5
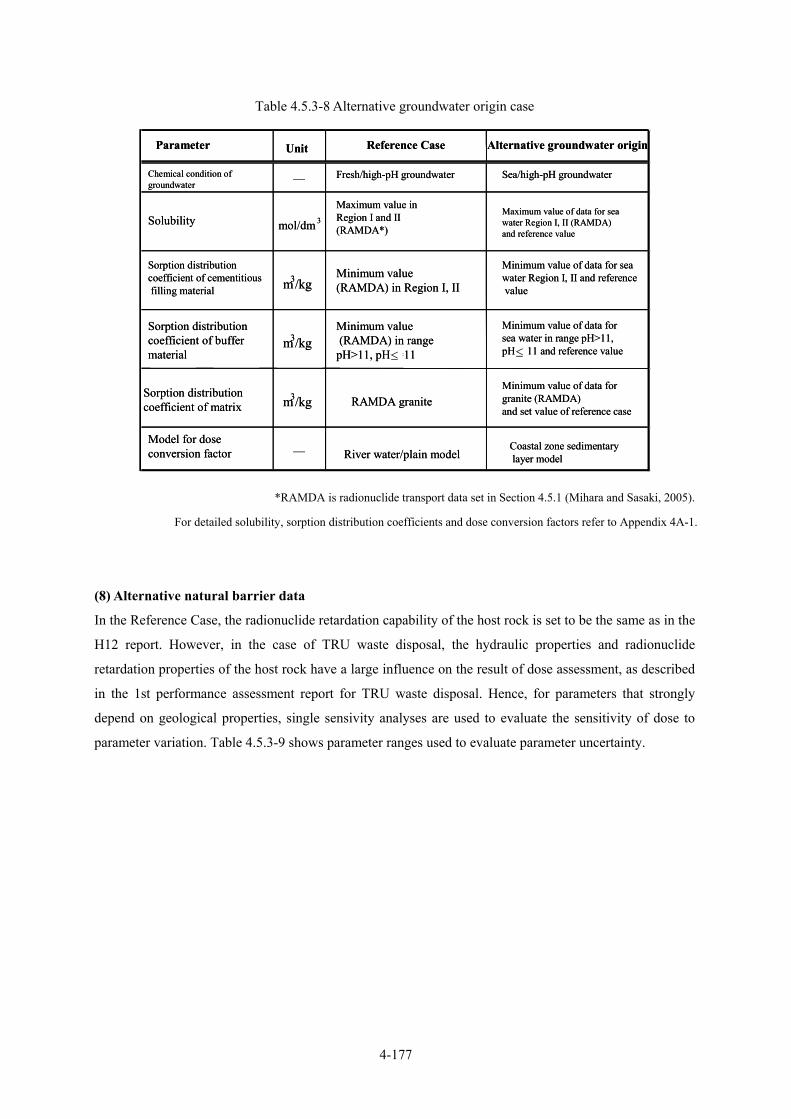
4-177
Table 4.5.3-8 Alternative groundwater origin case
Parameter Unit Reference Case Alternative groundwater origin
Chemical condition of groundwater ― Fresh/high-pH groundwater Sea/high-pH groundwater
Solubility mol/dm 3
Maximum value in Region I and II(RAMDA*)
Maximum value of data for sea water Region I, II (RAMDA) and reference value
Sorption distribution coefficient of cementitiousfilling material m3/kg
Minimum value(RAMDA) in Region I, II
Minimum value of data for seawater Region I, II and referencevalue
Sorption distribution coefficient of buffer material
m3/kgMinimum value(RAMDA) in range
pH>11, pH<=11
Minimum value of data for sea water in range pH>11,pH<=11 and reference value
Sorption distribution coefficient of matrix m3/kg RAMDA granite
Minimum value of data for granite (RAMDA) and set value of reference case
Model for dose conversion factor ― River water/plain model
Coastal zone sedimentarylayer model
*RAMDA is radionuclide transport data set in Section 4.5.1 (Mihara and Sasaki, 2005).
For detailed solubility, sorption distribution coefficients and dose conversion factors refer to Appendix 4A-1.
(8) Alternative natural barrier data
In the Reference Case, the radionuclide retardation capability of the host rock is set to be the same as in the
H12 report. However, in the case of TRU waste disposal, the hydraulic properties and radionuclide
retardation properties of the host rock have a large influence on the result of dose assessment, as described
in the 1st performance assessment report for TRU waste disposal. Hence, for parameters that strongly
depend on geological properties, single sensivity analyses are used to evaluate the sensitivity of dose to
parameter variation. Table 4.5.3-9 shows parameter ranges used to evaluate parameter uncertainty.
≤ ≤

4-178
Table 4.5.3-9 Sensitivity analysis of parameters in the natural barrier
(9) Other effects
Other individual phenomena that may have adverse effects on the safety of the disposal system include gas
generation by microbes. However, there is currently insufficient knowledge to allow development of
meaningful analytical cases.
4.5.3.3 Analytical results (1) Comparison of the Reference Case with alternative cases for the groundwater scenario
Here, groundwater scenario uncertainty is evaluated by comparing the results of the Reference Case with
results from the alternative cases using the parameters described in (1) – (8) above (Fig. 4.5.3-1).
In the alternative case for the engineered barriers, which takes into acount the degradation with time of
cementitious filling material and buffer material, only a small increase in maximum dose is observed
compared to that of the Reference Case if degradation commences 103 years after closure.
In the case which considers radionuclide sorption on colloids in the geopshpere, the maximum dose
increases by a factor of two compared with that of the Reference Case.
The maximum dose in the gas influence case is almost the same as for the Reference Case and is not
changed even if the transport of radionuclides in gaseous form from Groups 2 and 3 is included. In this
alternative case, it is assumed that radionuclide migration increases as groundwater expulsion from the
engineered barrier increases.
In the case where the duration of oxidizing condition is 104 years and resaturationj takes 500 years, the
maximum dose is almost same as in the Reference Case. In all cases, I-129 dominates the maximum dose
Parameter Unit Sensitivity range Remarks
Fracture transmissivity statistic m2/s 1×10 -101×10 -11 - 1×10 -9
Mean logarithmic standard deviationof fracture transmisstivity is set to 1.07
Hydraulic gradient - 0.01 0.001 - 0.05Coastal zone, plain, hills and mountains; considered to be5 times the range of the Reference Case
Host rock matrix diffusion depth m 0.1 0.01 - 1Data uncertainty: region with 0.1 - 10 times of reference setting
- 0.5 0.05 - 1Data uncertainty: region with0.1 - 5 times of reference setting
Porosity of host rock matrix - 0.02 0.003 - 0.5 Covers all rock types
Length of fault m 800 1 - 1000 Large range
Reference Case value
Proportion of fracture surface from which radionuclides candiffuse into the matrix

4-179
in Groups 1, 3 and 4, which is the same as for the Reference Case, and C-14 controls the maximum dose
for Group 2. Since I-129 and C-14 are soluble with low sorption capability in the engineered barriers, they
are unlikely to affect the performance of engineered barrier system. Hence, significant changes in
maximum dose are not seen.
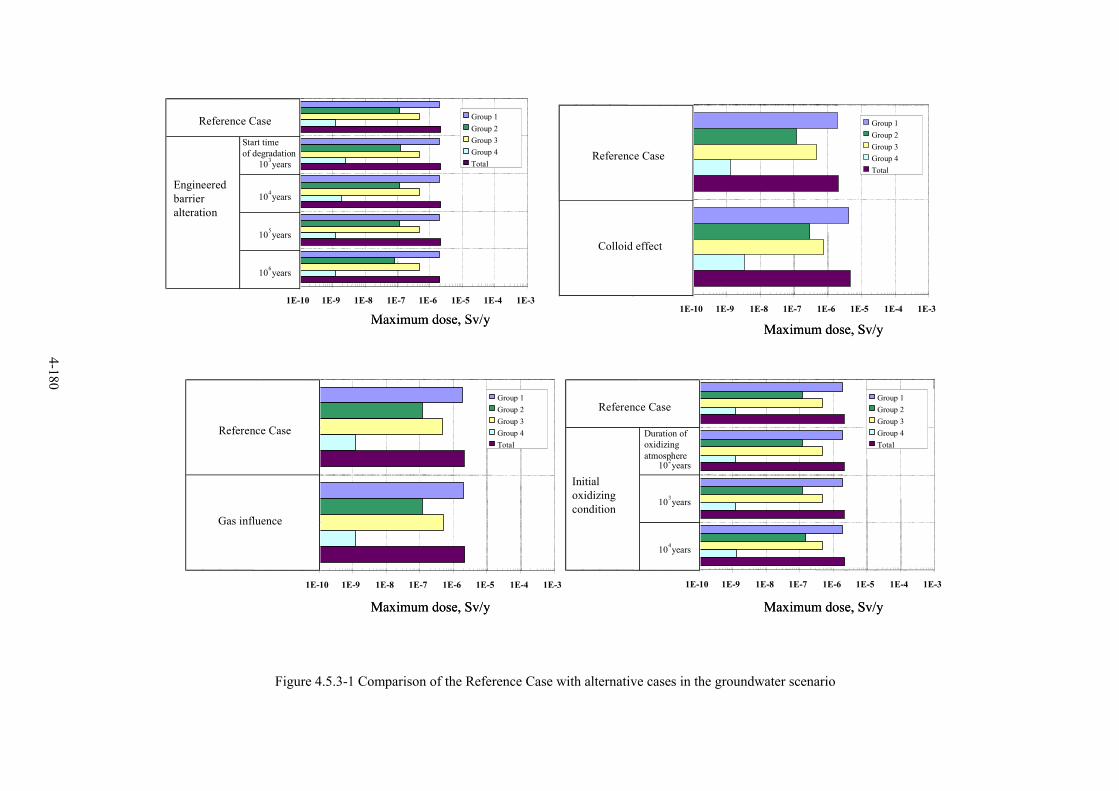
4-180
Figure 4.5.3-1 Comparison of the Reference Case with alternative cases in the groundwater scenario
1E-10 1E-9 1E-8 1E-7 1E-6 1E-5 1E-4 1E-3
Group 1Group 2Group 3Group 4Total
Start time of degradation
103years
104years
105years
106years
Reference Case
Engineered barrieralteration
1E-10 1E-9 1E-8 1E-7 1E-6 1E-5 1E-4 1E-3
Group 1Group 2Group 3Group 4Total
Reference Case
Gas influence
1E-10 1E-9 1E-8 1E-7 1E-6 1E-5 1E-4 1E-3
Group 1Group 2Group 3Group 4Total
Reference Case
Colloid effect
1E-10 1E-9 1E-8 1E-7 1E-6 1E-5 1E-4 1E-3
Group 1Group 2Group 3Group 4Total
Duration of oxidizing atmosphere
102years
103years
104years
Reference Case
Initial oxidizingcondition
Maximum dose, Sv/y
Maximum dose, Sv/y
Maximum dose, Sv/y
Maximum dose, Sv/y
1E-10 1E-9 1E-8 1E-7 1E-6 1E-5 1E-4 1E-3
Group 1Group 2Group 3Group 4Total
Start time of degradation
103years
104years
105years
106years
Reference Case
Engineered barrieralteration
1E-10 1E-9 1E-8 1E-7 1E-6 1E-5 1E-4 1E-3
Group 1Group 2Group 3Group 4Total
Reference Case
Gas influence
1E-10 1E-9 1E-8 1E-7 1E-6 1E-5 1E-4 1E-3
Group 1Group 2Group 3Group 4Total
Reference Case
Colloid effect
1E-10 1E-9 1E-8 1E-7 1E-6 1E-5 1E-4 1E-3
Group 1Group 2Group 3Group 4Total
Duration of oxidizing atmosphere
102years
103years
104years
Reference Case
Initial oxidizingcondition
Maximum dose, Sv/y
Maximum dose, Sv/y
Maximum dose, Sv/y
Maximum dose, Sv/y
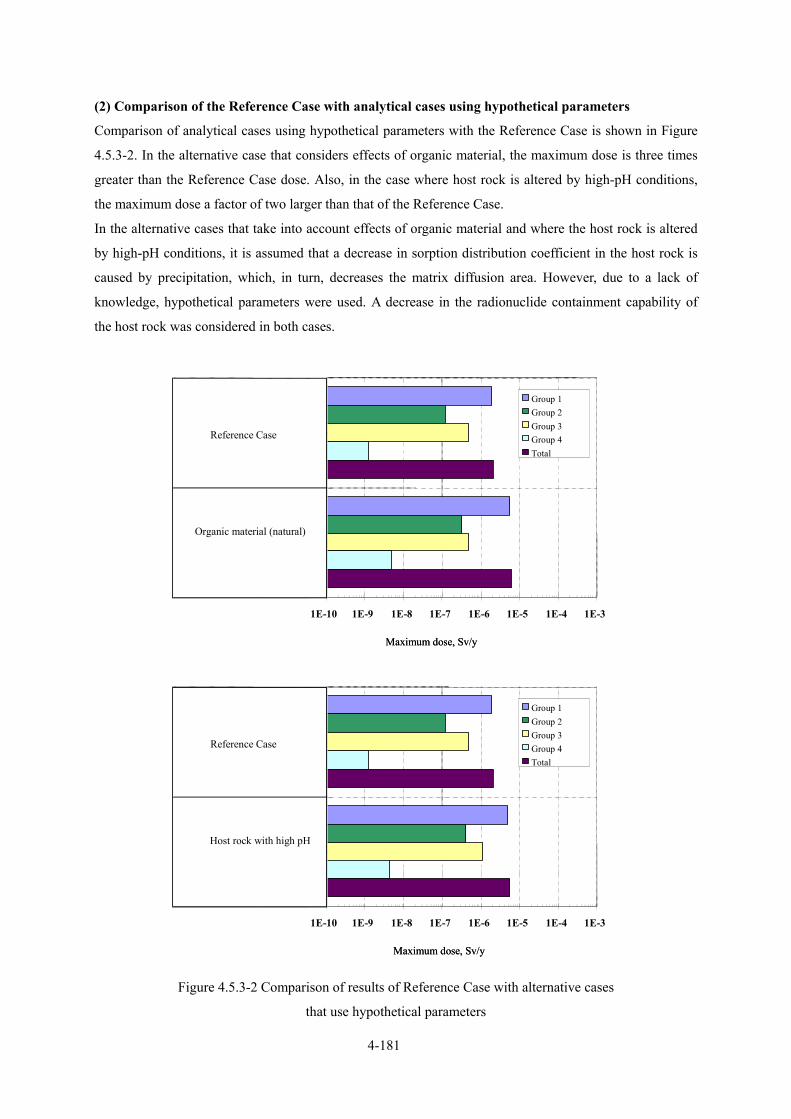
4-181
(2) Comparison of the Reference Case with analytical cases using hypothetical parameters
Comparison of analytical cases using hypothetical parameters with the Reference Case is shown in Figure
4.5.3-2. In the alternative case that considers effects of organic material, the maximum dose is three times
greater than the Reference Case dose. Also, in the case where host rock is altered by high-pH conditions,
the maximum dose a factor of two larger than that of the Reference Case.
In the alternative cases that take into account effects of organic material and where the host rock is altered
by high-pH conditions, it is assumed that a decrease in sorption distribution coefficient in the host rock is
caused by precipitation, which, in turn, decreases the matrix diffusion area. However, due to a lack of
knowledge, hypothetical parameters were used. A decrease in the radionuclide containment capability of
the host rock was considered in both cases.
1E-10 1E-9 1E-8 1E-7 1E-6 1E-5 1E-4 1E-3
Group 1Group 2Group 3Group 4Total
Reference Case
Organic material (natural)
1E-10 1E-9 1E-8 1E-7 1E-6 1E-5 1E-4 1E-3
Group 1Group 2Group 3Group 4Total
Reference Case
Host rock with high pH
Maximum dose, Sv/y
Maximum dose, Sv/y
1E-10 1E-9 1E-8 1E-7 1E-6 1E-5 1E-4 1E-3
Group 1Group 2Group 3Group 4Total
Reference Case
Organic material (natural)
1E-10 1E-9 1E-8 1E-7 1E-6 1E-5 1E-4 1E-3
Group 1Group 2Group 3Group 4Total
Reference Case
Host rock with high pH
Maximum dose, Sv/y
Maximum dose, Sv/y
Figure 4.5.3-2 Comparison of results of Reference Case with alternative cases
that use hypothetical parameters
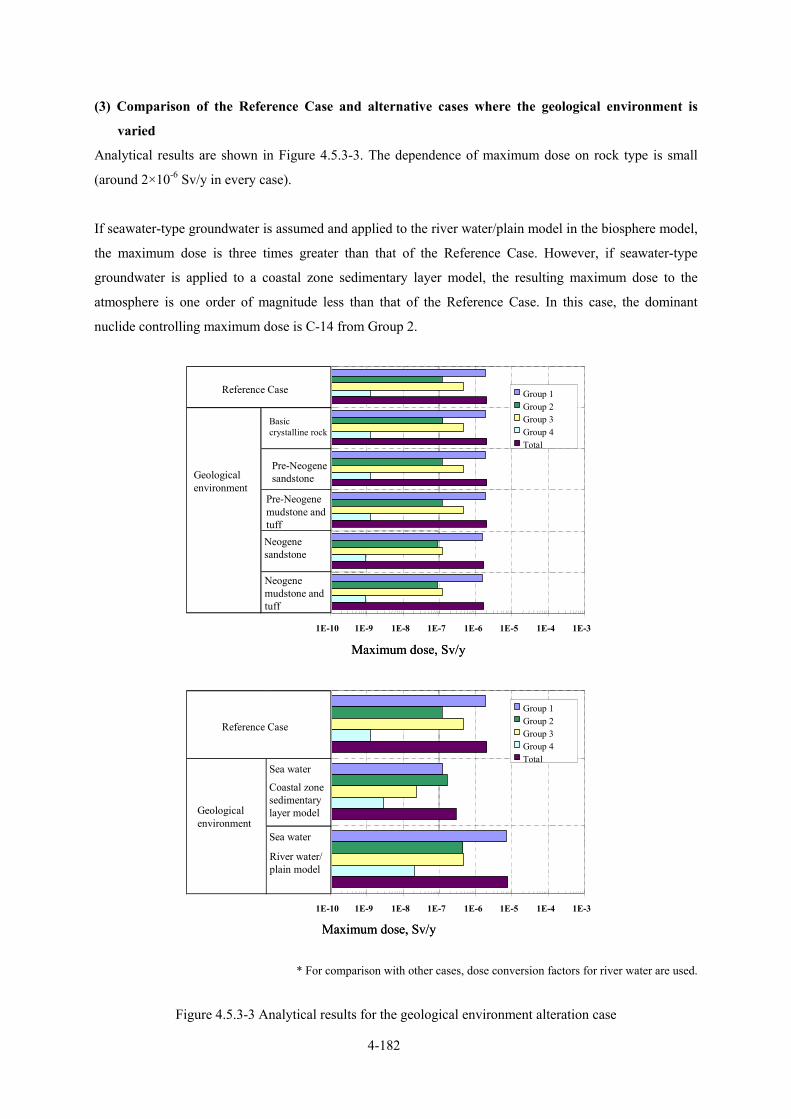
4-182
(3) Comparison of the Reference Case and alternative cases where the geological environment is
varied
Analytical results are shown in Figure 4.5.3-3. The dependence of maximum dose on rock type is small
(around 2×10⁻⁶ Sv/y in every case).
If seawater-type groundwater is assumed and applied to the river water/plain model in the biosphere model,
the maximum dose is three times greater than that of the Reference Case. However, if seawater-type
groundwater is applied to a coastal zone sedimentary layer model, the resulting maximum dose to the
atmosphere is one order of magnitude less than that of the Reference Case. In this case, the dominant
nuclide controlling maximum dose is C-14 from Group 2.
Maximum dose, Sv/y
Maximum dose, Sv/y
1E-10 1E-9 1E-8 1E-7 1E-6 1E-5 1E-4 1E-3
Group 1Group 2Group 3Group 4Total
Basic crystalline rock
Pre-Neogenesandstone
Pre-Neogenemudstone and tuffNeogenesandstone
Neogenemudstone and tuff
Reference Case
Geological environment
1E-10 1E-9 1E-8 1E-7 1E-6 1E-5 1E-4 1E-3
Group 1Group 2Group 3Group 4Total
Sea water
Coastal zonesedimentary layer model
Sea water
River water/plain model
Reference Case
Geological environment
Maximum dose, Sv/y
Maximum dose, Sv/y
1E-10 1E-9 1E-8 1E-7 1E-6 1E-5 1E-4 1E-3
Group 1Group 2Group 3Group 4Total
Basic crystalline rock
Pre-Neogenesandstone
Pre-Neogenemudstone and tuffNeogenesandstone
Neogenemudstone and tuff
Reference Case
Geological environment
1E-10 1E-9 1E-8 1E-7 1E-6 1E-5 1E-4 1E-3
Group 1Group 2Group 3Group 4Total
Sea water
Coastal zonesedimentary layer model
Sea water
River water/plain model
Reference Case
Geological environment
* For comparison with other cases, dose conversion factors for river water are used.
Figure 4.5.3-3 Analytical results for the geological environment alteration case
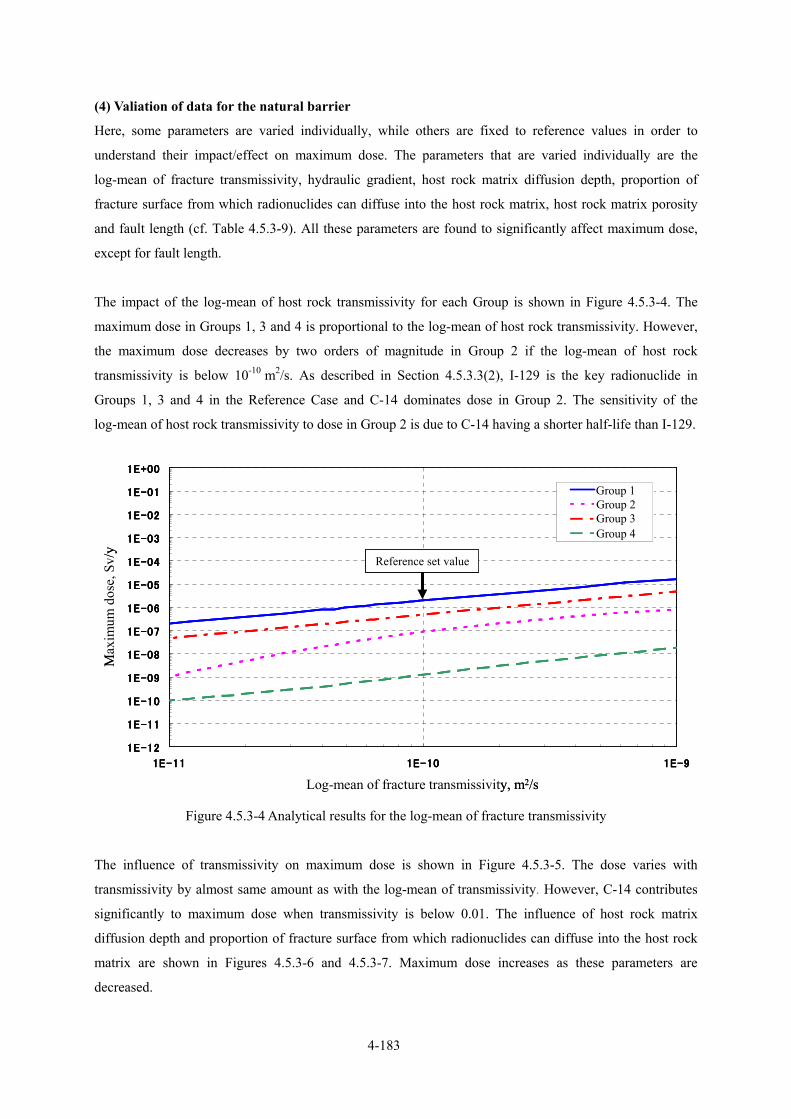
4-183
(4) Valiation of data for the natural barrier
Here, some parameters are varied individually, while others are fixed to reference values in order to
understand their impact/effect on maximum dose. The parameters that are varied individually are the
log-mean of fracture transmissivity, hydraulic gradient, host rock matrix diffusion depth, proportion of
fracture surface from which radionuclides can diffuse into the host rock matrix, host rock matrix porosity
and fault length (cf. Table 4.5.3-9). All these parameters are found to significantly affect maximum dose,
except for fault length.
The impact of the log-mean of host rock transmissivity for each Group is shown in Figure 4.5.3-4. The
maximum dose in Groups 1, 3 and 4 is proportional to the log-mean of host rock transmissivity. However,
the maximum dose decreases by two orders of magnitude in Group 2 if the log-mean of host rock
transmissivity is below 10-10 m2/s. As described in Section 4.5.3.3(2), I-129 is the key radionuclide in
Groups 1, 3 and 4 in the Reference Case and C-14 dominates dose in Group 2. The sensitivity of the
log-mean of host rock transmissivity to dose in Group 2 is due to C-14 having a shorter half-life than I-129.
Figure 4.5.3-4 Analytical results for the log-mean of fracture transmissivity
The influence of transmissivity on maximum dose is shown in Figure 4.5.3-5. The dose varies with
transmissivity by almost same amount as with the log-mean of transmissivity. However, C-14 contributes
significantly to maximum dose when transmissivity is below 0.01. The influence of host rock matrix
diffusion depth and proportion of fracture surface from which radionuclides can diffuse into the host rock
matrix are shown in Figures 4.5.3-6 and 4.5.3-7. Maximum dose increases as these parameters are
decreased.
亀裂透水量係数の対数平均値,m2/s
1E-12
1E-11
1E-10
1E-09
1E-08
1E-07
1E-06
1E-05
1E-04
1E-03
1E-02
1E-01
1E+00
1E-11 1E-10 1E-9
最大
線量
,Sv/y
グループ1
グループ2
グループ3
グループ4
Log-mean of fracture transmissivity, m2/s
Max
imum
dos
e, S
v/y
Group 1Group 2Group 3Group 4
Reference set value
亀裂透水量係数の対数平均値,m2/s
1E-12
1E-11
1E-10
1E-09
1E-08
1E-07
1E-06
1E-05
1E-04
1E-03
1E-02
1E-01
1E+00
1E-11 1E-10 1E-9
最大
線量
,Sv/y
グループ1
グループ2
グループ3
グループ4
亀裂透水量係数の対数平均値,m2/s
1E-12
1E-11
1E-10
1E-09
1E-08
1E-07
1E-06
1E-05
1E-04
1E-03
1E-02
1E-01
1E+00
1E-11 1E-10 1E-9
最大
線量
,Sv/y
グループ1
グループ2
グループ3
グループ4
Log-mean of fracture transmissivity, m2/s
Max
imum
dos
e, S
v/y
Group 1Group 2Group 3Group 4
Reference set value
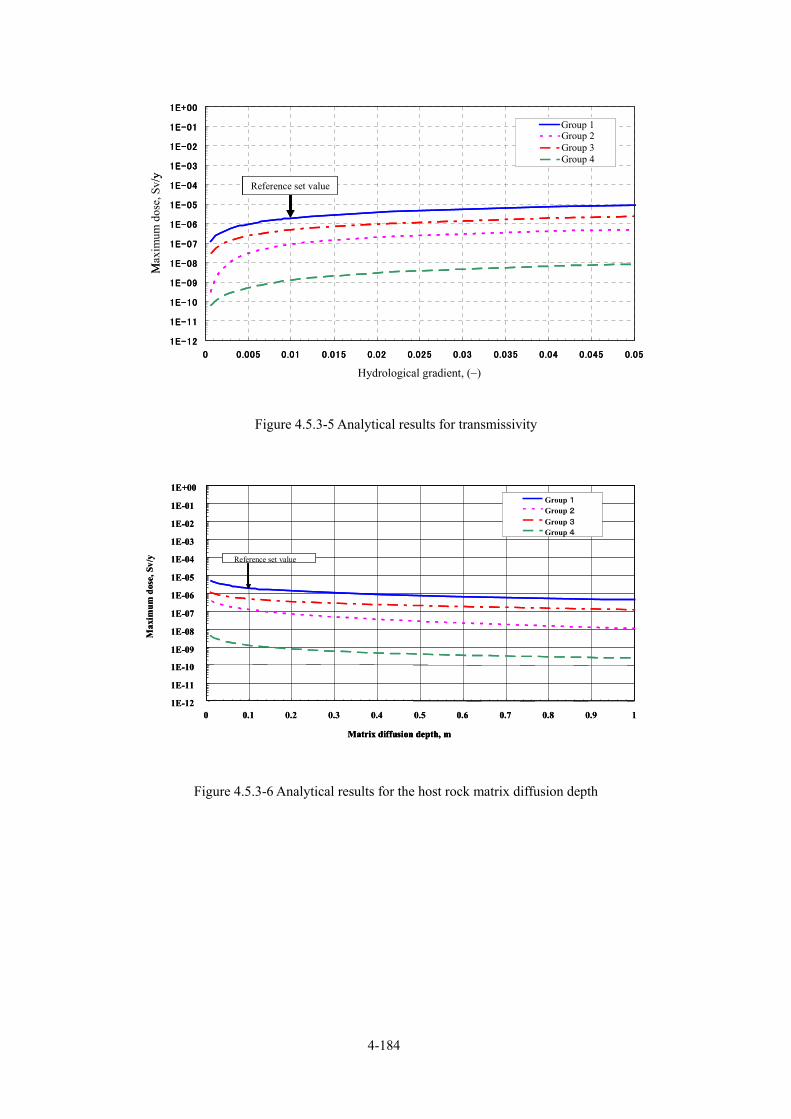
4-184
Figure 4.5.3-5 Analytical results for transmissivity
Figure 4.5.3-6 Analytical results for the host rock matrix diffusion depth
Matrix diffusion depth, m
1E-12
1E-11
1E-10
1E-09
1E-08
1E-07
1E-06
1E-05
1E-04
1E-03
1E-02
1E-01
1E+00
0 0.1 0.2 0.3 0.4 0.5 0.6 0.7 0.8 0.9 1
Max
imum
dos
e, S
v/y
Group 1Group 2Group 3Group 4
Reference set value
Matrix diffusion depth, mMatrix diffusion depth, m
1E-12
1E-11
1E-10
1E-09
1E-08
1E-07
1E-06
1E-05
1E-04
1E-03
1E-02
1E-01
1E+00
0 0.1 0.2 0.3 0.4 0.5 0.6 0.7 0.8 0.9 1
Max
imum
dos
e, S
v/y
Group 1Group 2Group 3Group 4
Reference set value
動水勾配,-
1E-12
1E-11
1E-10
1E-09
1E-08
1E-07
1E-06
1E-05
1E-04
1E-03
1E-02
1E-01
1E+00
0 0.005 0.01 0.015 0.02 0.025 0.03 0.035 0.04 0.045 0.05
最大
線量
,Sv/y
グループ1
グループ2
グループ3
グループ4
Reference set value
Hydrological gradient, (−)
Max
imum
dos
e, S
v/y
Group 1Group 2Group 3Group 4
動水勾配,-
1E-12
1E-11
1E-10
1E-09
1E-08
1E-07
1E-06
1E-05
1E-04
1E-03
1E-02
1E-01
1E+00
0 0.005 0.01 0.015 0.02 0.025 0.03 0.035 0.04 0.045 0.05
最大
線量
,Sv/y
グループ1
グループ2
グループ3
グループ4
Reference set valueReference set value
Hydrological gradient, (−)
Max
imum
dos
e, S
v/y
Group 1Group 2Group 3Group 4
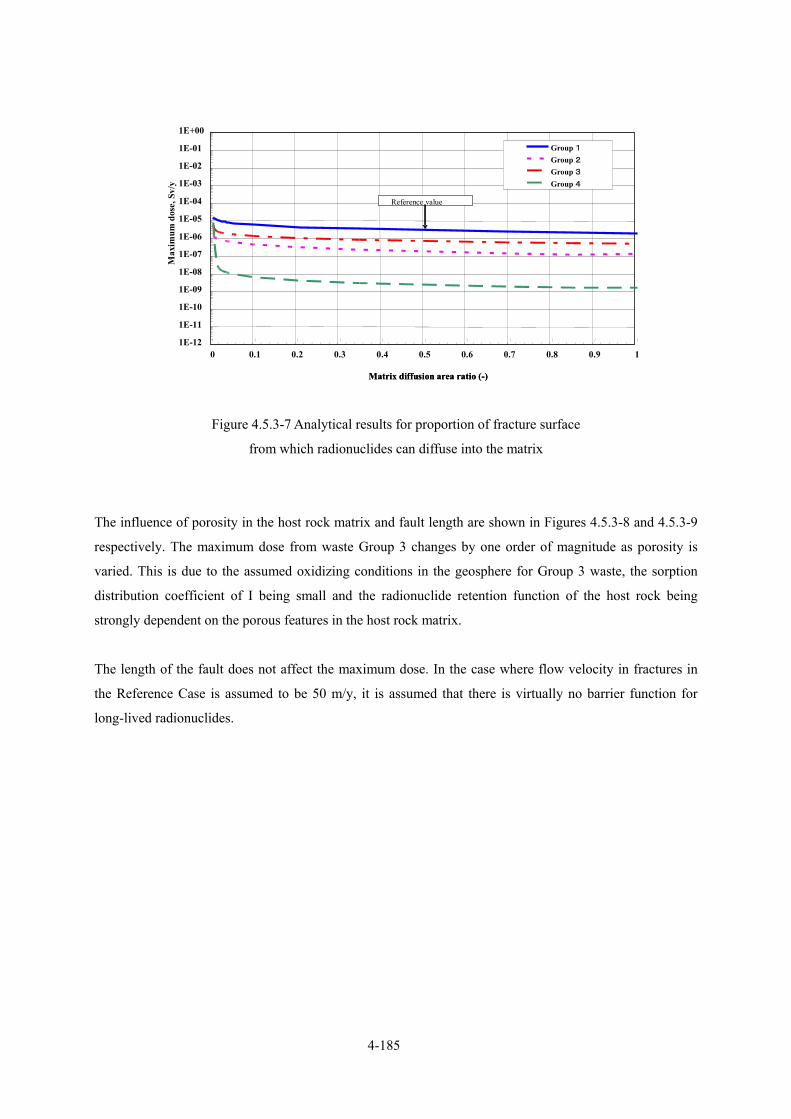
4-185
Figure 4.5.3-7 Analytical results for proportion of fracture surface
from which radionuclides can diffuse into the matrix
The influence of porosity in the host rock matrix and fault length are shown in Figures 4.5.3-8 and 4.5.3-9
respectively. The maximum dose from waste Group 3 changes by one order of magnitude as porosity is
varied. This is due to the assumed oxidizing conditions in the geosphere for Group 3 waste, the sorption
distribution coefficient of I being small and the radionuclide retention function of the host rock being
strongly dependent on the porous features in the host rock matrix.
The length of the fault does not affect the maximum dose. In the case where flow velocity in fractures in
the Reference Case is assumed to be 50 m/y, it is assumed that there is virtually no barrier function for
long-lived radionuclides.
Matrix diffusion area ratio (-)
1E-12
1E-11
1E-10
1E-09
1E-08
1E-07
1E-06
1E-05
1E-04
1E-03
1E-02
1E-01
1E+00
0 0.1 0.2 0.3 0.4 0.5 0.6 0.7 0.8 0.9 1
Max
imum
dos
e, S
v/y
Group 1Group 2Group 3Group 4
Reference value
Matrix diffusion area ratio (-)
1E-12
1E-11
1E-10
1E-09
1E-08
1E-07
1E-06
1E-05
1E-04
1E-03
1E-02
1E-01
1E+00
0 0.1 0.2 0.3 0.4 0.5 0.6 0.7 0.8 0.9 1
Max
imum
dos
e, S
v/y
Group 1Group 2Group 3Group 4
Reference value
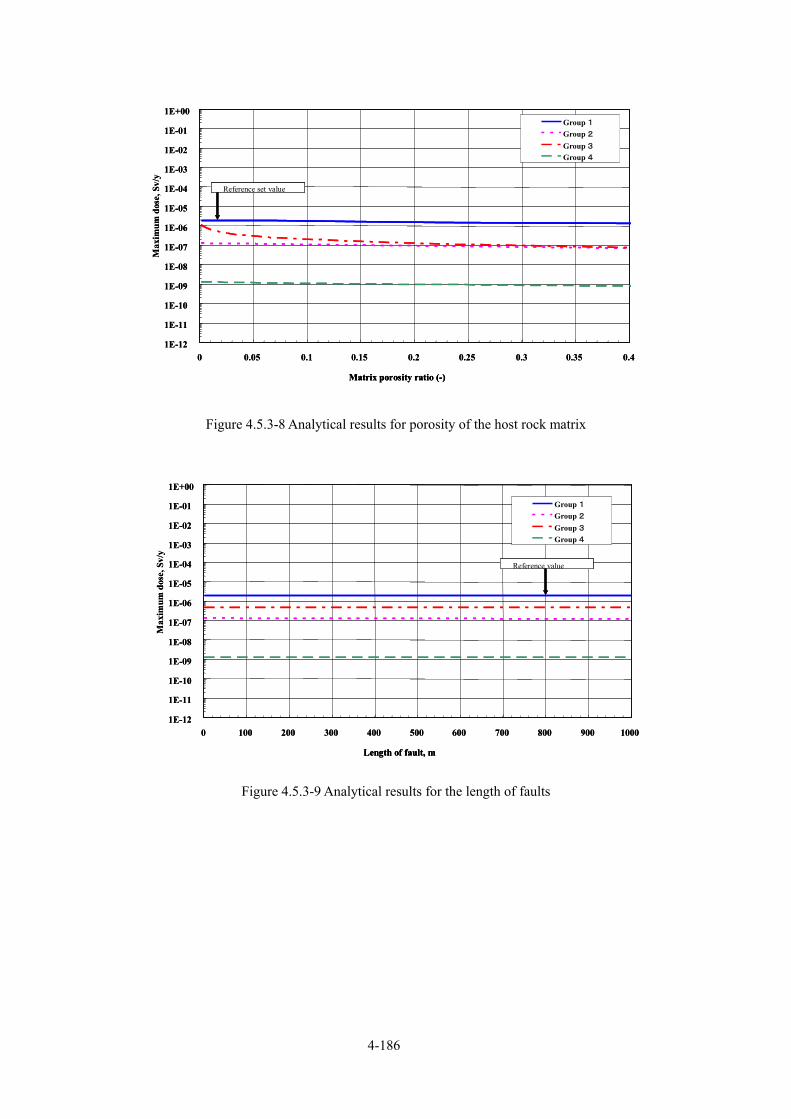
4-186
Figure 4.5.3-8 Analytical results for porosity of the host rock matrix
Figure 4.5.3-9 Analytical results for the length of faults
Matrix porosity ratio (-)
1E-12
1E-11
1E-10
1E-09
1E-08
1E-07
1E-06
1E-05
1E-04
1E-03
1E-02
1E-01
1E+00
0 0.05 0.1 0.15 0.2 0.25 0.3 0.35 0.4
Max
imum
dos
e, S
v/y
Group 1Group 2Group 3Group 4
Reference set value
Matrix porosity ratio (-)Matrix porosity ratio (-)
1E-12
1E-11
1E-10
1E-09
1E-08
1E-07
1E-06
1E-05
1E-04
1E-03
1E-02
1E-01
1E+00
0 0.05 0.1 0.15 0.2 0.25 0.3 0.35 0.4
Max
imum
dos
e, S
v/y
Group 1Group 2Group 3Group 4
Reference set value
Length of fault, m
1E-12
1E-11
1E-10
1E-09
1E-08
1E-07
1E-06
1E-05
1E-04
1E-03
1E-02
1E-01
1E+00
0 100 200 300 400 500 600 700 800 900 1000
Max
imum
dos
e, S
v/y
Group 1Group 2Group 3Group 4
Reference value
Length of fault, mLength of fault, m
1E-12
1E-11
1E-10
1E-09
1E-08
1E-07
1E-06
1E-05
1E-04
1E-03
1E-02
1E-01
1E+00
0 100 200 300 400 500 600 700 800 900 1000
Max
imum
dos
e, S
v/y
Group 1Group 2Group 3Group 4
Reference value
4-187
4.5.3.4 Summary Alterations of the engineered barrier materials are a source of uncertainty, classified in Table 4.5.1-1 as
“uncertainty in the groundwater scenario”. The analysis of this uncertainty considers the influence of initial
oxidizing conditions, colloids and gases. When colloids are included, the maximum dose increases by a
factor of 2 compared to the Reference Case. The increase in the maximum dose due to other effects was not
significant. In these cases, the radionuclide contributing most to dose was I-129 in Group 1 waste.
Analyses of uncertainty in the groundwater scenario (hypothetical values) showed that, compared to the
Reference Case, the maximum dose was increased by a factor of 2 in the case where the host rock was
altered under highly alkaline conditions, and by a factor of 3 in the case where natural organic material was
present.
Alternative cases aimed at the geological environment investigated uncertainties in the groundwater
scenario model and parameters. There were no observed variations in the maximum dose due to differences
in rock types. If the groundwater changes from freshwater-type to seawater-type, the proportion of
radionuclides that migrate to the biosphere is increased. However, if dose conversion factors which are
consistent with the seawater environment are used, the maximum dose is decreased by a factor of about 10.
In this case, the radionuclide that contributed most to the dose was C-14 in Group 2 waste.
These alternative cases also revealed that variations in the maximum dose are caused by the log-mean of
the host rock transmissivity and variations in transmissivity. If the log-mean of the host rick transmissivity
is increased by a factor of 10 compared to the Reference Case, the maximum dose is also increased by a
factor of 10. In all the analytical results, the radionuclide which contributed most to the maximum dose was
I-129 in Group 1 waste.
In the above analyses, the impact/effect of each chosen parameter was evaluated by specifying an optional
fixed value for the parameter, or by changing its value. The other parameter values were fixed to be the
same as in the Reference Case. However, in order to evaluate the effects of uncertainties more robustly,
more detailed analyses are needed to consider the effects of varying all parameter values in different
combinations. The next Section, 4.5.4, describes robust results that were obtained from such a
comprehensive analysis.
4.5.3.5 Future issues ・Model upgrade for alteration of the engineered barrier materials
The model used for evaluating alteration of the engineered barrier materials assumed that some parameters,
such as sorption distribution coefficient and solubility, change abruptly at set time periods. In this analysis,
since the radionuclides I-129 and C-14 which dominate dose are soluble and have low sorption in the
engineered barriers, the sorption distribution coefficient and solubility of the engineered barrier materials
4-188
have no effect on the maximum dose. In future, in order to improve the reliability of the evaluation,
refinement of the model and development of a method for selecting suitable input parameters is needed.
・Upgrading of colloid model and data acquisition
The colloid model in this report assumes linear instantaneous sorption of radionuclides by colloids.
However, at present there is no reliable model for the effect colloids. Hence, integration of realistic models
into the radionuclide transport analysis is necessary. In addition, the chemical forms of radionuclides that
migrate from waste are not uniform. Hence, for assessing the effects of colloids, data for each radionuclide
needs be accumulated and reflected in the radionuclide transport analysis.
・Treatment of host rock alteration in the presence of natural organic material and high pH
Depending on how these datasets are handled can lead to evaluations that are either under-conservative or
over-conservative. Further investigations are needed for these datasets.
・Improving knowledge of I and C in the host rock
Parameters such as depth of matrix diffusion were taken from the safety assement performed in the H12
report. Howerver, the behavior of I and C in the host rock may be different from radionuclides relevant for
HLW. Hence, futher study is required of the behaviour of I and C in the host rock.
4-189
4.5.4 Evaluation of uncertainty in the base scenario In the prevous section (4.5.3), the influence of model and parameter uncertainty in the groundwater
scenario on dose calculation was evaluated by comparing output from alternative cases (e.g. groundwater
scenario uncertainty (cf. Section 4.5.1) etc) with that of the Reference Case.
Here in this section, the influence of overlap of scenarios and/or phenomena and the wide variation in
parameters, including hypothetical parameter ranges, are evaluated using a comprehensive sensitivity
analysis (Ooi et al., 2004). This method involves randomly sampling independent parameters and then
using a statistical approach to identify parameters that have a large impact on dose and to extract
combinations of parameter values (defined as “a successful condition”) that result in doses less than the
target value.
As described in Section 4.5.3, total dose is predominantly controlled by I-129 in Group 1, which is soluble,
has low sorption and does not form a decay chain. In order to reduce the number of computations in the
evaluation, uncertainty concerned with the migration of I-129 mainly is evaluated quantitatively.
In this section the following is presented:
①Quantification of the influence of uncertainty and demonstration of the adequacy of safety assessments;
②Quantification of safety margin to safety criteria and of parameter tolerance to changes in parameter
values;
③Presentation of alternative planning options and of the prospect on the treatment of unresolved
problems;
④Presentation of important issues to be researched.
Section 4.5.4.1 describes the comprehensive sensitivity analysis method, Section 4.5.4.2 the variation
range of parameters, Section 4.5.4.3 the results and Section 4.5.4.4 the conclusions.
4.5.4.1 Comprehensive sensitivity analysis A large number of parameters that have an impact on dose are identified and the effects of each parameter
on dose variation are investigated. Threshold parameter values (or parameter value combinations) that do
not result in a target dose being exceeded are extracted. This condition is defined as a successful condition
(see below).
(1) Identification of important parameters and their impact on dose
In this analysis, a number of parameters are given ranges that are considered to be conservative (see
Section 4.5.4.2 below). Each parameter has its own unique range which is treated as a uniform distribution
for simplicity. Parameter values are identified by random sampling of these uniform distributions. Multiple
maximum doses that are regarded as being statistically significant are calculated using nuclide migration
analyses using OZONE (see Section 4.5.3.1) for the randomly sampled parameter values. These results are
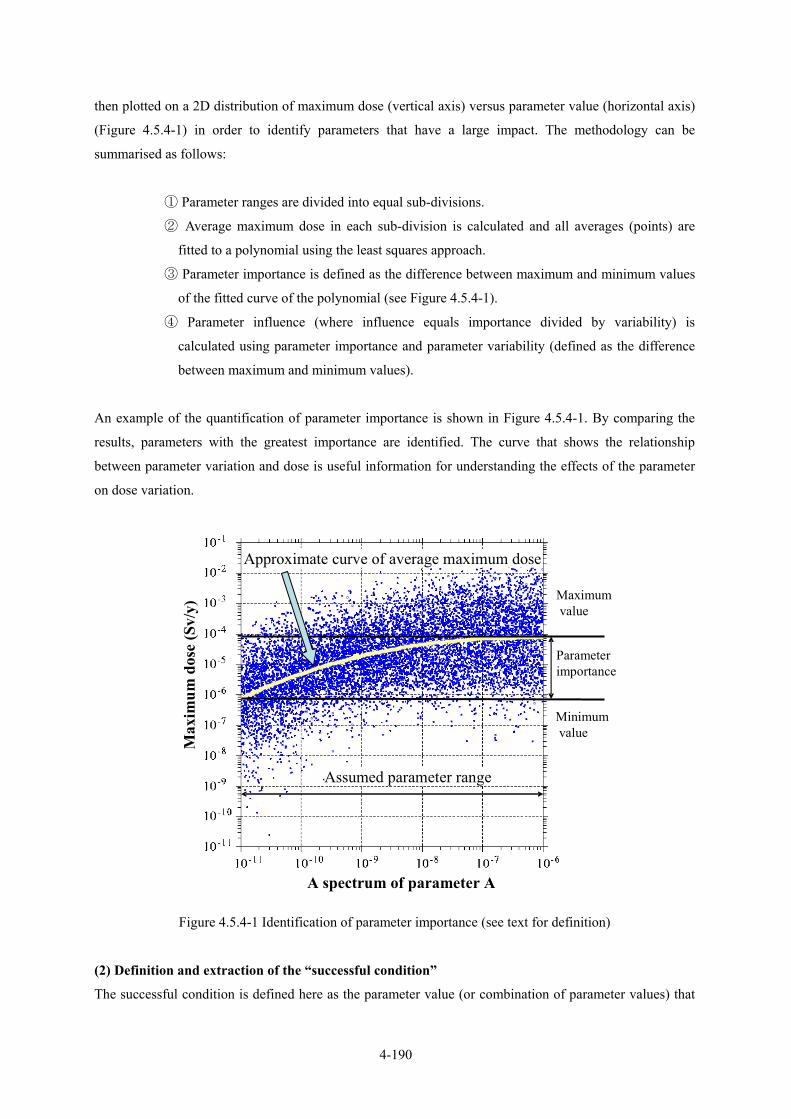
4-190
then plotted on a 2D distribution of maximum dose (vertical axis) versus parameter value (horizontal axis)
(Figure 4.5.4-1) in order to identify parameters that have a large impact. The methodology can be
summarised as follows:
① Parameter ranges are divided into equal sub-divisions.
② Average maximum dose in each sub-division is calculated and all averages (points) are
fitted to a polynomial using the least squares approach.
③ Parameter importance is defined as the difference between maximum and minimum values
of the fitted curve of the polynomial (see Figure 4.5.4-1).
④ Parameter influence (where influence equals importance divided by variability) is
calculated using parameter importance and parameter variability (defined as the difference
between maximum and minimum values).
An example of the quantification of parameter importance is shown in Figure 4.5.4-1. By comparing the
results, parameters with the greatest importance are identified. The curve that shows the relationship
between parameter variation and dose is useful information for understanding the effects of the parameter
on dose variation.
Assumed parameter range
Minimumvalue
Maximumvalue
Approximate curve of average maximum dose
A spectrum of parameter A
Max
imum
dos
e (S
v/y)
Parameter importance
Figure 4.5.4-1 Identification of parameter importance (see text for definition)
(2) Definition and extraction of the “successful condition”
The successful condition is defined here as the parameter value (or combination of parameter values) that
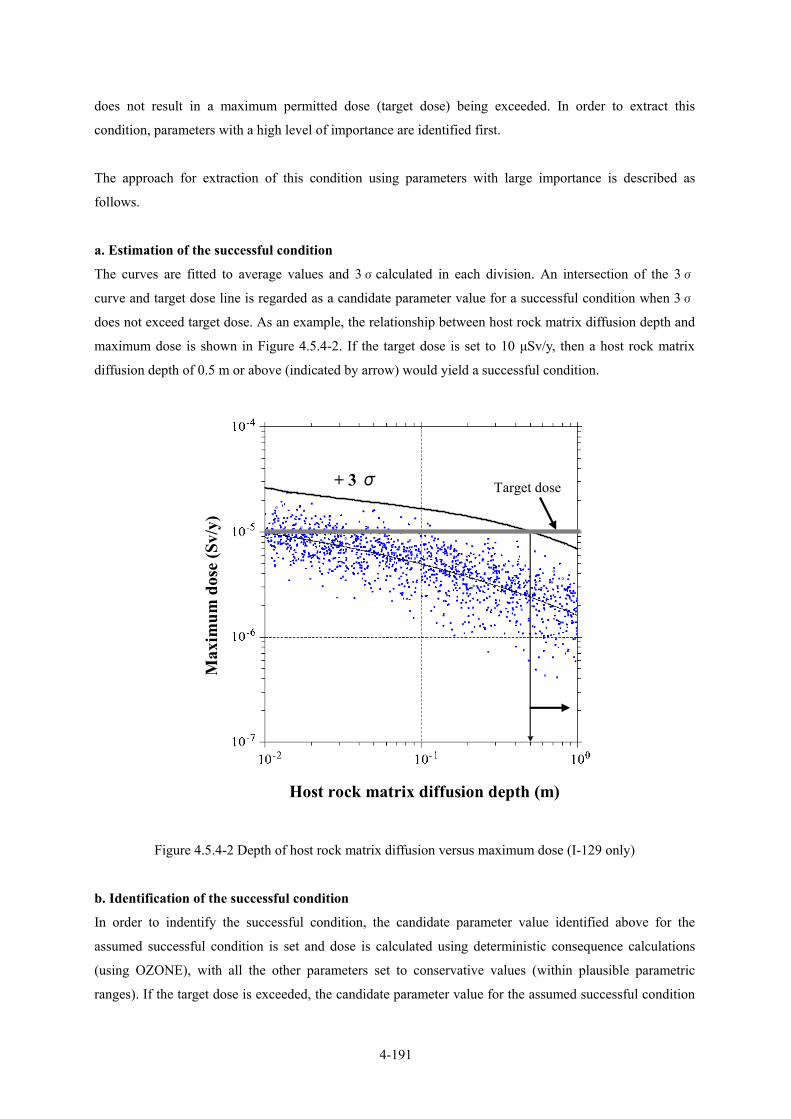
4-191
does not result in a maximum permitted dose (target dose) being exceeded. In order to extract this
condition, parameters with a high level of importance are identified first.
The approach for extraction of this condition using parameters with large importance is described as
follows.
a. Estimation of the successful condition
The curves are fitted to average values and 3σcalculated in each division. An intersection of the 3σ
curve and target dose line is regarded as a candidate parameter value for a successful condition when 3σ
does not exceed target dose. As an example, the relationship between host rock matrix diffusion depth and
maximum dose is shown in Figure 4.5.4-2. If the target dose is set to 10 µSv/y, then a host rock matrix
diffusion depth of 0.5 m or above (indicated by arrow) would yield a successful condition.
+ 3 σ
Host rock matrix diffusion depth (m)
Max
imum
dos
e (S
v/y)
Target dose
Figure 4.5.4-2 Depth of host rock matrix diffusion versus maximum dose (I-129 only)
b. Identification of the successful condition
In order to indentify the successful condition, the candidate parameter value identified above for the
assumed successful condition is set and dose is calculated using deterministic consequence calculations
(using OZONE), with all the other parameters set to conservative values (within plausible parametric
ranges). If the target dose is exceeded, the candidate parameter value for the assumed successful condition

4-192
is varied within the assumed parameter range and the analysis is repeated again until a value is found
where target dose is not exceeded.
c. Confirmation of adequacy of successful condition
The other parameters that were fixed in the calculations above are varied and an upper limit is confirmed
based on deterministic consequence calculations used to identify the successful condition above. If the
target dose is exceeded, the cause is identified and the conservative values of parameters in the
identification of the successful condition are reviewed.
4.5.4.2 Specification of parameter variation ranges A wide parameter range is used in the comprehensive sensitivity analysis based on existing experimental
and literature data in order to cover the parameter values used in the deterministic consequence
calculations. Example parameter ranges, sorption distribution coefficients (Kd) of cementitious filling
material in Group 4 are shown in Figure 4.5.4-3, as well as the reference values from Section 4.5.3. Also,
the parameter ranges and fixed values (Group 1) used in the comprehensive sensitivity analysis above are
shown in Table 4.5.4-1.
1.E-07
1.E-06
1.E-05
1.E-04
1.E-03
1.E-02
1.E-01
1.E+00
1.E+01
1.E+02
1.E+03
I C Cs Th U Np Am
Nuclide
Kd
of c
emen
titio
us fi
lling
mat
eria
l (m
3 /kg)
Reference Engineered barrier alteration effectColloid influenceGas influenceInitial oxidation effectNatural organic material effect
高pHによる母岩影響
地質環境変更影響(地下水組成)
天然バリアデータの変更
Host rock alteration effect by high pHGeological environment alteration caseChange of natural barrier data
Figure 4.5.4-3 Parameter ranges of sorption distribution coefficients (Kd) of cementitious filling materials
used in the comprehensive sensitivity analysis
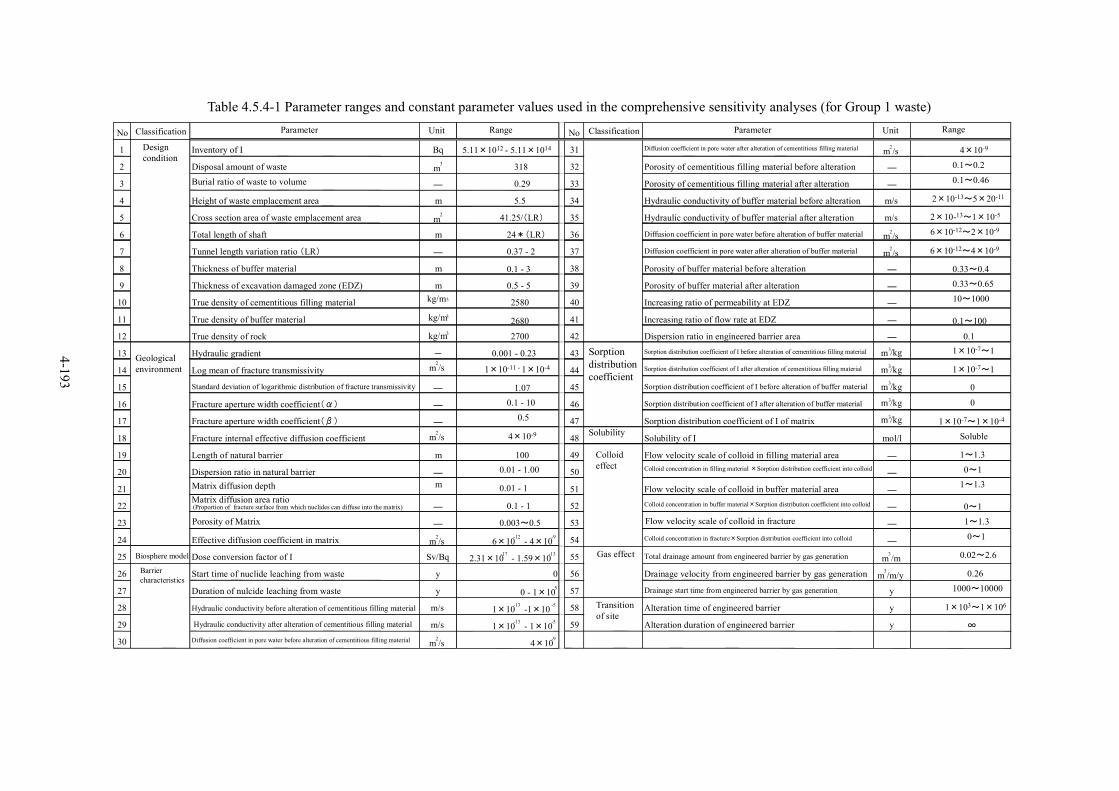
4-193
Table 4.5.4-1 Parameter ranges and constant parameter values used in the comprehensive sensitivity analyses (for Group 1 waste)
No Classification Parameter Unit Range No Classification Parameter Unit Range
1 Inventory of I Bq 5.11×10¹² - 5.11×10¹⁴ 31 Diffusion coefficient in pore water after alteration of cementitious filling material m2/s 4×10⁻⁹
2 Disposal amount of waste m3 318 32 Porosity of cementitious filling material before alteration ― 0.1~0.2
3 Burial ratio of waste to volume ― 0.29 33 Porosity of cementitious filling material after alteration ― 0.1~0.46
4 Height of waste emplacement area m 5.5 34 Hydraulic conductivity of buffer material before alteration m/s 2×10-13~5×20-11
5 Cross section area of waste emplacement area m2 41.25/(LR) 35 Hydraulic conductivity of buffer material after alteration m/s 2×10-13~1×10⁻⁵
6 Total length of shaft m 24*(LR) 36 Diffusion coefficient in pore water before alteration of buffer material m2/s 6×10-12~2×10⁻⁹
7 Tunnel length variation ratio (LR) ― 0.37 - 2 37 Diffusion coefficient in pore water after alteration of buffer material m2/s 6×10-12~4×10⁻⁹
8 Thickness of buffer material m 0.1 - 3 38 Porosity of buffer material before alteration ― 0.33~0.4
9 Thickness of excavation damaged zone (EDZ) m 0.5 - 5 39 Porosity of buffer material after alteration ― 0.33~0.65
10 True density of cementitious filling material kg/m3 2580 40 Increasing ratio of permeability at EDZ ― 10~1000
11 True density of buffer material kg/m3 2680 41 Increasing ratio of flow rate at EDZ ― 0.1~100
12 True density of rock kg/m3 2700 42 Dispersion ratio in engineered barrier area ― 0.1
13 Hydraulic gradient - 0.001 - 0.23 43 Sorption distribution coefficient of I before alteration of cementitious filling material m3/kg 1×10⁻⁷~1
14 Log mean of fracture transmissivity m2/s 1×10-11 - 1×10⁻⁴ 44 Sorption distribution coefficient of I after alteration of cementitious filling material m3/kg 1×10⁻⁷~1
15 Standard deviation of logarithmic distribution of fracture transmissivity ― 1.07 45 Sorption distribution coefficient of I before alteration of buffer material m3/kg 0
16 Fracture aperture width coefficient(α) ― 0.1 - 10 46 Sorption distribution coefficient of I after alteration of buffer material m3/kg 0
17 Fracture aperture width coefficient(β) ― 0.5 47 Sorption distribution coefficient of I of matrix m3/kg 1×10⁻⁷~1×10⁻⁴
18 Fracture internal effective diffusion coefficient m2/s 4×10⁻⁹ 48 Solubility Solubility of I mol/l Soluble
19 Length of natural barrier m 100 49 Flow velocity scale of colloid in filling material area ― 1~1.3
20 Dispersion ratio in natural barrier ― 0.01 - 1.00 50 Colloid concentration in filling material ×Sorption distribution coefficient into colloid― 0~1
21 Matrix diffusion depth 0.01 - 1 51 Flow velocity scale of colloid in buffer material area ―1~1.3
22Matrix diffusion area ratio
― 0.1 - 1 52 Colloid concentration in buffer material×Sorption distribution coefficient into colloid ― 0~1
23 Porosity of Matrix ― 0.003~0.5 53 Flow velocity scale of colloid in fracture ― 1~1.3
24 Effective diffusion coefficient in matrix m2/s 6×10-12 - 4×10⁻⁹ 54 Colloid concentration in fracture×Sorption distribution coefficient into colloid ― 0~1
25 Biosphere model Dose conversion factor of I Sv/Bq 2.31×10⁻¹⁷ - 1.59×10⁻¹³ 55 Total drainage amount from engineered barrier by gas generation m3/m 0.02~2.6
26 Start time of nuclide leaching from waste y 0 56 Drainage velocity from engineered barrier by gas generation m3/m/y 0.26
27 Duration of nulcide leaching from waste y 0 - 1×10⁵ 57 Drainage start time from engineered barrier by gas generation y 1000~10000
28 Hydraulic conductivity before alteration of cementitious filling material m/s 1×10-13 -1×10 -5 58 Alteration time of engineered barrier y 1×10³~1×10⁶
29 Hydraulic conductivity after alteration of cementitious filling material m/s 1×10-13 - 1×10⁻⁵ 59 Alteration duration of engineered barrier y ∞
30 Diffusion coefficient in pore water before alteration of cementitious filling material m2/s 4×10⁻⁹
Design condition
Geologicalenvironment
Barriercharacteristics
Transition of site
Gas effect
Colloid effect
Sorption distribution coefficient
(Proportion of fracture surface from which nuclides can diffuse into the matrix)
m

4-194
4.5.4.3 Analytical results The first step is to decide on a target dose. Here 10 µSv/y is chosen as the target dose (with I-129 in as the
target radionuclide). A preliminary analysis is performed and linear relationships between dose conversion
factor and dose, and between radionuclide inventory and dose are confirmed in Group 1.
Here, the radionuclide inventory and dose conversion factor are set to the reference value and other
parameters with a high level of importance are identified and the successful conditions are extracted.
(1) Results of statistical analysis
The results of the statistical analysis and comparisons between level of importance and influence on
maximum dose are shown in Figure 4.5.4-4. The result of the deterministic consequence analysis for the
Reference Case shown in Section 4.5.2 and the results of alternative cases shown in Section 4.5.3 are
illustrated in Figure 4.5.4-4. From Figure 4.5.4-4, it can be seen that the log-mean of fracture
transmissivity, duration of nuclide leaching from waste, sorption distribution coefficient of I before
alteration of cementitious filling material and hydraulic gradient significantly affect the maximum dose.
These parameters have a high level of importance.
0 0.5 1 1.5 2 2.5 3
Log mean of fracture transmissivityDuration of nuclide leaching from waste
Sorption distribution coefficient ofI before alteration of cementitious
filling materialHydrological gradient
Thickness of buffer materialSorption distribution coefficient ofI after alteration of cementitious
filling materialIncreasing ratio of flow rate at EDZ
Host rock matrix diffusion depth
Diffusion coefficient in pore water before alteration of buffer material
Alteration time of engineered barrier
Porosity of matrix
Matrix diffusion area ratio
Flow velocity scale of colloidin fracturePorosity after alteration of buffer material
Flow velocity scale of colloid ofcolloid in filling material region
Dispersion ratio in natural barrier
Parameter importance
Parameter importance
Parameter influence
Reference case
Colloid influence case
Engineered barrier alteration influence case
Initial oxidation effect case
Natural organic effect case
Gas influence caseChange of rock type effect caseChange of groundwater origineffect caseUncertainty of permeability coefficient effect caseUncertainty of hydrological gradient effect
Host rock alteration effect cased by high pH
Time (y)
Max
imum
dos
e (S
v/y)
Figure 4.5.4-4 Results of the statistical analysis and comparisons between level of importance
and influence on maximum dose
The successful condition is evaluated by focusing on the log-mean of fracture transmissivity. The
relationship between log-mean and maximum dose is shown in Figure 4.5.4-5. From Figure 4.5.4-5,
permitted dose (10 µSv/y) is exceeded if other parameters are varied. This shows that the log-mean of
fracture transmissivity alone does not result in a successful condition.
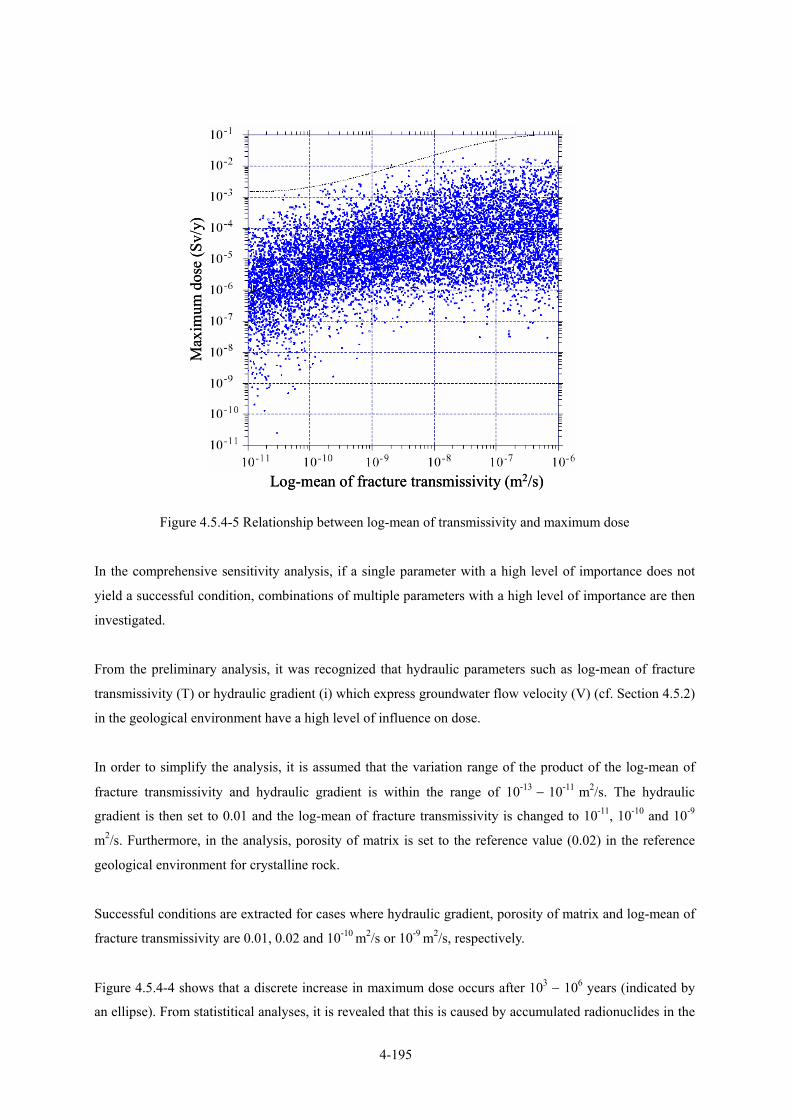
4-195
Figure 4.5.4-5 Relationship between log-mean of transmissivity and maximum dose
In the comprehensive sensitivity analysis, if a single parameter with a high level of importance does not
yield a successful condition, combinations of multiple parameters with a high level of importance are then
investigated.
From the preliminary analysis, it was recognized that hydraulic parameters such as log-mean of fracture
transmissivity (T) or hydraulic gradient (i) which express groundwater flow velocity (V) (cf. Section 4.5.2)
in the geological environment have a high level of influence on dose.
In order to simplify the analysis, it is assumed that the variation range of the product of the log-mean of
fracture transmissivity and hydraulic gradient is within the range of 10-13 − 10-11 m2/s. The hydraulic
gradient is then set to 0.01 and the log-mean of fracture transmissivity is changed to 10-11, 10-10 and 10-9
m2/s. Furthermore, in the analysis, porosity of matrix is set to the reference value (0.02) in the reference
geological environment for crystalline rock.
Successful conditions are extracted for cases where hydraulic gradient, porosity of matrix and log-mean of
fracture transmissivity are 0.01, 0.02 and 10-10 m2/s or 10-9 m2/s, respectively.
Figure 4.5.4-4 shows that a discrete increase in maximum dose occurs after 103 − 106 years (indicated by
an ellipse). From statistitical analyses, it is revealed that this is caused by accumulated radionuclides in the
Max
imum
dos
e (S
v/y)
Log-mean of fracture transmissivity (m2/s)
Max
imum
dos
e (S
v/y)
Log-mean of fracture transmissivity (m2/s)
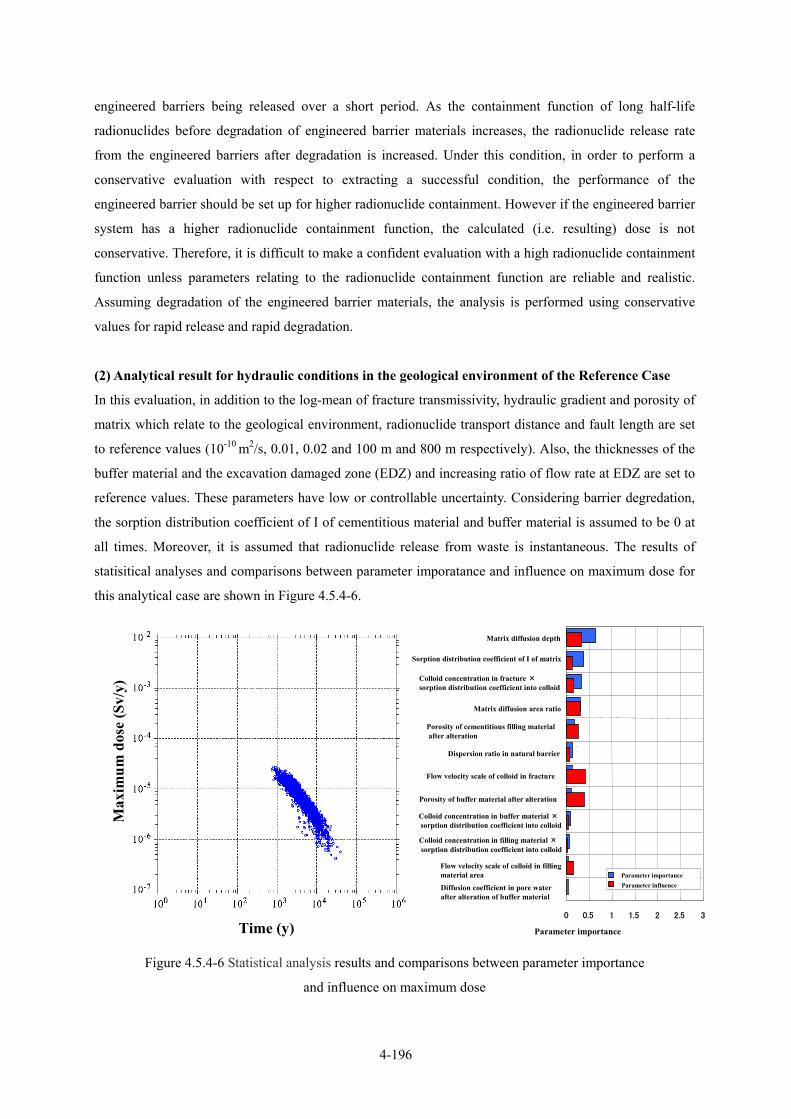
4-196
engineered barriers being released over a short period. As the containment function of long half-life
radionuclides before degradation of engineered barrier materials increases, the radionuclide release rate
from the engineered barriers after degradation is increased. Under this condition, in order to perform a
conservative evaluation with respect to extracting a successful condition, the performance of the
engineered barrier should be set up for higher radionuclide containment. However if the engineered barrier
system has a higher radionuclide containment function, the calculated (i.e. resulting) dose is not
conservative. Therefore, it is difficult to make a confident evaluation with a high radionuclide containment
function unless parameters relating to the radionuclide containment function are reliable and realistic.
Assuming degradation of the engineered barrier materials, the analysis is performed using conservative
values for rapid release and rapid degradation.
(2) Analytical result for hydraulic conditions in the geological environment of the Reference Case
In this evaluation, in addition to the log-mean of fracture transmissivity, hydraulic gradient and porosity of
matrix which relate to the geological environment, radionuclide transport distance and fault length are set
to reference values (10-10 m2/s, 0.01, 0.02 and 100 m and 800 m respectively). Also, the thicknesses of the
buffer material and the excavation damaged zone (EDZ) and increasing ratio of flow rate at EDZ are set to
reference values. These parameters have low or controllable uncertainty. Considering barrier degredation,
the sorption distribution coefficient of I of cementitious material and buffer material is assumed to be 0 at
all times. Moreover, it is assumed that radionuclide release from waste is instantaneous. The results of
statisitical analyses and comparisons between parameter imporatance and influence on maximum dose for
this analytical case are shown in Figure 4.5.4-6.
Max
imum
dos
e (S
v/y)
Time (y)0 0.5 1 1.5 2 2.5 3
Matrix diffusion depth
Sorption distribution coefficient of I of matrix
Colloid concentration in fracture ×sorption distribution coefficient into colloid
Matrix diffusion area ratio
Porosity of cementitious filling materialafter alteration
Dispersion ratio in natural barrier
Flow velocity scale of colloid in fracture
Porosity of buffer material after alteration
Colloid concentration in buffer material ×sorption distribution coefficient into colloid
Colloid concentration in filling material ×sorption distribution coefficient into colloid
Flow velocity scale of colloid in filling material area
Diffusion coefficient in pore water after alteration of buffer material
Parameter importance
Parameter importanceParameter influence
Figure 4.5.4-6 Statistical analysis results and comparisons between parameter importance
and influence on maximum dose
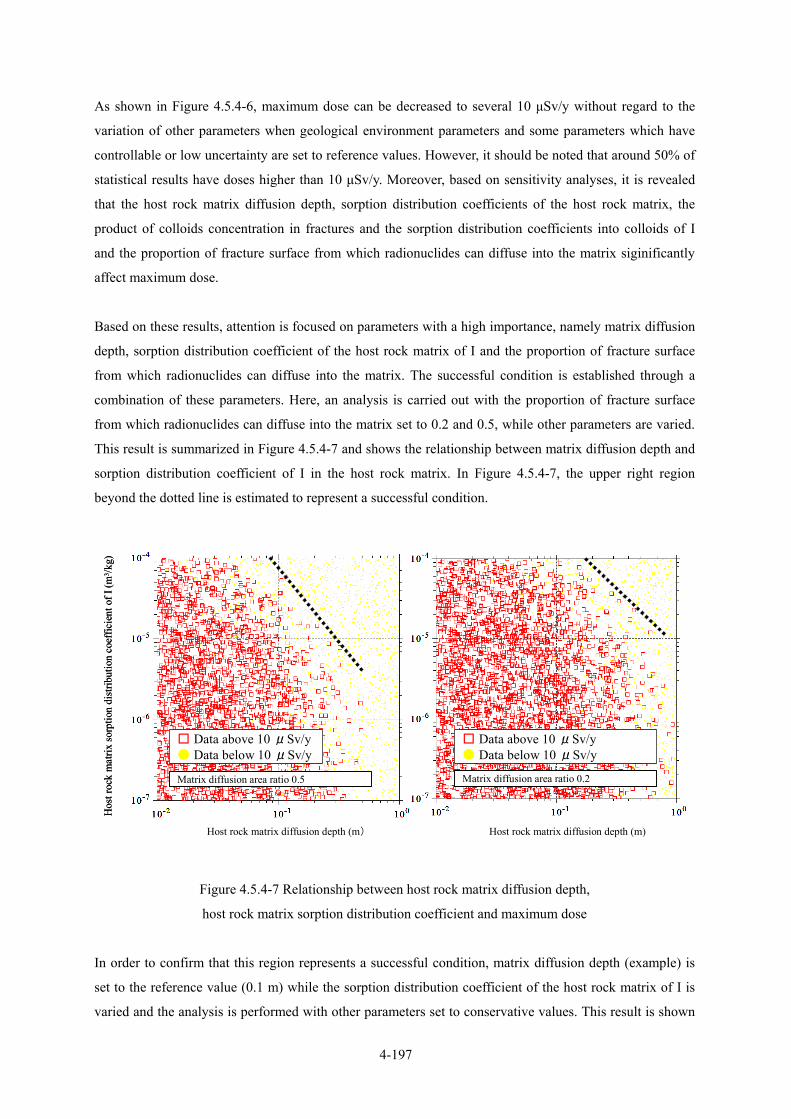
4-197
As shown in Figure 4.5.4-6, maximum dose can be decreased to several 10 µSv/y without regard to the
variation of other parameters when geological environment parameters and some parameters which have
controllable or low uncertainty are set to reference values. However, it should be noted that around 50% of
statistical results have doses higher than 10 µSv/y. Moreover, based on sensitivity analyses, it is revealed
that the host rock matrix diffusion depth, sorption distribution coefficients of the host rock matrix, the
product of colloids concentration in fractures and the sorption distribution coefficients into colloids of I
and the proportion of fracture surface from which radionuclides can diffuse into the matrix siginificantly
affect maximum dose.
Based on these results, attention is focused on parameters with a high importance, namely matrix diffusion
depth, sorption distribution coefficient of the host rock matrix of I and the proportion of fracture surface
from which radionuclides can diffuse into the matrix. The successful condition is established through a
combination of these parameters. Here, an analysis is carried out with the proportion of fracture surface
from which radionuclides can diffuse into the matrix set to 0.2 and 0.5, while other parameters are varied.
This result is summarized in Figure 4.5.4-7 and shows the relationship between matrix diffusion depth and
sorption distribution coefficient of I in the host rock matrix. In Figure 4.5.4-7, the upper right region
beyond the dotted line is estimated to represent a successful condition.
Figure 4.5.4-7 Relationship between host rock matrix diffusion depth,
host rock matrix sorption distribution coefficient and maximum dose
In order to confirm that this region represents a successful condition, matrix diffusion depth (example) is
set to the reference value (0.1 m) while the sorption distribution coefficient of the host rock matrix of I is
varied and the analysis is performed with other parameters set to conservative values. This result is shown
Hos
t roc
k m
atrix
sorp
tion
dist
ribut
ion
coef
ficie
nt o
f I (m
3 /kg)
Host rock matrix diffusion depth (m) Host rock matrix diffusion depth (m)
Matrix diffusion area ratio 0.5
Data above 10 μSv/y Data below 10 μSv/y
Data above 10 μSv/y Data below 10 μSv/y
Matrix diffusion area ratio 0.2
Hos
t roc
k m
atrix
sorp
tion
dist
ribut
ion
coef
ficie
nt o
f I (m
3 /kg)
Host rock matrix diffusion depth (m) Host rock matrix diffusion depth (m)
Matrix diffusion area ratio 0.5
Data above 10 μSv/y Data below 10 μSv/y
Data above 10 μSv/y Data below 10 μSv/y
Matrix diffusion area ratio 0.2
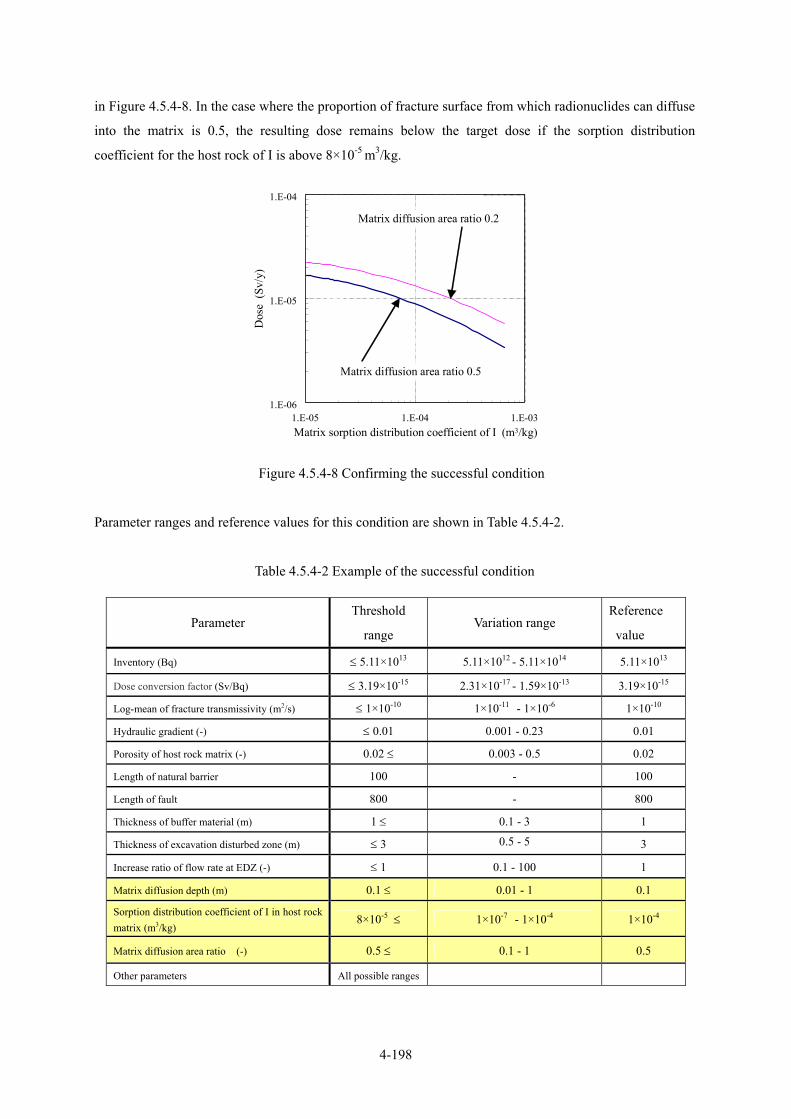
4-198
in Figure 4.5.4-8. In the case where the proportion of fracture surface from which radionuclides can diffuse
into the matrix is 0.5, the resulting dose remains below the target dose if the sorption distribution
coefficient for the host rock of I is above 8×10⁻⁵ m3/kg.
Figure 4.5.4-8 Confirming the successful condition
Parameter ranges and reference values for this condition are shown in Table 4.5.4-2.
Table 4.5.4-2 Example of the successful condition
Parameter Threshold
range Variation range
Reference
value
Inventory (Bq) ≤ 5.11×10¹³ 5.11×10¹² - 5.11×10¹⁴ 5.11×10¹³
Dose conversion factor (Sv/Bq) ≤ 3.19×10⁻¹⁵ 2.31×10⁻¹⁷ - 1.59×10⁻¹³ 3.19×10⁻¹⁵
Log-mean of fracture transmissivity (m2/s) ≤ 1×10⁻¹⁰ 1×10-11 - 1×10⁻⁶ 1×10⁻¹⁰
Hydraulic gradient (-) ≤ 0.01 0.001 - 0.23 0.01
Porosity of host rock matrix (-) 0.02 ≤ 0.003 - 0.5 0.02
Length of natural barrier 100 - 100
Length of fault 800 - 800
Thickness of buffer material (m) 1 ≤ 0.1 - 3 1
Thickness of excavation disturbed zone (m) ≤ 3 0.5 - 5 3
Increase ratio of flow rate at EDZ (-) ≤ 1 0.1 - 100 1
Matrix diffusion depth (m) 0.1 ≤ 0.01 - 1 0.1
Sorption distribution coefficient of I in host rock matrix (m3/kg)
8×10⁻⁵ ≤ 1×10⁻⁷ - 1×10⁻⁴ 1×10⁻⁴
Matrix diffusion area ratio (-) 0.5 ≤ 0.1 - 1 0.5
Other parameters All possible ranges
Matrix diffusion area ratio 0.2
Matrix diffusion area ratio 0.5
1.E-06
1.E-05
1.E-04
1.E-05 1.E-04 1.E-03Matrix sorption distribution coefficient of I (m3/kg)
Dos
e (S
v/y)
Matrix diffusion area ratio 0.2
Matrix diffusion area ratio 0.5
Matrix diffusion area ratio 0.2
Matrix diffusion area ratio 0.5
1.E-06
1.E-05
1.E-04
1.E-05 1.E-04 1.E-03Matrix sorption distribution coefficient of I (m3/kg)
Dos
e (S
v/y)
Matrix diffusion area ratio 0.2
Matrix diffusion area ratio 0.5
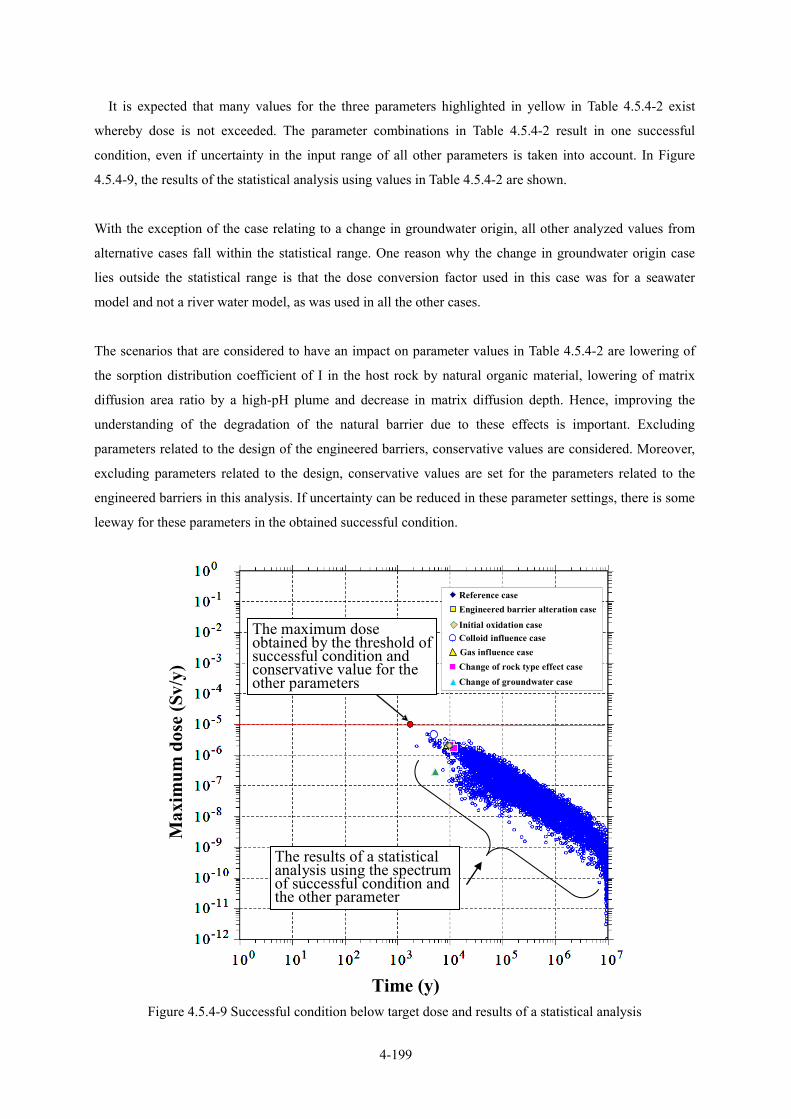
4-199
It is expected that many values for the three parameters highlighted in yellow in Table 4.5.4-2 exist
whereby dose is not exceeded. The parameter combinations in Table 4.5.4-2 result in one successful
condition, even if uncertainty in the input range of all other parameters is taken into account. In Figure
4.5.4-9, the results of the statistical analysis using values in Table 4.5.4-2 are shown.
With the exception of the case relating to a change in groundwater origin, all other analyzed values from
alternative cases fall within the statistical range. One reason why the change in groundwater origin case
lies outside the statistical range is that the dose conversion factor used in this case was for a seawater
model and not a river water model, as was used in all the other cases.
The scenarios that are considered to have an impact on parameter values in Table 4.5.4-2 are lowering of
the sorption distribution coefficient of I in the host rock by natural organic material, lowering of matrix
diffusion area ratio by a high-pH plume and decrease in matrix diffusion depth. Hence, improving the
understanding of the degradation of the natural barrier due to these effects is important. Excluding
parameters related to the design of the engineered barriers, conservative values are considered. Moreover,
excluding parameters related to the design, conservative values are set for the parameters related to the
engineered barriers in this analysis. If uncertainty can be reduced in these parameter settings, there is some
leeway for these parameters in the obtained successful condition.
成立条件
Reference case
Change of rock type effect caseGas influence caseColloid influence case
Engineered barrier alteration case
Initial oxidation case
Change of groundwater case
The maximum dose obtained by the threshold of successful condition and conservative value for the other parameters
Max
imum
dos
e (S
v/y)
Time (y)
The results of a statistical analysis using the spectrum of successful condition and the other parameter
Figure 4.5.4-9 Successful condition below target dose and results of a statistical analysis
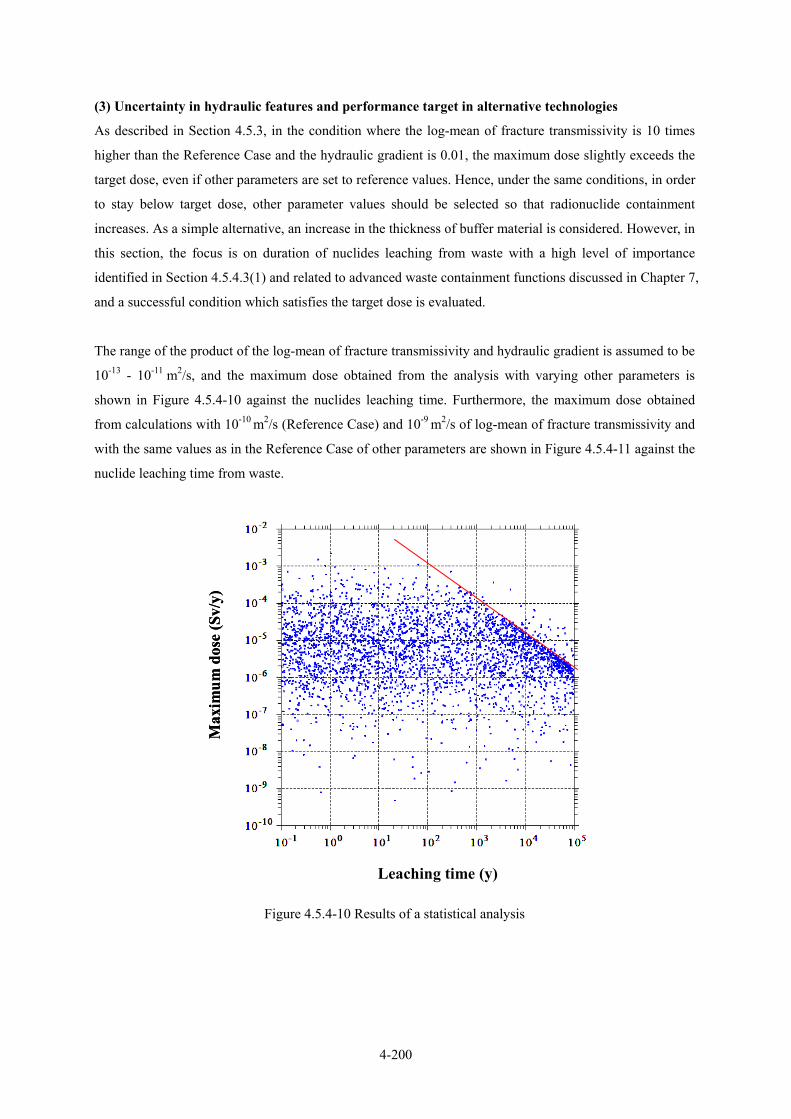
4-200
(3) Uncertainty in hydraulic features and performance target in alternative technologies
As described in Section 4.5.3, in the condition where the log-mean of fracture transmissivity is 10 times
higher than the Reference Case and the hydraulic gradient is 0.01, the maximum dose slightly exceeds the
target dose, even if other parameters are set to reference values. Hence, under the same conditions, in order
to stay below target dose, other parameter values should be selected so that radionuclide containment
increases. As a simple alternative, an increase in the thickness of buffer material is considered. However, in
this section, the focus is on duration of nuclides leaching from waste with a high level of importance
identified in Section 4.5.4.3(1) and related to advanced waste containment functions discussed in Chapter 7,
and a successful condition which satisfies the target dose is evaluated.
The range of the product of the log-mean of fracture transmissivity and hydraulic gradient is assumed to be
10-13 - 10-11 m2/s, and the maximum dose obtained from the analysis with varying other parameters is
shown in Figure 4.5.4-10 against the nuclides leaching time. Furthermore, the maximum dose obtained
from calculations with 10-10 m2/s (Reference Case) and 10-9 m2/s of log-mean of fracture transmissivity and
with the same values as in the Reference Case of other parameters are shown in Figure 4.5.4-11 against the
nuclide leaching time from waste.
Leaching time (y)
Max
imum
dos
e (S
v/y)
Leaching time (y)
Max
imum
dos
e (S
v/y)
Figure 4.5.4-10 Results of a statistical analysis
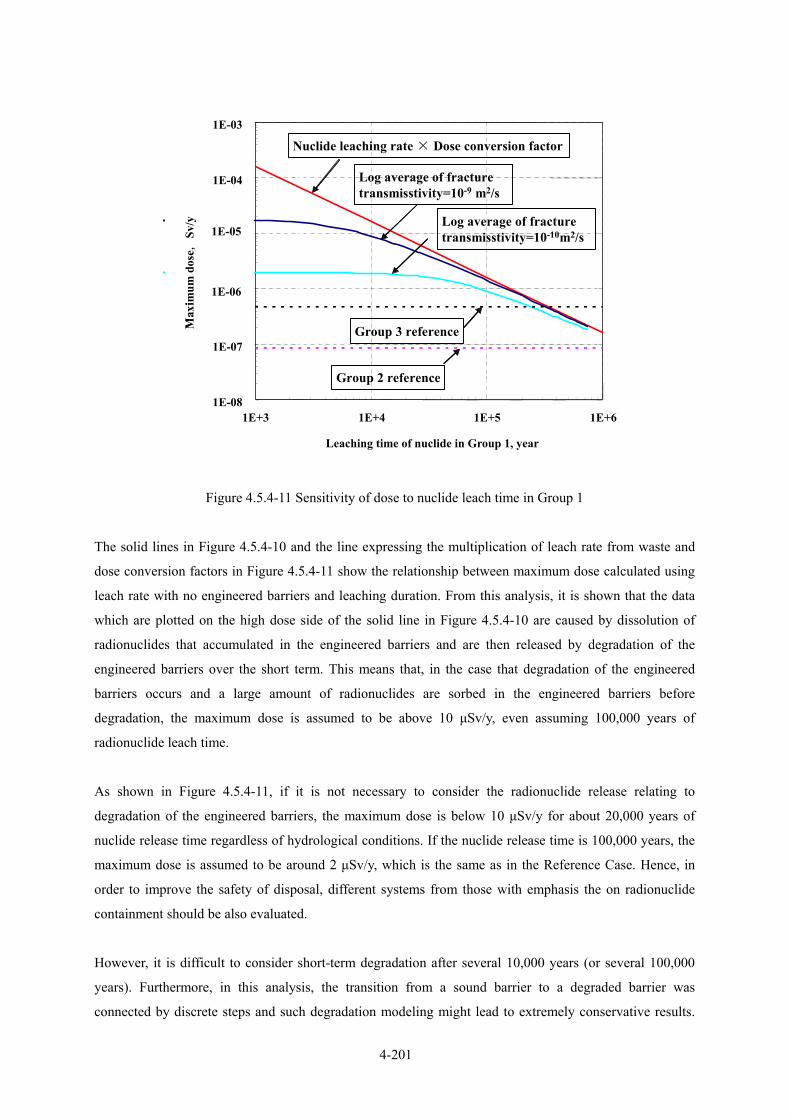
4-201
Figure 4.5.4-11 Sensitivity of dose to nuclide leach time in Group 1
The solid lines in Figure 4.5.4-10 and the line expressing the multiplication of leach rate from waste and
dose conversion factors in Figure 4.5.4-11 show the relationship between maximum dose calculated using
leach rate with no engineered barriers and leaching duration. From this analysis, it is shown that the data
which are plotted on the high dose side of the solid line in Figure 4.5.4-10 are caused by dissolution of
radionuclides that accumulated in the engineered barriers and are then released by degradation of the
engineered barriers over the short term. This means that, in the case that degradation of the engineered
barriers occurs and a large amount of radionuclides are sorbed in the engineered barriers before
degradation, the maximum dose is assumed to be above 10 µSv/y, even assuming 100,000 years of
radionuclide leach time.
As shown in Figure 4.5.4-11, if it is not necessary to consider the radionuclide release relating to
degradation of the engineered barriers, the maximum dose is below 10 µSv/y for about 20,000 years of
nuclide release time regardless of hydrological conditions. If the nuclide release time is 100,000 years, the
maximum dose is assumed to be around 2 µSv/y, which is the same as in the Reference Case. Hence, in
order to improve the safety of disposal, different systems from those with emphasis the on radionuclide
containment should be also evaluated.
However, it is difficult to consider short-term degradation after several 10,000 years (or several 100,000
years). Furthermore, in this analysis, the transition from a sound barrier to a degraded barrier was
connected by discrete steps and such degradation modeling might lead to extremely conservative results.
1E-08
1E-07
1E-04
1E-03
1E+3 1E+4 1E+5 1E+6
Nuclide leaching rate × Dose conversion factor
Log average of fracture transmisstivity=10-9 m2/s
Group 2 reference
Group 3 referenceMax
imum
dos
e,Sv
/y
1E-05
1E-06
Nulcide infiltration time in group 1, year
Log average of fracture transmisstivity=10-10m2/s
Leaching time of nuclide in Group 1, year

4-202
Since there is insufficient knowledge about the temporal change in the engineered barriers, further work on
improving understanding of temporal change is needed.
In addition to analyses of alternative cases using deterministic consequence analyses in Section 4.5.3, the
result of the comprehensive sensitivity analysis which includes influence of change in design conditions
(variation in thickness of buffer material), change in waste performance (effect of changing of radionuclide
leach rate) was shown.
These analyses use a one-dimensional multipathway model in the natural barrier based on the 1D
parallel-plate model. However, it is important to evaluate the effect of model uncertainty on dose. In this
report, in evaluating the effect of model/parameter uncertainty, the assumption that the transport medium in
the natural barrier is a porous medium is considered.
A comprehensive sensitivity analysis for a natural barrier with a porous medium has already been
performed using the same parameters as above (e.g. inventory) (Ooi et al., 2004). From this result, it was
shown that the successful condition could be extracted even in groundwater flow rate conditions (product
of hydraulic conductivity and hydraulic gradient (1.0×10⁻⁹ m s-1 ×0.05)) that are 5 times higher than
groundwater flow rate (1.0×10⁻⁹ m s-1 ×0.01) in the Reference Case for porous media in this study. Because
of the different models, simple comparison appears difficult. However, the concept of TRU waste
geological disposal in this report is considered to be a robust concept from the point of view of safety, even
in the migration model for a porous medium natural barrier.
4.5.4.4 Summary 1. It has been confirmed that parameters describing geological environment conditions
(hydrogeological parameters) significantly affect the maximum dose.
2. It has been confirmed that, when the geological environment conditions (log-mean transmissivity,
hydraulic gradient, porosity of matrix), analytical conditions (length of natural barrier, length of
fault) and design condition parameters were assumed to have the same values as in the Reference
Case, even if the uncertainties are taken into account in all parameters except the above, the
maximum dose was less than several 10s of µSv/y and safety is not significantly compromised.
3. In the successful condition obtained from the comprehensive sensitivity analysis, it has been
confirmed that, if it is assumed that the maximum acceptable target dose is 10 µSv/y, safety is not
compromised by the effects of engineered barrier degradation, colloids, gases and initial oxidizing
conditions. This result holds true even when the effects of these phenomena are considered together.
Furthermore, concerning hypothetical uncertainty of natural organic material and alteration of host
rock by high pH, if the sorption distribution coefficient of I, host rock matrix diffusion depth of I
and surface area through which I may diffuse were the same as in the Reference Case, it was
confirmed that safety is not compromised even when all other varied parameters are considered

4-203
together.
4. It has been confirmed that system safety will not be compromised in the case where the geological
environment conditions are not as favorable as the reference conditions, due to improvements in the
performance of waste packages. This result is true even when consideration is given to uncertainties
in other phenomena.
5. By adopting a comprehensive sensitivity analysis approach, it is possible to perfom a
comprehensive evaluation of the effects of uncertainty on system safety. It is considered that the
method is able to present the characteristics of system performance in a way that is easy to
understand by using key parameters and successful conditions.
4.5.4.5 Future issues The reliability of the results obtained from the comprehensive sensitivity analysis depends on the
conservativeness of analytical models for evaluating each phenomenon and parameter ranges. Hence,
further study of the phenomena mentioned in Section 4.4 is necessary, in addition to developing a
sensitivity analysis approach that can handle epistemic uncertainty (uncertainty due to ignorance and/or
lack of understanding of a system). Moreover, since most parameters can be correlated with other
parameters, development of a sensitivity analysis approach that can handle such parameter relationships is
also a future issue.
4.5.5 Analysis of the perturbation scenario 4.5.5.1 Natural event impact case Natural phenomena generic FEPs (earthquake/active faulting, volcanoes/magma activity, uplift/erosion,
climate/sea-level change and meteorite impact) are considered here. However, based on FEP screening,
only uplift/erosion and climate/sea-level change are chosen as important phenomena in the safety
assessment for the geological disposal of TRU waste (cf. Section 4.3.3). If a suitable site is selected, the
probability of occurrence and the impact on safety of the geological disposal system is considered to be
negligible, hence, others phenomena (earthquake/active faulting, volcanoes/magma activity and meteorite
impact) are excluded from the safety assessment.
(1) Uplift and erosion
a. Assumptions
If the disposal site shows evidence of long-term uplift and the rate of uplift/erosion is assumed to be the
same, the disposal depth could become shallow. If the disposal site reaches the weathered zone (up to 100
m below the suface), many changes to the hydrogeology and chemical environment of the host rock may
occur. The assumed geological environment of the disposal facility during uplift/erosion is shown in Figure
4.5.5-1.
If uplift and erosion continue over the long-term, the disposal facility will be exposed at the surface and

4-204
radioactive material could be directly released into the biosphere without transport via groundwater. The
influence of such a condition on the safety assessment is described in the isolation failure scenario below.
Weathered zone~100 m
TRU waste disposal site
Variation in hydrological environment
Oxidizing groundwater
Decreasing disposal depth
Weathered zone~100 m
TRU waste disposal site
Variation in hydrological environment
Oxidizing groundwater
Decreasing disposal depth
Figure 4.5.5-1 Geological environment in the uplift/erosion scenario
b. Conceptual model
The evaluation of the influence of each environmental THMCR condition is shown in Table
4.5.5-1.Transport pathway and dose assessment in the radionuclide transport analysis in the biosphere is
shown in Table 4.5.5-2.
Table 4.5.5-1 Assumptions made in conceptual model of uplift/erosion
Environmental
condition Assumptions
Thermal Ground temperature decreases due to decrease in depth.
Hydrology Increase in transmissivity and porosity might be caused by decreasing earth covering.
Range of hydraulic gradient increases due to influence of topography.
Mechanical Rock stress decreases due to decrease in earth covering
Chemical
Mineral composition and rock porosity may change due to weathering.
Pore water chemistry may change from reducing (deep groundwater condition) to
oxidizing due to infiltrating meteoric water.
Radiation
field No significant change
4-205
Table 4.5.5-2 Transport pathway and specification of the biosphere in the uplift/erosion scenario
Transport pathway/
biosphere Specifications
Engineered barriers
If the TRU repository reaches the weathered zone, the corrosion rate of activated
metal, solubility, sorption distribution coefficients and effective diffusion
coefficients are set for oxidizing groundwater conditions.
EDZ Same as for Reference Case.
Host rock
For the weathered zone, it is assumed that groundwater flow velocity is 10 times
higher due to increasing of permeability, porosity and the influence of surface
topography.
The sorption distribution coefficient dataset is for oxidizing groundwater
conditions.
Cataclastic zone Not considered as a transport medium.
Biosphere Same as for Reference Case (river water/plain model (agricultural group)).
c. Evaluation of uplift/erosion
In the open solicitation documents for selection of Preliminary Investigation Areas (PIAs) for the final
disposal of HLW, it is stated that “areas where there is clear evidence of uplift amounting to more than 300
m during the last 100,000 years will be excluded from PIAs” (NUMO, 2002). The same site selection
requirements for HLW are envisaged for the geological disposal of TRU waste i.e., uplift rate is less than 3
mm/y.
The result of the evaluation of uplift/erosion is shown in Figrue 4.5.5-2 for constant uplift/erosion rates of
1 mm/y and 0.1 mm/y over 100,000 years. When the disposal facility reaches the weathered zone (after
900,000 years and 9,000,000 years respectively), the dose increases abruptly. However by this time the key
radionuclides have already reached the biosphere. Maximum dose which is obtained 10,000 years after
disposal is the same in as the Reference Case.
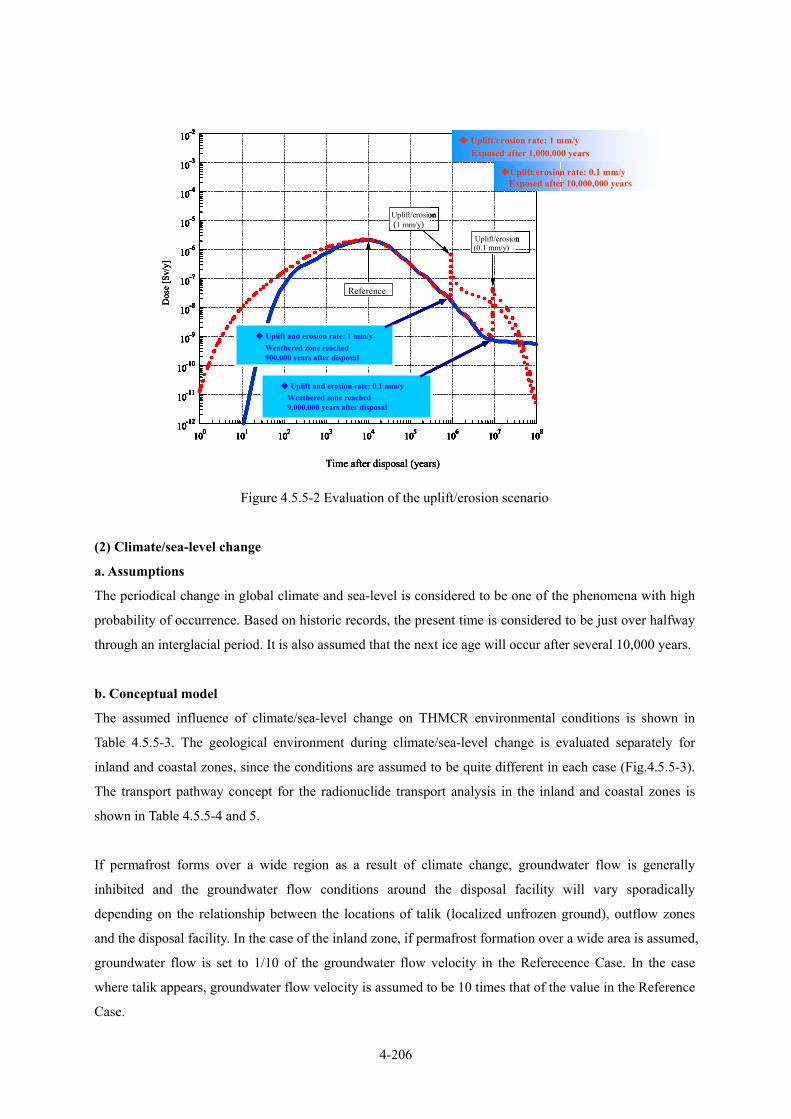
4-206
Figure 4.5.5-2 Evaluation of the uplift/erosion scenario
(2) Climate/sea-level change
a. Assumptions
The periodical change in global climate and sea-level is considered to be one of the phenomena with high
probability of occurrence. Based on historic records, the present time is considered to be just over halfway
through an interglacial period. It is also assumed that the next ice age will occur after several 10,000 years.
b. Conceptual model
The assumed influence of climate/sea-level change on THMCR environmental conditions is shown in
Table 4.5.5-3. The geological environment during climate/sea-level change is evaluated separately for
inland and coastal zones, since the conditions are assumed to be quite different in each case (Fig.4.5.5-3).
The transport pathway concept for the radionuclide transport analysis in the inland and coastal zones is
shown in Table 4.5.5-4 and 5.
If permafrost forms over a wide region as a result of climate change, groundwater flow is generally
inhibited and the groundwater flow conditions around the disposal facility will vary sporadically
depending on the relationship between the locations of talik (localized unfrozen ground), outflow zones
and the disposal facility. In the case of the inland zone, if permafrost formation over a wide area is assumed,
groundwater flow is set to 1/10 of the groundwater flow velocity in the Referecence Case. In the case
where talik appears, groundwater flow velocity is assumed to be 10 times that of the value in the Reference
Case.
10-12
10-11
10-10
10-9
10-8
10-7
10-6
10-5
10-4
10-3
10-2
100 101 102 103 104 105 106 107 108
レファレンス
隆起侵食(0.1mm/y)
隆起侵食(1mm/y)
隆起・侵食速度: 1mm/y90万年で風化帯に遷移
隆起・侵食速度: 0.1mm/y900 万年で風化帯に遷移
隆起・侵食速度 : 1mm/y100 万年で地表に露出
隆起・侵食速度 : 0.1mm/y1,000 万年で地表に露出
10-12
10-11
10-10
10-9
10-8
10-7
10-6
10-5
10-4
10-3
10-2
Dos
e [S
v/y]
100 101 102 103 104 105 106 107 108
Time after disposal (years)
Reference
Uplift/erosion(0.1 mm/y)
Uplift/erosion(1 mm/y)
Uplift and erosion rate: 1 mm/yWeathered zone reached900,000 years after disposal
Uplift and erosion rate: 0.1 mm/yWeathered zone reached 9,000,000 years after disposal
Uplift/erosion rate: 1 mm/y
Uplift/erosion rate: 0.1 mm/yExposed after 10,000,000 years
Exposed after 1,000,000 years
10-12
10-11
10-10
10-9
10-8
10-7
10-6
10-5
10-4
10-3
10-2
100 101 102 103 104 105 106 107 108
レファレンス
隆起侵食(0.1mm/y)
隆起侵食(1mm/y)
10-1210-12
10-1110-11
10-1010-10
10-910-9
10-810-8
10-710-7
10-610-6
10-510-5
10-410-4
10-3
10-2
100
10-3
10-2
100 101101 102102 103103 104104 105 106105 106 107 108107 108
レファレンス
隆起侵食(0.1mm/y)
隆起侵食(1mm/y)
隆起・侵食速度: 1mm/y90万年で風化帯に遷移
隆起・侵食速度: 0.1mm/y900 万年で風化帯に遷移
隆起・侵食速度 : 1mm/y100 万年で地表に露出
隆起・侵食速度 : 0.1mm/y1,000 万年で地表に露出
10-1210-12
10-1110-11
10-1010-10
10-910-9
10-810-8
10-710-7
10-610-6
10-510-5
10-410-4
10-3
10-2
Dos
e [S
v/y]
100 101101 102102 103103 104104 105 106105 106 107 108107 108
Time after disposal (years)
Reference
Uplift/erosion(0.1 mm/y)
Uplift/erosion(1 mm/y)
Uplift and erosion rate: 1 mm/yWeathered zone reached900,000 years after disposal
Uplift and erosion rate: 0.1 mm/yWeathered zone reached 9,000,000 years after disposal
Uplift/erosion rate: 1 mm/y
Uplift/erosion rate: 0.1 mm/yExposed after 10,000,000 years
Exposed after 1,000,000 years
4-207
For the coastal zone case, if the surrounding groundwater environment of the disposal facility changes to
salt water as a result of marine transgression, static groundwater flow is assumed. On the other hand, if it is
assumed that the salt/freshwater boundary exists near the disposal facility due to marine regression, the
groundwater flow condition changes depending on the relationhip between topographic gradient, location
of outflow regions and the disposal facility (Hasegawa et al., 2001; Imamura et al., 2001). During marine
transgression, if the disposal facility is located in a salt water zone, 1/10 of the groundwater flow velocity
in the Reference Case is assumed. If the disposal facility is assumed to be near the salt/freshwater boundary,
5 times the groundwater flow velocity of the Reference Case is assumed.
The conceptual model for the biosphere in the Reference Case is based on the present-day mild climate.
This is modified to model a cool-temperate climate or tundra climate and applied to the inland and coastal
zones. The assumptions made to construct the conceptual model for the inland zone are a radionuclide
release area in a river plain, a cool-temperate climate or tundra climate and a farming exposure group. If
the disposal facility is located in the salt water region or near the salt/freshwater boundary, in the case of a
coastal zone the assumptions made to construct the conceptual model are radionuclide release in a
sedimentary layer, a cool-temperate climate or tundra climate and a marine fishing exposure group. If the
disposal facility exists in a freshwater region due to marine regression, the assumptions made to construct
the conceptual model are radionuclide release in a river water plain, a cool-temperate climate or tundra
climate and a farming exposure group.The dose conversion factors used in the biosphere models are shown
in Table 4.5.5-6.
It should be noted that rather short climate/sea-level change periodicity values are reported elsewhere
(Dansgaard-Oeschger cycle, Dansgaard et al., 1993). Therefore, periodicity is not modeled continuously in
this assessment, but rather as multiple snapshots of representative conditions of climate/sea-level change.

4-208
Table 4.5.5-3 Assumptions made in the conceptual model of climate/sea-level change
Environment
condition Assumptions
Thermal Surface temperature changes
Hydraulic
A decrease in rainwater recharge and water table is assumed in the case of permafrost
formation. Moreover, if permafrost forms over a wide area, groundwater flow is generally
limited and periodically changes depending on the locations of talik, outflow regions and
the disposal facility. If the salt/freshwater boundary migrates close to the disposal facility in
the coastal zone, groundwater flow with a large variation is assumed. Also if the
topographic gradient changes due to marine erosion, a variation in hydraulic gradient is
assumed.
Mechanical If permafrost forms on the surface, the stress condition around disposal facility may change.
Chemical If the salt/freshwater boundary migrates close to the disposal facility in the coastal zone, the
pore water periodically varies between salt and freshwater.
Radiation
field No significant variation.
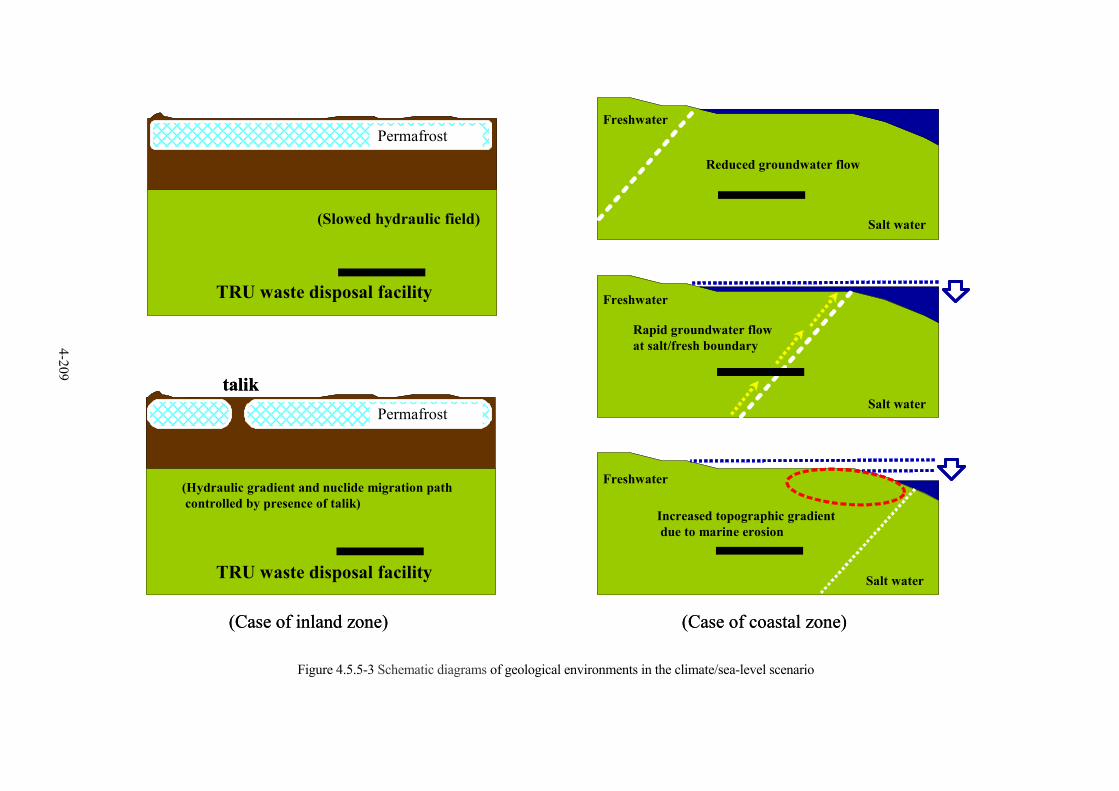
4-209
TRU waste disposal facility
凍土
talik
(Slowed hydraulic field)
凍土凍土Freshwater
Freshwater
Freshwater
Salt water
Salt water
Salt water
Reduced groundwater flow
Rapid groundwater flowat salt/fresh boundary
(Hydraulic gradient and nuclide migration pathcontrolled by presence of talik)
TRU waste disposal facility
Permafrost
Increased topographic gradientdue to marine erosion
Permafrost
(Case of inland zone) (Case of coastal zone)
TRU waste disposal facility
凍土
talik
(Slowed hydraulic field)
凍土凍土Freshwater
Freshwater
Freshwater
Salt water
Salt water
Salt water
Reduced groundwater flow
Rapid groundwater flowat salt/fresh boundary
(Hydraulic gradient and nuclide migration pathcontrolled by presence of talik)
TRU waste disposal facility
Permafrost
Increased topographic gradientdue to marine erosion
Permafrost
(Case of inland zone) (Case of coastal zone)
Figure 4.5.5-3 Schematic diagrams of geological environments in the climate/sea-level scenario
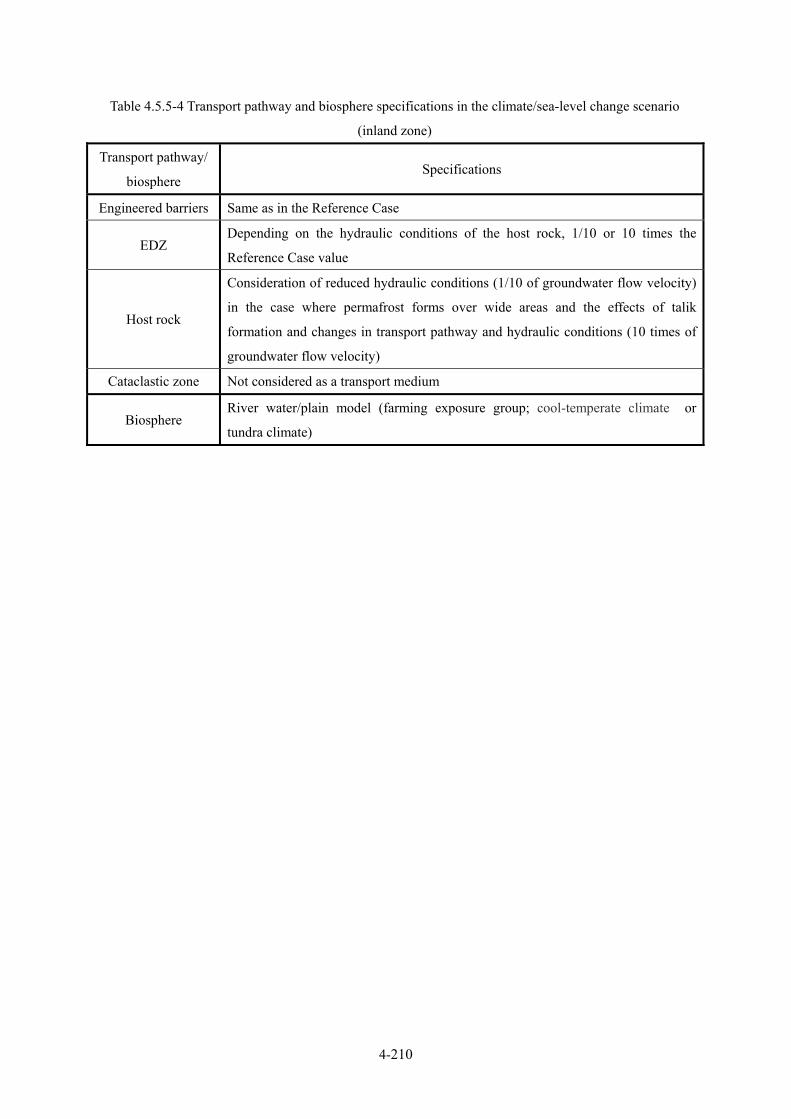
4-210
Table 4.5.5-4 Transport pathway and biosphere specifications in the climate/sea-level change scenario
(inland zone)
Transport pathway/
biosphere Specifications
Engineered barriers Same as in the Reference Case
EDZ Depending on the hydraulic conditions of the host rock, 1/10 or 10 times the
Reference Case value
Host rock
Consideration of reduced hydraulic conditions (1/10 of groundwater flow velocity)
in the case where permafrost forms over wide areas and the effects of talik
formation and changes in transport pathway and hydraulic conditions (10 times of
groundwater flow velocity)
Cataclastic zone Not considered as a transport medium
Biosphere River water/plain model (farming exposure group; cool-temperate climate or
tundra climate)

4-211
Table 4.5.5-5 Transport pathway and biosphere specifications in the climate/sea-level change scenario
(coastal zone)
Pathway
specification/
biosphere
Specifications
Engineered barriers
In the case where the disposal facility is located in a salt water region, the corrosion
rate of activated metal, solubility, sorption distribution coefficient, effective
diffusion coefficient and transmissivity of the buffer material are set for SRHP-type
groundwater conditions.
EDZ Depending on the hydraulic condition of host rock, 1/10, 5 and 10 times the value
in the Reference Case
Host rock
If the disposal facility is in a freshwater region, groundwater flow velocity is 5
times the Reference Case value due to increase in topographic gradient through
marine erosion. If the disposal facility is close to the salt/freshwater boundary, the
groundwater flow velocity is increased by a factor of 10. If the disposal facility is
located in a salt water region, groundwater flow velocity is 1/10 or less compared
to the Reference Case value or static. If the disposal facility is located in a salt
water region, sorption distribution coefficients are used and SRHP-type
groundwater data are assumed.
Cataclastic zone Not considered as a transport medium
Biosphere
In the case where the disposal facility is in a salt water region near the
salt/freshwater boundary, a coastal zone sedimentary layer/plain model (marine
fishing group) is assumed. In the case of a freshwater region, river water/plain
model (farming group) is assumed. Cool-temperate and tundra climates are
considered in each case.
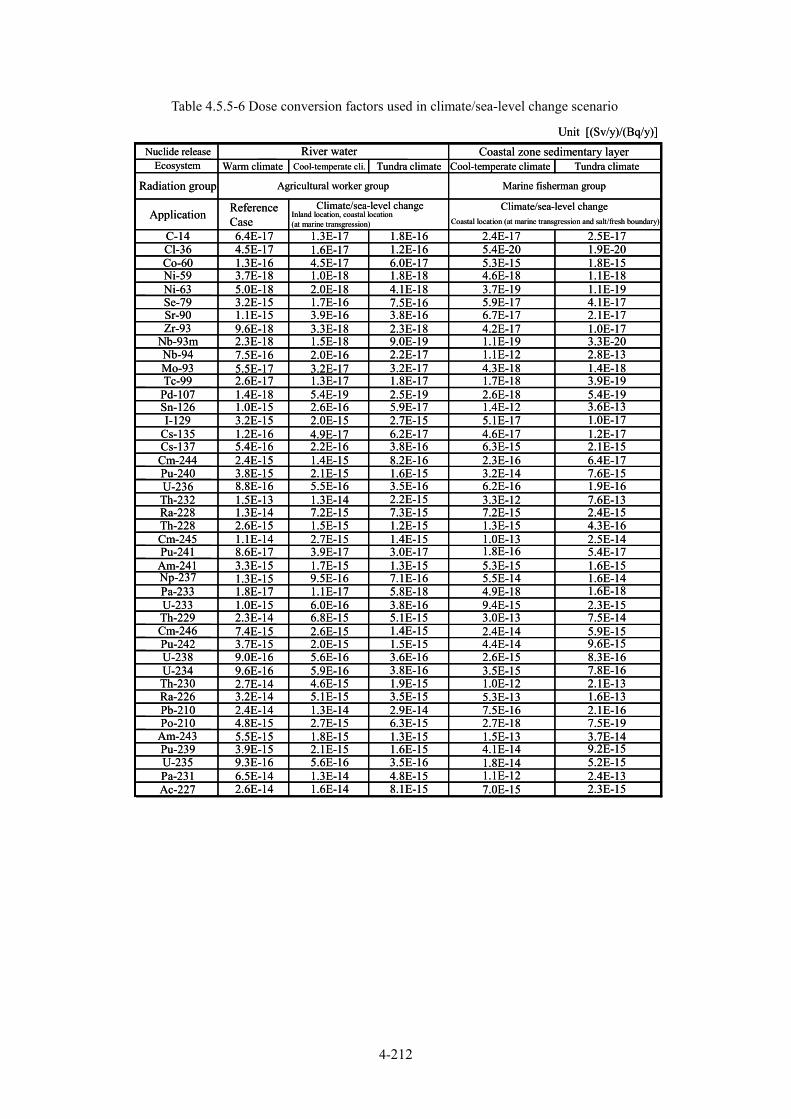
4-212
Table 4.5.5-6 Dose conversion factors used in climate/sea-level change scenario
Unit [(Sv/y)/(Bq/y)]Nuclide release River water
Ecosystem Warm climate Cool-temperate cli. Tundra climate Cool-temperate climate Tundra climate
Radiation group Agricultural worker group Marine fisherman group
Application ReferenceCase
Climate/sea-level changeInland location, coastal location(at marine transgression)
Climate/sea-level changeCoastal location (at marine transgression and salt/fresh boundary)
C-14 6.4E-17 1.3E-17 1.8E-16 2.4E-17 2.5E-17Cl-36 4.5E-17 1.6E-17 1.2E-16 5.4E-20 1.9E-20Co-60 1.3E-16 4.5E-17 6.0E-17 5.3E-15 1.8E-15Ni-59 3.7E-18 1.0E-18 1.8E-18 4.6E-18 1.1E-18Ni-63 5.0E-18 2.0E-18 4.1E-18 3.7E-19 1.1E-19Se-79 3.2E-15 1.7E-16 7.5E-16 5.9E-17 4.1E-17Sr-90 1.1E-15 3.9E-16 3.8E-16 6.7E-17 2.1E-17Zr-93 9.6E-18 3.3E-18 2.3E-18 4.2E-17 1.0E-17
Nb-93m 2.3E-18 1.5E-18 9.0E-19 1.1E-19 3.3E-20Nb-94 7.5E-16 2.0E-16 2.2E-17 1.1E-12 2.8E-13Mo-93 5.5E-17 3.2E-17 3.2E-17 4.3E-18 1.4E-18Tc-99 2.6E-17 1.3E-17 1.8E-17 1.7E-18 3.9E-19
Pd-107 1.4E-18 5.4E-19 2.5E-19 2.6E-18 5.4E-19Sn-126 1.0E-15 2.6E-16 5.9E-17 1.4E-12 3.6E-13I-129 3.2E-15 2.0E-15 2.7E-15 5.1E-17 1.0E-17
Cs-135 1.2E-16 4.9E-17 6.2E-17 4.6E-17 1.2E-17Cs-137 5.4E-16 2.2E-16 3.8E-16 6.3E-15 2.1E-15Cm-244 2.4E-15 1.4E-15 8.2E-16 2.3E-16 6.4E-17Pu-240 3.8E-15 2.1E-15 1.6E-15 3.2E-14 7.6E-15U-236 8.8E-16 5.5E-16 3.5E-16 6.2E-16 1.9E-16Th-232 1.5E-13 1.3E-14 2.2E-15 3.3E-12 7.6E-13Ra-228 1.3E-14 7.2E-15 7.3E-15 7.2E-15 2.4E-15Th-228 2.6E-15 1.5E-15 1.2E-15 1.3E-15 4.3E-16Cm-245 1.1E-14 2.7E-15 1.4E-15 1.0E-13 2.5E-14Pu-241 8.6E-17 3.9E-17 3.0E-17 1.8E-16 5.4E-17Am-241 3.3E-15 1.7E-15 1.3E-15 5.3E-15 1.6E-15Np-237 1.3E-15 9.5E-16 7.1E-16 5.5E-14 1.6E-14Pa-233 1.8E-17 1.1E-17 5.8E-18 4.9E-18 1.6E-18U-233 1.0E-15 6.0E-16 3.8E-16 9.4E-15 2.3E-15Th-229 2.3E-14 6.8E-15 5.1E-15 3.0E-13 7.5E-14Cm-246 7.4E-15 2.6E-15 1.4E-15 2.4E-14 5.9E-15Pu-242 3.7E-15 2.0E-15 1.5E-15 4.4E-14 9.6E-15U-238 9.0E-16 5.6E-16 3.6E-16 2.6E-15 8.3E-16U-234 9.6E-16 5.9E-16 3.8E-16 3.5E-15 7.8E-16Th-230 2.7E-14 4.6E-15 1.9E-15 1.0E-12 2.1E-13Ra-226 3.2E-14 5.1E-15 3.5E-15 5.3E-13 1.6E-13Pb-210 2.4E-14 1.3E-14 2.9E-14 7.5E-16 2.1E-16Po-210 4.8E-15 2.7E-15 6.3E-15 2.7E-18 7.5E-19
Am-243 5.5E-15 1.8E-15 1.3E-15 1.5E-13 3.7E-14Pu-239 3.9E-15 2.1E-15 1.6E-15 4.1E-14 9.2E-15U-235 9.3E-16 5.6E-16 3.5E-16 1.8E-14 5.2E-15Pa-231 6.5E-14 1.3E-14 4.8E-15 1.1E-12 2.4E-13Ac-227 2.6E-14 1.6E-14 8.1E-15 7.0E-15 2.3E-15
Coastal zone sedimentary layer
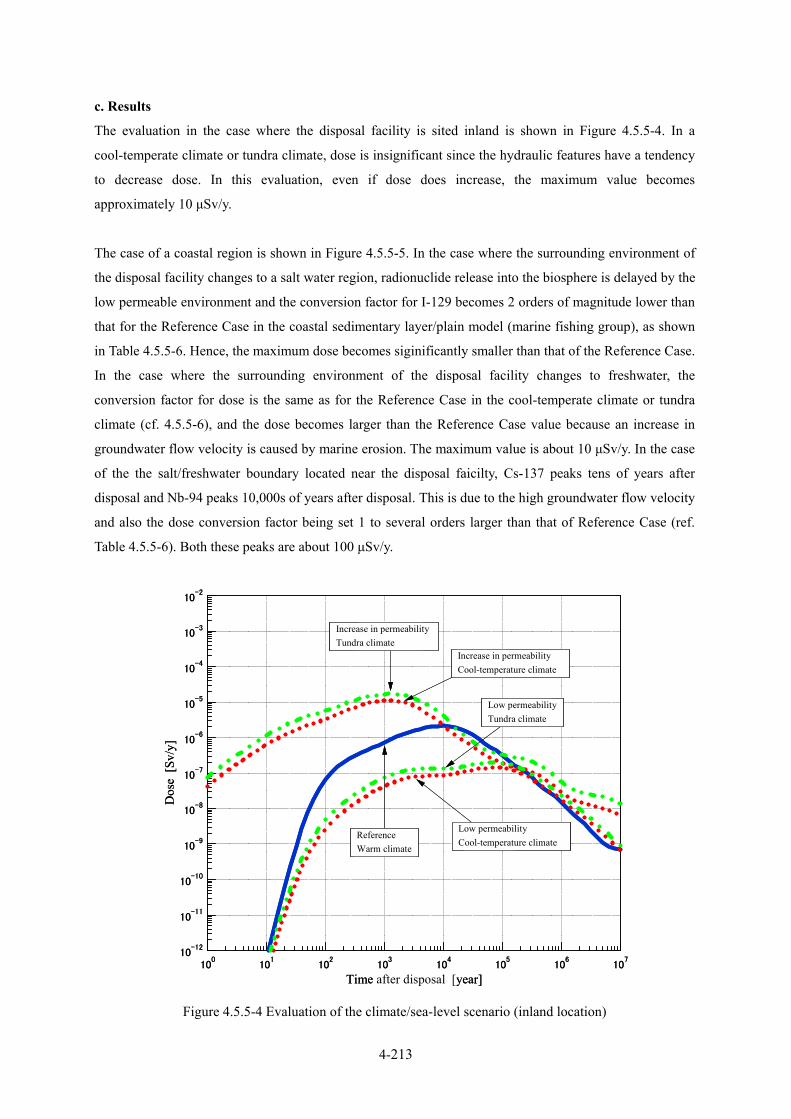
4-213
c. Results
The evaluation in the case where the disposal facility is sited inland is shown in Figure 4.5.5-4. In a
cool-temperate climate or tundra climate, dose is insignificant since the hydraulic features have a tendency
to decrease dose. In this evaluation, even if dose does increase, the maximum value becomes
approximately 10 µSv/y.
The case of a coastal region is shown in Figure 4.5.5-5. In the case where the surrounding environment of
the disposal facility changes to a salt water region, radionuclide release into the biosphere is delayed by the
low permeable environment and the conversion factor for I-129 becomes 2 orders of magnitude lower than
that for the Reference Case in the coastal sedimentary layer/plain model (marine fishing group), as shown
in Table 4.5.5-6. Hence, the maximum dose becomes siginificantly smaller than that of the Reference Case.
In the case where the surrounding environment of the disposal facility changes to freshwater, the
conversion factor for dose is the same as for the Reference Case in the cool-temperate climate or tundra
climate (cf. 4.5.5-6), and the dose becomes larger than the Reference Case value because an increase in
groundwater flow velocity is caused by marine erosion. The maximum value is about 10 µSv/y. In the case
of the the salt/freshwater boundary located near the disposal faicilty, Cs-137 peaks tens of years after
disposal and Nb-94 peaks 10,000s of years after disposal. This is due to the high groundwater flow velocity
and also the dose conversion factor being set 1 to several orders larger than that of Reference Case (ref.
Table 4.5.5-6). Both these peaks are about 100 µSv/y.
10-12
10-11
10-10
10-9
10-8
10-7
10-6
10-5
10-4
10-3
10-2
線量[Sv/y]
100
101
102
103
104
105
106
107
経過時間[年]
レファレンス温暖気候
水理増大冷帯気候
水理増大ツンドラ気候
水理抑制冷帯気候
水理抑制ツンドラ気候
Time after disposal [year]
Dos
e [S
v/y]
Increase in permeabilityTundra climate
Increase in permeabilityCool-temperature climate
Low permeabilityTundra climate
Low permeabilityCool-temperature climate
ReferenceWarm climate
Figure 4.5.5-4 Evaluation of the climate/sea-level scenario (inland location)
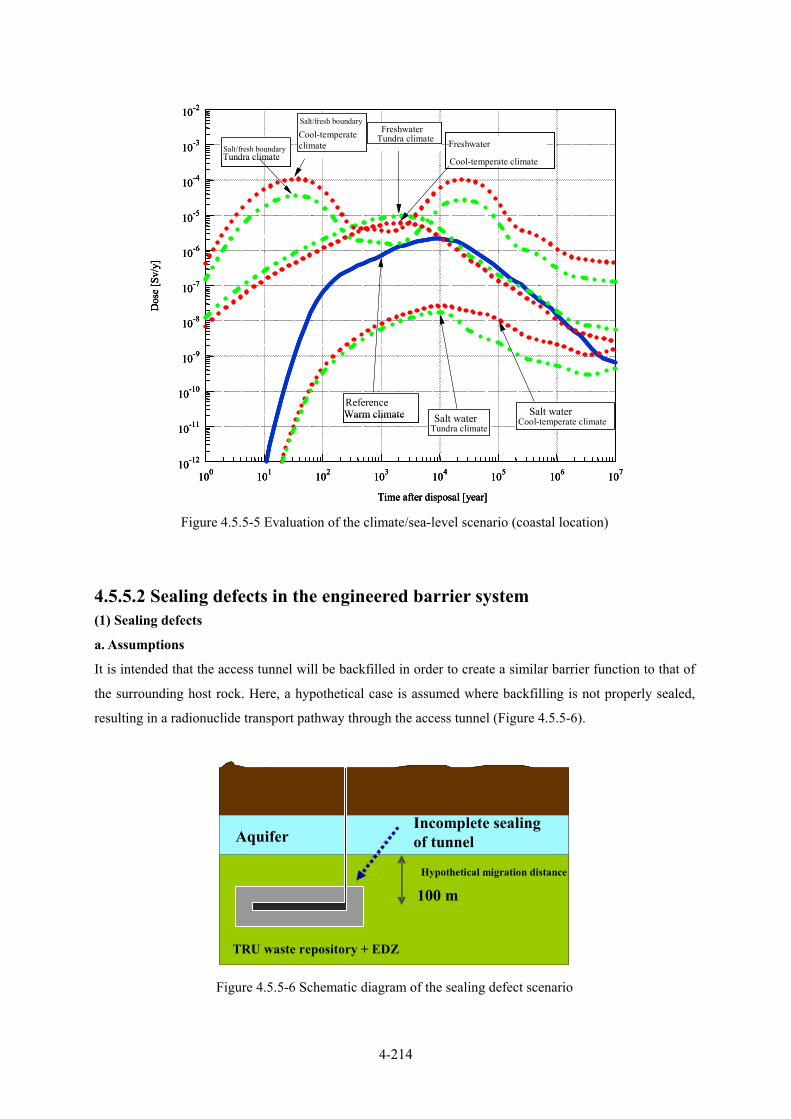
4-214
10-12
10-11
10-10
10-9
10-8
10-7
10-6
10-5
10-4
10-3
10-2
Dos
e [S
v/y]
100 101 102 103 104 105 106 107
Time after disposal [year]
Reference Warm climate
Freshwater
Cool-temperate climate
FreshwaterTundra climate
Salt/fresh boundary
Cool-temperateclimateSalt/fresh boundary
Tundra climate
Salt waterCool-temperate climateSalt water
Tundra climate
10-1210-12
10-1110-11
10-1010-10
10-910-9
10-810-8
10-710-7
10-610-6
10-510-5
10-410-4
10-3
10-2
Dos
e [S
v/y]
100
10-3
10-2
Dos
e [S
v/y]
100 101101 102102 103103 104104 105 106105 106 107
Time after disposal [year]
107
Time after disposal [year]
Reference Warm climate
Freshwater
Cool-temperate climate
FreshwaterTundra climate
Salt/fresh boundary
Cool-temperateclimateSalt/fresh boundary
Tundra climate
Salt waterCool-temperate climateSalt water
Tundra climate
Figure 4.5.5-5 Evaluation of the climate/sea-level scenario (coastal location)
4.5.5.2 Sealing defects in the engineered barrier system (1) Sealing defects
a. Assumptions
It is intended that the access tunnel will be backfilled in order to create a similar barrier function to that of
the surrounding host rock. Here, a hypothetical case is assumed where backfilling is not properly sealed,
resulting in a radionuclide transport pathway through the access tunnel (Figure 4.5.5-6).
Aquifer
Hypothetical migration distance
100 m
Incomplete sealing of tunnel
TRU waste repository + EDZ
Aquifer
Hypothetical migration distance
100 m
Incomplete sealing of tunnel
TRU waste repository + EDZ
Figure 4.5.5-6 Schematic diagram of the sealing defect scenario

4-215
b. Conceptual model
The model concept is summarised in Table 4.5.5-7.
Table 4.5.5-7 Transport pathway and biosphere conceptualization in the sealing defect scenario
Transport
pathway/biosphere Specification
Engineered barriers Same as in Reference Case
EDZ Increase in EDZ flow due to incomplete sealing (10 times)
Host rock Access tunnel is a transport pathway; assumed that groundwater flow velocity is 10
times higher than that of the host rock.
Cataclastic zone Not considered as a transport medium.
Biosphere Same as in Reference Case. (river water/plain model (farming group))
c. Results
The dose calculations are shown in Figure 4.5.5-7. There are several types of disposal tunnel in a TRU
waste repository, depending on the type of waste and shape of package. It is difficult to envisage that a
sealing defect will occur in all disposal tunnels at the same time, hence one tunnel is considered here. The
effect on increasing dose depends on which tunnel has the sealing fault. The influence of a sealing fault in
a disposal tunnel for Group 1 is most significant to exceed 10µSv/y. On the other hand, a fault in a disposal
tunnel for Group 4 waste would have higher dose compared to the Reference Case, but it does not exceed
1µSv/y.
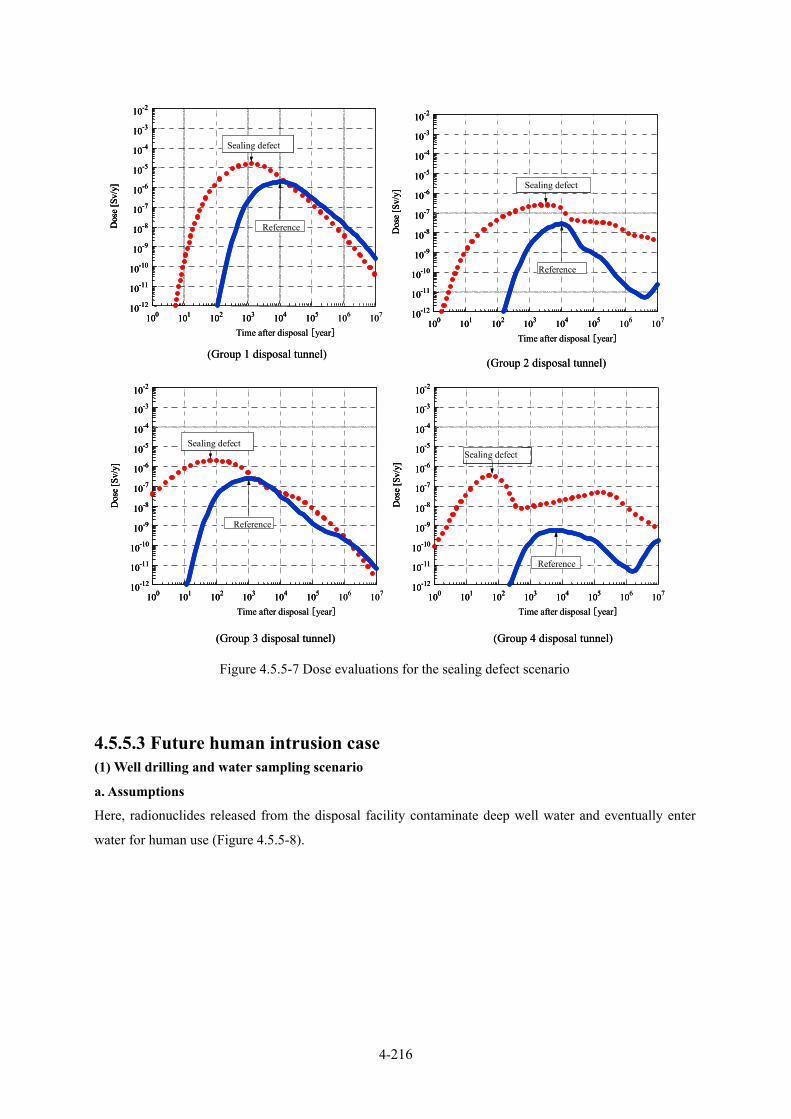
4-216
10-12
10-11
10-10
10-9
10-8
10-7
10-6
10-5
10-4
10-3
10-2D
ose
[Sv/
y]
100 101 102 103 104 105 106 107
Time after disposal [year]
Sealing defect
Reference
10-12
10-11
10-10
10-9
10-8
10-7
10-6
10-5
10-4
10-3
10-2
Dos
e [S
v/y]
100 101 102 103 104 105 106 107
Time after disposal [year]
Sealing defect
Reference
10-12
10-11
10-10
10-9
10-8
10-7
10-6
10-5
10-4
10-3
10-2D
ose
[Sv/
y]
100 101 102 103 104 105 106 107
Time after disposal [year]
Sealing defect
Reference
10-12
10-11
10-10
10-9
10-8
10-7
10-6
10-5
10-4
10-3
10-2
Dos
e [S
v/y]
100 101 102 103 104 105 106 107
Time after disposal [year]
Sealing defect
Reference
(Group 1 disposal tunnel)(Group 2 disposal tunnel)
(Group 3 disposal tunnel) (Group 4 disposal tunnel)
10-1210-12
10-1110-11
10-1010-10
10-910-9
10-810-8
10-710-7
10-610-6
10-510-5
10-410-4
10-3
10-2D
ose
[Sv/
y]
100
10-3
10-2D
ose
[Sv/
y]
100 101101 102102 103103 104104 105105 106 107
Time after disposal [year]
Sealing defect
Reference
10-1210-12
10-1110-11
10-1010-10
10-910-9
10-810-8
10-710-7
10-610-6
10-510-5
10-410-4
10-3
10-2
Dos
e [S
v/y]
100
10-3
10-2
Dos
e [S
v/y]
100 101101 102102 103103 104104 105105 106 107
Time after disposal [year]
Sealing defect
Reference
10-1210-12
10-1110-11
10-1010-10
10-910-9
10-810-8
10-710-7
10-610-6
10-510-5
10-410-4
10-3
10-2D
ose
[Sv/
y]
100
10-3
10-2D
ose
[Sv/
y]
100 101101 102102 103103 104104 105105 106 107
Time after disposal [year]
Sealing defect
Reference
10-1210-12
10-1110-11
10-1010-10
10-910-9
10-810-8
10-710-7
10-610-6
10-510-5
10-410-4
10-3
10-2
Dos
e [S
v/y]
100
10-3
10-2
Dos
e [S
v/y]
100 101101 102102 103103 104104 105105 106 107
Time after disposal [year]
Sealing defect
Reference
(Group 1 disposal tunnel)(Group 2 disposal tunnel)
(Group 3 disposal tunnel) (Group 4 disposal tunnel)
Figure 4.5.5-7 Dose evaluations for the sealing defect scenario
4.5.5.3 Future human intrusion case (1) Well drilling and water sampling scenario
a. Assumptions
Here, radionuclides released from the disposal facility contaminate deep well water and eventually enter
water for human use (Figure 4.5.5-8).
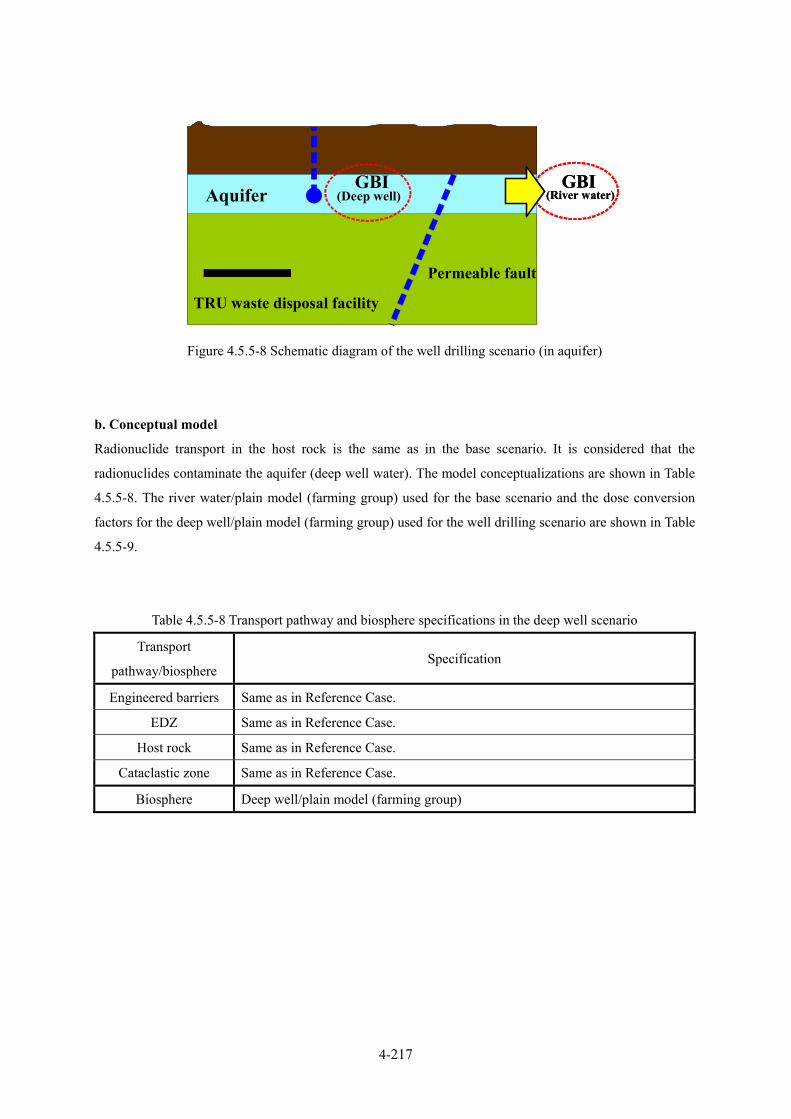
4-217
Figure 4.5.5-8 Schematic diagram of the well drilling scenario (in aquifer)
b. Conceptual model
Radionuclide transport in the host rock is the same as in the base scenario. It is considered that the
radionuclides contaminate the aquifer (deep well water). The model conceptualizations are shown in Table
4.5.5-8. The river water/plain model (farming group) used for the base scenario and the dose conversion
factors for the deep well/plain model (farming group) used for the well drilling scenario are shown in Table
4.5.5-9.
Table 4.5.5-8 Transport pathway and biosphere specifications in the deep well scenario
Transport
pathway/biosphere Specification
Engineered barriers Same as in Reference Case.
EDZ Same as in Reference Case.
Host rock Same as in Reference Case.
Cataclastic zone Same as in Reference Case.
Biosphere Deep well/plain model (farming group)
GBI(River water)Aquifer
TRU waste disposal facility
Permeable fault
GBI(Deep well)
GBI(River water)Aquifer
TRU waste disposal facility
Permeable fault
GBI(Deep well)
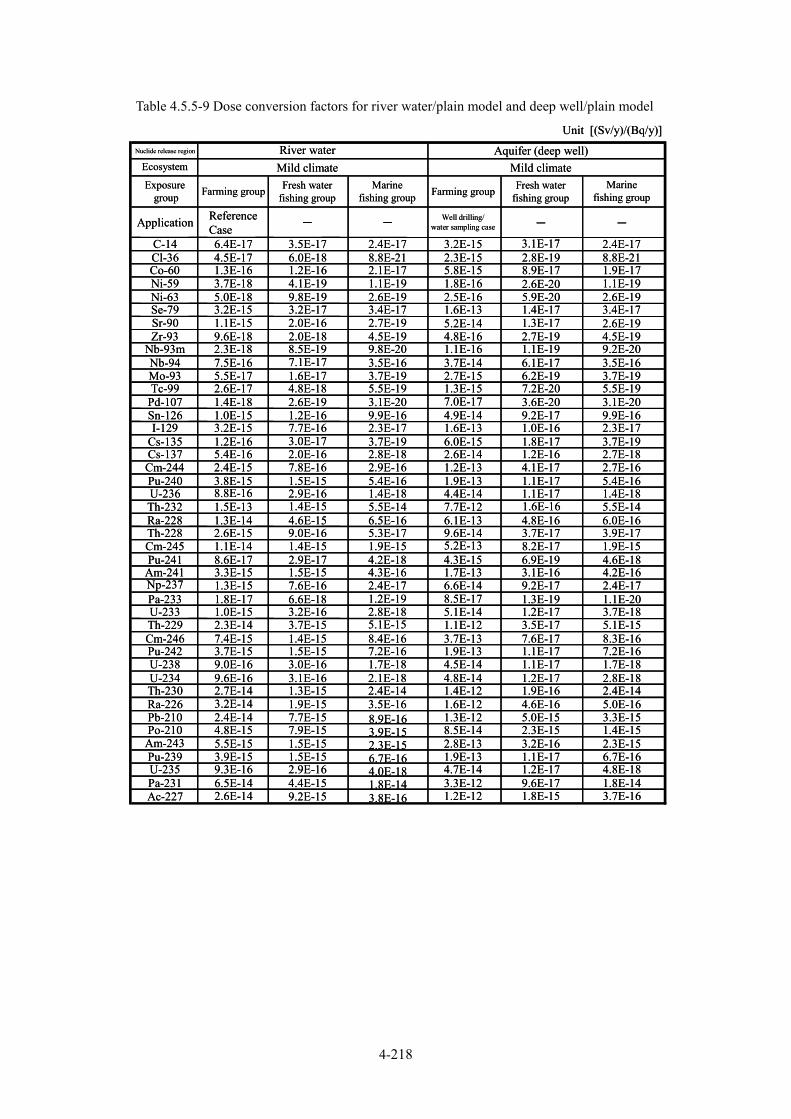
4-218
Table 4.5.5-9 Dose conversion factors for river water/plain model and deep well/plain model
Unit [(Sv/y)/(Bq/y)]Nuclide release region River water
Ecosystem Mild climate Mild climateExposure
group Farming group
Application ReferenceCase - -
Well drilling/water sampling case - -
C-14 6.4E-17 3.5E-17 2.4E-17 3.2E-15 3.1E-17 2.4E-17Cl-36 4.5E-17 6.0E-18 8.8E-21 2.3E-15 2.8E-19 8.8E-21Co-60 1.3E-16 1.2E-16 2.1E-17 5.8E-15 8.9E-17 1.9E-17Ni-59 3.7E-18 4.1E-19 1.1E-19 1.8E-16 2.6E-20 1.1E-19Ni-63 5.0E-18 9.8E-19 2.6E-19 2.5E-16 5.9E-20 2.6E-19Se-79 3.2E-15 3.2E-17 3.4E-17 1.6E-13 1.4E-17 3.4E-17Sr-90 1.1E-15 2.0E-16 2.7E-19 5.2E-14 1.3E-17 2.6E-19Zr-93 9.6E-18 2.0E-18 4.5E-19 4.8E-16 2.7E-19 4.5E-19
Nb-93m 2.3E-18 8.5E-19 9.8E-20 1.1E-16 1.1E-19 9.2E-20Nb-94 7.5E-16 7.1E-17 3.5E-16 3.7E-14 6.1E-17 3.5E-16Mo-93 5.5E-17 1.6E-17 3.7E-19 2.7E-15 6.2E-19 3.7E-19Tc-99 2.6E-17 4.8E-18 5.5E-19 1.3E-15 7.2E-20 5.5E-19
Pd-107 1.4E-18 2.6E-19 3.1E-20 7.0E-17 3.6E-20 3.1E-20Sn-126 1.0E-15 1.2E-16 9.9E-16 4.9E-14 9.2E-17 9.9E-16I-129 3.2E-15 7.7E-16 2.3E-17 1.6E-13 1.0E-16 2.3E-17
Cs-135 1.2E-16 3.0E-17 3.7E-19 6.0E-15 1.8E-17 3.7E-19Cs-137 5.4E-16 2.0E-16 2.8E-18 2.6E-14 1.2E-16 2.7E-18Cm-244 2.4E-15 7.8E-16 2.9E-16 1.2E-13 4.1E-17 2.7E-16Pu-240 3.8E-15 1.5E-15 5.4E-16 1.9E-13 1.1E-17 5.4E-16U-236 8.8E-16 2.9E-16 1.4E-18 4.4E-14 1.1E-17 1.4E-18Th-232 1.5E-13 1.4E-15 5.5E-14 7.7E-12 1.6E-16 5.5E-14Ra-228 1.3E-14 4.6E-15 6.5E-16 6.1E-13 4.8E-16 6.0E-16Th-228 2.6E-15 9.0E-16 5.3E-17 9.6E-14 3.7E-17 3.9E-17Cm-245 1.1E-14 1.4E-15 1.9E-15 5.2E-13 8.2E-17 1.9E-15Pu-241 8.6E-17 2.9E-17 4.2E-18 4.3E-15 6.9E-19 4.6E-18
Am-241 3.3E-15 1.5E-15 4.3E-16 1.7E-13 3.1E-16 4.2E-16Np-237 1.3E-15 7.6E-16 2.4E-17 6.6E-14 9.2E-17 2.4E-17Pa-233 1.8E-17 6.6E-18 1.2E-19 8.5E-17 1.3E-19 1.1E-20U-233 1.0E-15 3.2E-16 2.8E-18 5.1E-14 1.2E-17 3.7E-18Th-229 2.3E-14 3.7E-15 5.1E-15 1.1E-12 3.5E-17 5.1E-15Cm-246 7.4E-15 1.4E-15 8.4E-16 3.7E-13 7.6E-17 8.3E-16Pu-242 3.7E-15 1.5E-15 7.2E-16 1.9E-13 1.1E-17 7.2E-16U-238 9.0E-16 3.0E-16 1.7E-18 4.5E-14 1.1E-17 1.7E-18U-234 9.6E-16 3.1E-16 2.1E-18 4.8E-14 1.2E-17 2.8E-18Th-230 2.7E-14 1.3E-15 2.4E-14 1.4E-12 1.9E-16 2.4E-14Ra-226 3.2E-14 1.9E-15 3.5E-16 1.6E-12 4.6E-16 5.0E-16Pb-210 2.4E-14 7.7E-15 8.9E-16 1.3E-12 5.0E-15 3.3E-15Po-210 4.8E-15 7.9E-15 3.9E-15 8.5E-14 2.3E-15 1.4E-15Am-243 5.5E-15 1.5E-15 2.3E-15 2.8E-13 3.2E-16 2.3E-15Pu-239 3.9E-15 1.5E-15 6.7E-16 1.9E-13 1.1E-17 6.7E-16U-235 9.3E-16 2.9E-16 4.0E-18 4.7E-14 1.2E-17 4.8E-18Pa-231 6.5E-14 4.4E-15 1.8E-14 3.3E-12 9.6E-17 1.8E-14Ac-227 2.6E-14 9.2E-15 3.8E-16 1.2E-12 1.8E-15 3.7E-16
Aquifer (deep well)
Farming group Fresh water fishing group
Marine fishing group
Fresh water fishing group
Marine fishing group
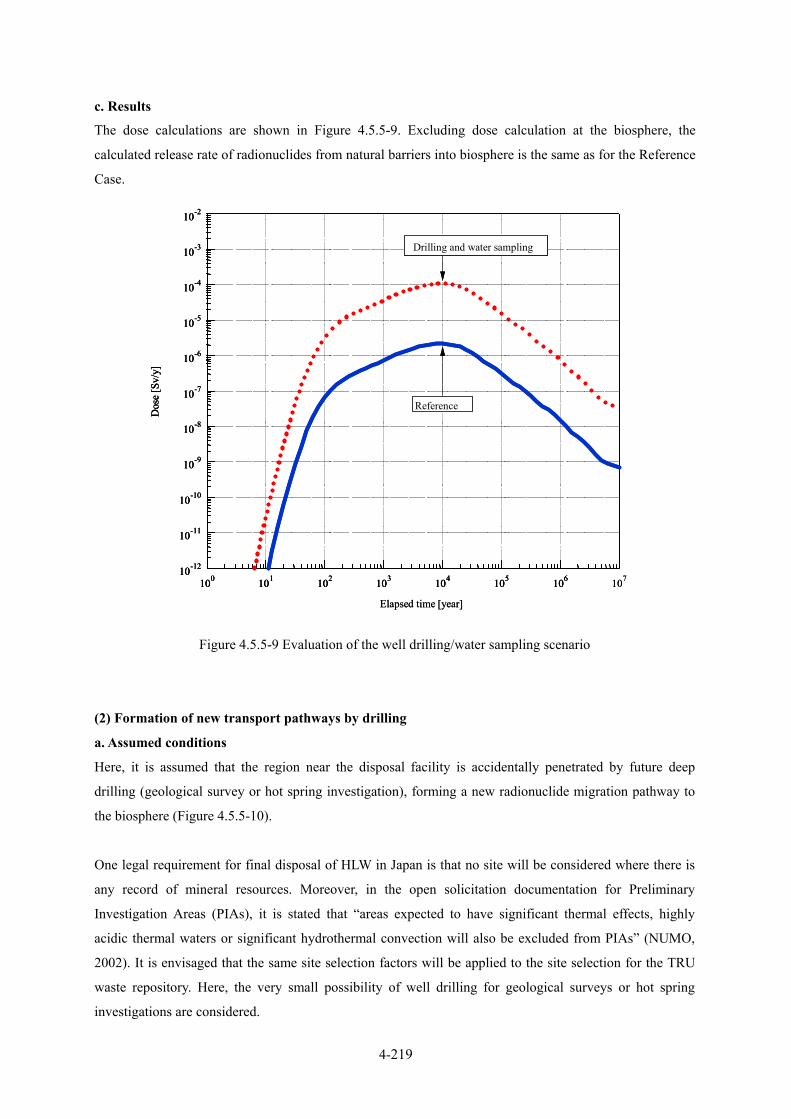
4-219
c. Results
The dose calculations are shown in Figure 4.5.5-9. Excluding dose calculation at the biosphere, the
calculated release rate of radionuclides from natural barriers into biosphere is the same as for the Reference
Case.
Figure 4.5.5-9 Evaluation of the well drilling/water sampling scenario
(2) Formation of new transport pathways by drilling
a. Assumed conditions
Here, it is assumed that the region near the disposal facility is accidentally penetrated by future deep
drilling (geological survey or hot spring investigation), forming a new radionuclide migration pathway to
the biosphere (Figure 4.5.5-10).
One legal requirement for final disposal of HLW in Japan is that no site will be considered where there is
any record of mineral resources. Moreover, in the open solicitation documentation for Preliminary
Investigation Areas (PIAs), it is stated that “areas expected to have significant thermal effects, highly
acidic thermal waters or significant hydrothermal convection will also be excluded from PIAs” (NUMO,
2002). It is envisaged that the same site selection factors will be applied to the site selection for the TRU
waste repository. Here, the very small possibility of well drilling for geological surveys or hot spring
investigations are considered.
10-12
10-11
10-10
10-9
10-8
10-7
10-6
10-5
10-4
10-3
10-2
Dos
e [S
v/y]
100 101 102 103 104 105 106 107
Elapsed time [year]
Reference
Drilling and water sampling
10-1210-12
10-1110-11
10-1010-10
10-910-9
10-810-8
10-710-7
10-610-6
10-510-5
10-410-4
10-3
10-2
Dos
e [S
v/y]
100
10-3
10-2
Dos
e [S
v/y]
100 101101 102102 103103 104104 105 106105 106 107
Elapsed time [year]
Reference
Drilling and water sampling
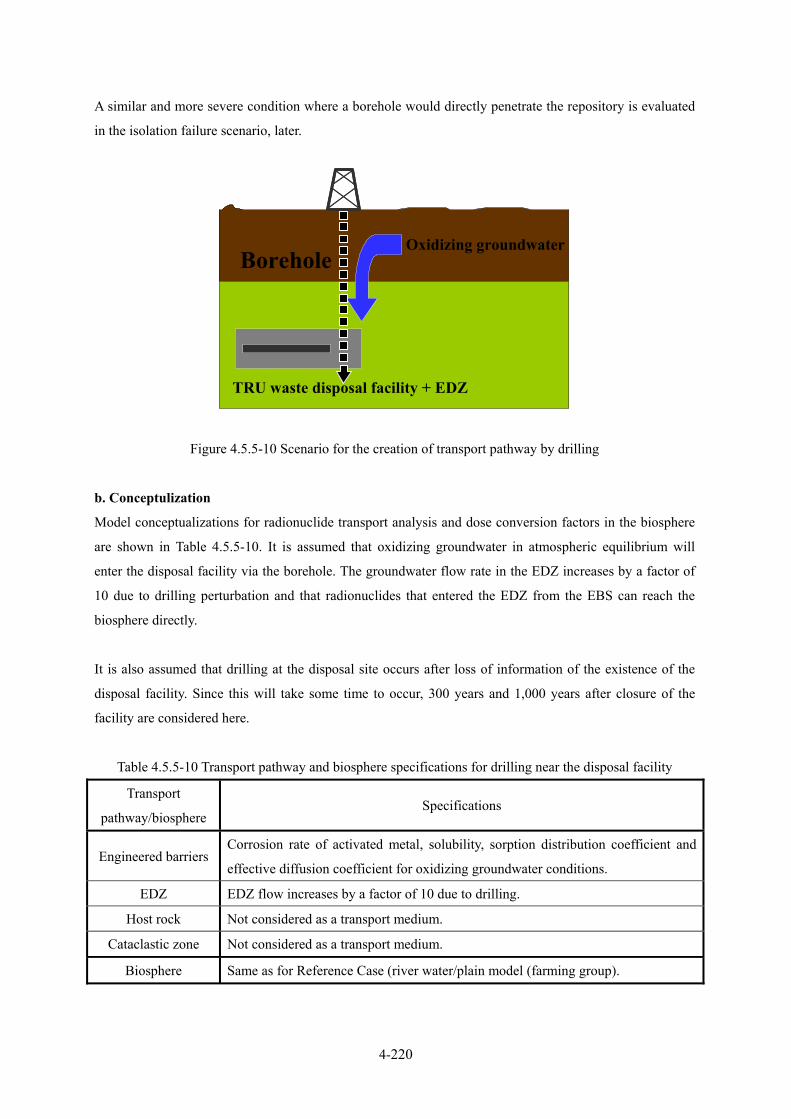
4-220
A similar and more severe condition where a borehole would directly penetrate the repository is evaluated
in the isolation failure scenario, later.
Oxidizing groundwaterBorehole
TRU waste disposal facility + EDZ
Oxidizing groundwaterBorehole
TRU waste disposal facility + EDZ
Figure 4.5.5-10 Scenario for the creation of transport pathway by drilling
b. Conceptulization
Model conceptualizations for radionuclide transport analysis and dose conversion factors in the biosphere
are shown in Table 4.5.5-10. It is assumed that oxidizing groundwater in atmospheric equilibrium will
enter the disposal facility via the borehole. The groundwater flow rate in the EDZ increases by a factor of
10 due to drilling perturbation and that radionuclides that entered the EDZ from the EBS can reach the
biosphere directly.
It is also assumed that drilling at the disposal site occurs after loss of information of the existence of the
disposal facility. Since this will take some time to occur, 300 years and 1,000 years after closure of the
facility are considered here.
Table 4.5.5-10 Transport pathway and biosphere specifications for drilling near the disposal facility
Transport
pathway/biosphere Specifications
Engineered barriers Corrosion rate of activated metal, solubility, sorption distribution coefficient and
effective diffusion coefficient for oxidizing groundwater conditions.
EDZ EDZ flow increases by a factor of 10 due to drilling.
Host rock Not considered as a transport medium.
Cataclastic zone Not considered as a transport medium.
Biosphere Same as for Reference Case (river water/plain model (farming group).

4-221
c. Results
The dose calculations are shown in Figure 4.5.5-11.
As in the in the sealing defect scenario, the dose depends on the type of disposal tunnel affected by drilling.
However, the effect on dose is much higher than for the sealing defect scenario.
In this drilling scenario, since the performance of the natural barrier which contributes to retarding I-129 is
not considered, the dose from Group 1 is increased to about 100 µSv/y. Moreover, actinides which are
insignificant in the base scenario contribute significantly to dose in Group 4 since there is no buffer
material.
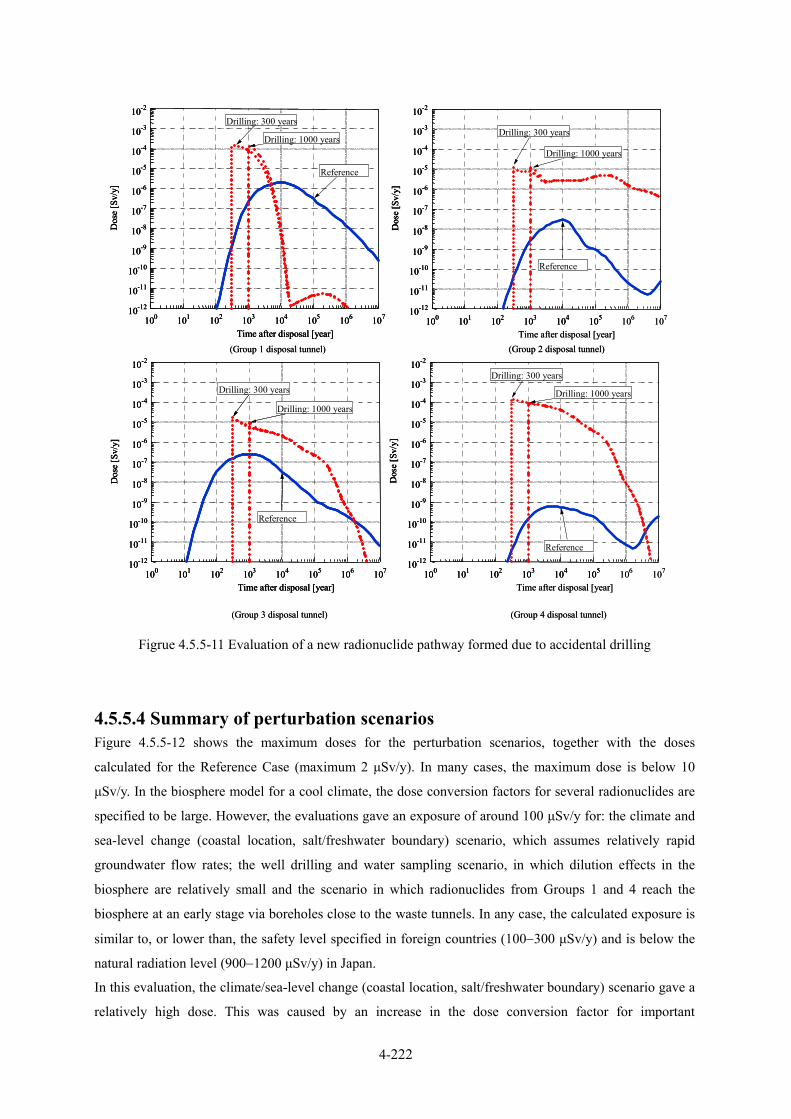
4-222
10-12
10-11
10-10
10-9
10-8
10-7
10-6
10-5
10-4
10-3
10-2D
ose
[Sv/
y]
100 101 102 103 104 105 106 107
Time after disposal [year]
Reference
Drilling: 300 years
Drilling: 1000 years
10-12
10-11
10-10
10-9
10-8
10-7
10-6
10-5
10-4
10-3
10-2
Dos
e [S
v/y]
100 101 102 103 104 105 106 107
Time after disposal [year]
Reference
Drilling: 300 years
Drilling: 1000 years
10-12
10-11
10-10
10-9
10-8
10-7
10-6
10-5
10-4
10-3
10-2
Dos
e [S
v/y]
100 101 102 103 104 105 106 107
Time after disposal [year]
Reference
Drilling: 300 years
Drilling: 1000 years
10-12
10-11
10-10
10-9
10-8
10-7
10-6
10-5
10-4
10-3
10-2
Dos
e [S
v/y]
100 101 102 103 104 105 106 107
Time after disposal [year]
Reference
Drilling: 300 years
Drilling: 1000 years
(Group 1 disposal tunnel) (Group 2 disposal tunnel)
(Group 3 disposal tunnel) (Group 4 disposal tunnel)
10-1210-12
10-1110-11
10-1010-10
10-910-9
10-810-8
10-710-7
10-610-6
10-510-5
10-410-4
10-3
10-2D
ose
[Sv/
y]
100
10-3
10-2D
ose
[Sv/
y]
100 101101 102102 103103 104104 105105 106 107
Time after disposal [year]106 107
Time after disposal [year]
Reference
Drilling: 300 years
Drilling: 1000 years
10-1210-12
10-1110-11
10-1010-10
10-910-9
10-810-8
10-710-7
10-610-6
10-510-5
10-410-4
10-3
10-2
Dos
e [S
v/y]
100
10-3
10-2
Dos
e [S
v/y]
100 101101 102102 103103 104104 105105 106 107
Time after disposal [year]
Reference
Drilling: 300 years
106 107
Time after disposal [year]
Reference
Drilling: 300 years
Drilling: 1000 years
10-1210-12
10-1110-11
10-1010-10
10-910-9
10-810-8
10-710-7
10-610-6
10-510-5
10-410-4
10-3
10-2
Dos
e [S
v/y]
100
10-3
10-2
Dos
e [S
v/y]
100 101101 102102 103103 104104 105105 106 107
Time after disposal [year]
Reference
Drilling: 300 years
Drilling: 1000 years
10-1210-12
10-1110-11
10-1010-10
10-910-9
10-810-8
10-710-7
10-610-6
10-510-5
10-410-4
10-3
10-2
Dos
e [S
v/y]
100
10-3
10-2
Dos
e [S
v/y]
100 101101 102102 103103 104104 105105 106 107
Time after disposal [year]
Reference
Drilling: 300 years
Drilling: 1000 years
(Group 1 disposal tunnel) (Group 2 disposal tunnel)
(Group 3 disposal tunnel) (Group 4 disposal tunnel)
Figrue 4.5.5-11 Evaluation of a new radionuclide pathway formed due to accidental drilling
4.5.5.4 Summary of perturbation scenarios Figure 4.5.5-12 shows the maximum doses for the perturbation scenarios, together with the doses
calculated for the Reference Case (maximum 2 µSv/y). In many cases, the maximum dose is below 10
µSv/y. In the biosphere model for a cool climate, the dose conversion factors for several radionuclides are
specified to be large. However, the evaluations gave an exposure of around 100 µSv/y for: the climate and
sea-level change (coastal location, salt/freshwater boundary) scenario, which assumes relatively rapid
groundwater flow rates; the well drilling and water sampling scenario, in which dilution effects in the
biosphere are relatively small and the scenario in which radionuclides from Groups 1 and 4 reach the
biosphere at an early stage via boreholes close to the waste tunnels. In any case, the calculated exposure is
similar to, or lower than, the safety level specified in foreign countries (100−300 µSv/y) and is below the
natural radiation level (900−1200 µSv/y) in Japan.
In this evaluation, the climate/sea-level change (coastal location, salt/freshwater boundary) scenario gave a
relatively high dose. This was caused by an increase in the dose conversion factor for important
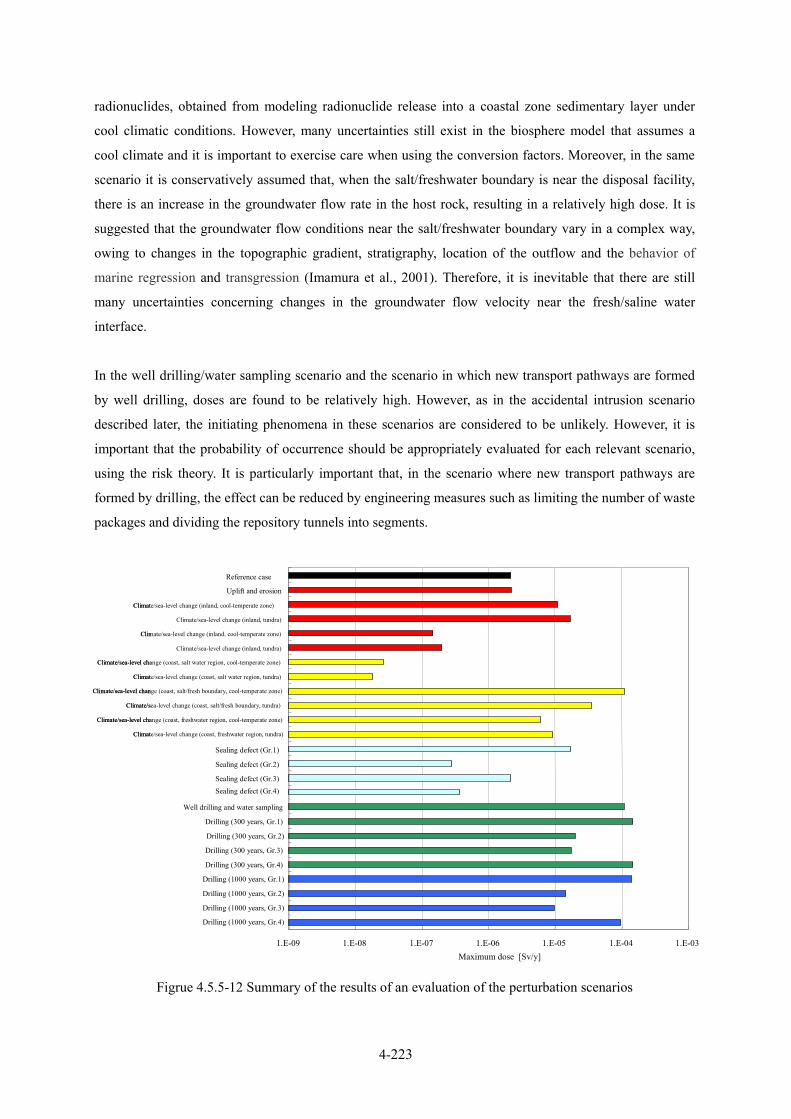
4-223
radionuclides, obtained from modeling radionuclide release into a coastal zone sedimentary layer under
cool climatic conditions. However, many uncertainties still exist in the biosphere model that assumes a
cool climate and it is important to exercise care when using the conversion factors. Moreover, in the same
scenario it is conservatively assumed that, when the salt/freshwater boundary is near the disposal facility,
there is an increase in the groundwater flow rate in the host rock, resulting in a relatively high dose. It is
suggested that the groundwater flow conditions near the salt/freshwater boundary vary in a complex way,
owing to changes in the topographic gradient, stratigraphy, location of the outflow and the behavior of
marine regression and transgression (Imamura et al., 2001). Therefore, it is inevitable that there are still
many uncertainties concerning changes in the groundwater flow velocity near the fresh/saline water
interface.
In the well drilling/water sampling scenario and the scenario in which new transport pathways are formed
by well drilling, doses are found to be relatively high. However, as in the accidental intrusion scenario
described later, the initiating phenomena in these scenarios are considered to be unlikely. However, it is
important that the probability of occurrence should be appropriately evaluated for each relevant scenario,
using the risk theory. It is particularly important that, in the scenario where new transport pathways are
formed by drilling, the effect can be reduced by engineering measures such as limiting the number of waste
packages and dividing the repository tunnels into segments.
Figrue 4.5.5-12 Summary of the results of an evaluation of the perturbation scenarios
1.E-09 1.E-08 1.E-07 1.E-06 1.E-05 1.E-04 1.E-03
Drilling (300 years, Gr.1)
Well drilling and water sampling
Sealing defect (Gr.1)
Climate/sea-level change (inland, cool-temperate zone)
Uplift and erosion
Reference case
Maximum dose [Sv/y]
Sealing defect (Gr.2)
Sealing defect (Gr.3)Sealing defect (Gr.4)
Drilling (300 years, Gr.2)
Drilling (300 years, Gr.3)
Drilling (300 years, Gr.4)
Drilling (1000 years, Gr.1)
Drilling (1000 years, Gr.2)
Drilling (1000 years, Gr.3)
Drilling (1000 years, Gr.4)
Climate/sea-level change (inland, tundra)
Climate/sea-level change (inland, cool-temperate zone)
Climate/sea-level change (inland, tundra)
Climate/sea-level change (coast, salt water region, cool-temperate zone)
Climate/sea-level change (coast, salt water region, tundra)
Climate/sea-level change (coast, salt/fresh boundary, cool-temperate zone)
Climate/sea-level change (coast, salt/fresh boundary, tundra)
Climate/sea-level change (coast, freshwater region, cool-temperate zone)
Climate/sea-level change (coast, freshwater region, tundra)
4-224
4.5.6 Analysis of isolation failure scenarios 4.5.6.1 Surface exposure of the disposal facility by uplift and erosion (1) Assumptions
If uplift and erosion at the disposal site continue over a long period, the disposal facility could eventually
be exposed at the surface. This scenario is considered here with human consumption not through
groundwater transport to the surface but rather from soil contamination as result of direct exposure at the
surface.
As described in Section 4.5.5, Japanese legislation states that the depth of a HLW repository must be more
than 300 m,below the surface and the disposal facility is not expected to be exposed at the surface for at
least 100,000 years after final disposal. In this report, as the construction of the TRU repository is
envisaged at 500 m (sedimentary rock) and 1000 m (crystalline rock), if the same site selection factors as
for HLW final disposal are used the surface exposure of the TRU repository is also estimated to be at least
100,000 years after final disposal.
(2) Model conceptualization
The conceptual model is shown in Figure 4.5.6-1.
Here, it is assumed that surface exposure of the disposal facility occurs after 100,000 years and that a
radionuclide plume around the disposal facility forms by radionuclide leaching from the facility.
In the surface exposure scenario of the disposal facility, it is difficult to construct the biosphere model in
order to evaluate exposure to the public from contaminated soil. A methodology will be developed in
future. By referring to the evaluation in the H12 report (JNC, 2000), the effect of radiolysis is discussed by
comparing radionuclide flux as follows.
・Radionuclide flux from the repository:
Caused by erosion of contaminated host rock in the disposal facility.
Calculated from the radionuclide concentration in exposed contaminated host rock in the disposal
facility (assumed to be concentration in disposal facility × homogeneous distribution at 20 m depth)
and annual erosion rate.
・Natural radionuclide flux:
The radionuclide flux generated by the erosion of a host rock such as granite or a uranium ore deposit
which includes natural radionuclides.
Calculated from the natural radionuclide concentration in the host rock and the annual erosion rate in
the disposal area.
Uplift and erosion rates of 0.1 mm/y and 1 mm/y are assumed, which satisfies the site selection factors
above.
4-225
(3) Results
The case of crystalline rock and an uplift/erosion rate of 1 mm/y is shown in Figure 4.5.6-21. The flux of
U-238 which is generated by erosion of the exposed disposal facility is smaller than that from a naturally
occurring uranium ore deposit.
1 Compared with the natural radiation flux in in Appendix B-2, volume 3 of H12 report, the natural flux in Figure 4.5.6-2 shows a lower value. This is because the area of the TRUdisposal facility is smaller than that for HLW.

4-226
TRU waste disposal facility
Assuming leached nuclide formsuniform plume around disposal facility
300m×300m×300m
TRU waste disposal facility
Assuming leached nuclide formsuniform plume around disposal facility
300m×300m×300m
Figure 4.5.6-1 Conceptual model of surface exposure due to uplift and erosion
Figure 4.5.6-2 Surface exposure of the disposal facility
(crystalline rock with an uplift/erosion rate of 1 mm/y)
1E+3
1E+4
1E+5
1E+6
1E+7
1E+8
1E+9
1E+10
1E+11
1E+12
1E+13
1E+14
1E+2 1E+3 1E+4 1E+5 1E+6 1E+7 1E+8Time after disposal (y)
U-2
38 fl
ux (B
q/y)
Crystalline bedrockErosion rate: 1.0 mm/y
Originating from repositoryTh-229 32%I-129 28%Po-210 12%
Uranium ore deposit (quality 0.1wt%): erosion rate 1.0 mm/y
Uranium ore deposit (quality 0.05wt%): erosion rate 1.0 mm/y
Rock containing uranium, concentration 10ppm: erosion rate 1.0 mm/y
Rock containing uranium, concentration 1ppm: erosion rate 1.0 mm/y

4-227
4.5.6.2 Accidental penetration of the repository by drilling (1) Assumed dose pathway
If drilling occurs near the disposal facility, several radionuclide pathways to the human environment may
be created. Although many pathways should be considered for a comprehensive evaluation, here a few
plausible scenarios are modeled and uncertainties assessed. For the evaluation of human intrusion, it is
recommended that “the consequences of one or more typical plausible stylised intrusion scenarios should
be considered by the decision-maker to evaluate the resilence of the repository to potential intrusion.”
(ICRP 1998).
Although an accidental penetration of repository scenario is not necessarily well stylized yet, here the
following is based on other assessement reports on the intrusion scenario (JNC, 2000; JAERI, 2004).
Here, the following are evaluated (Table 4.5.6-1)
① Internal/external radiation exposure of drill core observer;
② Internal/external radiation exposure of drilling operator;
③ Internal/external radiation exposure of inhabitants.
Table 4.5.6-1 Evaluation target for intrusion by drilling scenario
Radiation source Target person in dose
assessment Dose pathway
External dose
Internal dose by dust inhalation Drill core drill core observer
Internal dose by oral ingestion
External dose
Internal dose by dust inhalation Mixture of drilling mud and
waste drilling worker
Internal dose by oral ingestion
External dose
Internal dose by dust inhalation Mixture of contaminated drilling
material inhabitant
Internal dose by oral ingestion
(2) Calculation of radiation dose
External and internal exposure through inhalation and ingestion by a drill core observer, drilling worker
and the general public are calculated using the following formula.
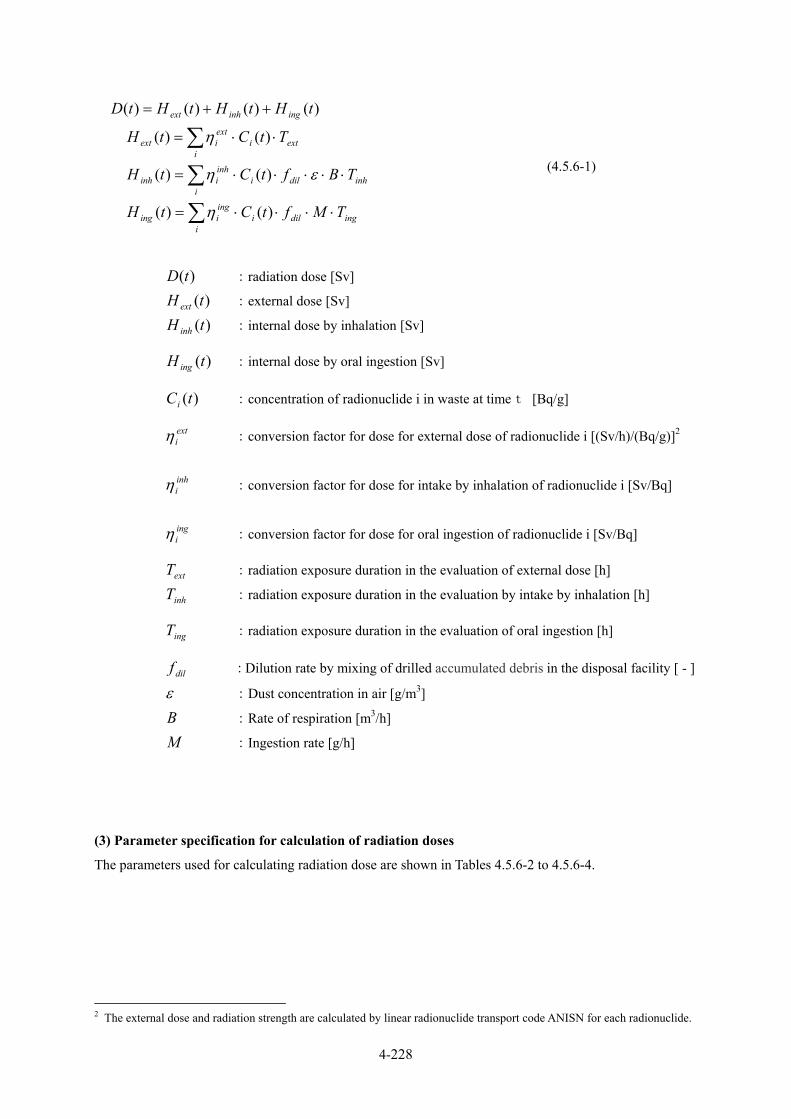
4-228
∑
∑
∑
⋅⋅⋅⋅=
⋅⋅⋅⋅⋅=
⋅⋅=
++=
iingdili
ingiing
iinhdili
inhiinh
iexti
extiext
inginhext
TMftCtH
TBftCtH
TtCtH
tHtHtHtD
)()(
)()(
)()(
)()()()(
η
εη
η
(4.5.6-1)
)(tD :radiation dose [Sv]
)(tH ext :external dose [Sv]
)(tH inh :internal dose by inhalation [Sv]
)(tH ing :internal dose by oral ingestion [Sv]
)(tCi :concentration of radionuclide i in waste at timet [Bq/g]
extiη :conversion factor for dose for external dose of radionuclide i [(Sv/h)/(Bq/g)]2
inhiη :conversion factor for dose for intake by inhalation of radionuclide i [Sv/Bq]
ingiη :conversion factor for dose for oral ingestion of radionuclide i [Sv/Bq]
extT :radiation exposure duration in the evaluation of external dose [h]
inhT :radiation exposure duration in the evaluation by intake by inhalation [h]
ingT :radiation exposure duration in the evaluation of oral ingestion [h]
dilf :Dilution rate by mixing of drilled accumulated debris in the disposal facility [ - ]
ε :Dust concentration in air [g/m3]
B :Rate of respiration [m3/h]
M :Ingestion rate [g/h]
(3) Parameter specification for calculation of radiation doses
The parameters used for calculating radiation dose are shown in Tables 4.5.6-2 to 4.5.6-4.
2 The external dose and radiation strength are calculated by linear radionuclide transport code ANISN for each radionuclide.
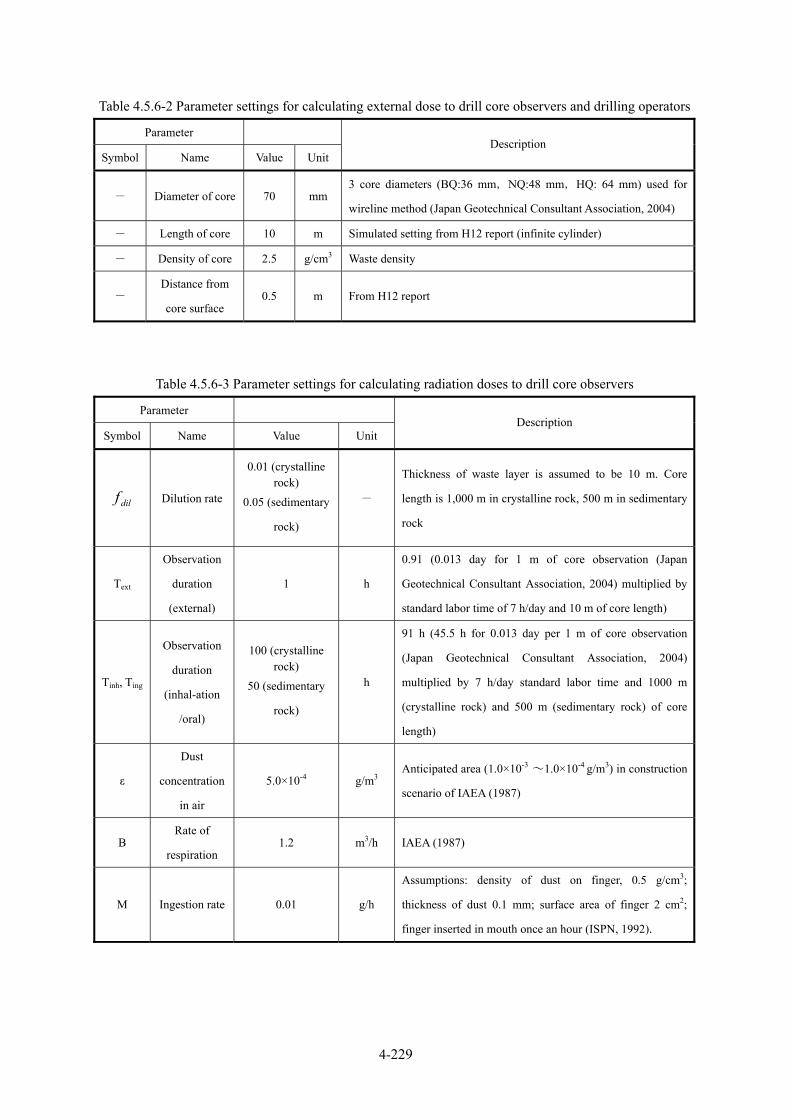
4-229
Table 4.5.6-2 Parameter settings for calculating external dose to drill core observers and drilling operators
Parameter
Symbol Name Value Unit Description
- Diameter of core 70 mm 3 core diameters (BQ:36 mm,NQ:48 mm,HQ: 64 mm) used for
wireline method (Japan Geotechnical Consultant Association, 2004)
- Length of core 10 m Simulated setting from H12 report (infinite cylinder)
- Density of core 2.5 g/cm3 Waste density
- Distance from
core surface 0.5 m From H12 report
Table 4.5.6-3 Parameter settings for calculating radiation doses to drill core observers
Parameter
Symbol Name Value Unit Description
dilf Dilution rate
0.01 (crystalline rock)
0.05 (sedimentary
rock)
-
Thickness of waste layer is assumed to be 10 m. Core
length is 1,000 m in crystalline rock, 500 m in sedimentary
rock
Text
Observation
duration
(external)
1 h
0.91 (0.013 day for 1 m of core observation (Japan
Geotechnical Consultant Association, 2004) multiplied by
standard labor time of 7 h/day and 10 m of core length)
Tinh, Ting
Observation
duration
(inhal-ation
/oral)
100 (crystalline rock)
50 (sedimentary
rock)
h
91 h (45.5 h for 0.013 day per 1 m of core observation
(Japan Geotechnical Consultant Association, 2004)
multiplied by 7 h/day standard labor time and 1000 m
(crystalline rock) and 500 m (sedimentary rock) of core
length)
ε
Dust
concentration
in air
5.0×10⁻⁴ g/m3 Anticipated area (1.0×10⁻³ ~1.0×10⁻⁴ g/m3) in construction
scenario of IAEA (1987)
B Rate of
respiration 1.2 m3/h IAEA (1987)
M Ingestion rate 0.01 g/h
Assumptions: density of dust on finger, 0.5 g/cm3;
thickness of dust 0.1 mm; surface area of finger 2 cm2;
finger inserted in mouth once an hour (ISPN, 1992).
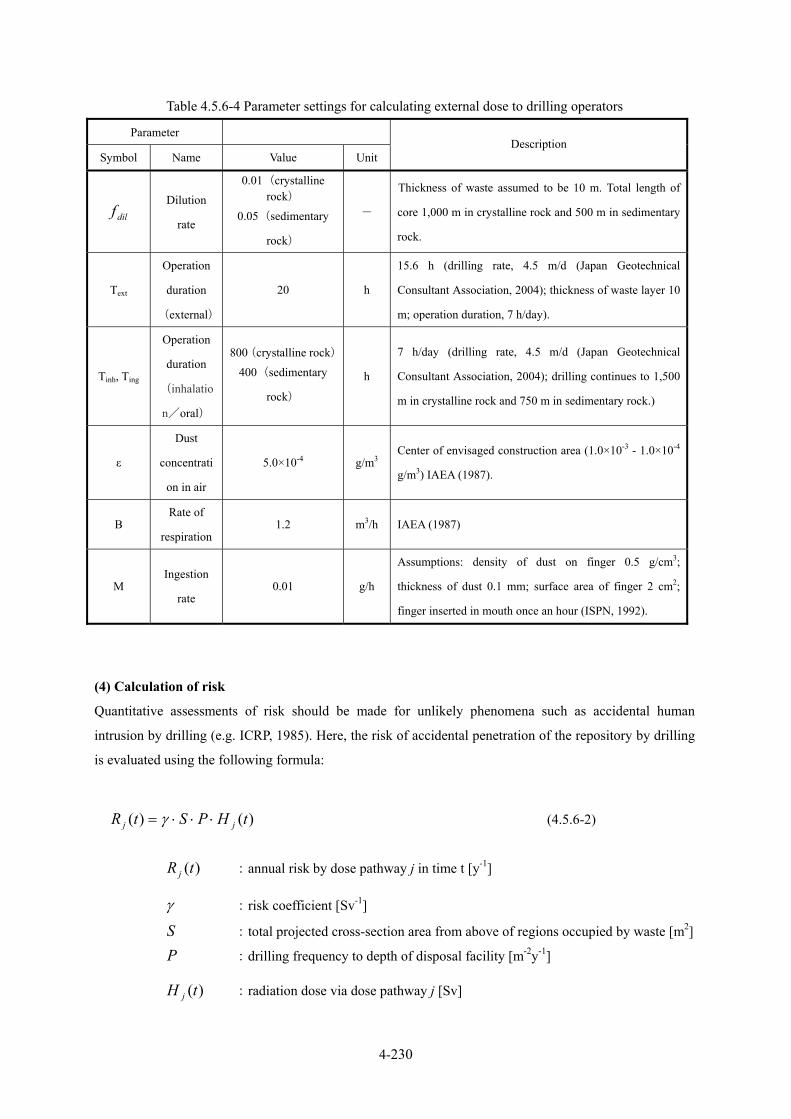
4-230
Table 4.5.6-4 Parameter settings for calculating external dose to drilling operators
Parameter
Symbol Name Value Unit Description
dilf Dilution
rate
0.01(crystalline rock)
0.05(sedimentary
rock)
-
Thickness of waste assumed to be 10 m. Total length of
core 1,000 m in crystalline rock and 500 m in sedimentary
rock.
Text
Operation
duration
(external)
20 h
15.6 h (drilling rate, 4.5 m/d (Japan Geotechnical
Consultant Association, 2004); thickness of waste layer 10
m; operation duration, 7 h/day).
Tinh, Ting
Operation
duration
(inhalatio
n/oral)
800(crystalline rock)
400(sedimentary
rock)
h
7 h/day (drilling rate, 4.5 m/d (Japan Geotechnical
Consultant Association, 2004); drilling continues to 1,500
m in crystalline rock and 750 m in sedimentary rock.)
ε
Dust
concentrati
on in air
5.0×10⁻⁴ g/m3Center of envisaged construction area (1.0×10⁻³ - 1.0×10⁻⁴
g/m3) IAEA (1987).
B Rate of
respiration 1.2 m3/h IAEA (1987)
M Ingestion
rate 0.01 g/h
Assumptions: density of dust on finger 0.5 g/cm3;
thickness of dust 0.1 mm; surface area of finger 2 cm2;
finger inserted in mouth once an hour (ISPN, 1992).
(4) Calculation of risk
Quantitative assessments of risk should be made for unlikely phenomena such as accidental human
intrusion by drilling (e.g. ICRP, 1985). Here, the risk of accidental penetration of the repository by drilling
is evaluated using the following formula:
)()( tHPStR jj ⋅⋅⋅= γ (4.5.6-2)
)(tR j :annual risk by dose pathway j in time t [y-1]
γ :risk coefficient [Sv-1]
S :total projected cross-section area from above of regions occupied by waste [m2]
P :drilling frequency to depth of disposal facility [m-2y-1]
)(tH j :radiation dose via dose pathway j [Sv]
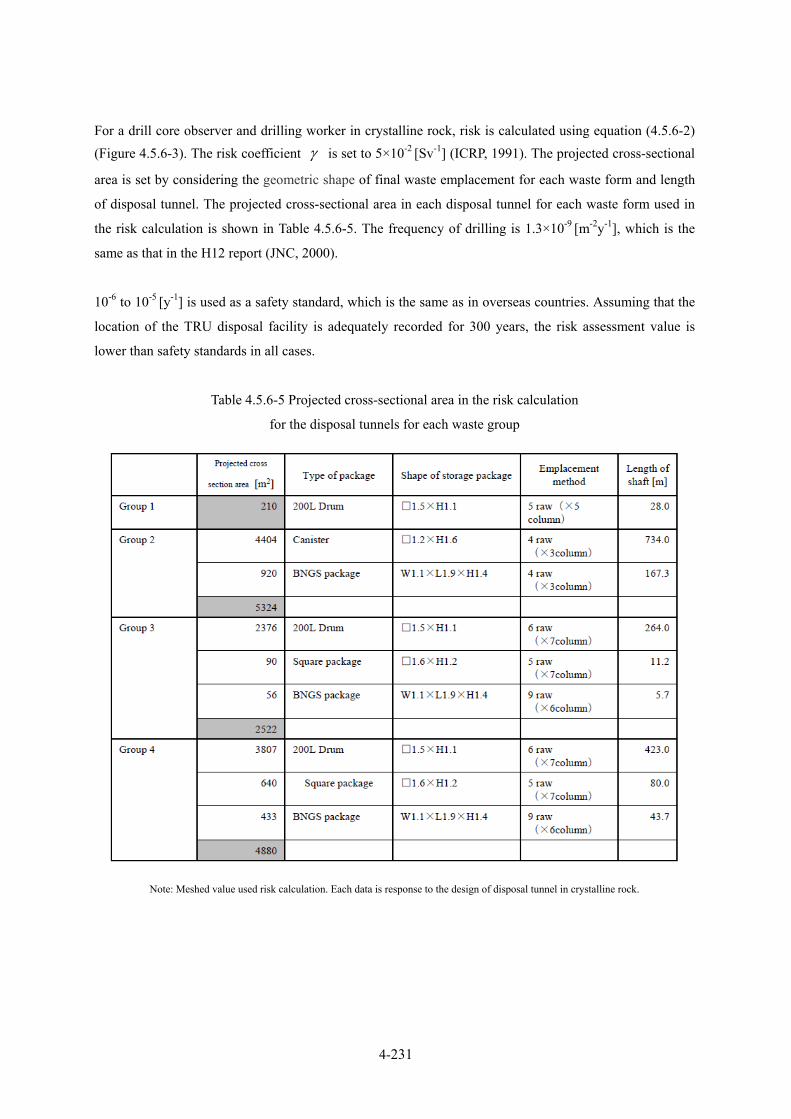
4-231
For a drill core observer and drilling worker in crystalline rock, risk is calculated using equation (4.5.6-2) (Figure 4.5.6-3). The risk coefficient γ is set to 5×10⁻² [Sv-1] (ICRP, 1991). The projected cross-sectional
area is set by considering the geometric shape of final waste emplacement for each waste form and length
of disposal tunnel. The projected cross-sectional area in each disposal tunnel for each waste form used in
the risk calculation is shown in Table 4.5.6-5. The frequency of drilling is 1.3×10⁻⁹ [m-2y-1], which is the
same as that in the H12 report (JNC, 2000).
10-6 to 10-5 [y-1] is used as a safety standard, which is the same as in overseas countries. Assuming that the
location of the TRU disposal facility is adequately recorded for 300 years, the risk assessment value is
lower than safety standards in all cases.
Table 4.5.6-5 Projected cross-sectional area in the risk calculation
for the disposal tunnels for each waste group
Note: Meshed value used risk calculation. Each data is response to the design of disposal tunnel in crystalline rock.
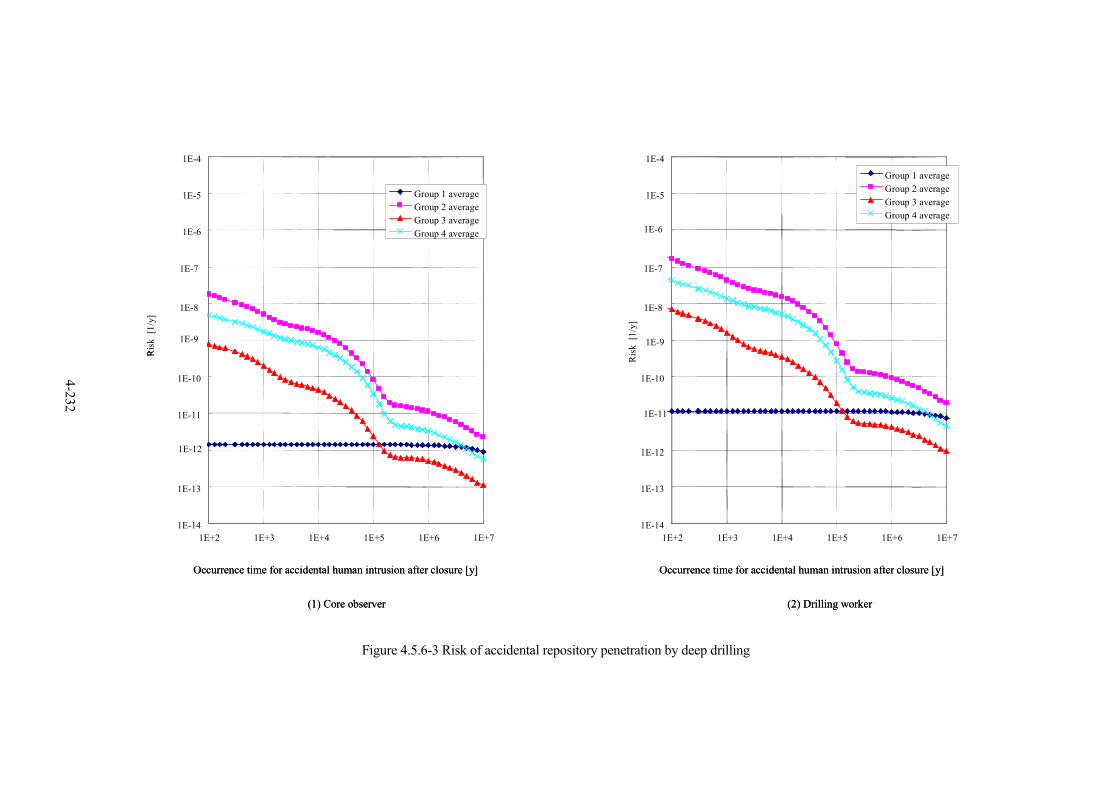
4-232
1E-14
1E-13
1E-11
1E-10
1E-6
1E-5
1E-4
1E+2 1E+3 1E+4 1E+5 1E+6 1E+7
Occurrence time for accidental human intrusion after closure [y]
Group 1 averageGroup 2 averageGroup 3 averageGroup 4 average
1E-12
1E-8
1E-9
1E-7
Risk
[1/
y]
1E-14
1E-13
1E-12
1E-10
1E-9
1E-5
1E-4
1E+2 1E+3 1E+4 1E+5 1E+6 1E+7
Risk
[1/
y]
Group 1 averageGroup 2 averageGroup 3 averageGroup 4 average
Occurrence time for accidental human intrusion after closure [y]
1E-6
1E-7
1E-8
1E-11
(1) Core observer (2) Drilling worker
1E-14
1E-13
1E-11
1E-10
1E-6
1E-5
1E-4
1E+2 1E+3 1E+4 1E+5 1E+6 1E+7
Occurrence time for accidental human intrusion after closure [y]
Group 1 averageGroup 2 averageGroup 3 averageGroup 4 average
1E-12
1E-8
1E-9
1E-7
Risk
[1/
y]
1E-14
1E-13
1E-12
1E-10
1E-9
1E-5
1E-4
1E+2 1E+3 1E+4 1E+5 1E+6 1E+7
Risk
[1/
y]
Group 1 averageGroup 2 averageGroup 3 averageGroup 4 average
Occurrence time for accidental human intrusion after closure [y]
1E-6
1E-7
1E-8
1E-11
(1) Core observer (2) Drilling worker
Figure 4.5.6-3 Risk of accidental repository penetration by deep drilling
4-233
4.6 Summary of disposal safety In order to examine the safety of the repository for TRU waste disposal, the individual factors that make
up the structure of the safety assessment were established and a safety assessment system was constructed
that focused on impact of uncertainty. Pre-conditions relating to the disposal environment and the concept
for TRU waste disposal was compiled and the safety assessment that considered diverse uncertainty was
carried out through a detailed evaluation of individual phenomena including the temporal and spatial
variations in the characteristics of barrier material.
4.6.1 Method for conducting safety assessments of a geological repository
The key characteristics of the geological disposal system for TRU waste are the large variety of waste,
including metals, nitrates and organic material, and the use of large amounts of cementitious material. This
affects the evolution of the disposal facility and the possible spatio-temporal evolution of barrier materials.
Furtheremore, the geological disposal system for TRU waste is being developed for a generic geological
environment as no actual site has been identified as yet. These factors are a source of uncertainty in the
safety assessment.
OECD/NEA (2004) stipulates that investigations of uncertainty should be included in safety assessments in
order to improve the reliability of the evaluation. In order to obtain the confidence of not only
dicision-maker and specialist but also the general public in the safety assessment, various uncertainties
should be evaluated in detail and the results should be presented clearly.
Hence, a new safety assessment system was constructed that includes a comprehensive sensitivity analysis
in order to evaluate uncertainty comprehensively, which the deterministic consequence calculations can not
always treate sufficiently.
4.6.2 Summary of preconditions used in the safety assessment Since the safety concept of the geological disposal of TRU waste is not decided as yet, it is important to
define and to present safety requirements for clarifying the target and range of assessments in the safety
evaluation. In this assessment, based on IAEA (DS154), safety requirements considered in the current
stage of development were defined.
Since the development of a TRU waste repository is at a generic stage, the geological conditions were
summarised by considering the reseach program of HLW. The inventories of radionuclides, taking into
account future generation of TRU waste, were calculated and the design of the disposal facility for safety
assessment based on TRU inventories was presented. These requirements and conditions were summarised
as preconditions.
4-234
4.6.3 Scenario development A comprehensive FEP list was constructed based on examples from Japan and abroad. Exhaustive scenario
evaluations were performed by considering the features of geological disposal and the relationship
between FEPs and scenarios. A base scenario of groundwater scenario including the reference scenarion
and the alternative scenario, perturbation scenario of groundwater scenario and isolation failure scenario
were constructed. Furthermore, important repository environmental conditions in the safety assessment
were identified.
4.6.4 Specification of environmental condition in the safety assessment The repository environmental conditions which form an important part of the safety assessment were
evaluated. In these conditions, the site conditions (thermal, hydraulic, mechanical, chemical, radiation
field) and phenomena related to radionuclide transport and to organic material and nitrates in TRU waste
were included. Furthermore, the conditions affected by alteration effects of the engineered barriers,
alkaline alteration effects of the surrounding host rock, effects of the hydraulic field in the near-field,
colloid effects, effects of natural organic material, effects of microbes and gaseous effects were included.
In the evaluating these conditions, detailed individual phenomena were investigated by considering
spatio-temporal variations and uncertainties in the barrier materials (cf. Section 4.4.11).
4.6.5 Radionuclide transport analysis and dose assessments 4.6.5.1 Specification of analytical cases Based on an evluation of important disposal environments in the safety assessment, analytical cases were
set up. Analytical cases that considered model and parameter uncertainty were also established and the
methodology used to evaluate the analytical cases was described.
4.6.5.2 Results of safety assessment for the base scenario of the groundwater scenario
In order to evaluate the safety of the TRU waste disposal concept, deterministic consequence calculations
for the Reference Case were made. These showed that the maximum dose was about 2 µSv/y, which is
well below the safety standard in overseas countries (100−300 µSv/y), natural background radiation level
in Japan and the existing safety standards for shallow disposal in Japan (10 µSv/y).
In order to ensure the reliability of the safety assessment, alternative cases were analyzed and compared
with the Reference Case in order to address uncertainties in scenario, models and data. In the alternative
cases, potential impact of the phenomena which affect the safety of TRU waste disposal were investigated,
deterministic consequence calculations and sensitivity analyses for key parameters were carried out with
alternative values of key parameters set up based on the parameter ranges. The maximum dose in most
cases was below the 10 µSv/y. However, the influence of transmissivity and hydraulic gradient showed a
strong linear relationship with maximum dose, and the target value (10 µSv/y) was exceeded in some cases
4-235
depending on the parameter values.
A complementary comprehensive sensitivity analysis was performed in order to evaluate the effects of
uncertainty on maximum dose. The result showed that disposal safety is assured even with the existence of
various uncertainties in the assumed parameters and models under the reference geological environment,
except for cases based on hypothetical parameters due to lack of information.
Considering the uncertainty of the geological environment, disposal safety could be assured by including
alternative technologies for reducing nuclide release from waste even in the presence of multiple
uncertainties. These technologies are presently under development and are briefly described in Chapter 7.
The importance of the data relating to sorption of natural organic material in the host rock, the data
relating to the proportion of fracture from which radionuclides can diffuse into matrix and the
improvement of waste technologies which help prevent radionuclide release from waste was indicated
through the assessment. In order to avoid excessively conservative assessment, and improve the reliability
of the safety assessments, research should focus on these issues.
4.6.5.3 Results of the safety assessment of the perturbation scenario in the groundwater scenario
In the perturbation scenario, scenarios of natural phenomena, initial defects of engineered barriers and
human intrusion were evaluated.
In the natural phenomena scenario, the effect of uplift/erosion and climate/sea-level change were
considered.
Based on site-selection factors for high-level waste (uplift and erosion below 300 m during 100,000 years),
0.1 mm/y and 1 mm/y for uplift and erosion rates were considered. The results show that the maximum
dose is almost the same as that of the Reference Case. The controlling factor for this analysis is the rate of
increase (10 times) in groundwater flow velocity and the time period over which the effects of uplift and
erosion become significant (900,000 years and 9,000,000 years). From the evaluation of uncertainty in
Section 4.5.4 (Figure 4.5.4.3-7), if an increasing groundwater flow velocity and uplift and erosion rate stay
within the above values, disposal safety is not compromised, even taking into account parameter
uncertainties related to an oxidizing environment.
Considering the effects of a cool climate or tundra climate, the variation was mainly affected by the
differences in biosphere models or uncertainty of groundwater flow around the disposal facility. Hence in
future, more realistic hydraulic conditions, biosphere models and relevant parameters for future climate
change are required.
4-236
In the scenario of initial defects of engineered barriers, the effect of fault sealing was considered. The
groundwater flow condition (10 times that of the host rock) and the increase in flow in the EDZ (10 times)
due to incomplete sealing were established. The evaluation showed that the maximum dose was several 10
µSv/y in the case of Group 1.
In the human intrusion scenario, the formation of new radionuclide transport pathways by well drilling and
water sampling was considered. In the drilling and water sampling scenario, it was assumed that
contaminated pore water in the aquifer was used by general public directly. As a result of the analysis, the
maximum dose was estimated to be about 100 µSv/y. For the formation of new radionuclide transport
pathways by drilling, it was assumed that oxidizing groundwater enters the repository and flow in the EDZ
increases by a factor of 10. It was also assumed that radionuclides at EDZ directly reach the biosphere. The
analytical results show that the maximum dose for Group 1 reaches about 100 µSv/y.
Summarizing these results, the maximum dose for the perturbation scenario in the groundwater scenario is
below 10 µSv/y in many cases. Otherwise, the scenario which considers the formation of new radionuclide
transport pathways by well drilling and water sampling, different biosphere models and borehole drilling
gives 100 µSv/y. Nevertheless, this level is the same as, or less than, the regulatory safety standard
(100-300 µSv/y) in overseas countries.
4.6.5.4 Results of safety assessment for the isolation failure scenario Exposure of the disposal facility at the surface by uplift and erosion and accidental penetration of the
repository by drilling were evaluated as isolation failure scenarios.
In the case of surface exposure, taking into account site selection factors (uplift and erosion below 300 m
during 100,000 years), this event only happens after 100,000 years. At this point, it is assumed that
radionuclide was released forming a contaminated plume around the repository. In the evaluation, since the
exposure pathway is different from the normal groundwater scenario, the U-238 conversion flux was
chosen as a safety index for dose rate. The flux caused by erosion of repository was found to be smaller to
that generated from erosion of granite and uranium ore deposits.
For accidental repository penetration by drilling, an evaluation was performed based on the evaluation
method for the scenario by drilling in the H12 report (JNC, 2000) and the risk was found to be below 10-6 -
10-5 [y-1], which is the safety standard in several overseas countries.
Among the phenomena which form the basis for the perturbation scenarios and isolation failure scenarios
above, extremely unlikely phenomena such as drilling were also included. In order to evaluate such
phenomena in detail, some form of risk-based reasoning that includes event probability is necessary in
future.
4-237
4.6.6 Summary of safety An exhaustive scenario evaluation for TRU specific waste disposal was carried out. A base scenario of the
groundwater scenario, perturbation scenario and isolation failure scenario were constructed and evaluated.
In the evaluation of the base scenario, a detailed evaluation of individual phenomena that considers the
uncertainty relating to spatio-temporal changes in the barrier materials was performed based on current
data and natural phenomena.
Based on these results, the analytical case for radionuclide transport and dose assessment was established
and it was demonstrated that the TRU waste disposal concept in Japan is the safe concept with robustness
by the combination of deterministic consequence calculations and a comprehensive sensitivity analysis.
Based on the evaluation of perturbation/ isolation failure scenarios, it was shown that risk was below 10-6 −
10-5 [y-1], which is the indicated safety standard in severa overseas countries.
From these evaluations and analyses, an exhaustive safety assessment was carried out. Key areas for future
research are summarised in Chapter 8.
4-238
References
Adler, M., Mäder, U. and Waber, H.N. (1999): High pH alteration of argillaceous rocks: an experimental
study, Scheiz. Mineral. Petrogr. Mitt., 79, 445-454.
Agg, P.J. (1993): Modelling gas generation in radioactive waste repositories, Nucl. Energy, 32, 81-87.
Ahn, J., Greenspan, E. and Chambré, P.L. (1998): Mechanisms and Possibility of Autocatalytic Criticality
by High-Level Wastes Buried in Water-Saturated Geologic Formation, Journal of Nuclear Fuel
Cycle and Environment, Vol. 4, No. 2, pp. 3-20. [written in Japanese]
Alexander, W.R. and Smellie, J.A. (1998): Maqarin natural analogue project, ANDRA, CEA, Nagra,
NIREX and SKB Synthesis Report on Phase I, II and III, Nagra Project Report 98-09.
Ando, K., Noda, M., Yamamoto, M. and Mihara, M. (2005): Gas Generation and Migration Analysis for
TRU Waste Disposal System, Japan Nuclear Cycle Development Institute, JNC TN8400 2005-026.
[written in Japanese]
Arai, Y. (1991): Semento no Zairyo-Kagaku (in Japanese) (Material Chemistry of Cement, Second Edition,
translated by JAEA), Dainippon-Tosho. [written in Japanese]
Arter, H.E., Hanselman, K.W. and Bachofen, R. (1991): The behaviour of microorganisms in a waste
repository, Experienta, 47, 578-583.
Arthur, R.C., Sasamoto, H., Oda, C., Honda, A., Shibata, M., Yoshida, Y. and Yui, M. (2005): Development
of thermodynamic database for hyperalkaline, argillaceous systems, Japan Nuclear Cycle
Development Institute, JNC TN8400 2005-010.
Atkinson, A. (1985): The Time Dependence of pH within a Repository for Radioactive Waste Disposal,
AERE R11777, UKAEA.
Atkinson, A., Hearne, J.A. and Knights, C.F. (1987): Aqueous Chemistry and Thermodynamic Modelling
of CaO-SiO2-H2O Gels, AERE R12548, UKAEA.
Atkinson, A. and Guppy, M. (1988): Evolution of pH in a radwaste repository leaching of modified
cements and reactions with groundwater, AERE R12961, UKAEA.
Avogadro, A. and De Marsily, G. (1984): The role of colloids in nuclear waste disposal, Mat. Res. Soc.
Symp. Proc., Scientific Basis for Nuclear Waste Management VII, Vol. 26, pp. 495-505.
Baker, A.J., Lever, D.A., Rees, J.H., Thorne, M.C., Tweed, C.J. and Wikramaratna, R.S. (1997): Nirex 97:
An Assessment of the Post-closure Performance of a Deep Waste Repository at Sellafield, Volume
4: The Gas Pathway, Nirex Science Report S/97/012.
Berner, U.R. (1992): Evolution of Pore Water Chemistry during Degradation of Cement in a Radioactive
Waste Repository Environment, Waste Management, 12, 201-219.
Bjergbakke, E., Sehested, K., Rasumessen, O.L. and Christensen, H. (1984): Input file for Computer
Simulation of Water Radiolysis, M-2430, Danish Atomic Energy Commission.
Börjesson, S., Emren, A. and Ekberg, C. (1997): A Thermodynamic Model for the Calcium Silicate
Hydrate Gel, Modelled as a Non-ideal Binary Solid Solution, Cem. Concr. Res., 27, 1649-1657.
Bowman, C.D. and Venneri, F. (1995): Underground Autocatalytic Criticality from Plutonium and Other
4-239
Fissile Material. Los Alamos National Laboratory, LA-UR-94-4022A.
Bradbury, M.H. and Sarott, F.A. (1994): Sorption Databases for the Cementitious Near-Field of a L/ILW
Repository for Performance Assessment, Nagra Technical Report 93-08.
Bradbury, M.H. and Sarott, F.A. (1995): Sorption Database for the Cementitious Near-Field of a L/ILW
Repository for Performance Assessment, PSI Bericht, Nr. 95-06.
Bradbury, M.H. and Van Loon, L.R. (1998): Cementitious Near-Field Sorption Date Bases for Performance
Assessment of a L/ILW Repository in a Palfris Marl Host Rock, PSI Bericht Nr. 98-01.
Burch, T.E., Nagy, K.L. and Lasaga, A.C. (1993): Free energy dependence of albite dissolution kinetics at
80°C and pH8.8, Chemical Geology, 105, pp. 137-162.
Cama, J., Ganor, J., Ayora, C. and Lasaga, C.A. (2000): Smectite dissolution kinetics at 80°C and pH8.8,
Geochimica et Cosmochimica Acta, Vol. 64, No. 15, pp. 2701-2717.
Cama, J., Metz, V. and Ganor, J. (2002): Geochimica et Cosmochimica Acta, Vol. 66, pp. 3913-3926.
Carroll, S., Mrozek, E., Alai, M. and Ebert, M. (1998): Amorphous silica precipitation (60 to 120°C):
Comparison of laboratory and field rates, Geochimica et Cosmochimica Acta, Vol. 62, No. 8, pp.
1379-1396.
Chang, Y., Peacock, A.D., Lomg, P.E., Stephen, J.R., McKinley, J.P., Macnaughton, S.J., Hussain,
A.K.M.A., Saxton, A.M. and White, D.C. (2001): Diversity and characterization of sulfate-reducing
bacteria in groundwater at a uranium mill tailings site, Appl. Environ. Microbiol., 67, 3149-3160.
Christensen, H. and Bjergbakke, E. (1982): Radiolysis of Groundwater from HLW Stored in Copper
Canisters, Studvik Energiteknik AB, 82-02, 1-33.
Dansgaard, W., Johnsen, S.J., Clausen, H.B., Dahl-Jensen, D., Gundestrup, N.S., Hammer, C.U., Hividberg,
C.S., Steffensen, J.P., Sveinbjornsdottir, A.E., Jouzel, J. and Bond, G. (1993): Evidence for general
instability of past climate from 250-kyr ice core record. Nature, 364, 218-220.
Degueldre, C. (1993): Colloid Properties in Granitic Groundwater Systems, with Emphasis on the Impact
on Safety Assessment of a Radioactive Waste Repository, Mat. Res. Soc. Symp. Proc., Scientific
Basis for Nuclear Waste Management XVI, 294, 817-823.
Dibble, W.E. and Tiller, W.A. (1981): Kinetic model of zeolite paragenesis in tuffaceous sediments, Clays
and Clay Minerals, Vol. 29, pp. 323-330.
Diebold, P. and Mueller, W.H. (1984): Szenarien der Geologischen Langzeit-Sicherheit. Nagra Technical
Report NTB 84-26.
EIC Net (2005): Environmental information system (http://www.eic.or.jp/ecotem), Environmental
Information & Communication Network. [written in Japanese]
Engle, W.W. (1967): A User Manual for ANISN –A One-dimensional Discrete Ordinate Transport Code
with Anisotropic Scattering−, K-1963.
EPRI (1998): Radwaste Radiolytic Gas Generation Literature Review, EPRI NP-5977.
Ewart, F., Greenfield, B.F., Haworth, A., Rosevear, A. and Williams, S.J. (1991): The effects of organics in
SFR on sorption coefficients, SFR91-01.
Ewing, R.C. (1984): Summary −Smectite Alteration−, Proceedings of Workshop Convened at the

4-240
Shoreham Hotel Washington D.C. Dec. 8-9, SKB KBS Technical Report 84-11.
Fujii, K. and Kondo, W. (1981): Heterogeneous Equilibrium of Calcium Silicate Hydrate in Water at 30°C,
J. Chem. Soc. Dalt Trans., 2, 645-651.
Fujita, H., Negishi, K., Osawa, T. and Honda, A. (2003): Semento Suiwabutsu no Yoshutsu-Kyodo e
Ataeru Shosanen no Eikyo (in Japanese) (Effect of Nitrate on Leaching Behavior of Cement
Hydrates, translated by Authors), Concrete Engineering Series 53, Konkurito no Kagakuteki
Shinshoku, Yodatsu ni kansuru Kenkyuh no Genjo (in Japanese) (Current Status of the Study on
Chemical Degradation and Leaching of Concrete, translated by JAEA), pp. 207-214. [written in
Japanese]
Fujita, T., Sugiyama, D., Tsukamoto, M. and Yokoyama, H. (1997): Review on technical issues influencing
performance of chemical barriers of TRU waste repository, Central Research Institute of Electric
Power Industry, CRIEPI Report U97017. [written in Japanese]
Fujita, T., Sugiyama, D. and Tsukamoto, M. (2002): Chemical Alteration of Cement Materials in a
Radioactive Waste Repository Environment (3) –Development of Reactive Transport
Computational Code Combined with Incongruent Dissolution Model of Calcium Silicate Hydrates–,
Central Research Institute of Electric Power Industry, CRIEPI Report T02003. [written in Japanese]
Fujita, T., Sugiyama, D., Swanton, S.W. and Myatt, B.J. (2003): Observation and characterization of
colloids derived from leached cement hydrates, Journal of Contaminant Hydrology, 61, 3-16.
Fujiwara, K. and Kawashima, A. (2002): Experimental Studies of Microbial Acclimation to Condition of
Geological Disposal System, Japan Nuclear Cycle Development Institute, JNC TJ8400 2002-034.
[written in Japanese]
Glasser, F.P., Tyrer, M., Quillin, K., Ross, D., Pedersen, J., Goldthorpe, K., Bennett, D. and Atkins, M.
(1998): The chemistry of blended cements and backfills intended for use in radioactive waste
disposal, R&D technical report P98, Environment Agency.
Glynn, P.D. (1991): MBSSAS: A Code for the Computation of Margules Parameters and Equilibrium
Relations in Binary Solid-Solution Aqueous-Solution Systems, Computers and Geoscience 17,
907-966.
Goodwin, B.W., McConnell, D.B., Andres, T.H., Hajas, W.C., Leneveu, D.M., Melnyk, T.W., Sherman,
G.R., Stephens, M.E., Szekely, J.G., Wuschke, D.M., Bera, P.C., Cosgrove, C.M., Dougan, K.D.,
Keeling, S.B., Kitson, C.I., Kummen, B.C., Oliver, S.E., Witzke, K.H., Wojciechowski, L.C. and
Wikjord, A.G. (1994): The Disposal of Canada’s Nuclear Fuel Waste: Postclosure Assessment of a
Reference System. AECL-10717, COG-93-7.
Grauer, R. (1986): Bentonite as a Backfill Material in the High Level Waste Repository. Chemical Aspects,
Nagra Technical Report NTB 86-12E.
Greenberg, S.A. and Chang, T.N. (1965): Solubility Relationships in the Calcium Oxide-Silica-Water
System at 25°C, J. Phys. Chem., 69, 182-188.
Greenfieled, B.F., Moreton, A.D., Spindler, M.W., Williams, S.J. and Woodwark, D.R. (1992): The Effects
of the Degradation of Organic Materials in the Near Field of a Radioactive Waste Repository, Mat.
4-241
Res. Soc. Symp. Proc., Scientific Basis for Nuclear Waste Management XV, Vol. 257, pp. 299-306.
Greenfield, B.F, Ito, M., Spindler, M.W., Williams, S.J. and Yui, M. (1997): The Effects of the Chemical
and Radiolytic Degradation of Asphalt on Plutonium Solubility, Mat. Res. Soc. Symp. Proc.,
Scientific Basis for Nuclear Waste Management XX, Vol. 465, pp. 721-728.
Greenfield, B.F., Ilett, D.J., Ito, M., McCrohon, R., Hearth, T.G., Tweed, C.J., Williams, S.J. and Yui, M.
(1998): The Effect of Cement Additives on Radionuclide Solubilities, Radiochimica Acta, 82,
27-32.
Grenthe, I., Puigdomenech, I. and Bruno, J. (1983): The possible effects of alpha and beta radiolysis on the
matrix dissolution of spent nuclear fuel, KBS TR 83-02.
Grindrod, P. (1993): The impact of colloids on the migration and dispersal of radionuclides within
fractured rock, Journal of Contaminant Hydrology, Vol. 13, pp. 167-181.
Guillaumont, R., Fanghanel, T., Fuger, J., Grenthe, I., Neck, V., Palmer, D.A. and Rand, M.H. (2003):
Update on the Chemical Thermodynamics of Uranium, Neptunium, Plutonium, Americium and
Technetium, OECD Nuclear Energy Agency, Elsevier.
Hasegawa, T., Igarashi, T., Tanaka, Y., Tsuchi, H. and Ono, F. (2001): Numerical Investigation of
Sub-Seabed Groundwater Flow, Journal of Groundwater Hydrology, Vol. 43, No. 4, pp. 289-300.
[written in Japanese]
Honda, A. and Mihara, M. (2004): Impact of Organic Materials in Hull-end Piece Wastes on Solubility and
Sorption of Radioactive Nuclides, Japan Nuclear Cycle Development Institute, JNC TN8400
2004-011. [written in Japanese]
Honda, A., Masuda, K., Tateishi, T., Imakita, T., Nishimura, T. and Kato O. (2005): A Modeling Study for
the Chemical Evolution of Nitrate Accompanied with the Corrosion of Carbon Steel, Japan Nuclear
Cycle Development Institute, JNC TN8400 2005-023. [written in Japanese]
Horikoshi, K. and Akiba, M. (1993): Kou-Arukari Biseibutsu (in Japanese) (Alkalophilic Microorganisms,
translated by JAEA), Japan Scientific Societies Press. [written in Japanese]
Horseman, S.T. and Harrington, J.F. (1997): Study of gas migration in MX80 buffer bentonite, British
Geological Survey, Technical Report WE/97/7.
Huang, W-H. and Chen, W-C. (2004): Swelling behaviour of a potential buffer material under simulated
near field environment, Journal of Nuclear Science and Technology, Vol. 41, No. 12, pp.
1271-1279.
Huertas, F.J., Caballero, E., Jimenez de Cisnerous, C., Huertas, F. and Linares, J. (2001): Kinetics of
montmorillonite dissolution in granitic solutions, Applied Geochemistry, Vol. 16, pp. 397-407.
Humphreys, P., Johnstone, T., Trivedi, D. and Hoffmann, A. (1995): The biogeochemical transport code
DRINK: A mechanistic description, Mat. Res. Soc. Symp. Proc., Scientific Basis for Nuclear Waste
Management XVIII, Vol. 353, pp. 211-218.
IAEA (1987): Exemption of Radiation Sources and Practices from Regulatory Control, IAEA
TECDOC-401.
Ichige, S. and Honda, A. (2005): A Swelling Experiment of Altered Bentonite by Alkaline Solution, Japan
4-242
Nuclear Cycle Development Institute, JNC TN8430 2005-003. [written in Japanese]
ICRP (1985): Radiation Protection Principles for the Disposal of Solid Radioactive Wastes, Publication 46,
Annals of the ICRP, Vol. 15, No. 4.
ICRP (1991): 1990 Recommendation of the International Commission on Radiological Protection,
Publication 60, Annals of the ICRP, Vol. 21, Nos. 1-3.
ICRP (1998): Radiation Protection Recommendations as Applied to the Disposal of Long-lived Solid
Radioactive Waste, Publication 81, Annals of the ICRP, Vol. 28, No. 4.
ICRP (1999): ICRP Publication 81 −Radiation Protection Recommendations as Applied to the Disposal of
Long-lived Solid Radioactive Waste.
Imai, G. (1985): Wakariyasui Tsuchi no Rikigaku (in Japanese) (Guidebook of Soil Mechanics, translated
by JAEA), Kajima Institute Publishing. [written in Japanese]
Imamura, S., Shimomura, M., Adachi, T., Ijiri, Y. and Sugihara, Y. (2001): Three-Dimensional
Groundwater Flow Analysis with Saline/Fresh-Water Interface, Japan Nuclear Cycle Development
Institute, JNC TJ7400 2001-008. [written in Japanese]
Inoue, A. (2004): Formation and Transformation of Clay Minerals under Saline, Alkaline Conditions −A
Review in Special Reference to Reactions of Bentonite and Cement Pore−, Journal of the Clay
Science Society of Japan, Vol. 43, No. 3, pp. 145-161. [written in Japanese]
IPSN (1992): CONTRIBUTION TECHNIQUE A LA DEFINITION DES SEUIL D’ AUTORISATION
POUR L’ EVACUATION SANS CONDITION DES DECHETS SOLIDES ET DES DECHETS
LIQUIDES CONDITIONNES, IPSN SERGD/92/22.
Iriya, K., Kubo, H., Fukaya, Y. and Fujita, H. (1999): The Study on Degradation of Engineered Barrier in
Radioactive Waste Repositories (III), Japan Nuclear Cycle Development Institute, JNC TJ8400
99-007. [written in Japanese]
Iriya, K., Kubo, H., Kato, T. and Fujita, H. (2000): The Study on Degradation of Engineered Barrier in
Radioactive Waste Repositories and Effect of Nitrate and Leaching Solutions, Japan Nuclear Cycle
Development Institute, JNC TJ8400 2000-034, p. 71. [written in Japanese]
Ito, H. and Mihara, M. (2005): A Study on Changes in Hydraulic Conductivity of Saturated
Bentonite-based Materials, Japan Nuclear Cycle Development Institute, JNC TN8400 2005-029.
[written in Japanese]
Ito, M., Okamoto, M., Shibata, M., Sasaki, Y., Danhara, T., Suzuki, K. and Watanabe, T. (1993): Bentonite
Mineral Composition Analysis, Power Reactor and Nuclear Fuel Development Corporation, PNC
TN8430 93-003. [written in Japanese]
Iwaida, T., Nagasaki, S. and Tanaka, S. (1999): Colloid Generation in Cement-Water System, Journal of
Nuclear Fuel Cycle and Environment, Vol. 6, No. 1, pp. 83-90. [written in Japanese]
JAERI (2004): Hoshasei-Haikibutsu Shobun no Chokiteki Hyoka Shuho no Chosa Hokokusho (in
Japanese) (The Investigation Report on Long-Term Evaluation Method for Radioactive Waste
Disposal, translated by JAEA), Japan Atomic Energy Research Institute. [written in Japanese]
Japan Cement Association (1993): Wakariyasui Semento Kagaku (in Japanese) (Easily Comprehensible

4-243
Cement Science, translated by JAEA), p. 93. [written in Japanese]
Japan Concrete Admixture Association (2003): Koseino AE Gensuizai ni tsuite (in Japanese) (On Air
Entraining and High-range Water Reducing Agent, translated by JAEA), JCAA Homepage
(http://www.moon.sphere.ne.jp/jcaa/good_concrete/high_ae_gensui/index.html).
Japan Geotechnical Consultants Association (2004): Zenkoku Hyojun Sekisan Shiryo Doshitsu Chosa,
Chishitsu Chosa (in Japanese) (The Standard Cost Estimation of Soil and Geological Investigation
in Japan, translated by JAEA), H15 Kaitei Hokake-ban. [written in Japanese]
Japan Society of Civil Engineers (2003): Concrete Engineering Series 53, Konkurito no Kagakuteki
Shinshoku, Yodatsu ni kansuru Kenkyuh no Genjo (in Japanese) (Current Status of the Study on
Chemical Degradation and Leaching of Concrete, translated by JAEA), pp. 18-20. [written in
Japanese]
JNC (2000): H12: Project to Establish the Scientific and Technical Basis for HLW Disposal in Japan,
Project Overview Report, Supporting Report 1, 2 and 3, Japan Nuclear Cycle Development
Institute, JNC TN1410 2000-001, -002, -003 and -004.
Kagaku-Daijiten Henshu Iinkai (1987): Encyclopaedia Chimica, Kyoritsu Shuppan. [written in Japanese]
Kalousek, G.L. (1954): Application of differential thermal analysis in a study of the system
lime-silica-water, Proc. 3rd Int. Symp. Chem. Cements, London, 296, 1954.
Kamei, G., Yusa, Y. and Sasaki, N. (1992): Natural analogue study on the long-term durability of bentonite
– Time, temperature condition and water chemistry on illitization at the Murakami deposit, Japan,
Mat. Res. Soc. Symp. Proc., Scientific Basis for Nuclear Waste Management XV, Vol. 257, pp.
505-512.
Kaneko, M., Kato, H., Sasoh, M., Tateyama, S., Murase, T., Tsukamoto, M. and Inatsugu, S. (2004): The
Effect of Nitrate on the Disposal of TRU Waste (2) −The Effect of Nitrate on the Alteration of
Cementitious Material−, 2004 Fall Meeting of the Atomic Energy Society of Japan (III), September,
2004, p. 676. [written in Japanese]
Kanno, T. and Matsumoto, K. (1997): Assessment of Outflow Characteristics of Bentonite Buffer Material
(I), Power Reactor and Nuclear Fuel Development Corporation, PNC TN8410 97-313. [written in
Japanese]
Kanno, T., Fukunaga, S., Tochigi, Y., Yui, M., Yoshikawa, H., Yoshida, Y., Aoki, K., Kudo, A., Kato, K.,
Nanba, K., Miyasaka, I. and Wang, Y. (2004): Simulation for Influence of Microbes on Geological
Disposal, Japan Nuclear Cycle Development Institute, JNC TW8404 2003-035. [written in
Japanese]
Karnland, O. and Pusch, R. (1995): Cementation Phenomena of Importance for the Performance of
Smectite Clay Buffers in HLW Repository, Radioactive Waste Management and Environmental
Remediation, ASME.
Karnland, O., Nilsson, U., Olsson, S. and Sellin, P. (2004): Experimental study on changes of bentonite
mineralogy and physical properties as a result of exposure to high pH solutions, Nuclear Waste
Management Organization of Japan, NUMO-TR-04-05.
4-244
Kato, H., Muroi, M., Yamada, N., Ishida, H. and Sato, H. (1995): Estimation of effective diffusivity in
compacted bentonite, Mat. Res. Soc. Symp. Proc., Scientific Basis for Nuclear Waste Management
XVIII, Vol. 353, 277-284.
Kato, H., Nakazawa, T., Ueta, S. and Yato, T. (1999): MEASUREMENTS OF EFFECTIVE
DIFFUSIVITIES OF TRITIATED WATER IN SAND-MIXED BENTONITE, Radioactive Waste
Management and Environmental Remediation, ASME.
Kato, H., Sato, M., Owada, H., Mihara, M. and Ooi, T. (2000): Effect of Leachate of Cementitious
Materials on the Geological Media −Experimental Study of the Influence of High pH Plume on
Rock−, Japan Nuclear Cycle Development Institute, JNC TN8430 2000-088. [written in Japanese]
Kato, T., Nakanishi, H., Inagaki, M., Honda, A. and Tsukamoto, M. (2005): An Estimation of
Microorganisms Impacts on Geological Disposal System for TRU Waste, Japan Nuclear Cycle
Development Institute, JNC TN8400 2005-022. [written in Japanese]
Kim, J.I. (1993): The chemical behavior of transuranium elements and barrier functions in natural aquifer
systems, Mat. Res. Soc. Symp. Proc., Scientific Basis for Nuclear Waste Management XVI, Vol.
294, pp. 3-21.
King, F., Quinn, M.J. and Miller, N.H. (1999): The effect of hydrogen and gamma radiation on the
oxidation of UO2 in 0.1 mol dm-3 NaCl solution, SKB Technical Report 99-27.
Konynenburg, V.R.A. (1995): Comments on the Draft Paper “Underground Supercriticality from
Plutonium and other Fissile Materials.” UCRL-ID-120990 COM.
Kotelnikova, S., Macario, A.J. and Pederson, K. (1998): Methanobacterium subterraneum sp. nov., a new
alkalipilic, eurythermic and halotolerant methanogen isolated from deep granitic groundwater, Int. J.
Syst. Bacterial., Vol. 48, 357-367.
Kurakata, K., Kojima, Y., Ishikwa, K. and Sudo, M. (1996): Haru-Kan Haikibutsu Senbetsu Shiken (2)
−Haru tou Haikibutsu Yukibutsu Jokyo Shiken− (in Japanese) (The Experiments for Development
of Hull waste –Separation of Organics from Spent Hull−, translated by JAEA), Power Reactor and
Nuclear Fuel Development Corporation, PNC ZN8410 1142 96-012, p. 9. [written in Japanese]
Kurosawa, S., Yui, M. and Yoshikawa, H. (1997): Experimental study of colloid filtration by compacted
bentonite, Mat. Res. Soc. Symp. Proc., Scientific Basis for Nuclear Waste Management XX, Vol.
465, pp. 963-970.
Kurosawa, S., Kato, H., Ueta, S., Yokoyama, K. and Fujihara, H. (1999a): Colloid filtration by
sand-bentonite buffer materials, Radioactive Waste Management and Environmental Remediation,
ASME, Nagoya, Japan, H-11.
Kurosawa, S., Kato, H., Ueta, S., Yokoyama, K. and Fujihara, H. (1999b): Erosion properties and
dipersion-flocculation behavior of bentonite particles, Mat. Res. Soc. Symp. Proc., Scientific Basis
for Nuclear Waste Management XXII, Vol. 556, pp. 679-686.
Kurosawa, S., Shibata, M., Ueta, S., Ichige, S. and Yui, M. (2002): Effect of Colloid Filtration by Bentonite
Barrier Altered in Alkalic Conditions, Japan Nuclear Cycle Development Institute, JNC TN8400
2002-13. [written in Japanese]
4-245
Lasaga, A.C. (1998): Kinetic theory in the earth sciences, Princeton university press.
Maekawa, K. (2002): Research on the Issues Related to Groundwater Chemistry Relevant to TRU Waste
Repository, Japan Nuclear Cycle Development Institute, JNC TJ8400 2002-055. [written in
Japanese]
Manaka, M., Kawasaki, M. and Honda, A. (2000): Measurements of the effective diffusion coefficient of
dissolved oxygen and oxidation rate of pyrite by dissolved oxygen in compacted sodium bentonite,
Nuclear Technology VOL. 130.
Masuda, K., Kato, T. and Honda, A. (2005): An Estimation of the Chemical Evolution of Nitrate due to the
Metal Corrosion and Microbiological Reaction, Japan Nuclear Cycle Development Institute, JNC
TN8400 2005-021. [written in Japanese]
Matsumoto, K. and Tanai, K. (2005): Extrusion and erosion of bentonite buffer (II) −Evaluation of
extrusion process of bentonite buffer in Horonobe groundwater (HDB-6)−, Japan Nuclear Cycle
Development Institute, JNC TN8400 2004-026. [written in Japanese]
Max, G. and Keiling, Ch. (1989): Investigation into the solubilities, sorption and migration behavior of AgI,
CsNO3, Na2U2O7, NpO2OH and Pu(OH)4 in near-field-systems, Mat. Res. Soc. Symp. Proc.,
Scientific Basis for Nuclear Waste Management XII, Vol. 127, pp. 855-862.
McCarthy, J.F. and Degueldre, C. (1993): in Buffle and H.P. van Leeuwen (ed.), Environmental particles,
Vol. 2, Lewis Publishers, Boca Raton, FL, Chapter 6.
McKinley, I.G. (1985): The Geochemistry of the Near-Field. Nagra Technical Report 84-48.
McKinley, I.G, Kawamura, H., Neall, F.B. and Ando, K. (2001): Repository design optimization for
long-lived ILW, Mat. Res. Soc. Symp. Proc., Scientific Basis for Nuclear Waste Management XXIV,
Vol. 663, pp. 843-850.
Metcalfe, R. and Walker, C. (2004): Proceedings of the International Workshop on Bentonite-Cement
Interaction in Repository Environments, Nuclear Waste Management Organization of Japan,
NUMO-TR-04-05.
Metz, V., Cama, J. and Ganor, J. (2002): Dependence of smectite dissolution rate on deviation from
equilibrium, Geochim. Cosmochim. Acta, 66/S1, A509.
Mihara, M., Ito, M., Kato, H. and Ueta, S. (1999): Effective Diffusion Coefficients of HTO, Cs, I and C in
Compacted Ca-bentonite, Japan Nuclear Cycle Development Institute, JNC TN8430 99-011.
[written in Japanese]
Mihara, M., Nishimura, T., Wada, R. and Honda, A. (2002): Estimation on Gas Generation and Corrosion
Rates of Carbon Steel, Stainless Steel and Zircaloy in Alkaline Solutions under Low Oxygen
Condition, Japan Nuclear Cycle Development Institute, JNC Technical Review, No. 15, pp. 91-101.
(JNC TN1340 2002-001) [written in Japanese]
Mihara, M., Osawa, T., Ooi, T., Fujita, H., Negishi, K., Yokoseki, K. and Watanabe, K. (2003): A Study on
Evolution of Long-Term Hydraulic Condition in Near-Field for TRU Waste Disposal System (6)
−Evolution and Changes of Hydraulic and Mechanical Properties of Cement Paste−, 2003 Fall
Meeting of the Atomic Energy Society of Japan (III), September, 2003, p. 580. [written in

4-246
Japanese]
Mihara, M. and Ooi, T. (2004): Development of TIGER Code for Radionuclide Transport in a
Geochemically Evolving Region, Japan Nuclear Cycle Development Institute, JNC Technical
Review, No. 22, pp. 27-38. [written in Japanese]
Mihara, M. and Sasaki, R. (2005): RAMDA; Radio-nuclides Migration Datasets (RAMDA) on cement,
bentonite and rock for TRU waste repository in Japan, Japan Nuclear Cycle Development Institute,
JNC TN8400 2005-027.
Miki, T., Oyamada, K. and Ikeda, T. (2003): Systematization and Sophistication of a Comprehensive
Performance Assessment Program, Japan Nuclear Cycle Development Institute, JNC TJ8400
2003-053. [written in Japanese]
Mine, T., Mihara, M., Ito, M. and Kato, H. (1997): Shuju no Semento-kei Zairyo ni taisuru Youso,
Seshiumu no Kyuchaku-Shiken (in Japanese) (Sorption Experiment of Iodine and Cesium for
Various Cementitious Materials, translated by JAEA), Power Reactor and Nuclear Fuel
Development Corporation, PNC TN8410 97-258. [written in Japanese]
Miyamoto, S., Sato, M. and Mihara, M. (2005): Dependence of Concentration of Ammonium Chloride on
Solubility of Nickel, Japan Nuclear Cycle Development Institute, JNC TN8400 2005-028. [written
in Japanese]
Moreno, L., Skagius, K., Södergren, S. and Wiborgh, M. (2001): Project Safe − Gas Related Processes in
SFR, SKB Report R-01-11.
Morooka, K., Mihara, M., Honda, A., Mukai, S., Sarah, B., Mark, C. and Steve, W. (2004): A Experimental
Study on the Effect of Nitrate on the Disposal TRU Waste (IV) −Distribution Coefficient for
Nuclides on Cementitious Materials and Tuff−, 2004 Annual Meeting of the Atomic Energy Society
of Japan (III), March, 2004, p. 851. [written in Japanese]
Motamedi, M. and Pedersen, K. (1998): Desulfovibrio aespoeensis sp. nov., a novel thermophlic,
hydrogen-oxidizing bacterium from a deep-sea hydrothermal vent chimney., Int. J. Syst. Bacterial.,
Vol. 48, pp. 311-315.
Müller, W., Morlock, G. and Kannen, H. (1992): Produktion und Verbreib von Gasen im Grubengebaude
eines salinaren Endlagers, GFS Report 3/92.
Murakami, Y., Iwatsuki, T. and Naganuma, T. (2003): Microbial Activity in the Subsurface Environment of
the Tono Area and its Relation to Groundwater Chemistry, Journal of Geography, Vol. 112, No. 2,
pp. 277-287. [written in Japanese]
Naganuma, T., Adachi, N., Fujita, Y., Tanimoto, D., Watanabe, F., Okamoto, T., Murakami, Y., Amano, K.,
Iwatsuki, T. and Hama, K. (2002): Potential Microbial Contribution to Nitrogen Cycling in the
Tono Subsurface, ABSTRACTS 2002 Japan Earth and Planetary Science Joint Meeting, B006-011.
[written in Japanese]
Nagao, S. (1995): Characteristics of Humic Substances and TRU-Humate Complexes in Groundwater,
Radioactive Waste Research, Vol. 1, No. 2, pp. 231-242. [written in Japanese]
Nagra (2002): Project Opalinus Clay, Safety Report, Demonstration of disposal feasibility for spent fuel,
4-247
vitrified high-level waste and long-lived intermediate-level waste (Entsorgungsnachweis), Nagra
NTB 02-05, p. B-17.
Nagy, K.L. and Lasaga, A.C. (1992): Dissolution and precipitation kinetics of gibbsite at 80°C and pH3:
The dependence on solution saturation state, Geochimica et Cosmochimica Acta, Vol. 56, pp.
3093-3111.
Nagy, K.L., Cygan, R.T., Hanchar, J.M. and Sturchio, N.C. (1999): Gibbsite growth kinetics on gibbsite,
kaolinite, and muscovite substrates: atomic force microscopy evidence for epitaxy and an
assessment of reactive surface area, Geochimica et Cosmochimica Acta, Vol. 63, No. 16, pp.
2337-2351.
Nakazawa, T., Kato, H., Murase, T., Tsukamoto, M. and Inatsugu, S. (2004): The Effect of Nitrate on the
Disposal of TRU Waste (3) −The Effect of Nitrate on the Alteration of Bentonite Material and
Rock−, 2004 Fall Meeting of the Atomic Energy Society of Japan (III), September, 2004, p. 677.
[written in Japanese]
NAS (1995): Technical Basis for Yucca Mountain Standards National Research Council, National
Academy Press, Washington, D.C.
Nirex (1997): The Gas Pathway, Nirex 97 –An Assessment of the Post-closure Performance of a Deep
Waste Repository at Sellafield, Volume 4, NIREX SCIENCE REPORT S/97/012.
Nishimura, T., Wada, R., Nishimoto, H., Fujiwara, K., Taniguchi, N. and Honda, A. (1999): The Effects of
Bacteria on the Corrosion Behavior of Carbon Steel in Compacted Bentonite, Japan Nuclear Cycle
Development Institute, JNC TN8400 99-077. [written in Japanese]
Nishimura, T., Wada, R. and Fujiwara, K. (2003): Evaluation of Gas Generation Rates Caused by Metal
Corrosion under the Geological Repository Conditions, Kobe Steel Engineering Reports, Vol. 53,
No. 3. [written in Japanese]
NSC (2004): Common Important Issues for Safety Regulations of Radioactive Waste, Special Committee
on Overall Nuclear Energy Safety, Nuclear Safety Commission of Japan. [written in Japanese]
NUMO (2002): Siting Factors for the Selection of Preliminary Investigation Areas, Information Package
for Open Solicitation of Volunteers for Areas to Explore the Feasibility of Constructing a Final
Repository for High-level Radioactive Waste, 3, Nuclear Waste Management Organization of Japan.
[written in Japanese]
Ochs, M., Lothenbach, B., Christl, Iso., Yui, M., Shibata, T. and Jintoku, T. (2003): Thermodynamic
database for NH3-species of radioactive elements, Japan Nuclear Cycle Development Institute, JNC
TN8400 2003-012.
Oda, C. and Shibata, M. (1999): Modelling and Experimental Studies on Bentonite−Water Interaction,
Japan Nuclear Cycle Development Institute, JNC TN8400 99-032. [written in Japanese]
Oda, C., Sasaki, R., Savage, D., Arthur, R.C. and Honda, A. (2005): Multiple Scenarios of Bentonite
Alteration, Japan Nuclear Cycle Development Institute, JNC TN8400 2005-020. [written in
Japanese]
OECD/NEA (1991): Review of Safety Assessment Methods, OECD/NEA Nuclear Energy Agency, Paris,
4-248
France.
OECD/NEA (1999): Scenario Development Methods and Practice –An Evaluation Based on the NEA
Workshop on Scenario Development, Madrid, Spain, May, 1999.
OECD/NEA (2000): Features, Events and Processes (FEPs) for Geological Disposal of Radioactive Waste
–An International Database–.
OECD/NEA (2001): Gas Generation and Migration in Radioactive Waste Disposal Safety-relevant Issues,
Workshop Proceedings, Raims, France, June, 26th-28th, 2001.
OECD/NEA (2004): POST-CLOSURE SAFETY CASE FOR GEOLOGICAL REPOSITORIES,
OECD/NEA Nuclear Energy Agency, Paris, France.
Oelkers, E.H. (2001): General kinetic description of multioxide silicate mineral and glass dissolution,
Geochimica et Cosmochimica Acta, Vol. 65, No. 21, pp. 3703-3719.
Okutsu, K., Morikawa, S., Hironaka, Y., Maeda, M., Shimbo, H., Kuroyanagi, M., Tabei, K., Sahara, F.,
Murakami, T. and Aoyama, Y. (2005): Study on the System Development for Evaluating Long-term
Alteration of Hydraulic Field in Near Field IV, Japan Nuclear Cycle Development Institute, JNC
TJ8400 2005-012. [written in Japanese]
Onishi, T., Machida, A., Tsuji, Y. and Hirata, Y. (1988): Tei-Nodo Ryusanen niyoru Chichu Konkurito no
Henshitsu Tokusei −Bisaina Hibiware wo Yusuru Kyoshitai no Shinseki Shiken Kekka− (in
Japanese) (The Degradation Behavior of Concrete Affected by Low Concentration of Sulfate −The
Results of Immersion Experiments of Micro-cracked samples−, translated by JAEA), H9 JSCE
Kantoshibu Gijutsu Kenkyuh Happyokai Koen-Gaiyoshu, Vol. 25, pp. 828-829. [written in
Japanese]
Ooi, T., Sone, T., Inagaki, M. and Mihara, M. (2004): Extraction of Successful Conditions for Safe
Geological Disposal of TRU Waste using a Panoramic Sensitivity Analysis Approach, Japan
Nuclear Cycle Development Institute, JNC Technical Review, No. 25, pp. 69-84. (JNC TN1340
2004-004) [written in Japanese]
Osawa, T., Honda, A., Negishi, K. and Fujita, H. (2004): A Study on the Effect of Nitrate on the Disposal
of TRU Waste (III) −Influence of Ammonia on Hydraulic and Mechanical Properties of Hardened
OPC Paste−, 2004 Annual Meeting of the Atomic Energy Society of Japan (III), March, 2004, p.
850. [written in Japanese]
Owada, H., Mihara, M., Kuroki, Y. and Arimoto, K. (2000): Degradation Studies on Granite in Alkaline
Solution, Japan Nuclear Cycle Development Institute, JNC TN8400 2000-027. [written in
Japanese]
Parks, P.B., Williamson, T.G. and Hyder, M.L. (1995): Consequences of the Bowman-Venneri Nuclear
Excursion Thesis on the Prospects for Placing Vitrified Plutonium Canisters in Geologic
Repositories. WSRC-TR-95-0036.
Plettinck, S., Chou, L. and Wollast, R. (1994): Kinetics and mechanisms of dissolution of silica at room
temperature and pressure, V.M. Goldschmidt Abstracts, Edinburgh, Mineralogical Magazine, Vol.
58A, pp. 728-729.

4-249
PNC (1992): Research and Development on the Geological Disposal of High-Level Radioactive Waste
(H3), Power Reactor and Nuclear Fuel Development Corporation, PNC TN 1410 92-081. [written
in Japanese]
PNC (1994): Current Status of Research and Development on Geological Disposal of High-level
Radioactive Waste, Power Reactor and Nuclear Fuel Development Corporation, PNC TN1410
94-094, p. 116. [written in Japanese]
Pruess, K. and Battistelli, A. (1999): TMVOC, A Numerical Simulator for Three-Phase Non-isothermal
Flows of Multicomponent Hydrocarbon Mixtures in Saturated-Unsaturated Heterogeneous Media,
Lawrence Berkeley National Laboratory, Berkeley, Report LBNL-49375.
Pusch, R. (1987): Piping and erosion phenomena in soft clay gels, SKB Technical Report 87-09.
Pusch, R., Karnland, O., Lajudie, A. and Decarreau, A. (1993): MX 80 clay exposed to high temperatures
and gamma radiation, SKB Technical Report 93-03.
Pyrak-Nolte, L.J., Myer, L.R., Cook, N.G.W. and Witherspoon, P.A. (1987): Hydraulic and mechanical
properties of natural fractures in low permeability rock, In Herger & Vongpaisal (ed.) The
proceedings of the Sixth International Congress on Rock Mechanics, Rotterdam, Balkema, pp.
225-233.
Rahman, M.M., Nagasaki, S. and Tanaka, S. (1999a): A Model for Dissolution of CaO-SiO2-H2O Gel at
Ca/Si>1, Cem. Concr. Res., 29, 1091-1097.
Rahman, M.M., Nagasaki, S. and Tanaka, S. (1999b): A Model for Dissolution of CaO-SiO2-H2O Gel at
Ca/Si<1 by Considering Disordered Structure, Mat. Res. Soc. Symp. Proc., Scientific Basis for
Nuclear Waste Management XXII, Vol. 556, pp. 1237-1244.
Ramsay, J.D.F. (1988): The role of colloids in the release of radionuclides from nuclear waste, Radiochim.
Acta, 44/45, 165-170.
Reardon, E.J. (1992): Problems and Approaches to the Prediction of the Chemical Composition in
Cement/Water System, Waste Management, 12, 2/3, 221-239.
Rochelle, C.A., Bateman, K., Milodowski, A.E., Noy, D.J., Pearce, J. and Savage, D. (1992): Reaction of
cement pore fluids with rock: Implications for the migration of radio nuclides, in Water−Rock
Interaction, Khara and Maest Eds., Balkema, Rotterdam, pp. 423-426.
Rodwell, W. and Norris, S. (2003): A Thematic Network on Gas Issues in Safety Assessment of Deep
Repositories for Nuclear Waste (GASNET), EUR 20620 EN.
RWMC (2001): Research on long-term performance evaluation technique for cement-based material (H12),
Radioactive Waste Management Funding and Research Center. [written in Japanese]
RWMC (2002): Confirmatory testing of highly-developed radioactive waste disposal system (H13) –Study
on the disposal system for relatively low-level radioactive waste–, Radioactive Waste Management
Funding and Research Center. [written in Japanese]
RWMC (2005): Verification tests on the long-term performance of engineered barriers (H16), Radioactive
Waste Management Funding and Research Center. [written in Japanese]
Ryan, J.N. and Elimelech, M. (1996): Colloid mobilization and transportation in groundwater, Colloids and
4-250
Surfaces A., 107, 1.
Saito, N. (1998): Mono-zukuri to Fukuzatsu-kei (in Japanese) (Complexity behind Manufacturing,
translated by JAEA), Kodansha. [written in Japanese]
Sasaki, R., Honda, A. and Oda, C. (2005): An Impact Statement of Secondary Mineral Assemblages and
Mineral Reaction Rates for the Long-term Alteration of the Buffer Material, Japan Nuclear Cycle
Development Institute, JNC TN8400 2005-024. [written in Japanese]
Sasamoto, H., Seo, T., Yui, M. and Sasaki, Y. (1996): Geochemical Investigation of Groundwater in the
Kamaishi In-Situ Test Site, Japan (1), Power Reactor and Nuclear Fuel Development Corporation,
PNC TN8410 96-203. [written in Japanese]
Saso, M., Tateyama, S., Kato, H., Kaneko, M., Murase, T., Tsukamoro, M. and Inatsugu, S. (2004): The
Effect of Nitrate on the Disposal of TRU Waste (4) −The Effect of Nitrate on Distribution
Coefficient for Cementitious Material and Rock−, 2004 Fall Meeting of the Atomic Energy Society
of Japan (III), September, 2004, p. 678. [written in Japanese]
Sato, H., Ashida, T., Kohara, Y., Yui, M., Umeki, H., Ishiguro, K. (1992): Effective Diffusion Coefficients
of Nuclides in Bentonite and Rock, Power Reactor and Nuclear Fuel Development Corporation,
PNC TN8410 92-164. [written in Japanese]
Sato, H., Shibutani, T., Tachi, Y., Ota, K., Amano, K. and Yui, M. (1997): Diffusion Behaviour of Nuclides
Considering Pathways in Fractured Crystalline Rocks, Power Reactor and Nuclear Fuel
Development Corporation, PNC TN8410 97-127.
Sato, H. (2002): Fundamental Study on Anisotropy of Diffusion and Migration Pathway in Compacted
Bentonite, Japan Nuclear Cycle Development Institute, JNC Technical Review, No. 16, pp. 125-136.
(JNC TN1340 2002-002) [written in Japanese]
Sato, T., Kuroda, M., Yokoyama, S., Tsutsui, M., Fukushi, K., Tanaka, T. and Nakayama, S. (2004):
Dissolution mechanism and kinetics of smectite under alkaline conditions, Nuclear Waste
Management Organization of Japan, NUMO-TR-04-05.
Savage, D., Bateman, K., Hill, P., Hughes, C., Milodowski, A., Pearce, J., Rae, E. and Rochelle, C.A.
(1992): Rate and mechanism of the reaction of silicates with cement pore fluids, Applied Clay
Science, 7.
Savage, D., Hughes, C., Milodowski, A.E., Bateman, K., Pearce, J.M., Rae, E. and Rochelle, C.A. (1998a):
The evolution of chemical mass transfer in the disturbed zone of a deep geological disposal facility
for radioactive wastes. I; Reaction of silicates with calcium hydroxide fluids, Safety Studies Nirex
Radioactive Waste Disposal, NSS/R244.
Savage, D., Bateman, K., Hill, P., Milodowski, A., Pearce, J., Rae, E. and Rochelle, C.A. (1998b): The
evolution of chemical mass transfer in the disturbed zone of a deep geological disposal facility for
radioactive wastes. II; Reaction of silicates with Na-K-Ca hydroxide fluids, Safety Studies Nirex
Radioactive Waste Disposal, NSS/R283.
Sawada, A., Ijiri, Y., Sakamoto, K. and Watari, S. (1999): Nuclide Migration Analysis in Fractured Rock,
Japan Nuclear Cycle Development Institute, JNC TN8400 99-093. [written in Japanese]
4-251
Sazarashi, M., Ikeda, Y., Takashima, Y. and Mine, T. (1999): A Study on Chemical Behaviour of Nitrate
under Reducing, 1999 Fall Meeting of the Atomic Energy Society of Japan (III), September, 1999,
p. 755. [written in Japanese]
Shibata, M., Haga, K., Sutou, S., Hironaga, M., Takahashi, M. and Tanaka, S. (2000): Effect of
Groundwater Composition on Hydraulic Permeability in Cement Hydrate, 2000 Fall Meeting of the
Atomic Energy Society of Japan (III), September, 2000, p. 682. [written in Japanese]
Shibata, M., Sasamoto, H., Jintoku, T. and Yui, M. (2004): Status of Assessment Technique for Long-term
Stability of Buffer Material, Japan Nuclear Cycle Development Institute, JNC TN8400 2004-010.
[written in Japanese]
Shibata, M., Mihara, M., Sasaki, R. and Honda, A. (2005): Effects of TBP and its Degradation Products
Contained in Asphalt Waste on the Nuclide Solubility and Speciation, Japan Nuclear Cycle
Development Institute, JNC TN8400 2005-025. [written in Japanese]
Shimura, S., Murase, T., Akasaka, H., Kato, K., Kato, H. and Saito, S. (1995): Study on Applicability of
Overseas Bentonites as Buffer Materials (2) −Evaluation of Effective and Apparent Diffusivity−,
1995 Annual Meeting of the Atomic Energy Society of Japan, March, 1995, p. 456. [written in
Japanese]
Shirakawa, T., Ijiri, Y., Nagasaka, K. and Matsumoto, M. (2000): Reliability Evaluation for Radionuclide
Transport Analysis Code MATRICS, Japan Nuclear Cycle Development Institute, JNC TN8400
2000-021. [written in Japanese]
Spitsyn, V.I., Balukova, B.D. and Savushkina, M.K. (1982): Influence of Irradiation with Gamma-Quanta
and Beam of Accelerated Electrons on the Sorption Parameters of Clay Minerals of the
Montmorillonite Group, Mat. Res. Soc. Symp. Proc., Scientific Basis for Nuclear Waste
Management, Vol. 6, pp. 703-707.
Stumm, W. and Morgen, J.J. (1996): Aquatic Chemistry −Chemical Equilibria and Rates in Natural Water−,
3rd Edition, John Wiley & Sons, New York.
Sugiyama, D., Fujita, T. and Nakanishi, K. (2001): Chemical Alteration of Cement Materials in a
Radioactive Waste Repository Environment (1) –Thermodynamic Modeling for the Dissolution and
Precipitation of Calcium Silicate Hydrates–, Central Research Institute of Electric Power Industry,
CRIEPI Report T01007. [written in Japanese]
Sunaryo, G.L., Katsumura, Y., Shirai, I., Hiroishi, D. and Ishigure, K. (1994): Radiolysis of Water at
Elevated Temperature II – Irradiation with γ-rays and Fast Neutrons up to 250°C, Radiat. Phys.
Chem., 44, 273-280.
Takai, K., Moser, D.P., Onstott, T.C. and Spoedrickson, J.K. (2001): Alkaliphilus transvaalensis gen. nov.,
sp. nov., an extremely alkaliphilic bacterium isolated from a deep South African gold mine, Int. J.
Syst. Evol. Microbiol., Vol. 51, pp. 1245-1256.
Takase, H., Inagaki, M. and Noguchi, T. (2002): Development of on-line performance assessment
environment, 2002 Annual Meeting of the Atomic Energy Society of Japan (III), March, 2002, p.
663. [written in Japanese]
4-252
Takei, A., Owada, H., Fujita, H. and Negishi, K. (2002): The Effect of Nitrates on the Alteration of
Cementitious Material, Japan Nuclear Cycle Development Institute, JNC TJ8400 2002-020.
[written in Japanese]
Takei, A., Owada, H., Fujita, H. and Negishi, K. (2003): The Effect of Nitrates on the Alteration of
Cementitious Material II, Japan Nuclear Cycle Development Institute, JNC TJ8400 2003-041.
[written in Japanese]
Tanai, K., Sato, H., Murakami, T. and Inoue, M. (1999): A Preliminary Assessment of Gas Diffusion and
Migration, Japan Nuclear Cycle Development Institute, JNC TN8400 99-045. [written in Japanese]
Tanai, K. and Yamamoto, M. (2003): Experimental and Modeling Studies on Gas Generation in Kunigel
V1 Bentonite, Japan Nuclear Cycle Development Institute, JNC TN8400 2003-024.
Taniguchi, N., Kawasaki, M. and Fujiwara, K. (2001): The Activity of Sulfate Reducing Bacteria in
Bentonite and the Effect of Hydrogen Sulfide on the Corrosion of Candidate Materials for
Overpacks, Japan Nuclear Cycle Development Institute, JNC TN8400 2001-011. [written in
Japanese]
Taniguchi, W., Hasegawa, H., Iwasa, K. and Sato, T. (1999): Fundamental Properties of Geoenvironment
for Design Study of Repository, Japan Nuclear Cycle Development Institute, JNC TN8400 99-053.
[written in Japanese]
Taylor, H.F.W. (1997): Cement Chemistry 2nd Edition, Thomas Telford.
The Association for the Geological Collaboration in Japan (ed.) (1996): Cyclopedia of Earth Sciences,
Heibonsha Limited, Publishers, Tokyo. [written in Japanese]
Torikai, Y., Sato, S. and Ohohashi, H. (1996): Thermodynamic Properties of Water in Compacted
Montmorillonite, Nuclear Technology, Vol. 115, pp. 73-80.
TRU Coordination Team (2000): Outline of TRU waste disposal, Federation of Electric Power Companies,
Japan Nuclear Cycle Development Institute, JNC TY1400 2000-001, TRU TR-2000-01. [written in
Japanese]
Ujike, I. (2002): 1st International Conference on Thaumasite in Cementitious Materials (BRE 2002),
Concrete Journal, Vol. 40, No. 12, pp. 45-48. [written in Japanese]
Van Loon, L.R. and Kopajtic, Z. (1990): Complexation of Cu2+, Ni2+, and UO22+ by Radiolytic
Degradation Products of Bitumen, PSI Bericht Nr. 66.
Villar, M.V. and Rivas, P. (1994): Hydraulic properties of montmorillonite-quartz and saponite-quartz
mixtures, Applied Clay Science, 9, pp. 1-9.
Wada, R., Nishimura, T., Masuda, K., Fujiwara, K., Imakita, T. and Tateishi, T. (2002): Research on the
Transformation of Nitrate due to Its Chemical Interaction with Metals in TRU Waste Disposal
Environment, Japan Nuclear Cycle Development Institute, JNC TJ8400 2003-076, p. 165. [written
in Japanese]
Wakasugi, K., Makino, H. and Robinson, P. (1999): The Development of MESHNOTE Code for
Radionuclide Migration in the Near Field, Japan Nuclear Cycle Development Institute, JNC
TN8400 99-095.
4-253
Wang, Y. and Papenguth, H.W. (1996): A multicomponent reactive transport model of early diagenesis:
Application to redocx cycling in coastal marine sediments, Geochimica et Cosmochimica Acta, Vol.
60, pp. 2993-3014.
Wetton, P.D., Pearce, J.M., Alexander, W.R., Milodowski, A.E., Reeder, S., Wragg, J. and Salameh, E.
(1998): Tohe production of colloids at the cement/host rock interface. Maqarin natural analogue
study: Phase III, Smellie, J.A.T. (ed.), SKB Technical Report 98-04.
Wieland, E. (2001): Experimental studies on the inventory of cement-derived colloids in the porewater of a
cementitious backfill material, Nagra Technical Report NTB01-02.
Wieland, E. and Van Loon, L.R. (2003): Cementitious Near-Field Sorption Data Base for Performance
Assessment of an ILW Repository in Opalinus Clay, PSI Bericht Nr. 03-06.
Wilding, C.R., Berghman, K., Donato, A. and Glasser, F.P. (1991): Effects of Radiolysis, Radiation
Damage and Waste/Matrix Interaction, European Community Conference on Radioactive Waste
Management and Disposal (3rd) Luxembourg.
Wolery, T.J. (1992): EQ3/6, a software package for geochemical modelling of aqueous systems: Package
overview and installation guide (Version 7.0): UCRL-MA-110662-PT-I, Lawrence Livermore
National Laboratory, Livermore, California.
Yamada, K., Murase, Y. and Yokota, N. (1984): γ-Shosha ga Konkurito no Sho-Bussei ni Oyobosu Eikyo ni
kansuru Kenkyuh (in Japanese) (The Effect of γ-Irradiation on Physical Properties of Concrete,
translated by JAEA), Semento-Gijutsu-Nenpo 38. [written in Japanese]
Yamada, N., Takase, T., Ooma, T. and Kumano, Y. (2005): Trace Analysis of Alteration Tests of Bentonite
and Cement, 2005 Annual Meeting of the Atomic Energy Society of Japan (III), March, 2005, p.
659. [written in Japanese]
Yamaguchi, T., Tanuma, S., Yasutomi, I., Nakayama, T., Tanabe, H., Katsurai, K., Kawamura, W. and
Maeda, K. (1999): A STUDY ON CHEMICAL FORMS AND MIGRATION BEHAVIOR OF
RADIONUCLIDES IN HULL WASTES, Radioactive Waste Management and Environmental
Remediation, ASME 1999, CD-ROM.
Yamamoto, M., Murakami, T., Kuchimura, K., Mori, R., Shoji, Y. and Mihara, M. (1999): Gas migration
properties of engineered barriers: gas injection test of compacted sand bentonite mixture and two
phase flow simulation, ICEM ’99, Nagoya, Japan.
Yamamoto, M., Seki, Y. and Mori, R. (2000): Gas Migration in the Engineered Barrier System (V), Japan
Nuclear Cycle Development Institute, JNC TJ8400 2000-032. [written in Japanese]
Yamamoto, M., Mihara, M. and Ooi, T. (2004): An assessment of gas impact on geological repository
−Methodology and material property of gas migration analysis in engineered barrier system−,
Journal of Nuclear Fuel Cycle and Environment, Vol. 10, No. 1-2, pp. 31-45. [written in Japanese]
Yasuda, K., Yokoseki, K., Kawata, Y. and Yoshizawa, Y. (2002): Physical and Transportation Properties of
Concrete due to Calcium Leaching, Cement Science and Concrete Technology, No. 56, pp. 492-498.
[written in Japanese]
Yim, M., Simonson, S.A. and Sullivan, T.M. (1996): Investigation of 14C release in an engineered
4-254
low-level waste disposal facility, Nuclear Technology, 114, 254-271.
Yoshida, N. and Yamada, K. (2005): Thaumasite Form of Sulfate Attack −A Review of the Deterioration
Mechanism and the Evaluating Method of Risk−, Concrete Journal, Vol. 43, No. 6, pp. 20-27.
[written in Japanese]
Yoshida, Y. and Shibata, M. (2005): Establishment of Data Base Files of Thermodynamic Data Developed
by OECD/NEA Part II −Thermodynamic data of Tc, U, Np, Pu and Am with auxiliary species−,
Japan Nuclear Cycle Development Institute, JNC TN8400 2004-025. [written in Japanese]
Yui, M., Sasamoto, H. and Arthur, R.C. (1999a): Groundwater evolution modeling for the 2nd progress
performance assessment (PA) report, Japan Nuclear Cycle Development Institute, JNC TN8400
99-030.
Yui, M., Azuma, J. and Shibata, M. (1999b): JNC Thermodynamic Database for Performance Assessment
of High-level Radioactive Waste Disposal System, Japan Nuclear Cycle Development Institute,
JNC TN8400 99-070.