Embed Size (px)
Citation preview
Chapter 4
Feedstocks and Feedstock Characteristics
4.1 COALS AND COKE
Approximately 2250 MMtoe/y of coal is consumed each year (BP 2002). Of this about 35 MMt/y is gasified to produce 150 million Nm3/d of synthesis gas (Simbeck and Johnson 2001). Roughly half of this gas is generated in the Sasol synfuels plants in South Africa where the synthesis gas is used for the production of liquid hydrocarbons and other chemicals. Most of the remainder of this gas is used for ammonia production and--in China--for the production of town gas.
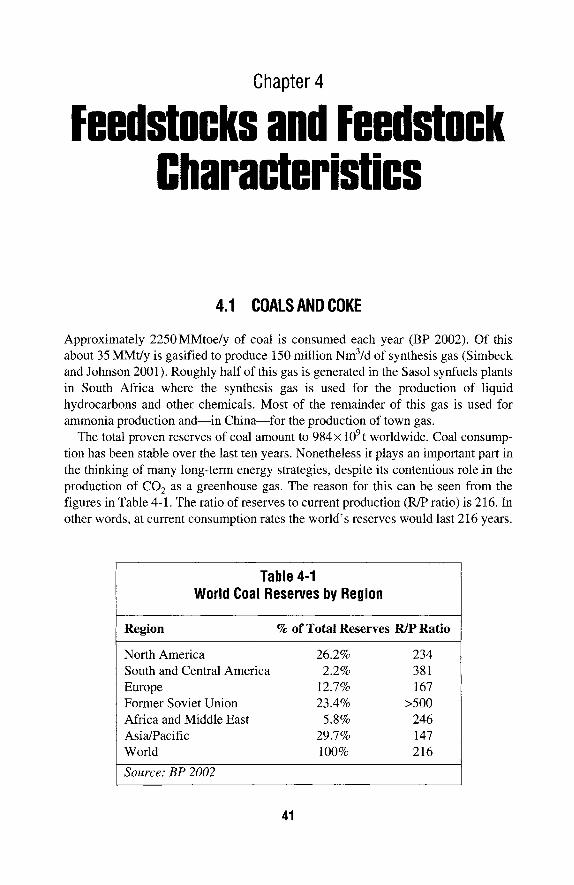
The total proven reserves of coal amount to 984 x 109t worldwide. Coal consump- tion has been stable over the last ten years. Nonetheless it plays an important part in the thinking of many long-term energy strategies, despite its contentious role in the production of CO 2 as a greenhouse gas. The reason for this can be seen from the figures in Table 4-1. The ratio of reserves to current production (R/P ratio) is 216. In other words, at current consumption rates the world's reserves would last 216 years.
Table 4-1 World Coal Reserves by Region
Region % of Total Reserves R/P Ratio
North America 26.2% 234 South and Central America 2.2% 381 Europe 12.7% 167 Former Soviet Union 23.4% >500 Africa and Middle East 5.8% 246 Asia/Pacific 29.7% 147 World 100% 216
Source: BP 2002
41
42 Gasification
Compare this with 62 years for natural gas and 40 years for oil. Furthermore the reserves are more evenly distributed than oil (65% of reserves in the Middle East) or natural gas (72% in the Middle East and Russia).
The composition of coals is very complex, and the types of coal differ considerably. The detailed petrographic composition of the organic part of coals, often characterized by a so-called maceral analysis, has little influence on most gasification processes, and the interested reader is referred to the many treatises on this subject (e.g., Speight 1983; Smoot and Smith 1985; and Kural 1994). Important for gasification are the age of the coal, its caking properties, its water content, and its ash properties.
4.1.1 Formation of Coal
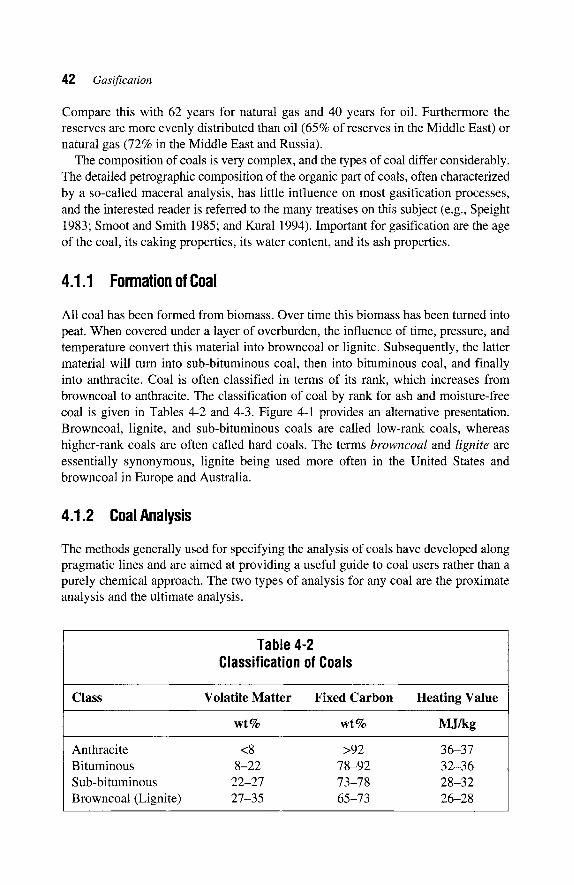
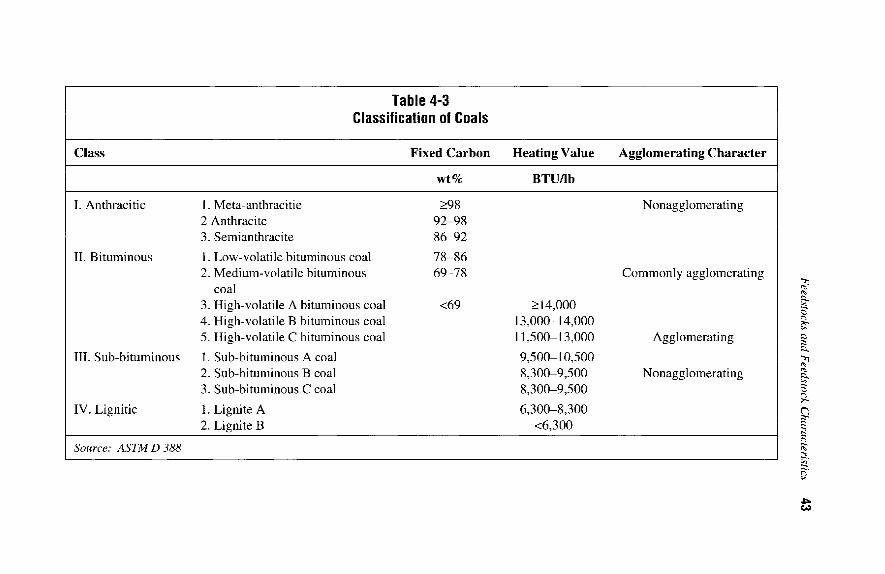
All coal has been formed from biomass. Over time this biomass has been turned into peat. When covered under a layer of overburden, the influence of time, pressure, and temperature convert this material into browncoal or lignite. Subsequently, the latter material will turn into sub-bituminous coal, then into bituminous coal, and finally into anthracite. Coal is often classified in terms of its rank, which increases from browncoal to anthracite. The classification of coal by rank for ash and moisture-free coal is given in Tables 4-2 and 4-3. Figure 4-1 provides an alternative presentation. Browncoal, lignite, and sub-bituminous coals are called low-rank coals, whereas higher-rank coals are often called hard coals. The terms browncoal and lignite are essentially synonymous, lignite being used more often in the United States and browncoal in Europe and Australia.
4.1.2 Coal Analysis
The methods generally used for specifying the analysis of coals have developed along pragmatic lines and are aimed at providing a useful guide to coal users rather than a purely chemical approach. The two types of analysis for any coal are the proximate analysis and the ultimate analysis.
Table 4-2 Classification of Coals
Class Volatile Matter Fixed Carbon Heating Value
wt% wt% MJ/kg
Anthracite <8 >92 36-37 B ituminou s 8-22 78-92 32-36 Sub-bituminous 22-27 73-78 28-32 Browncoal (Lignite) 27-35 65-73 26-28
Feedstocks and F
eedstock Characteristics
4~
*J
,l
m
,MN
m
~
0 I,.4
.m
n
G~
�9
�9
Z
�9
�9
�9
o
<
o Z
--'~
0 0
~ 0
0 0
oo
oR
,,0
o
o
~$
~
v �9 �9
�9
�9 =
I =
I =
I I=I
0 0
�9 o~
~
~
~-~
, =
,> ,>
,> ~:~
~
~ ~
e4 ,.-.;t--,i
~4 ~
~ -:
e,,i~4 -;e
,,i
�9
�9 ~ �9
=I
44 Gasification
1 0 0 %
90%
8 0 %
70%
6 0 %
50%
40%
30%
20%
1 0 %
0%
[ ] Moisture
[ ] Volat i le matter
[ ] Fixed carbon
/
_~'
CO
0 .~_ E
.(3
0
0 _1
I
O
O t~ t -
t-" t~
E O3
!
O t~ r -
e"
<_..
|
r
t~ t--
t-- t~
|
t~ r
40.0
35.0
30.0
25.0
20.0
>
1 5 . 0
10.0
5.0
0.0
o
O .c_ E
o3
-7 i I
1:13 Or)
O .c_ E
Or)
O C
E
(D
O >
..C
"-!-
cQ r J)
O
E
_.m
O >
O
< U)
O r -
E
O >
-1--
(D
O >
E
~E
U)
O r
E
O
,.z-, i f -
> !. m _
_.J Lr./~
q I ! ! !
(1)
r.)
~-c:i
i<
I
i
O . _
O z,..
(.-
,,z-, Q) J
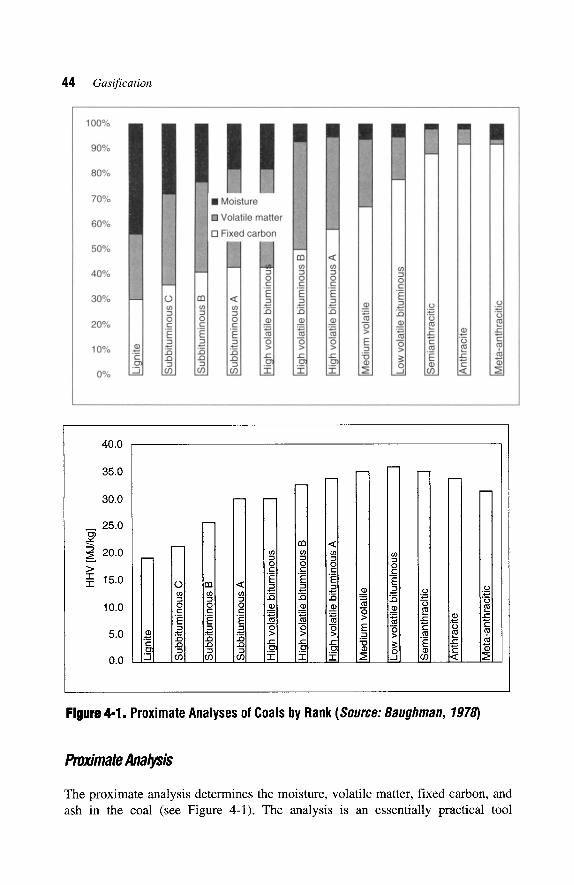
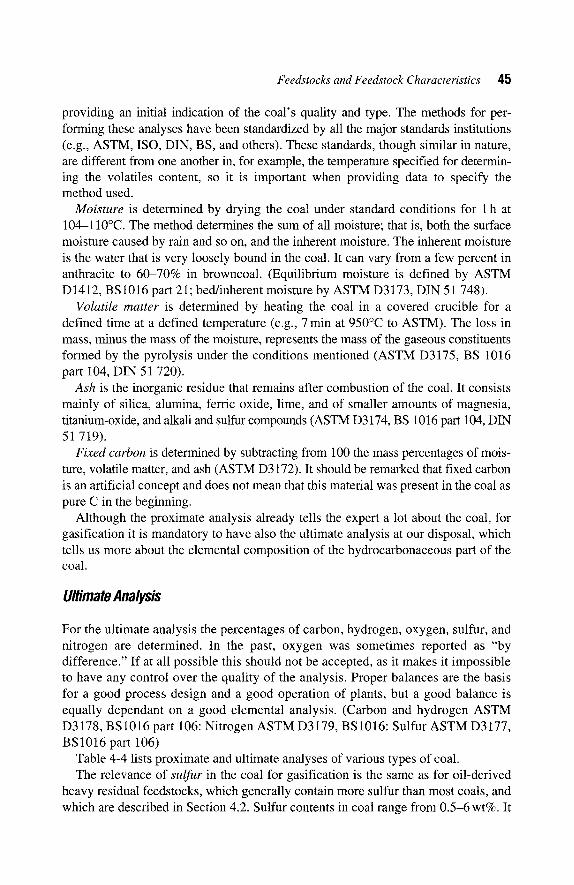
Figure 4-1, Proximate Analyses of Coals by Rank (Source: Baughman, 1978)
Proximate Analysis
The proximate analysis determines the moisture, volatile matter, fixed carbon, and ash in the coal (see Figure 4-1). The analysis is an essentially practical tool
Feedstocks and Feedstock Characteristics 45
providing an initial indication of the coal's quality and type. The methods for per- forming these analyses have been standardized by all the major standards institutions (e.g., ASTM, ISO, DIN, BS, and others). These standards, though similar in nature, are different from one another in, for example, the temperature specified for determin- ing the volatiles content, so it is important when providing data to specify the method used.
Moisture is determined by drying the coal under standard conditions for 1 h at 104-110~ The method determines the sum of all moisture; that is, both the surface moisture caused by rain and so on, and the inherent moisture. The inherent moisture is the water that is very loosely bound in the coal. It can vary from a few percent in anthracite to 60-70% in browncoal. (Equilibrium moisture is defined by ASTM D1412, BS1016 part 21; bed/inherent moisture by ASTM D3173, DIN 51 748).
Volatile matter is determined by heating the coal in a covered crucible for a defined time at a defined temperature (e.g., 7 min at 950~ to ASTM). The loss in mass, minus the mass of the moisture, represents the mass of the gaseous constituents formed by the pyrolysis under the conditions mentioned (ASTM D3175, BS 1016 part 104, DIN 51 720).
Ash is the inorganic residue that remains after combustion of the coal. It consists mainly of silica, alumina, ferric oxide, lime, and of smaller amounts of magnesia, titanium-oxide, and alkali and sulfur compounds (ASTM D3174, BS 1016 part 104, DIN 51 719).
Fixed carbon is determined by subtracting from 100 the mass percentages of mois- ture, volatile matter, and ash (ASTM D3172). It should be remarked that fixed carbon is an artificial concept and does not mean that this material was present in the coal as pure C in the beginning.
Although the proximate analysis already tells the expert a lot about the coal, for gasification it is mandatory to have also the ultimate analysis at our disposal, which tells us more about the elemental composition of the hydrocarbonaceous part of the coal.
Ultimate Analysis
For the ultimate analysis the percentages of carbon, hydrogen, oxygen, sulfur, and nitrogen are determined. In the past, oxygen was sometimes reported as "by difference." If at all possible this should not be accepted, as it makes it impossible to have any control over the quality of the analysis. Proper balances are the basis for a good process design and a good operation of plants, but a good balance is equally dependant on a good elemental analysis. (Carbon and hydrogen ASTM D3178, BS 1016 part 106: Nitrogen ASTM D3179, BS 1016: Sulfur ASTM D3177, BS1016 part 106)
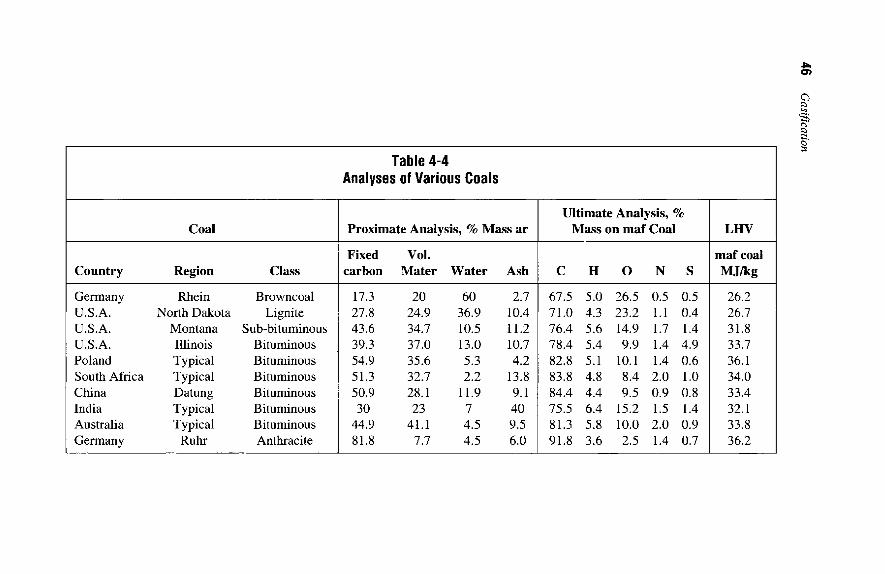
Table 4-4 lists proximate and ultimate analyses of various types of coal. The relevance of sulfur in the coal for gasification is the same as for oil-derived
heavy residual feedstocks, which generally contain more sulfur than most coals, and which are described in Section 4.2. Sulfur contents in coal range from 0.5-6 wt%. It
46 G
asification
t~
0 0
m t~
r~
Z
0
t'q
~,,I ce~
cc~ cc~
cc) cc3
ce'~ cQ
cr
c5
c5
.-;~ic
5,-;c
5,-;c
5c
5
o,-;,-;.-;~
eq
cS
-;eq
,-;
~5
~i~
c5
~5
~c
5e
q
~, ~
d~o~
i~~
~
~
r
,.....~ ~,,,i
,,~'.. r
tt3 tt3
q-~ ,,~..
~
6 ~
~z~
=~
. ~
~,~
~
Z
o
Feedstocks and Feedstock Characteristics 47
may be present in coal in three forms: pyritic sulfur, inorganic sulfates, and as sulfur in organic compounds. These three forms of sulfur can be determined using ASTM D 2492. In coals with a high sulfur content, most of the sulfur is generally present in the form of pyrite. Note that the quantity of pyritic sulfur is an indicator for the potential abrasiveness of the coal.
The nitrogen content in coals ranges from 0.5-2.5 wt%. Only part of the nitrogen in the coal is converted into ammonia and HCN upon gasification, whereas the remain- der is converted into elemental nitrogen. The presence of the coal-derived nitrogen in the product gas is one reason why it is not always essential to gasify coal with very pure oxygen (>99mo1%), even when the gas is used for the production of syngas or hydrogen. The percentage of the nitrogen in the coal that is converted into elemental nitrogen upon gasification will depend on the type of nitrogen compounds in the coal.
4.1.3 Other Minerals in Coal
Beyond the elements described above, which are provided with every ultimate analy- sis of coal, it will be found that a substantial part of the periodic table can be shown to be present in coals. These other elements can be divided into macro components, the presence of which is usually given in wt%, and the micro or trace elements that are only present at ppm levels. Values from a sample coal within the typical range are given later in Table 4-7.
The chlorine content in coal is mostly well below 1 wt%. However, in some coals it may be as high as 2.5 wt%. In combination with a low nitrogen content in the coal, this will result in a high caustic consumption in the wash section of a gasifier.
Chlorides have three possible detrimental effects in the plant:
1. Chlorides have a melting point in the range 350-800~ they deposit in the syngas cooler and foul the exchanger surface. The first indication of this is an increase in the syngas cooler outlet temperature.
2. In the reactor chlorides can react with the hydrogen present to form HC1, which will decrease the pH of the wash water or condensate.
3. Chlorides may also form NH4C1 with high nitrogen feeds. With such feedstocks the chloride deposits as NH4C1 in the economizers at temperatures below about 280~ Further, as an aqueous solution this leads to severe chloride stress corrosion in stainless steels that are used, for example, in burners and instrument lines.
Coals also contain phosphorus, but this has less significance for gasification than, for instance, for the steel industry.
Basis of Reporting Analyses
It is important for the users of the analytical data of coal to be able to convert various types of analysis into each other. Apart from the difference in units used that can
48 Gasification
readily be transferred into each other, there are problems associated with the basis for the analysis. The proximate analysis and the ultimate analysis may be given based on the so-called as-received (ar) coal; that is, the coal including moisture and ash. When doing so it is also important to record whether the sample was taken direct from storage or air dried before analysis, since the difference between total and inher- ent moisture cannot be determined. But it is also possible to get these analyses on a moisture-and-ash-free (maf) basis, a moisture-free (mf) basis, or an ash-free (af) basis. Furthermore, the heating value may be the higher heating value (HHV) or the lower heating value (LHV). In relation to the latter it should be kept in mind that the HHV of steam and water are positive and zero, respectively, and that the LHV of steam and water are zero and negative, respectively. A program is included on the companion website to convert given data for proximate and ultimate analysis as well as for the heating value on any basis (ar, af, mf, maf, and HHV or LHV) into any other basis.
4.1.4 Other Properties
Heating Value
The heating value is obtained by combustion of the sample in a calorimeter. If not available, the heating value can be calculated with, for example, the Dulong formula (Perry and Chilton 1973, p. 9-4) from the ultimate analyses:
HHV in MJ/kg = 33.86"C + 144.4"(H- O/8) + 9.428"S
where C, H, O, and S are the mass fractions of the elements obtained from the ulti- mate analysis. There are other formulae for calculating the heating value from the ulti- mate and/or proximate analyses (e.g., Channiwala and Parikh 2002):
HHV in MJ/kg= 34.91"C+ 117.83"H- 10.34"O- 1.51*N+ 10.05"S- 2.1 l ' A s h
It is always useful to calculate the heating value from these analyses, as it is a good crosscheck on measured values, ff the deviation is more than a few percent, all analyses must be checked.
Caking and Swelling Properties
Another important property of a coal is the swelling index. The swelling index is determined by heating a defined sample of coal for a specified time and temperature, and comparing the size and shape taken by the sample with a defined scale. There are a number of different scales defined in, for example, ASTM D 720-91, BS 1016 (Gray- King method), or ISO 335 (Roga method). The swelling index is an indicator for the caking properties of a coal and its expansion on heating. Softening/caking does not occur at a precise temperature but over a temperature range. It is an important variable
Feedstocks and Feedstock Characteristics 49
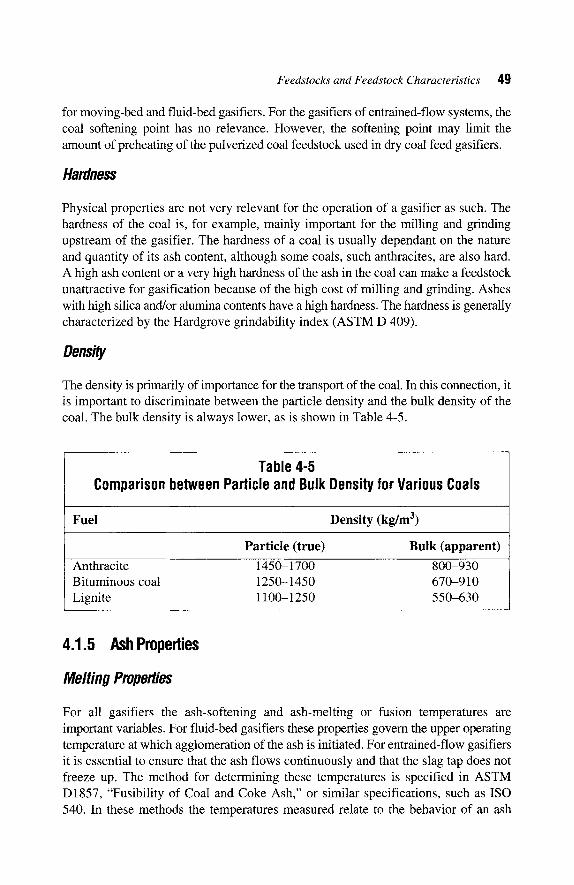
for moving-bed and fluid-bed gasifiers. For the gasifiers of entrained-flow systems, the coal softening point has no relevance. However, the softening point may limit the amount of preheating of the pulverized coal feedstock used in dry coal feed gasifiers.
Hardness
Physical properties are not very relevant for the operation of a gasifier as such. The hardness of the coal is, for example, mainly important for the milling and grinding upstream of the gasifier. The hardness of a coal is usually dependant on the nature and quantity of its ash content, although some coals, such anthracites, are also hard. A high ash content or a very high hardness of the ash in the coal can make a feedstock unattractive for gasification because of the high cost of milling and grinding. Ashes with high silica and/or alumina contents have a high hardness. The hardness is generally characterized by the Hardgrove grindability index (ASTM D 409).
Density
The density is primarily of importance for the transport of the coal. In this connection, it is important to discriminate between the particle density and the bulk density of the coal. The bulk density is always lower, as is shown in Table 4-5.
Table 4-5 Comparison between Particle and Bulk Density for Various Coals
Fuel Density (kg/m 3)
Particle (true) Bulk (apparent) Anthracite 1450-1700 800-930 Bituminous coal 1250-1450 670-910 Lignite 1100-1250 550-630
4.1.5 Ash Properties
Melting Properties
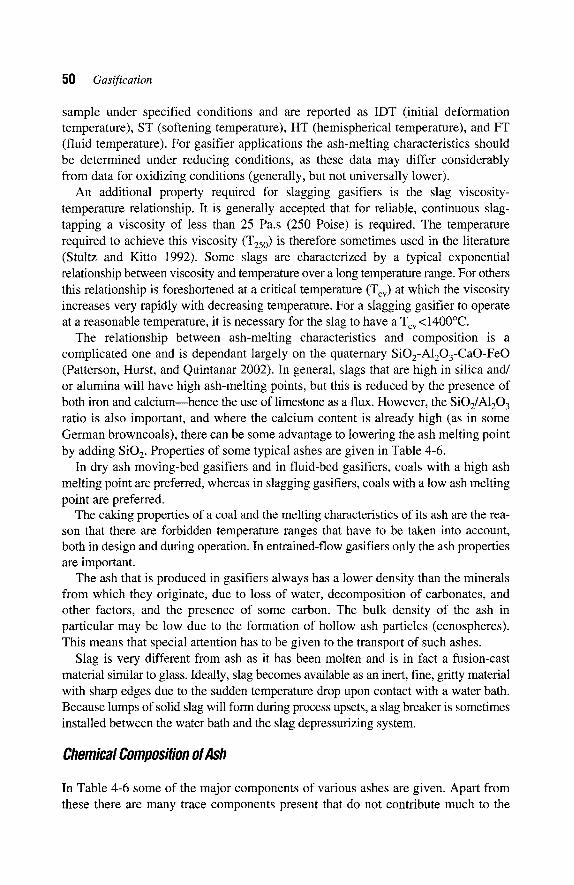
For all gasifiers the ash-softening and ash-melting or fusion temperatures are important variables. For fluid-bed gasifiers these properties govern the upper operating temperature at which agglomeration of the ash is initiated. For entrained-flow gasifiers it is essential to ensure that the ash flows continuously and that the slag tap does not freeze up. The method for determining these temperatures is specifed in ASTM D1857, "Fusibility of Coal and Coke Ash," or similar specifications, such as ISO 540. In these methods the temperatures measured relate to the behavior of an ash
50 Gasification
sample under specified conditions and are reported as IDT (initial deformation temperature), ST (softening temperature), HT (hemispherical temperature), and FT (fluid temperature). For gasifier applications the ash-melting characteristics should be determined under reducing conditions, as these data may differ considerably from data for oxidizing conditions (generally, but not universally lower).
An additional property required for slagging gasifiers is the slag viscosity- temperature relationship. It is generally accepted that for reliable, continuous slag- tapping a viscosity of less than 25 Pa.s (250 Poise) is required. The temperature required to achieve this viscosity (T250) is therefore sometimes used in the literature (Stultz and Kitto 1992). Some slags are characterized by a typical exponential relationship between viscosity and temperature over a long temperature range. For others this relationship is foreshortened at a critical temperature (Tcv) at which the viscosity increases very rapidly with decreasing temperature. For a slagging gasifier to operate at a reasonable temperature, it is necessary for the slag to have a Tcv <1400~
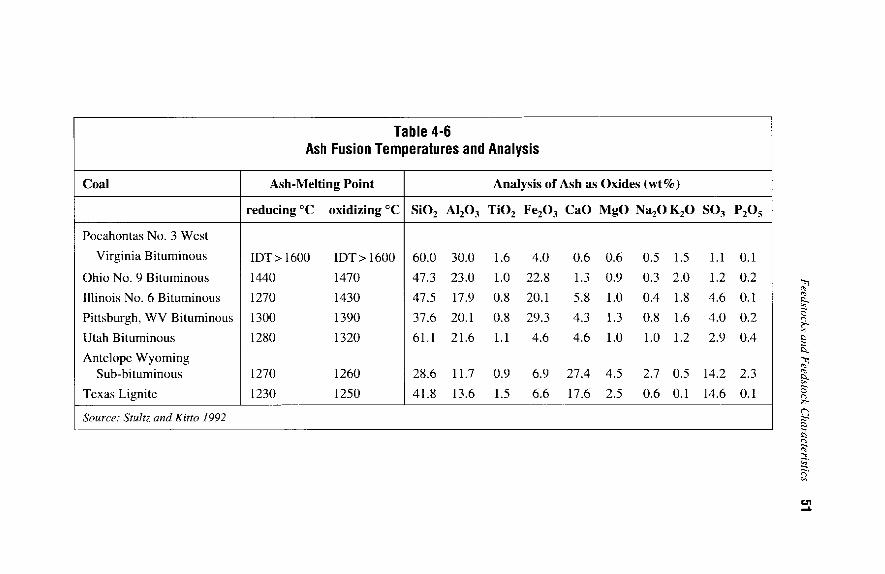
The relationship between ash-melting characteristics and composition is a complicated one and is dependant largely on the quaternary SiO2-AlzO3-CaO-FeO (Patterson, Hurst, and Quintanar 2002). In general, slags that are high in silica and/ or alumina will have high ash-melting points, but this is reduced by the presence of both iron and calciummhence the use of limestone as a flux. However, the SiO2/AI20 3 ratio is also important, and where the calcium content is already high (as in some German browncoals), there can be some advantage to lowering the ash melting point by adding SiO 2. Properties of some typical ashes are given in Table 4-6.
In dry ash moving-bed gasifiers and in fluid-bed gasifiers, coals with a high ash melting point are preferred, whereas in slagging gasifiers, coals with a low ash melting point are preferred.
The caking properties of a coal and the melting characteristics of its ash are the rea- son that there are forbidden temperature ranges that have to be taken into account, both in design and during operation. In entrained-flow gasifiers only the ash properties are important.
The ash that is produced in gasifiers always has a lower density than the minerals from which they originate, due to loss of water, decomposition of carbonates, and other factors, and the presence of some carbon. The bulk density of the ash in particular may be low due to the formation of hollow ash particles (cenospheres). This means that special attention has to be given to the transport of such ashes.
Slag is very different from ash as it has been molten and is in fact a fusion-cast material similar to glass. Ideally, slag becomes available as an inert, fine, gritty material with sharp edges due to the sudden temperature drop upon contact with a water bath. Because lumps of solid slag will form during process upsets, a slag breaker is sometimes installed between the water bath and the slag depressurizing system.
Chemical Composition of Ash
In Table 4-6 some of the major components of various ashes are given. Apart from these there are many trace components present that do not contribute much to the
Feedstocks and F
eedstock Characteristics
~1
~ d
d d
d d
~,i d
~ e
~ ~
d d
d d
,--: t,-,i
d ~
Z ~I~
.
..
..
N
o
d-
--
~
m
"N
~. m
m
m
m
"-' r
eq
.~
[..
~ m
o
�9 ~
~
A
o o
o o
o o
,~ -
o ~ r
~
r.,r
52 Gasification
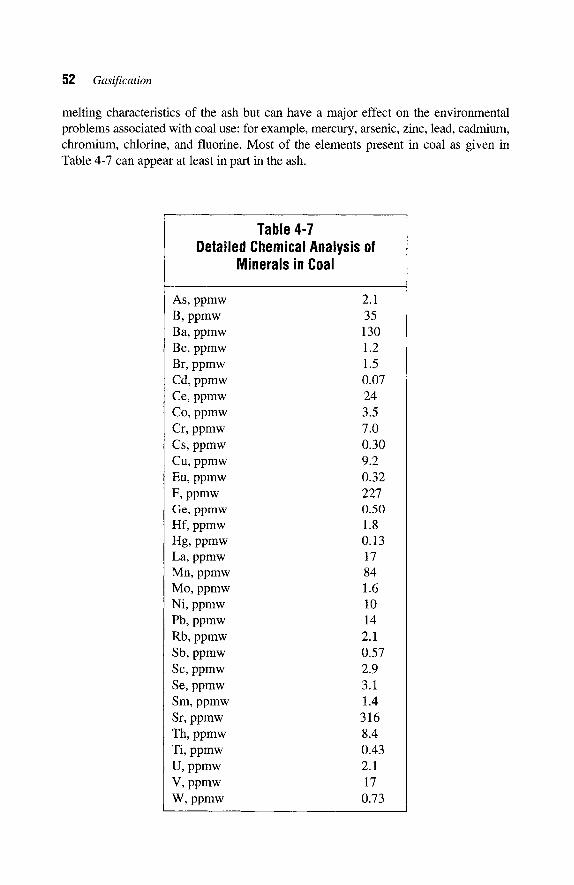
melting characteristics of the ash but can have a major effect on the environmental problems associated with coal use: for example, mercury, arsenic, zinc, lead, cadmium, chromium, chlorine, and fluorine. Most of the elements present in coal as given in Table 4-7 can appear at least in part in the ash.
Table 4-7 Detailed Chemical Analysis of
Minerals in Coal
As, ppmw B, ppmw Ba, ppmw Be, ppmw Br, ppmw Cd, ppmw Ce, ppmw Co, ppmw Cr, ppmw Cs, ppmw Cu, ppmw Eu, ppmw F, ppmw Ge, ppmw Hf, ppmw Hg, ppmw La, ppmw Mn, ppmw Mo, ppmw Ni, ppmw Pb, ppmw Rb, ppmw Sb, ppmw Sc, ppmw Se, ppmw Sm, ppmw Sr, ppmw Th, ppmw Ti, ppmw U, ppmw V, ppmw W, ppmw
2.1 35 130 1.2 1.5 0.07 24 3.5 7.0 0.30 9.2 0.32 227 0.50 1.8 0.13 17 84 1.6 10 14 2.1 0.57 2.9 3.1 1.4 316 8.4 0.43 2.1 17 0.73
Feedstocks and Feedstock Characteristics 53
4.1.6 Coke
Coke is a material consisting essentially of the fixed carbon and the ash in the coal. It was in the past a common fuel in water gas plants, but as it is more expensive than coal, anthracite is now often the preferred fuel. It is virtually never used in gasification plants. Coke plays a very important role in blast furnaces, which may be considered to be very large gasifiers (Gumz 1950). One of the main reasons to use coke in blast furnaces is that it is much stronger than coal.
4.1.7 Petroleum Coke
Petroleum coke, more often named petcoke, is increasingly considered as an attractive feedstock for gasification, in particular as it becomes more and more difficult to fire this high-sulfur material as a supplemental fuel in coal-fired power stations. Apart from the feed systems that are similar to those for pulverized coal, the behavior of petcoke in gasifiers is very similar to that of heavy oil fractions. When gasified in certain entrained-flow slagging coal gasifiers, it is essential to add ash, because otherwise the build-up of a proper slag layer on the membrane wall will not be successful (Mahagaokar and Hauser 1994). In the Elcogas plant in Puertollano, Spain petcoke is processed together with (high-ash) coal (Sendin 1994).
4.2 LIQUID AND GASEOUS FEEDSTOCKS
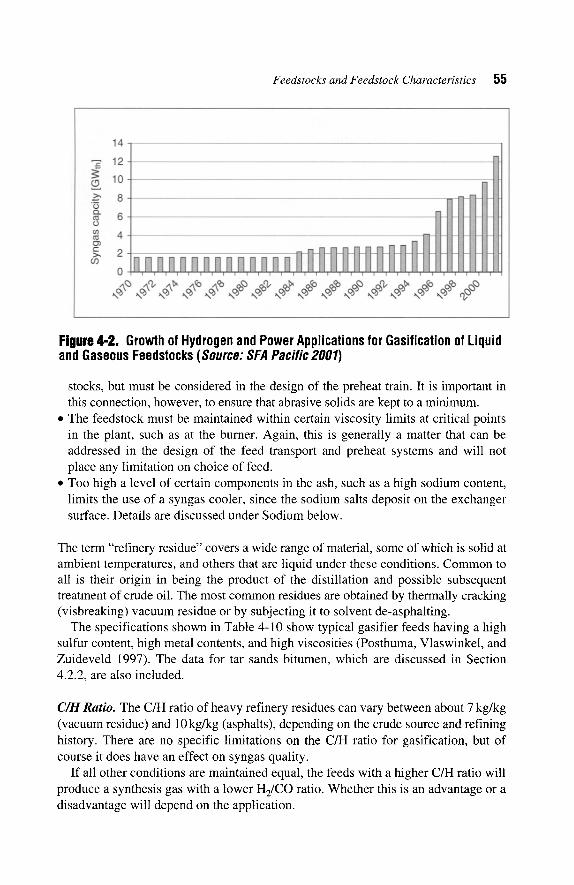
In 2002 some 154 million Nm3/d of synthesis gas was produced by partial oxidation of liquid or gaseous feeds (Simbeck and Johnson 2001; SFA Pacific 2001). If fed to state-of-the-art IGCC units, this would have generated some 11,500 MW e. By far the largest portion of this synthesis gas (about 80%) is generated from refinery residues, typically visbreaker vacuum bottoms or asphalt. The most important product from these plants is ammonia. Methanol is also important, but refinery hydrogen and power applications via IGCC are rapidly increasing (Figure 4-2). Most plants with gaseous feed are small units for the production of CO-rich synthesis gases, particularly for the production of oxo-alcohols. The largest single gas-fed plant is the Shell unit at Bintulu, Malaysia, which serves as the front end for a synfuels plant using Fischer-Tropsch technology. The number of projects recently announced indicates that this type of application is likely to gain increasing importance in the near future. However in the long term one must recognize that neither oil nor natural gas availability is as great as that of coal. The reserves-to-production ratios are 40 and 62 years, respectively, compared with 216 years for coal.
4.2.1 Refinery Residues
Over 95% of liquid material gasified consists of refinery residues. Being a high temperature, noncatalytic process, partial oxidation is by and large flexible with
54 Gasification
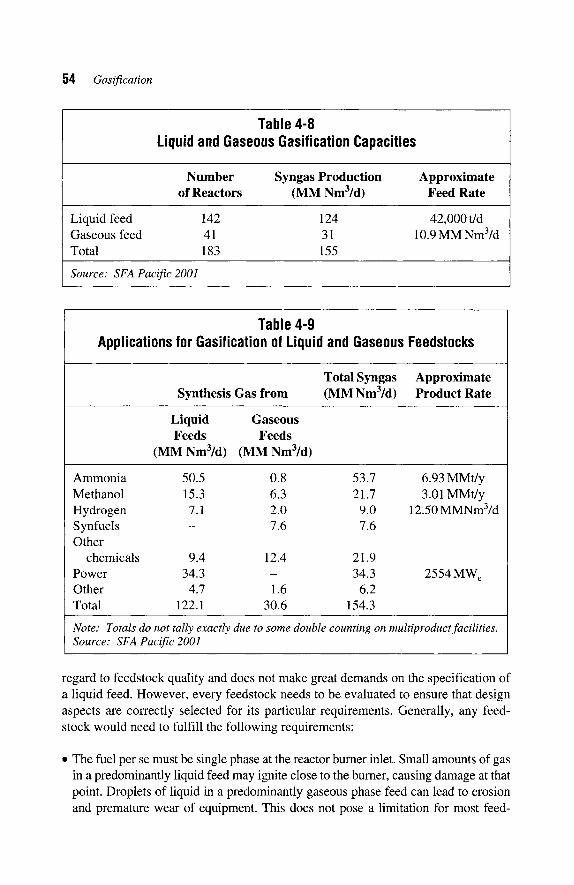
Table 4-8 Liquid and Gaseous Gasification Capacities
Number Syngas Production Approximate of Reactors (MM Nm3/d) Feed Rate
Liquid feed 142 124 Gaseous feed 41 31 Total 183 155
42,000 t/d 10.9 MM Nm3/d
Source: SFA Pacific 2001
Table 4-9 Applications for Gasification of Liquid and Gaseous Feedstocks
Synthesis Gas from Total Syngas Approximate (MM Nm3/d) Product Rate
Liquid Gaseous Feeds Feeds
(MM Nm3/d) (MM Nm3/d)
Ammonia 50.5 0.8 53.7 6.93 MMt/y Methanol 15.3 6.3 21.7 3.01 MMt/y Hydrogen 7.1 2.0 9.0 12.50 MMNm3/d Synfuels - 7.6 7.6 Other
chemicals 9.4 12.4 21.9 Power 34.3 - 34.3 2554 MW e Other 4.7 1.6 6.2 Total 122.1 30.6 154.3
Note: Totals do not tally exactly due to some double counting on multiproduct facilities. Source: SFA Pacific 2001
regard to feedstock quality and does not make great demands on the specification of a liquid feed. However, every feedstock needs to be evaluated to ensure that design aspects are correctly selected for its particular requirements. Generally, any feed- stock would need to fulfill the following requirements:
�9 The fuel per se must be single phase at the reactor burner inlet. Small amounts of gas in a predominantly liquid feed may ignite close to the burner, causing damage at that point. Droplets of liquid in a predominantly gaseous phase feed can lead to erosion and premature wear of equipment. This does not pose a limitation for most feed-
Feedstocks and Feedstock Characteristics 55
14 12
6
Hm m mm mmHHHHH I I I I I i I i I I i ! I I
Figure 4-2. Growth of Hydrogen and Power Applications for Gasification of Liquid and Gaseous Feedstocks (Source: SFA Pacific 2001)
stocks, but must be considered in the design of the preheat train. It is important in this connection, however, to ensure that abrasive solids are kept to a minimum.
�9 The feedstock must be maintained within certain viscosity limits at critical points in the plant, such as at the burner. Again, this is generally a matter that can be addressed in the design of the feed transport and preheat systems and will not place any limitation on choice of feed.
�9 Too high a level of certain components in the ash, such as a high sodium content, limits the use of a syngas cooler, since the sodium salts deposit on the exchanger surface. Details are discussed under Sodium below.
The term "refinery residue" covers a wide range of material, some of which is solid at ambient temperatures, and others that are liquid under these conditions. Common to all is their origin in being the product of the distillation and possible subsequent treatment of crude oil. The most common residues are obtained by thermally cracking (visbreaking) vacuum residue or by subjecting it to solvent de-asphalting.
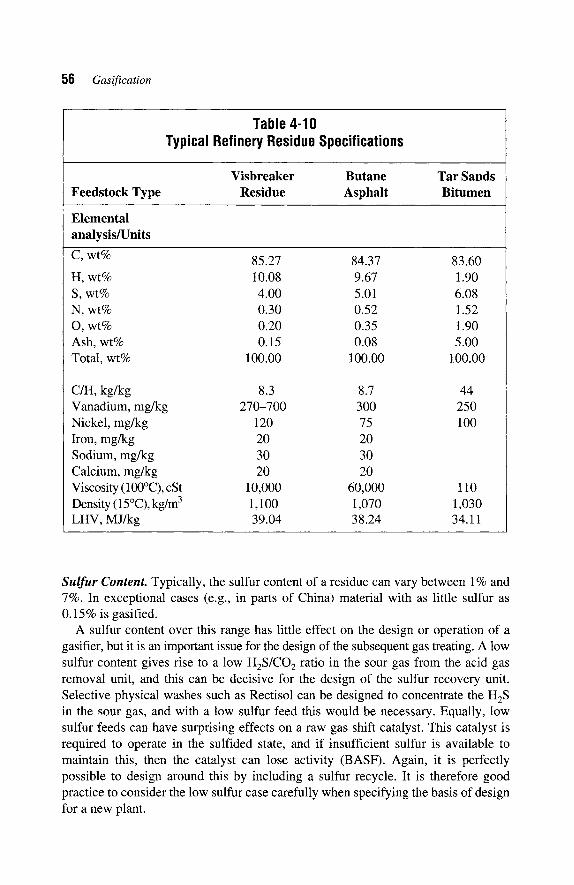
The specifications shown in Table 4-10 show typical gasifier feeds having a high sulfur content, high metal contents, and high viscosities (Posthuma, Vlaswinkel, and Zuideveld 1997). The data for tar sands bitumen, which are discussed in Section 4.2.2, are also included.
C/H Ratio. The C/H ratio of heavy refinery residues can vary between about 7 kg/kg (vacuum residue) and 10 kg/kg (asphalts), depending on the crude source and refining history. There are no specific limitations on the C/H ratio for gasification, but of course it does have an effect on syngas quality.
If all other conditions are maintained equal, the feeds with a higher C/H ratio will produce a synthesis gas with a lower H2/CO ratio. Whether this is an advantage or a disadvantage will depend on the application.
56 Gasification
Table 4-10 Typical Refinery Residue Specifications
Visbreaker Butane Tar Sands Feedstock Type Residue Asphalt Bitumen
Elemental analysis/Units
C, wt% 85.27 84.37 83.60
H, wt% 10.08 9.67 1.90 S, wt% 4.00 5.01 6.08 N, wt% 0.30 0.52 1.52 O, wt% 0.20 0.35 1.90 Ash, wt% 0.15 0.08 5.00 Total, wt% 100.00 100.00 100.00
C/H, kg/kg 8.3 8.7 44 Vanadium, mg/kg 270-700 300 250 Nickel, mg/kg 120 75 100 Iron, mg/kg 20 20 Sodium, mg/kg 30 30 Calcium, mg/kg 20 20 Viscosity (100~ cSt 10,000 60,000 110 Density (15~ kg/m 3 1,100 1,070 1,030 LHV, MJ/kg 39.04 38.24 34.11
Sulfur Content. Typically, the sulfur content of a residue can vary between 1% and 7%. In exceptional cases (e.g., in parts of China) material with as little sulfur as 0.15 % is gasified.
A sulfur content over this range has little effect on the design or operation of a gasifier, but it is an important issue for the design of the subsequent gas treating. A low sulfur content gives rise to a low H2S/CO 2 ratio in the sour gas from the acid gas removal unit, and this can be decisive for the design of the sulfur recovery unit. Selective physical washes such as Rectisol can be designed to concentrate the H2S in the sour gas, and with a low sulfur feed this would be necessary. Equally, low sulfur feeds can have surprising effects on a raw gas shift catalyst. This catalyst is required to operate in the sulfided state, and if insufficient sulfur is available to maintain this, then the catalyst can lose activity (BASF). Again, it is perfectly possible to design around this by including a sulfur recycle. It is therefore good practice to consider the low sulfur case carefully when specifying the basis of design for a new plant.
Feedstocks and Feedstock Characteristics 57
Corrosion effects in a residue gasifier, which can be connected with the presence of sulfur, are in most cases independent of the actual content of sulfur, and one needs to look at what other circumstances are contributing to the corrosion. In the event of, for example, high temperature sulfur corrosion, the solution to the problem will generally lie in avoiding the high temperatures rather than trying to lower the sulfur content of the feed.
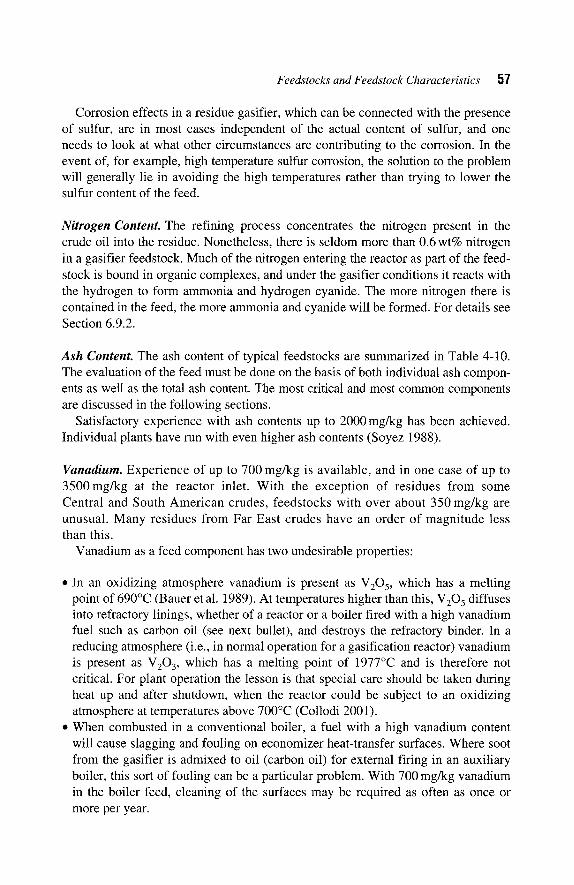
Nitrogen Content. The refining process concentrates the nitrogen present in the crude oil into the residue. Nonetheless, there is seldom more than 0.6 wt% nitrogen in a gasifier feedstock. Much of the nitrogen entering the reactor as part of the feed- stock is bound in organic complexes, and under the gasifier conditions it reacts with the hydrogen to form ammonia and hydrogen cyanide. The more nitrogen there is contained in the feed, the more ammonia and cyanide will be formed. For details see Section 6.9.2.
Ash Content. The ash content of typical feedstocks are summarized in Table 4-10. The evaluation of the feed must be done on the basis of both individual ash compon- ents as well as the total ash content. The most critical and most common components are discussed in the following sections.
Satisfactory experience with ash contents up to 2000mg/kg has been achieved. Individual plants have run with even higher ash contents (Soyez 1988).
Vanadium. Experience of up to 700 mg/kg is available, and in one case of up to 3500mg/kg at the reactor inlet. With the exception of residues from some Central and South American crudes, feedstocks with over about 350 mg/kg are unusual. Many residues from Far East crudes have an order of magnitude less than this.
Vanadium as a feed component has two undesirable properties:
�9 In an oxidizing atmosphere vanadium is present as V205, which has a melting point of 690~ (Bauer et al. 1989). At temperatures higher than this, V205 diffuses into refractory linings, whether of a reactor or a boiler fired with a high vanadium fuel such as carbon oil (see next bullet), and destroys the refractory binder. In a reducing atmosphere (i.e., in normal operation for a gasification reactor) vanadium is present as V203, which has a melting point of 1977~ and is therefore not critical. For plant operation the lesson is that special care should be taken during heat up and after shutdown, when the reactor could be subject to an oxidizing atmosphere at temperatures above 700~ (Collodi 2001).
�9 When combusted in a conventional boiler, a fuel with a high vanadium content will cause slagging and fouling on economizer heat-transfer surfaces. Where soot from the gasifier is admixed to oil (carbon oil) for external firing in an auxiliary boiler, this sort of fouling can be a particular problem. With 700 mg/kg vanadium in the boiler feed, cleaning of the surfaces may be required as often as once or more per year.

58 Gasification
�9 Problems with burners and syngas coolers have also been reported when operating with over 6000mg/kg vanadium in the reactor feed (Soyez 1988). This high level of vanadium in the feed is, however, extremely unusual.
Nickel There is no generally recognized upper limit for nickel in gasifier feedstocks. Nickel does, however, have an important influence on the gas treatment. In the presence of carbon monoxide and under pressure, nickel and nickel sulfide both form nickel carbonyl, a gaseous compound that leaves the gasification as a component of the synthesis gas. This topic is handled in more detail in Section 6.9.8.
It is also worth noting that upon air contact nickel sulfide can react to form NiSO 4 in the water. The NiSO 4 goes into solution in the water and can then be recycled to the scrubber, where it can increase the amount of carbonyls formed.
Sodium. Sodium can be present in the gasification feedstock either as sodium chloride or as sodium hydroxide. The sodium leaves the reactor as sodium chloride, or as sodium carbonate where the origin is sodium hydroxide, which have melting points of 800~ and 850~ respectively (Perry and Chilton 1973). In plants where the synthesis gas is cooled by steam raising in a heat exchanger, these salts deposit on the heat-exchange surface. The most serious effect is fouling of a large section of the surface, causing an increase in exchanger outlet temperature. The depositing can, however, also accumulate locally to the extent that there is a significant increase in pressure drop. It is therefore desirable to ensure that the sodium content does not exceed 30 mg/kg, or at the maximum 50 mg/kg. It is our experience that already as much as 80mg/kg in a feed that had been contaminated with seawater caused the outlet temperature of a syngas cooler to rise at more than I~ per day.
Fortunately, the sodium chloride fouling is a reversible phenomenon, and operation with a sodium free feed will cause the outlet temperature to reduce again even if not quite to the value prevailing before the sodium ingress. Full recovery requires a steam out.
Sodium compounds--and for that matter other alkali metals--have the additional unpleasant property that they diffuse into the refractory lining of the reactor, where they effect a change in the crystal structure of the alumina from c~-alumina to ~-alumina, which leads in turn to a gradual disintegration and loss of life of the refractory.
For most refinery applications the sodium limitation is not a restriction, since the desalting process in the refinery effectively maintains the sodium level within allowable limits. In cases where a high sodium content is expected on a regular and steady basis, then quench cooling is a preferable choice to a syngas cooler.
Calcium. Typically, there may be some 6-20mg/kg calcium in a refinery residue. Calcium can react with the CO 2 in the synthesis gas to form carbonates. This does not normally present any problems. Where significantly more calcium is present, these carbonates can precipitate out of the quench or wash water depositing in the level indicators, possibly with disastrous results if not recognized in time. A certain degree of depositing on the surface of syngas coolers is also possible (Soyez 1988).
Feedstocks and Feedstock Characteristics 59
Iron. The iron content of the feed can be as high as 50 mg/kg, but is generally lower. The behavior of iron is similar to that of nickel. Carbonyl formation in the synthesis gas takes place at a lower temperature than for nickel. This is discussed in more detail in Section 6.9.8.
Silica. Silica can find its way into refinery residues from a number of sources, as sand, catalyst fines from a fluid catalytic cracker (FCC), or from abraded refractory. Typically, there may be between 20 and 50mg/kg in the residue, which can be tolerated. Larger quantities can cause two types of problem.
On the one hand, silica is an abrasive material that largely passes into the water system, where it settles out to some extent. In recycle systems, it is partly mixed with the feedstock, increasing the quantity being fed to the reactor. Abrasion has been reported on the feedstock charge pumps as a result (Soyez 1988).
Silica entering the system as FCC catalyst fines can also deposit close to the burner area of the reactor, with the risk of disturbing the flame pattern in the reactor.
Additionally, there is the problem that under the reducing conditions in the reactor, silica is reduced to volatile SiO according to the reaction
SiO 2 + H 2 - SiO 1" + H20
The SiO condenses at about 800~ while cooling in the syngas cooler and deposits on the exchanger surface. This is one reason why all oil gasifiers use a low-silica high-alumina refractory lining (Crowley 1967).
Chloride. Chloride in the feedstock is mostly present as NaC1. Smaller quantities may also be present as K-, Fe-, Cr-, Ca-, and Mg- compounds.
Although large quantifies of chlorides will damage the plant, the limitation of the main source, NaC1 to 30ppmw Na, is usually sufficient to limit the overall chloride intake.
The potential problems of fouling or corrosion associated with chlorides are described in Section 4.1.
Naphthenic Acids. Naphthenic acids can be present in residues to a greater (e.g., those derived from Russian crudes) or lesser extent. While this is not of importance for the gasification process itself, it can be an important evaluation criterion, since it would need to be considered in the selection of metallurgy for the feedstock transport system.
Viscosity. Many refinery residues have an extremely high viscosity and are (subject- ively) solid, having the consistency of street bitumen at ambient temperatures. Since the viscosity decreases considerably with increased temperature, it is often desirable to transport and store this material in a heated condition.
The temperature dependency of viscosity takes the form of the Walther equation (Grol3e et al. 1962, L4):
log(log(v + c)) = m*(log(T0) - log(T)) + log (log(v 0 + c))
60 Gasification
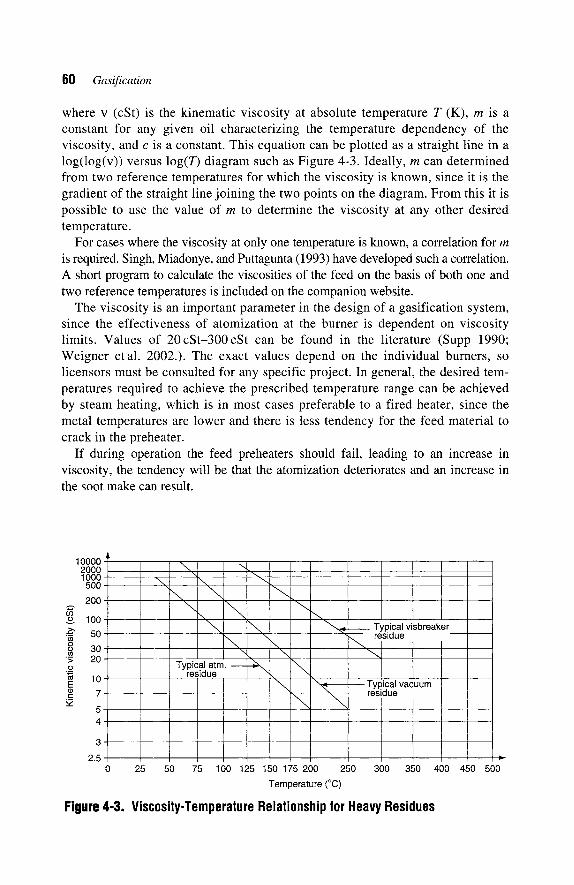
where v (cSt) is the kinematic viscosity at absolute temperature T (K), m is a constant for any given oil characterizing the temperature dependency of the viscosity, and c is a constant. This equation can be plotted as a straight line in a log(log(v)) versus log(T) diagram such as Figure 4-3. Ideally, m can determined from two reference temperatures for which the viscosity is known, since it is the gradient of the straight line joining the two points on the diagram. From this it is possible to use the value of m to determine the viscosity at any other desired temperature.
For cases where the viscosity at only one temperature is known, a correlation for m is required. Singh, Miadonye, and Puttagunta (1993) have developed such a correlation. A short program to calculate the viscosities of the feed on the basis of both one and two reference temperatures is included on the companion website.
The viscosity is an important parameter in the design of a gasification system, since the effectiveness of atomization at the burner is dependent on viscosity limits. Values of 20cSt -300cSt can be found in the literature (Supp 1990; Weigner etal. 2002.). The exact values depend on the individual burners, so licensors must be consulted for any specific project. In general, the desired tem- peratures required to achieve the prescribed temperature range can be achieved by steam heating, which is in most cases preferable to a fired heater, since the metal temperatures are lower and there is less tendency for the feed material to crack in the preheater.
If during operation the feed preheaters should fail, leading to an increase in viscosity, the tendency will be that the atomization deteriorates and an increase in the soot make can result.
10000 ? 2000 1000 - 500 -
200 - 09
100 -
50- O o 30- "~, 20 .__ cO 10- E
7- c
5- 4 -
3 -
2.5- 0
-,,,.
\ \
Typical atm residue
\ \ \
\ \
\
" • . _ Typical visbreaker \ residue
,,,,,
Typical vacuum residue
25 50 75 100 125 150 175 200 250 300 350
Temperature (~
Figure 4-3. Viscosity-Temperature Relationship for Heavy Residues
400 450 500
Feedstocks and Feedstock Characteristics 61
HEATING CURVE
COOLING ~ CURVE
MELTING ,,,, \ PO, T
FREEZING N,~ \
POINT -N,~~ DROPPING CONGEALING/" ~ ~ / POINT
o,Nt - c , o u o
POUR / ' " ~ r " ~ - % . ~ ~ jPOINT POINT
. . . . . . . . _ . ~ ~ r
TEMPERATURE
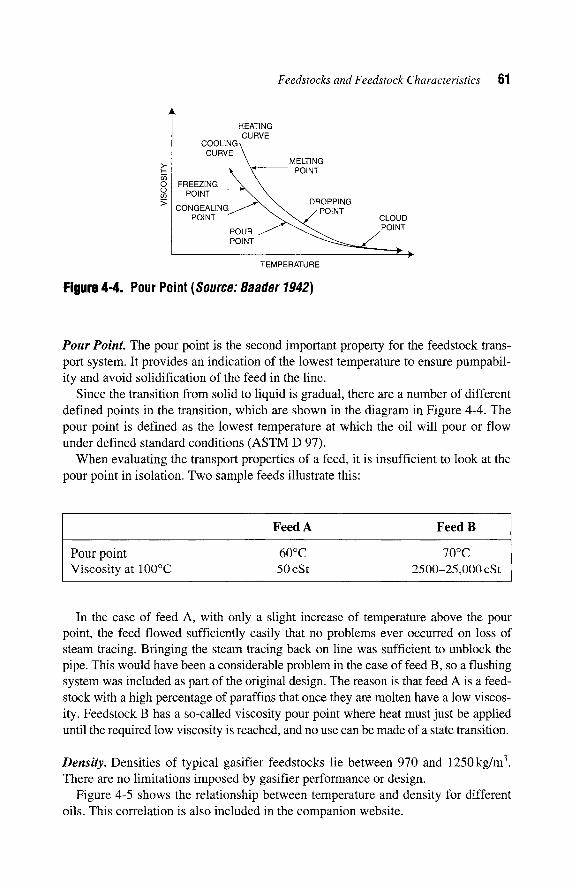
Figure 4-4. Pour Point (Source: Baader 1942)
Pour Point. The pour point is the second important property for the feedstock trans- port system. It provides an indication of the lowest temperature to ensure pumpabil- ity and avoid solidification of the feed in the line.
Since the transition from solid to liquid is gradual, there are a number of different defined points in the transition, which are shown in the diagram in Figure 4-4. The pour point is defined as the lowest temperature at which the oil will pour or flow under defined standard conditions (ASTM D 97).
When evaluating the transport properties of a feed, it is insufficient to look at the pour point in isolation. Two sample feeds illustrate this:
Feed A Feed B
Pour point 60~ 70~ Viscosity at 100~ 50 cSt 2500-25,000 cSt
In the case of feed A, with only a slight increase of temperature above the pour point, the feed flowed sufficiently easily that no problems ever occurred on loss of steam tracing. Bringing the steam tracing back on line was sufficient to unblock the pipe. This would have been a considerable problem in the case of feed B, so a flushing system was included as part of the original design. The reason is that feed A is a feed- stock with a high percentage of paraffins that once they are molten have a low viscos- ity. Feedstock B has a so-called viscosity pour point where heat must just be applied until the required low viscosity is reached, and no use can be made of a state transition.
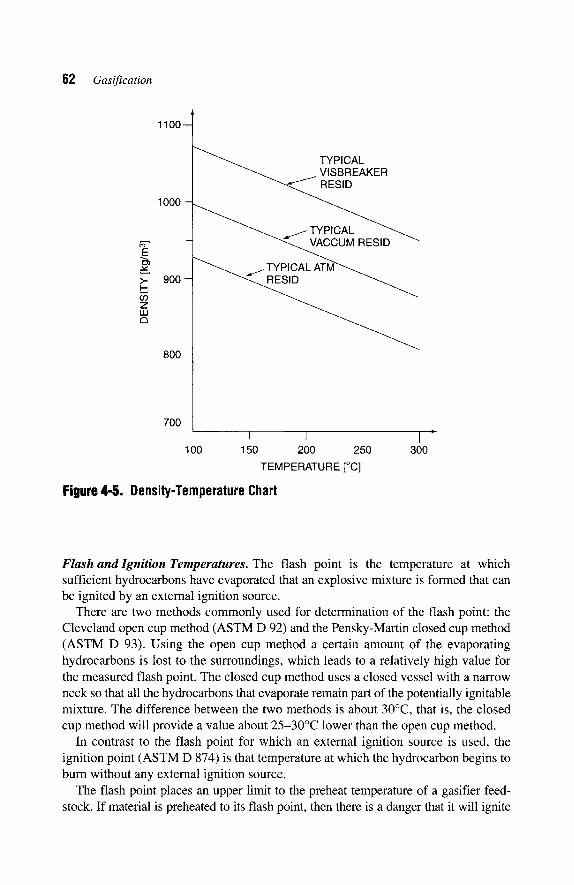
Density. Densities of typical gasifier feedstocks lie between 970 and 1250 kg/m 3. There are no limitations imposed by gasifier performance or design.
Figure 4-5 shows the relationship between temperature and density for different oils. This correlation is also included in the companion website.
62 Gasification
1100--
1000 -
900
800 -
700
TvYsP/CALKE R
TYPICAL RESID
_ T Y P I C A L
I I I 100 150 200 250
TEMPERATURE [~
Figure 4-5. Density-Temperature Chart
300
Flash and Ignition Temperatures. The flash point is the temperature at which sufficient hydrocarbons have evaporated that an explosive mixture is formed that can be ignited by an external ignition source.
There are two methods commonly used for determination of the flash point: the Cleveland open cup method (ASTM D 92) and the Pensky-Martin closed cup method (ASTM D 93). Using the open cup method a certain amount of the evaporating hydrocarbons is lost to the surroundings, which leads to a relatively high value for the measured flash point. The closed cup method uses a closed vessel with a narrow neck so that all the hydrocarbons that evaporate remain part of the potentially ignitable mixture. The difference between the two methods is about 30~ that is, the closed cup method will provide a value about 25-30~ lower than the open cup method.
In contrast to the flash point for which an external ignition source is used, the ignition point (ASTM D 874) is that temperature at which the hydrocarbon begins to burn without any external ignition source.
The flash point places an upper limit to the preheat temperature of a gasifier feed- stock. If material is preheated to its flash point, then there is a danger that it will ignite
Feedstocks and Feedstock Characteristics 63
immediately on exiting the burner and damage it. A damaged burner can in turn change the design flame pattern, causing local stoichiometric combustion with associated high temperatures and the potential for reactor containment failure. A suitable safety precau- tion is to maintain the preheat temperature 50-100~ lower than the flash point.
Generally, there is no need to preheat to anything like the flash point of normal residues, since the viscosity is already sufficiently low for good atomization at substantially lower temperatures. Problems can arise, however, with blended feedstocks. If, for instance, FCC light cycle oil is added to a heavy asphalt to reduce its viscosity, then the light material might have a flash point at a temperature required to achieve an acceptable viscosity of the blend at the burner.
Conradson Carbon. The Conradson carbon (ASTM D 189) is determined by placing a feed sample into a container and heating it to a given temperature so that it cracks. The Conradson carbon value is given by the amount of cracked residue expressed as a percentage of the original sample.
The Conradson carbon value is not used expressly in gasifier installation design. It does, however, provide an indication of the propensity for coke formation by the residue during preheat. It can also, in connection with the C/H ratio, provide a guide to the moderating steam requirement. Additionally, it can be of use when consider- ing the consistency of other data received for a particular feed.
Typical values for the Conradson carbon are:
Propane asphalt 35% Vacuum residue 20% Atmospheric residue 10%
The Ramsbottom method (ASTM D 254) provides an alternative determination of the carbon residue. A conversion chart between the two methods can be found in Speight (1998, p. 335).
4.2.2 Other Liquid Feedstocks
Orimulsion. Orimulsion is the trade name for an emulsified bitumen-water mixture produced from the bitumen fields in the Orinoco belt of Venezuela. Orimulsion consists of about 70% bitumen and 30% water and contains about 1% surfactants. The emulsifying technology converts the bitumen into a transportable fuel with a pour point of 3~ and a viscosity of about 200cP at 30~ It has a lower heating value of 27.8 MJ/kg (Marrufo, Sarmiento, and Alcala 2001).
Technically, Orimulsion is a petroleum product; it contains sulfur, vanadium, and nickel in substantial quantities, and these behave just as in a conventional residue. The sodium content is low (12 mg/kg), assuming that there is no contami- nation in transport. The differences of Orimulsion when compared to a refinery residue are in the water content and the surfactant used. The water content causes
64 Gasification
a considerable loss of efficiency since energy is used in its heating and evaporation. The resulting syngas has a CO 2 content of about 10% compared with around 3% in unquenched syngas generated from a conventional residue. Early formulations of Orimulsion contained considerable quantities of magnesium, which could have presented problems similar to those caused by calcium. The newest formulation, Orimulsion 400, has a magnesium content of 6 mg/kg, which is sufficiently low to avoid these.
When designing for or operating with Orimulsion, it is necessary to take specific precautions (e.g., reduced preheat temperatures) to avoid the emulsion breaking. A handbook of suitable handling guidelines can be obtained from the suppliers.
Orimulsion has been tested as a gasification feedstock in Texaco's Montebello, California, pilot facility in 1989 with apparent success. The producer of Orimulsion, Bitumenes Orinoco S.A. (Bitor), claims to be able to supply the material at a price to allow competitive production in a gasification plant but there is no recorded commercial application at this time (2002).
Tar Sands Residues. Tar sands are deposits of heavy hydrocarbons located in a sandstone matrix that are not amenable to conventional pumping technology. The largest and most well-known deposits are in northern Alberta, Canada. Other deposits exist (in approximate order of size) in Venezuela, the United States (Utah, Texas, California, Kentucky), Russia (Olenek), Madagascar, and Albania, as well as in other locations in Canada (Melville island). A typical analysis is included in Table 4-10.
Tar sands represent a major hydrocarbon resource with an estimated 450 billion barrels of recoverable reserves (Speight 1998, p. 117), but the difficulties and cost of extraction have limited commercial exploitation. At present, there are only two commercially operating plants, both in the Athabasca River basin of northern Alberta. A number of pilot operations for the development of improved extraction techniques exist, also mostly in this area, and a number of commercial projects are currently under development (Parkinson 2002).
The processing of tar sands can be described in three principle steps:
1. Extraction, for which there are two fundamentally different approaches. One is to mine the bitumen-laden sandstone and transport it to a central extraction plant, where the sandstone and bitumen are separated by a hot-water extraction process (HWEP). The commercial operations of Syncrude and Suncor are both based on this method.
Alternative methods have been developed for in situ extraction and separation, such as steam-assisted gravity drainage (SAGD). There are pilot plants in operation that demonstrate the possibilities of this approach, and at least one current project is based on it.
2. Primary conversion, for which conventional or modified coking, cracking, or solvent de-asphalting processes are applied.
3. Secondary conversion, which is essentially a hydrotreating step.
Feedstocks and Feedstock Characteristics 65
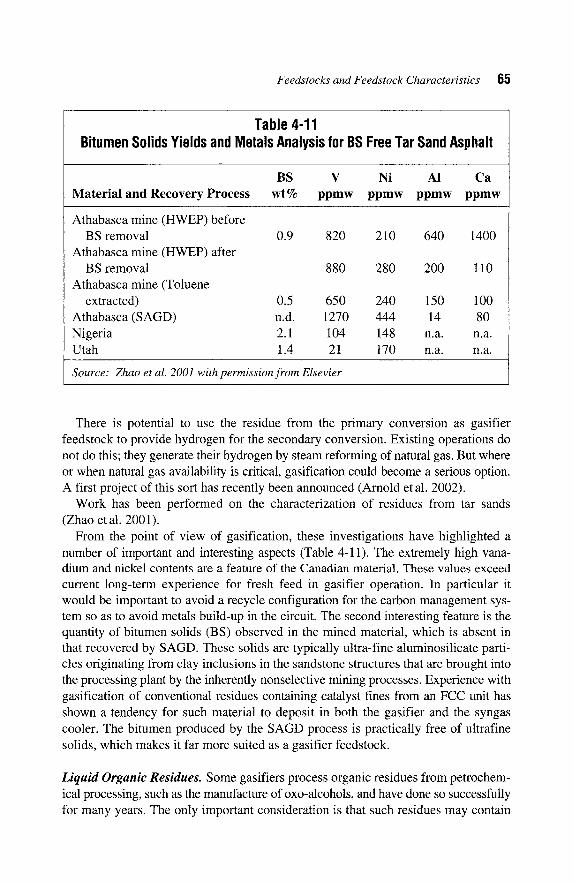
Table 4-11 Bitumen Solids Yields and Metals Analysis for BS Free Tar Sand Asphalt
Material and Recovery Process BS V Ni Al Ca
wt% ppmw ppmw ppmw ppmw
Athabasca mine (HWEP) before BS removal 0.9 820 210 640 1400
Athabasca mine (HWEP) after BS removal 880 280 200 110
Athabasca mine (Toluene extracted) 0.5 650 240 150 100
Athabasca (SAGD) n.d. 1270 444 14 80 Nigeria 2.1 104 148 n.a. n.a. Utah 1.4 21 170 n.a. n.a.
Source: Zhao et al. 2001 with permission from Elsevier
There is potential to use the residue from the primary conversion as gasifier feedstock to provide hydrogen for the secondary conversion. Existing operations do not do this; they generate their hydrogen by steam reforming of natural gas. But where or when natural gas availability is critical, gasification could become a serious option. A first project of this sort has recently been announced (Arnold et al. 2002).
Work has been performed on the characterization of residues from tar sands (Zhao et al. 2001).
From the point of view of gasification, these investigations have highlighted a number of important and interesting aspects (Table 4-11). The extremely high vana- dium and nickel contents are a feature of the Canadian material. These values exceed current long-term experience for fresh feed in gasifier operation. In particular it would be important to avoid a recycle configuration for the carbon management sys- tem so as to avoid metals build-up in the circuit. The second interesting feature is the quantity of bitumen solids (BS) observed in the mined material, which is absent in that recovered by SAGD. These solids are typically ultra-fine aluminosilicate parti- cles originating from clay inclusions in the sandstone structures that are brought into the processing plant by the inherently nonselective mining processes. Experience with gasification of conventional residues containing catalyst fines from an FCC unit has shown a tendency for such material to deposit in both the gasifier and the syngas cooler. The bitumen produced by the SAGD process is practically free of ultrafine solids, which makes it far more suited as a gasifier feedstock.
Liquid Organic Residues. Some gasifiers process organic residues from petrochem- ical processing, such as the manufacture of oxo-alcohols, and have done so successfully for many years. The only important consideration is that such residues may contain
66 Gasification
catalyst fines. Depending on the catalyst and/or carrier, this may have an abrasive effect on critical equipment or cause fouling or plugging as described above for refinery residues.
Coal Tar. The MPG process (see Section 5.4.3) was originally developed for coal- based tars generated in a plant using Lurgi fixed-bed gasifiers to gasify lignite. It has been in successful operation in such service since 1969 (Hirschfelder, Buttker, and Steiner 1997; Liebner 1998).
Other oil-processing gasifiers have taken in coal tar in order to reduce feed- stock costs. Such attempts at mixing coal tar and petroleum-derived residues have not generally been successful. The principle difficulty is the incompatibility of the different types of ash, which tend to form eutectica. The result is plugging of either the throat area in a quench reactor or of the tube bundle in a syngas cooler.
Spent Lubricating Oil. Spent lubricating oil is included here as a potential gasifier fuel more to warn against it than to encourage its use. Used lubricating oil can contain typically 1500mg/kg each of lead and zinc. The lead content can be as much as 10,000mg/kg. Lead and zinc sulfides solidify at temperatures of 700-800~ and will block syngas coolers and the throats of quench reactors. Soyez (1988) reports that "some 100 ppm was sufficient to plug the waste heat boilers completely within only seven days." Other similar cases are also known. The only sound advice concerning gasification of spent lubrication oil is: don't.
4.2.3 Natural Gas
Compared with the variety of aspects needing evaluation when dealing with liquid feeds, natural gas is relatively simple, and the principle issues to be considered are more of an economic rather than technical nature. For the production of hydrogen-rich synthesis gas it is generally more economic to employ steam reforming rather than partial oxidation. Partial oxidation of natural gas is only likely to demonstrate favorable economics for hydrogen production where no purpose-built oxygen plant is required, or where the hydrogen is a by-product of carbon monoxide production. The advantage of partial oxidationmnamely, that as a noncatalytic process, no large amounts of steam are required to prevent carbon laydown on the catalystmonly comes into its own when a CO-rich syngas is required. Further details are discussed in Section 7.1.4.
Since most applications for partial oxidation of natural gas aim at a CO-rich syn- thesis gas, quenching hot gas with water--advantageous if a CO shift is desired~is economically unattractive, and most such plants employ a syngas cooler.
There is no specific requirement on the hydrocarbon content of the natural gas. Clearly, heavier gases with high ethane or propane content will produce a synthesis gas richer in CO than pure methane. When looking at the still heavier components of natural gas, however, it is really only necessary that they be gaseous at the burner.
Feedstocks and Feedstock Characteristics 67
Nitrogen is a component in natural gas, which passes through the reactor largely as an inert. The amount of nitrogen (or argon) allowable in the feedstock is governed purely by the synthesis gas specification. This is different from the CO 2 case. CO 2 is a partner in the partial oxidation reactions and will increase the CO yield from the gas. This will be favorable in many instances, but must be reviewed on a case-by-case basis.
In contrast to catalytic processes such as steam reforming or autothermal reforming, partial oxidation is tolerant of sulfur. In fact there are good reasons to accept sulfur into the partial oxidation reactor. Firstly the synthesis gas has a high partial pressure of carbon monoxide so that in the absence of large quantities of steam there is considerable potential for metal dusting corrosion (Posthuma, Vlaswinkel, and Zuideveld 1997), more so than with the equivalent steam reformer (see Section 6.11 for details). The most effective form of protection against metal dusting is sulfur in the gas (Gommans and Huurdeman 1994).
The second advantage of leaving the sulfur in the gas is to prevent a spontaneous methanation reaction in the synthesis gas.
4.2.4 Other Gaseous Feedstocks
Refinery Gas. Refinery gas has been used as a feedstock for partial oxidation. Although partial oxidation cannot usually compete with steam reforming for hydrogen production from natural gas, the situation can be different with a refinery gas feed. Refinery waste gas streams can contain considerable quantities of olefins, which would need to be hydrogenated upstream of a steam reformer. The partial oxidation route is not sensitive to the presence of unsaturates in the feed, and this flexibility can provide opportunities (Ramprasad et al. 1999).
Attention needs to be paid to the issues of metal dusting and methanation as with natural gas, but if there is no sulfur in the feed, then other solutions are possible, such as using a quench reactor if hydrogen is to be the end product.
F T Off-Gas. Fischer-Tropsch off-gas is essentially similar to many refinery off-gas streams in that it can contain significant quantities of unsaturated hydrocarbons. The same considerations apply. Where the main syngas generation for the FT synthesis is partial oxidation of natural gas, one only needs to be careful with the recycle of inerts (Higman 1990). This is, however, a limitation imposed by the synthesis process and not by the partial oxidation itself.
Coke Oven Gas. There are two recorded plants using coke oven gas as a feedstock. Coke oven gas is available only at low pressure. This makes the economics unfavor- able in all but the most exceptional cases.
4.3 BIOMASS
The term biomass covers a broad range of materials that offer themselves as fuels or raw materials and that have in common that they are all derived from recently living
68 Gasification
organisms. This definition clearly excludes traditional fossil fuels, since although they also derive from plant (coal) or animal (oil and gas) life, it has taken millions of years to convert them to their current form. For the purpose of this book, we have chosen to include all agricultural and forestry wastes as well as purpose-grown material as biomass, thus clearly including animal refuse such as poultry litter. There is still a potential overlap between what is classified as waste and what as biomass. We have considered human sewage sludge as well as wastes from industrial processes as waste. Black liquor, an intermediate material in the paper industry with important fuel use, is treated here as biomass.
Although biomass is not a major industrial fuel, it supplies 15-20% of the total fuel use in the world. It is used mostly in nonindustrialized economies for domestic heating and cooking. In industrialized countries the use of biomass as a fuel is largely restricted to the use of by-products from forestry and the paper and sugar industries. Nonetheless, its use is being encouraged as part of a strategy for CO 2 abatement.
4.3.1 Properties of Biomass
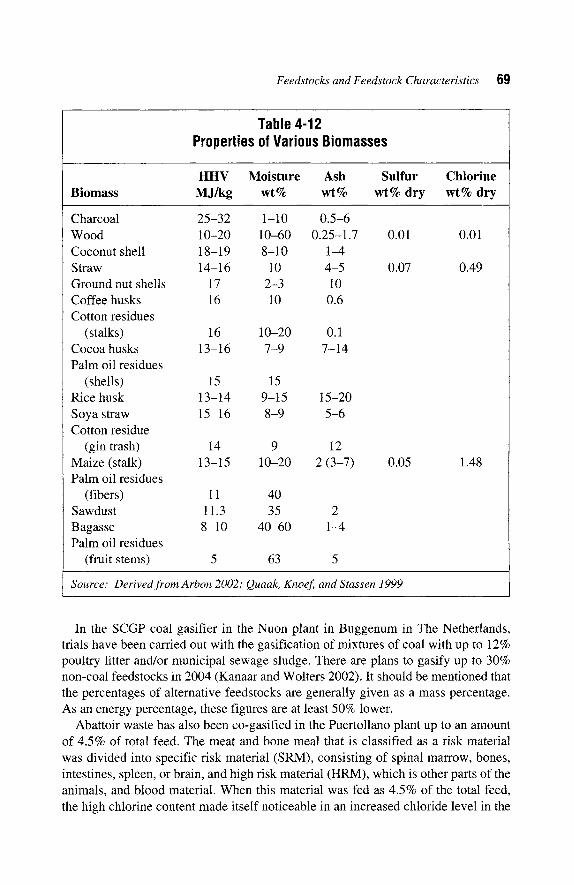
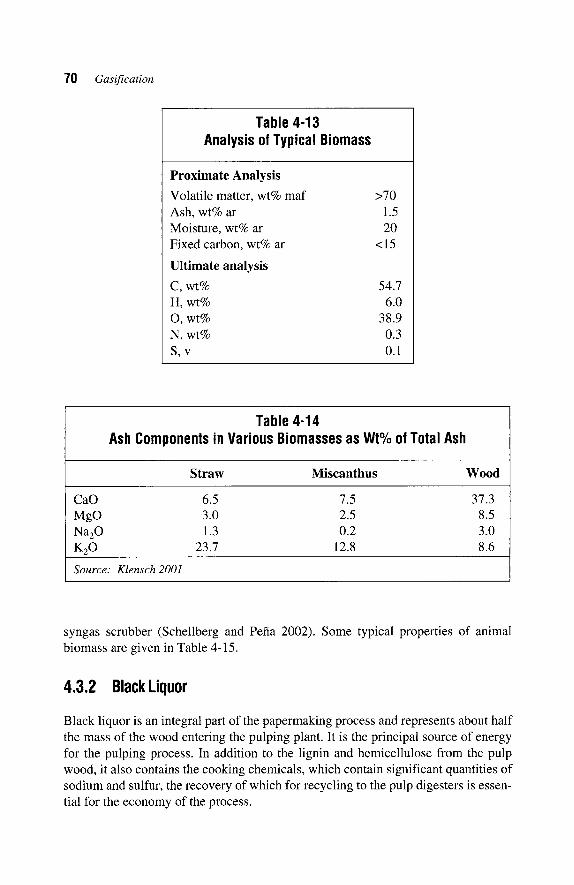
The properties of biomass are as diverse as the sources from which they come. Typ- ical data for some vegetable biomasses is included in Table 4-12.
Vegetable Biomass
Typical proximate and ultimate analyses are given in Table 4-13. Quaak, Knoef, and Stassen (1999) give a range for the bulk density of 150-200kg/m 3 for straw shavings and 600-900 kg/m 3 for solid wood.
Ash Properties. The major difference between biomass and coal ashes is that for the majority of most biomasses the ash consists mainly of salts. Most of the biomass ash consists of potassium, calcium, phosphorus, and, further, sodium, magnesium, iron, silicon, and trace elements. Some examples are given in Table 4-14.
As a result biomass ashes have low ash-melting points of, for example, 800~ for some straws. Because these ashes are extremely aggressive towards refractory mater- ialsmK2CO 3 can be used to dissolve minerals before further analysismbiomass does not lend itself for slagging gasification unless it is mixed with large quantities of coal.
Animal Biomass
Although biomass is often interpreted as vegetable biomass, animal-derived biomass remains an energy source that should not be totally ignored, even if its production is largely determined by developments in the agricultural and food sector. In order to provide an idea of the volumes involved, it should be noted that the annual production of waste by poultry is 8 kg/head. Pigs produce about 300 kg/y, beef cattle 900-1200 kg/y, and dairy cattle 1200-2000 kg/y (Smil 2001).
Feedstocks and Feedstock Characteristics 69
Table 4-12 Properties of Various Biomasses
HHV Moisture Ash Sulfur Chlorine Biomass MJ/kg wt % wt % wt % dry wt % dry
Charcoal 25-32 1-10 0.5-6 Wood 10-20 10-60 0.25-1.7 0.01 0.01 Coconut shell 18-19 8-10 1-4 Straw 14-16 10 4-5 0.07 0.49 Ground nut shells 17 2-3 10 Coffee husks 16 10 0.6 Cotton residues
(stalks) 16 10-20 0.1 Cocoa husks 13-16 7-9 7-14 Palm oil residues
(shells) 15 15 Rice husk 13-14 9-15 15-20 Soya straw 15-16 8-9 5-6 Cotton residue
(gin trash) 14 9 12 Maize (stalk) 13-15 10-20 2 (3-7) 0.05 1.48 Palm oil residues
(fibers) 11 40 Sawdust 11.3 35 2 Bagasse 8-10 40-60 1-4 Palm oil residues
(fruit stems) 5 63 5
Source: Derived from Arbon 2002; Quaak, Knoef and Stassen 1999
In the SCGP coal gasifier in the Nuon plant in Buggenum in The Netherlands, trials have been carried out with the gasification of mixtures of coal with up to 12% poultry litter and/or municipal sewage sludge. There are plans to gasify up to 30% non-coal feedstocks in 2004 (Kanaar and Wolters 2002). It should be mentioned that the percentages of alternative feedstocks are generally given as a mass percentage. As an energy percentage, these figures are at least 50% lower.
Abattoir waste has also been co-gasified in the Puertollano plant up to an amount of 4.5% of total feed. The meat and bone meal that is classified as a risk material was divided into specific risk material (SRM), consisting of spinal marrow, bones, intestines, spleen, or brain, and high risk material (HRM), which is other parts of the animals, and blood material. When this material was fed as 4.5% of the total feed, the high chlorine content made itself noticeable in an increased chloride level in the
70 Gasification
Table 4-13 Analysis of Typical Biomass
Proximate Analysis
Volatile matter, wt% maf >70 Ash, wt% ar 1.5 Moisture, wt% ar 20 Fixed carbon, wt% ar <15
Ultimate analysis
C, wt% 54.7 H, wt% 6.0 O, wt% 38.9 N, wt% 0.3 S,v 0.1
Table 4-14 Ash Components in Various Biomasses as Wt% of Total Ash
Straw Miscanthus Wood
CaO 6.5 7.5 37.3 MgO 3.0 2.5 8.5 Na20 1.3 0.2 3.0 K20 23.7 12.8 8.6
Source: Klensch 2001
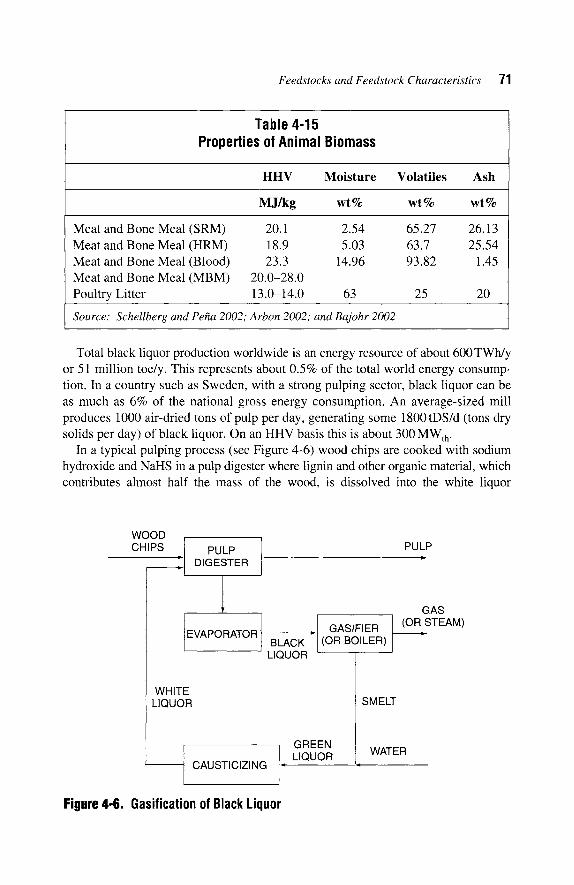
syngas scrubber (Schellberg and Pefia 2002). Some typical properties of animal biomass are given in Table 4-15.
4.3.2 Black Liquor
Black liquor is an integral part of the papermaking process and represents about half the mass of the wood entering the pulping plant. It is the principal source of energy for the pulping process. In addition to the lignin and hemicellulose from the pulp wood, it also contains the cooking chemicals, which contain significant quantities of sodium and sulfur, the recovery of which for recycling to the pulp digesters is essen- tial for the economy of the process.
Feedstocks and Feedstock Characteristics 71
Table 4-15 Properties of Animal Biomass
HHV Moisture Volatiles Ash
MJ/kg wt% wt% wt%
Meat and Bone Meal (SRM) Meat and Bone Meal (HRM) Meat and Bone Meal (Blood) Meat and Bone Meal (MBM) Poultry Litter
20.1 2.54 65.27 26.13 18.9 5.03 63.7 25.54 23.3 14.96 93.82 1.45
20.0-28.0 13.0-14.0 63 25 20
Source: Schellberg and Pefta 2002; Arbon 2002; and Bajohr 2002
Total black liquor production worldwide is an energy resource of about 600 TWh/y or 51 million toe/y. This represents about 0.5% of the total world energy consump- tion. In a country such as Sweden, with a strong pulping sector, black liquor can be as much as 6% of the national gross energy consumption. An average-sized mill produces 1000 air-dried tons of pulp per day, generating some 1800 tDS/d (tons dry solids per day) of black liquor. On an HHV basis this is about 300 MWth.
In a typical pulping process (see Figure 4-6) wood chips are cooked with sodium hydroxide and NariS in a pulp digester where lignin and other organic material, which contributes almost half the mass of the wood, is dissolved into the white liquor
WOOD CHIPS PULP
DIGESTER
PULP
EVAPORATOR BLACK
LIQUOR
WHITE LIQUOR
GREEN LIQUOR
CAUSTICIZING
GASIFIER (OR BOILER)
SMELT
WATER
Figure 4-6. Gasification of Black Liquor
GAS (OR STEAM)
72 Gasification
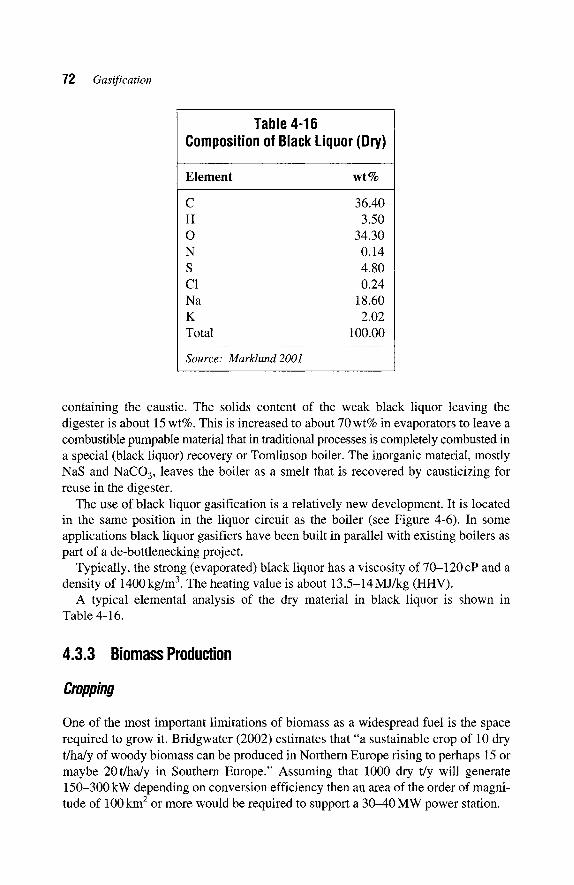
Table 4-16 Composition of Black Liquor (Dry)
Element wt%
C 36.40 H 3.50 O 34.30 N 0.14 S 4.80 C1 0.24 Na 18.60 K 2.02 Total 100.00
Source: Marklund 2001
containing the caustic. The solids content of the weak black liquor leaving the digester is about 15 wt%. This is increased to about 70 wt% in evaporators to leave a combustible pumpable material that in traditional processes is completely combusted in a special (black liquor) recovery or Tomlinson boiler. The inorganic material, mostly NaS and NaCO 3, leaves the boiler as a smelt that is recovered by causticizing for reuse in the digester.
The use of black liquor gasification is a relatively new development. It is located in the same position in the liquor circuit as the boiler (see Figure 4-6). In some applications black liquor gasifiers have been built in parallel with existing boilers as part of a de-bottlenecking project.
Typically, the strong (evaporated) black liquor has a viscosity of 70-120cP and a density of 1400 kg/m 3. The heating value is about 13.5-14 MJ/kg (HHV).
A typical elemental analysis of the dry material in black liquor is shown in Table 4-16.
4.3.3 Biomass Production
Cropping
One of the most important limitations of biomass as a widespread fuel is the space required to grow it. Bridgwater (2002) estimates that "a sustainable crop of 10 dry t/ha/y of woody biomass can be produced in Northern Europe rising to perhaps 15 or maybe 20t/ha/y in Southern Europe." Assuming that 1000 dry t/y will generate 150-300 kW depending on conversion efficiency then an area of the order of magni- tude of 100 km 2 or more would be required to support a 30-40 MW power station.
Feedstocks and Feedstock Characteristics 73
It is unlikely that all transportation fuels and organic chemicals can in the future be produced from biomass. This would call for an immense acreage of biomass planta- tions of a few million square kilometers. This seems unrealistic for various reasons:
�9 The sheer size of such projects. �9 It is far from certain that large-scale plantations of more or less conventional crops
such as Eucalyptus, miscanthus, euphorbia, and other species are so green as the advocates of these plantations claim it to be. The large-scale biomass production in Minas Gerais in Brazil for making charcoal to be used in blast furnaces is a well-known environmental problem. Fertilizers, herbicides, and pesticides will be required; ash may have to be recycled in order to recycle alkali, phosphorus, and so on. Irrigation may be a problem, and so may soil erosion. Moreover, monocul- tures are very sensitive to pests. Last but not least, such developments are often difficult to reconcile with the wish for more biodiversity.
�9 Biomass is easy to transport when it comes to gathering firewood for nearby domestic use. However, it is expensive to transport in large quantities over any appreciable distance. The energy density of biomass is one-tenth that of liquid hydrocarbons, and further, it is a solid that cannot be pumped. In order to make wood and other biomass more amenable to transport, it can be chipped, but then the energy density will decrease even further. As a result, the energy required to get bulk biomass to usually distant markets is appreciable and constitutes a size- able percentage of the fuel market it wants to replace.
Biomass Waste
On the other hand, there are circumstances where large quantities of waste bio- mass arise as a result of some other economic activity such as forestry, papermak- ing, and sugar. Under these circumstances most of the costs associated with the collection of the biomass and its transport to a central location is borne by the main product. Thus in these areas somewhat larger biomass gasifiers (500-1000t/d corresponding 80-160 MWth ) can and have been built. However, none of these are of a capacity to be compared with world-scale plants based on fossil fuel feedstocks of 200-1000 MWth.
4.3.4
B/o-O//
Development Potential
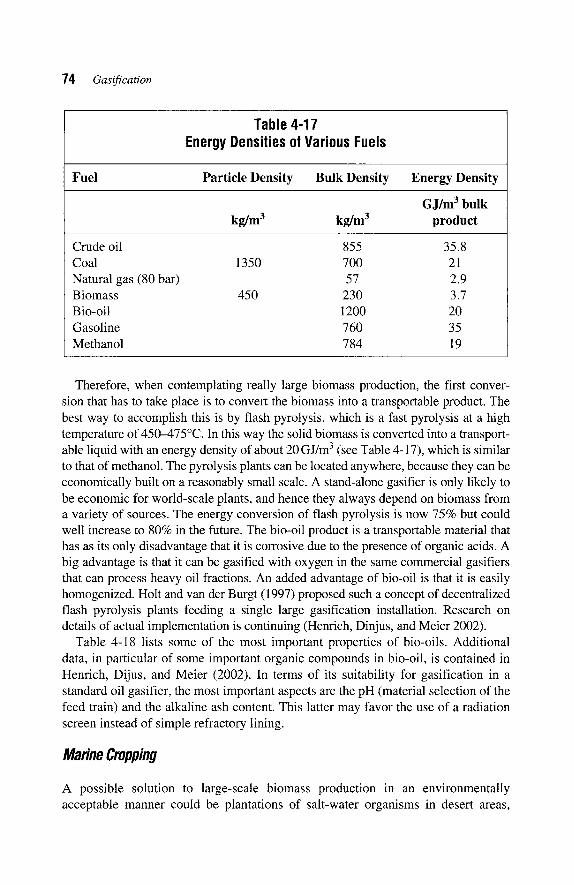
The major drawback of biomass is that the energy density is an order of magnitude lower than that of crude oil (Table 4-17). When it is further considered that biomass for fuel is a difficult to handle solid (grain is an exception in that it almost flows like water), this implies that fuel biomass can never be shipped economically over long intercontinental distances.
74 Gasification
Table 4-17 Energy Densities of Various Fuels
Fuel Particle Density Bulk Density Energy Density
GJ/m 3 bulk kg/m 3 kg/m 3 product
Crude oil 855 35.8 Coal 1350 700 21 Natural gas (80 bar) 57 2.9 Biomass 450 230 3.7 Bio-oil 1200 20 Gasoline 760 35 Methanol 784 19
Therefore, when contemplating really large biomass production, the first conver- sion that has to take place is to convert the biomass into a transportable product. The best way to accomplish this is by flash pyrolysis, which is a fast pyrolysis at a high temperature of 450-475~ In this way the solid biomass is converted into a transport- able liquid with an energy density of about 20 GJ/m 3 (see Table 4-17), which is similar to that of methanol. The pyrolysis plants can be located anywhere, because they can be economically built on a reasonably small scale. A stand-alone gasifier is only likely to be economic for world-scale plants, and hence they always depend on biomass from a variety of sources. The energy conversion of flash pyrolysis is now 75% but could well increase to 80% in the future. The bio-oil product is a transportable material that has as its only disadvantage that it is corrosive due to the presence of organic acids. A big advantage is that it can be gasified with oxygen in the same commercial gasifiers that can process heavy oil fractions. An added advantage of bio-oil is that it is easily homogenized. Holt and van der Burgt (1997) proposed such a concept of decentralized flash pyrolysis plants feeding a single large gasification installation. Research on details of actual implementation is continuing (Henrich, Dinjus, and Meier 2002).
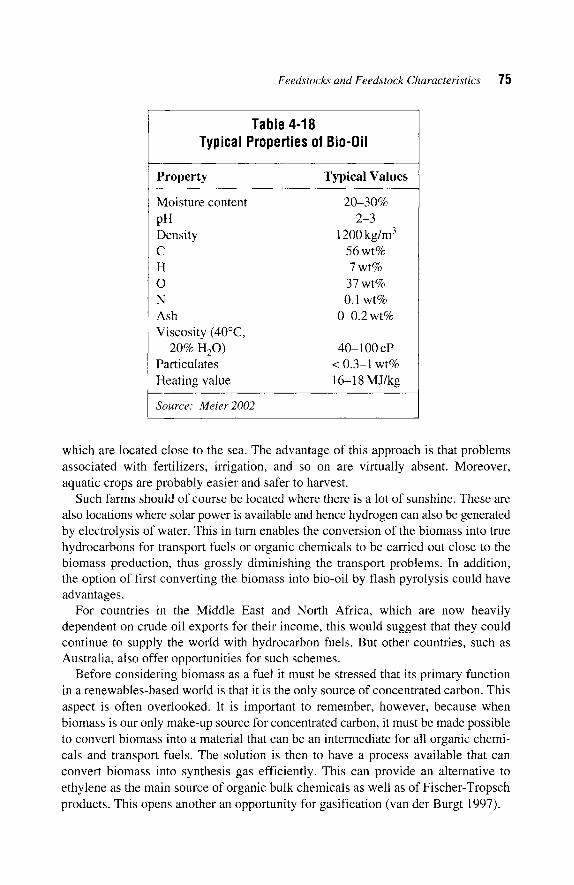
Table 4-18 lists some of the most important properties of bio-oils. Additional data, in particular of some important organic compounds in bio-oil, is contained in Henrich, Dijus, and Meier (2002). In terms of its suitability for gasification in a standard oil gasifier, the most important aspects are the pH (material selection of the feed train) and the alkaline ash content. This latter may favor the use of a radiation screen instead of simple refractory lining.
Marine Cropping
A possible solution to large-scale biomass production in an environmentally acceptable manner could be plantations of salt-water organisms in desert areas,
Feedstocks and Feedstock Characteristics 75
Table 4-18 Typical Properties of Bio-Oil
Property Typical Values
Moisture content 20-30% pH 2-3
1200 kg/m 3 Density C 56 wt% H 7 wt% O 37 wt% N 0.1 wt% Ash 0-0.2 wt% Viscosity (40~
20% H20 ) 40-100 cP Particulates < 0.3-1 wt% Heating value 16-18 MJ/kg
Source: Meier 2002
which are located close to the sea. The advantage of this approach is that problems associated with fertilizers, irrigation, and so on are virtually absent. Moreover, aquatic crops are probably easier and safer to harvest.
Such farms should of course be located where there is a lot of sunshine. These are also locations where solar power is available and hence hydrogen can also be generated by electrolysis of water. This in turn enables the conversion of the biomass into true hydrocarbons for transport fuels or organic chemicals to be carried out close to the biomass production, thus grossly diminishing the transport problems. In addition, the option of first converting the biomass into bio-oil by flash pyrolysis could have advantages.
For countries in the Middle East and North Africa, which are now heavily dependent on crude oil exports for their income, this would suggest that they could continue to supply the world with hydrocarbon fuels. But other countries, such as Australia, also offer opportunities for such schemes.
Before considering biomass as a fuel it must be stressed that its primary function in a renewables-based world is that it is the only source of concentrated carbon. This aspect is often overlooked. It is important to remember, however, because when biomass is our only make-up source for concentrated carbon, it must be made possible to convert biomass into a material that can be an intermediate for all organic chemi- cals and transport fuels. The solution is then to have a process available that can convert biomass into synthesis gas efficiently. This can provide an alternative to ethylene as the main source of organic bulk chemicals as well as of Fischer-Tropsch products. This opens another an opportunity for gasification (van der Burgt 1997).
76 Gasification
4.4 WASTES
"Waste" as a gasification feedstock covers a wide range of materials, both solid and liquid. Some materials, which we include in this section, could as easily have been included under biomass. Other chemical liquid wastes described here could also have been included in Section 4.2. The selection of materials described here is therefore to some extent arbitrary, but it has mainly been guided by self-classification of specific projects and general tradition within the gasification industry.
One of the most difficult aspects of waste as a feedstock, whether for gasification or incineration, is its heterogeneous nature. In this connection the interconnected properties of heating value and moisture content play an important part for both solid and liquid feeds. For solids, particle size is another key parameter. The pre- sence of a number of components in the waste such as sulfur, chlorides, or metals can also vary considerably. The variations can be seasonal or even daily. Even with well-defined industrial wastes, where several waste streams are fed together to the gasifier, differing proportions of the individual streams can have an influence on gasifier performance.
For these reasons feedstock preparation plays an important role in the design of any waste gasification project. Equally important, this wide variation tends to make each project unique.
The long-term supply of the feedstock is another aspect to be considered. For this and other reasons it is often important that the refuse is processed with a support feedstock such as coal or residual oil. Ideally, the economics of the plant should be robust even in the absence of the refuse feedstock.
In the European Union there are about 500 million tons per year of waste that is suitable for thermal treatment. Of this some 6% is classified as hazardous waste, which includes clinical wastes, some wastes derived from agriculture, and chemical industry wastes (Schwager and Whiting 2002).
4.4.1 Solid Waste
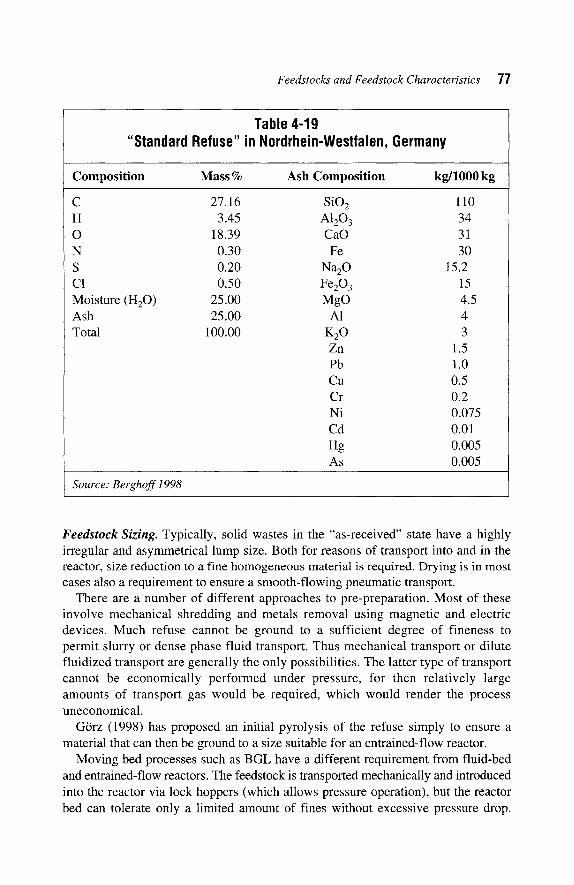
One of the difficulties with refuse is the variability of its chemical composition. For a study comparing various refuse incineration and gasification processes, the State Environmental Office of Nordrhein-Westfalen developed a "standard refuse" composition, which is given in Table 4-19. The lower heating value was specified as 10 MJ/kg.
L6ffler (1998) reports the composition of other types of refuse as specified for a circulating fluid-bed gasifier in Rtidersdorf.
Care should be exercised, however, when evaluating such data, which is very locality specific. In particular, local regulations on separation and recycling of household waste including plastics can have a dramatic effect on the heating value.
Feedstocks and Feedstock Characteristics 7"/
Table 4-19 "Standard Refuse" in Nordrhein-Westfalen, Germany
Composition Mass% Ash Composition kg/lO00 kg
C 27.16 H 3.45 O 18.39 N 0.30 S 0.20 C1 0.50 Moisture (H20) 25.00 Ash 25.00 Total 100.00
SiO 2 110 A120 3 34 CaO 31 Fe 30
Na20 15.2 Fe203 15 MgO 4.5
A1 4
K20 3 Zn 1.5 Pb 1.0 Cu 0.5 Cr 0.2 Ni 0.075 Cd 0.01 Hg 0.005 As 0.005
Source: Berghoff 1998
Feedstock Sizing. Typically, solid wastes in the "as-received" state have a highly irregular and asymmetrical lump size. Both for reasons of transport into and in the reactor, size reduction to a fine homogeneous material is required. Drying is in most cases also a requirement to ensure a smooth-flowing pneumatic transport.
There are a number of different approaches to pre-preparation. Most of these involve mechanical shredding and metals removal using magnetic and electric devices. Much refuse cannot be ground to a sufficient degree of fineness to permit slurry or dense phase fluid transport. Thus mechanical transport or dilute fluidized transport are generally the only possibilities. The latter type of transport cannot be economically performed under pressure, for then relatively large amounts of transport gas would be required, which would render the process uneconomical.
G6rz (1998) has proposed an initial pyrolysis of the refuse simply to ensure a material that can then be ground to a size suitable for an entrained-flow reactor.
Moving bed processes such as BGL have a different requirement from fluid-bed and entrained-flow reactors. The feedstock is transported mechanically and introduced into the reactor via lock hoppers (which allows pressure operation), but the reactor bed can tolerate only a limited amount of fines without excessive pressure drop.
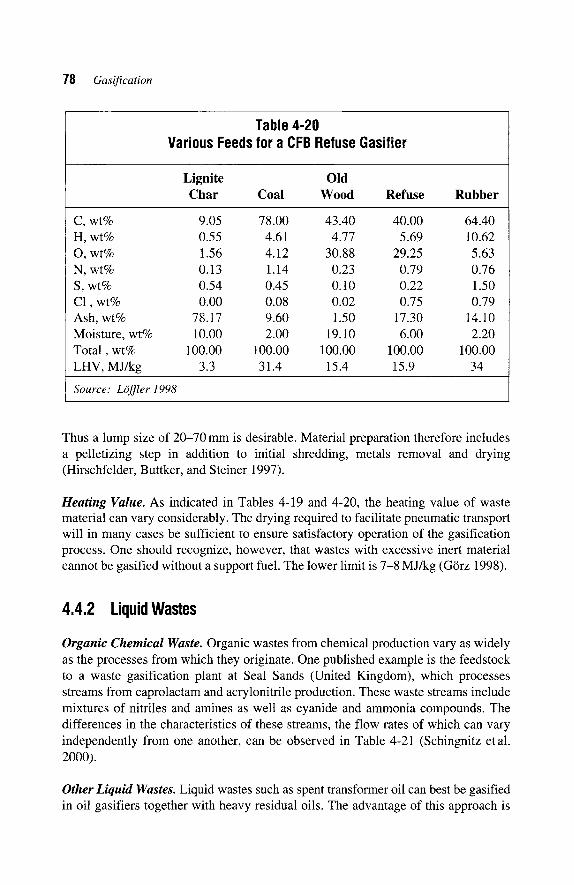
78 Gasification
Table 4-20 Various Feeds for a CFB Refuse Gasifier
Lignite Old Char Coal Wood Refuse Rubber
C, wt% 9.05 78.00 43.40 40.00 64.40 H, wt% 0.55 4.61 4.77 5.69 10.62 O, wt% 1.56 4.12 30.88 29.25 5.63 N, wt% 0.13 1.14 0.23 0.79 0.76 S, wt% 0.54 0.45 0.10 0.22 1.50 C1, wt% 0.00 0.08 0.02 0.75 0.79 Ash, wt% 78.17 9.60 1.50 17.30 14.10 Moisture, wt% 10.00 2.00 19.10 6.00 2.20 Total, wt% 100.00 100.00 100.00 100.00 100.00 LHV, MJ/kg 3.3 31.4 15.4 15.9 34
Source: LOftier 1998
Thus a lump size of 20-70 mm is desirable. Material preparation therefore includes a pelletizing step in addition to initial shredding, metals removal and drying (Hirschfelder, Buttker, and Steiner 1997).
Heating Value. As indicated in Tables 4-19 and 4-20, the heating value of waste material can vary considerably. The drying required to facilitate pneumatic transport will in many cases be sufficient to ensure satisfactory operation of the gasification process. One should recognize, however, that wastes with excessive inert material cannot be gasified without a support fuel. The lower limit is 7-8 MJ/kg (G6rz 1998).
4.4.2 Liquid Wastes
Organic Chemical Waste. Organic wastes from chemical production vary as widely as the processes from which they originate. One published example is the feedstock to a waste gasification plant at Seal Sands (United Kingdom), which processes streams from caprolactam and acrylonitrile production. These waste streams include mixtures of nitriles and amines as well as cyanide and ammonia compounds. The differences in the characteristics of these streams, the flow rates of which can vary independently from one another, can be observed in Table 4-21 (Schingnitz etal. 2000).
Other Liquid Wastes. Liquid wastes such as spent transformer oil can best be gasified in oil gasifiers together with heavy residual oils. The advantage of this approach is
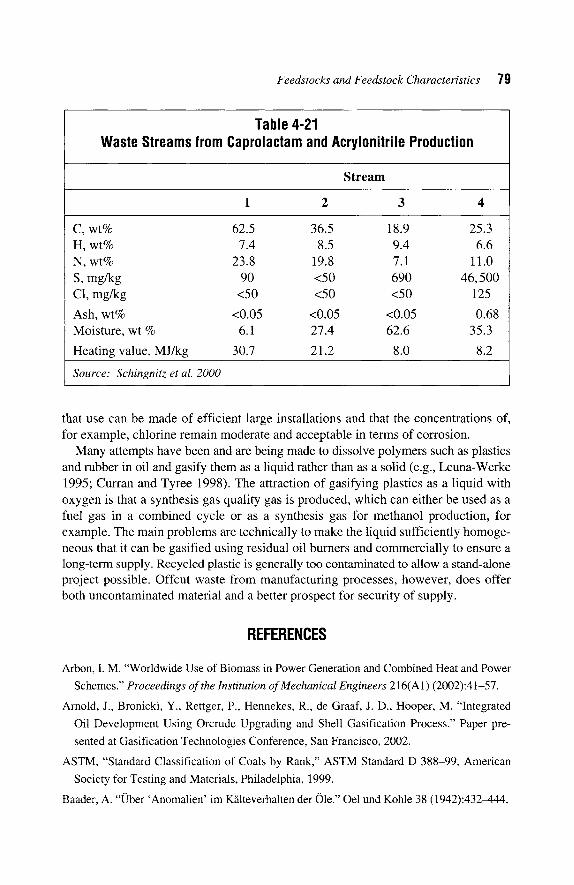
Feedstocks and Feedstock Characteristics 79
Table 4-21 Waste Streams from Caprolactam and Acrylonitrile Production
Stream
1 2 3 4
C, wt% 62.5 36.5 18.9 25.3 H, wt% 7.4 8.5 9.4 6.6 N, wt% 23.8 19.8 7.1 11.0 S, mg/kg 90 <50 690 46,500 C1, mg/kg <50 <50 <50 125
Ash, wt% <0.05 <0.05 <0.05 0.68 Moisture, wt % 6.1 27.4 62.6 35.3
Heating value, MJ/kg 30.7 21.2 8.0 8.2
Source: Schingnitz et al. 2000
that use can be made of efficient large installations and that the concentrations of, for example, chlorine remain moderate and acceptable in terms of corrosion.
Many attempts have been and are being made to dissolve polymers such as plastics and rubber in oil and gasify them as a liquid rather than as a solid (e.g., Leuna-Werke 1995; Curran and Tyree 1998). The attraction of gasifying plastics as a liquid with oxygen is that a synthesis gas quality gas is produced, which can either be used as a fuel gas in a combined cycle or as a synthesis gas for methanol production, for example. The main problems are technically to make the liquid sufficiently homoge- neous that it can be gasified using residual oil burners and commercially to ensure a long-term supply. Recycled plastic is generally too contaminated to allow a stand-alone project possible. Offcut waste from manufacturing processes, however, does offer both uncontaminated material and a better prospect for security of supply.
REFERENCES
Arbon, I. M. "Worldwide Use of Biomass in Power Generation and Combined Heat and Power
Schemes." Proceedings of the Institution of Mechanical Engineers 216(A1) (2002):41-57.
Arnold, J., Bronicki, Y., Rettger, P., Hennekes, R., de Graaf, J. D., Hooper, M. "Integrated
Oil Development Using Orcrude Upgrading and Shell Gasification Process." Paper pre-
sented at Gasification Technologies Conference, San Francisco, 2002.
ASTM, "Standard Classification of Coals by Rank," ASTM Standard D 388-99, American
Society for Testing and Materials, Philadelphia, 1999.
Baader, A. "Uber 'Anomalien' im K~ilteverhalten der Ole." Oel und Kohle 38 (1942):432-444.
80 Gasification
Bajohr, S. Private communication. September, 2002.
BASF. Technical leaflet, BASF Catalyst K 8-11. Ludwigshafen: BASF AG, (undated).
Bauer, G., Gtither, V., Hess, H., Otto, A., Roidl, O., Roller, H., and Sattelberger, S. In Ullmann's
Encyclopedia of Industrial Chemistry, 5th ed. vol. A 27. Weinheim: VCH Verlagsgesellschaft,
1989.
Baughman, G. L. Synthetic Fuels Data Handbook. Denver: Cameron Engineers, 1978.
Beeg, K., Schneider, W., and Sparing, M. "Einfache Bestimmung umweltrelevanter Metall-
carbonyle in technischen Gasen mittels Flammen-AAS." Chemische Technik 45(3) (June
1993):158-161.
Berghoff, R. "Thermodynamische Bewertung der Abfallvergasungsprozesse." In Ver-
gasungsverfahren fiir die Entsorgung von Abftillen, eds. M. Born and R. Berghoff. Dtissel-
doff: Springer-VDI, 1998.
BP BP Statistical Review of World Energy. London: BP PLC, June 2002.
Bridgwater, A. V. "Thermal Conversion of Biomass and Waste: The Status." Paper presented at
IChemE Conference, "Gasification: The Clean Choice for Carbon Management." Noordwijk,
2002.
Channiwala, S. A., and Parikh, P. P. "A Unified Correlation for Estimating HHV of Solid,
Liquid, and Gaseous Fuels." Fuel 81(8) (May 2002):1051-1063.
Collodi, G. "Commercial Operation of ISAB Energy and Sarlux IGCC." Paper presented at
Gasification Technologies Conference, San Francisco, 2001.
Crowley, M. S. "Hydrogen-Silica Reactions in Refractories." Ceramic Bulletin 46(7)
(1967):679-682.
Curran, P., and Tyree, R. F. "Feedstock Versatility for Texaco Gasification." Paper presented
at IChemE Conference, "Gasification: The Gateway to a Cleaner Future," Dresden, September
1998.
Gommans, R. J., and Huurdeman, T. L. "DSM's Experience with Metal Dusting in Waste
Heat Boilers." Paper presented at AIChE Ammonia Safety Symposium, Vancouver,
1994.
Grrz, J. "Anforderungen an Einsatzstoffe und Prozessparameter bei Nutzung der Flug-
stromvergasung ftir die Vergasung von Abfallstoffen." In Vergasungsverfahren fiir die
Entsorgung von Abftillen, eds. M. Born and R. Berghoff. Dtisseldorf: Springer-VDI,
1998.
GroBe, L., Henning, F., Kirschbaum, E., Reitz, O., and Schumacher, R. Arbeitsmappe fiir
Mineralrlingenieure page L 4. Dtisseldorf: VDI-Verlag, 1962
Gumz, W. Gas Producers and Blast Furnaces. New York: John Wiley & Sons, 1950.
Hannemann, F., Kanaar, M., Karg, J., and Schiffers, U. "Buggenum Experience and Improved
Concepts for Syngas Application." Paper presented at Gasification Technologies Conference,
San Francisco, 2002.
Feedstocks and Feedstock Characteristics 81
Henrich, E., Dinjus, E., and Meier, D. "Flugstromvergasung von fliissigen Pyrolyseprodukten
bei hohem Druck: Ein neues Konzept zur Biomassevergasung." Paper presented at DGMK
Conference, "Energetische Nutzung von Biomassen," Velen, Germany, 2002.
Higman, C. A. A. "Synthesis Gas Processes for Synfuels Production." Paper presented at
Eurogas '90, Trondheim, June 1990.
Hirschfelder, H., Buttker, B., and Steiner, G. "Concept and Realization of the Schwarze
Pumpe 'Waste to Energy and Chemicals Centre.'" Paper presented at IChemE Conference
"Gasification Technology in Practice," Milan, 1997.
Holt, N., and van der Burgt, M. "Biomass Conversion: Prospects and Context." Paper pre-
sented at 16th EPRI Gasification Technology Conference, San Francisco, October 1997.
Kanaar, M., and Wolters, C. "Nuon Power Buggenum IGCC." Paper presented at Gasifica-
tion Technologies Conference, San Francisco, October 2002.
Klensch, S. "Verhalten von Schwermetallen bei der thermischen Umwandlung von S~.gesp~inen
im Flugstrom." Ph.D. diss., Engler-Bunte-Institut der Universit~it Karlsruhe (TH), 2001.
Kural, O. Coal. Istanbul: Istanbul Technical University, 1994.
Leuna-Werke GmbH "Verfahren zur Herstellung von Synthesegas aus Erd61riickst~inden und
Altkunststoff oder Altkunststoffgemischen." German Patent DE 43 29 436 C1, March 1995.
Liebner, W. "MPG-Lurgi/SVZ Multi-purpose Gasification: A New and Proven Technology."
Paper presented at Tenth Refinery Technology Meet, Mumbai, February 1998.
L6ffier, J. C. (1998) "Zirkulierende Wirbelschicht zur Erzeugung von Schwachgas." In
Vergasungsverfahren fiir die Entsorgung von Abfiillen, eds. M. Born and R. Berghoff.
Dtisseldorf: Springer-VDI, 1998.
Mahagaokar, U., and Hauser, N. "Gasification of Petroleum Coke in the Shell Coal Gasification
Process." Paper presented at IMP Gasification Colloquium, Mexico City, February 1994.
Marklund, M. "Black Liquor Recovery: How Does It Work?" Available at www.etcpitea.se/
blg/document/PBLG_or_RB.pdf, (December 2001).
Marruffo, F., Sarmiento, W., and Alcala, A. "Gasification of Orimulsion: Synergism of the
Two Technologies." Paper presented at Gasification Technologies 2001 Conference, San
Francisco, 200 I.
Meier, D. "Flash-Pyrolyse zur Verfltissigung von Biomasse---Stand der Technik." Paper presented
at DGMK Conference, "Energetische Nutzung von Biomassen," Velen, Germany, 2002.
Meyers, R. A. Handbook of Synfuels Technology. New York: McGraw-Hill, 1984.
Parkinson, G. "Combing Oil from Tar Sands." Chemical Engineering 109(5) (May 2002):27-31.
Patterson, J. H., Hurst, H. J., and Quintanar, A. "Slag Compositional Limits for Coal Use in
Slagging Gasifiers." Paper presented at 19th International Pittsburgh Coal Conference,
Pittsburgh, 2002.
Perry, R. H., and Chilton, C. H. Chemical Engineer's Handbook. 5th ed. Tokyo: McGraw-
Hill-Kogakusha, 1973.
82 Gasification
Posthuma, S. A., Vlaswinkel, P. L., and Zuideveld, P. L. "Shell Gasifiers in Operation." Paper
presented at IChemE Conference "Gasification Technology in Practice," Milan, 1997.
Quaak, P., Knoef, H., and Stassen, H. Energy from Biomass: A Review of Combustion and
Gasification Technologies. Washington, DC: World Bank, 1999.
Ramprasad, R., Vakil, T., Falsetti, J., and Islam, M., "Competitiveness of Gasification at the
Bulwer Island, Australia Refinery." Paper presented at Gasification Technologies Confer-
ence, San Francisco, 1999.
Ricketts, B., Hotchkiss, R., Livingston, B., and Hall, M. "Technology Status Review of
Waste/Biomass Co-Gasification with Coal." Paper presented at IChemE Conference, "Gas-
ification: The Clean Choice for Carbon Management," Noordwijk, April 2002.
Schellberg, W., and Garcia Pefia, F. "Commercial Operation of the Puertollano IGCC Plant."
Paper presented at IChemE Conference, "Gasification: The Clean Choice for Carbon
Management," Noordwijk, 2002.
Schingnitz, M., Gaudig, U., McVey, I., and Wood, K. "Gasifier to Convert Nitrogen Waste
Organics at Seal Sands, UK." Paper presented at IChemE Conference "Gasification for the
Future," Noordwijk, April 2000.
Schwager, J., and Whiting, K. J. "European Waste Gasification: Technical and Public Policy
Trends and Developments." Paper presented at Gasification Technologies Conference, San
Francisco, October 2002.
Sendin, U. "Proyecto de Gasificaci6n Integrada en Ciclo Combinado de Puertollano." Paper
presented at IMP Gasification Colloquium, Mexico City, February 1994.
SFA Pacific Gasification Database, SFA Pacific Inc., Mountain View, CA, 2001.
Simbeck, D., and Johnson, H. "World Gasification Survey: Industry Trends and Developments."
Paper presented at Gasification Technologies Conference, San Francisco, 2001.
Singh, B., Miadonye, A., and Puttagunta, V. R. "Heavy Oil Viscosity Range from One Test."
Hydrocarbon Processing 75(8) (August 1993): 157-162.
Smil, V. Enriching the Earth. Cambridge, Mass.: MIT Press, 2001.
Smoot, L. D., and Smith, P. J. Coal Combustion and Gasification. New York: Plenum, 1985.
Soyez, W. "Slag-Related Risks in Partial Oxidation Plants." Paper presented at AIChE
Ammonia Safety Meeting, Denver, 1988.
Spare, P. H. "Biomass: What about Health and Safety?" Energy World (June 1997).
Speight, J. G. The Chemistry and Technology of Petroleum. 3rd ed. New York: Marcel
Dekker, 1998.
Speight, J. G. Fuel Science and Technology Handbook. New York: Marcel Dekker, 1990.
Speight, J. G. The Chemistry and Technology of Coal. New York: Marcel Dekker, 1983
Speight, J. G. The Desulfurization of Heavy Oils and Residua. New York: Marcel Dekker, 1981.
Stultz, S. C., and Kitto, J. B. Steam: Its Generation and Use, 40th ed. Barberton, Ohio:
Babcock & Wilcox, 1992.

Feedstocks and Feedstock Characteristics 83
Supp, E. How to Produce Methanol from Coal. Berlin: Springer, 1990.
van der Burgt, M. J. "The Role of Biomass as an Energy Carrier for the Future." Energy
World 246 (Feb. 1997):16-17.
Wiegner, P., Martens, F., Uhlenberg, J., and Wolff, J. "Increased Flexibility of Shell Gasifica-
tion Plant." Paper presented at IChemE Conference, "Gasification: The Clean Choice for
Carbon Management," Noordwijk, April 2002.
Zhao, S., Kotlyar, L. S., Sparks, B. D., Woods, J. R., Gao, J., and Chung, K. H. "Solids Con-
tents, Properties, and Molecular Structures of Asphaltenes from Different Oilsands." Fuel
80 (2001 ): 1907-1914.

本文献由“学霸图书馆-文献云下载”收集自网络,仅供学习交流使用。
学霸图书馆(www.xuebalib.com)是一个“整合众多图书馆数据库资源,
提供一站式文献检索和下载服务”的24 小时在线不限IP
图书馆。
图书馆致力于便利、促进学习与科研,提供最强文献下载服务。
图书馆导航:
图书馆首页 文献云下载 图书馆入口 外文数据库大全 疑难文献辅助工具


![Coal/Gas Feedstock Combination - Gasification & · PDF fileCoal/Gas Feedstock Combination ... Microsoft PowerPoint - Coal-NG Feedstock Combination GTC 14.ppt [Compatibility Mode] Author:](https://img.pdfslide.net/doc/110x75/5a765ec47f8b9a9c548d3cb0/coalgas-feedstock-combination-gasification-syngas-a-coalgas-feedstock.jpg)