Embed Size (px)
Citation preview
"Integration of chosen reduviids and botanicals in CHAPTER - 4groundnut pest management". Ph.D. Thesis submittedby C. Ravi to Manomaniam Sundaranar University,Tirunelveli, Tamil Nadu, India.
IMPACT OF I3IOPESTICWES ON GROUDNUT PESTS AND CROPPRODUCTION
4. 1. Introduction
Field application of the botanicals to minimize the pests and their
infestation was carried out by many workers (Mohamad, 1981; Dhir et al.,
1992; Kalyanasundaram et al., 1994; Ramamurthy and Venugopal, 1997;
Ramaraju ci at., 1998; Senguttwan, 1999; Paulraj, 2001; Selvaraj, 2002;
Sahayaraj, 2002c and Kumar and Prasad, 2002). Various plant products were
tested in the groundnut field to minimize the pests such as S. lilura and H.
armigera (Doureesamy el at., 1990; Venula ci al., 1999; Obulapathi ci at.,
2000; Martinez and Emden, 2000; Paulraj, 2001; Sahayaraj, 2002c and
Selvaraj, 2002) and thereby increased the groundnut production and cost
benefit ratio (Kalyanasundaram ci at., 1994; Paulraj, 2001 and Selvaraj, 2002).
V. negundo has pesticidal property (Abraham ci at., 1972; Jacobson, 1975;
Chandha, 1976; Rai and Kandasamy, 1985; Campos and Quilantang, 1985;
Grainge el al., 1985; Tripathi and Rizvi, 1985; Kandasamy el at., 1987;
Manalo, 1992; Rajesus ci al., 1993; Sahayaraj and Sekar, 1996; Sahayaraj
and Paulraj, 1998c; Paulraj, 2001 and Singh ci at., 2002) in the laboratory
and the field application of the plant extracts greatly reduced the pest
population (Ramamurthy and Venugopal, 1997; Paulraj, 2001 and Sahayaraj,
2002c). 1. carnea is a weed plant with pesticidal property (Sahayaraj el at.,
74
2003; Pandey el al., 1986; Ramamurthy and Venugopal, 1997; Kulat el al.,
1997; Senguttuvan, 1999 and Ramamurthy and Rajaram, 2001) and field
efficacy was also tested (Ramamurthy and Venugopal, 1997).
Augmentative release of the predators is a main component in the IPM
and especially the rcduviids play a major role in the suppression of various
pests of economic importance (Schaeffer, 1988; Ambrose, 1995; 1996; 1999;
2000; Sahayaraj, 1999b; 2002c and Sahayaraj and Martin, 2003). The
reduviid predator, P. laevicollis was released in the coconut field to reduce
the grubs and adults of 0. rhinoceros (Antony el al., 1979). Sahayaraj
(1999b) released R. marginalus in the groundnut field and observed the
suppression of lepidopteran pests and reported high groundnut yield. Grundy
and Maelzer (2000) released P. plagipennis in the pigeon pea field and
reported the control of various pests in Australia. Sahayaraj (2002c)
integrated certain botanicals along with R. marginatus in the groundnut field
and obtained a good groundnut yield. Recently, Sahayaraj and Martin (2003)
reported high yield of groundnut in R. inarginalus released field. R. kumari,
has been reported to feed on the groundnut pests in the laboratory (Sahayaraj,
1994 and Sahayaraj and Sivakumar, 1995). Ambrose and Claver (1999b) and
Claver and Ambrose (2001b, c) released R. kumarii in cotton and pigeon pea
field cages and reported the pest suppression by the predator. However, no
reports are available on the release of this predator in the groundnut field and
the subsequent impact on groundnut production. The present study was
undertaken to find out the impact of the crude water extracts of IC and VN
75
and R. kurnarii separately on groundnut pest incidence, infestation, yield and
cost benefit ratio in groundnut field.
4. 2. Materials and Methods
4. 2. 1. Plot description
4. 2. 1. 1. Plant biopesticide treatment
The experiment was conducted at a farmer's field in Vellalankulam,
Tirunelveli District, Tamil Nadu, India from mid January to May 2(X)!.
Groundnut (variety - TMV 7) was cultivated under well irrigation. The
farmer was advised not to use pesticides or any other pest control practices.
The recommended dose (gypsum - 50 - 100 kg/acre, DAP - 50 kg/acre and
farm yard manure - 1 ton/acre) of fertilizers was used. From the total area
under cultivation, 1620 m2 (36 x 45m) was chosen for the present study.
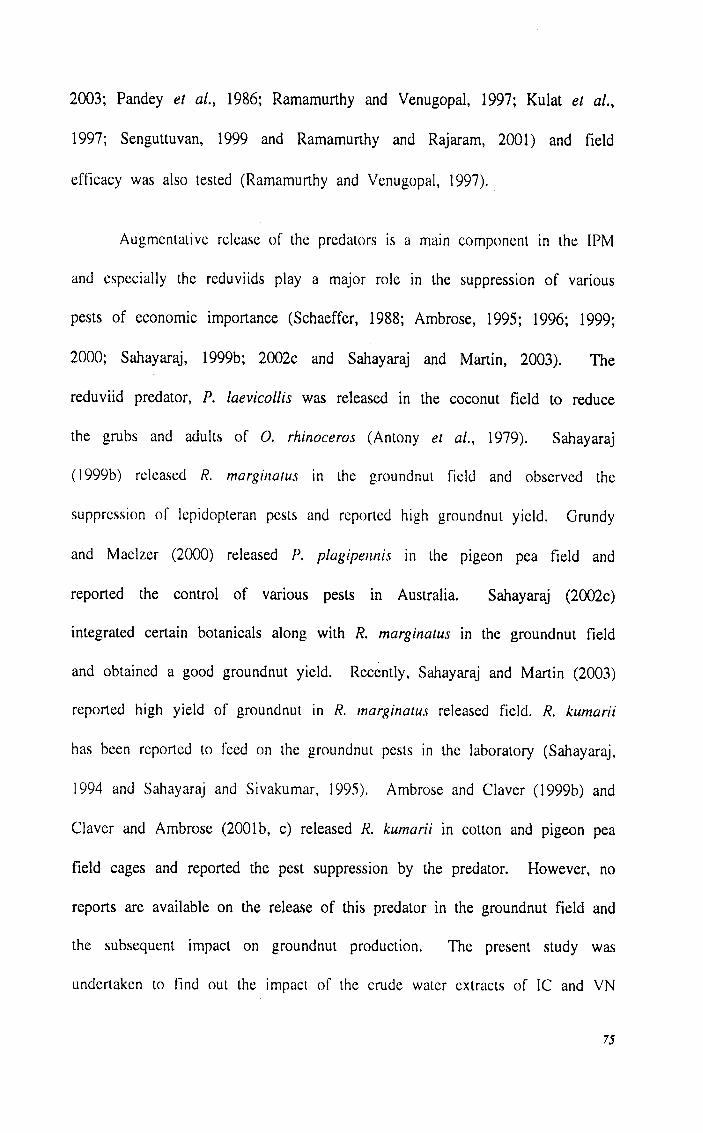
The chosen area was divided into 4 plots (405 m2) (A - IC alone, B - VN
alone, C - equal amount of IC + VN and D - water alone). Each plot was
again divided into three subplots (130.3 m 2). Altogether there were twelve
sub-plots and were arranged in a randomized block design as shown in fig.
17. Each sub-plot was separated from the adjutant sub-plot by providing one
m soil bar (plate 8 ).
76
4.
Fig. 17. Plot description for the biopesticide treatment
Al DI Cl BI
C2 B2 A2 D2
A3 D3 C3 B3
____ 45m
4. 2. 1. 2. Predator release experiment
Field experiments were conducted at Chakkamalpuram, Tuticorin
District, Tamil Nadu, India from June to November 2002, in a groundnut
field (variety - TMV 7) under well irrigation. The owner of the land was
advised not to use pesticides or any other pest control practices. A total area
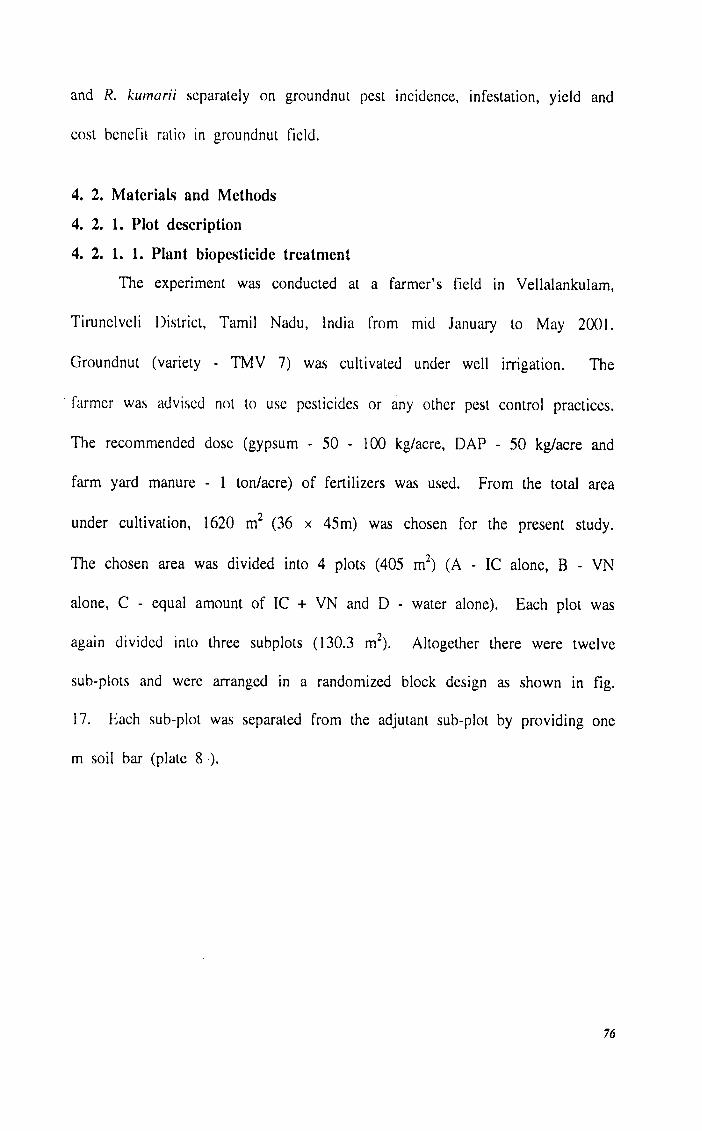
of 1620 m2 (36 x 45 m) was chosen for the present study. The area was
divided into two plots (810 m 2 each) (la and lb) and each plot was again
divided into three sub-plots (249.26 m 2). Altogether there were six subplots
(fig. 18, plate 8 ). Each subplot was separated from the adjacent plot by
providing 1 m soil bar.
Fig. 18. Plot description for the predator released experiment
lLa I
b 1
1h2 1a2
11a3
h3
4_________ 45 m _
E
77
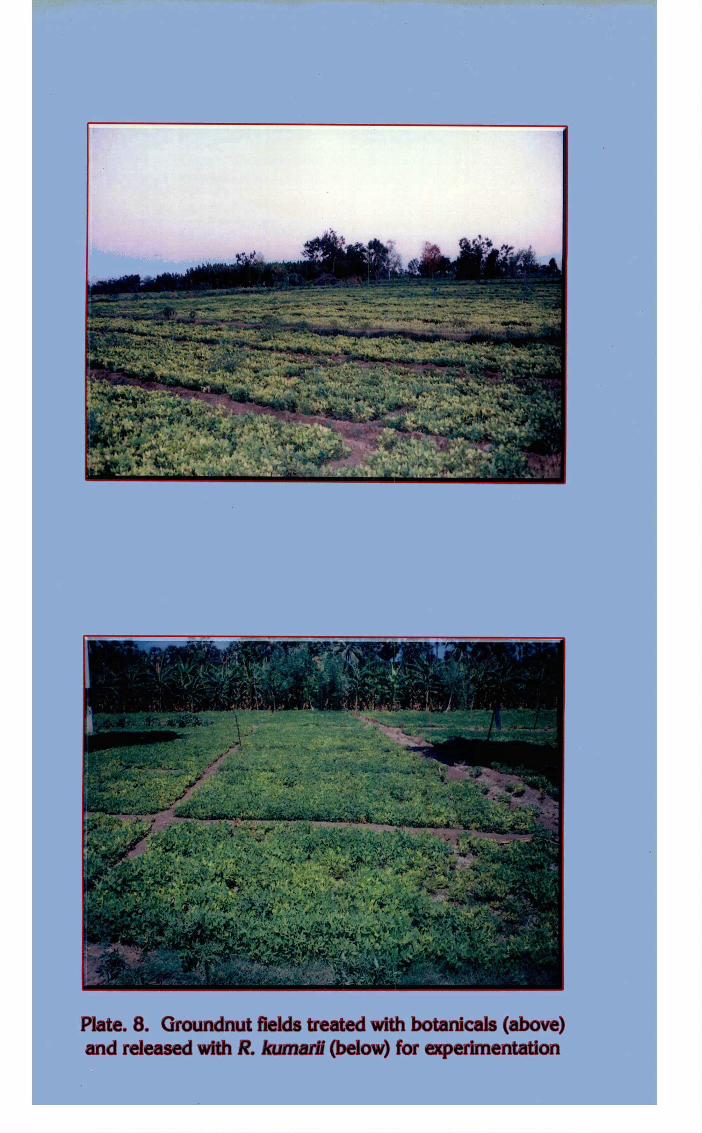
Plate. 8. Groundnut fields treated with botanicals (above)and released with R. kumaril (below) for experimentation
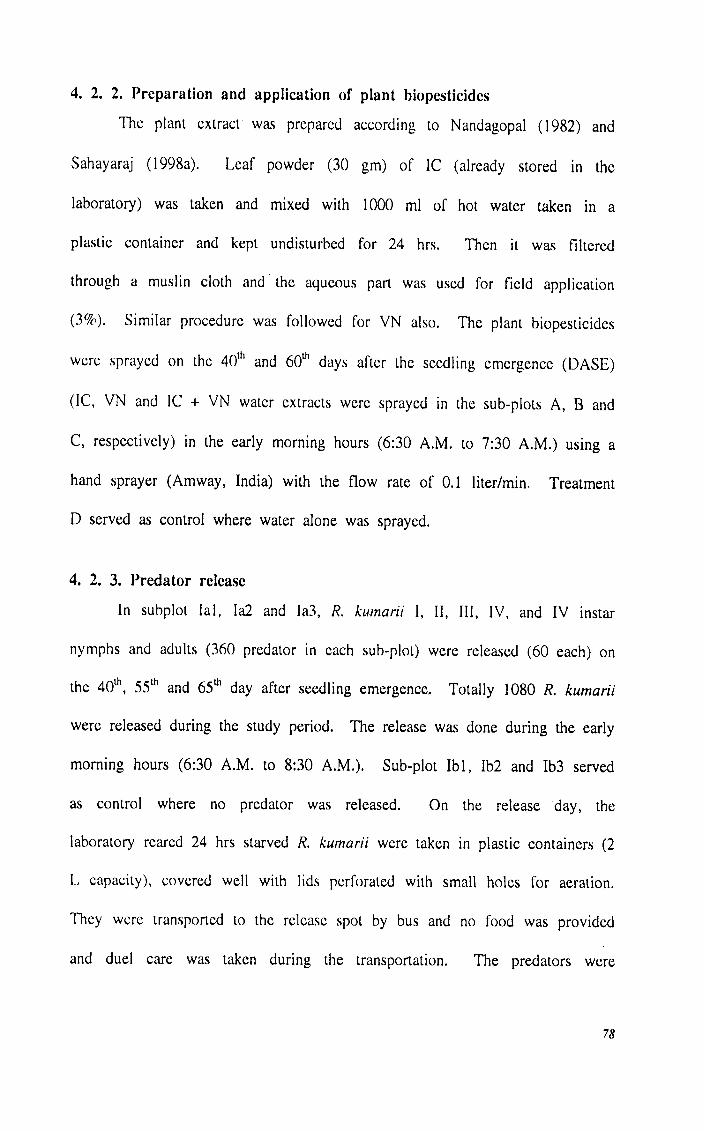
4. 2. 2. Preparation and application of plant biopesticides
The plant extract was prepared according to Nandagopal (1982) and
Sahayaraj (1998a). Leaf powder (30 gm) of IC (already stored in the
laboratory) was taken and mixed with 1000 ml of hot water taken in a
plastic container and kept undisturbed for 24 hrs. Then it was filtered
through a muslin cloth and the aqueous part was used for field application
(3%). Similar procedure was followed for VN also. The plant biopesticides
were sprayed on the 401h and 601h days alter the seedling emergence (DASE)
(IC, VN and IC + VN water extracts were sprayed in the sub-plots A, B and
C, respectively) in the early morning hours (6:30 A.M. to 7:30 A.M.) using a
hand sprayer (Amway, India) with the flow rate of 0.1 liter/mm. Treatment
D served as control where water alone was sprayed.
4. 2. 3. Predator release
In subplot lal, 1a2 and Ia3, R. kurnarii I, II, III, IV, and IV instar
nymphs and adults (360 predator in each sub-plot) were released (60 each) on
the 401h 55th and 65 1h day after seedling emergence. Totally 1080 R. kumarii
were released during the study period. The release was done during the early
morning hours (6:30 A.M. to 8:30 A.M.). Sub-plot Ibi, 1b2 and 1b3 served
as control where no predator was released. On the release day, the
laboratory reared 24 hrs starved R. kurnarii were taken in plastic containers (2
L capacity), covered well with lids perforated with small holes for aeration.
They were transported to the release spot by bus and no food was provided
and duel care was taken during the transportation. The predators were
78
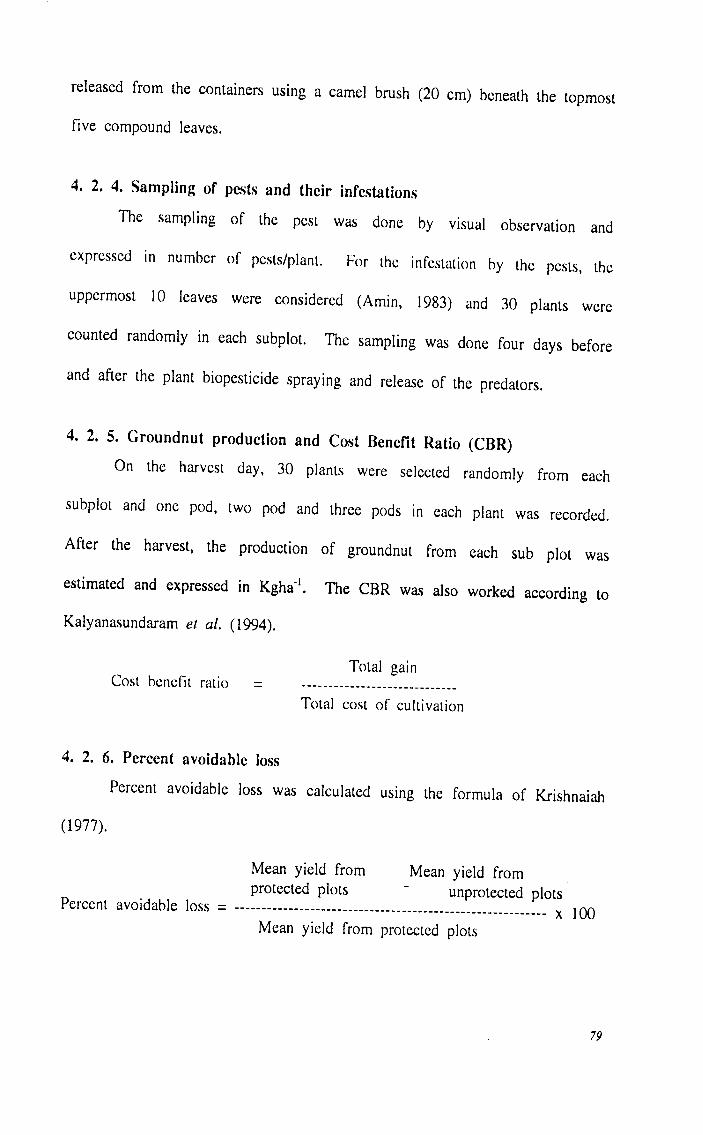
released from the containers using a camel brush (20 cm) beneath the topmost
five compound leaves.
4. 2. 4. Sampling of pests and their infestations
The sampling of the pest was done by visual observation and
expressed in number of pests/plant. For the infestation by the pests, the
uppermost 10 leaves were considered (Amin, 1983) and 30 plants were
counted randomly in each subplot. The sampling was done four days before
and after the plant biopesticide spraying and release of the predators.
4. 2. 5. Groundnut production and Cost Benefit Ratio (CBR)
On the harvest day, 30 plants were selected randomly from each
subplot and one pod, two pod and three pods in each plant was recorded.
After the harvest, the production of groundnut from each sub plot was
estimated and expressed in Kgha'. The CBR was also worked according to
Kalyanasundaram el al. (1994).
Total gainCost benefit ratio =
Total cost of cultivation
4. 2. 6. Percent avoidable loss
Percent avoidable loss was calculated using the formula of Krishnaiah
(1977).
Mean yield from Mean yield fromprotected plots unprotected plots
Percent avoidable loss = ----------------------------------------------------------x iooMean yield from protected plots
79
4. 2. 7. Statistics
ANOVA was carried out using SYSTAT and STATISTICA computer
package and were interpreted.
4. 3 Results
4. 3. 1. Pest incidence
In the botanicals treated field, the predominant pest observed was Aphis
craccivora Koch (24.66, 25.12, 24.33 and 24.66 per plant for control, VN, IC
and VN + IC plots for the 36111 DASFI, respectively) followed by S. lilura
(0.65/plant in all the treatments in the first count), H. armigera (0.25/plant in
all the treatments in the first count) and grass hoppers like Atraclomorpha
crenulata Fab. and Chrotogonus trachypierus Blanch (0.12/plant for all the
treatments in the first count). The incidence of all the pests gradually
decreased after the application of the botanicals. Reduction in A. craccii'ora
population (24.58, 16.36, 12.50/plant for VN, IC and VN + IC plots,
respectively) was observed and were significant (P . < 0.05; p = 0.0006) than
the control. S. litura (0.48, 0.36 and 0.24/plant for VN, IC and VN+IC plots
respectively) population was also statistically significantly (P < 0.05; p
0.0006) reduced than that of the control (0.87/plant). The incidence of pests
coincided with the application of botanicals (table 23).
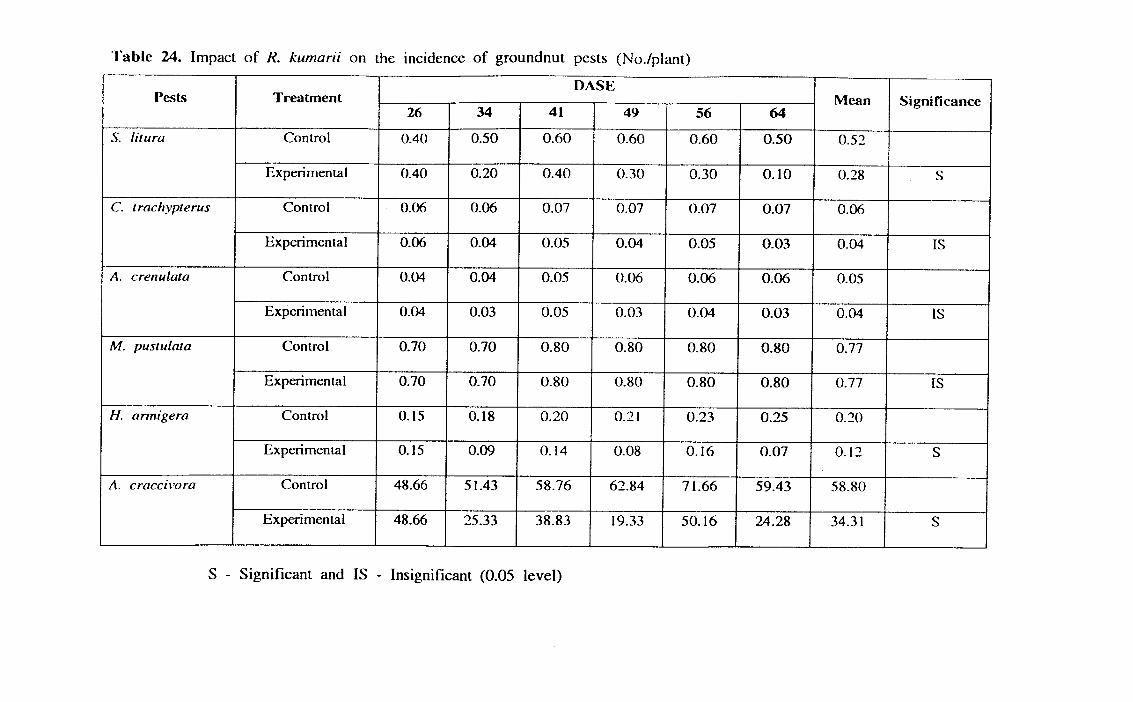
The occurrence of the pest in the experimental field where predators
were released is shown in table 24. Initially, the occurrence of A. craccivora
(48.66/plant), S. litura (0.40/plant), C. Irachyterus (0.06/plant), A. crenulata
(0.04/plant), M. pustulata (0.70/plant) and H. armigera (0.15/plant) was
maximum and after the release of the predators, their population was
80
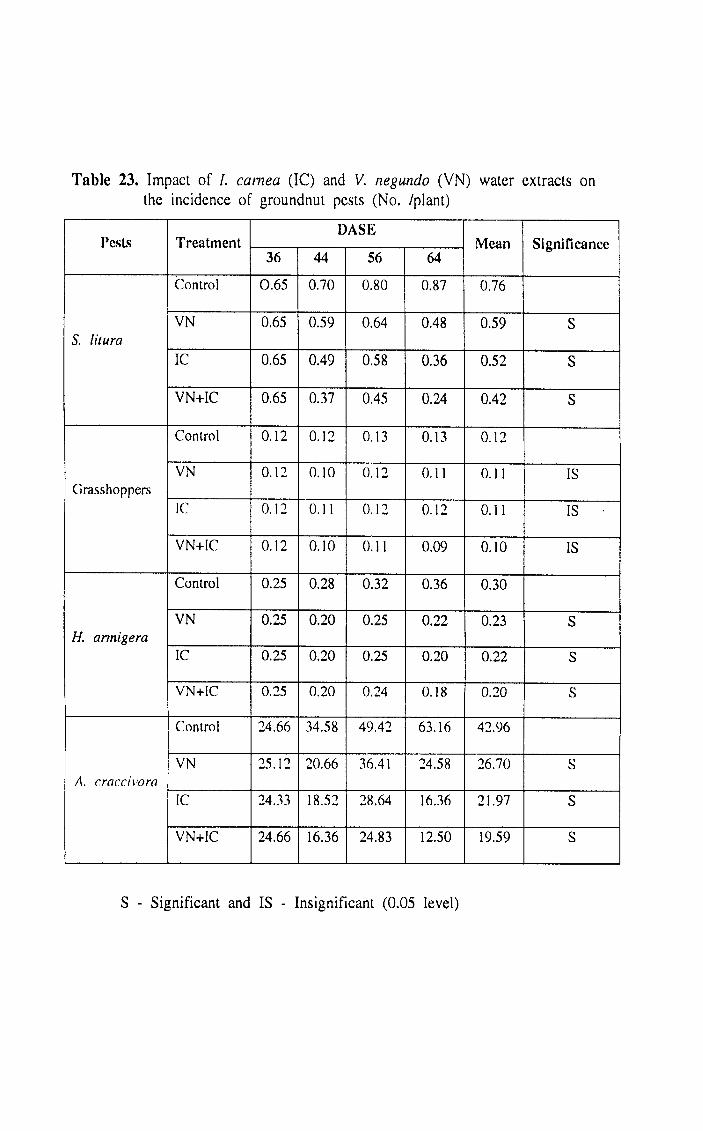
Table 23. Impact of I. carnea (IC) and V. negundo (VN) water extracts onthe incidence of groundnut pests (No. /plant)
DASEPesls Treatment ______
36 44 56 64Mean Signiflcance
Control 0.65 0.70 0.80 0.87 0.76
VN 0.65 0.59 0.64 0.48 0.59 SS. litura
IC 0.65 0.49 0.58 0.36 0.52 S
VN+IC 0.65 0.37 0.45 0.24 0.42 S
Control 0.12 0.12 0.13 0.13 0.12
VN 0.12 0.10 0.12 0.11 0.11 ISGrasshoppers
IC 0.12 0.11 0.12 0.12 0.11 IS
VN+IC 0.12 0.10 0.11 0.09 0.10 IS
Control 0.25 0.28 0.32 0.36 0.30
VN 0.25 0.20 0.25 0.22 0.23 SH. armigera
IC 0.25 0.20 0.25 0.20 0.22 S
VN+IC 0.25 0.20 0.24 0.18 0.20 S
Control 24.66 34.58 49.42 63.16 42.96
V 25.12 20.66 36.41 24.58 26.70 SA. cracciora
IC 24.33 18.52 28.64 16.36 21.97 S
VN+IC 24.66 16.36 24.83 12.50 19.59 S
S - Significant and IS - Insignificant (0.05 level)
C)zzCC
)
C)
-JECC)
C)
rJ)
N 0
0 C
r
N N
C
N
-N
C
C
C
C
N
N
N
-
C c
od d
cc c
od
C C
N
e' 'C
r C
C
'r N
- C
C
C
C
00 00 N
C
d d
d d
6 C
5 6
d d
0 0
N
'C
0 C
r
'C 'C
'C 'C
r
c C
C
C
00 00 C
14 -
d d
d
dd d
C C
N
r C
C
-
00'o
C C
0 0 00 00 C
l C
d d
d d
d d
d d
d
d d
d d
d d
d d
d
I:r
L.r
L.-
--
•r.C
0C
00
0U
o.. U
o.. U
o.. U
o. U
o
U
ox
N
c)
U
>-0CIrJ)•0'SC.)
drastically reduced, especially that of A. craccivora (24.28) at 64 DASE and
was highly significant (P < 0.05; P = 0.0083) than that of the control
(59.43/plant). Significant reduction in the S. litura (P < 0.05; P = 0.0086)
and H. annigera (P < 0.05; P = 0.0077) population were also observed. But
the release of the predator did not alter the population of M. pusiulata (0.77
for both control and reduviid released field, respectively) and eventhough it
reduced the population of C. trachylerus and A. crenulata they were not
statistically significant at 5% level. R. kumarii reduced 66.66, 40, 25, 0,
56.25, and 51.59% of S. litura, C. trachvierus, A. crenulala, M. pustulala, H.
annigera and A. craccii'ora population, respectively.
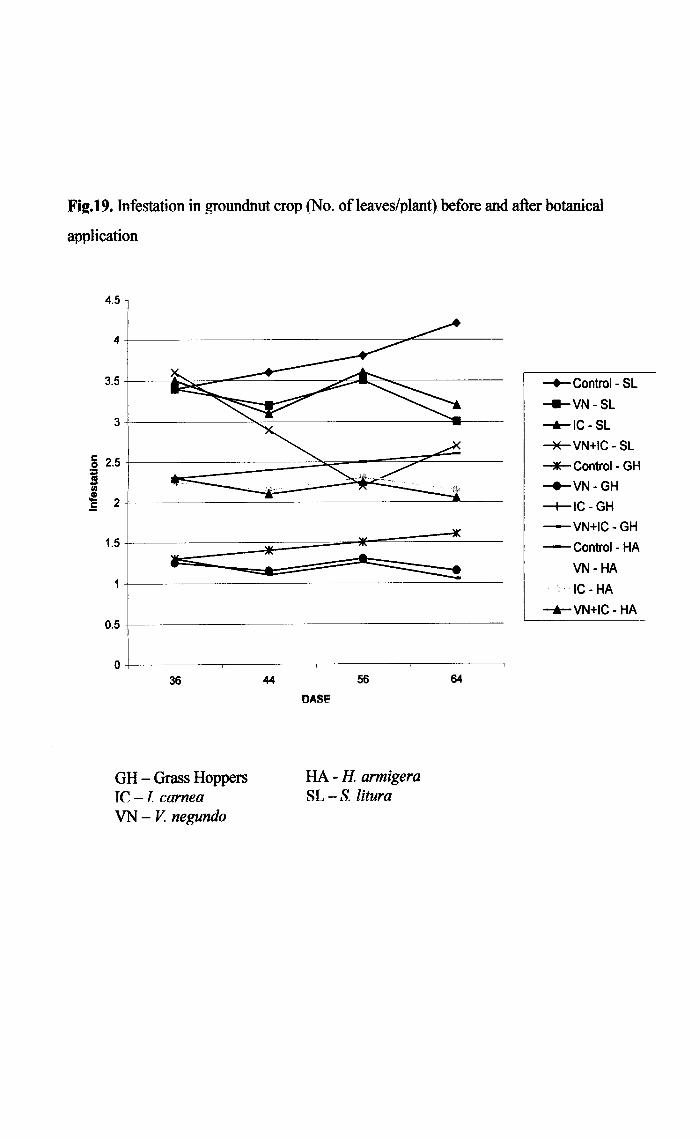
4. 3. 2. Pest infestation
The infestation of three groundnut pests viz., S. litura, H. arinigera
and grasshoppers in the botanicals treated field and control were observed and
are shown in fig. 19. In general, the infestation due to S. litura was higher
(3.4, 3.5, 3.5 and 3.6 in the control, VN, IC and IC + VN plots respectively
for the 36Ih DASE) than other two pests. The infestations due to the pests
were high before the application of the botanicals and after the application of
both IC and VN water extracts, it was greatly reduced and are statistically
significant than control (P < 0.05). For instance, the infestation due to
H. armigera before the application was 1.25/plant and after the application of
VN, it was reduced to 1.15/plant. Both the botanicals greatly minimized the
mean infestation of the pests solely and in combination, a great reduction in
the infestation of the leaves was observed (2.85, 1.17 and 1.17 for S. lilura,
81
36 44 56 64
Fig. 19. Infestation in groundnut crop (No. of leaves/plant) before and after botanical
application
4.5
4
3.5
3
C0
U,•1-C
1.5
0.5
0
DASF
GH - Grass Hoppers HA - H. armigera
IC - I carnea SL - S. litura
VN - V negundo
—4-- Control - SL
SL
—i-- IC - SL
- SL
—*--- Control - GH
—-VN - GH
—+-- IC - GH
—VN+IC - GH
- Control - HA
VN - HA
IC - HA
---VN+IC - HA
grass hoppers and H. armigera, respectively) and they are statistically
significant to their respective control (P < 0.05).
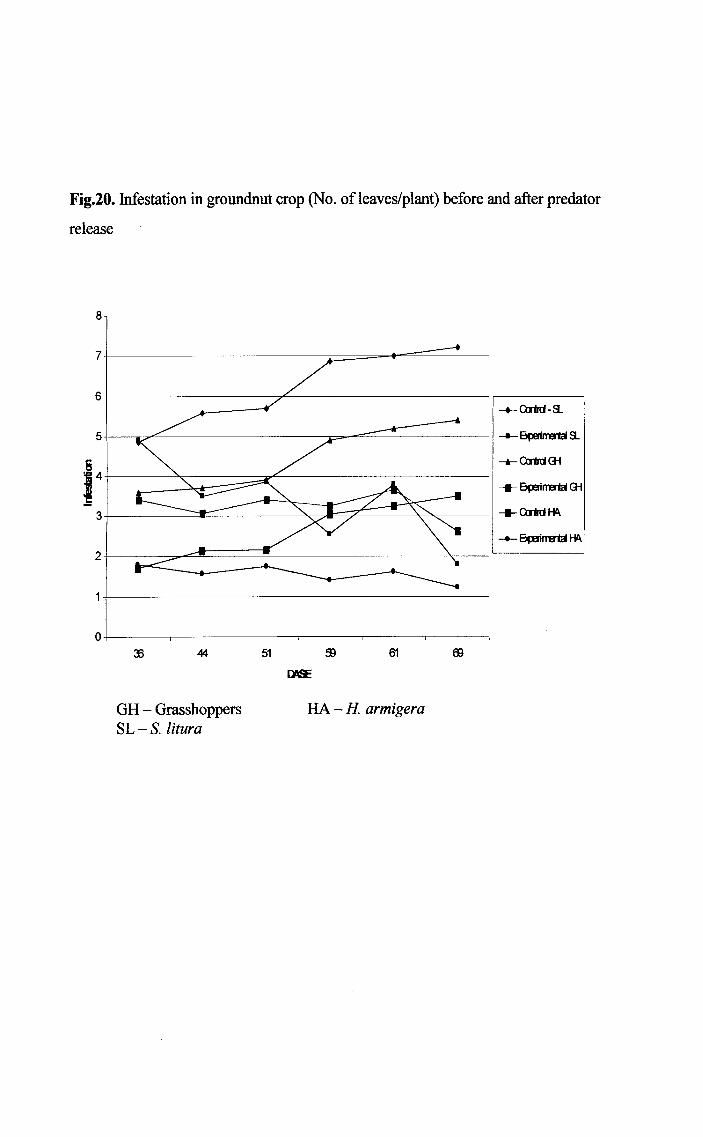
In the predator released field, the S. lilura infestation was higher
(mean 6.20 and 3.4 leaves/plant for control and experimental, respectively)
followed by grasshoppers (4.45 and 3.23 leaves/plant for control and
experimental respectively) and H. arrni,çera (2.63 and 1.56 leaves/plant for
control and experimental respectively). After the release of R. kumarii a
significant (P < 0.05; P = 0.007, 0.0048 for S. litura and H. armigera
respectively) reduction in the infestation of the S. litura and H. armigera
were observed (fig. 20). A significant reduction in the grasshopper infestation
was also observed (P < 0.05). The predator greatly reduced the infestation of
lepidopteran pests than the orthopteran pests.
4. 3. 3. Yield and cost benefit ratio
In all the treatments, two pods was more than one pod and three pods.
In the VN (0.13 ± 0.18 pods/plant) and IC + VN (0.46 ± 0.35 pods/plant)
plots, three pods were also observed. Number of two pods/plant was
maximum in the botanicals applied plots (14.9 ± 0.41, 16.16 ± 0.24 and
17.60 ± 0.32 pods/plant in the VN, IC and IC + VN plots, respectively) and
are highly significant (P < 0.05) than that of control (11.53 ± 0.24
pods/plant) (table 25).
The production of groundnut was also higher in the botanicals treated
plot, especially in the IC+VN plot (1386.80 kgha t ) and is statistically
significant (P < 0.05, P = 0.04) and lower in the control plot (1060.50
82
44 51 59 61
[1
J4
Fig.20. Infestation in groundnut crop (No. of leaves/plant) before and after predator
release
GH - Grasshoppers HA - H. armigera
SL - S. litura
-+-calid-a
-'-- 8çn1 a
---QitdG1
Bçee1 G
Bçuinl
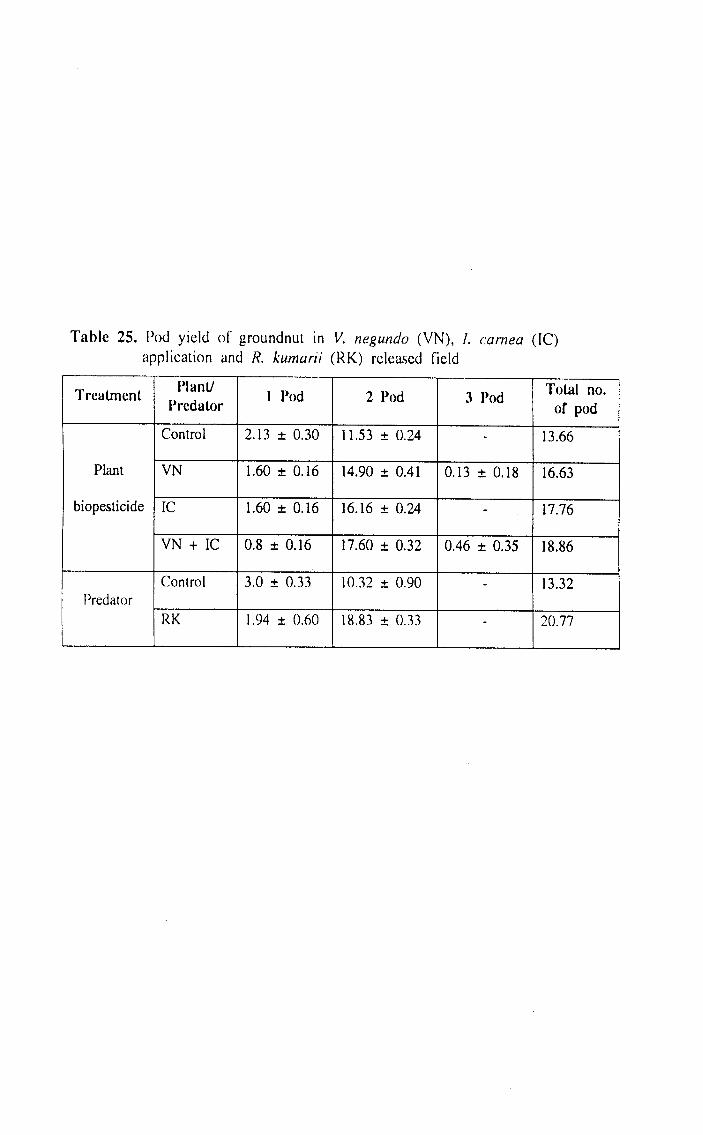
Table 25. Pod yield of groundnut in V. ne c undo (VN), I. carnea (IC)application and R. kumarii (RK) released field
Plant/ Total no.Treatment I Pod 2 Pod 3 PodPredator of pod
Control 2.13 ± 0.30 11.53 ± 0.24 - 13.66
Plant VN 1.60 ± 0.16 14.90 ± 0.41 0.13 ± 0.18 16.63
biopesticide IC 1.60 ± 0.16 16.16 ± 0.24 - 17.76
VN + IC 0.8 ± 0.16 17.60 ± 0.32 0.46 ± 0.35 18.86
Control 3.0 ± 0.33 10.32 ± 0.90 - 13.32Predator
RK 1.94 ± 0.60 18.83 ± 0.33 - 20.77
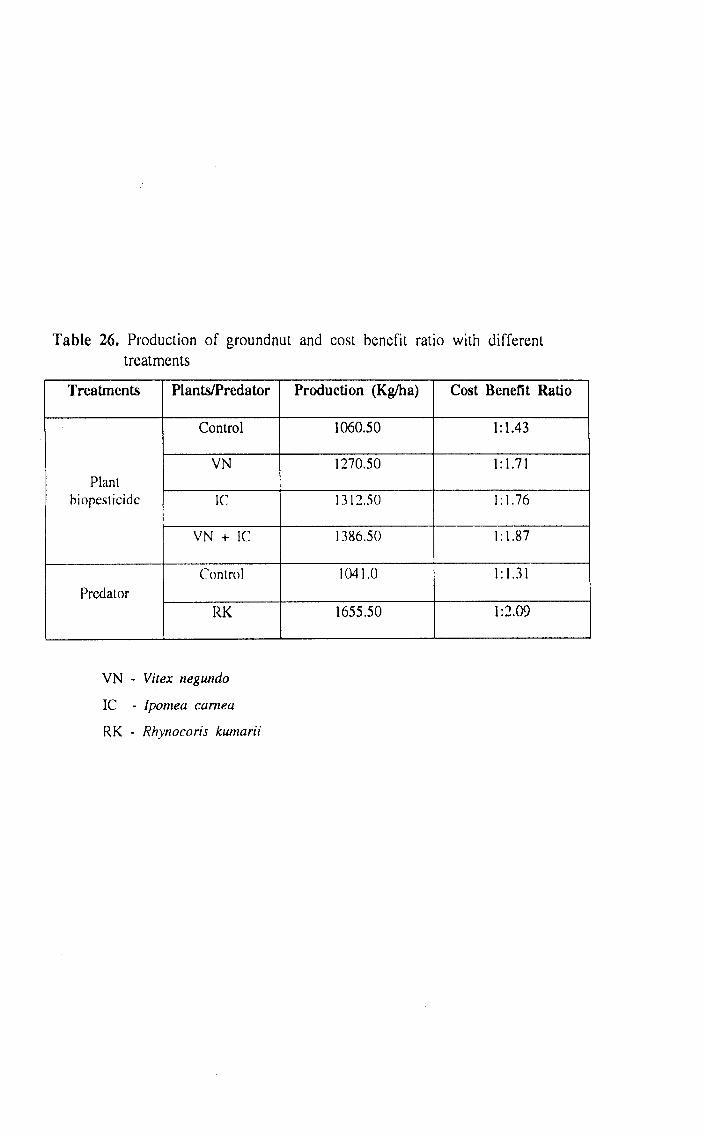
Table 26. Production of groundnut and cost benefit ratio with differenttreatments
Treatments Plants/Predator Production (Kg/ha) Cost Benefit Ratio
Control 1060.50 1:1.43
VN 1270.50 1:1.71Plant
hiopcsticidc IC 1312.50 1:1.76
VN + IC 1386.50 1:1.87
Control 1041.0 1:1.31
Predator
RK 1655.50 1:2.09
VN - Vitex negwzdo
IC - Ipomea carnea
RK - Rhynocoris ku:narii
kgha') (table 26). Likewise, the cost benefit ratio was also high in the IC +
VN (1:1.87) followed by IC (1:1.76), VN (1:1.71) and control (1:1.43),
respectively (table. 26). The botanicals greatly increased the pod yield and
production than the control. As observed in the plant hiopesticide treatment,
the pod yield was higher in the predator released plot and two pods were
higher in both the plots (10.32 in control and 18.83 in experimental) than one
pod (3.0 in control and 1.94 in the experimental, respectively) (table 25).
The production of groundnut was also higher in the experimental plot
(1655.50 kgha') than the control (1041.0 kgha') and is statistically
insignificant (P > 0.05; p = 3.32) (Table 26). The cost benefit ratio was
also high in the experimental plot (1:2.09) (table 26).
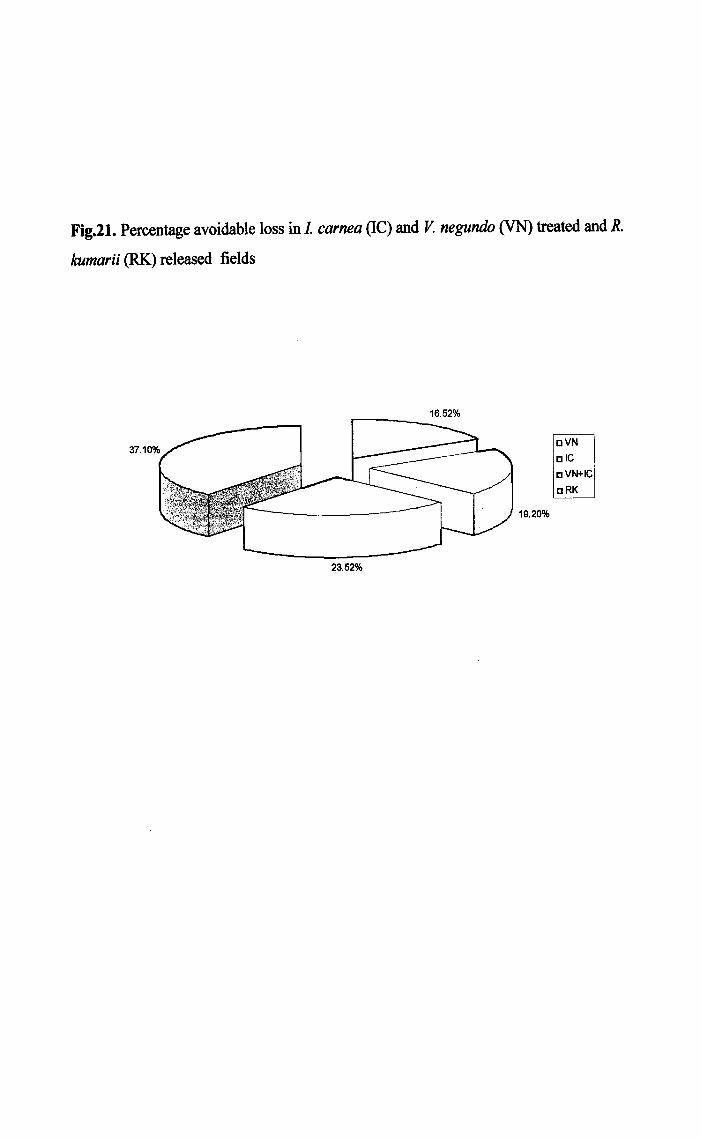
4. 3. 4. Percent avoidable loss
The percent avoidable loss was higher (37.10%) in predator released
field, followed by VN + IC (23.52%), IC (19.20%) and VN (16.52%)
respectively (fig. 21).
4. 4. Discussion
4. 4. 1. Plant biopesticide
The efficacy of various plant products was tested against different
groundnut pests and the field application revealed that the botanicals greatly
reduced the pest incidence and their infestation (Kalyanasundaram el al., 1994;
Senguttuvan, 1999; Obulapathi et al., 2000; Paulraj, 2001; Sahayaraj, 2002c
and Selvaraj, 2002). Plant products such as neem, vitex, pongamia and
calotropis were applied in the field and they greatly reduced the infestation of
S. lilura, H. armigera and A. modiceila and their population, there by greatly
83
OOAE3 VN
nIG
ri VN+IC(
DRKJ
19.20%
Fig.21. Percentage avoidable loss in I. carnea (IC) and V. negundo (VN) treated and R.
kumarii (RK) released fields
16.52%
23.62%
increased the groundnut production and cost benefit ratio (Paulraj, 2001 and
Sahayaraj, 2002c). The production of groundnut and cost benefit ratio was
high in the botanicals treated groundnut field (Selvaraj, 2002). The present
study also revealed the same concept (i.e.) reduction in pest occurrence and
increase in the groundnut production. The results were in concordance with
the study of Kalyanasundaram ci al. (1994); Paulraj (2001); Sahayaraj (2002
c) and Selvaraj (2002).
4. 4. 2. Predator release
Augmentative release of the predators, especially the reduviids is a
major concept in IPM (Ambrose, 1999; Sahayaraj, 1999b, 2002c and
Sahayaraj ind Martin ?003'. R. ' rc1cad in t1 crndnut.
field and it greatly suppressed the pests such as S. litura and H. armigera
and there by increased the groundnut production (Sahayaraj, 1999b, 2002c and
Sahayaraj and Martin, 2003). Claver and Ambrose (2001a) released R.
ku,narii in cotton field and it significantly reduced the lepidopteran pests.
The field cage release of R. kumarii also suppressed the pest population
(Ambrose and Claver, 1999b).
The field release of P. plagipennis (Grundy and Maelzer, 2000) and P.
iaei'icol!is (Antony ci al., 1979) were successful in reducing various pests in
their released fields. Sahayaraj (2002c) integrated R. marginalus along with
some botanicals in groundnut field and he observed the drastic reduction of
pests such as S. litura and H. armigera and achieved a high yield of
groundnut. In the present study, R. kumarii suppressed various pests in the
84
groundnut field as it was reported in the laboratory studies (Ambrose, 1996
and Claver, 1998). But it did not reduce the population of M. puslulata.
But Ambrose (1999) reported that it feeds on M. pustulala in the laboratory.
Since R. kumarii is a sluggish flighter than M. puslulata, it may he difficult
to attack that in the field. In the present study, R. kumarii greatly suppressed
the population of S. lilura, A. craccivora and H. armigera (66.66, 51.59 and
56.25% respectively) and the infestation due to S. litura, H. arinigera and
grasshoppers in the groundnut crop. Furthermore, it enhanced the production
of groundnut and cost benefit ratio and it is in agreement with the findings
of Sahayaraj (1999b and 2002c) and Sahayaraj and Martin (2003) on R.
marginalus released groundnut field. So R. kumarii could he used as a
biological control agent against groundnut pests.
4. 5. Conclusion
The water extract of both the plants (IC and VN) and the life stages
of the reduviid predator R. kumarii greatly reduced the pest population and
their infestation and in turn increased the number of pods, production and
cost benefit ratio. The farmers cultivating groundnut can use both the plants,
and the rcduviid to check the pest population and their infestation rather than
using synthetic pesticides.
85


![SCIENCE CHINA Life Sciences · 2019. 8. 15. · Bt rice on the development and population dynamics of such target lepidopteran pests [1013]; however, ... thropod species was calculated](https://img.pdfslide.net/doc/110x75/60c076b9d3c50b30fc558c00/science-china-life-sciences-2019-8-15-bt-rice-on-the-development-and-population.jpg)