Embed Size (px)
Citation preview

33
CHAPTER 4
NAUTICAL CHARTS
CHART FUNDAMENTALS
400. Definitions
A nautical chart represents part of the spherical earth on a plane surface. It shows water depth, the shoreline of adjacent land, prominent topographic features, aids to nav-igation, and other navigational information. It is a work area on which the navigator plots courses, ascertains posi-tions, and views the relationship of the ship to the surrounding area. It assists navigators in avoiding dangers and arriving safely at their destination.
Should a marine accident occur, the nautical chart in use at the time takes on legal significance. In cases of grounding, collision, and other accidents, charts become critical records for reconstructing the event and assigning liability. Charts used in reconstructing the incident can also have tremendous training value.
Originally hand-drawn on sheepskin, traditional nauti-cal charts have for generations been printed on paper. Electronic Charts consisting of a digital data base and a display system are commonly in use today and are replac-ing paper charts aboard many vessels. An electronic chart is not simply a digital version of a paper chart; it introduces a new navigation methodology with capabilities and limita-tions very different from paper charts. The electronic chart is the legal equivalent of the paper chart if it meets certain International Maritime Organization specifications. See Chapter 5 - ECDIS for a detailed information regarding electronic charts.
401. Projections
Because a cartographer cannot transfer a sphere to a flat surface without distortion, he or she must project the surface of a sphere onto a developable surface. A develop-able surface is one that can be flattened to form a plane. This process is known as chart projection. If points on the surface of a sphere are projected from a single point, the projection is said to be perspective or geometric.
As the use of electronic charts becomes increasingly widespread, it is important to remember that the same car-tographic principles that apply to paper charts apply to their depiction on video screens.
402. Selecting a Projection
Each projection has certain preferable features. How-ever, as the area covered by the chart becomes smaller, the differences between various projections become less no-ticeable. On the largest scale chart, such as that of a harbor, projections are practically identical. Some desirable proper-ties of a projection are:
1. True shape of physical features2. Correct angular relationships3. Equal area (Represents areas in proper proportions)4. Constant scale values5. Great circles represented as straight lines6. Rhumb lines represented as straight lines
Some of these properties are mutually exclusive. For example, a single projection cannot be both conformal and equal area. Similarly, both great circles and rhumb lines cannot be represented on a single projection as straight lines.
403. Types of Projections
The type of developable surface to which the spherical surface is transferred determines the projection’s classifica-tion. Further classification depends on whether the projection is centered on the equator (equatorial), a pole (polar), or some point or line between (oblique). The name of a projection indicates its type and its principal features.
The Mercator projection is classified as a cylindrical projection upon a plane, the cylinder tangent along the equator. Similarly, a projection based upon a cylinder tan-gent along a meridian is called transverse (or inverse) Mercator or transverse (or inverse) orthomorphic. The Mercator is the most common projection used in maritime navigation, primarily because rhumb lines plot as straight lines.
In a simple conic projection, points on the surface of the earth are transferred to a tangent cone. In the Lambert conformal projection, the cone intersects the earth (a se-cant cone) at two small circles. In a polyconic projection, a series of tangent cones is used.
In an azimuthal or zenithal projection, points on the earth are transferred directly to a plane. If the origin of the

34 NAUTICAL CHARTS
projecting rays is the center of the earth, a gnomonic pro-jection results; if it is the point opposite the plane’s point of tangency, a stereographic projection; and if at infinity (the projecting lines being parallel to each other), an or-thographic projection. The gnomonic, stereographic, and orthographic are perspective projections. In an azimuthal equidistant projection, which is not perspective, the scale of distances is constant along any radial line from the point of tangency. See Figure 403.
Cylindrical and plane projections are special conical projections, using heights infinity and zero, respectively.
A graticule is the network of latitude and longitude lines laid out in accordance with the principles of any projection.
404. Cylindrical Projections
If a cylinder is placed around the earth, tangent along the equator, and the planes of the meridians are extended, they intersect the cylinder in a number of vertical lines. See Figure 404. These parallel lines of projection are equidis-tant from each other, unlike the terrestrial meridians from which they are derived which converge as the latitude in-creases. On the earth, parallels of latitude are perpendicular to the meridians, forming circles of progressively smaller diameter as the latitude increases. On the cylinder they are shown perpendicular to the projected meridians, but be-cause a cylinder is everywhere of the same diameter, the projected parallels are all the same size.
If the cylinder is cut along a vertical line (a meridian) and spread out flat, the meridians appear as equally spaced vertical lines; and the parallels appear as horizontal lines. The parallels’ relative spacing differs in the various types of cylindrical projections.
If the cylinder is tangent along some great circle other than the equator, the projected pattern of latitude and longi-tude lines appears quite different from that described above,
since the line of tangency and the equator no longer coin-cide. These projections are classified as oblique or transverse projections.
405. Mercator Projection
Navigators most often use the plane conformal projec-tion known as the Mercator projection. The Mercator projection is not perspective, and its parallels can be de-rived mathematically as well as projected geometrically. Its distinguishing feature is that both the meridians and paral-lels are expanded at the same ratio with increased latitude. The expansion is equal to the secant of the latitude, with a small correction for the ellipticity of the Earth. Since the se-cant of 90° is infinity, the projection cannot include the poles. Since the projection is conformal, expansion is the same in all directions and angles are correctly shown. Rhumb lines appear as straight lines, the directions of which can be measured directly on the chart. Distances can also be measured directly if the spread of latitude is small. Great circles, except meridians and the equator, appear as curved lines concave to the equator. Small areas appear in their correct shape but of increased size unless they are near the equator.
Figure 403. Azimuthal projections: A, gnomonic; B, stereographic; C, (at infinity) orthographic.
Figure 404. A cylindrical projection.

NAUTICAL CHARTS 35
406. Meridional Parts
At the equator a degree of longitude is approximately equal in length to a degree of latitude. As the distance from the equator increases, degrees of latitude remain approximately the same, while degrees of longitude become progressively shorter. Since degrees of longitude appear everywhere the same length in the Mercator projection, it is necessary to in-crease the length of the meridians if the expansion is to be equal in all directions. Thus, to maintain the correct propor-tions between degrees of latitude and degrees of longitude, the degrees of latitude must be progressively longer as the dis-tance from the equator increases. This is illustrated in Figure 406.
The length of a meridian, increased between the equator and any given latitude, expressed in minutes of arc at the equator as a unit, constitutes the number of meridional parts (M) corresponding to that latitude. Meridional parts, given in Table 6 for every minute of latitude from the equator to the pole, make it possible to construct a Mercator chart and to solve problems in Mercator sailing. These values are for the World Geodetic System (WGS) ellipsoid of 1984.
407. Transverse Mercator Projections
Constructing a chart using Mercator principles, but with the cylinder tangent along a meridian, results in a transverse Mercator or transverse orthomorphic projection. The word “inverse” is used interchangeably with “transverse.” These projections use a fictitious graticule similar to, but offset from, the familiar network of meridians and parallels. The tangent great circle is the fictitious equator. Ninety degrees from it are two fictitious poles. A group of great circles through these poles and perpendicular to the tangent great circle are the ficti-tious meridians, while a series of circles parallel to the plane of the tangent great circle form the fictitious parallels. The actual meridians and parallels appear as curved lines.
A straight line on the transverse or oblique Mercator pro-jection makes the same angle with all fictitious meridians, but not with the terrestrial meridians. It is therefore a fictitious rhumb line. Near the tangent great circle, a straight line closely approximates a great circle. The projection is most useful in this area. Since the area of minimum distortion is near a merid-ian, this projection is useful for charts covering a large band of latitude and extending a relatively short distance on each side of the tangent meridian. It is sometimes used for star charts showing the evening sky at various seasons of the year. See Figure 407.
Figure 406. A Mercator map of the world.

36 NAUTICAL CHARTS
408. Universal Transverse Mercator (UTM) Grid
The Universal Transverse Mercator (UTM) grid is a military grid superimposed upon a transverse Mercator graticule, or the representation of these grid lines upon any graticule. This grid system and these projections are often used for large-scale (harbor) nautical charts and military charts.
409. Oblique Mercator Projections
A Mercator projection in which the cylinder is tangent along a great circle other than the equator or a meridian is called an oblique Mercator or oblique orthomorphic projection. See Figure 409a and Figure 409b. This projec-tion is used principally to depict an area in the near vicinity of an oblique great circle. Figure 410, for example, shows the great circle joining Washington and Moscow. Figure 409c shows an oblique Mercator map with the great circle
between these two centers as the tangent great circle or fic-titious equator. The limits of the chart of Figure 410 are indicated in Figure 409c. Note the large variation in scale as the latitude changes.
Figure 407. A transverse Mercator map of the Western Hemisphere.
Figure 409a. An oblique Mercator projection.
Figure 409b. An oblique Orthomorphic projection.

NAUTICAL CHARTS 37
410. Rectangular ProjectionA cylindrical projection similar to the Mercator, but
with uniform spacing of the parallels, is called a rectangu-lar projection. It is convenient for graphically depicting information where distortion is not important. The principal navigational use of this projection is for the star chart of the
Air Almanac, where positions of stars are plotted by rectan-gular coordinates representing declination (ordinate) and sidereal hour angle (abscissa). Since the meridians are par-allel, the parallels of latitude (including the equator and the poles) are all represented by lines of equal length.
411. Conic Projections
A conic projection is produced by transferring points from the surface of the earth to a cone or series of cones. This cone is then cut along an element and spread out flat to form the chart. When the axis of the cone coincides with the axis of the earth, then the parallels appear as arcs of circles, and the meridians appear as either straight or curved lines converging toward the nearer pole. Limiting the area cov-ered to that part of the cone near the surface of the earth limits distortion. A parallel along which there is no distor-tion is called a standard parallel. Neither the transverse conic projection, in which the axis of the cone is in the equatorial plane, nor the oblique conic projection, in which
the axis of the cone is oblique to the plane of the equator, is ordinarily used for navigation. They are typically used for illustrative maps.
Using cones tangent at various parallels, a secant (in-tersecting) cone, or a series of cones varies the appearance and features of a conic projection.
412. Simple Conic Projection
A conic projection using a single tangent cone is a sim-ple conic projection (Figure 412a). The height of the cone increases as the latitude of the tangent parallel decreases. At the equator, the height reaches infinity and the cone be-comes a cylinder. At the pole, its height is zero, and the
Figure 409c. An oblique Mercator map based upon a cylinder tangent along the great circle through Washington and Moscow. The map includes an area 500 miles on each side of the great circle. The limits of this map are indicated on the
Mercator map of Figure 410.
Figure 410. The great circle between Washington and Moscow as it appears on a Mercator map.

38 NAUTICAL CHARTS
cone becomes a plane. Similar to the Mercator projection, the simple conic projection is not perspective since only the meridians are projected geometrically, each becoming an element of the cone. When this projection is spread out flat
to form a map, the meridians appear as straight lines con-verging at the apex of the cone. The standard parallel, where the cone is tangent to the earth, appears as the arc of a circle with its center at the apex of the cone. The other
parallels are concentric circles. The distance along any me-ridian between consecutive parallels is in correct relation to the distance on the earth, and, therefore, can be derived mathematically. The pole is represented by a circle (Figure 412b). The scale is correct along any meridian and along the standard parallel. All other parallels are too great in length, with the error increasing with increased distance from the standard parallel. Since the scale is not the same in all directions about every point, the projection is neither a conformal nor equal-area projection. Its non-conformal na-ture is its principal disadvantage for navigation.
Since the scale is correct along the standard parallel and varies uniformly on each side, with comparatively little distortion near the standard parallel, this projection is useful for mapping an area covering a large spread of longitude and a comparatively narrow band of latitude. It was devel-oped by Claudius Ptolemy in the second century AD to map just such an area: the Mediterranean Sea.
413. Lambert Conformal Projection
The useful latitude range of the simple conic projection can be increased by using a secant cone intersecting the earth
at two standard parallels (see Figure 413). The area between the two standard parallels is compressed, and that beyond is expanded. Such a projection is called either a secant conic or conic projection with two standard parallels.
Figure 412a. A simple conic projection.
Figure 412b. A simple conic map of the Northern Hemisphere.

NAUTICAL CHARTS 39
If in such a projection the spacing of the parallels is al-tered, such that the distortion is the same along them as along the meridians, the projection becomes conformal. This modification produces the Lambert conformal pro-jection. If the chart is not carried far beyond the standard parallels, and if these are not a great distance apart, the dis-tortion over the entire chart is small.
A straight line on this projection so nearly approxi-mates a great circle that the two are nearly identical. Radio beacon signals travel great circles; thus, they can be plotted on this projection without correction. This feature, gained without sacrificing conformality, has made this projection popular for aeronautical charts because aircraft make wide use of radio aids to navigation. Except in high latitudes, where a slightly modified form of this projection has been used for polar charts, it has not replaced the Mercator pro-jection for marine navigation.
414. Polyconic Projection
The latitude limitations of the secant conic projection can be minimized by using a series of cones. This results in a polyconic projection. In this projection, each parallel is the base of a tangent cone. At the edges of the chart, the area between parallels is expanded to eliminate gaps. The scale is correct along any parallel and along the central meridian of the projection. Along other meridians the scale increases with increased difference of longitude from the central me-ridian. Parallels appear as nonconcentric circles, meridians appear as curved lines converging toward the pole and con-cave to the central meridian.
The polyconic projection is widely used in atlases, par-ticularly for areas of large range in latitude and reasonably large range in longitude, such as continents. However, since it is not conformal, this projection is not traditionally used in navigation.
415. Azimuthal Projections
If points on the earth are projected directly to a plane surface, a map is formed at once, without cutting and flat-tening, or “developing.” This can be considered a special case of a conic projection in which the cone has zero height.
The simplest case of the azimuthal projection is one in which the plane is tangent at one of the poles. The merid-ians are straight lines intersecting at the pole, and the parallels are concentric circles with their common center at the pole. Their spacing depends upon the method used to transfer points from the earth to the plane.
If the plane is tangent at some point other than a pole, straight lines through the point of tangency are great circles, and concentric circles with their common center at the point of tangency connect points of equal distance from that point. Distortion, which is zero at the point of tangency, in-creases along any great circle through this point. Along any circle whose center is the point of tangency, the distortion is constant. The bearing of any point from the point of tan-gency is correctly represented. It is for this reason that these projections are called azimuthal. They are also called ze-nithal. Several of the common azimuthal projections are perspective.
416. Gnomonic Projection
If a plane is tangent to the earth, and points are projected geometrically from the center of the earth, the result is a gnomonic projection (see Figure 416a). Since the projec-
Figure 413. A secant cone for a conic projection with two standard parallels.
Figure 416a. An oblique gnomonic projection.

40 NAUTICAL CHARTS
tion is perspective, it can be demonstrated by placing a light at the center of a transparent terrestrial globe and holding a flat surface tangent to the sphere.
In an oblique gnomonic projection the meridians ap-pear as straight lines converging toward the nearer pole. The parallels, except the equator, appear as curves (Figure 416b). As in all azimuthal projections, bearings from the point of tangency are correctly represented. The distance scale, however, changes rapidly. The projection is neither conformal nor equal area. Distortion is so great that shapes, as well as distances and areas, are very poorly represented, except near the point of tangency.
The usefulness of this projection rests upon the fact that any great circle appears on the map as a straight line, giving charts made on this projection the common name great-circle charts.
Gnomonic charts are most often used for planning the great-circle track between points. Points along the deter-mined track are then transferred to a Mercator projection. The great circle is then tracked by following the rhumb lines from one point to the next. Computer programs which automatically calculate great circle routes between points and provide latitude and longitude of corresponding rhumb line endpoints are quickly making this use of the gnomonic chart obsolete.
417. Stereographic Projection
A stereographic projection results from projecting points on the surface of the earth onto a tangent plane, from a point on the surface of the earth opposite the point of tangency (see Fig-ure 417a). This projection is also called an azimuthal orthomorphic projection.
The scale of the stereographic projection increases with distance from the point of tangency, but it increases more slowly than in the gnomonic projection. The stereo-graphic projection can show an entire hemisphere without excessive distortion (see Figure 417b). As in other azimuth-al projections, great circles through the point of tangency appear as straight lines. Other circles such as meridians and parallels appear as either circles or arcs of circles.
Figure 416b. An oblique gnomonic map with point of tangency at latitude 30°N, longitude 90°W.
Figure 417a. An equatorial stereographic projection.
Figure 417b. A stereographic map of the Western Hemisphere.

NAUTICAL CHARTS 41
The principal navigational use of the stereographic projection is for charts of the polar regions and devices for mechanical or graphical solution of the navigational trian-gle. A Universal Polar Stereographic (UPS) grid, mathematically adjusted to the graticule, is used as a refer-ence system.
418. Orthographic Projection
An orthographic projection is created by projecting terrestrial points from infinity to a tangent plane (see Figure 418a). This projection is not conformal, nor does it result in an equal area representation. Its principal use is in naviga-
tional astronomy because it is useful for illustrating and solving the navigational triangle. It is also useful for illus-trating celestial coordinates. If the plane is tangent at a point on the equator, the parallels (including the equator) appear as straight lines. The meridians would appear as ellipses, except that the meridian through the point of tangency would appear as a straight line and the one 90° away would appear as a circle (see Figure 418b).
419. Azimuthal Equidistant Projection
An azimuthal equidistant projection is an azimuthal projection in which the distance scale along any great circle through the point of tangency is constant. If a pole is the point of tangency, the meridians appear as straight radial lines and the parallels as equally spaced concentric circles. If the plane is tangent at some point other than a pole, the concentric circles represent distances from the point of tan-gency. In this case, meridians and parallels appear as curves.
The projection can be used to portray the entire earth, the point 180° from the point of tangency appearing as the largest of the concentric circles. The projection is not con-formal, equal area, or perspective. Near the point of tangency distortion is small, increasing with distance until shapes near the opposite side of the earth are unrecogniz-able (Figure 419).
The projection is useful because it combines the three features of being azimuthal, having a constant distance scale from the point of tangency, and permitting the entire
Figure 418a. An equatorial orthographic projection.
Figure 418b. An orthographic map of the Western Hemisphere.
Figure 419. An azimuthal equidistant map of the world with the point of tangency latitude 40°N, longitude 100°W.

42 NAUTICAL CHARTS
earth to be shown on one map. Thus, if an important harbor or airport is selected as the point of tangency, the great-cir-cle course, distance, and track from that point to any other point on the earth are quickly and accurately determined. For communication work with the station at the point of
tangency, the path of an incoming signal is at once apparent if the direction of arrival has been determined and the direc-tion to train a directional antenna can be determined easily. The projection is also used for polar charts and for the star finder, No. 2102D.
POLAR CHARTS
420. Polar Projections
Special consideration is given to the selection of pro-jections for polar charts because the familiar projections become special cases with unique features.
In the case of cylindrical projections in which the axis of the cylinder is parallel to the polar axis of the earth, dis-tortion becomes excessive and the scale changes rapidly. Such projections cannot be carried to the poles. However, both the transverse and oblique Mercator projections are used.
Conic projections with their axes parallel to the earth’s polar axis are limited in their usefulness for polar charts be-cause parallels of latitude extending through a full 360° of longitude appear as arcs of circles rather than full circles. This is because a cone, when cut along an element and flat-tened, does not extend through a full 360° without stretching or resuming its former conical shape. The useful-ness of such projections is also limited by the fact that the pole appears as an arc of a circle instead of a point. Howev-er, by using a parallel very near the pole as the higher standard parallel, a conic projection with two standard par-
allels can be made. This requires little stretching to complete the circles of the parallels and eliminate that of the pole. Such a projection, called a modified Lambert con-formal or Ney’s projection, is useful for polar charts. It is particularly familiar to those accustomed to using the ordi-nary Lambert conformal charts in lower latitudes.
Azimuthal projections are in their simplest form when tangent at a pole. This is because the meridians are straight lines intersecting at the pole, and parallels are concentric circles with their common center at the pole. Within a few degrees of latitude of the pole they all look similar; howev-er, as the distance becomes greater, the spacing of the parallels becomes distinctive in each projection. In the po-lar azimuthal equidistant it is uniform; in the polar stereographic it increases with distance from the pole until the equator is shown at a distance from the pole equal to twice the length of the radius of the earth; in the polar gno-monic the increase is considerably greater, becoming infinity at the equator; in the polar orthographic it decreases with distance from the pole (Figure 420). All of these but the last are used for polar charts.
421. Selection of a Polar Projection
The principal considerations in the choice of a suitable projection for polar navigation are:
1. Conformality: When the projection represents an-gles correctly, the navigator can plot directly on the chart.
2. Great circle representation: Because great circles are more useful than rhumb lines at high altitudes, the pro-jection should represent great circles as straight lines.
3. Scale variation: The projection should have a con-stant scale over the entire chart.
4. Meridian representation: The projection should show straight meridians to facilitate plotting and grid navigation
5. Limits: Wide limits reduce the number of projec-tions needed to a minimum.
The projections commonly used for polar charts are the modified Lambert conformal, gnomonic, stereographic, and azimuthal equidistant. All of these projections are sim-ilar near the pole. All are essentially conformal, and a great circle on each is nearly a straight line.
As the distance from the pole increases, however, the distinctive features of each projection become important.
Figure 420. Expansion of polar azimuthal projections.

NAUTICAL CHARTS 43
The modified Lambert conformal projection is virtually conformal over its entire extent. The amount of its scale dis-tortion is comparatively little if it is carried only to about 25° or 30° from the pole. Beyond this, the distortion in-creases rapidly. A great circle is very nearly a straight line anywhere on the chart. Distances and directions can be measured directly on the chart in the same manner as on a Lambert conformal chart. However, because this projection is not strictly conformal, and on it great circles are not ex-actly represented by straight lines, it is not suited for highly accurate work.
The polar gnomonic projection is the one polar projec-tion on which great circles are exactly straight lines. However, a complete hemisphere cannot be represented upon a plane because the radius of 90° from the center would become infinity.
The polar stereographic projection is conformal over its entire extent, and a straight line closely approximates a great circle (see Figure 421). The scale distortion is not ex-cessive for a considerable distance from the pole, but it is greater than that of the modified Lambert conformal projection.
The polar azimuthal equidistant projection is useful for showing a large area such as a hemisphere because there is no expansion along the meridians. However, the projection is not conformal and distances cannot be measured accu-rately in any but a north-south direction. Great circles other than the meridians differ somewhat from straight lines. The equator is a circle centered at the pole.
The two projections most commonly used for polar charts are the modified Lambert conformal and the polar stereographic. When a directional gyro is used as a direc-tional reference, the track of the craft is approximately a great circle. A desirable chart is one on which a great circle is represented as a straight line with a constant scale and with angles correctly represented. These requirements are not met entirely by any single projection, but they are ap-proximated by both the modified Lambert conformal and the polar stereographic. The scale is more nearly constant on the former, but the projection is not strictly conformal. The polar stereographic is conformal, and its maximum scale variation can be reduced by using a plane which inter-sects the earth at some parallel intermediate between the pole and the lowest parallel. The portion within this stan-dard parallel is compressed, and that portion outside is expanded.
The selection of a suitable projection for use in polar regions depends upon mission requirements. These require-ments establish the relative importance of various features. For a relatively small area, any of several projections is suitable. For a large area, however, the choice is more dif-ficult. If grid directions are to be used, it is important that all units in related operations use charts on the same projec-tion, with the same standard parallels, so that a single grid direction exists between any two points.
SPECIAL CHARTS
422. Plotting Sheets
Position plotting sheets are “charts” designed primarily for open ocean navigation, where land, visual aids to navi-gation, and depth of water are not factors in navigation. They have a latitude and longitude graticule, and they may have one or more compass roses. The meridians are usually unlabeled, so a plotting sheet can be used for any longitude. Plotting sheets on Mercator projection are specific to lati-tude, and the navigator should have enough aboard for all latitudes for their voyage. Plotting sheets are less expensive
than charts.A plotting sheet may be used in an emergency when
charts have been lost or destroyed. Directions on how to construct plotting sheets suitable for emergency purposes are given in Chapter 28 - Emergency Navigation.
423. Grids
No system exists for showing the surface of the earth on a plane without distortion. Moreover, the appearance of the surface varies with the projection and with the relation
Figure 421. Polar stereographic projection.

44 NAUTICAL CHARTS
of that surface area to the point of tangency. One may wantto identify a location or area simply by alpha-numeric rect-angular coordinates. This is accomplished with a grid. In itsusual form this consists of two series of lines drawn perpen-dicularly on the chart, marked by suitable alpha-numericdesignations.
A grid may use the rectangular graticule of the Merca-tor projection or a set of arbitrary lines on a particularprojection. The World Geodetic Reference System(GEOREF) is a method of designating latitude and longi-tude by a system of letters and numbers instead of byangular measure. It is not, therefore, strictly a grid. It is use-ful for operations extending over a wide area. Examples ofthe second type of grid are the Universal Transverse Mer-cator (UTM) grid, the Universal Polar Stereographic(UPS) grid, and the Temporary Geographic Grid (TGG).Since these systems are used primarily by military forces,they are sometimes called military grids.
For more information on chart projections see TheMap Projections Catalog. The catalog offers examples of abroad range of publicly available projection types.
CHART SCALES
424. Types Of Scales
The scale of a chart is the ratio of a given distance on thechart to the actual distance which it represents on the earth. It maybe expressed in various ways. The most common are:
1. A simple ratio or fraction, known as the represen-tative fraction. For example, 1:80,000 or 1/80,000means that one unit (such as a meter) on the chartrepresents 80,000 of the same unit on the surface ofthe earth. This scale is sometimes called the natu-ral or fractional scale.
2. A statement that a given distance on the earthequals a given measure on the chart, or vice versa.For example, “30 miles to the inch” means that 1inch on the chart represents 30 miles of the earth’ssurface. Similarly, “2 inches to a mile” indicatesthat 2 inches on the chart represent 1 mile on theearth. This is sometimes called the numericalscale.
3. A line or bar called a graphic scale may be drawnat a convenient place on the chart and subdividedinto nautical miles, meters, etc. All charts varysomewhat in scale from point to point, and in someprojections the scale is not the same in all directionsabout a single point. A single subdivided line or barfor use over an entire chart is shown only when thechart is of such scale and projection that the scalevaries a negligible amount over the chart, usuallyone of about 1:75,000 or larger. Since 1 minute oflatitude is very nearly equal to 1 nautical mile, thelatitude scale serves as an approximate graphicscale. On most nautical charts the east and westborders are subdivided to facilitate distancemeasurements.
On a Mercator chart the scale varies with the latitude.This is noticeable on a chart covering a relatively large dis-tance in a north-south direction. On such a chart the borderscale nearest the latitude in question should be used formeasuring distances.
Of the various methods of indicating scale, the graphi-cal method is normally available in some form on the chart.In addition, the scale is customarily stated on charts onwhich the scale does not change appreciably over the chart.
The ways of expressing the scale of a chart are readilyinterchangeable. For instance, in a nautical mile there areabout 72,913.39 inches. If the natural scale of a chart is1:80,000, one inch of the chart represents 80,000 inches ofthe earth, or a little more than a mile. To find the exactamount, divide the scale by the number of inches in a mile,or 80,000/72,913.39 = 1.097. Thus, a scale of 1:80,000 isthe same as a scale of 1.097 (or approximately 1.1) miles toan inch. Stated another way, there are: 72,913.39/80,000 =0.911 (approximately 0.9) inch to a mile. Similarly, if thescale is 60 nautical miles to an inch, the representative frac-tion is 1:(60 x 72,913.39) = 1:4,374,803.
A chart covering a relatively large area is called asmall-scale chart and one covering a relatively small areais called a large-scale chart. Since the terms are relative,there is no sharp division between the two. Thus, a chart ofscale 1:100,000 is large scale when compared with a chartof 1:1,000,000 but small scale when compared with one of1:25,000.
As scale decreases, the amount of detail which can beshown decreases also. Cartographers selectively decreasethe detail in a process called generalization when produc-ing small scale charts using large scale charts as sources.The amount of detail shown depends on several factors,among them the coverage of the area at larger scales and theintended use of the chart.
Figure 423. Map Projections Catalog. http://www.csiss.org/map-projections

NAUTICAL CHARTS 45
425. Chart Classification by Scale
Charts are constructed on many different scales, rang-ing from about 1:2,500 to 1:14,000,000. Small-scale chartscovering large areas are used for route planning and for off-shore navigation. Charts of larger scale, covering smallerareas, are used as the vessel approaches land. Several meth-ods of classifying charts according to scale are used invarious nations. The following classifications of nauticalcharts are used by the National Ocean Service (NOS).
Sailing charts are the smallest scale charts used forplanning, fixing position at sea, and for plotting the deadreckoning while proceeding on a long voyage. The scale isgenerally smaller than 1:600,000. The shoreline and topog-raphy are generalized and only offshore soundings,principal navigational lights, outer buoys, and landmarksvisible at considerable distances are shown.
General charts are intended for coastwise navigationoutside of outlying reefs and shoals. The scales range fromabout 1:150,000 to 1:600,000.
Coastal charts are intended for inshore coastwise nav-igation, for entering or leaving bays and harbors ofconsiderable width, and for navigating large inland water-ways. The scales range from about 1:50,000 to 1:150,000.
Harbor charts are intended for navigation and anchor-age in harbors and small waterways. The scale is generallylarger than 1:50,000.
In the classification system used by the National Geo-spatial-Intelligence Agency (NGA), the sailing charts areincorporated in the general charts classification (smaller
than about 1:150,000); those coastal charts especially use-ful for approaching more confined waters (bays, harbors)are classified as approach charts. There is considerableoverlap in these designations, and the classification of achart is best determined by its purpose and its relationshipto other charts of the area. The use of insets complicates theplacement of charts into rigid classifications.
426. Small-Craft Charts
NOS publishes a series of small craft charts sometimescalled “strip charts.” These charts depict segments of theAtlantic Intracoastal Waterway, the Gulf Intracoastal Wa-terway and other inland routes used by yachtsmen,fishermen, and small commercial vessels for coastal travel.They are not “north-up” in presentation, but are alignedwith the waterway they depict, whatever its orientation is.Most often they are used as a piloting aid for “eyeball” nav-igation and placed “course-up” in front of the helmsman,because the routes they show are too confined for takingand plotting fixes.
Although NOS small-craft charts are designed primar-ily for use aboard yachts, fishing vessels and other smallcraft, these charts, at scales of 1:80,000 and larger, are insome cases the only charts available depicting inland waterstransited by large vessels. In other cases the small-craftcharts may provide a better presentation of navigationalhazards than the standard nautical chart because of betterscale and more detail. Therefore, navigators should usethese charts in areas where they provide the best coverage.
CHART ACCURACY
427. Factors Relating to Accuracy
The accuracy of a chart depends upon the accuracy ofthe hydrographic surveys and other data sources used tocompile it and the suitability of its scale for its intended use.
One can sometimes estimate the accuracy of a chart’ssurveys from the source notes given in the title of the chart.If the chart is based upon very old surveys, use it with cau-tion. Many early surveys were inaccurate because of thetechnological limitations of the surveyor.
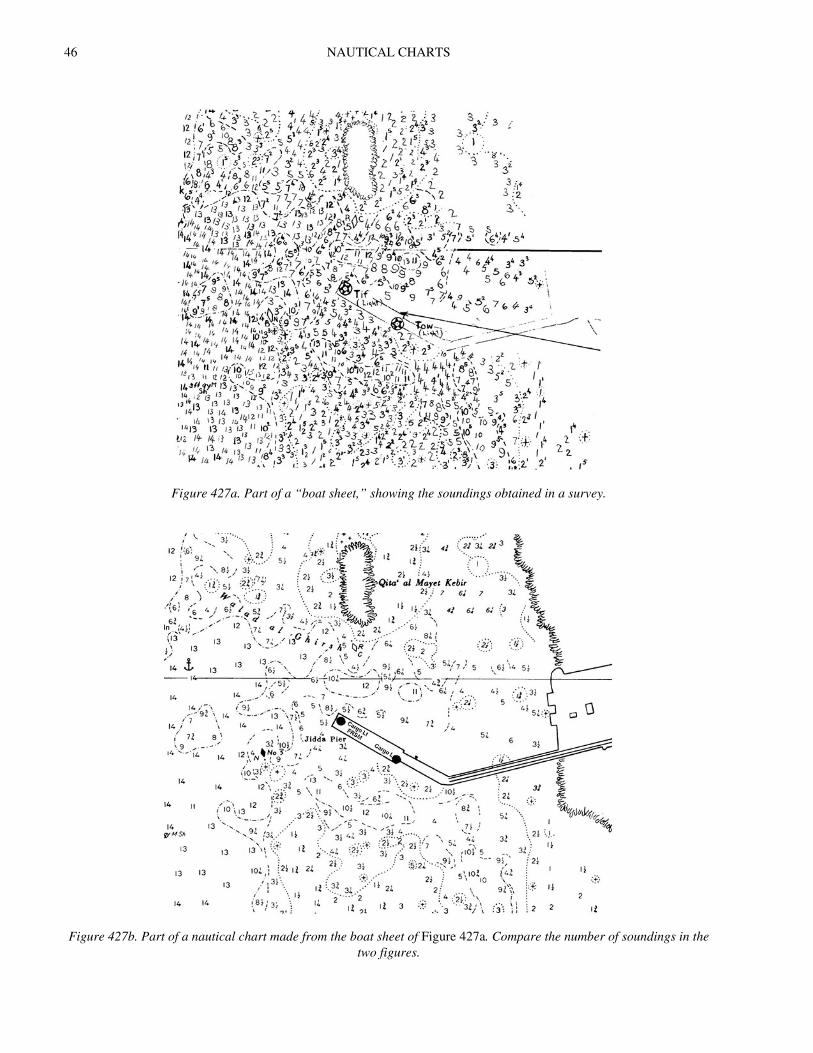
The number of soundings and their spacing indicatesthe completeness of the survey. Only a small fraction of thesoundings taken in a thorough survey are shown on thechart, but sparse or unevenly distributed soundings indicatethat the survey was probably not made in detail. See Figure427a and Figure 427b. Large blank areas or absence ofdepth contours generally indicate lack of soundings in thearea. Operate in an area with sparse sounding data only ifrequired and then only with extreme caution. Run the echosounder continuously and operate at a reduced speed.Sparse sounding information does not necessarily indicatean incomplete survey. Relatively few soundings are shown
when there is a large number of depth contours, or wherethe bottom is flat, or gently and evenly sloping. Additionalsoundings are shown when they are helpful in indicating theuneven character of a rough bottom.
Even a detailed survey may fail to locate every rock orpinnacle. In waters where they might be located, the bestmethod for finding them is a wire drag survey. Areas thathave been dragged may be indicated on the chart by limit-ing lines and green or purple tint and a note added to showthe effective depth at which the drag was operated.
Changes in bottom contours are relatively rapid in ar-eas such as entrances to harbors where there are strongcurrents or heavy surf. Similarly, there is sometimes a ten-dency for dredged channels to shoal, especially if they aresurrounded by sand or mud, and cross currents exist. Chartsoften contain notes indicating the bottom contours areknown to change rapidly.
The same detail cannot be shown on a small-scale chartas on a large scale chart. On small-scale charts, detailed in-formation is omitted or “generalized” in the areas coveredby larger scale charts. The navigator should use the largestscale chart available for the area in which he or she is oper-
46 NAUTICAL CHARTS
Figure 427a. Part of a “boat sheet,” showing the soundings obtained in a survey.
Figure 427b. Part of a nautical chart made from the boat sheet of Figure 427a. Compare the number of soundings in the two figures.

NAUTICAL CHARTS 47
ating, especially when operating in the vicinity of hazards.Charting agencies continually evaluate both the detail
and the presentation of data appearing on a chart. Develop-ment of a new navigational aid may render previous chartsinadequate. The development of radar, for example, re-quired upgrading charts which lacked the detail required forreliable identification of radar targets.
After receiving a chart, the user is responsible for keep-ing it updated. Mariner’s reports of errors, changes, andsuggestions are useful to charting agencies. Even with mod-ern automated data collection techniques, there is nosubstitute for on-sight observation of hydrographic condi-tions by experienced mariners. This holds true especially inless frequently traveled areas of the world.
428. Source Diagrams and Zones of Confidence
All charts, whether paper or electronic, contain datawhich varies in quality due to the age and accuracy of indi-vidual surveys. A chart can be considered as a patchworkof individual surveys pieced together to form a single im-age. A source diagram only shows who supplied a survey,and possibly how old that survey is, but provides nothingabout the quality of the survey. Where source diagrams arebased on inexact and sometimes subjective parameters, anew zone of confidence (ZOC) system (exclusive to elec-
tronic charts in the United States) is derived moreconsistently, using a combination of survey data, positionaccuracy, depth accuracy, and sea floor coverage.
The ZOC assessments within each chart enable mari-ners to assess the limitation of the hydrographic data fromwhich the chart was compiled and to assess the associatedlevel of risk to navigate in a particular area. In ENC the var-ious assessment areas and ratings appear across the entiretyof the ENC and are therefore embedded in their true posi-tions, rather than in a small diagram. This information layercan be displayed or hidden as planning and route monitor-ing requirements change.
Assessments are made based upon four criteria, fol-lowing which a single ZOC rating is derived for each areaof differing quality, based upon the lowest individually as-sessed criteria for that area. Individual criteria are:
1. Position accuracy.2. Depth accuracy (in reference to what has been de-
tected, not what might or might not have beenmissed).
3. Seafloor coverage, i.e. the certainty of feature detec-tion (this is not related to depth accuracy, but relatesonly to what might or might not have been missed).
4. Typical survey characteristics.
ZOC Position Accuracy
Depth Accuracy Seafloor Coverage Typical Survey Characteristics
A1 ± 5 m
= 0.50 + 1% d
Full area search undertaken. All significant seafloor features detected and depths measured.
Controlled, systematic survey high position and depth accuracy achieved using DGPS or a minimum three high quality lines of position (LOP) and a multibeam, channel or mechanical sweep system.
Depth (m) Accuracy (m)
10 ± 0.6
30 ± 0.8
100 ± 1.5
1000 ± 10.5
A2 ± 20 m
= 1.00 + 2% d
Full area search undertaken. All significant seafloor features detected and depths measured.
Controlled, systematic survey high position and depth accuracy achieved less than ZOC A1 and using a modern survey echosounder and a sonar or mechanical system.
Depth (m) Accuracy (m)
10 ± 1.2
30 ± 1.6
100 ± 3.0
1000 ± 21.0
Table 428. Zones of Confidence category explanations.

48 NAUTICAL CHARTS
Of these, the most important is the assessment of sea-floor coverage, as this determines how much clearance should be maintained between a ship's keel and the seabed in most areas, and where any additional precautions may need to be taken.
Each surveyed area will be assigned to one of five
quality categories for assessed data (ZOC A1, A2, B, C, D), with a sixth category used for data which has not been as-sessed (ZOC U). See Table 428 for an explanation of each category. The standard is detailed in the International Hy-drographic Organization (IHO) S-57 Edition 3.1 Supplement 2, publication.
CHART READING
429. Chart Dates
NOAA charts have two areas where dates are shown. At the top center of the chart is the date of the first edition of the chart. In the lower left corner of the chart is the cur-rent edition number and date. Additionally, NOAA charts show the “cleared through” dates in the lower left corner of the chart to indicate what Notice to Mariner dates the chart is updated too (i.e. Notice to Mariner and Local Notice to Mariner). See Figure 429a. Any subsequent change will be published in the Notice to Mariners. Any notices which ac-cumulate between the chart date and the announcement date in the Notice to Mariners will be given with the announcement.
NGA charts similarly have two dates as well. At the top center of the chart is the date of the first edition of the chart. In the lower left corner of the chart is the current chart edi-
B ± 50 m
= 1.00 + 2% dFull area search not achieved; uncharted features, hazardous to surface navigation are not expected but may exist.
Controlled systematic survey achieving similar depth but lessor position accuracies than ZOC A2, using modern survey echosounder, but no sonar or mechanical sweep system.
Depth (m) Accuracy (m)
10 ± 1.2
30 ± 1.6
100 ± 3.0
1000 ± 21.0
C ± 500 m
= 2.00 + 5% d
Full area search not achieved, depth anomalies may be expected.
Low accuracy survey or data collected on an opportunity basis such as soundings on passage.
Depth (m) Accuracy (m)
10 ± 2.5
30 ± 3.5
100 ± 7.0
1000 ± 52.0
D Worse than ZOC
Worse than ZOC C Full area search not achieved, large depth
Poor quality data or data that cannot be quality assessed due
U Unassessed - The quality of the bathymetric data has yet to be assessed
ZOC Position Accuracy
Depth Accuracy Seafloor Coverage Typical Survey Characteristics
Table 428. Zones of Confidence category explanations.
Figure 429a. NOAA chart dates.

NAUTICAL CHARTS 49
tion number, date, and barcode information. See Figure 429b. The edition date will contain a statement indicating what Notice to Mariner the NGA chart has been corrected too. Any subsequent change will be published in the No-tice to Mariners. Any notices which accumulate between the chart date and the announcement date in the Notice to Mariners will be given with the announcement. NGA charts do not contain a “cleared through” date like NOAA charts because NGA does not have a program in place for produc-ing weekly digital updates to the chart files.
Certain NGA charts are reproductions of foreign charts produced under joint agreements with a number of other countries. These bilateral foreign chart reproductions will also include an NGA chart number, edition number, user note, and barcode information. These charts, even though of recent date, may not be based on the most recent edition of the foreign chart. Further, new editions of the foreign chart will not necessarily automatically result in a new edi-tion of the NGA reproduction, especially in cases where the foreign chart is the better chart to use.
Comparing the difference of edition numbers and dates between the first and current editions on the chart, gives an indication of how often the chart is updated. Charts of busy areas are updated more frequently than those of less trav-eled areas. This interval may vary from 6 months to more than ten years for NOAA charts, and may be much longer for certain NGA charts in remote areas.
New editions of charts are both demand and source driven. Receiving significant new information may or may not initiate a new edition of a chart, depending on the de-mand for that chart. If it is in a sparsely-traveled area, production priorities may delay a new edition for several years. Conversely, a new edition may be printed without the receipt of significant new data if demand for the chart is high and stock levels are low. Notice to Mariners correc-tions are always included on new editions.
430. Title Block
The chart title block should be the first thing a naviga-tor looks at when receiving a new edition chart (refer to Figure 430). The title itself tells what area the chart covers. The chart’s scale and projection appear below the title. The chart will give both vertical and horizontal datums and, if necessary, a datum conversion note. Source notes or dia-grams will list the date of surveys and other charts used in compilation.
431. Shoreline
The shoreline shown on nautical charts represents the line of contact between the land and water at a selected ver-tical datum. In areas affected by tidal fluctuations, this is usually the mean high-water line. In confined coastal wa-ters of diminished tidal influence, a mean water level line may be used. The shoreline of interior waters (rivers, lakes) is usually a line representing a specified elevation above a selected datum. A shoreline is symbolized by a heavy line. A broken line indicates that the charted position is approx-imate only. The nature of the shore may be indicated.
If the low water line differs considerably from the high water line, then a dotted line represents the low water line. If the bottom in this area is composed of mud, sand, gravel or stones, the type of material will be indicated. If the bot-tom is composed of coral or rock, then the appropriate symbol will be used. The area alternately covered and un-covered may be shown by a tint which is usually a combination of the land and water tint.
The apparent shoreline shows the outer edge of ma-rine vegetation where that limit would appear as shoreline to the mariner. It is also used to indicate where marine vegetation prevents the mariner from defining the shoreline. A light line symbolizes this shoreline. A broken line marks the inner edge when no other symbol (such as a cliff or levee) furnishes such a limit. The com-bined land-water tint or the land tint marks the area between inner and outer limits.
432. Chart Symbols
Much of the information contained on charts is shown by symbols. These symbols are not shown to scale, but they indicate the correct position of the feature to which they refer. The standard symbols and abbrevia-tions used on charts published by the United States of America are shown in Chart No. 1, Symbols, Abbrevia-tions and Terms used on Paper and Electronic Navigation Charts. See Figure 432a for link.
Electronic chart symbols are, within programming and display limits, much the same as printed ones. The less ex-pensive electronic charts have less extensive symbol libraries, and the screen’s resolution may affect the presen-tation detail.
Figure 429b. NGA chart dates.

50 NAUTICAL CHARTS
Most of the symbols and abbreviations shown in U.S. Chart No. 1 agree with recommendations of the Interna-tional Hydrographic Organization (IHO), these are often called INT1 symbols. The symbols and abbreviations onany given chart may differ somewhat from those shown in U.S. Chart No. 1. In addition, foreign charts may use differ-ent symbology. When using a foreign chart, the navigator should have available the Chart No. 1 from the country which produced the chart.
The symbols in U.S. Chart No. 1 are organized by type in separate sections. For example, “natural features, “land-marks,” “depths,” “rocks, wrecks, obstructions, aquaculture,” etc. Each section has a separate letter designator.
Information and examples of each symbol are dis-
played in eight columns. These show the IHO number code for the symbol; the INT1 symbol; a textual description of the symbol, term, or abbreviation; NOAA and NGA sym-bols if they are different from the INT1 symbol (the NOAA and NGA columns are combined if the charts from each of these agencies s use the same symbol. If the symbols are different, two separate columns are shown). The next col-umn shows any symbols used on foreign charts that NGA reproduces. The final two columns show the ECDIS sym-bols used to portray ENC data. The layout is explained in the introduction section of U.S. Chart No. 1.
Chart No. 1 is organized according to subject matter, with each specific subject given a letter designator. The general subject areas are General, Topography, Hydrogra-phy, Aids and Services, and Indexes. Under each heading, letter designators further define subject areas, and individ-ual numbers refer to specific symbols. See Figure 432b.
Information in Chart No. 1 is arranged in columns. The first column contains the IHO number code for the symbol in question. The next two columns show the symbol itself, in NOS and NGA formats. If the formats are the same, the two columns are combined into one. The next column is a text description of the symbol, term, or abbreviation. The next three columns contain the IHO standard symbolized on charts produced by NOAA or NGA. The last column con-tains the symbol used on electronic charts displayed on an ECDIS with a text description to the right of the symbol.
Figure 430. A chart title block.
Figure 432a. Link to Chart No. 1. https://msi.nga.mil/NGAPortal/MSI.portal?_nfpb=true&_
pageLabel=msi_portal_page_62&pubCode=0004

NAUTICAL CHARTS 51
433. Lettering
Except on some modified reproductions of foreign charts, cartographers have adopted certain lettering stan-dards. Vertical type is used for features which are dry at high water and not affected by movement of the water; slanting type is used for underwater and floating features.
There are two important exceptions to the two general rules listed above. Vertical type is not used to represent heights above the waterline, and slanting type is not used to indicate soundings, except on metric charts. Section 434 dis-cusses the conventions for indicating soundings.
Evaluating the type of lettering used to denote a feature, one can determine whether a feature is visible at high tide. For instance, a rock might bear the title “Rock” whether or not it extends above the surface. If the name is given in ver-tical letters, the rock constitutes a small islet; if in slanting type, the rock constitutes a reef, covered at high water.
434. Soundings
Charts show soundings in several ways. Numbers de-note individual soundings. These numbers may be either vertical or slanting; both may be used on the same chart, distinguishing between data based upon different U.S. and foreign surveys, different datums, or smaller scale charts.
Large block letters at the top and bottom of the chart indicate the unit of measurement used for soundings. SOUNDINGS IN FATHOMS indicates soundings are in fathoms or fathoms and fractions. SOUNDINGS IN FATHOMS AND FEET indicates the soundings are in fath-oms and feet. A similar convention is followed when the soundings are in meters or meters and tenths.
A depth conversion scale is placed outside the neat-line on the chart for use in converting charted depths to feet, meters, or fathoms. “No bottom” soundings are indicated by a number with a line over the top and a dot over the line. This indicates that the spot was sounded to the depth indi-cated without reaching the bottom. Areas which have been
Figure 432b. Contents of U.S. Chart No. 1.

52 NAUTICAL CHARTS
wire dragged are shown by a broken limiting line, and the clear effective depth is indicated, with a characteristic sym-bol under the numbers. On NGA charts a purple or green tint is shown within the swept area.
Soundings are supplemented by depth contours, lines connecting points of equal depth. These lines present a pic-ture of the bottom. The types of lines used for various depths are shown in Section I of Chart No. 1. On some charts depth contours are shown in solid lines; the depth represented by each line is shown by numbers placed in breaks in the lines, as with land contours. Solid line depth contours are derived from intensively developed hydro-graphic surveys. A broken or indefinite contour is substituted for a solid depth contour whenever the reliabil-ity of the contour is questionable.
Depth contours are labeled with numerals in the unit of measurement of the soundings. A chart presenting a more detailed indication of the bottom configuration with fewer numerical soundings is useful when bottom contour navi-gating. Such a chart can be made only for areas which have undergone a detailed survey
Shoal areas often are given a blue tint. Charts designed to give maximum emphasis to the configuration of the bot-tom show depths beyond the 100-fathom curve over the entire chart by depth contours similar to the contours shown on land areas to indicate graduations in height. These are called bottom contour or bathymetric charts.
On electronic charts, a variety of other color schemes may be used, according to the manufacturer of the system. Color perception studies are being used to determine the best presentation.
The side limits of dredged channels are indicated by broken lines. The project depth and the date of dredging, if known, are shown by a statement in or along the channel. The possibility of silting is always present. Local authori-ties should be consulted for the controlling depth. NOS charts frequently show controlling depths in a table, which is kept current by the Notice to Mariners.
The chart scale is generally too small to permit all soundings to be shown. In the selection of soundings, least depths are shown first. This conservative sounding pattern provides safety and ensures an uncluttered chart appear-ance. Steep changes in depth may be indicated by more dense soundings in the area. The limits of shoal water indi-cated on the chart may be in error, and nearby areas of undetected shallow water may not be included on the chart. Given this possibility, areas where shoal water is known to exist should be avoided. If the navigator must enter an area containing shoals, they must exercise extreme caution in avoiding shallow areas which may have escaped detection. By constructing a “safety range” around known shoals and ensuring their vessel does not approach the shoal any closer than the safety range, the navigator can increase their chances of successfully navigating through shoal water. Constant use of the echo sounder is also important.
Abbreviations listed in Section J of Chart No. 1 are
used to indicate what substance forms the bottom. The meaning of these terms can be found in the Glossary of this volume. While in ages past navigators might actually navi-gate by knowing the bottom characteristics of certain local areas, today knowing the characteristic of the bottom is most important when anchoring.
435. Depths and Datums
Depths are indicated by soundings or explanatory notes. Only a small percentage of the soundings obtained in a hydrographic survey can be shown on a nautical chart. The least depths are generally selected first, and a pattern built around them to provide a representative indication of bottom relief. In shallow water, soundings may be spaced 0.2 to 0.4 inch apart. The spacing is gradually increased as water deepens, until a spacing of 0.8 to 1.0 inch is reached in deeper waters offshore. Where a sufficient number of soundings are available to permit adequate interpretation, depth curves are drawn in at selected intervals.
All depths indicated on charts are reckoned from a se-lected level of the water, called the sounding datum, (sometimes referred to as the reference plane to distin-guish this term from the geodetic datum). The various sounding datums are explained in Chapter 35- Tides and Tidal Currents. On charts produced from U.S. surveys, the sounding datum is selected with regard to the tides of the re-gion. Depths shown are the least depths to be expected under average conditions. On charts compiled from foreign charts and surveys the sounding datum is that of the original authority. When it is known, the sounding datum used is stated on the chart. In some cases where the chart is based upon old surveys, particularly in areas where the range of tide is not great, the sounding datum may not be known.
For most NOAA charts of the United States and Puerto Rico, the sounding datum is indicated as Mean Lower Low Water (MLLW). Most NGA charts are based upon mean low water, mean lower low water, or mean low water springs. The sounding datum for charts published by other countries varies greatly, but is usually lower than mean low water. On charts of the Baltic Sea, Black Sea, the Great Lakes, and other areas where tidal effects are small or with-out significance, the sounding datum adopted is an arbitrary height approximating the mean water level.
The sounding datum of the largest scale chart of an area is generally the same as the reference level from which height of tide is tabulated in the tide tables.
The chart datum is usually only an approximation of the actual mean value, because determination of the actual mean height usually requires a longer series of tidal obser-vations than is normally available to the cartographer. In addition, the heights of the tide vary over time.
Since the chart datum is generally a computed mean or average height at some state of the tide, the depth of water at any particular moment may be less than shown on the chart. For example, if the chart datum is mean lower low

NAUTICAL CHARTS 53
water, the depth of water at lower low water will be less than the charted depth about as often as it is greater. A lower depth is indicated in the tide tables by a minus sign (–).
436. Heights
The shoreline shown on charts is generally mean high water. A light’s height is usually reckoned from mean sea level. The heights of overhanging obstructions (bridges, power cables, etc.) are usually reckoned from mean high water. A high water reference gives the mariner the mini-mum clearance expected.
Since heights are usually reckoned from high water and depths from some form of low water, the reference lev-els are seldom the same. Except where the range of tide is very large, this is of little practical significance.
437. Dangers
Dangers are shown by appropriate symbols, as indicat-ed in Section K of Chart No. 1.
A rock uncovered at mean high water may be shown as an islet. If an isolated, offlying rock is known to uncover at the sounding datum but to be covered at high water, the chart shows the appropriate symbol for a rock and gives the height above the sounding datum. The chart can give this height one of two ways. It can use a statement such as “Uncov 2 ft.,” or it can indicate the number of feet the rock protrudes above the sounding datum, underline this value, and enclose it in parentheses (i.e. (2)). A rock which does not uncover is shown by an enclosed figure approximating its dimensions and filled with land tint. It may be enclosed by a dotted depth curve for emphasis.
A tinted, irregular-line figure of approximately true di-mensions is used to show a detached coral reef which uncovers at the chart datum. For a coral or rocky reef which is submerged at chart datum, the sunken rock symbol or an appropriate statement is used, enclosed by a dotted or bro-ken line if the limits have been determined.
Several different symbols mark wrecks. The nature of the wreck or scale of the chart determines the correct symbol. A sunken wreck with less than 30 meters of water over it is consid-ered dangerous and its symbol is surrounded by a dotted curve. The curve is omitted if the wreck is deeper than 30 meters. The safe clearance over a wreck, if known, is indicated by a standard sounding number placed at the wreck. If this depth was deter-mined by a wire drag, the sounding is underscored by the wire drag symbol. An unsurveyed wreck over which the exact depth is unknown but a safe clearance depth is known is depicted with a solid line above the symbol.
Tide rips, eddies, and kelp are shown by symbol or legend. Piles, dolphins (clusters of piles), snags, and stumps are shown by small circles and a label identifying the type of obstruction. If such dangers are submerged, the letters “Subm” precede the la-bel. Fish stakes and traps are shown when known to be permanent or hazardous to navigation.
438. Aids to Navigation
Aids to navigation are shown by symbols listed in Sec-tions P through S of Chart No. 1. Abbreviations and additional descriptive text supplement these symbols. In or-der to make the symbols conspicuous, the chart shows them in size greatly exaggerated relative to the scale of the chart. “Position approximate” circles are used on floating aids to indicate that they have no exact position because they move around their moorings. For most floating aids, the position circle in the symbol marks the approximate location of the anchor or sinker. The actual aid may be displaced from this location by the scope of its mooring.
The type and number of aids to navigation shown on a chart and the amount of information given in their legends varies with the scale of the chart. Smaller scale charts may have fewer aids indicated and less information than larger scale charts of the same area.
Lighthouses and other navigation lights are shown as black dots with purple disks or as black dots with purple flare symbols. The center of the dot is the position of the light. Some modified facsimile foreign charts use a small star instead of a dot.
On large-scale charts the legend elements of lights are shown in the following order:
The legend characteristics for this light would appear on the chart:
“6” Fl(2) R 10s 80m 19M
As chart scale decreases, information in the legend is selectively deleted to avoid clutter. The order of deletion is usually height first, followed by period, group repetition in-terval (e.g. (2)), designation, and range. Characteristic and color will almost always be shown.
Small triangles mark red daybeacons; small squares mark all others. On NGA charts, pictorial beacons are used when the IALA buoyage system has been implemented. The center of the triangle marks the position of the aid. Ex-cept on Intracoastal Waterway charts and charts of state waterways, the abbreviation “Bn” is shown beside the sym-bol, along with the appropriate abbreviation for color if
Legend Example Meaning
Designation “6” Light number 6
Characteristic F1(2) group flashing; 2 flashes
Color R red
Period 10s 2 flashes in 10 seconds
Height 80m 80 meters
Range 19M 19 nautical miles

54 NAUTICAL CHARTS
known. For black beacons the triangle is solid black and there is no color abbreviation. All beacon abbreviations are in vertical lettering.
Radiobeacons are indicated on the chart by a purple circle accompanied by the appropriate abbreviation indicat-ing an ordinary radiobeacon (R Bn) or a radar beacon (Ramark or Racon, for example).
A variety of symbols, determined by both the charting agency and the types of buoys, indicate navigation buoys. IALA buoys (see Chapter 7- Short Range Aids to Naviga-tion) in foreign areas are depicted by various styles of symbols with proper topmarks and colors; the position cir-cle which shows the approximate location of the sinker is at the base of the symbol.
A mooring buoy is shown by one of several symbols as indicated in Chart No. 1. It may be labeled with a berth number or other information.
A buoy symbol with a horizontal line indicates the buoy has horizontal bands. A vertical line indicates vertical stripes; crossed lines indicate a checked pattern. There is no significance to the angle at which the buoy symbol appears on the chart. The symbol is placed so as to avoid interfer-ence with other features.
Lighted buoys are indicated by a purple flare from the buoy symbol or by a small purple disk centered on the po-sition circle.
Abbreviations for light legends, type and color of buoy, designation, and any other pertinent information giv-en near the symbol are in slanted type. The letter C, N, or S indicates a can, nun, or spar, respectively. Other buoys are assumed to be pillar buoys, except for special buoys such as spherical, barrel, etc. The number or letter designation of the buoy is given in quotation marks on NOS charts. On other charts they may be given without quotation marks or other punctuation.
Aeronautical lights included in the light lists are shown by the lighthouse symbol, accompanied by the abbreviation “AERO.” The characteristics shown depend principally upon the effective range of other navigational lights in the vicinity and the usefulness of the light for marine navigation.
Directional ranges are indicated by a broken or solid line. The solid line, indicating that part of the range intend-ed for navigation, may be broken at irregular intervals to avoid being drawn through soundings. That part of the range line drawn only to guide the eye to the objects to be kept in range is broken at regular intervals. The direction, if given, is expressed in degrees, clockwise from true north.
Sound signals are indicated by the appropriate word in capital letters (HORN, BELL, GONG, or WHIS) or an ab-breviation indicating the type of sound. Sound signals of any type except submarine sound signals may be represent-ed by three purple 45° arcs of concentric circles near the top of the aid. These are not shown if the type of signal is listed. The location of a sound signal which does not accompany a visual aid, either lighted or unlighted, is shown by a small
circle and the appropriate word in vertical block letters.Private aids, when shown, are marked “Priv” on NOS
charts. Some privately maintained unlighted fixed aids are indicated by a small circle accompanied by the word “Marker,” or a larger circle with a dot in the center and the word “MARKER.” A privately maintained lighted aid has a light symbol and is accompanied by the characteristics and the usual indication of its private nature. Private aids should be used with caution.
A light sector is the sector or area bounded by two radii and the arc of a circle in which a light is visible or in which it has a distinctive color different from that of adjoining sec-tors. The limiting radii are indicated on the chart by dotted or dashed lines. Sector colors are indicated by words spelled out if space permits, or by abbreviations (W, R, etc.) if it does not. Limits of light sectors and arcs of visibility as observed from a vessel are given in the light lists, in clock-wise order.
439. Land Areas
The amount of detail shown on the land areas of nauti-cal charts depends upon the scale and the intended purpose of the chart. Contours, form lines, and shading indicate relief.
Contours are lines connecting points of equal eleva-tion. Heights are usually expressed in feet (or in meters with means for conversion to feet). The interval between con-tours is uniform over any one chart, except that certain intermediate contours are sometimes shown by broken line. When contours are broken, their locations are approximate.
Form lines are approximations of contours used for the purpose of indicating relative elevations. They are used in areas where accurate information is not available in suffi-cient detail to permit exact location of contours. Elevations of individual form lines are not indicated on the chart.
Spot elevations are generally given only for summits or for tops of conspicuous landmarks. The heights of spot ele-vations and contours are given with reference to mean high water when this information is available.
When there is insufficient space to show the heights of islets or rocks, they are indicated by slanting figures en-closed in parentheses in the water area nearby.
440. Cities and Roads
Cities are shown in a generalized pattern that approxi-mates their extent and shape. Street names are generally not charted except those along the waterfront on the largest scale charts. In general, only the main arteries and thor-oughfares or major coastal highways are shown on smaller scale charts. Occasionally, highway numbers are given. When shown, trails are indicated by a light broken line. Buildings along the waterfront or individual ones back from the waterfront but of special interest to the mariner are shown on large-scale charts. Special symbols from Chart

NAUTICAL CHARTS 55
No. 1 are used for certain kinds of buildings. A single line with cross marks indicates both single and double track rail-roads. City electric railways are usually not charted. Airports are shown on small-scale charts by symbol and on large-scale charts by the shape of runways. The scale of the chart determines if single or double lines show breakwaters and jetties; broken lines show the submerged portion of these features.
441. Landmarks
Landmarks are shown by symbols in Chart No. 1.A large circle with a dot at its center is used to indicate
that the position is precise and may be used without reser-vation for plotting bearings. A small circle without a dot is used for landmarks not accurately located. Capital and low-er case letters are used to identify an approximate landmark: “Mon,” “Cup,” or “Dome.” The abbreviation “PA” (position approximate) may also appear. An accurate
landmark is identified by all capital type (“MON,” “CUP,” “DOME”).
When only one object of a group is charted, its name is followed by a descriptive legend in parenthesis, including the number of objects in the group, for example “(TALL-EST OF FOUR)” or “(NORTHEAST OF THREE).”
442. Miscellaneous Chart Features
A measured nautical mile indicated on a chart is accu-rate to within 6 feet of the correct length. Most measured miles in the United States were made before 1959, when the United States adopted the International Nautical Mile. The new value is within 6 feet of the previous standard length of 6,080.20 feet. If the measured distance differs from the standard value by more than 6 feet, the actual measured dis-tance is stated and the words “measured mile” are omitted.
Periods after abbreviations in water areas are omitted
because these might be mistaken for rocks. However, a lower case i or j is dotted.
Commercial radio broadcasting stations are shown on charts when they are of value to the mariner either as land-marks or sources of direction-finding bearings.
Lines of demarcation between the areas in which inter-national and inland navigation rules apply are shown only when they cannot be adequately described in notes on the chart.
Compass roses are placed at convenient locations on Mercator charts to facilitate the plotting of bearings and courses. The outer circle is graduated in degrees with zero at true north. The inner circle indicates magnetic north.
On many NGA charts magnetic variation is given to the nearest 1' by notes in the centers of compass roses. the annual change is given to the nearest 1' to permit correction of the given value at a later date. On NOS charts, variation is to the nearest 15', updated at each new edition if over three years old. The current practice of NGA is to give the magnetic variation to the nearest 1', but the magnetic infor-mation on new editions is only updated to conform with the latest five year epoch. Whenever a chart is reprinted, the magnetic information is updated to the latest epoch. On some smaller scale charts, the variation is given by isogonic lines connecting points of equal variation; usually a sepa-rate line represents each degree of variation. The line of
zero variation is called the agonic line. Many plans and in-sets show neither compass roses nor isogonic lines, but indicate magnetic information by note. A local magnetic disturbance of sufficient force to cause noticeable deflec-tion of the magnetic compass, called local attraction, is indicated by a note on the chart.
Currents are sometimes shown on charts with arrows giving the directions and figures showing speeds. The in-formation refers to the usual or average conditions. According to tides and weather, conditions at any given time may differ considerably from those shown.
Review chart notes carefully because they provide im-portant information. Several types of notes are used. Those in the margin give such information as chart number, pub-lication notes, and identification of adjoining charts. Notes in connection with the chart title include information on scale, sources of data, tidal information, soundings, and cautions. Another class of notes covers such topics as local magnetic disturbance, controlling depths of channels, haz-ards to navigation, and anchorages.
A datum note will show the geodetic datum of the chart (Do not confuse with the sounding datum. See Chapter 2 -Geodesy and Datums in Navigation). It may also contain in-structions on plotting positions from the WGS 84 or NAD 83 datums on the chart if such a conversion is needed.
TIDAL INFORMATION
PlacePosition
Height above datum of soundings
Mean High Water Mean Low Water
N. Lat. E. Long. Higher Lower Lower Higher
meters meters meters meters
Olongapo . . . . . . 14°49' 120°17' . . . 0.9 . . . . . . 0.4 . . . . . 0.0 . . . . 0.3 . .
Figure 442a. Tidal box.

56 NAUTICAL CHARTS
Anchorage areas are labeled with a variety of magenta, black, or green lines depending on the status of the area. Anchorage berths are shown as purple circles, with the number or letter assigned to the berth inscribed within the circle. Caution notes are sometimes shown when there are specific anchoring regulations.
Spoil areas are shown within short broken black lines. Spoil areas are tinted blue on NOS charts and labeled. These areas contain no soundings and should be avoided.
Firing and bombing practice areas in the United States territorial and adjacent waters are shown on NOS and NGA charts of the same area and comparable scale.
Danger areas established for short periods of time are not charted but are announced locally. Most military com-mands charged with supervision of gunnery and missile firing areas promulgate a weekly schedule listing activated danger areas. This schedule is subjected to frequent change; the mariner should always ensure they have the latest sched-
ule prior to proceeding into a gunnery or missile firing area. Danger areas in effect for longer periods are published in the Notice to Mariners. Any aid to navigation established to mark a danger area or a fixed or floating target is shown on charts.
Traffic separation schemes are shown on standard nau-tical charts of scale 1:600,000 and larger and are printed in magenta.
A logarithmic time-speed-distance nomogram with an explanation of its application is shown on harbor charts.
Tidal information boxes are shown on charts of scales 1:200,000 and larger for NOS charts, and various scales on NGA charts, according to the source. See Figure 442a.
Tabulations of controlling depths are shown on some NOS harbor and coastal charts. See Figure 442b.
Study Chart No. 1 thoroughly to become familiar with all the symbols used to depict the wide variety of features on nautical charts.
REPRODUCTIONS OF FOREIGN CHARTS
443. Modified Facsimiles
Modified facsimile charts are modified reproductions of foreign charts produced in accordance with bilateral interna-tional agreements. These reproductions provide the mariner with up-to-date charts of foreign waters. Modified facsimile charts published by NGA are, in general, reproduced with minimal changes, as listed below:
1. The original name of the chart may be removed and replaced by an anglicized version.
2. English language equivalents of names and terms on the original chart are printed in a suitable glos-sary on the reproduction, as appropriate.
3. All hydrographic information, except bottom char-acteristics, is shown as depicted on the original chart.
4. Bottom characteristics are as depicted in Chart No. 1, or as on the original with a glossary.
5. The unit of measurement used for soundings is shown in block letters outside the upper and lower
neatlines.6. A scale for converting charted depth to feet, meters,
or fathoms is added.7. Blue tint is shown from a significant depth curve to
the shoreline.8. Blue tint is added to all dangers enclosed by a dot-
ted danger curve, dangerous wrecks, foul areas, obstructions, rocks awash, sunken rocks, and swept wrecks.
9. Caution notes are shown in purple and enclosed in a box.
10. Restricted, danger, and prohibited areas are usually outlined in purple and labeled appropriately.
11. Traffic separation schemes are shown in purple.12. A note on traffic separation schemes, printed in
black, is added to the chart.13. Wire dragged (swept) areas are shown in purple or
green.14. Corrections are provided to shift the horizontal da-
tum to the WGS (1984).
NANTUCKET HARBOR
Tabulated from surveys by the Corps of Engineers - report of June 1972and surveys of Nov. 1971
Controlling depths in channels entering fromseaward in feet at Mean Low Water Project Dimensions
Name of ChannelLeft
outside quarter
Middle half of
channel
Right outside quarter
Date of Survey Width (feet)
Length (naut. miles)
Depth M. L. W.
(feet)
Entrance Channel 11.1 15.0 15.0 11 - 71 300 1.2 15
Note.-The Corps of Engineers should be consulted for changing conditions subsequent to the above.
Figure 442b. Tabulations of controlling depths.

NAUTICAL CHARTS 57
INTERNATIONAL CHARTS
444. International Chart Standards
The need for mariners and chart makers to understand and use nautical charts of different nations became increas-ingly apparent as the maritime nations of the world developed their own establishments for the compilation and publication of nautical charts from hydrographic surveys. Representatives of twenty-two nations formed a Hydro-graphic Conference in London in 1919. That conference resulted in the establishment of the International Hydro-graphic Bureau (IHB) in Monaco in 1921. Today, the IHB’s successor, the International Hydrographic Orga-nization (IHO) continues to provide international standards for the cartographers of its member nations. (See Chapter 1 - Introduction to Marine Navigation, for a de-scription of the IHO.)
Recognizing the considerable duplication of effort by member states, the IHO in 1967 moved to introduce the first international chart. It formed a committee of six member states to formulate specifications for two series of interna-tional charts. Eighty-three small-scale charts were approved; responsibility for compiling these charts has sub-sequently been accepted by the member states’ Hydrographic Offices.
Once a Member State publishes an international chart, reproduction material is made available to any other Mem-ber State which may wish to print the chart for its own purposes.
International charts can be identified by the letters INT before the chart number and the IHO seal in addition to oth-er national seals which may appear.
PRINT ON DEMAND CHARTS
445. NOAA Print-on-Demand Paper Charts
NOAA's paper nautical charts are available as “print-on-demand,” up-to-date to the time of purchase. Coast Sur-vey reviews charts weekly, and applies all critical corrections specified in Notices to Mariners. NOAA print-on-demand paper charts must be printed by NOAA-certi-fied agents to meet the requirements for the mandatory carriage of nautical charts.
446. NOAA PDF Nautical Charts
NOAA provides about a thousand high-resolution printable nautical charts - almost the entire NOAA suite of charts - as PDF files. The PDF nautical charts are exact im-ages of NOAA's traditional nautical charts. Coast Survey checks each chart weekly, and applies all critical correc-tions. Most charts can be printed from any plotter capable
of plotting 36" width to achieve 1:1 scale. (NOTE: Mari-ners using paper charts to meet chart carriage requirements under federal regulations should use printed charts provid-ed by NOAA-certified print-on-demand vendors).
447. NGA Enterprise Print on Demand Service (ePODs)
The Enterprise Print on Demand Service (ePODs) is NGA’s effort to expedite and modernize the creation of leg-acy chart formats based on geospatially enabled database information. ePODs is a revolutionary concept that utilizes evolutionary methods to provide hardcopy charts built from digital data to the customer. ePODs are print-ready nautical chart files generated directly from existing vector data sets of foundation feature data. The system produces print-ready files that can be delivered directly to DoD and other autho-rized customers, or stored at a Remote Replication Service (RSS) sites for printing products “on demand.”
Figure 445. NOAA Print-on-Demand charts. http://www.charts.noaa.gov/InteractiveCatalog/nrnc.shtml
Figure 446. NOAA PDF charts. https://nauticalcharts.noaa.gov/

58 NAUTICAL CHARTS
CHART NUMBERING
448. The Chart Numbering System
NGA and NOS use a system in which numbers are assigned in accordance with both the scale and geo-graphical area of coverage of a chart. With the exception of certain charts produced for military use only, one- to five-digit numbers are used. With the exception of one-digit numbers, the first digit identifies the area; the num-ber of digits establishes the scale range. The one-digit numbers are used for certain products in the chart system which are not actually charts.
Two- and three-digit numbers are assigned to those small-scale charts which depict a major portion of an ocean basin or a large area. The first digit identifies the applicable ocean basin. See Figure 448b. Two-digit numbers are used
for charts of scale 1:9,000,000 and smaller. Three-digit numbers are used for charts of scale 1:2,000,000 to 1:9,000,000.
Due to the limited sizes of certain ocean basins, no
Number of Digits Scale
1 No Scale
2 1:9 million and smaller
3 1:2 million to 1:9 million
4 Special Purpose
5 1:2 million and larger
Table 448a. Chart Numbering
Figure 448b. Ocean basins with region numbers.

NAUTICAL CHARTS 59
charts for navigational use at scales of 1:9,000,000 and smaller are published to cover these basins. The otherwise unused two-digit numbers (30 to 49 and 70 to 79) are as-signed to special world charts.
One exception to the scale range criteria for three-digit numbers is the use of three-digit numbers for a series of po-sition plotting sheets. They are of larger scale than 1:2,000,000 because they have application in ocean basins and can be used in all longitudes.
Four-digit numbers are used for non-navigational and special purpose charts, such as chart 4149, Straits of Florida.
Five-digit numbers are assigned to those charts of scale 1:2,000,000 and larger that cover portions of the coastline rather than significant portions of ocean basins. These charts are based on the regions of the nautical chart index. See Figure 448c.
The first of the five digits indicates the region; the sec-ond digit indicates the subregion; the last three digits indicate the geographical sequence of the chart within the subregion. Many numbers have been left unused so that any future charts may be placed in their proper geographical sequence.
In order to establish a logical numbering system within the geographical subregions (for the 1:2,000,000 and larg-er-scale charts), a worldwide skeleton framework of coastal charts was laid out at a scale 1:250,000. This series was used as basic coverage except in areas where a coordinated series at about this scale already existed (such as the coast of Norway where a coordinated series of 1:200,000 charts was available).
Within each region, the geographical subregions are numbered counterclockwise around the continents, and within each subregion the basic series also is numbered counterclockwise around the continents. The basic cover-age is assigned generally every 20th digit, except that the first 40 numbers in each subregion are reserved for smaller-scale coverage. Charts with scales larger than the basic cov-erage are assigned one of the 19 numbers following the number assigned to the sheet within which it falls. Figure 448d shows the numbering sequence in Iceland. Note the sequence of numbers around the coast, the direction of numbering, and the numbering of larger scale charts within the limits of smaller scales.
Figure 448c. Regions and subregions of the nautical chart index.

60 NAUTICAL CHARTS
Certain exceptions to the standard numbering system have been made for charts intended for the military. Bottom contour charts depict parts of ocean basins. They are iden-tified with a letter plus four digits according to a scheme best shown in the catalog, and are not available to civilian navigators. Combat charts have 6-digit numbers beginning
with an “8.” Neither is available to civilian navigators.Five-digit numbers are also assigned to the charts pro-
duced by other hydrographic offices. This numbering system is applied to foreign charts so that they can be filed in logical sequence with the charts produced by the NGA and the NOS.
449. Catalogs and Stock Numbers
The NGA/DLIS Catalog of Maps, Charts and Related Products is available on CD only. It is reserved for military and government agencies, which possess access to limited distribution data. New versions of the catalog are released every six months with corrections published in the weekly Notice to Mariners. The standalone CD in interactive with a robust Table of Contents. The digital catalog has the abil-ity to pan across the Pacific Ocean. Military navigators receive their nautical charts and publications automatically; civilian navigators purchase them from chart sales agents.
NOAA charts are available digitally through its Nauti-cal Products Catalog or by selecting one of the five regional chart catalogs. There is also a print-at-home option for NOAA chart catalogs. By visiting the NOAA nautical
charts and publications website, users can select their re-gion of interest and download a PDF. The Nautical Product Catalog provides access to paper charts (RNC & PDF) as well as Electronic Charts (ENC). See Figure 449 for a link to the NOAA chart catalog.
The stock number and bar code are generally found in
Figure 448d. Chart coverage of Iceland, illustrating the sequence and direction of the U.S. chart numbering system.
Figure 449. NOAA Nautical Chart Catalogs. http://www.charts.noaa.gov/ChartCatalog/MapSelect.html

NAUTICAL CHARTS 61
the lower left corner of a NGA chart. The first two digits of the stock number refer to the region and subregion. These are followed by three letters, the first of which refers to the portfolio to which the chart belongs; the second two denote
the type of chart: CO for coastal, HA for harbor and ap-proach, and OA for military operating area charts. The last five digits are the actual chart number.
USING CHARTS
450. Preliminary Steps
Before using a new edition of a chart, verify its an-nouncement in the Notice to Mariners and correct it with all applicable corrections. Read all the chart’s notes; there should be no question about the meanings of symbols or the units in which depths are given. Since the latitude and lon-gitude scales differ considerably on various charts, carefully note those on the chart to be used.
Place additional information on the chart as required. Arcs of circles might be drawn around navigational lights to indicate the limit of visibility at the height of eye of an ob-server on the bridge. Notes regarding other information from the light lists, tide tables, tidal current tables, and sail-ing directions might prove helpful.
451. Maintaining Charts
A mariner navigating on an uncorrected chart is court-ing disaster. The chart's print date reflects the latest Notice to Mariners used to update the chart; responsibility for maintaining it after this date lies with the user. The weekly Notice to Mariners contains information needed for main-taining charts. Radio broadcasts give advance notice of urgent corrections. Local Notice to Mariners should be con-sulted for inshore areas. The navigator must develop a system to keep track of chart corrections and to ensure that the chart they are using is updated with the latest correction.
For vessels still using paper charts a convenient way of keeping this record is with a Chart/Publication Correc-tion Record Card system. Using this system, navigators do not immediately update every chart in their portfolio when they receive the Notice to Mariners. Instead, they construct a card for every chart in their portfolio and notes the correc-tions on this card. When the time comes to use the chart, they pull the chart and the chart's card, and they makes the indicated corrections on the chart. This system ensures that every paper chart is properly corrected prior to use.
Electronic and printed chart correction card forms are available through the NGA Maritime Safety Information web portal under the miscellaneous products tab. See Fig-ure 451 for the link.
With Notice to Mariners available on the internet, mari-ners have the ability to see all applicable corrections to a chart by a specified date range, all corrections and also for multiple charts at a time.
A Summary of Corrections, containing a cumulative listing of previously published Notice to Mariners correc-tions, is published annually in 5 volumes by NGA. Thus, to
fully correct a chart whose edition date is several years old, the navigator needs only the Summary of Corrections for that region and the notices from that Summary forward; the nav-igator does not need to obtain notices all the way back to the edition date. See Chapter 6, Nautical Publications, for a de-scription of the Summaries and Notice to Mariners.
When a new edition of a chart is published, it is nor-mally furnished automatically to U.S. Government vessels. It should not be used until it is announced as ready for use in the Notice to Mariners. Until that time, corrections in the Notice apply to the old edition and should not be applied to the new one. When it is announced, a new edition of a chart replaces an older one.
Commercial users and others who don’t automatically receive new editions should obtain new editions from their sales agent. Occasionally, charts may be received or pur-chased several weeks in advance of their announcement in the Notice to Mariners. This is usually due to extensive re-scheming of a chart region and the need to announce groups of charts together to avoid lapses in coverage. The mariner bears the responsibility for ensuring that their charts are the current edition. The fact that a new edition has been com-piled and published often indicates that there have been extensive changes that cannot be made by hand corrections.
452. Using and Stowing Charts
Use and stow charts carefully. This is especially true with digital charts contained on electronic media. Keep op-tical and magnetic media containing chart data out of the sun, inside dust covers, and away from magnetic influenc-es. Placing a disk in an inhospitable environment may destroy the data.
Make permanent corrections to paper charts in ink so that they will not be inadvertently erased. Pencil in all other markings so that they can be easily erased without damag-ing the chart. Lay out and label tracks on charts of
Figure 451. Chart correction forms. https://msi.nga.mil/NGAPortal/MSI.portal?_nfpb=true&_
pageLabel=msi_portal_page_69&prodCode=03

62 NAUTICAL CHARTS
frequently-traveled ports in ink. Draw lines and labels no larger than necessary. Do not obscure sounding data or oth-er information when labeling a chart. When a voyage is completed, carefully erase the charts unless there has been a grounding or collision. In this case, preserve the charts without change because they will play a critical role in the investigation.
When not in use, stow charts flat in their proper portfo-lio. Minimize their folding and properly index them for easy retrieval.
453. Chart Lighting
Mariners often work in a red light environment be-cause red light is least disturbing to night adapted vision.
Such lighting can significantly affect the appearance of a chart. Before using a chart in red light, test the effect red light has on its markings. Do not outline or otherwise indi-cate navigational hazards in red pencil because red markings disappear under red light.
454. Port Maury Sample Chart
U.S. Chart No. 9999 - Port Maury (Wilkes Island, North Pacific) is produced by NGA and NOAA for training purposes, This fictitious sample of a nautical chart depicts a typical harbor area. The chart symbology is annotated to include references to U.S. Chart No. 1 and is meant to be a beginners guide and teaching reference to students of ma-rine navigation.
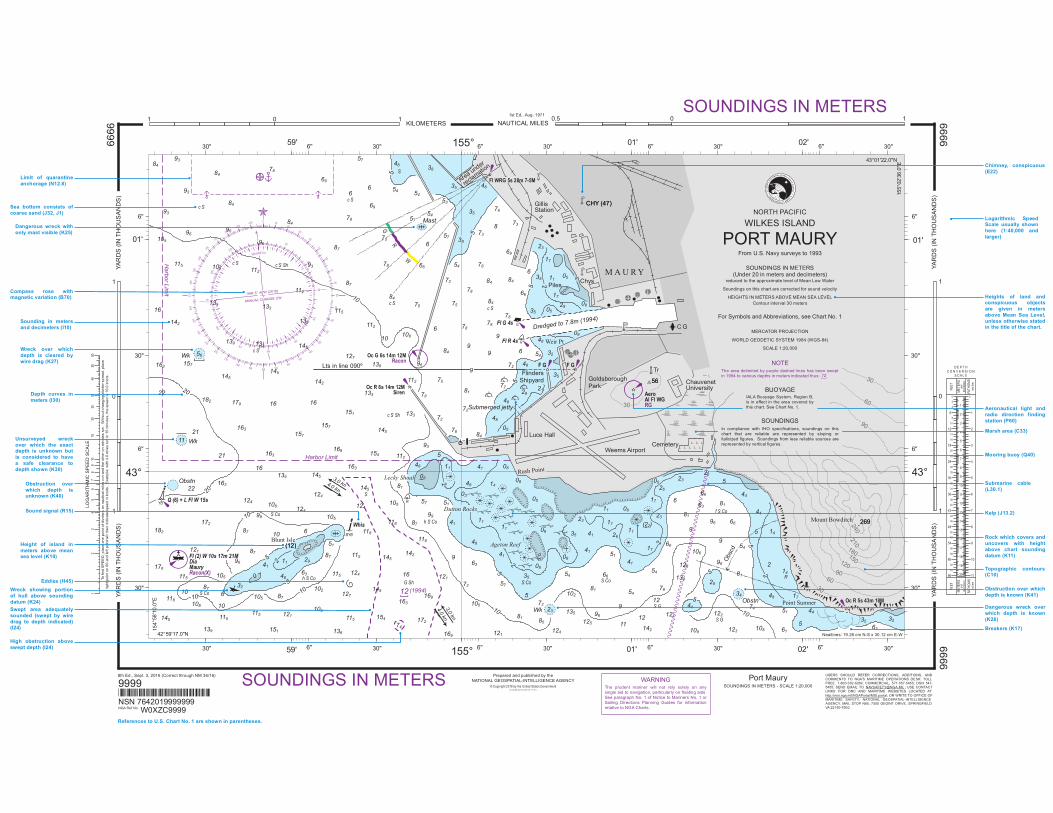
RRR RRR
R
::::::::::::::::::::::::::::::::::::::::::::
6
;
< <
< <<<
<<<
< <
<
<<
Ã
×
ø
ss
.
d
dd
d
d
d
d
k
kk
k
k
k
k }}@@@
_`_`
dd
d
d
}
}}
}}
¥ë
·
º ·
¼
¹
q
ó
ô
43°
6''
6''
154
°58
'10
.0"E
42°59'17.0"N
01'
30"
30"
155° 01'6'' 6'' 6'' 6''
59' 02'30" 30" 30" 30" 30"
6''
6''
155
°02
'36
.0"E
43°01'22.0"N
43°
01'
30"
30"
155° 01'6'' 6'' 6'' 6''59' 02'30" 30" 30" 30" 30"
78
57
84
9384
84
84
93
93
93
96
9696
78
78
84
69
69
6
6
48 38
35
35
48
38
57
57
54 54
54
53
6
75
87
87
54
75
72
66
75
78
78
73
73
76
6
84
112
112
115
10108
112
139
139
133
133
127
157
157
145
142
1616
145
145
151
154169
112
163
145
75
78
78
78
72
93
72
48
48
48
48
5
11 41 08
84
48
09
9
99
9
8
69
84 84
84
66
6
78
78
080535
35
23
05
17
17
11
29
6
72
7281
05
2921
35
3254
57
05
48
03
08
05
08
08
08
48
4111
11
54
51
14
41
41
41
35
23
26
11
11
17
17
17
(22)
08
05
23
41
51
54
66
81
996
1112 121
135
102
124
35
5
57
63
121
81 85
7223
72
105
9
99
81
87118
118
105
105
145
124
124124
124
124
127
118
115
115
145
145
163
169
16
142
121
172154115
105
102
74
169136
121
6
87
105
115 108 112
133
133139
145
157
142
16
163
182
163
163
179
21
21
22
22
16
163
139
108
139
115115
105118
115
108
87
87
87
87
151
10
105
121
172
99
10
11
182
96
610
145
1766348
4111 29
56
54
79
66
26
6
81
66
23
96
9
9
66
6381
26
12
106
126
134
125
122
25
44
142 108 123 108 61
34
74
96
81
54
5
44
44
5
14
14
2
48
51
5
44
17
35
63
32
96
2
52
52
5
5 2
5
5
210 10
5
5
5
2
5
1010
10
20
20
10133
51
32
240
30
60
90
210
30
9060
180150120
30
269
(12)
CHY (47)
56
c Sc S
S
c S c S Sh
c Sc S
c S Sh
BYB
S Co
S Co
h S Co
h S Co
S CoS Co
S G
S G
f S Co
R
RYB
R
G
c S
Mast
Obstn
Wk
Wk
Wk
Obstn
Tr
G Sh
Harbor Limit
Q (6) + L Fl W 15s
Fl (2) W 10s 17m 21MDiaMauryRacon(X)
Whis
Blunt Isle
S
12C
(1994)
3.0 kn4.0 kn
Lecky Shoal
Dutton Rocks
Ageton Reef
Rush Point
Fl G 4s
Fl R 4s
Dredged to 7.8m (1994)
Piles
Weir Pt
F G F G
AeroAl Fl WGRG
FlindersShipyard Goldsborough
Park
Luce Hall
Weems Airport
Obs
cd
Mount Bowditch
M A U R Y
GillisStation
Area under
reclamatio
n
Oc G 6s 14m 12MRacon
Oc R 6s 14m 12MSiren
Lts in line 090º
Submerged jetty
G
R
W
Fl WRG 5s 28m 7-5M
Oc R 5s 43m 18M
ChauvenetUniversity
3.0 kn
4.0 kn
Harbo
r Lim
it
0
VAR 5° 40'W (2016)
ANNUAL CHANGE 2'W
Chys
Cemetery
Point Sumner
C G
269
(12)
CHY (47)
56
999
9
SOUNDINGS IN METERS
999
999
99
USERS SHOULD REFER CORRECTIONS, ADDITIONS, ANDCOMMENTS TO NGA’S MARITIME OPERATIONS DESK: TOLLFREE, 1-800-362-6289; COMMERCIAL, 571-557-5455; DSN 547-5455; SEND EMAIL TO [email protected]; USE CONTACTLINKS FOR DNC AND MARITIME WEBSITES LOCATED AThttp://msi.nga.mil/NGAPortal/MSI.portal; OR WRITE TO OFFICE OFMARITIME SAFETY, NATIONAL GEOSPATIAL-INTELLIGENCEAGENCY, MAIL STOP N65, 7500 GEOINT DRIVE, SPRINGFIELDVA 22150-7500.
WARNINGThe prudent mariner will not rely solely on anysingle aid to navigation, particularly on floating aids.See paragraph No. 1 of Notice to Mariners No. 1 orSailing Directions Planning Guides for informationrelative to NGA Charts.
FATH
OM
San
dfe
et
ME
TER
San
dde
cim
eter
s
FEET
FATH
OM
San
dfe
et
ME
TER
San
dde
cim
eter
s
FEET
9
1
2
7
3
4
5
6
8
10
11
12
17
13
19
20
18
16
14
15
D E P T HC O N V E R S I O N
S C A L E
0
8
10
9
7
6
5
4
3
2
1
1166
60
54
42
36
48
24
30
18
6
12
38
0
4
2
8
14
20
10
16
34
32
26
28
22
40
44
52
46
50
56
58
64
62
LOG
AR
ITH
MIC
SP
EE
D S
CA
LE
T
o fin
d S
PE
ED
, p
lace
on
e p
oin
t of
divi
der
s on
nau
tical
mile
s ru
n a
nd
the
oth
er
on
min
ute
s ru
n.
With
ou
t ch
ang
ing
div
ide
r sp
rea
d, p
lace
righ
t po
int
on
60
an
d le
ft p
oin
t will
the
n in
dic
ate
sp
eed
in k
not
s. E
xam
ple
: w
ith 4
.0 m
iles
run
in 1
5 m
inut
es,
th
e s
pee
d is
16
.0 k
nots
.
36
78
91
24
515
6030
2520
1040
50
1 0 1KILOMETERS NAUTICAL MILES
0.5 0 11st Ed., Aug. 1971
YA
RD
S (
IN T
HO
US
AN
DS
)Y
AR
DS
(IN
TH
OU
SA
ND
S)
1
0
1
YA
RD
S (
IN T
HO
US
AN
DS
)Y
AR
DS
(IN
TH
OU
SA
ND
S)
1
0
1
Prepared and published by theNATIONAL GEOSPATIAL-INTELLIGENCE AGENCY
© Copyright 2018 by the United States GovernmentNo copyright claimed under Title 17 U.S.C.
Port MaurySOUNDINGS IN METERS - SCALE 1:20,000
Neatlines: 19.28 cm N-S x 30.12 cm E-W
!
!
Limit of quarantineanchorage (N12.8)
Sea bottom consists ofcoarse sand (J32, J1)
!Compass rose withmagnetic variation (B70)
Sounding in metersand decimeters (I10)
!
!Wreck over whichdepth is cleared bywire drag (K27)
!Depth curves inmeters (I30)
Unsurveyed wreckover which the exactdepth is unknown butis considered to havea safe clearance todepth shown (K30)
!
!
Sound signal (R15)
!Eddies (H45)
!Wreck showing portionof hull above soundingdatum (K24)
!Swept area adequatelysounded (swept by wiredrag to depth indicated)(I24)
!Dangerous wreck withonly mast visible (K25)
!
Chimney, conspicuous(E22)
SOUNDINGS IN METERS
! Logarithmic SpeedScale usually shownhere (1:40,000 andlarger)
! Heights of land andconspicuous objectsare given in metersabove Mean Sea Level,unless otherwise statedin the title of the chart.
!
Aeronautical light andradio direction findingstation (P60)
! Marsh area (C33)
!
Mooring buoy (Q40)
Submarine cable(L30.1)
!
! Kelp (J13.2)
!
Rock which covers anduncovers with heightabove chart soundingdatum (K11)
! Topographic contours(C10)
! Obstruction over whichdepth is known (K41)
! Dangerous wreck overwhich depth is known(K26)
! Breakers (K17)
High obstruction aboveswept depth (I24)
Soundings on this chart are corrected for sound velocity
(Under 20 in meters and decimeters)reduced to the approximate level of Mean Low Water
SOUNDINGS IN METERS
HEIGHTS IN METERS ABOVE MEAN SEA LEVELContour interval 30 meters
For Symbols and Abbreviations, see Chart No. 1
MERCATOR PROJECTION
WORLD GEODETIC SYSTEM 1984 (WGS-84)
SCALE 1:20,000
IALA Buoyage System, Region B,is in effect in the area covered bythis chart. See Chart No. 1.
BUOYAGE
In compliance with IHO specifications, soundings on thischart that are reliable are represented by sloping oritalicized figures. Soundings from less reliable sources arerepresented by vertical figures.
SOUNDINGS
NOTEThe area delimited by purple dashed lines has been sweptin 1994 to various depths in meters indicated thus: 12?
!Height of island inmeters above meansea level (K10)
NORTH PACIFIC
WILKES ISLAND
PORT MAURYFrom U.S. Navy surveys to 1993
Obstruction overwhich depth isunknown (K40)
!
8th Ed., Sept. 3, 2016 (Correct through NM 36/16)
9999*7642019999999*NSN 7642019999999NGA Ref No. W0XZC9999
!
References to U.S. Chart No. 1 are shown in parentheses.

Qb
Qb?
QbQb
Qb
Qb
Ý
][
][
Z
!X !YO
!YOY
!YO!YO!YO!YO!YO
!YO!YO
!YO!YO!YO
!YO
::::::::::::::::::::::::::::::::::::::::::::
++++ +++++ ++ +++++++++
+++++++++ + + +++++++
+++++++
+++++++++++++++++
+++++++ +++++++ ++++++++++++++++++
Q Q Q Q Q Q Q Q Q Q Q Q Q Q Q Q Q
QQQQQQ
QQQ
Q
QQQQQQQQQQ
Q Q QQ
QQ Q Q Q Q Q
Q
Q
QQQ Q
QQQ
QQQQQ
Q
QQQQ
Q Q Q QQ
Q
Q
Q Q
Q Q
QQQ
QQQ Q
QQQ
Q
QQQQ
Q
Q
QQQQ
QQQQQ
Q
QQ Q Q Q Q
QQQ
Q
Q
QQQ
QQQQ
Q
Q Q Q
Q
6
Ã
ø
ss
.
ø
ø ø
ø ø
ø
d
dd
d
d
d
d
6
66
6
6
6
6 }}
)
@ @@
)
)
@
QQ Q
Q
Q
Q
QQQQQ
6 6 6 6
666
Ñ
@@@
d}
2222
{
X6;
X6
#= X6;
X6;
X6;
U
43°
6''
6''
154
°58
'10
.0"E
42°59'17.0"N
01'
30"
30"
155° 01'6'' 6'' 6'' 6''
59' 02'30" 30" 30" 30" 30"
6''
6''
155
°02
'36
.0"E
43°01'22.0"N
43°
01'
30"
30"
155° 01'6'' 6'' 6'' 6''59' 02'30" 30" 30" 30" 30"
882
(12)
STACK(157)
185
100
800
100
200
300
700
100
300200
600500400
03
02
(3)
25
6
3
15
15
01
0103
05
13
01
11
15
23
25 14
05
11
15
31
33
31
43
41
41
41
41
41
41
4
43
43
45
31
3523
45
45
45
41
41
43
43
4
34
442
15
23
2
2
15
15
15
2
22
3
3
3
3
3
25
25
31
31
31
33
33
33 3
25
25
25
25
23
31
31
31
34
15
1135
35 15
12 01
23
2343
43
42
35
31
44
4
43
51
41
4
41
41
41
43
53
5355
65
73
6
61
44
6
51
51
56
41
44
44
4141
41
41
43
43
3443
43
43
43
51
515
5
543
5152
55
54
6165
73
7373
73
71 71
71
71 75
84
75
75
75
75
75
75
83
95
95
95
94
85
71
74
7484
81
84
9181
8375
71
6
65 65
682
85
4
441
41
35
55
33
23
24
21 0203
23
1
12
91
9283
858595
11
11
1111
11
12
13
02
01
02
02
02
03
03
03
04
03
012121
21
2411
2121
21
23
24
51
52
54
44
41
42
36564
75
62
62
62
61
7573
8511
1194
9392
9592
64
64
64
63
63
63
7361
545455
55
53
51
44
44 44
31
31
54
44
53
62
75
55
31
53
44 44
6161
7573
1321
23 23
21
03
14
54
63
81
53
53 55
55
5332
32
54
63
61
61
64
75 72
61
71
83
7474
75
75
85
84
82 92
91
91
63
63
4532
35
54
3
15
24
42
44
35
64
21
11
25
25
25
1111
11
11
12
12
13
15
21
21
21
24
03 02
05
05
05
0304
0405
42
53
64
65
71 52
42 42
45
33 31
64
25
25
25
63
63
74
41
63
65
71
65
33
31
1324
24
12
33
32
42
45
54
11
1142
24
22
22
33
33
51
45
51
54
54
54
55
25
22
12
24
65
63
64 55
35
33
3
25
24
42
31
23
2225
2434
05
05
04
04
1
1
05
15 14
24
10
10
6
6
3
1
6
3
3
3
6
3
6
1
1
3
3
1
3
6
1
1
4
c Sc S
S
c S c S Sh
c Sc S
c S Sh
GWHIS
S Co
S Co
h S Co
h S Co
S CoS Co
S G
S G
f S Co
R
R
c S
Mast
Obstn
Wk
Wk
Wk
Obstn
TOWER
G Sh
GRIQ
RACON (X)"Maury"Fl (2) W 10s 55ft 21M
Blunt Isle
S
64C
(1994)
3 kn4 kn
Lecky Shoal
Dutton Rocks
Ageton Reef
Rush Pt
Tank
Tk
Tanks
Tanks
Tanks
GFl G 4s
RFl R 4s
25 FEET 1994
Piles
Weir PtTanks
F GF G
AeroRot W&GRDF
FlindersShipyard Goldsborough
Park
Luce Hall
Weems Airport
LT O
BSC
Mount Bowditch
M A U R Y
GillisStation
Being
filled
Oc G 6s 46ft 12MRACON
Oc R 6s 46ft 12MSIREN
Lights in line 090º
Subm jetty
G
R
W
Fl WRG 5s 91ft 5M
Oc R 5s 140ft 18M
ChauvenetUniversity
3 kn
4 kn
VA
R5° 40'W (2016)
Chys
Cem
Chy
CG
QUARANTINE ANCHORAGE
WBn
FS
Pt Sumner
Marsh
AN
N
U AL DE C REA SE
2'
Breakers
Eddies
Kelp
Kelp
Kelp
Kelp
999
999
99
Formerly C&GS 4196, 1st Ed., Aug. 1971
192.8 x 301.2 mm
Sounding in fathomsand feet (I10)
!
!Wreck over whichdepth is cleared bywire drag (K27)
!Depth curves infathoms (I30)
!
! Heights of land andconspicuous objectsare given in feet aboveMean High Water,unless otherwise statedin the title of the chart.
!
!
!
For Symbols and Abbreviations, see Chart No. 1
!Height of island infeet above mean sealevel (K10)
Mercator ProjectionScale 1:20,000 at Lat. 43°
North American Datum of 1983(World Geodetic System 1984)
NORTH PACIFIC OCEAN
WILKES ISLAND
PORT MAURY
Additional information can be obtained at nauticalcharts.noaa.gov
SOUNDINGS IN FATHOMS(FATHOMS AND FEET TO ELEVEN FATHOMS)
AT MEAN LOWER LOW WATER
HEIGHTSHeights in feet above Mean High Water.
COAST SURVEY
Hydrography and topography by the NationalOcean Service, Coast Survey, with additionaldata from the Corps of Engineers, GeologicalSurvey, U.S. Coast Guard, and NationalGeospatial-Intelligence Agency.
AUTHORITIES
The horizontal reference datum of this chart isNorth American Datum of 1983 (NAD 83), which forcharting purposes is considered equivalent to theWorld Geodetic System of 1984 (WGS 84).Geographic positions referred to the North AmericanDatum of 1927 must be corrected an average of3.600" northward and 10.200" westward to agreewith this chart.
HORIZONTAL DATUM
WIRE-DRAGGED AREAS The areas within the dashed green lines havebeen swept clear to at least the depths indicated infathoms and feet by the green numbers.
¼ 0 ¼
Statute Miles¼ ¼0
Nautical Miles
250 0 250 500
Yards
250 0 250 500
Meters
Published at Washington, D.C.
U.S. DEPARTMENT OF COMMERCE NATIONAL OCEANIC AND ATMOSPHERIC ADMINISTRATION
NATIONAL OCEAN SERVICECOAST SURVEY
8th Ed., Sep. 2016
9999
NG
A R
ef
No
.
*7642019999999*
NS
N 7
642
01
999
99
99W
0X
ZC
99
99
SOUNDINGS IN FATHOMS(FATHOMS & FEET TO 11 FATHOMS)
9999
Last Correction: 9/3/2016. Cleared through:LNM: , NM: 3616 (9/3/2016)
CAUTION
This chart has been corrected from the Notice to Mariners (NM) published weeklyby the National Geospatial-Intelligence Agency and the Local Notice to Mariners (LNM)issued periodically by each U.S. Coast Guard district to the dates shown in the lowerleft hand corner. Chart updates corrected from Notice to Mariners published after thedates shown in the lower left hand corner are available at nauticalcharts.noaa.gov.
NOAA encourages users to submit inquiries discrepancies or comments about thischart at http://www.nauticalcharts.noaa.gov/staff/contact.htm.
FAT H O M S1 2 3 4 5 6 7 8 9 10 1711 12 13 14 15 16
6 12 18 24 30 36 42 48 54 60 10266 72 78 84 90 96
1 2 3 4 5 6 7 8 9 10 3111 12 13 14 15 16 17 18 19 20 21 22 23 24 25 26 27 28 29 30
FE E T
M E T ER S
WARNING
The prudent mariner will not rely solely onany single aid to navigation, particularly onfloating aids. See U.S. Coast Guard LightList and U.S. Coast Pilot for details.
Port MaurySOUNDINGS IN FATHOMS - SCALE 1:20,000
!
!
Limit of quarantineanchorage (N12.8)
Sea bottom consists ofcoarse sand (J32, J1)
!Compass rose withmagnetic variation (B70)
!Dangerous wreck withonly mast visible (K25)
Unsurveyed wreckover which the exactdepth is unknown butis considered to havea safe clearance todepth shown (K30)
!
Sound signal (R15)
Obstruction overwhich depth isunknown (K40)
!
!Eddies (H45)
!Wreck showing portionof hull above soundingdatum (K24)
!Swept area adequatelysounded (swept by wiredrag to depth indicated)(I24)
High obstruction aboveswept depth (K1)
!
!
Chimney, conspicuous(E22)
Aeronautical light andradio direction findingstation (P60)
Marsh area (C33)
Mooring buoy (Q40)
Submarine cable(L30.1)
!
! Kelp (J13.2)
!
Rock which covers anduncovers with heightabove chart soundingdatum (K11)
! Topographic contours(C10)
! Obstruction over whichdepth is known (K41)
! Dangerous wreck overwhich depth is known(K26)
! Breakers (K17)
References to U.S. Chart No. 1 are shown in parentheses.