Embed Size (px)
Citation preview
4-1
Chapter 4 Outline: Designing Distribution
Networks and Applications to e-Business
The Role of Distribution in the Supply Chain
Factors Influencing Distribution Network Design
Design Options for a Distribution Network
E-Business and the Distribution Network
4-2
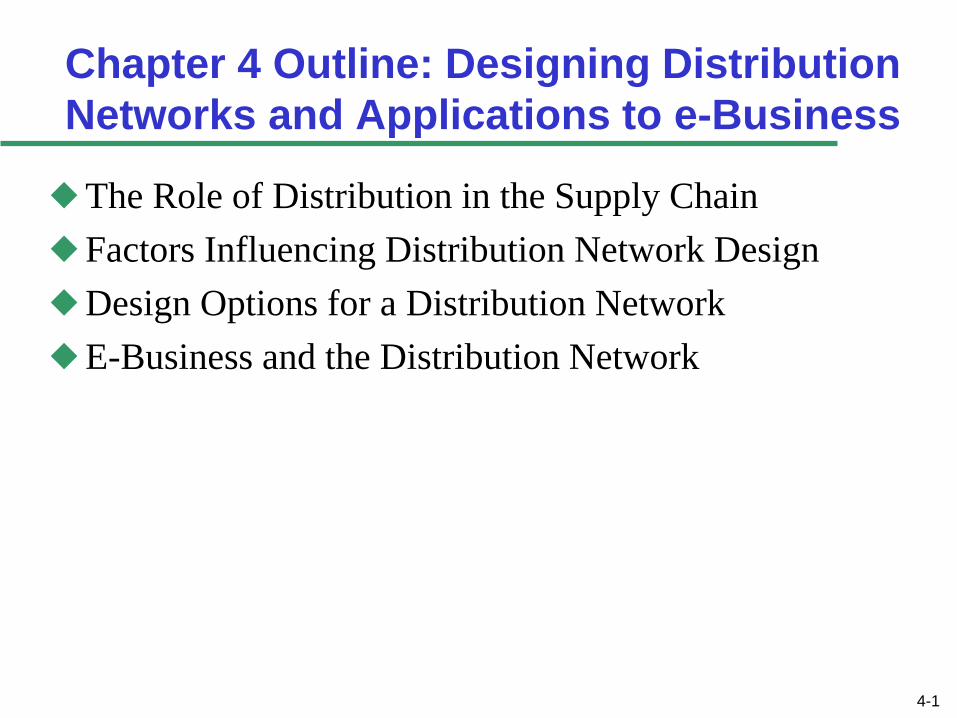
The Role of Distribution
in the Supply Chain
Distribution: the steps taken to move and store a product from
the supplier stage to the customer stage in a supply chain
– Distribution directly affects cost and the customer experience and
therefore drives profitability
Factors Influencing Distribution Network Design: As choice of
distribution network can achieve supply chain objectives from
low cost to high responsiveness:
– Distribution network performance evaluated along two dimensions at the
highest level (and when sustainability is explicitly considered, three):
» Customer needs that are met
» Cost of meeting customer needs
» Affect on sustainability
– Distribution network design options must therefore be compared
according to their impact on customer service and the cost to provide this
level of service as well as any significant sustainability impacts
4-3
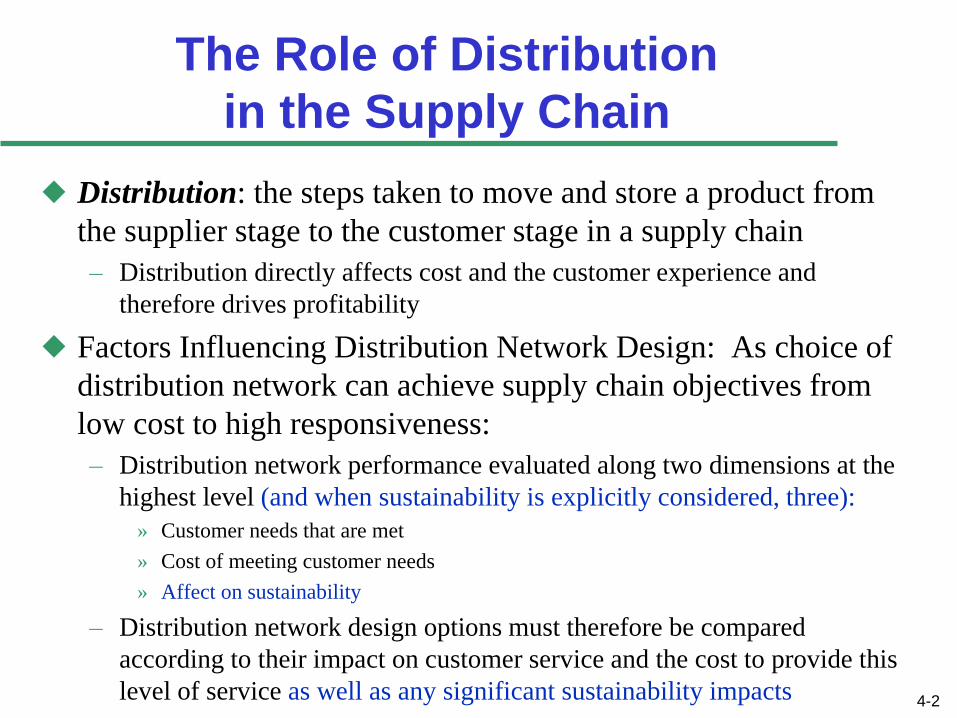
Distribution Networks in Practice
DC = Distribution Center (effectively synonymous w/ Wholesaler)
– DCs can be operated by a manufacturer, retailer or completely separate player
– Types of DCs 1. Break-bulk
2. Transport optimizers, especially Cross-Dock
3. Fast response -aggregate inventory (risk-pooling) yet still quick delivery to customer, e.g. MRO
Product, price, commoditization, and criticality (item’s importance) have an impact on the type of distribution system
The choice of a distribution network has very long-term consequences
– Consider whether an exclusive distribution strategy is advantageous
– The ownership structure of the distribution network can have as big as an impact as the type of distribution network (ex. Naya water/CCE distribution)
4-4
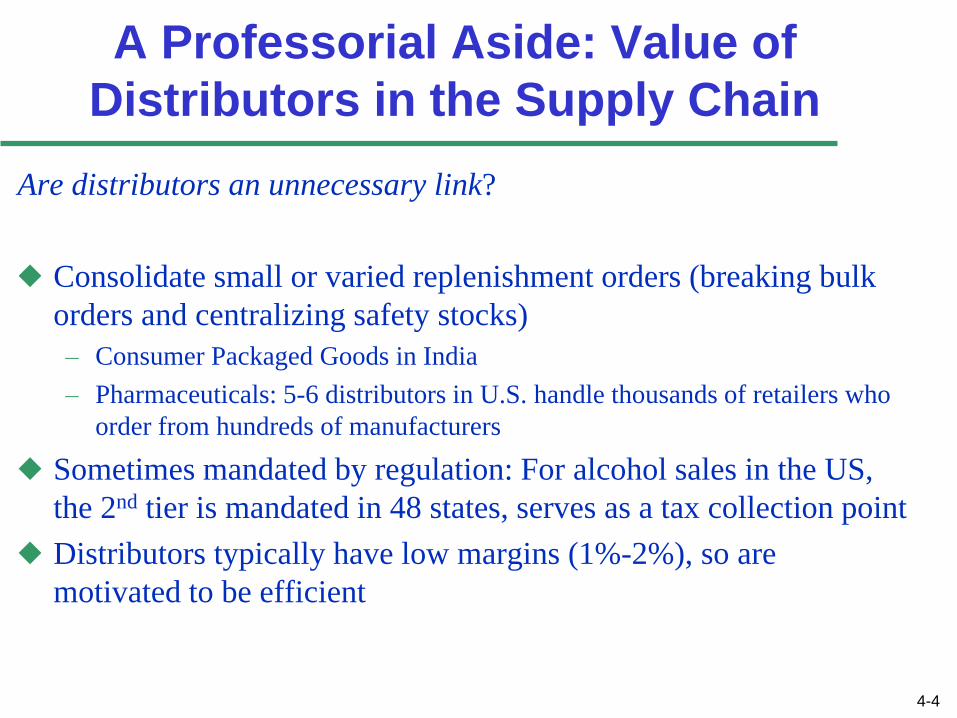
A Professorial Aside: Value of
Distributors in the Supply Chain
Are distributors an unnecessary link?
Consolidate small or varied replenishment orders (breaking bulk
orders and centralizing safety stocks)
– Consumer Packaged Goods in India
– Pharmaceuticals: 5-6 distributors in U.S. handle thousands of retailers who
order from hundreds of manufacturers
Sometimes mandated by regulation: For alcohol sales in the US,
the 2nd tier is mandated in 48 states, serves as a tax collection point
Distributors typically have low margins (1%-2%), so are
motivated to be efficient
4-5
Factors Influencing
Distribution Network Design
Elements of customer service (responsiveness) that are
influenced by network structure:
– Response time
– Product variety & availability
– Customer experience
– Order visibility
– Returnability (for both customer service and sustainability reasons)
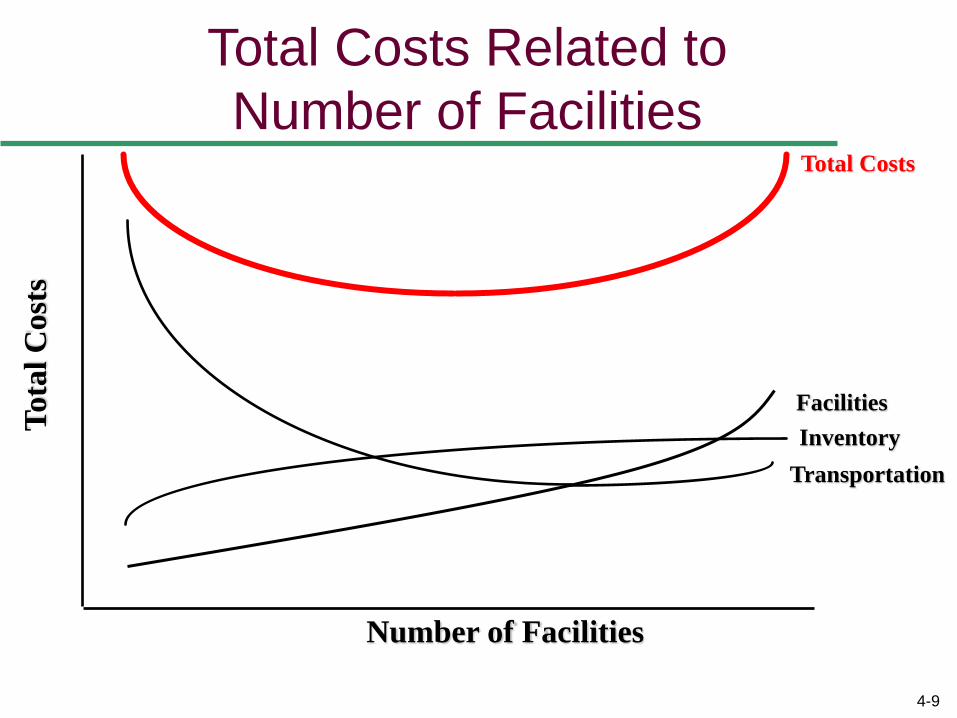
Supply chain costs affected by network structure (4 of 6 drivers
from Chapter 3):
– Facilities and handling (At the moment, focus is on warehousing facilities )
– Inventories
– Transportation
– Information
» Let’s graph the interactions of these with costs
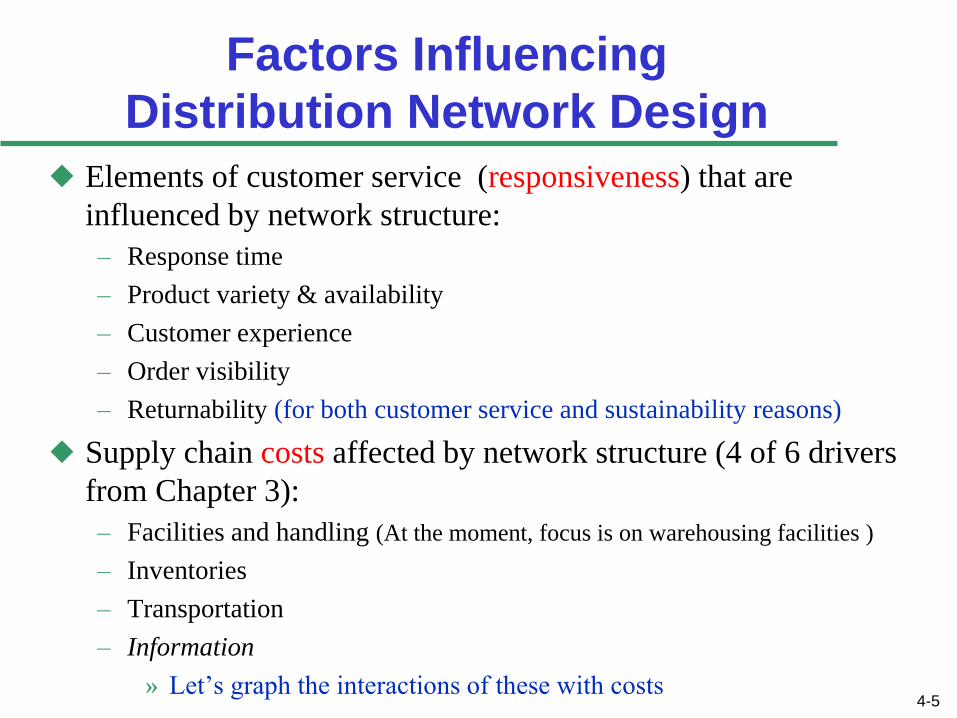
4-6
Facility Costs and Number
of Facilities
Facility
Costs
Number of facilities
4-7
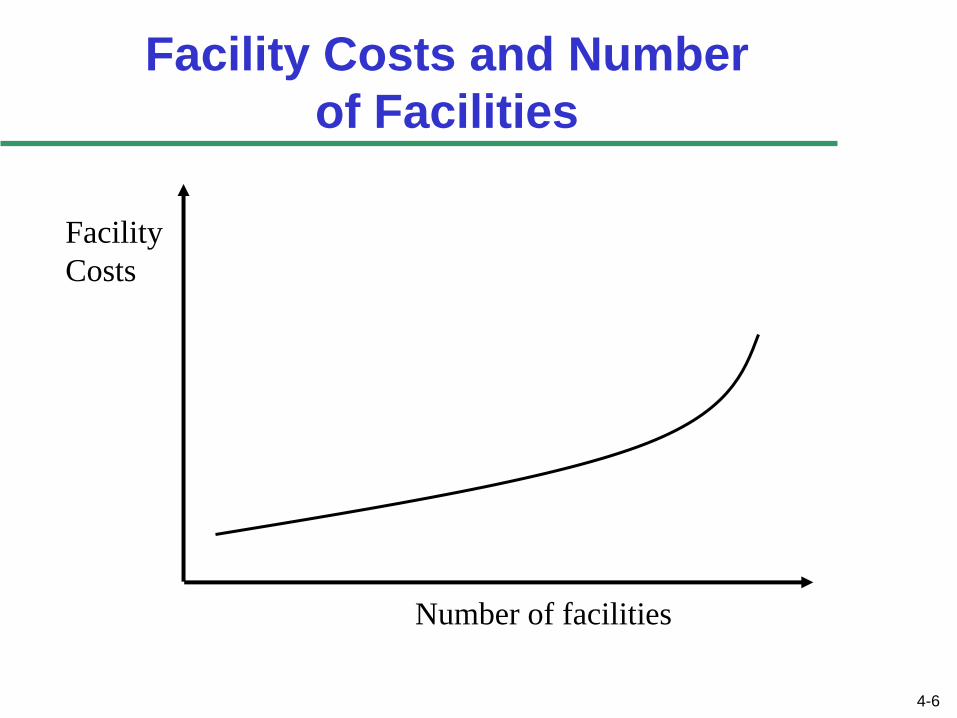
Transportation Costs and
Number of Facilities
Transportation
Costs
Number of facilities
4-8
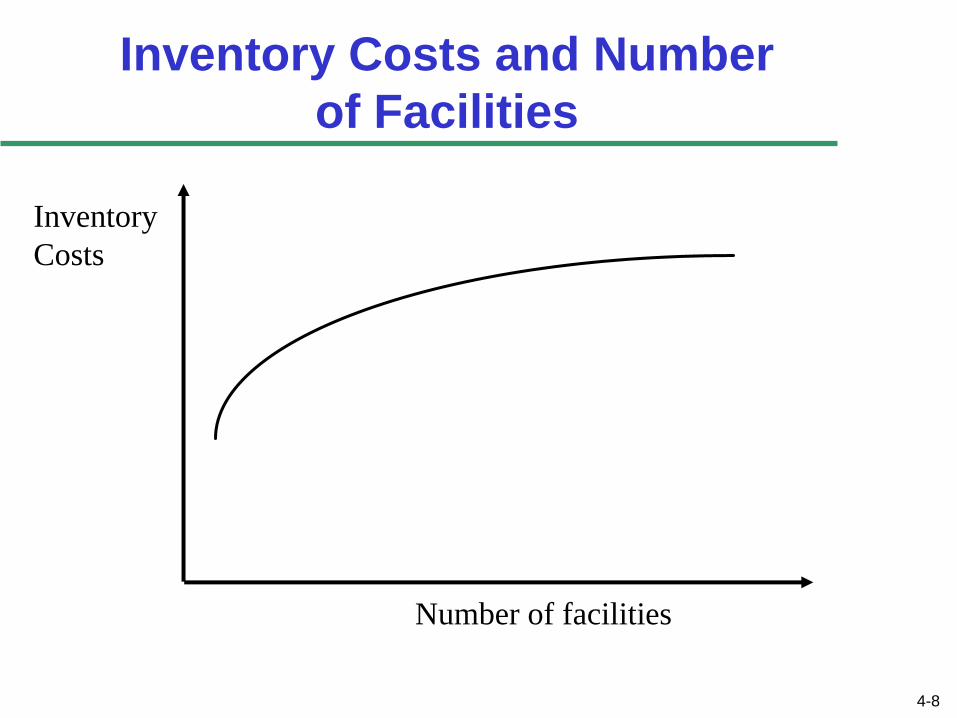
Inventory Costs and Number
of Facilities
Inventory
Costs
Number of facilities
4-9
Transportation
Total Costs Related to
Number of Facilities
Tota
l C
ost
s
Number of Facilities
Inventory
Facilities
Total Costs
4-10
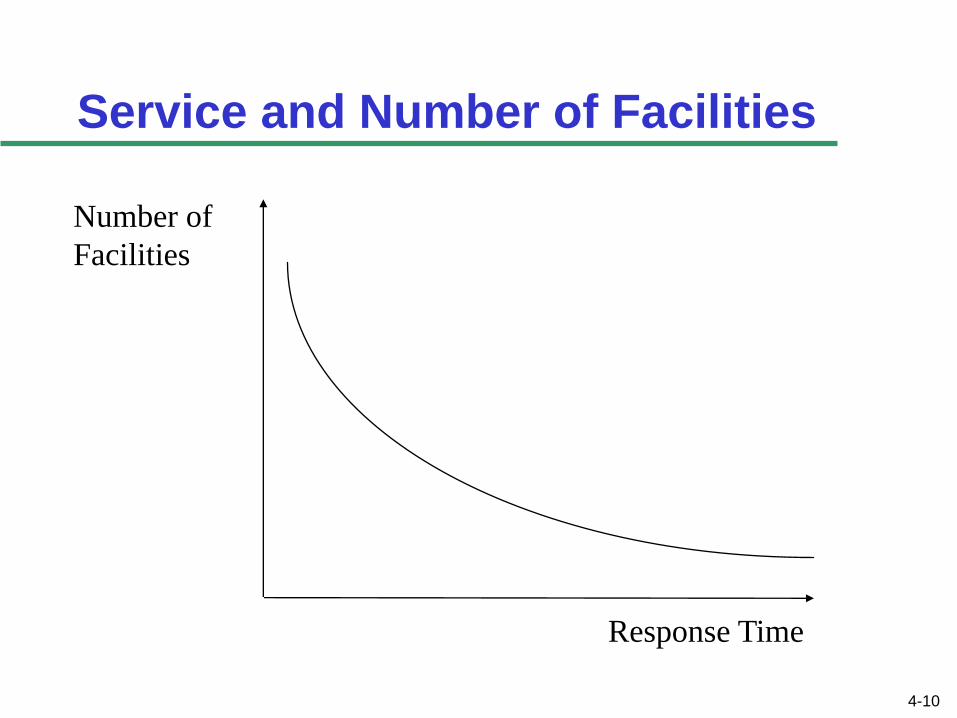
Service and Number of Facilities
Number of
Facilities
Response Time
4-11
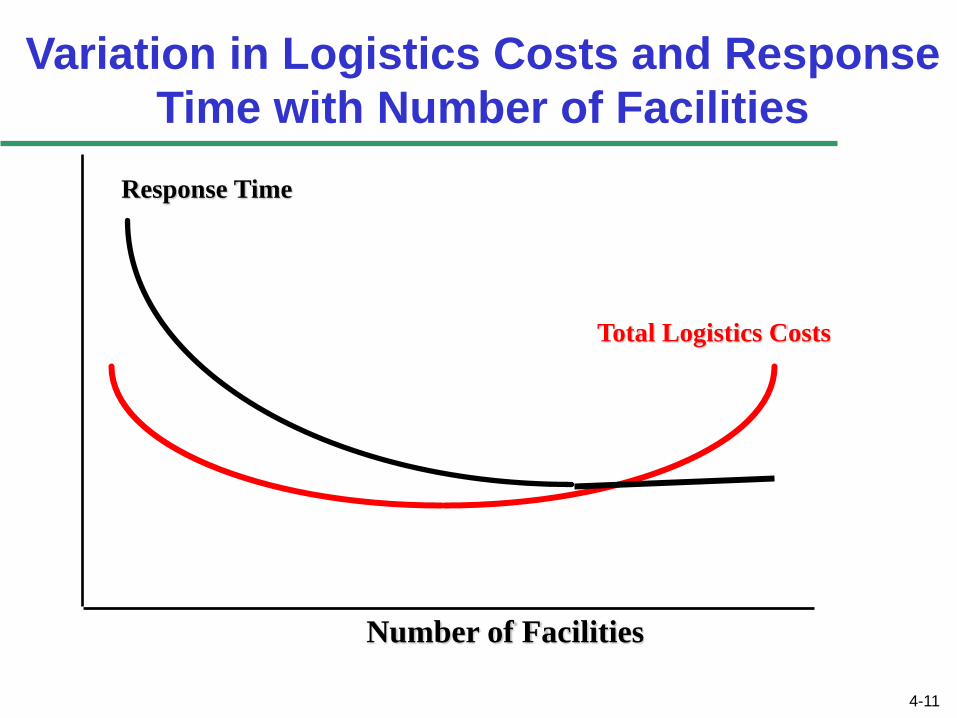
Response Time
Variation in Logistics Costs and Response
Time with Number of Facilities
Number of Facilities
Total Logistics Costs
4-12
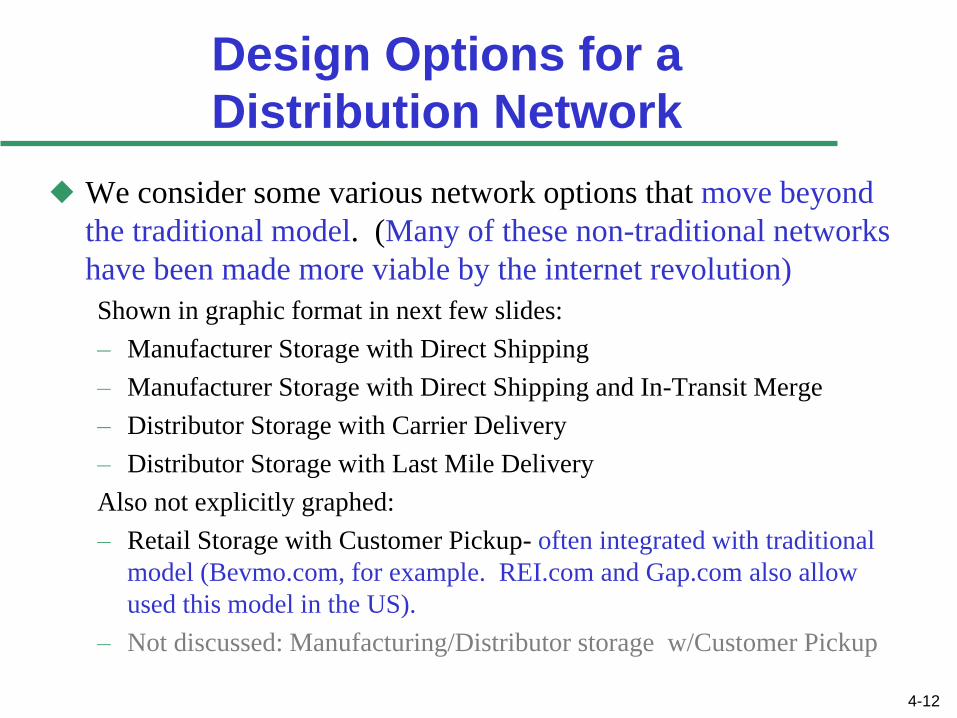
Design Options for a
Distribution Network
We consider some various network options that move beyond
the traditional model. (Many of these non-traditional networks
have been made more viable by the internet revolution)
Shown in graphic format in next few slides:
– Manufacturer Storage with Direct Shipping
– Manufacturer Storage with Direct Shipping and In-Transit Merge
– Distributor Storage with Carrier Delivery
– Distributor Storage with Last Mile Delivery
Also not explicitly graphed:
– Retail Storage with Customer Pickup- often integrated with traditional
model (Bevmo.com, for example. REI.com and Gap.com also allow
used this model in the US).
– Not discussed: Manufacturing/Distributor storage w/Customer Pickup
4-13
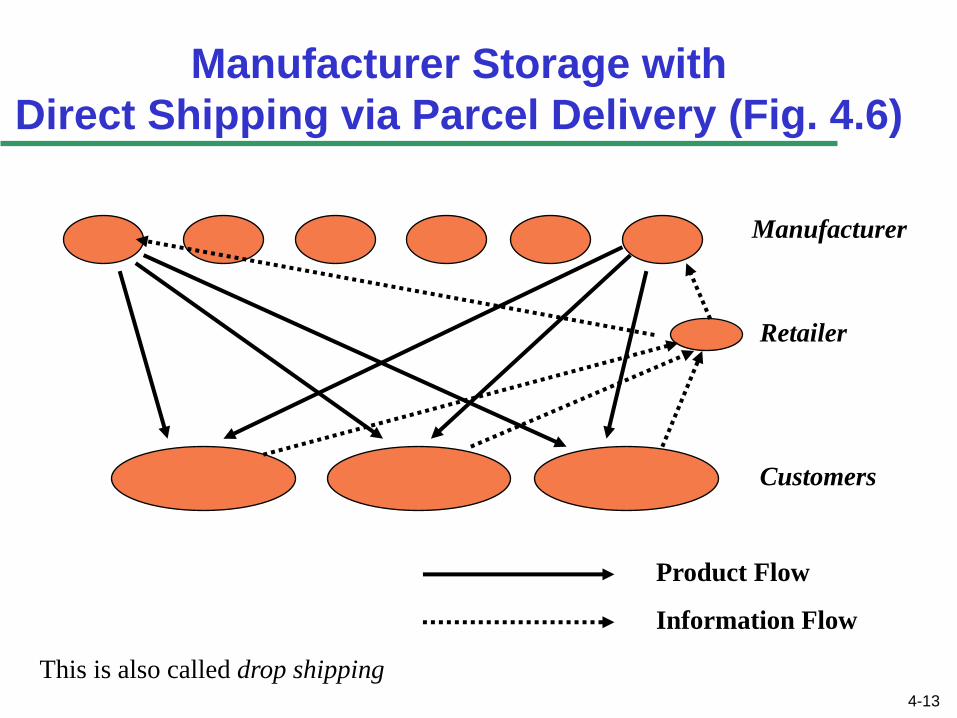
Manufacturer Storage with
Direct Shipping via Parcel Delivery (Fig. 4.6)
Manufacturer
Retailer
Customers
Product Flow
Information Flow
This is also called drop shipping
4-14
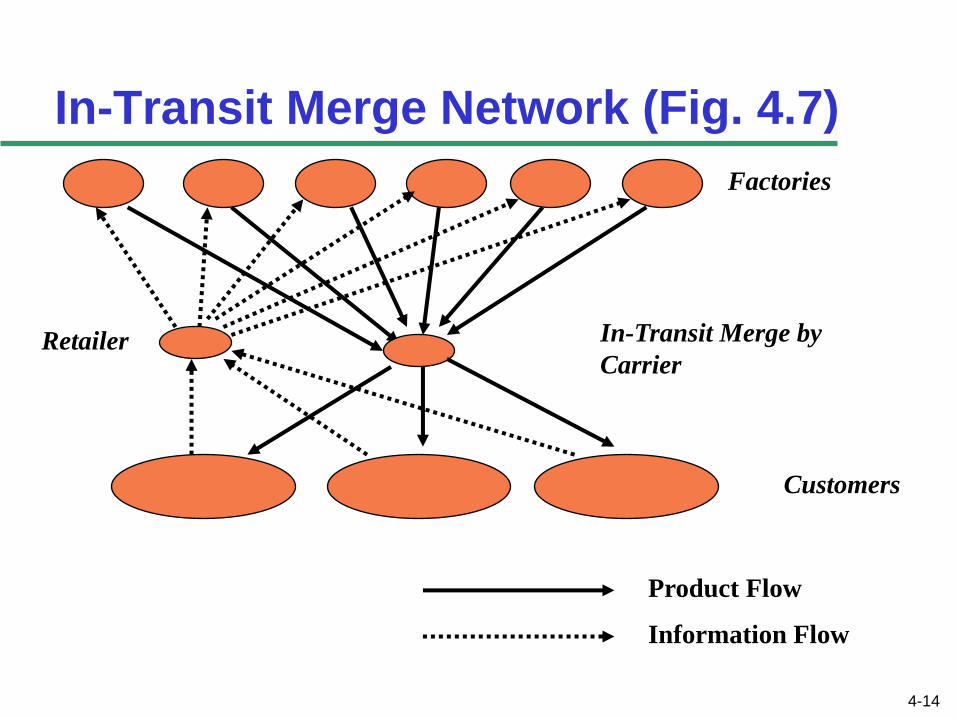
In-Transit Merge Network (Fig. 4.7)
Factories
Retailer
Product Flow
Information Flow
In-Transit Merge by
Carrier
Customers
4-15
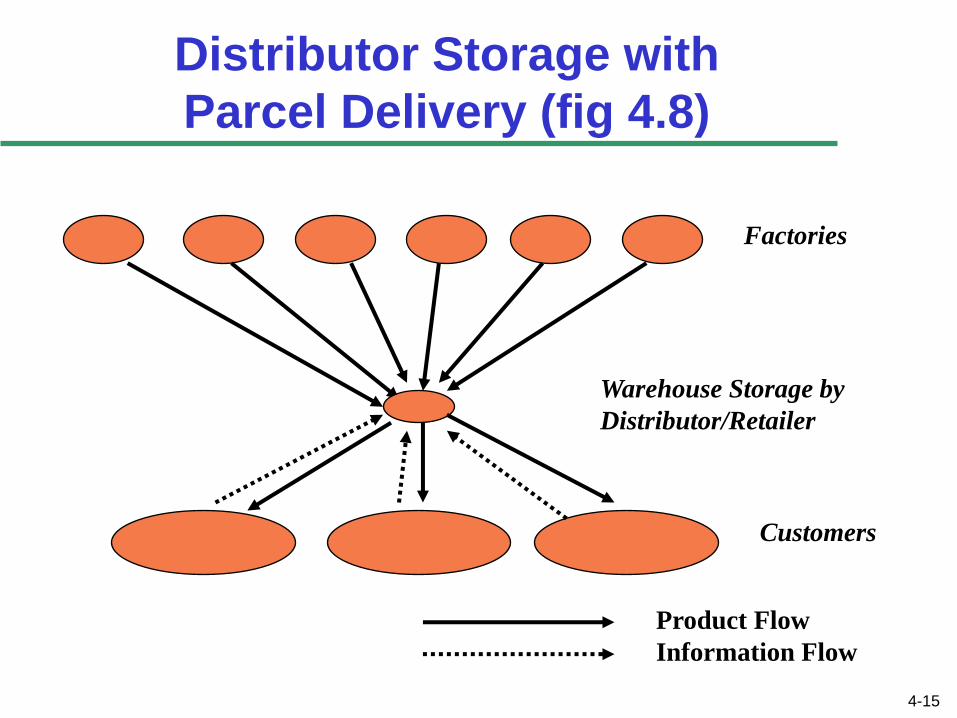
Distributor Storage with
Parcel Delivery (fig 4.8)
Factories
Customers
Product Flow
Information Flow
Warehouse Storage by
Distributor/Retailer
4-16
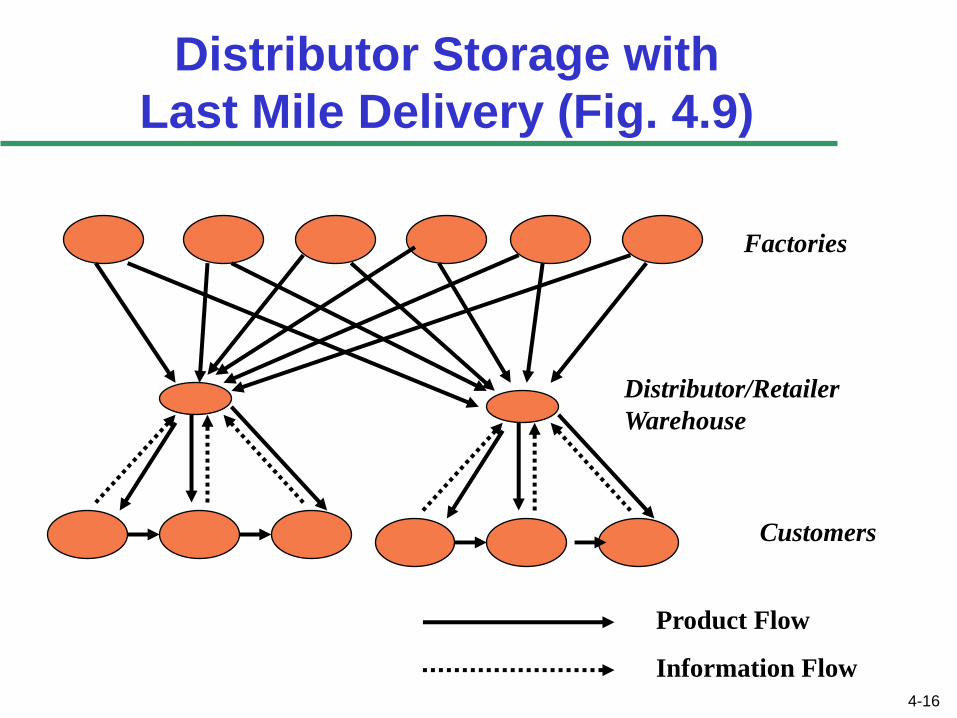
Distributor Storage with
Last Mile Delivery (Fig. 4.9)
Factories
Customers
Product Flow
Information Flow
Distributor/Retailer
Warehouse
4-17
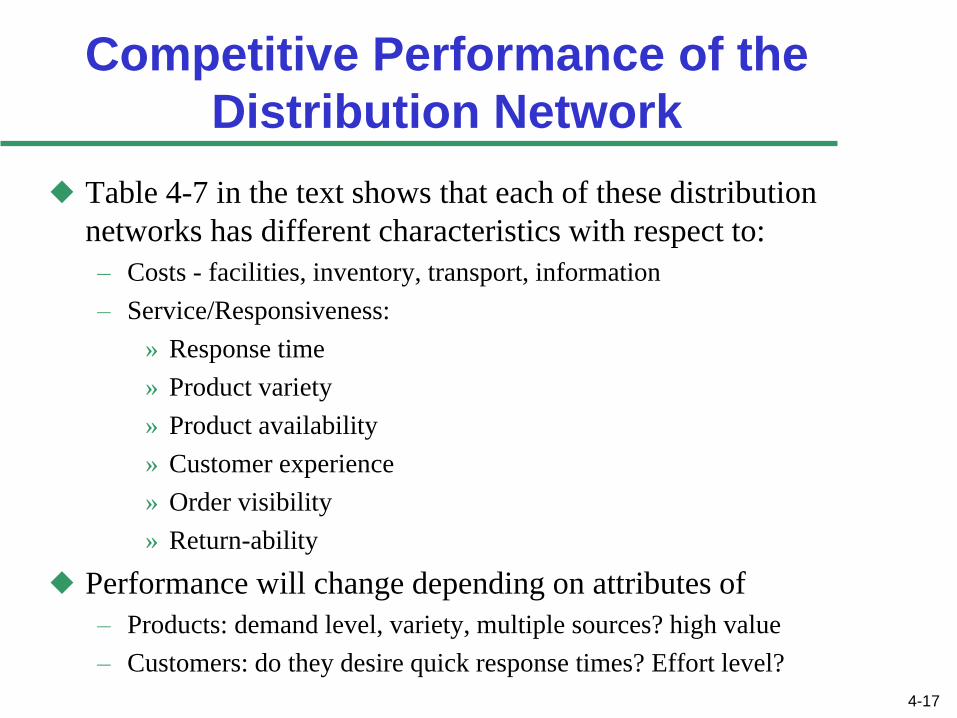
Competitive Performance of the
Distribution Network
Table 4-7 in the text shows that each of these distribution
networks has different characteristics with respect to:
– Costs - facilities, inventory, transport, information
– Service/Responsiveness:
» Response time
» Product variety
» Product availability
» Customer experience
» Order visibility
» Return-ability
Performance will change depending on attributes of
– Products: demand level, variety, multiple sources? high value
– Customers: do they desire quick response times? Effort level?
4-18
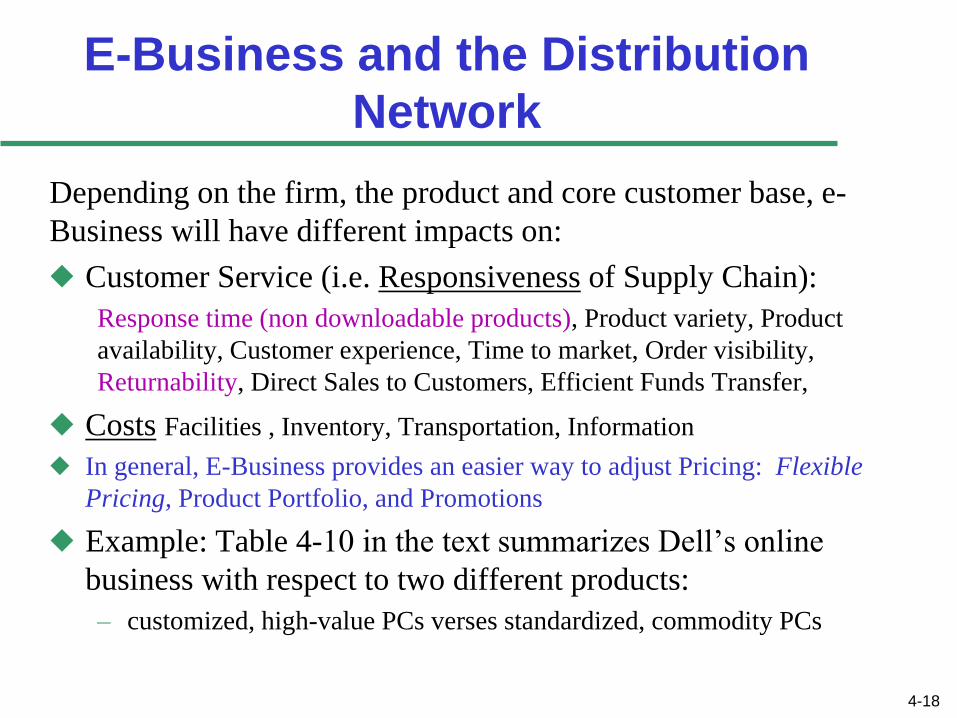
E-Business and the Distribution
Network
Depending on the firm, the product and core customer base, e-
Business will have different impacts on:
Customer Service (i.e. Responsiveness of Supply Chain):
Response time (non downloadable products), Product variety, Product
availability, Customer experience, Time to market, Order visibility,
Returnability, Direct Sales to Customers, Efficient Funds Transfer,
Costs Facilities , Inventory, Transportation, Information
In general, E-Business provides an easier way to adjust Pricing: Flexible
Pricing, Product Portfolio, and Promotions
Example: Table 4-10 in the text summarizes Dell’s online
business with respect to two different products:
– customized, high-value PCs verses standardized, commodity PCs
Chapter 5 Outline: Network
Design in the Supply Chain
The Role of Network Design in the Supply Chain
Factors Influencing Network Design Decisions
Framework for Network Design Decisions
Models for Facility Location and Capacity
Allocation
5-19
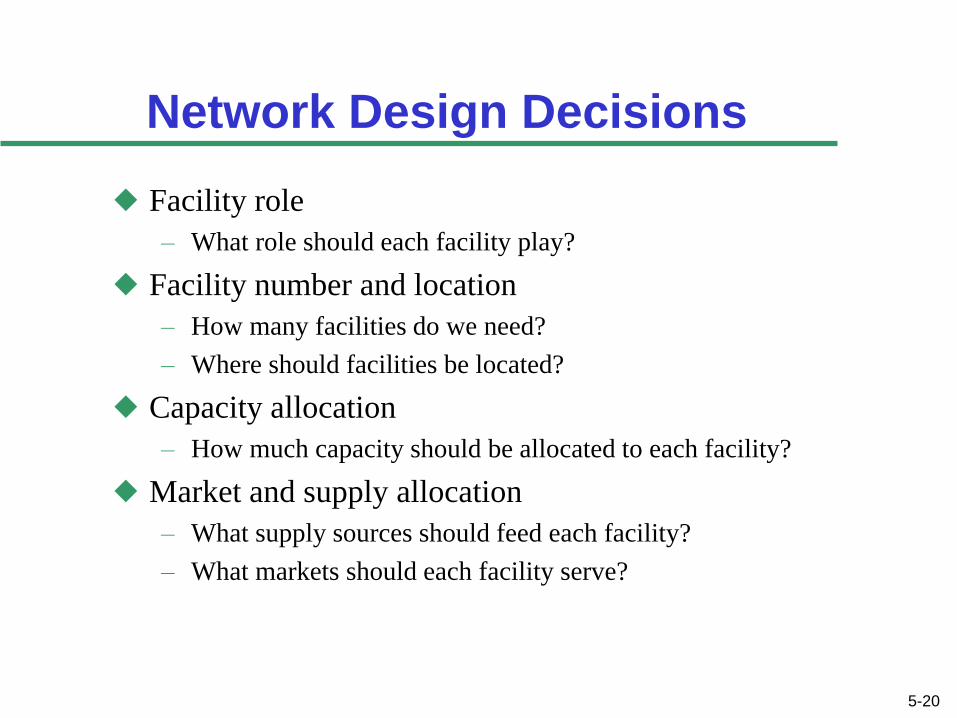
Network Design Decisions
Facility role
– What role should each facility play?
Facility number and location
– How many facilities do we need?
– Where should facilities be located?
Capacity allocation
– How much capacity should be allocated to each facility?
Market and supply allocation
– What supply sources should feed each facility?
– What markets should each facility serve?
5-20
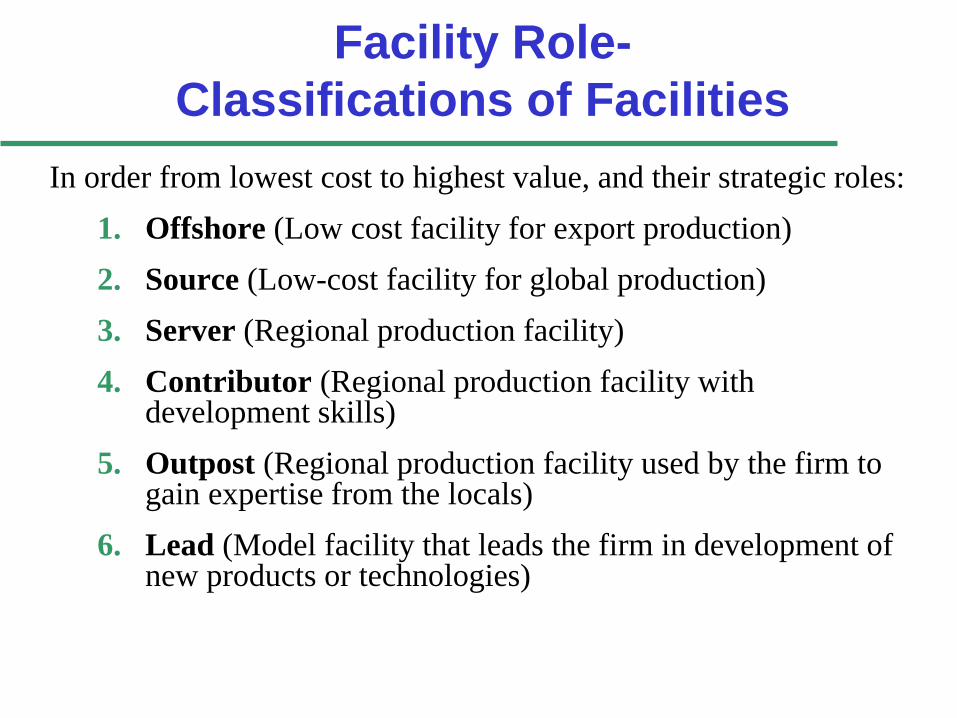
Facility Role-
Classifications of Facilities
In order from lowest cost to highest value, and their strategic roles:
1. Offshore (Low cost facility for export production)
2. Source (Low-cost facility for global production)
3. Server (Regional production facility)
4. Contributor (Regional production facility with development skills)
5. Outpost (Regional production facility used by the firm to gain expertise from the locals)
6. Lead (Model facility that leads the firm in development of new products or technologies)
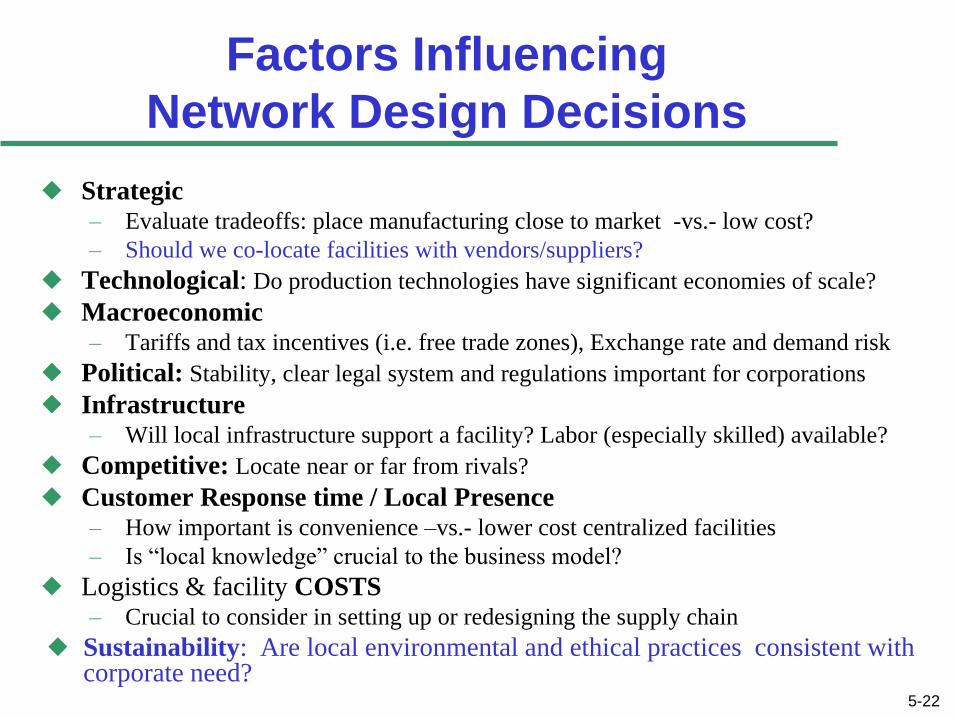
Factors Influencing
Network Design Decisions
Strategic – Evaluate tradeoffs: place manufacturing close to market -vs.- low cost?
– Should we co-locate facilities with vendors/suppliers?
Technological: Do production technologies have significant economies of scale?
Macroeconomic – Tariffs and tax incentives (i.e. free trade zones), Exchange rate and demand risk
Political: Stability, clear legal system and regulations important for corporations
Infrastructure – Will local infrastructure support a facility? Labor (especially skilled) available?
Competitive: Locate near or far from rivals?
Customer Response time / Local Presence – How important is convenience –vs.- lower cost centralized facilities
– Is “local knowledge” crucial to the business model?
Logistics & facility COSTS – Crucial to consider in setting up or redesigning the supply chain
Sustainability: Are local environmental and ethical practices consistent with corporate need?
5-22
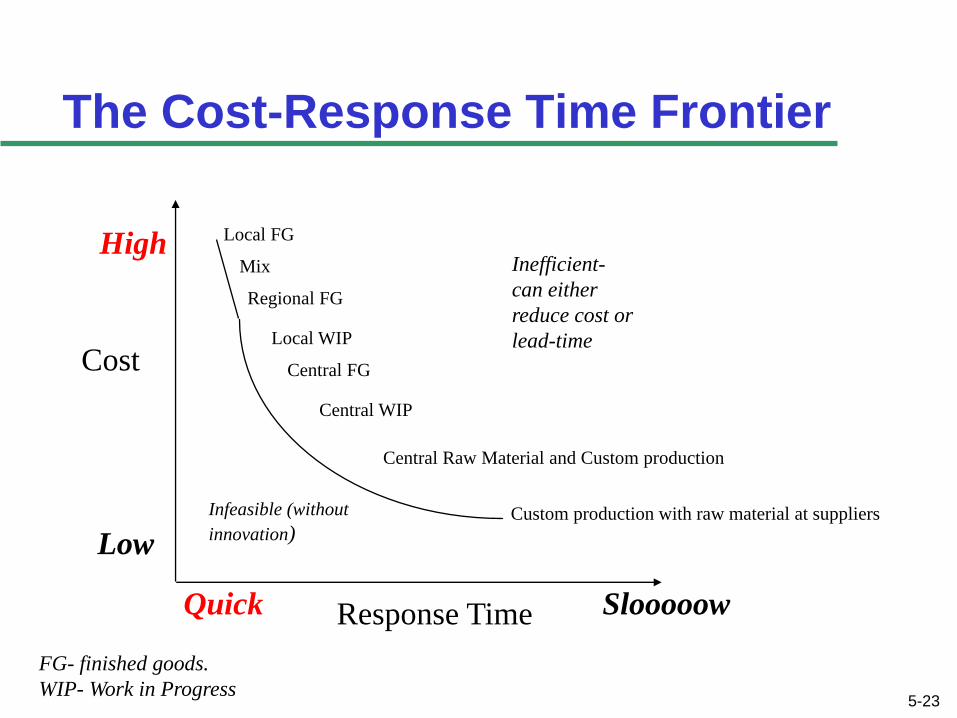
The Cost-Response Time Frontier
Local FG
Mix
Regional FG
Local WIP
Central FG
Central WIP
Central Raw Material and Custom production
Custom production with raw material at suppliers
Cost
Response Time Slooooow Quick
Low
High
5-23
Infeasible (without
innovation)
Inefficient-
can either
reduce cost or
lead-time
FG- finished goods.
WIP- Work in Progress
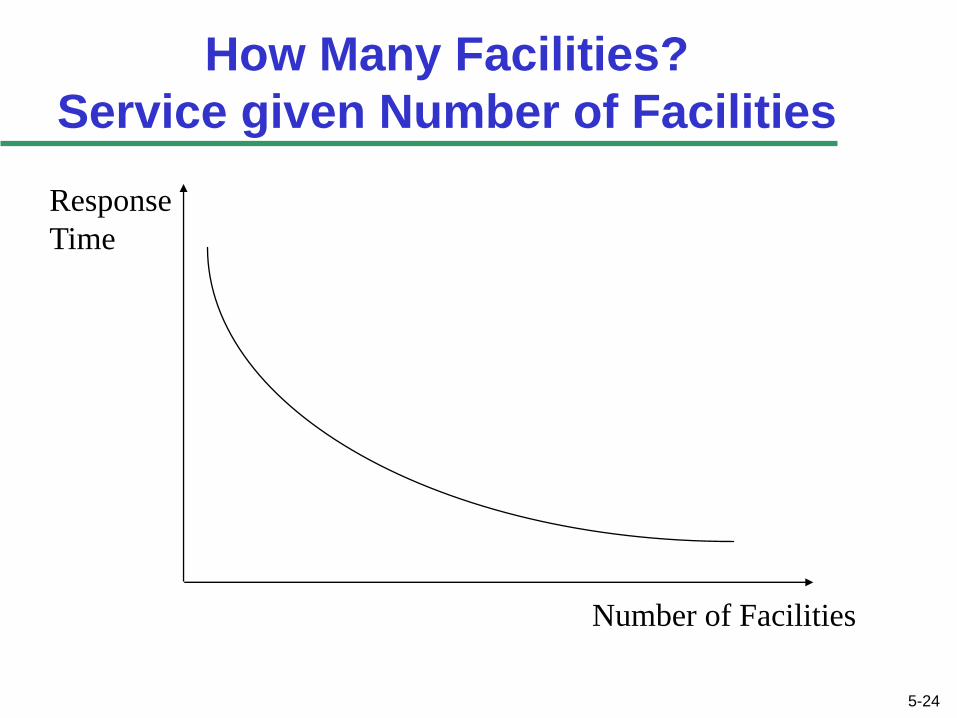
How Many Facilities?
Service given Number of Facilities
Number of Facilities
Response
Time
5-24
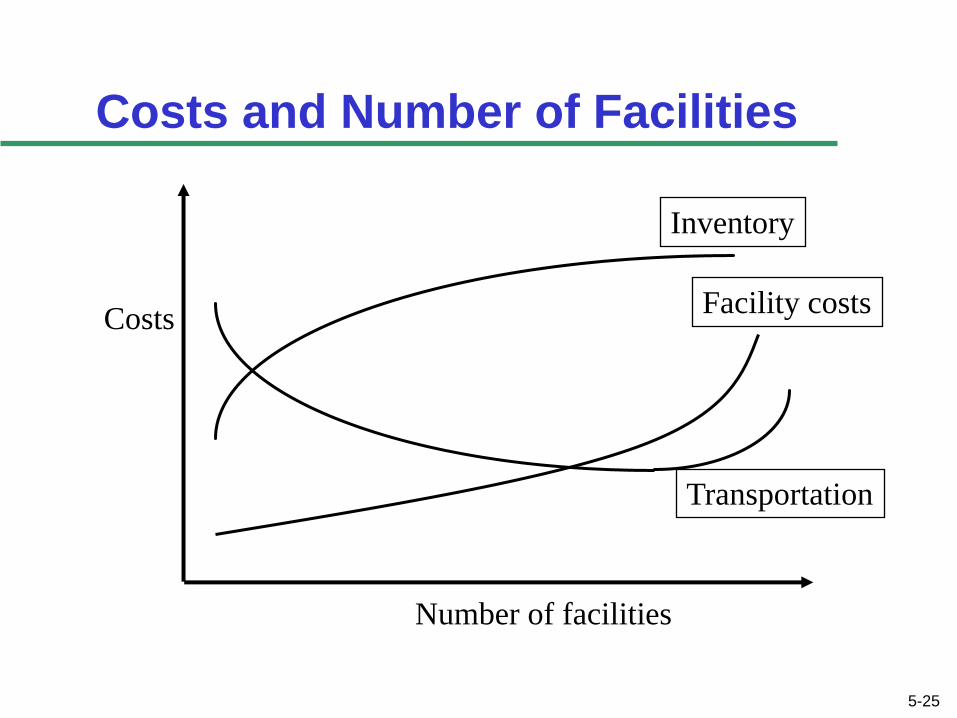
Costs and Number of Facilities
Costs
Number of facilities
Inventory
Transportation
Facility costs
5-25
Percent Service
Level Within
Promised Time
Transportation
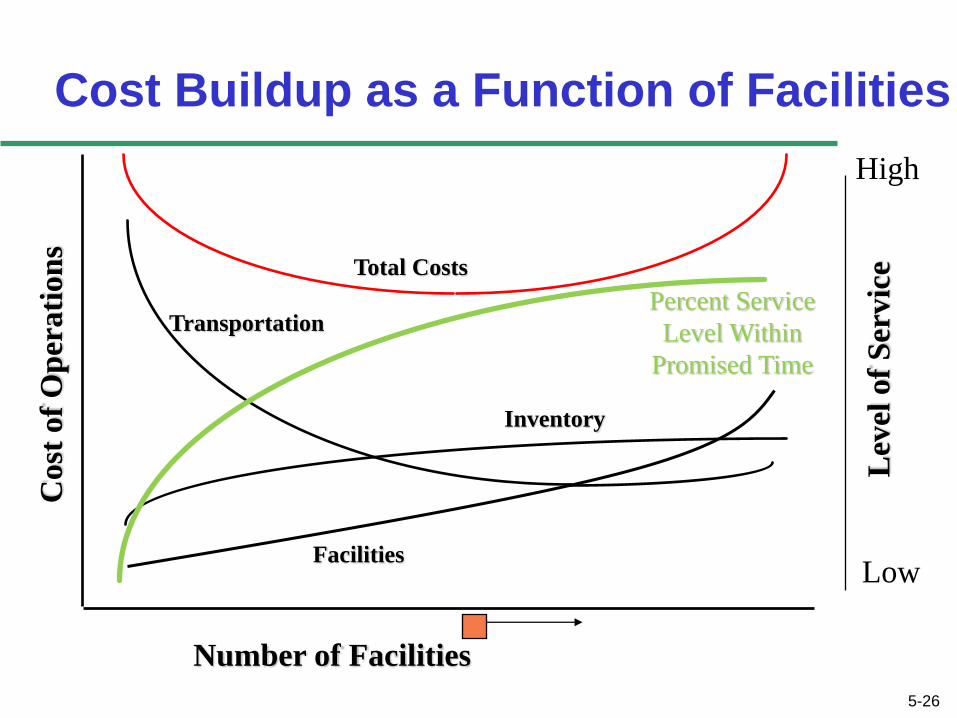
Cost Buildup as a Function of Facilities
Lev
el o
f S
ervic
e
Number of Facilities
Inventory
Facilities
Total Costs
5-26
Cost
of
Op
erati
on
s
Low
High
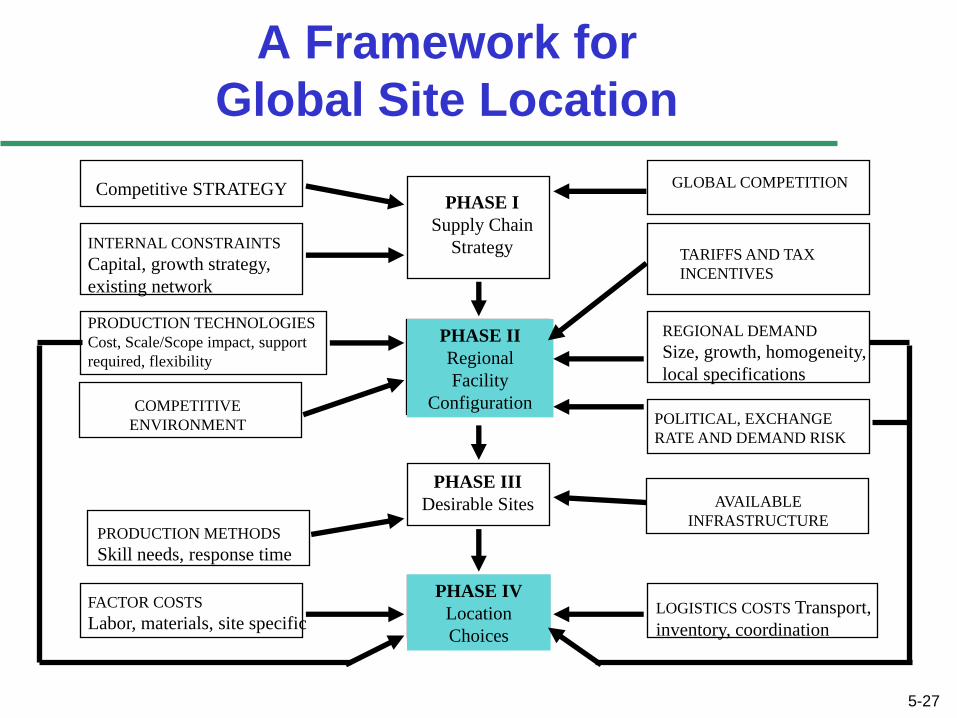
A Framework for
Global Site Location
PHASE I
Supply Chain
Strategy
PHASE II
Regional
Facility
Configuration
PHASE III
Desirable Sites
PHASE IV
Location
Choices
Competitive STRATEGY
INTERNAL CONSTRAINTS
Capital, growth strategy,
existing network
PRODUCTION TECHNOLOGIES
Cost, Scale/Scope impact, support
required, flexibility
COMPETITIVE
ENVIRONMENT
PRODUCTION METHODS
Skill needs, response time
FACTOR COSTS
Labor, materials, site specific
GLOBAL COMPETITION
TARIFFS AND TAX
INCENTIVES
REGIONAL DEMAND
Size, growth, homogeneity,
local specifications
POLITICAL, EXCHANGE
RATE AND DEMAND RISK
AVAILABLE
INFRASTRUCTURE
LOGISTICS COSTS Transport,
inventory, coordination
5-27
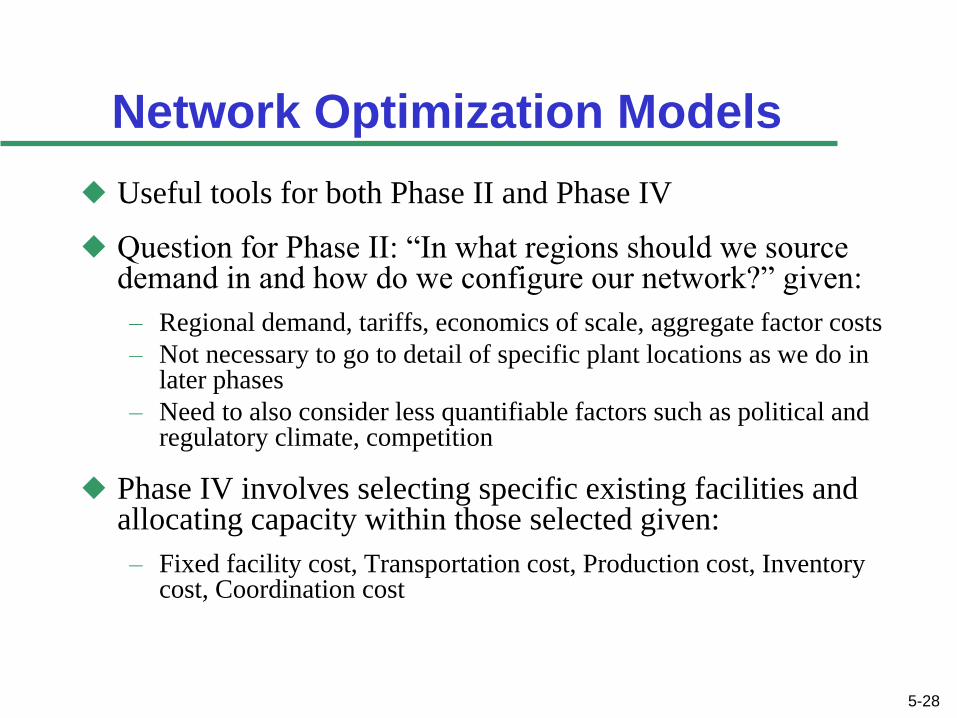
Network Optimization Models
Useful tools for both Phase II and Phase IV
Question for Phase II: “In what regions should we source demand in and how do we configure our network?” given:
– Regional demand, tariffs, economics of scale, aggregate factor costs
– Not necessary to go to detail of specific plant locations as we do in later phases
– Need to also consider less quantifiable factors such as political and regulatory climate, competition
Phase IV involves selecting specific existing facilities and allocating capacity within those selected given:
– Fixed facility cost, Transportation cost, Production cost, Inventory cost, Coordination cost
5-28
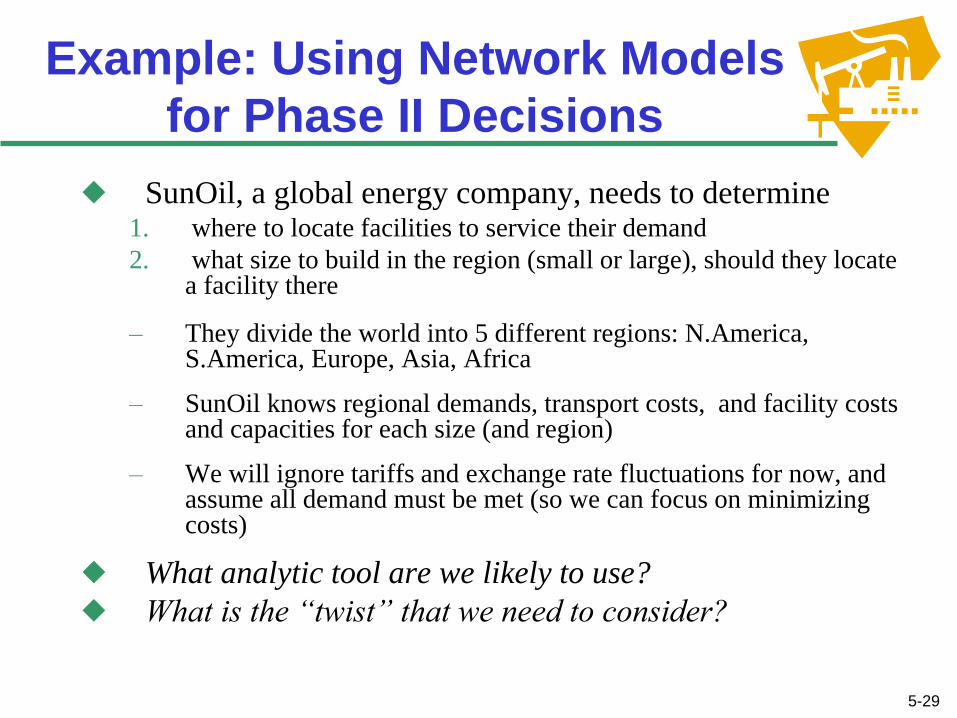
Example: Using Network Models
for Phase II Decisions
SunOil, a global energy company, needs to determine 1. where to locate facilities to service their demand
2. what size to build in the region (small or large), should they locate a facility there
– They divide the world into 5 different regions: N.America, S.America, Europe, Asia, Africa
– SunOil knows regional demands, transport costs, and facility costs and capacities for each size (and region)
– We will ignore tariffs and exchange rate fluctuations for now, and assume all demand must be met (so we can focus on minimizing costs)
What analytic tool are we likely to use?
What is the “twist” that we need to consider?
5-29
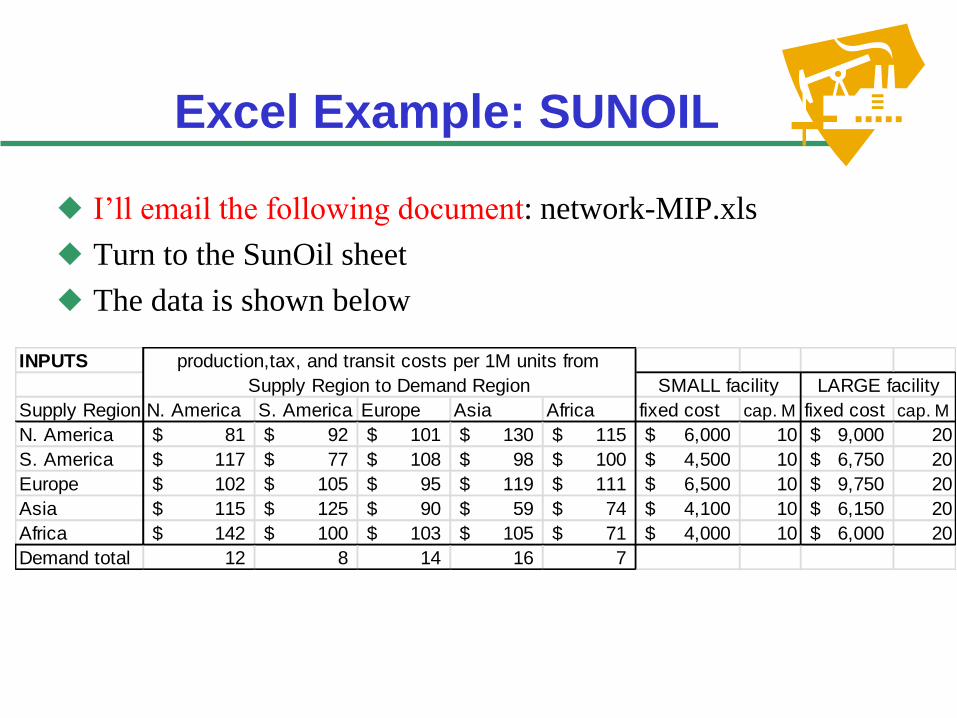
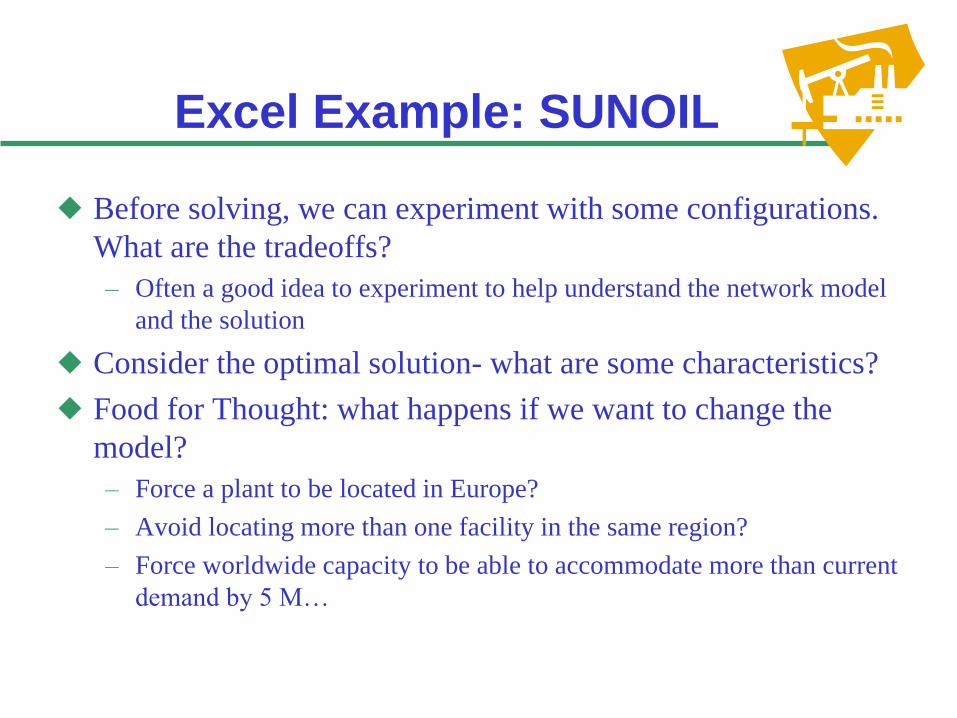
Excel Example: SUNOIL
I’ll email the following document: network-MIP.xls
Turn to the SunOil sheet
The data is shown below
INPUTS
Supply Region N. America S. America Europe Asia Africa fixed cost cap. M fixed cost cap. M
N. America 81$ 92$ 101$ 130$ 115$ 6,000$ 10 9,000$ 20
S. America 117$ 77$ 108$ 98$ 100$ 4,500$ 10 6,750$ 20
Europe 102$ 105$ 95$ 119$ 111$ 6,500$ 10 9,750$ 20
Asia 115$ 125$ 90$ 59$ 74$ 4,100$ 10 6,150$ 20
Africa 142$ 100$ 103$ 105$ 71$ 4,000$ 10 6,000$ 20
Demand total 12 8 14 16 7
production,tax, and transit costs per 1M units from
Supply Region to Demand Region SMALL facility LARGE facility
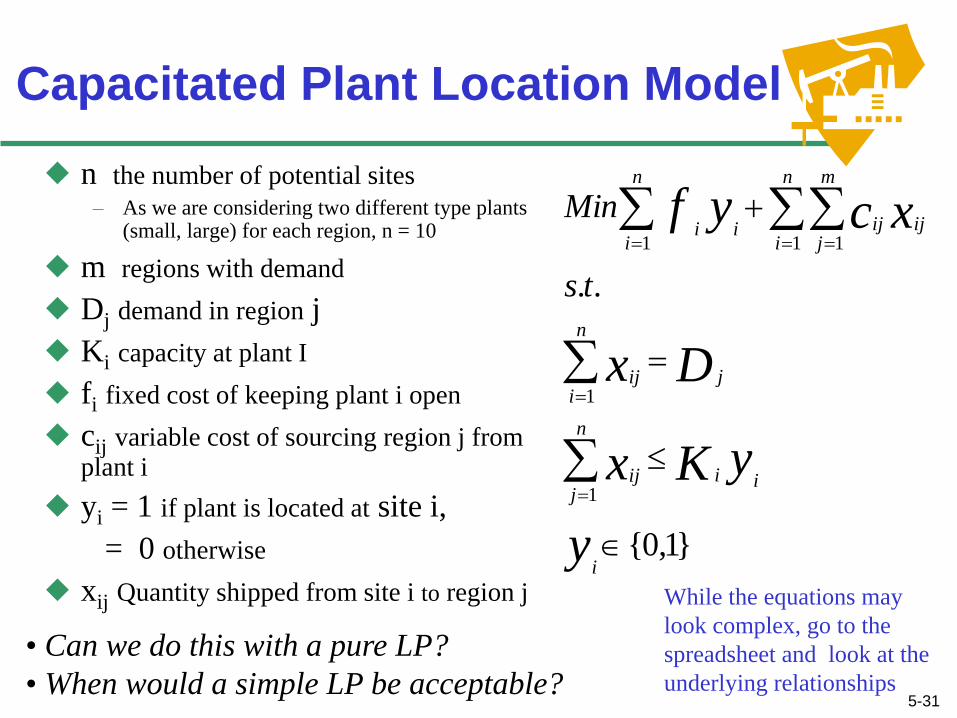
Capacitated Plant Location Model
n the number of potential sites – As we are considering two different type plants
(small, large) for each region, n = 10
m regions with demand
Dj demand in region j
Ki capacity at plant I
fi fixed cost of keeping plant i open
cij variable cost of sourcing region j from plant i
yi = 1 if plant is located at site i,
= 0 otherwise
xij Quantity shipped from site i to region j
}1,0{
..
1
1
1 11
y
yKx
Dx
xcyf
i
ii
n
jij
j
n
iij
n
i
m
jijiji
n
ii
ts
Min
5-31
• Can we do this with a pure LP?
• When would a simple LP be acceptable?
While the equations may
look complex, go to the
spreadsheet and look at the
underlying relationships
Excel Example: SUNOIL
Before solving, we can experiment with some configurations.
What are the tradeoffs?
– Often a good idea to experiment to help understand the network model
and the solution
Consider the optimal solution- what are some characteristics?
Food for Thought: what happens if we want to change the
model?
– Force a plant to be located in Europe?
– Avoid locating more than one facility in the same region?
– Force worldwide capacity to be able to accommodate more than current
demand by 5 M…
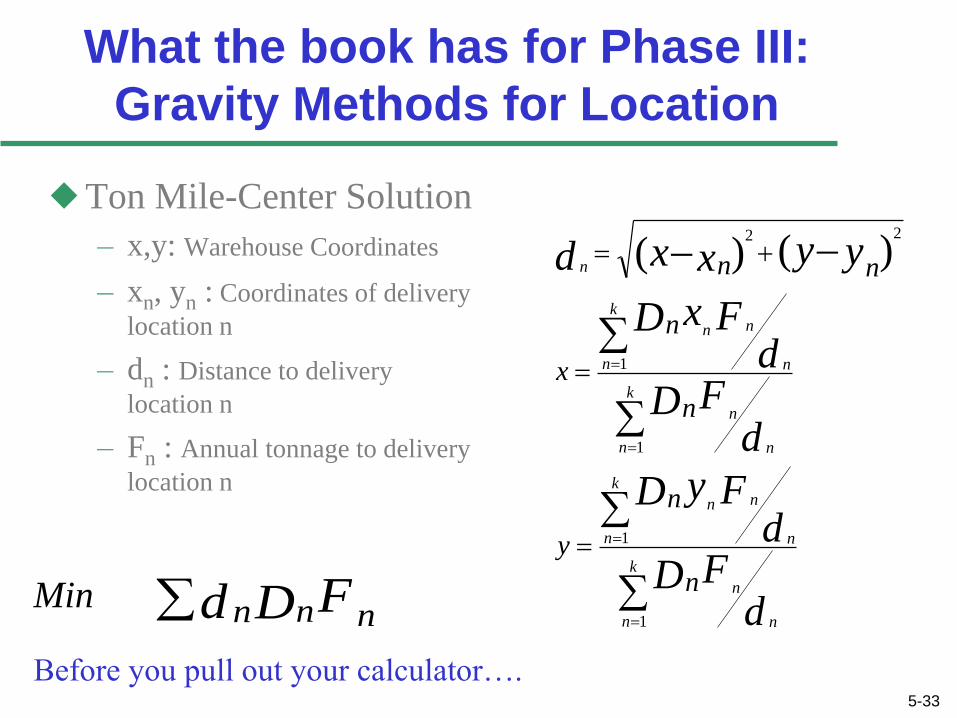
What the book has for Phase III:
Gravity Methods for Location
Ton Mile-Center Solution
– x,y: Warehouse Coordinates
– xn, yn : Coordinates of delivery
location n
– dn : Distance to delivery
location n
– Fn : Annual tonnage to delivery
location n
k
n n
n
k
n n
nn
k
n n
n
k
n n
nn
n
dFD
dFyD
dFD
dFxD
yyxxd
n
n
y
n
n
x
nn
1
1
1
1
22
)()(
Min FDd nn n
5-33
Before you pull out your calculator….
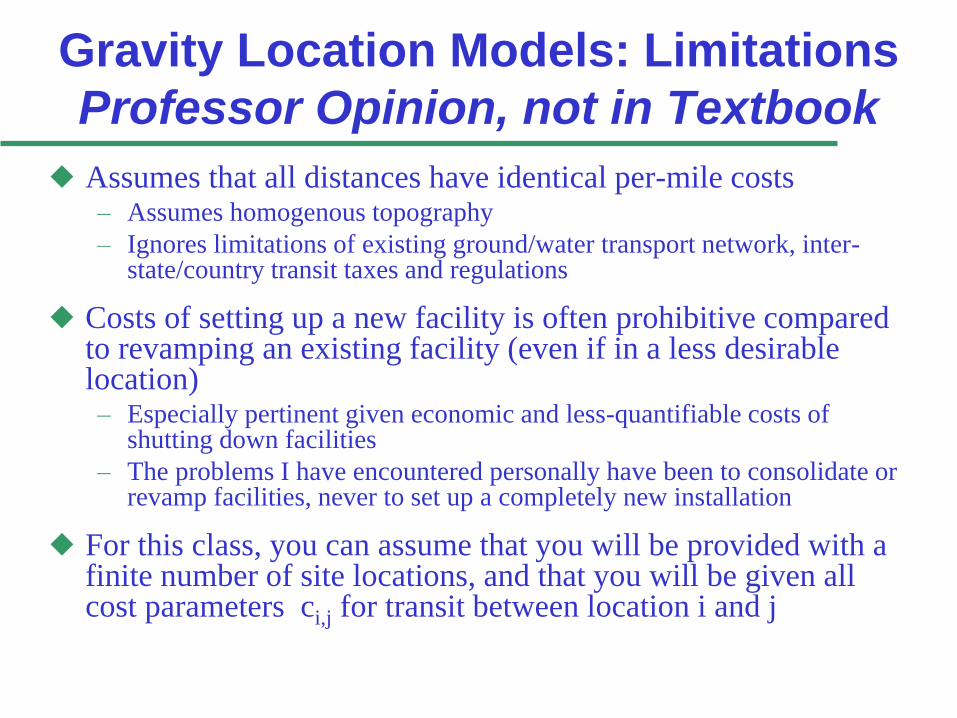
Gravity Location Models: Limitations
Professor Opinion, not in Textbook
Assumes that all distances have identical per-mile costs – Assumes homogenous topography
– Ignores limitations of existing ground/water transport network, inter-state/country transit taxes and regulations
Costs of setting up a new facility is often prohibitive compared to revamping an existing facility (even if in a less desirable location) – Especially pertinent given economic and less-quantifiable costs of
shutting down facilities
– The problems I have encountered personally have been to consolidate or revamp facilities, never to set up a completely new installation
For this class, you can assume that you will be provided with a finite number of site locations, and that you will be given all cost parameters ci,j for transit between location i and j
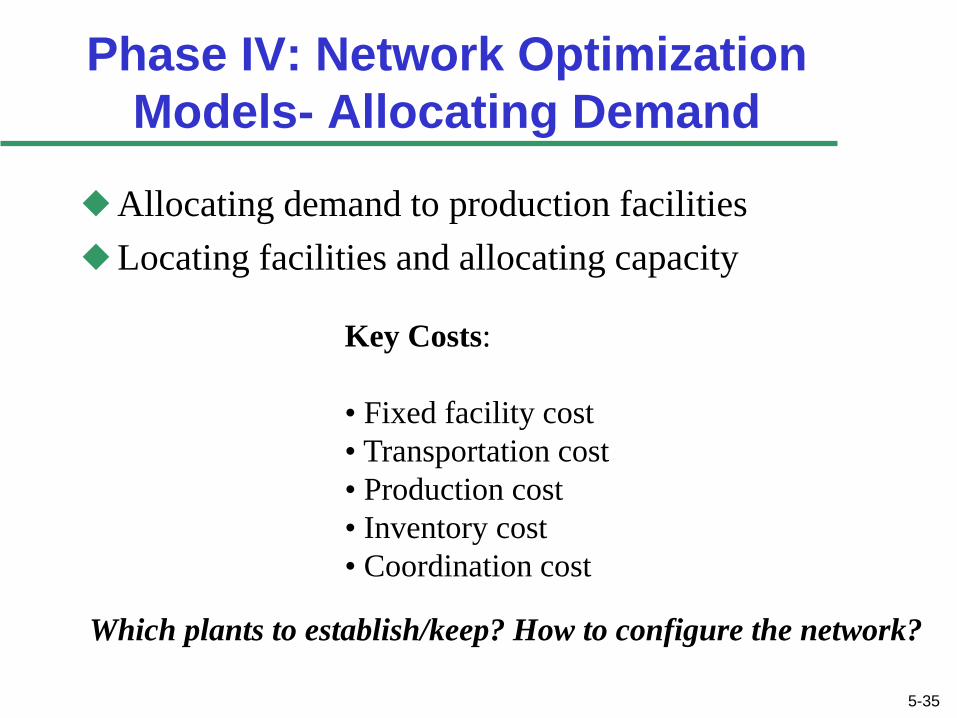
Phase IV: Network Optimization
Models- Allocating Demand
Allocating demand to production facilities
Locating facilities and allocating capacity
Which plants to establish/keep? How to configure the network?
Key Costs:
• Fixed facility cost
• Transportation cost
• Production cost
• Inventory cost
• Coordination cost
5-35
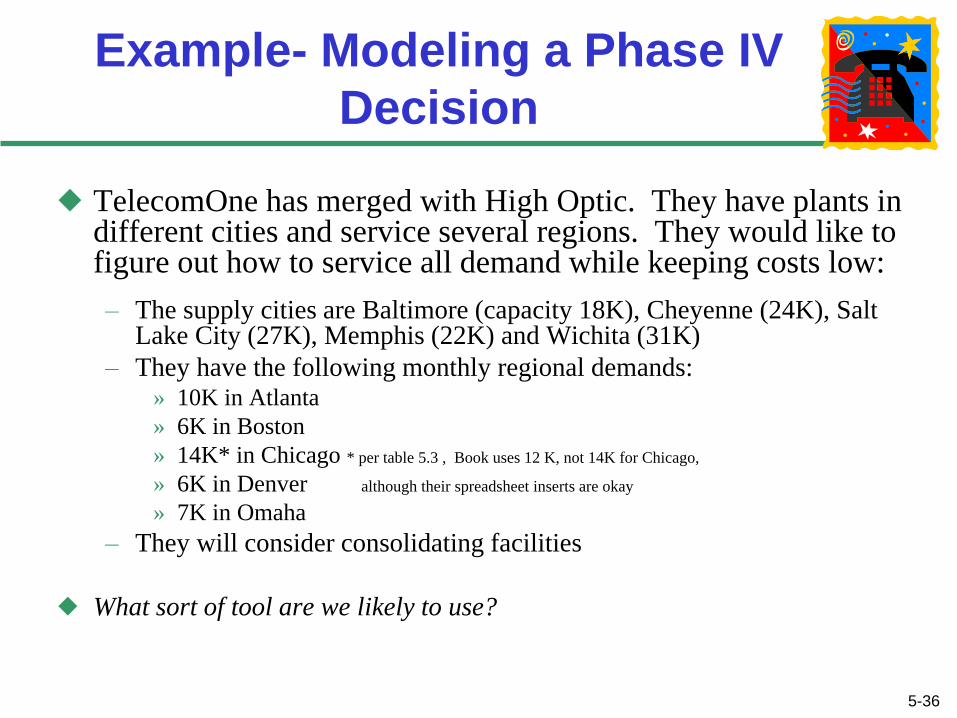
Example- Modeling a Phase IV
Decision
TelecomOne has merged with High Optic. They have plants in different cities and service several regions. They would like to figure out how to service all demand while keeping costs low:
– The supply cities are Baltimore (capacity 18K), Cheyenne (24K), Salt Lake City (27K), Memphis (22K) and Wichita (31K)
– They have the following monthly regional demands: » 10K in Atlanta
» 6K in Boston
» 14K* in Chicago * per table 5.3 , Book uses 12 K, not 14K for Chicago,
» 6K in Denver although their spreadsheet inserts are okay
» 7K in Omaha
– They will consider consolidating facilities
What sort of tool are we likely to use?
5-36
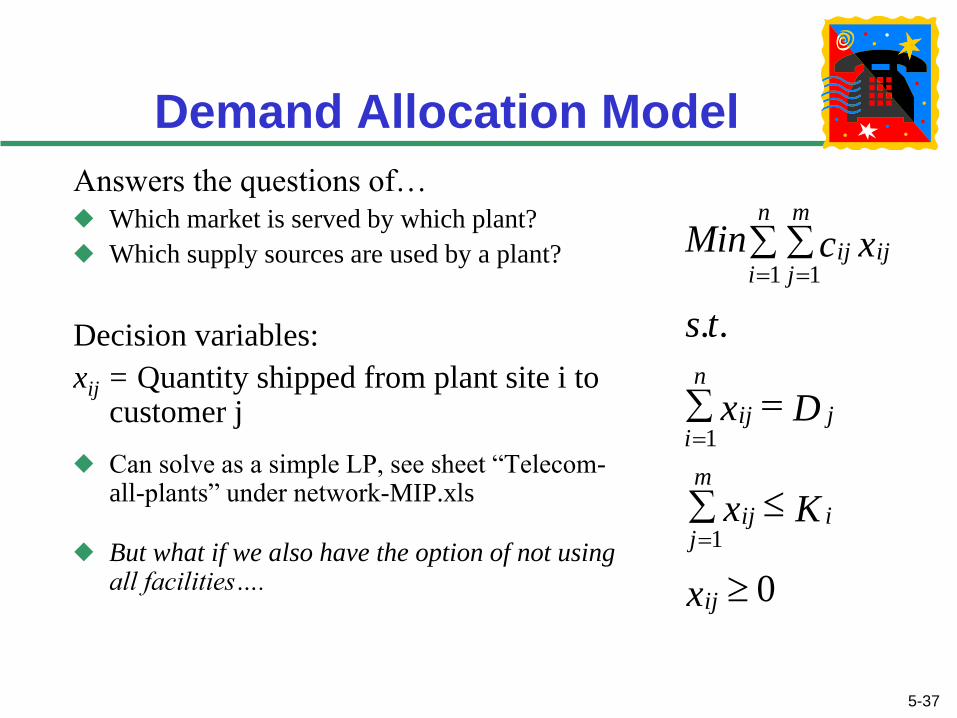
Demand Allocation Model
Answers the questions of…
Which market is served by which plant?
Which supply sources are used by a plant?
Decision variables:
xij = Quantity shipped from plant site i to customer j
Can solve as a simple LP, see sheet “Telecom-all-plants” under network-MIP.xls
But what if we also have the option of not using all facilities…. 0
..
1
1
1 1
x
Kx
Dx
ts
xcMin
ij
i
m
jij
j
n
iij
n
i
m
jijij
5-37
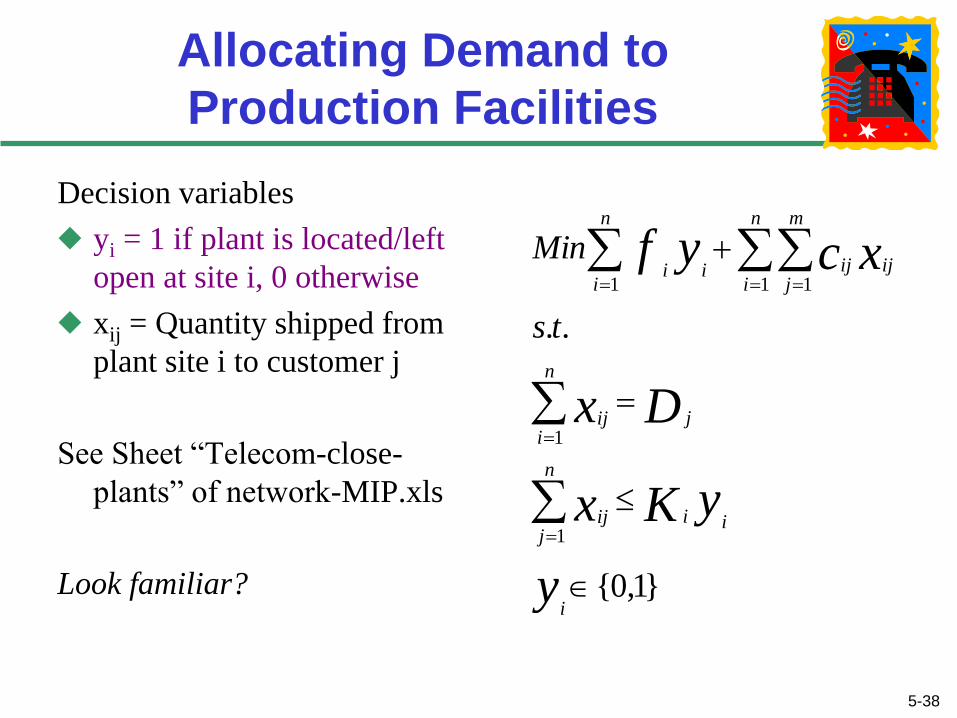
Allocating Demand to
Production Facilities
Decision variables
yi = 1 if plant is located/left
open at site i, 0 otherwise
xij = Quantity shipped from
plant site i to customer j
See Sheet “Telecom-close-
plants” of network-MIP.xls
Look familiar? }1,0{
..
1
1
1 11
y
yKx
Dx
xcyf
i
ii
n
jij
j
n
iij
n
i
m
jijiji
n
ii
ts
Min
5-38
Demand Allocation Model
Example Results
Before we solve the problem, what can we say about TelecomOptic’s situation?
What does the Excel model indicate should happen with plant configuration? Demand allocation?
What are the ramifications from this solution?
What are some what-if scenarios we might consider?
5-39
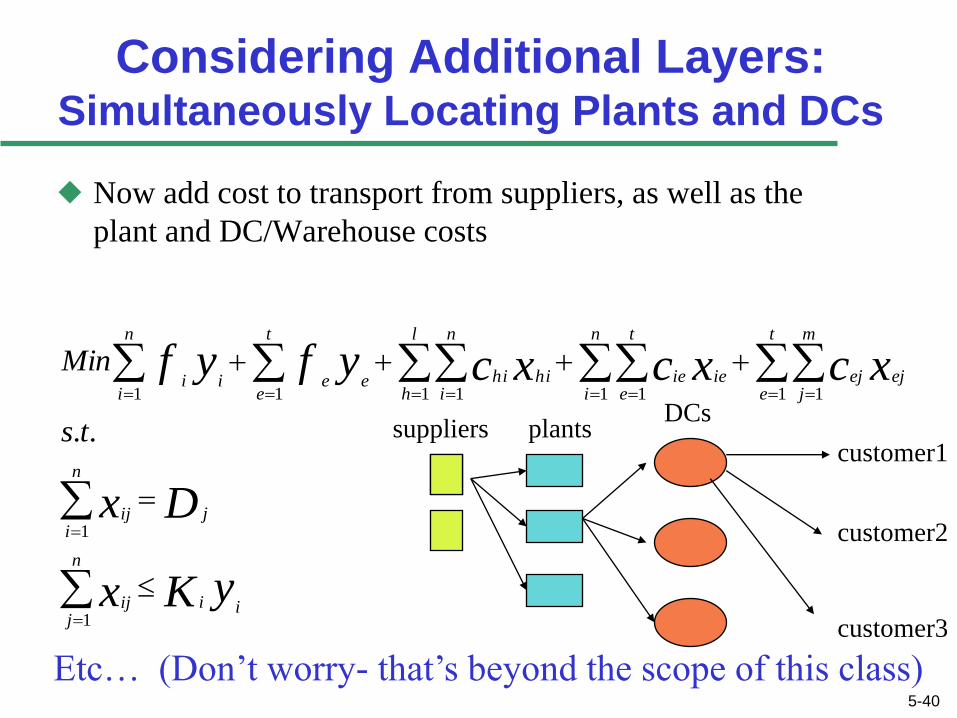
Considering Additional Layers: Simultaneously Locating Plants and DCs
Now add cost to transport from suppliers, as well as the
plant and DC/Warehouse costs
yKx
Dx
xcxcxcyfyf
ii
n
jij
j
n
iij
t
e
m
jejej
n
i
t
eieie
l
h
n
ihihie
t
eei
n
ii
ts
Min
1
1
1 11 11 111
..
5-40
suppliers plants DCs
customer1
customer2
customer3
Etc… (Don’t worry- that’s beyond the scope of this class)
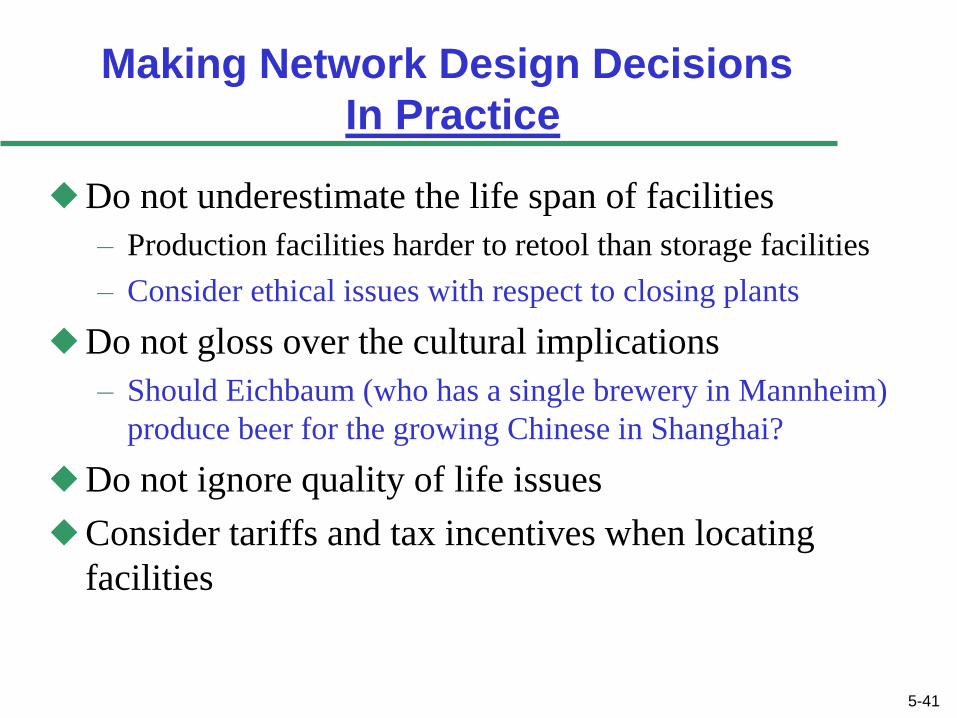
Making Network Design Decisions
In Practice
Do not underestimate the life span of facilities
– Production facilities harder to retool than storage facilities
– Consider ethical issues with respect to closing plants
Do not gloss over the cultural implications
– Should Eichbaum (who has a single brewery in Mannheim)
produce beer for the growing Chinese in Shanghai?
Do not ignore quality of life issues
Consider tariffs and tax incentives when locating
facilities
5-41
6-42
Outline- subset of Chapter 6 Designing Global Supply Chain Networks
Due to time limitations, we do not delve into Decision Tree
theory and other analytical models in this chapter, and we
consider only the introductory material in this chapter
The Impact of Globalization on Supply Chain Networks
The Offshoring Decision: Total Cost
Risk Management in Global Supply Chains
6-43
The Impact of Globalization on
Supply Chain Networks
Globalization offers companies opportunities to simultaneously grow revenues and decrease costs
The opportunities from globalization are often accompanied by significant additional risk
There will be a good deal of uncertainty in demand, prices, exchange rates, and the competitive market over the lifetime of a supply chain network
Therefore, building flexibility into supply chain operations allows the supply chain to deal with uncertainty in a manner that will maximize profits
6-44
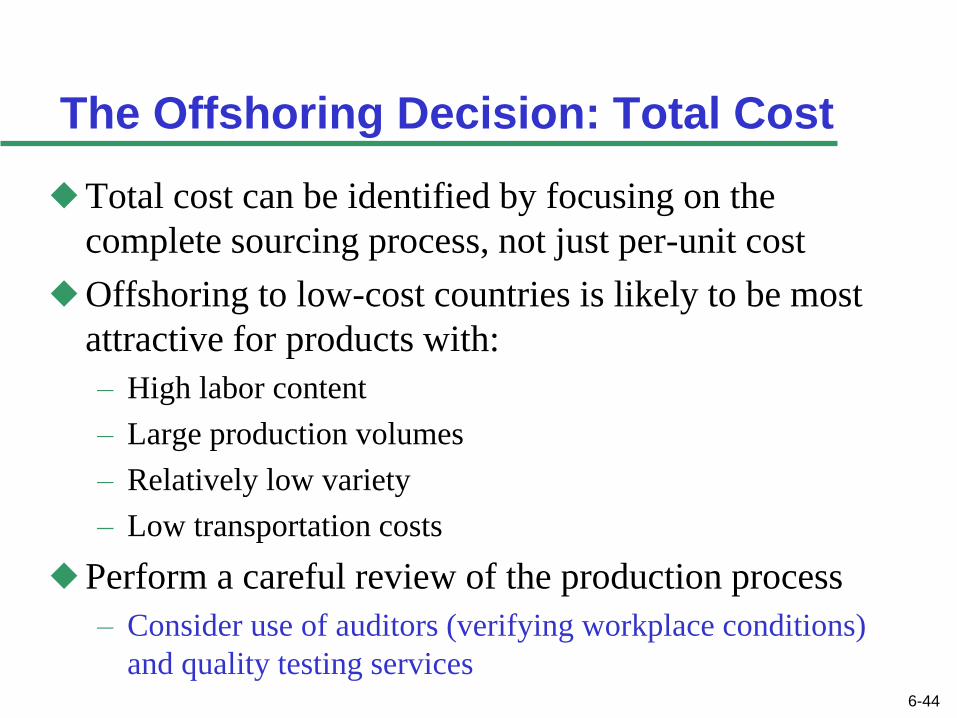
The Offshoring Decision: Total Cost
Total cost can be identified by focusing on the
complete sourcing process, not just per-unit cost
Offshoring to low-cost countries is likely to be most
attractive for products with:
– High labor content
– Large production volumes
– Relatively low variety
– Low transportation costs
Perform a careful review of the production process
– Consider use of auditors (verifying workplace conditions)
and quality testing services

Risk Management in Global
Supply Chains
Disruptions
– Topical Example: Honda, Nissan and Toyota have
effectively shut down factories for weeks following the
2011 Tsunami
» Nissan estimates lost profits of over $25 million/day
Delays
Systems risk
Forecast risk
Intellectual property risk
Procurement risk
Inventory risk
Capacity risk 6-45
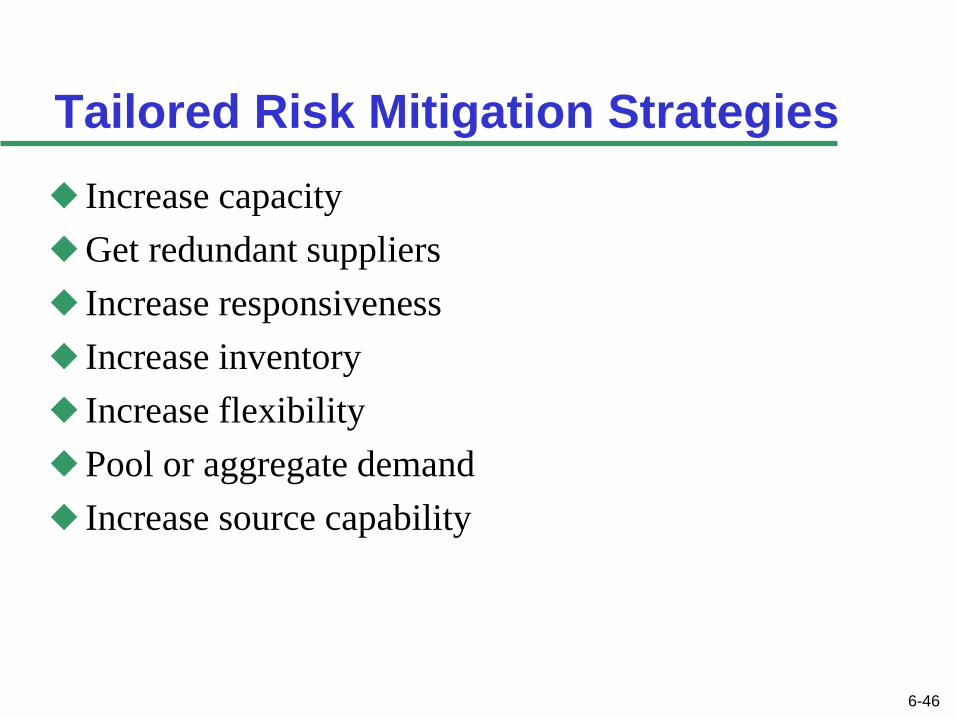
Tailored Risk Mitigation Strategies
Increase capacity
Get redundant suppliers
Increase responsiveness
Increase inventory
Increase flexibility
Pool or aggregate demand
Increase source capability
6-46
4-47
Summary of Chapter 4’s Learning
Objectives
What roles do distributors play in the supply chain?
What are the key factors to be considered when
designing the distribution network?
What are the strengths and weaknesses of various
distribution options, including e-Business enabled
ones?
Summary of Chapter 5’s Learning
Objectives
What is the role of network design decisions in the supply chain?
What are the factors influencing supply chain network design decisions?
Describe a strategic framework for facility location
How can network optimization methods be used for facility location and capacity allocation decisions?
5-48


![arXiv:1707.07190v1 [math.CO] 22 Jul 2017 · 2017-07-25 · arXiv:1707.07190v1 [math.CO] 22 Jul 2017 IntroductiontoClusterAlgebras Chapters4–5 (preliminaryversion) SergeyFomin Lauren](https://img.pdfslide.net/doc/110x75/5e6c50560f802b19e8413fd4/arxiv170707190v1-mathco-22-jul-2017-2017-07-25-arxiv170707190v1-mathco.jpg)