Embed Size (px)
Citation preview

CHAPTER 4
PRESENTATION, ANALYSIS AND INTERPRETATION OF DATA
This chapter presents the findings of the study. The analysis and interpretation of
statistical results follow the order of presentation of the problem set forth in Chapter 1.
Profile of the Ceramics Industry Respondents
The profile of the ceramics industry includes the industry size, type of product,
budget of waste management (show in table 4.) and kind of ceramic waste.

64
Table 4.
Distribution of the Ceramic Industries’ Profile
Indicator Frequency Percentage Number of employees Less than 50 employees 50-99 employees 100-199 employees 200-299 employees More than 299 employees
26 32 10 6 26
26.0 32.0 10.0 6.0 26.0
Total 100 100.0 Capital Less than 5 million Bahts 5-25 million Bahts 26-50 million Bahts 51-100 million Bahts More than 100 million Bahts
24 35 14 6 21
24.0 35.0 14.0 6.0 21.0
Total 100 100.0 Type of product Ceramic tile Sanitary ware Tableware Giftware Construction brick
20 10 20 26 24
20.0 10.0 20.0 26.0 24.0
Total 100 100.0 Budget of waste management Less than 1,000 Bahts 1,000-5,000 Bahts 5,001-10,000 Bahts More than 10,000 Bahts
2 36 36 26
2.0 36.0 36.0 26.0
Total 100 100.0

65
Size of the Ceramics Industry
The size of the industry is indicated in this by the number of employees and the
capital of the industry in million Bahts.
Figure 5 shows that of 100 ceramics industries surveyed, 26 or 26 percent have less
than 50 employees. A greater 32 ceramics industries have 50 to 99 employees. The profile
still reveals that 26 ceramics industries employed more than 299 employees. There are 6
industries that employed 200 to 299 employees and 10 of the industries employed 100 to
199 employees.
Further analysis would show that 58% of the industries have employees of less than
100 and 42% have more than 100 employees.
Figure 5. Number of Employees of the Ceramics Industry
26.0%
6.0%
10.0%
32.0%
26.0%
0.0
5.0
10.0
15.0
20.0
25.0
30.0
35.0
Less than 50employees
50-99employees
100-199employees
200-299employees
More than299 employees
Number of employees
%

66
Figure 6 shows the distribution of ceramics industries by capitalization in million
Bahts.
Figure 6. Capital of the Ceramics Industry
As it is shown, there are 35 industries whose capitalization ranges from 5-25 million
Bahts. This is followed by 24 industries with less than 5 million capitalization. The 3rd
group of 21 has more than 100 million capital. Another 14 industries indicated 26 to 50
million capitalization and 6 industries with 51-100 million Bahts capitalization.
24.0%
35.0%
14.0%
6.0%
21.0%
0.05.0
10.015.020.025.030.035.0
%
Less th
an 5 million Bahts
5-25 million Bahts
26-50 million Bahts
51-100 million Bahts
More than 100 millio
n Bahts
Capital

67
Type of Product
The next figure presents the profile of ceramics industries by the type of product they
specialize.
Figure 7. Type of Product
The distribution shows that more industries engage in manufacture of giftware
(26.0% or 26 out of 100). This is followed by 24 industries which concentrate on the
manufacture of bricks for building construction. The 3rd largest group of 20 industries is
specializing on the manufacture of ceramic tiles and the same number of 20 industries
specializes on the manufacture of tablewares. Only 10 out of 100 concentrate on the
production of sanitary wares.
Budget of Waste Management
Managing industry waste is a industry function that can be both beneficial to the
industry and the public. Figure 8 shows the distribution of the industries by budget
allocation for waste management in thousand Bahts.
24
20
10
20
26
Ceramic tile (20.0%)
Sanitary ware (10.0%)
Tableware (20.0%)
Giftware (26.0%)
Construction brick (24.0%)

68
Figure 8. Budget of Waste Management
The figure indicates bi-modal distribution. A group of 36 industries allocates 1,000-
5,000 Bahts for waste management. The same number of 36 industries allocate 5,001 to
10,000 Bahts annually. There are 26 industries that allocate more than 10,000 Bahts for
waste management; while 2 industries allocate less than 1,000 Bahts for waste management.
Kind of Ceramic Waste
Solid Waste
Waste can either be recycled or disposed of by the ceramics industries. The
following table shows the distribution of industries by solid waste.
26.0%
36.0%36.0%
2.0%0
5
10
15
20
25
30
35
40
Less than 1,000 Bahts
1,000-5,000 Bahts
5,001-10,000 Bahts
More than 10,000 Bahts
Budget of waste management
%

69
Table 5.
Distribution of Ceramics Industries by Solid Waste
Number of industries 20 10 20 26 24 100
Type of industry
Kind of ceramic waste
Cer
amic
tile
Sani
tary
war
e
Tab
lew
are
Gift
war
e
Con
stru
ctio
n br
ick Total
Frequency
and
Percentage
Raw material
Green ware
Biscuit ware
Glost ware
Powder clay
Slip Clay
Plastic clay
Sediments
Other
18
20
15
20
18
18
11
20
0
10
10
4
10
4
10
6
10
1
20
20
20
20
6
19
18
19
2
26
26
26
26
10
26
24
25
3
24
24
21
7
0
10
19
13
0
98
100
86
83
38
83
78
87
6
Table 5 shows that 98 out of 100 ceramic industries have raw material waste. Only 2
industries from tile manufacturing claimed that they don’t have raw material waste. All
industries have waste arising from green wares. This refers to unfired wares which were
either broken or failed to pass quality control. In some tile industries, biscuit and glost firing
are only one unlike in other ceramic products like giftwares and dinnerwares which require
separate firing for biscuit and glost. If biscuit and glost are done only once, any identified

70
defect before firing will render the ware useless. The item is then discarded and is
considered waste.
Not all industries have biscuit waste. Only 86 out of 100 claimed they have this kind
of waste. This simply means that some are 100% efficient in firing green wares and
handling biscuit wares or the biscuit and glost firing are done only once (single firing).
On glost ware waste, 83 out of 100 indicate that they have glost ware waste. Of the
5 types of industries, it was only in the construction of bricks that indicated few waste
incurred. Only seven (7 out of 21) claimed they have waste on glost wares. On powder
clay, only 38 industries incurred such waste. The 62 percent are more efficient indicating no
powder clay waste. In slip clay, however, 83 out of 100 have this type of waste.
In plastic clay, however, 78 out of 100 industries indicate they have this kind of
waste; 22% don’t have this waste. Plastic clay is not totally wasted except in some instances
when plastic clay is used for modeling in producing master mold. In production of bricks,
nothing can be waste. If plastic clay is used such can still be recycled to transform into a
raw material again for production. Low waste of this kind is seen among sanitary, tiles, and
tableware industries.
Sediments as waste is common to 87 industries. Only 13 out of 100 claimed they
don’t have this type of waste.
Liquid Waste
The most common liquid waste among industries surveyed is washed water. All
industries have this (100%). Liquid glaze materials is the 2nd which is common to 76

71
industries out of 100 surveyed. Brick industries are not using glaze in the production with
these indicating no liquid glaze waste.
Other liquid waste is manageable with only one industry specializing in giftware
indicates waste on this. As gleaned from the table the liquid glaze materials carries a big
problem as glaze compounds are expensive.
Table 6.
Distribution of Ceramics Industries by Liquid Waste
Number of industries 20 10 20 26 24 100
Type of industry
Cer
amic
tile
Sani
tary
war
e
Tab
lew
are
Gift
war
e
Con
stru
ctio
n br
ick
Total
Frequency
and
Percentage
Washed water
Glaze
Other
20
20
0
10
10
0
20
20
0
26
26
1
24
0
0
100
76
1
Waste Management Technique
In this study, the respondent industry were asked what techniques they use given a
particular ceramics waste.

72
Treatment of Ceramic Solid Waste
Treatment of Raw Material
Majority of the ceramics industries recycle the raw material waste and use again with
the same purpose (77.0%). There are 9 industries that dispose of this waste material for
landfill and five industries recycle them and use for another purpose. A few (4.0%) consider
them both for the same and another purpose. Recycling is the most common because the
raw material has not changed its chemical composition. It can be dried again, milled and
use again for the same purpose. This treatment is very economical for the industry. This
simply means that nothing is wasted. It does not add to environmental pollution and it is a
useful waste reduction in the industry and a cost saving management technique that can
attribute to industry productivity.
Table 7.
Frequency and Percentage Distribution of Industries by Kind of Treatment
Employed to Raw Material as Solid Waste
Treatment Frequency Percentage
A - Recycle and use for the same purpose
B - Recycle and use for another purpose
C - Dispose to landfill
AB
ABC
D – Other treatment
None
77
5
9
4
2
1
2
77.0
5.0
9.0
4.0
2.0
1.0
2.0
Total 100 100.0

73
Dealing with raw material wastes and green ware waste are almost the same because
the composition of the two are still in its natural form and no chemical changes have
occurred. Some ceramics industries may also recycle for reuse in the same and other
purpose.
Treatment of Green Ware
Table 8 reveals the process involved in the treatment of solid waste arising from
green ware waste. Green ware waste usually result from mishandling of the ceramic pieces
when it has just been formed or when it is already bone dry and are ready for firing. Some
pieces may have warped or cracked and will be discarded in stocking through quality
control.
In dealing with green ware waste, most ceramics industries recycle it again into a
raw material for the same purpose. As indicated 77 out of 100 do that but 9 industries
dispose some of it to landfill. Usually this is done when the green ware is applied with glaze
materials and when separation of glaze from clay body is costlier than using uncontaminated
raw material.

74
Table 8.
Frequency and Percentage Distribution of Industries by Kind of Treatment
Employed to Green Ware as Solid Waste
Treatment Frequency Percentage
A - Recycle and use for the same purpose
B – Recycle and use for another purpose
C – Dispose to landfill
D – Repair
AB
AC
BC
ABC
77
6
9
2
1
2
1
2
77.0
6.0
9.0
2.0
1.0
2.0
1.0
2.0
Total 100 100.0
Dealing with raw material wastes and green ware waste are almost the same because
the composition of the two are still in its natural form and no chemical changes have
occurred. Some ceramics industries may also recycle for reuse in the same and other
purpose.
Treatment of Biscuit Ware
A biscuit is a ceramic ware that underwent firing from the green ware stage. At this
point the biscuit ware has undergone chemical changes by heat and cannot be recycled for
use like a raw material in its previous state. It can be recycled and use not for the same
purpose but for another. See Table 9.

75
Table 9.
Frequency and Percentage Distribution of Industries by Kind of Treatment
Employed to Biscuit Ware as Solid Waste
Treatment Frequency Percentage
A - Recycle and use for the same purpose
B – Recycle and use for another purpose
C – Dispose to landfill
D – Sell
E – Repair
AC
BC
BE
CE
ABC
BCE
F - Other treatment
None
14
12
43
2
3
2
2
1
3
1
1
2
14
14.0
12.0
43.0
2.0
3.0
2.0
2.0
1.0
3.0
1.0
1.0
2.0
14.0
Total 100 100.0
As shown in Table 9, 43 ceramics industries treat this waste by disposing it to
landfill. This waste material which is as hard as rock can well serve the purpose providing a
strong foundation in filling up low lands in the city or for reclamation purpose.
If it used as raw material again as viewed by 14 industries, it must be not as a plastic
component but as silica in clay body composition in a form of grog. Some 12 industries
view it as recycled waste for other purpose not anymore as a plastic component of a clay
body. As further revealed some will just consider it for multipurpose. That is, as grog in the
raw material and landfill to dispose this kind of waste.

76
The reason for disposing this as landfill is logical. If acquiring raw silica is cheaper
than grinding this material into grog, then landfill is the most effective.
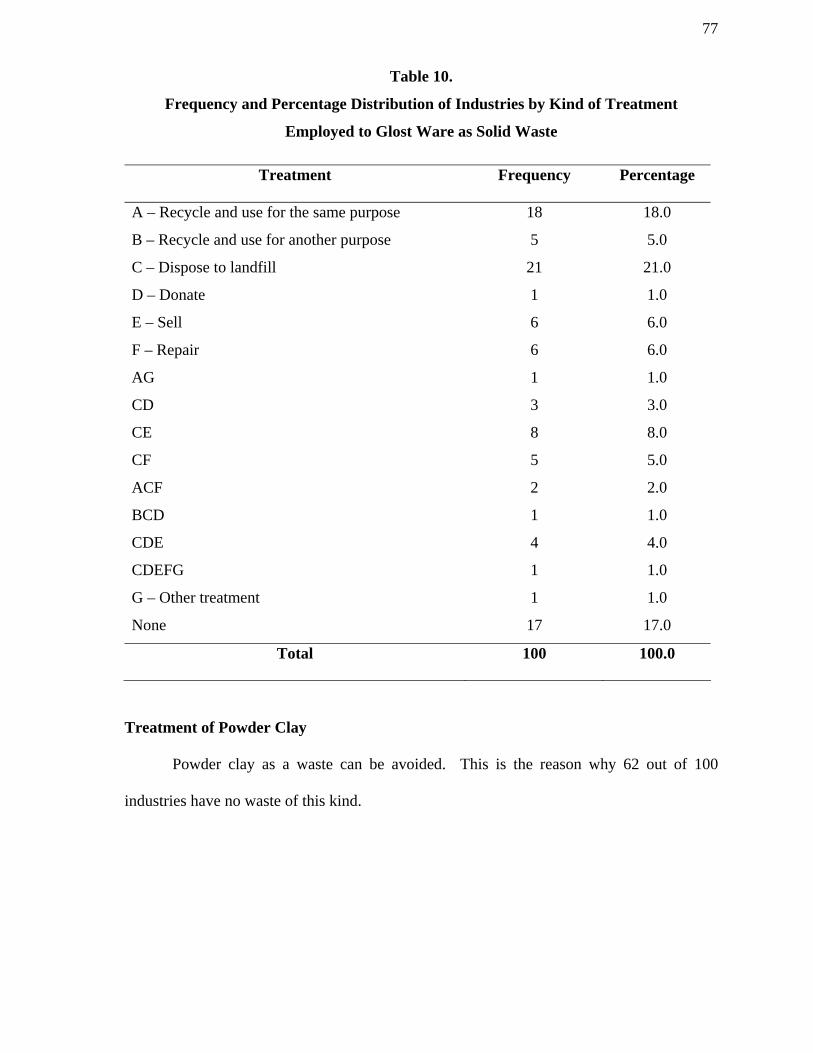
Treatment of Glost Ware
Many industries (21 out of 100) decided to consider this as a production waste by
disposing it to landfill. There are 18 industries, however, that still consider for recycling and
use for the same purpose and are therefore more imaginable than other industries.
Some glost wares that have defects and are considered waste can still be repaired
because of slight defect and remedy is possible can mitigate the industry loss. Selling it at
low price is being resorted to by some industries. Donation is also another alternative that
can make others happy and put other people happy for such kindness. As practiced for
quality control of products, those with slight defects are being separated and not included.
Some of these products like tiles with little cracks, or craze, bare spots can still be sold in the
local market as seen and practiced in the Philippines. This practice which concerns ethics
and values in business continue if there is no public protest. The loss of the industry is
usually avoided by some clever managers. The mass are usually after for lower price and
will always continue to be. The issue on cost effectiveness versus industry image deals with
two opposing values that the managers have to deal with.
The economic condition or situation sometimes pushes the manager to the wall and
have to think of what is best for the industry under his leadership. Turning waste into gold
is a challenge that he has to face without damaging the image of the industry.
77
Table 10.
Frequency and Percentage Distribution of Industries by Kind of Treatment
Employed to Glost Ware as Solid Waste
Treatment Frequency Percentage
A – Recycle and use for the same purpose
B – Recycle and use for another purpose
C – Dispose to landfill
D – Donate
E – Sell
F – Repair
AG
CD
CE
CF
ACF
BCD
CDE
CDEFG
G – Other treatment
None
18
5
21
1
6
6
1
3
8
5
2
1
4
1
1
17
18.0
5.0
21.0
1.0
6.0
6.0
1.0
3.0
8.0
5.0
2.0
1.0
4.0
1.0
1.0
17.0
Total 100 100.0
Treatment of Powder Clay
Powder clay as a waste can be avoided. This is the reason why 62 out of 100
industries have no waste of this kind.

78
Table 11.
Frequency and Percentage Distribution of Industries by Kind of Treatment
Employed to Powder Clay as Solid Waste
Treatment Frequency Percentage
A - Recycle and use for the same purpose
B - Recycle and use for another purpose
C - Dispose to landfill
AB
None
33
1
3
1
62
33.0
1.0
3.0
1.0
62.0
Total 100 100.0
As shown on the Table 11, among the 38 industries that encounter this waste, 33
considered recycling of the powder clay for raw materials. Only three considered this waste
for landfill.
The powder clay waste can be a clay body that was laid waste out of mishandling of
raw materials or excess from sanding green wares as part of final polishing before firing or
glaze application. This amount of waste, therefore, can be very negligible. Hence, a little
amount may just be collected as part of garbage which may go to landfill. Considerable
amount of this maybe mixed with unscreened slip clay and be part of the raw clay body in
liquid form for slip casting method of production.
Treatment to Slip Clay
Slip clay is usually used in slip casting of art wares or gift wares which can hardly be
done by mechanical pressing.

79
Table 12.
Frequency and Percentage Distribution of Industries by Kind of Treatment
Employed to Slip Clay as Solid Waste
Treatment Frequency Percentage
A - Recycle and use for the same purpose
B - Recycle and use for another purpose
C - Dispose to landfill
D – Sell
AB
AC
None
65
1
4
1
3
9
17
65.0
1.0
4.0
1.0
3.0
9.0
17.0
Total 100 100.0
The table 12 shows that of the 83 ceramics industries that encountered this waste
problem, 65 recycled this for use in the same purpose. Some will simply dispose it for
landfill as part of the daily industry garbage – if the amount is insignificant. In case of error
in the composition, recycling by either adding more clay body and water if the sodium
silicate is in excess in the composition. Slip clay which still retains the natural composition
of raw materials before heat treatment is easy to recycle and use for the same purpose. Any
combination of treatment may depend on the situation.
Treatment of Plastic Clay
Plastic clay has many uses. The most important use is in modeling or sculpturing in
freehand forming particularly in figurines. Waste occur usually when it becomes too stiff to
yield to pressure in forming or when it is considered excess, and when error is committed in

80
its formulation and cannot be used for the purpose. The table shows that only 22 out of 100
did not encounter such waste as gleaned from Table 13.
Table 13.
Frequency and Percentage Distribution of Industries by Kind of Treatment
Employed to Plastic Clay as Solid Waste
Treatment Frequency Percentage
A – Recycle and use for the same purpose
B – Recycle and use for another purpose
C – Dispose to landfill
AB
AC
None
56
7
7
1
7
22
56.0
7.0
7.0
1.0
7.0
22.0
Total 100 100.0
Of the 78 ceramics industries that product this waste, 56 of them recycle the plastic
clay waste for the same purpose. Some industries (7 out of 100) recycle this waste but for
another purpose such as using it as clay bedding in mold making. Still 7 of them would
simply dispose it to landfill.
The rest would use combination of recycling and landfill. Landfill should be the last
resort, since landfill is cheaper than recycling the plastic clay body.
Treatment of Sediments
Sediments may refer to course particles of clay and sand that settles down in a slurry.
Of the 100 ceramics industry surveyed 13 do not produce this waste.
81
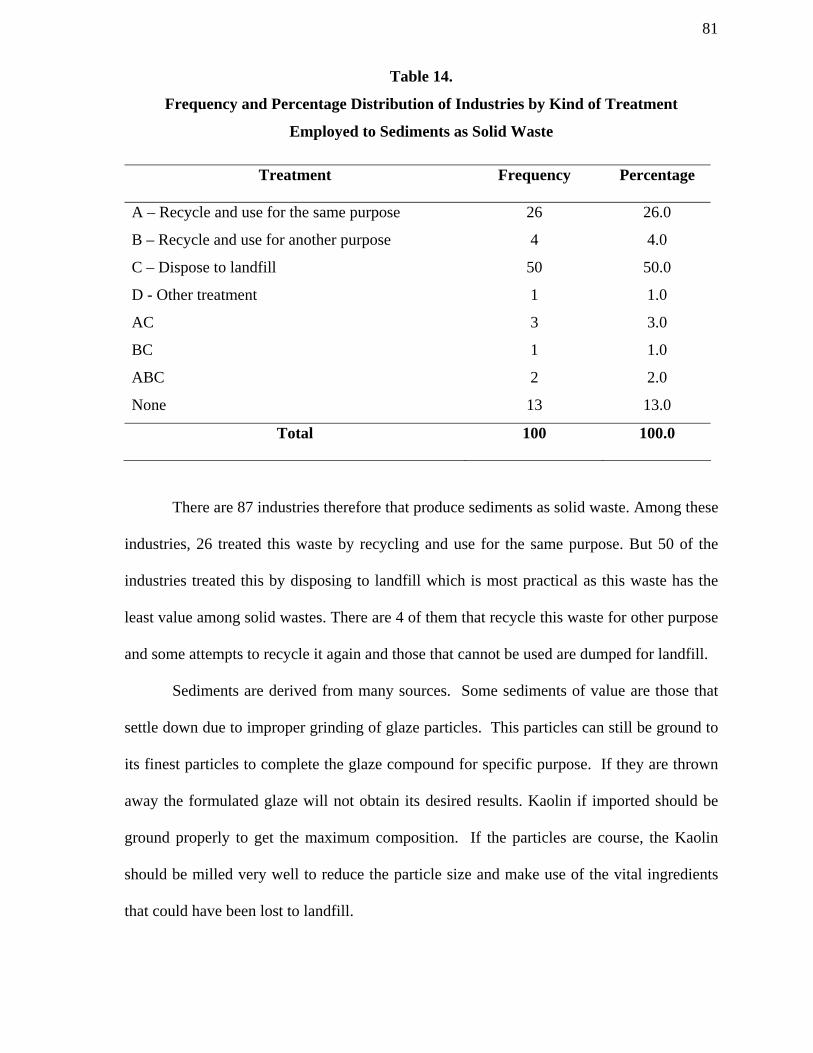
Table 14.
Frequency and Percentage Distribution of Industries by Kind of Treatment
Employed to Sediments as Solid Waste
Treatment Frequency Percentage
A – Recycle and use for the same purpose
B – Recycle and use for another purpose
C – Dispose to landfill
D - Other treatment
AC
BC
ABC
None
26
4
50
1
3
1
2
13
26.0
4.0
50.0
1.0
3.0
1.0
2.0
13.0
Total 100 100.0
There are 87 industries therefore that produce sediments as solid waste. Among these
industries, 26 treated this waste by recycling and use for the same purpose. But 50 of the
industries treated this by disposing to landfill which is most practical as this waste has the
least value among solid wastes. There are 4 of them that recycle this waste for other purpose
and some attempts to recycle it again and those that cannot be used are dumped for landfill.
Sediments are derived from many sources. Some sediments of value are those that
settle down due to improper grinding of glaze particles. This particles can still be ground to
its finest particles to complete the glaze compound for specific purpose. If they are thrown
away the formulated glaze will not obtain its desired results. Kaolin if imported should be
ground properly to get the maximum composition. If the particles are course, the Kaolin
should be milled very well to reduce the particle size and make use of the vital ingredients
that could have been lost to landfill.

82
Generally, it is observed from the preliminary findings that the ceramics industry in
Thailand maximize the utilization of its raw materials and industrial waste by giving the
appropriate treatment per solid waste classification.
Treatment of Ceramic Liquid Waste
Treatment of Washed Water
Liquid wastes in this study has been limited to water waste from washing raw
materials, tools and equipment and those water wasted from industrial processes.
The table reveals that 100 percent of the ceramics industries produce water waste.
Table 15.
Frequency and Percentage Distribution of Industries by Kind of Treatment
Employed to Washed Water as Liquid Waste
Treatment Frequency Percentage
A – Recycle by screening / filtration
B – Recycle by sedimentation
C – Recycle by flocculate
D – Dispose to sewer system
E – Other disposal means
AC
AD
BC
ABC
20
19
4
48
2
2
1
2
2
20.0
19.0
4.0
48.0
2.0
2.0
1.0
2.0
2.0
Total 100 100.0

83
As indicated 20 of the industries recycle the waste water by filtration. A group of 19
industries do it by sedimentation, that is allowing the particles in water to settle at the
bottom and siphon the water on top. Only four industries recycle water by flocculation. The
greatest number of 48 industries dispose the waste water to the sewerage system. The
remaining 9 industries do it by combination of recycling by filtration and sedimentation,
utilizing flocculation and some by disposal to sewerage system.
Close to the majority of the industries dispose the waste water through the sewerage
system. This is so because of the abundance of water supply from industrial waste. While
supply of water is not a problem, the probability of polluting the rivers is high.
It is, however, important to note that majority of the industries conserve the water
they use by recycling and use them again for industrial processes.
Treatment of Glaze
Table 16 shows that 24 out of 100 industries do not produce waste from liquid
glazes. If ever they use glaze their system of glaze application is so efficient to allow no
waste at all.

84
Table 16.
Frequency and Percentage Distribution of Industries by Kind of Treatment
Employed to Glaze as Liquid Waste
Treatment Frequency Percentage
A – Recycle by screening / filtration
B – Recycle by sedimentation
C – Recycle by flocculate
D – Dispose to sewer system
AB
AD
BD
ABC
None
26
15
5
24
1
3
1
1
24
26.0
15.0
5.0
24.0
1.0
3.0
1.0
1.0
24.0
Total 100 100.0
But a total count, there are 76 ceramics industries that produce liquid waste from
glaze applications. Of that number, 15 recycle the waste by sedimentation. If it is done the
glaze compound that settles at the bottom is never wasted. Water on top can be reused for
industrial processes. There are 26 industries that recycle this liquid waste by filtration. This
method would produce clear water for immediate use but allow the glaze particles to stick to
the layer of filter. This method would give rise to a new problem when filters get clogged.
Five industries use flocculation, while a big number of 24 industries dispose this waste to
the sewerage system. A big number of ceramics industries therefore is contributor to the
pollution of Thai rivers, considering the composition of glazes which are made of poisonous
compound except when the glaze compounds are made of frits. The remaining six industries

85
employ combination of two or three approaches in recycling and disposing liquid waste
from glaze solutions.
Level of Technology Used in the Treatment of Solid Waste
The data in table 17 reveals that majority of the industry use high technology in the
treatment of solid waste.
Table 17.
Mean Perception on the Level of Technology Used in the Treatment of Solid Waste
Indicator Weighted
Mean
Standard
Deviation
Interpretation
Level of technology used in the treatment of
solid waste:
Raw material
Green ware
Biscuit ware
Glost ware
Powder clay
Slip clay
Plastic clay
Sediments
Other
1.71
1.74
1.66
1.70
1.66
1.70
1.67
1.67
1.60
0.59
0.61
0.59
0.66
0.58
0.64
0.68
0.62
0.55
High
High
High
High
High
High
High
High
High
Average 1.6789 0.4535 High
Legend: Very high = 2.51-3.00
High = 1.51-2.50 Low = 1.00-1.50

86
The treatment of green ware waste obtained a mean of 1.74 which means that close
to 75 percent of the industries employ higher level of technology in treating waste green
wares. This is followed by raw material waste which more ceramics industries employed
high technology. Slip clay waste and glost ware waste are the 3rd waste being treated with
high technology method. The lowest mean is in treating other solid waste followed by
biscuit waste and powder clay. Plastic clay and sediments obtained 1.67 mean rating each
which also means that high technology is employed in waste treatment.
The average of 1.68 indicates that greater majority employed high technology while
a few of about 30 percent employed the low technology in the treatment of solid waste.
Level of Technology Used in the Treatment of Liquid Waste
Similarly the ceramics industry use generally high level of technology in the
treatment of liquid waste.

87
Table 18.
Mean Perception on the Level of Technology Used in the Treatment of Liquid Waste
Indicator Weighted
Mean
Standard
Deviation
Interpretation
Level of technology used in the treatment of
liquid waste:
Washed water
Glaze
Other
1.69
1.70
1.00
0.63
0.63
0.00
High
High
Low
Average 1.4633 0.4355 Low
Legend: 2.51 - 3.00 Very high
1.51 - 2.50 High 1.00 - 1.50 Low
Of the two categories of liquid waste, glaze liquid waste is treated with higher
technology (x = 1.70) than the washed water (x = 1.69). This is due to the value of glaze
liquid waste which can be reused if carefully saved. Glaze materials are very dear. Its
higher cost is a factor that the industry considered. Glaze sediments or particles saved can
very much outweigh in cost saving value than saving a plain water for reuse.
Nevertheless, high technology in liquid waste treatment is employed by the ceramics
industries.
Waste Management-Related Factors
Management of waste in ceramics industries starts with a goal and objectives which
are spelled out in the Policy on Waste Management. Plans are formulated and implemented
to achieve the objectives which can be beneficial to both the industry and society.

88
Table 19 reveals the assessment of people in the industry on the management of
industrial waste with regard to policy formed plan in the management of waste and
implementation of such plan.
Table 19. Mean Evaluation of Waste Management in Terms of
Policy Instrument, Plan, and Implementation
Factors Weighted Mean Standard Deviation Interpretation
Policy instrument 4.02 .6521 Good
Plan 3.90 .7644 Good
Implementation 4.00 .6755 Good
Average 3.97 .6412 Good
Legend: 4.51 – 5.00 Very Good 3.51 – 4.50 Good
2.51 – 3.50 Fair 1.51 – 2.50 Poor
1.00 – 1.50 Very Poor
As far as the policy instrument is concerned in waste management, the employees in
the industry perceives the policy to be good (x = 4.02). This means that the policy is based
on legislative and regulatory provisions and is carried out on a commercial and competitive
basis. This also means that the policy stresses waste reduction, enforce the development
plan for was disposal, promotes good environmental waste disposal and produces
information on the sources, types and volumes of waste.
The waste management plan is perceived to be good (x = 3.90). This means that the
plan encompasses the entire program and characterizes all waste; identifies and evaluates

89
minimization options; obtains commitment of top management in setting goals, budgeting
and staffing, prepares schedules, worksheets and other necessary tools.
The implementation is also rated good. This means that the industry conducts
regular maintenance of all equipment; purchase materials that are easy to handle; buys
materials in bulk to minimize cost and demands quality control from suppliers. This also
means that the industry monitors program to check emissions and waste from operation,
documents results of plans and prepares progress report that includes a summary of waste
generated.
Effectiveness of Machines in the Treatment of Waste of Ceramics Industries
Success in dealing with industrial waste can also be affected by the process related
factor. The efficiency and effectiveness of machines used can be a factor. Table 20 shows
the level of effectiveness of machines used in the study.

90
Table 20. Mean Perceptions on the Effectiveness of Machines in Treating Solid Waste
Indicator Weighted
Mean
Standard
Deviation
Interpretation
Effective of machine used in treatment of
solid waste:
Raw material
Green ware
Biscuit ware
Glost ware
Powder clay
Slip clay
Plastic clay
Sediments
Other
2.15
2.19
1.95
2.11
2.18
2.16
2.10
2.07
1.60
0.62
0.60
0.63
0.62
0.65
0.67
0.57
0.64
0.55
Effective
Effective
Effective
Effective
Effective
Effective
Effective
Effective
Effective
Average 2.0567 0.4510 Effective
Legend: 2.51 - 3.00 Very effective
1.51 - 2.50 Effective 1.00 - 1.50 Ineffective
As perceived by the industry respondents, effective machines were used in the
treatment of solid waste particularly in dealing with green wares (x = 2.19). This is followed
by the machine used in the treatment of powder clay waste (x = 2.18); slip clay (x = 2.16)
and solid raw material waste with x = 2.15. The lowest effectiveness of machine is in the
treatment of biscuit wares with 1.95 mean effectiveness. This is indicated by the decision of
industry to dispose biscuit wares to landfill. The lack of more effective machine to recycle
the product with lesser cost is a deterrent factor in the recycling of biscuits. All of these
machines used in the treatment of solid waste, however, are all considered effective as

91
indicated by the mean rating of 2.114 in a scale of 3 with 1 as ineffective, 2 as effective, and
3 as very effective.
Table 21. Mean Perceptions on the Effectiveness of Machines in Treating Liquid Waste
Indicator Weighted
Mean
Standard
Deviation
Interpretation
Effective of machine that used in treatment
of liquid waste:
Washed water
Glaze
Other
2.06
2.03
1.00
0.58
0.63
0.00
Effective
Effective
Ineffective
Average 1.6967 0.4365 Effective
Legend: Very effective = 2.51-3.00
Effective = 1.51-2.50 Ineffective = 1.00-1.50
As gleaned from the table 21, the machines used in treating the liquid waste have
been perceived to be effective. Machine used in treating waste water from washing is rated
2.06 which means “effective”. Machines for treating waste from liquid glazes is similarly
considered effective (x = 2.03). The lower rating is affected by the practice of a few
ceramics industries of disposing liquid waste from glazes directly to the sewerage system.
Waste from liquid glaze however, is not as destructive and dangerous as those hazardous
waste of other industries. The technology development in ceramics have converted the use
of poisonous lead in its raw state to fritz which is non-poisonous and is considered
environment and workers friendly. Ceramics industry has come of age when workers’
safety has come to the fore of management and employed technology in reducing the hazard

92
in dealing with raw materials for glaze composition and application. Effluent in ceramics
industry does not contain mercury and hazardous chemical that will contaminate rivers and
sea water and imperil human and aquatic lives. Most of its effluent generally contain mud
that will settle down at the river banks to be mixed with soil.
Waste Management Performance
The waste management performance of the industry is evaluated in terms of cost-
saving effectiveness, environmental protection, and compliance to government regulations.
Table 22. Mean Perception on the Waste Management Performance of the Ceramics Industries
in Terms of Cost-saving Effectiveness, Environmental Protection and Compliance to Government Regulations
Solid Waste Liquid Waste Performance
Indicators x S.D. Interpretation x S.D. Interpretation
Cost-saving Effectiveness 3.01 .65 Effective 2.98 .65 Effective
Environmental Protection 2.97 .62 Effective 2.68 .63 Effective
Compliance to
Government Regulation
3.29 .58 Compliant 2.50 .63 Compliant
Legend: 3.51 – 4.00 Very Effective / Very compliant 2.51 – 3.50 Effective / Compliant
1.51 – 2.50 Ineffective / Less compliant 1.00 - 1.50 Very Ineffective / Not compliant
The data revealed that the performance of the waste management of ceramics
industries is good. The cost-saving effect of dealing with solid waste is rated 3.01 which is
interpreted as effective. This means that much has been saved from recycling of waste

93
particularly in dealing with raw materials, green wares, powder clay, slip clay, plastic clay
and sediments.
Cost-saving in dealing with liquid waste is rated 2.98 lower than solid waste. This
rating however is still within the effective adjectival range which means that in treating
liquid waste the industry still save on cost particularly on glaze compound in liquid form.
As rated by industry owners, managers, and head of departments (x = 2.97 of solid
waste, x = 2.68 of liquid waste), the waste treatment employed by the ceramics industries
are effective in protecting the environment. As perceived by industry employees and
residents in the neighborhood in table 23, the mean rating of 3.88 suggests that the industry
exercise control in preventing environmental pollution in its operation in terms of managing
their industrial solid and liquid waste. As revealed earlier, much of its solid waste are
recycled and those that are less useful are disposed to landfill. Ceramic waste are generally
odorless since most raw materials are inorganic in its physical composition.
Congruent to this finding is the assessment given as far as compliance to government
regulations is concerned. The respondents rated the waste management performance
favorably for both solid (x = 3.29) and liquid waste (x = 2.50). The lower mean rating given
to liquid can be explained by the fact that most ceramics industries dispose their liquid waste
to sewerage system without much treatment given. It is only in liquid glaze waste that high
technology treatment is given to conserve some expensive glaze compounds for reuse. The
overall rating indicates that generally the ceramics industries are compliant to government
rules and regulations as far as industrial waste and environment protection is concerned as
contained in government regulations.

94
Table 23. Mean Perception of Workers and Neighbors on the Waste Management Performance
of the Ceramics Industries
Performance Indicator Weighted
Mean
Standard
Deviation
Interpretation
1. Believes in protecting the environment
2. Follows environmental regulations
3. Cleans up emissions to help in the solution
of environmental problems
4. Informs employees/neighbors about
environmental issues so that they will adopt
a positive approach in solving
environmental problems
5. Involves itself in controlling environmental
pollution
6. Does not produces pollution in the
neighborhood
7. Adheres to society's legal and ethical
standards
8. Takes into account the needs of the
community
9. is accountable for the effects of
manufacturing ceramics
4.00
3.81
3.84
3.80
3.86
3.85
3.92
3.85
3.98
0.82
0.91
0.84
0.91
0.85
0.98
0.87
0.86
0.92
Good
Good
Good
Good
Good
Good
Good
Good
Good
Average 3.8781 0.6808 Good
Legend: 4.51 – 5.00 Very Good 3.51 – 4.50 Good
2.51 – 3.50 Fair 1.51 – 2.50 Poor
1.00 – 1.50 Very Poor

95
Predictors of Waste Management Performance
In this study, waste management performance is indicated by cost-saving
effectiveness of the waste treatment, environmental protection and compliance to
government regulations.
Predictors of Cost-saving Effectiveness
The stepwise multiple regression analysis revealed that among the independent
variables treated, only 2 predictors come out for the cost-saving effectiveness of waste
treatment as indicator of waste management performance.
Table 24. Regression of Cost-saving Effectiveness on Independent Variables
Predictor Beta t Sig.
Kind of Ceramic Waste .462 4.036 .000
Level of Technology .334 2.917 .005
Adjusted R Square = .427 F Value = 20.390 Sig. = .000
The kind of ceramic waste predicts the cost-saving effectiveness of waste treatment.
The beta coefficient of .462 with 4.036 t-value is highly significant with .000 exact
probability. This finding means that treatment of solid waste is more cost-saving effective
than the treatment of liquid waste. This implies that treating solid waste by recycling for
original purpose gives more benefit than treating liquid waste for whatever purpose.

96
Spending for more valuable returns is economically beneficial than spending for
lesser benefits. Water is more abundant in Thailand and cheaper in terms of service. Solid
waste if recycled can approximate in per unit value with the raw material purchased from
suppliers. This realistic valuation can explain for this statistical finding that recycling solid
waste is more cost effective than recycling liquid waste.
Another predictor of cost-saving effectiveness is the level of technology. The higher
the level of technology is the higher in the cost-saving effectiveness of the waste treatment.
The beta coefficient indicates that for every standard deviation unit increase in the level of
technology for waste treatment there is .334 standard deviation unit increase in cost benefit
of such waste treatment. This simply means that application of higher technology is more
cost beneficial than employing lower technology in both solid and liquid waste treatment.
More benefits then is enjoyed by ceramics industries that employ higher technology in waste
management.
The adjusted R square indicates that the kind of waste treated in combination with
the level of technology accounts for 42.7 percent of any change in cost benefit of treating
industry waste. The F value of 20.390 is significant at the .000 indicating the strength of the
identified predictors of waste management performance.
Predictors of Environmental Protection
Another indicator of waste management performance is its ability to protect the
physical environment. It is a social responsibility of business organization. It should not
only be concerned with what it can get but what good it can do to society. Factors that
predict such indicator of waste management performance is shown in Table 25 below.

97
Table 25. Regression of Environmental Protection on Independent Variables
Predictors Beta t Sig.
Level of Technology .397 3.298 .002
Kind of Ceramic Waste .364 3.021 .004
Adjusted R Square = .383 F Value = 16.850 Sig. = .000
The level of technology and kind of ceramic waste stood up to be strong predictors
of environmental protection. The beta coefficient indicates that for every standard deviation
unit increase in technology level, there is a .397 increase in environmental protection.
Application of higher technology in the management of ceramic waste is always beneficial
to both. Lesser discharge of solid waste, lesser environmental problem. As explained
earlier ceramics industries are more economical in the use of their material resources.
Recycling of materials reduces production costs and at the same time reducing waste for
disposal to landfill. There are only two ways of waste disposal for ceramics industry. One
for landfill and the second is integration of its water waste to the sewerage system to the
bigger body of water. The kind of waste predict the environmental protection performance
of waste management. The beta coefficient indicates that for every standard deviation unit
increase in recycling of solid waste there is an equivalent .364 standard deviation unit
increase in environmental protection. Liquid effluents somehow contribute to water
pollution but such pollution is not as hazardous as compared to food manufacturing
industries. More recycling of solid waste means no negative contribution to the natural
environment. Ceramic waste in reality is a good material for landfill particularly in

98
reclamation areas where dense materials such as sediments of clay and sand or pebbles as
well as rejected biscuit and glost ware are very useful. Unlike other industrial waste ceramic
waste is odorless inorganic and therefore does not contribute to the growth of bacteria both
airborne, in land or in water.
The adjusted R square indicates that the level of technology in combination with the
treatment of solid waste account for 38.3 percent of the variance in environmental protection
as indicative performance of waste management among ceramics industries in Thailand.
Predictors of Compliance to Government Regulations
Akin to environmental protection is the industries’ compliance to government
regulation in dealing with industrial waste. Example of this is the treatment of solid waste
before dumping to designated site and the treatment of liquid waste before disposal to the
sewerage system and into the river. Table 26 shows the same predictor of this waste
management performance indicator.
Table 26. Regression of Compliance to Government Regulation on Independent Variables
Predictors Beta t Sig.
Level of Technology .398 3.260 .002
Kind of Ceramic Waste .334 2.738 .009
Adjusted R Square = .351 F Value = 15.053 Sig. = .000

99
Again the level of technology employed and the kind of ceramic waste predicts the
waste management performance of the ceramics industries as indicated by the industries’
compliance with government regulation on waste disposal.
The beta coefficient indicates that for every unit increase in the level of technology
used in the treatment of ceramic waste there is a corresponding .398 standard deviation unit
increase in compliance with government regulations. This finding is logical. Ceramics
industries have to strive to meet government standard on the level of pollutants in industrial
waste for disposal. To meet such regulation, the management has to acquire higher
technology for the purpose. Such more does not only increase the benefit to the industry by
cost cutting by recycling waste and use for the same purpose but also for compliance to
government regulation which in effect contribute to the preservation of the environment.
Similarly, the type of waste predict the compliance to government regulation. For
every standard deviation unit increase in the treatment of solid waste, there is a
corresponding .334 standard deviation unit increase in the industries’ compliance to
government regulation on waste management. The initial findings indeed indicate that
ceramics industries can manage their industrial waste more efficiently and effectively. They
are effective in dealing with their industrial waste in terms of cost-saving effectiveness,
environmental protection and compliance to government regulations. The adjusted R square
indicates that the level of technology in combination with the kind of industrial waste
account for 35.10 percent of the variance in compliance to government regulation on
industrial waste disposal and management. The F value of 15.053 is significant at the .000
level.

100
This finding reveals the responsiveness of the ceramics industries to government
policies and regulations in dealing with industrial waste. While other industrial sectors pose
a big headache to the government, the ceramics industry is not. The use of electric kilns and
efficient utilization of gas fuel kilns does not contribute to air pollution as in the case of
other industries that belch thick smoke and smog that contribute to the air pollution.
Although industrial pollution is the trade off for technology development and productivity of
industries which relate to economic development of the country, the ceramics industries
show that they are environment friendly and are more efficient and effective in the
management of their industrial waste.