Embed Size (px)
Citation preview

Chapter 4
Processes and Technologies

2000 by Prentice-Hall, Inc 2
Process Strategy
Overall approach to producing goods and Overall approach to producing goods and servicesservices
Defines:Defines: Capital intensityCapital intensity Process flexibilityProcess flexibility Vertical integrationVertical integration Customer involvementCustomer involvement

2000 by Prentice-Hall, Inc 3
From Function to Process
Ma
nu
fact
uri
ng
Ac
co
un
tin
g
Sa
les
Pu
rch
as
ing
Product Development
Order Fulfillment
Supply Chain Management
Customer Service
FunctionFunction ProcessProcess
Figure 4.1Figure 4.1

2000 by Prentice-Hall, Inc 4
Types of Processes
ProjectsProjects Batch productionBatch production Mass productionMass production Continuous productionContinuous production

2000 by Prentice-Hall, Inc 5
PROJECT PROJECT BATCHBATCH MASS MASS CONTINUOUSCONTINUOUS
ProductProduct UniqueUnique Made to order Made to order Made to stock Made to stock CommodityCommodityCustomerCustomer One-at-a-timeOne-at-a-time Few individualsFew individuals Mass marketMass market Mass marketMass marketDemandDemand InfrequentInfrequent FluctuatesFluctuates StableStable Very stableVery stableVolumeVolume Very lowVery low Low to medLow to med HighHigh Very highVery highNo. of differentNo. of different InfiniteInfinite Many, variedMany, varied FewFew Very lowVery low productsproductsSystemSystem Long-termLong-term Discrete, jobDiscrete, job Repetitive, Repetitive, Process industryProcess industry
assembly linesassembly linesEquipmentEquipment VariedVaried General-purposeGeneral-purpose Special-purposeSpecial-purpose Highly automatedHighly automatedType of workType of work ContractsContracts FabricationFabrication AssemblyAssembly Mix, treat, refineMix, treat, refineSkillsSkills Experts,Experts, Wide rangeWide range Limited rangeLimited range EquipmentEquipment
craftspeoplecraftspeople of skillsof skills of skillsof skills monitorsmonitorsAdvantagesAdvantages Custom work,Custom work, Flexibility,Flexibility, Efficiency,Efficiency, Highly efficientHighly efficient
technologytechnology qualityquality speed, low costspeed, low cost large capacitylarge capacityDis-Dis- Nonrepetitive,Nonrepetitive, Costly, slow,Costly, slow, Capital investment,Capital investment, Difficult toDifficult to advantagesadvantages small customersmall customer difficult todifficult to lack of lack of changechange
base, expensivebase, expensive managemanage responsivenessresponsivenessExampleExample Construction,Construction, Machine shops, Machine shops, Autos, TV’s,Autos, TV’s, Paint, chemicals, Paint, chemicals,
shipbuildingshipbuilding printing, bakeryprinting, bakery fast foodfast food foodfood
Types of ProcessesTypes of Processes
Table 4.1Table 4.1

2000 by Prentice-Hall, Inc 6
Process Selection with Break-Even Analysis
ccff = fixed cost= fixed cost
vv = volume (i.e., number of units produced and = volume (i.e., number of units produced and sold)sold)ccvv = variable cost per unit= variable cost per unit
pp = price per unit= price per unit
Total costTotal cost = fixed cost + total variable cost= fixed cost + total variable costTCTC = = ccff + + vcvcvv
Total revenueTotal revenue == volume x pricevolume x priceTRTR = = vpvp
ProfitProfit = total revenue - total cost= total revenue - total costZZ == TR - TCTR - TC
= = vpvp - ( - (ccff + + vcvcvv))

2000 by Prentice-Hall, Inc 7
Process Planning
Make-or-buy decisionsMake-or-buy decisions Process selectionProcess selection Specific equipment selectionSpecific equipment selection Process plansProcess plans Process analysisProcess analysis
2000 by Prentice-Hall, Inc 8
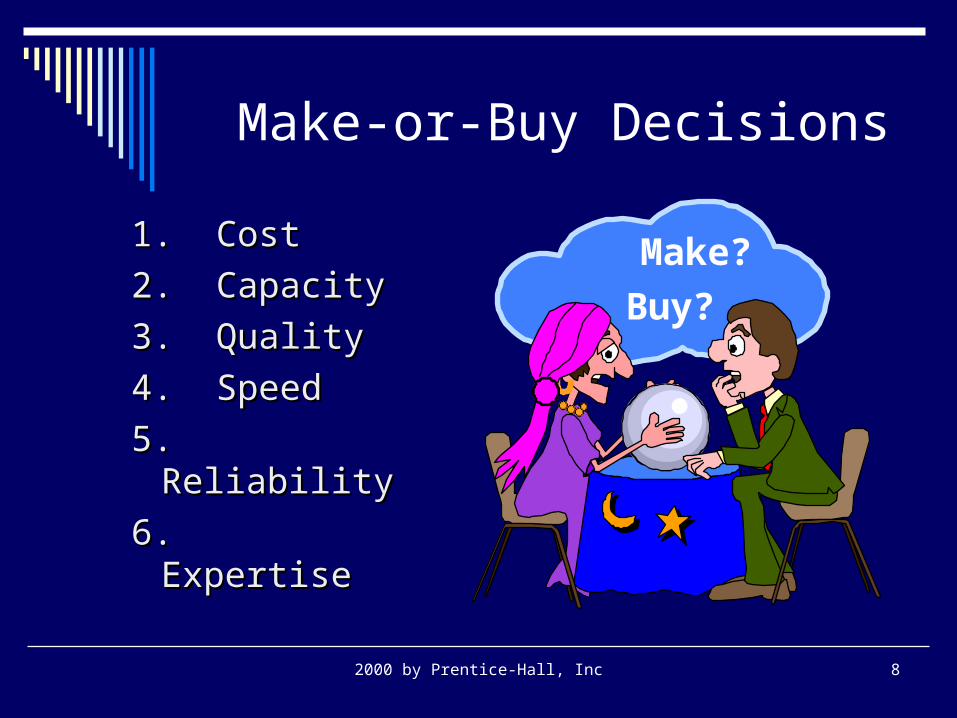
Make-or-Buy Decisions
1. Cost1. Cost
2. Capacity2. Capacity
3. Quality3. Quality
4. Speed4. Speed
5. Reliability5. Reliability
6. Expertise6. Expertise
Make?
Buy?

2000 by Prentice-Hall, Inc 9
Specific Equipment Selection
1.1. Purchase costPurchase cost
2.2. Operating costOperating cost
3.3. Annual savingsAnnual savings
4.4. Revenue enhancementRevenue enhancement
5.5. Replacement analysisReplacement analysis
6.6. Risk and uncertaintyRisk and uncertainty
7.7. Piecemeal analysisPiecemeal analysis
2000 by Prentice-Hall, Inc 10
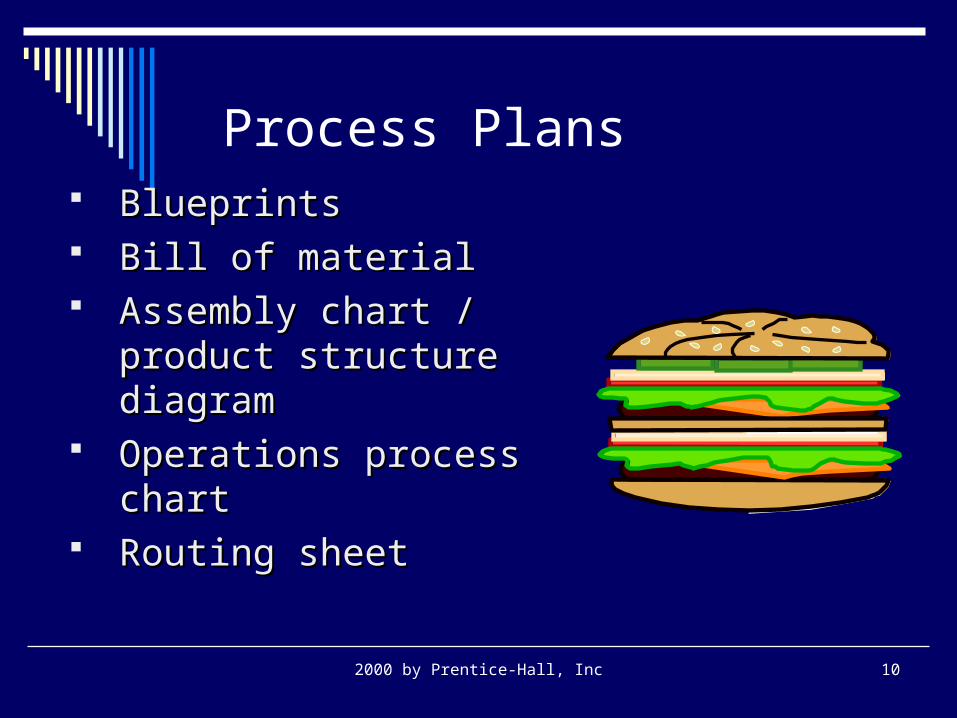
Process Plans BlueprintsBlueprints Bill of materialBill of material Assembly chart /Assembly chart /
product structure diagramproduct structure diagram Operations process chartOperations process chart Routing sheetRouting sheet

2000 by Prentice-Hall, Inc 11
Process Plans
Figure 4.2Figure 4.2
Bottom bunBottom bun
Beef pattyBeef pattySaltSaltCheeseCheese
LettuceLettuceSauceSauceOnionsOnions
Middle bunMiddle bun
Beef pattyBeef pattySaltSaltCheeseCheese
LettuceLettuceSauceSauceOnionsOnionsPicklesPickles
Sesame seed top bunSesame seed top bun
WrapperWrapper
SASA
SASA
First-layer assemblyFirst-layer assembly
Second-layer assemblySecond-layer assembly
Completed Big MacCompleted Big Mac

2000 by Prentice-Hall, Inc 12
Operations Process ChartPart name Crevice Tool
Part No. 52074
Usage Hand-Vac
Assembly No. 520
Oper. No. Description Dept. Machine/Tools Time
10 Pour in plastic bits 041 Injection molding 2 min
20 Insert mold 041 #076 2 min
30 Check settings 041 113, 67, 650 20 min& start machine
40 Collect parts & lay flat 051 Plastics finishing 10 min
50 Remove & clean mold 042 Parts washer 15 min
60 Break off rough edges 051 Plastics finishing 10 min
Figure 4.3Figure 4.3

2000 by Prentice-Hall, Inc 13
Process Analysis
The systematic examination of all aspects The systematic examination of all aspects of a process to improve its operationof a process to improve its operation FasterFaster More efficientMore efficient Less costlyLess costly More responsiveMore responsive
Basic toolsBasic tools Process flowchartProcess flowchart Process diagramsProcess diagrams Process mapsProcess maps
2000 by Prentice-Hall, Inc 14
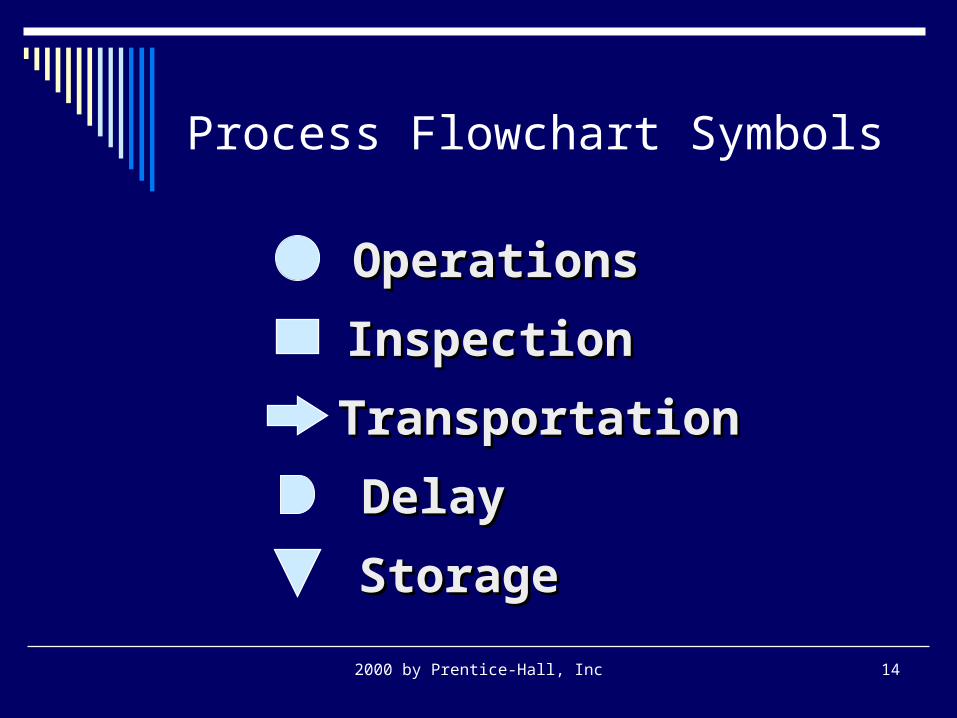
Process Flowchart Symbols
OperationsOperations
InspectionInspection
TransportationTransportation
DelayDelay
StorageStorage

2000 by Prentice-Hall, Inc 15
Process Flowchart
Ste
p
Op
erat
ion
Tra
nsp
ort
Insp
ect
Del
ay
Sto
rag
e
Dis
tan
ce(f
eet)
Tim
e(m
in)Description
ofprocess
1
2
3
4
5
6
7
8
9
10
11
Unload apples from truck
Move to inspection station
Weigh, inspect, sort
Move to storage
Wait until needed
Move to peeler
Apples peeled and cored
Soak in water until needed
Place in conveyor
Move to mixing area
Weigh, inspect, sort
TotalPage 1 0f 3 480
30
5
20
15
360
30
20
190 ft
20 ft
20 ft
50 ft
100 ft
Date: 9-30-02Analyst: TLR
Location: Graves MountainProcess: Apple Sauce
Figure 4.4Figure 4.4

2000 by Prentice-Hall, Inc 16
Process Diagram
Reserve Storage
Quality Assurance
Back to Vendor
UPS
Parcel Post
Next-Day UPS
Mono-gramming
Embroid-ering
Hemming
Gift Boxing
Receiving Active Bins Picking Packing Shipping
Figure 4.5Figure 4.5

2000 by Prentice-Hall, Inc 17
Process Map
Figure 4.6Figure 4.6
Place order
Drink
Eat salad or soup
Eat dinner
Receives check
Gives payment to waiter
Collect change, leave tip
Fill in tip amount
Give order to waiter
Prepare dinner order
Prepare soup or salad order
Give order to waiter
Is order complete?
Give soup or salad order to chef
Give dinner order to chef
Get drinks for customer
Deliver salad or soup order to customer
Deliver dinner to customer
Deliver check to customer
Receive payment for meal
Cash or Credit?
Bring change to customer
Run credit card through
Return credit slip to customer
Collect tip
YY
NN
CreditCredit
CashCash
CustomerCustomer WaiterWaiter Salad ChefSalad Chef Dinner ChefDinner Chef

2000 by Prentice-Hall, Inc 18
Continuous Improvement and Breakthroughs
Breakthrough Breakthrough ImprovementImprovement
Continuous improvement Continuous improvement refines the breakthroughrefines the breakthrough
Continuous improvement activities Continuous improvement activities peak; time to reengineer processpeak; time to reengineer process
Figure 4.9Figure 4.9

2000 by Prentice-Hall, Inc 19
Process Reengineering
Model validation
Key performance
measures
Detailed process map
Detailed process map
Pilot study of new design
Full-scale implementation
Innovative ideas
Design principle
s
High-level process map
High-level process map
Customer requirements
data
Strategic directive
Baseline analysis
Benchmark data
Goals & specifications for process performance
Figure 4.10Figure 4.10

2000 by Prentice-Hall, Inc 20
Principles for Redesigning Processes
1.1. Remove waste, simplify, consolidateRemove waste, simplify, consolidate2.2. Link processes to create valueLink processes to create value3.3. Let the swiftest and most capable executeLet the swiftest and most capable execute4.4. Flex the processFlex the process5.5. Capture information digitally and propagateCapture information digitally and propagate
Table 4.2Table 4.2

2000 by Prentice-Hall, Inc 21
Principles for Redesigning Processes
6.6. Provide visibility through information about Provide visibility through information about process statusprocess status
7.7. Fit the process with sensors and feedback loopsFit the process with sensors and feedback loops8.8. Add analytic capabilitiesAdd analytic capabilities9.9. Connect, collect and create knowledge around Connect, collect and create knowledge around
the processthe process10.10. Personalize the processPersonalize the process
Table 4.2Table 4.2

2000 by Prentice-Hall, Inc 22
Techniques for Generating Innovative Ideas
Vary entry point to a problemVary entry point to a problem Draw analogiesDraw analogies Change your perspectiveChange your perspective Try inverse brainstormingTry inverse brainstorming Chain forward as far as possibleChain forward as far as possible Use attribute brainstormingUse attribute brainstorming
Table 4.3Table 4.3

2000 by Prentice-Hall, Inc 23
e-Manufacturing
Real-time sharing of data with trading partners Real-time sharing of data with trading partners and customers to drive collaborative decisionsand customers to drive collaborative decisions
CAD -CAD - uses software to create & modify designsuses software to create & modify designs GT-GT- classifies designs to benefit from prior experienceclassifies designs to benefit from prior experience STEP - sets standards for communicationSTEP - sets standards for communication CAPP - creates processing instructions for CAMCAPP - creates processing instructions for CAM CAM -CAM - uses programmable automation in manufacturinguses programmable automation in manufacturing

![Pancreatic cancer: What defines resectabilityWhat defines …gicancers.org/syllabus/1[1].1 Evans.Pancreatic Cancer.pdf · 2010-11-01 · Pancreatic cancer: What defines resectabilityWhat](https://img.pdfslide.net/doc/110x75/5f57a92ea7197928bc5ea35f/pancreatic-cancer-what-defines-resectabilitywhat-defines-11-evanspancreatic.jpg)


![Pancreatic cancer: What defines resectabilityWhat …1].1 Evans.Pancreatic Cancer.pdfPancreatic cancer: What defines resectabilityWhat defines ... SMA margin uninvolved with distance](https://img.pdfslide.net/doc/110x75/5ad222427f8b9a72118cc0ad/pancreatic-cancer-what-defines-resectabilitywhat-11-evanspancreatic-cancerpdfpancreatic.jpg)