Embed Size (px)
Citation preview

Integrated Resource Plan
Chapter 4
Resource Planning Analysis Framework
Chapter 4 - Resource Planning Analysis Framework
Integrated Resource Plan Page 4-i
August 2013
Table of Contents
4.1 Introduction .................................................................................................. 4-1 4.2 Short Term Energy Supply Management ..................................................... 4-2
4.2.1 Short Term Load Resource Balances .......................................... 4-3 4.2.2 Key Questions to be Addressed Over the Short to Mid-
Term Planning Horizon ................................................................ 4-6 4.2.3 Key Decision Objectives to Design and Compare Options .......... 4-6
4.2.3.1 Financial Impacts ..................................................... 4-7 4.2.3.2 Economic Development Impacts ............................. 4-7 4.2.3.3 Maximize System Reliability .................................... 4-8 4.2.3.4 Maintain or Improve Relationships........................... 4-8 4.2.3.5 Maximize Equity of Opportunities ............................ 4-8 4.2.3.6 IRP Treatment of Multiple Decision Objectives ........ 4-9
4.2.4 Key Uncertainties Over the Short to Mid-Term Planning Horizon ........................................................................................ 4-9
4.2.5 Methods to Reduce Costs Over the Short to Mid-Term Planning Period .......................................................................... 4-10 4.2.5.1 Reduce Spending on EPAs ................................... 4-10 4.2.5.2 Delay Planned Ramp-ups in Spending on
DSM Activities ....................................................... 4-17 4.2.5.3 Scale Back Voltage and Var Optimization
project implementation ........................................... 4-22 4.2.5.4 Customer Incentive Mechanisms ........................... 4-23
4.2.6 Short Term Energy Supply Management: Summary and Conclusions ............................................................................... 4-26
4.3 Long Term Resource Planning Analysis Framework ................................. 4-29 4.3.1 Key Long Term Resource Planning Questions .......................... 4-29 4.3.2 Comparing Alternatives Using Multiple Planning Objectives ...... 4-31
4.3.2.1 Financial Impacts ................................................... 4-32 4.3.2.2 Environmental Footprint ......................................... 4-32 4.3.2.3 Economic Development Impact ............................. 4-32 4.3.2.4 IRP Treatment of Multiple Decision Objectives ...... 4-33
4.3.3 Key Uncertainties and Risks ...................................................... 4-35 4.3.4 Quantifying Uncertainty .............................................................. 4-36
4.3.4.1 Load Forecast Uncertainty ..................................... 4-37 4.3.4.2 DSM Savings Uncertainty ...................................... 4-40 4.3.4.3 Net Load and Net Gap Uncertainty ........................ 4-49

Chapter 4 - Resource Planning Analysis Framework
Integrated Resource Plan Page 4-ii
August 2013
4.3.4.4 Market Price Forecast Uncertainty......................... 4-53 4.3.4.5 Wind Integration Cost and ELCC Uncertainty ........ 4-54 4.3.4.6 IPP Attrition Uncertainty ......................................... 4-54 4.3.4.7 Resource Options .................................................. 4-55
4.3.5 Applying the Resource Planning Analysis Framework to Comparing Alternatives .............................................................. 4-55
4.4 Portfolio Analysis Methodology and Assumptions ...................................... 4-57 4.4.1 Portfolio Analysis Models ........................................................... 4-57 4.4.2 Modelling Constraints ................................................................ 4-58 4.4.3 Financial Parameters ................................................................. 4-59
4.4.3.1 Inflation Rate ......................................................... 4-59 4.4.3.2 Cost of Capital ....................................................... 4-60 4.4.3.3 Discount Rate ........................................................ 4-60 4.4.3.4 U.S./Canadian Exchange Rate .............................. 4-61
4.4.4 Load/Resource Assumptions ..................................................... 4-61 4.4.5 Market Price Assumptions ......................................................... 4-61 4.4.6 Resource Options ...................................................................... 4-61
4.4.6.1 Available Resource Options .................................. 4-62 4.4.6.2 Resource Option Attributes .................................... 4-64
4.4.7 Transmission Analysis ............................................................... 4-66
List of Figures
Figure 4-1 Energy Surplus/Deficit with Incremental Resources .................... 4-4 Figure 4-2 Capacity Surplus/Deficit with Incremental Resources .................. 4-5 Figure 4-3 Energy Surplus/Deficit with Incremental Resources .................. 4-27 Figure 4-4 Capacity Surplus/Deficit with Incremental Resources ................ 4-28 Figure 4-5 Range of Uncertainty Regarding Energy Load Forecast ............ 4-38 Figure 4-6 Range of Uncertainty Regarding Capacity Load Forecast ......... 4-39 Figure 4-7 Range of Potential Energy Savings for DSM Option 2 ............... 4-43 Figure 4-8 Range of Potential Capacity Savings for DSM Option 2 ............ 4-45 Figure 4-9 Energy Gap ................................................................................ 4-51 Figure 4-10 Capacity Gap ............................................................................. 4-52 Figure 4-11 Modelling Map and Base Modelling Assumptions ...................... 4-56

Chapter 4 - Resource Planning Analysis Framework
Integrated Resource Plan Page 4-iii
August 2013
List of Tables
Table 4-1 Detailed Assumptions Regarding Incremental Resources in F2017 ........................................................................................... 4-3
Table 4-2 Energy Surplus/Deficit with Incremental Resources, GWh .......... 4-5 Table 4-3 Capacity Surplus/Deficit with Typical Incremental
Resources, MW ........................................................................... 4-6 Table 4-4 CEA and Other Resource Planning Objectives ............................ 4-7 Table 4-5 Expected Energy from Pre-COD EPA Terminations and
Deferrals, GWh .......................................................................... 4-14 Table 4-6 Expected Capacity from Pre-COD EPA Terminations and
Deferrals, MW ............................................................................ 4-14 Table 4-7 EPA Renewal Energy Differences (F2017 – F2023,
F2028, F2033), GWh ................................................................. 4-15 Table 4-8 EPA Renewal Capacity Differences (F2017 – F2023,
F2028, F2033), MW ................................................................... 4-16 Table 4-9 New SOP EPA Energy Differences (F2017 to F2023,
F2028, F2033), GWh ................................................................. 4-17 Table 4-10 New SOP EPA Capacity Differences (F2017 to F2023,
F2028, F2033), MW ................................................................... 4-17 Table 4-11 Energy Surplus/Deficit with DSM Options, GWh ........................ 4-18 Table 4-12 DSM Plan Energy Differences (F2017 to F2023, F2028,
F2033), GWh ............................................................................. 4-21 Table 4-13 DSM Plan Capacity Differences (F2017 to F2023, F2028,
F2033), MW ............................................................................... 4-21 Table 4-14 VVO Energy Differences (F2017 to F2023, F2028, F2033),
GWh ........................................................................................... 4-23 Table 4-15 VVO Capacity Differences (F2017 to F2023, F2028,
F2033), MW ............................................................................... 4-23 Table 4-16 Cumulative Changes to Incremental Resource Additions,
Energy (F2017 to F2023, F2028, F2033), GWh......................... 4-26 Table 4-17 Cumulative Changes to Incremental Resource Additions,
Capacity (F2017 to F2023, F2028, F2033), MW ........................ 4-26 Table 4-18 Energy Surplus/Deficit (F2017 to F2023, F2028, F2033),
GWh ........................................................................................... 4-27 Table 4-19 Capacity Surplus/Deficit (F2017 to F2023, F2028, F2033),
GWh ........................................................................................... 4-28 Table 4-20 CEA and Other Resource Planning Decision Objectives ........... 4-31 Table 4-21 Example Consequence Table .................................................... 4-34 Table 4-22 Approaches to Handling Uncertainty .......................................... 4-36

Chapter 4 - Resource Planning Analysis Framework
Integrated Resource Plan Page 4-iv
August 2013
Table 4-23 Savings from Capacity-Focused DSM and Uncertainty (MW in F2021) .................................................................................... 4-47
Table 4-24 Gap Terminology ....................................................................... 4-49 Table 4-25 IPP Attrition Rates and Uncertainty (per cent) ........................... 4-55

Chapter 4 - Resource Planning Analysis Framework
Integrated Resource Plan Page 4-1
August 2013
4.1 Introduction 1
BC Hydro’s planning environment is dominated by three overarching uncertainties —2
load growth, DSM deliverability and market conditions. This chapter sets out the 3
analytical framework that BC Hydro used to compare resource alternatives, 4
addressing multiple objectives, attributes and uncertainties. The following four 5
criteria were adhered in the analysis: 6
• Meeting BC Hydro’s planning criteria (as described in section 1.2.2) 7
• Achieving the Clean Energy Act (CEA) subsection 6(2) self-sufficiency of 8
electricity supply1 9
• Meeting CEA subsection 2(c) 93 per cent clean or renewable energy objective 10
• Ensuring that at least 66 per cent of BC Hydro’s expected incremental load 11
growth is met by DSM as set out in subsection 2(b) of the CEA 12
As this chapter demonstrates, BC Hydro has sufficient resources to meet growing 13
electricity demand over the short to mid-term2 planning period, but will need to 14
acquire new resources towards the middle and end of the planning horizon 15
assuming implementation of the Demand Side Measures (DSM) target and 16
Electricity Purchase Agreement (EPA) renewal assumptions described in this 17
chapter, with or without Expected LNG. This splits the analytical framework into two 18
separate but interrelated parts, focused on shorter term and longer term planning 19
issues. 20
The remainder of this chapter is organized as follows: 21
1 Except as noted in the section 8.2.7 recommendation concerning the two-year economic bridging to Site C’s
ISD. 2 For the purposes of this document, events occurring before F2018 are considered short-term and events
occurring beyond F2023 are considered long-term. The boundaries between short, mid and long term are treated loosely as no analytic results turn on their exact definitions.
Chapter 4 - Resource Planning Analysis Framework
Integrated Resource Plan Page 4-2
August 2013
• Section 4.2 covers the short to mid-term planning period and outlines the key 1
questions, decision objectives, uncertainties and the planning analysis 2
framework over that period, with an emphasis on managing costs. It presents 3
the associated analyses and recommendations, and concludes with 4
recommended short-term actions and options to manage costs 5
• Sections 4.3 to 4.4 focus on the long-term and outline the key questions, 6
decision objectives, uncertainties, and planning analysis framework to 7
address resource planning questions over that period 8
Building on this chapter, Chapter 6 takes the short-term cost management 9
conclusions and describes the analysis undertaken to determine what actions and 10
resources should be considered to meet the identified need for energy and capacity 11
over the longer term. The framework described in this chapter, and the 12
corresponding results presented in Chapter 6, led BC Hydro to select the 13
Recommended Actions that are found in Chapter 8. 14
4.2 Short Term Energy Supply Management 15
The Load-Resource Balances (LRBs) shown in Chapter 2 establish that a gap exists 16
for energy and for capacity from the start of the planning period in F2017 and 17
onward before accounting for DSM and the other incremental resources described in 18
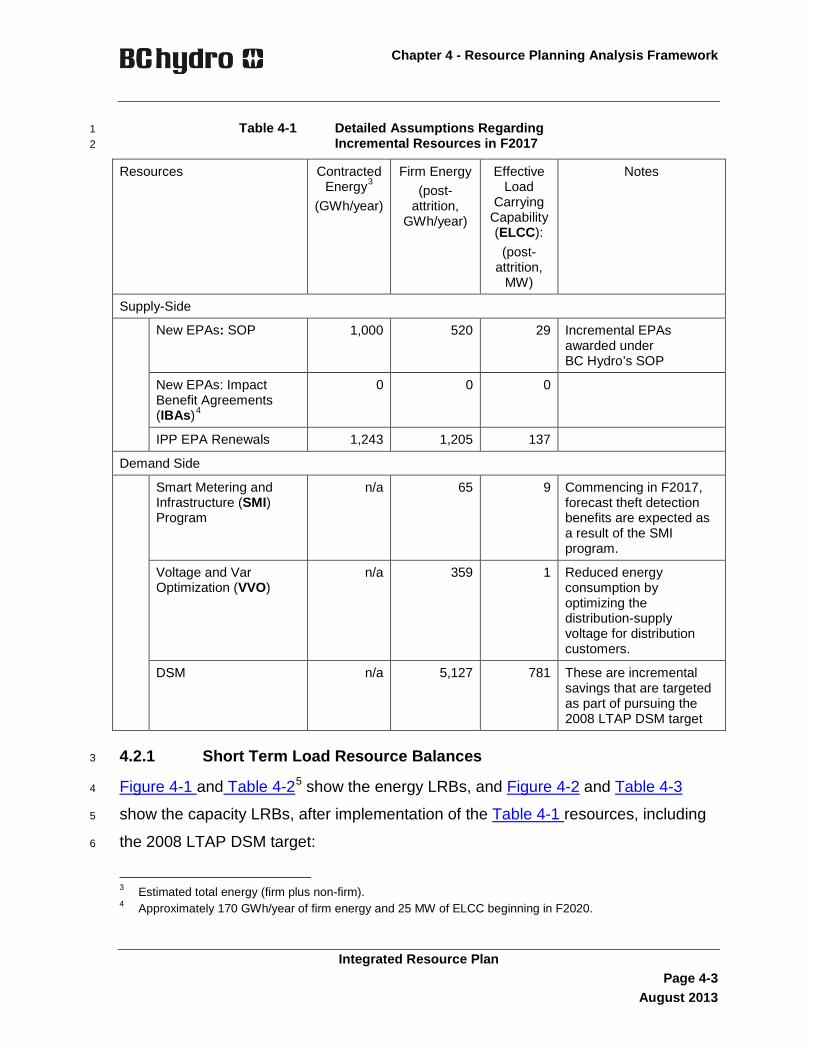
Table 4-1. The resources listed below in Table 4-1 have volumes that are generated 19
for illustrative purposes, but that correspond to the quantity of cost-effective 20
resources available at or below the Long Run Marginal Cost (LRMC) price of 21
$135/MWh that was used by BC Hydro in the past based on the Clean Power Call 22
results. As such, they form a baseline of “typical” resource planning volumes against 23
which alternative short-term expenditures can be compared. 24
Chapter 4 - Resource Planning Analysis Framework
Integrated Resource Plan Page 4-3
August 2013
Table 4-1 Detailed Assumptions Regarding 1 Incremental Resources in F2017 2
Resources
Contracted Energy3
(GWh/year)
Firm Energy (post-
attrition, GWh/year)
Effective Load
Carrying Capability (ELCC):
(post-attrition,
MW)
Notes
Supply-Side
New EPAs: SOP 1,000 520 29 Incremental EPAs awarded under BC Hydro’s SOP
New EPAs: Impact Benefit Agreements (IBAs)4
0 0 0
IPP EPA Renewals 1,243 1,205 137
Demand Side
Smart Metering and Infrastructure (SMI) Program
n/a 65 9 Commencing in F2017, forecast theft detection benefits are expected as a result of the SMI program.
Voltage and Var Optimization (VVO)
n/a 359 1 Reduced energy consumption by optimizing the distribution-supply voltage for distribution customers.
DSM n/a 5,127 781 These are incremental savings that are targeted as part of pursuing the 2008 LTAP DSM target
4.2.1 Short Term Load Resource Balances 3
Figure 4-1 and Table 4-25 show the energy LRBs, and Figure 4-2 and Table 4-3 4
show the capacity LRBs, after implementation of the Table 4-1 resources, including 5
the 2008 LTAP DSM target: 6
3 Estimated total energy (firm plus non-firm). 4 Approximately 170 GWh/year of firm energy and 25 MW of ELCC beginning in F2020.

Chapter 4 - Resource Planning Analysis Framework
Integrated Resource Plan Page 4-4
August 2013
• The Table 4-1 incremental resources address the energy and capacity gap 1
without Expected LNG until F2025 and F2021 respectively, with temporary 2
planning surpluses in the near and mid-term 3
• A temporary planning surplus continues to exist with Expected LNG of 3,000 4
GWh/year and 360 MW - the energy and capacity gaps emerge in F2022 and 5
F2020 respectively 6
As there is no need for incremental resources in the near to mid-term of the planning 7
horizon, the inclusion of these incremental resources bears scrutiny to reduce costs 8
in the short-term, regardless of the potential demand from LNG. 9
Figure 4-1 Energy Surplus/Deficit with Incremental 10 Resources 11
5 BC Hydro has summarized LRBs and surplus/deficit values in this chapter with respect to key milestone
years: F2017 (self-sufficiency target year and start of the planning horizon) through F2023; F2028; and F2033 (final year of the planning horizon).

Chapter 4 - Resource Planning Analysis Framework
Integrated Resource Plan Page 4-5
August 2013
Table 4-2 Energy Surplus/Deficit with Incremental 1 Resources, GWh 2
F2017 F2018 F2019 F2020 F2021 F2022 F2023 F2028 F2033
Surplus/Deficit with Typical Incremental Resources and Expected LNG 6,913 5,351 3,899 2,101 406 -1,298 -2,056 -4,427 -8,706
Surplus/Deficit with Typical Incremental Resources without Expected LNG 6,913 5,351 3,899 3,101 2,406 1,702 944 -1,427 -5,706
Figure 4-2 Capacity Surplus/Deficit with Incremental 3 Resources 4

Chapter 4 - Resource Planning Analysis Framework
Integrated Resource Plan Page 4-6
August 2013
Table 4-3 Capacity Surplus/Deficit with Typical 1 Incremental Resources, MW 2
F2017 F2018 F2019 F2020 F2021 F2022 F2023 F2028 F2033
Surplus/Deficit with Typical Incremental Resources and Expected LNG 340 235 85 -113 -284 -508 -663 -1,222 -2,137
Surplus/Deficit with Typical Incremental Resources without Expected LNG 340 235 85 7 -44 -148 -302 -861 -1,777
The following sections describe ways in which short-term costs can be reduced 3
through various actions. 4
4.2.2 Key Questions to be Addressed Over the Short to Mid-Term 5
Planning Horizon 6
BC Hydro explored four sets of actions for reducing costs over the short to mid-term 7
planning horizon: 8
(a) Reduce spending on IPP resources 9
(b) Delay planned ramp ups in spending on DSM initiatives 10
(c) Scale back implementation of BC Hydro’s VVO Program 11
(d) Create industrial customer incentive mechanisms to temporarily increase 12
demand 13
The following three sections lay out the framework for creating and comparing 14
different options. 15
4.2.3 Key Decision Objectives to Design and Compare Options 16
Chapter 1 describes the sources and rationale for considering multiple planning 17
objectives within this IRP, including: the CEA British Columbia’s energy objectives 18
and requirements; good utility practice; and statutory obligations like the Utilities 19
Commission Act (UCA) service obligation. Table 4-4 presents decision objectives 20
compiled by BC Hydro to inform either the design or the comparison of methods to 21

Chapter 4 - Resource Planning Analysis Framework
Integrated Resource Plan Page 4-7
August 2013
reduce energy portfolio expenditures over the short to mid-term planning horizon of 1
this IRP. 2
Table 4-4 CEA and Other Resource Planning 3 Objectives 4
Decision Objective Reason for Inclusion
Minimize Financial Impacts, including: • Cost (various measures) • Cost Uncertainty
Good utility practice; First Nations, public and stakeholder interests; align with CEA ‘ratepayer’ objectives grouped in Table 1-1
Maximize Economic Development • Foster development of First Nations’ communities • Foster Development of rural communities
First Nations, public and stakeholder interests; align with CEA ‘economic development’ objectives grouped in Table 1-1
Maximize System Reliability • Minimize DSM Deliverability Risk
Good utility practice; First Nations, public and stakeholder interests
Maintain or Improve Relationships • Customers • IPP Industry • First Nations
Good utility practice; First Nations, public and stakeholder interests
Maximize Equity of Opportunities Good utility practice; First Nations, public and stakeholder interests
4.2.3.1 Financial Impacts 5
The CEA and good utility practice point towards the importance of tracking costs 6
when comparing resource options. Costs are expressed on a Present Value (PV) 7
basis to capture the impact of the timing of costs and trade revenues over the 8
planning horizon. Where uncertainty is relevant, cost ranges or costs across 9
scenarios are highlighted. 10
4.2.3.2 Economic Development Impacts 11
Consistent with subsection 2(k) and 2(f) of the CEA, BC Hydro considered the 12
economic development potential of resources, and the development of First Nations 13
and rural communities through the use of clean or renewable resources. Some 14
future potential IPP EPAs are tied to Impact Benefits Agreements (IBAs) signed with 15
specific First Nations. The existence of these IBAs was one of several factors used 16

Chapter 4 - Resource Planning Analysis Framework
Integrated Resource Plan Page 4-8
August 2013
to determine which IPP EPAs would be included as resources during the near to 1
mid-term period of the planning horizon when self-sufficiency needs are met. 2
4.2.3.3 Maximize System Reliability 3
BC Hydro treats the planning criteria described in section 1.2.2 as a constraint that is 4
not traded off against other objectives. However, some resource choices can work 5
towards or against achieving reliability beyond the planning criteria; once the 6
planning criteria are met, reliability can be traded off against other objectives. In this 7
IRP, such instances might occur over the short to mid-term planning horizon, 8
depending on the degree to which DSM is included in the portfolio. 9
4.2.3.4 Maintain or Improve Relationships 10
The ability of BC Hydro to meet future energy and capacity needs is tied to the 11
business relationships it has developed to pursue supply-side resources and DSM 12
initiatives. On the supply-side, maintaining BC Hydro’s business reputation 13
(including relationships with IPPs) was one consideration when assessing how EPAs 14
would be handled during the near to mid-term planning period. On the demand-side, 15
maintaining ties to industry that would allow BC Hydro to ramp up future DSM 16
activities was a key design criterion for the short-term period over which DSM 17
expenditures are to be moderated. 18
4.2.3.5 Maximize Equity of Opportunities 19
Equity was an important design criterion for DSM and potential customer incentive 20
mechanisms: 21
• Access to DSM initiatives in general, and the inclusion of a low income DSM 22
program in particular, were key design criteria used to ensure customers 23
would have access to DSM opportunities to lower their bills 24
• Section 4.2.5.4 discusses potential incentive mechanisms for customers to 25
access, on a temporary basis, energy in excess of BC Hydro’s system needs. 26

Chapter 4 - Resource Planning Analysis Framework
Integrated Resource Plan Page 4-9
August 2013
One design criterion for such incentive mechanisms will be that access to 1
them does not unfairly benefit particular companies within an industrial 2
sector. 3
4.2.3.6 IRP Treatment of Multiple Decision Objectives 4
BC Hydro used the decision objectives described in sections 4.2.3.1 to 4.2.3.5 to 5
design and compare optional ways of reducing costs over the short-term. Consistent 6
with the BCUC’s approach and as highlighted in Table 1-1, the goal is not to arrive at 7
the least cost solution, but rather the most cost-effective solution. Since the role of 8
these objectives in the design of options and the impact of the options on these 9
objectives have not been quantified in many cases, the appropriate balance 10
amongst these objectives to achieve the most cost-effective solution has been a 11
matter of professional judgment. 12
4.2.4 Key Uncertainties Over the Short to Mid-Term Planning Horizon 13
To provide a clear discussion of the uncertainties and risks that BC Hydro is 14
managing, the following definitions are provided: 15
• Uncertainties are variables with unknown outcomes 16
• Risk is commonly defined as the effect of uncertainty on objectives. 17
Some key uncertainties and related risks for addressing resource needs over the 18
short to mid-term include: 19
(a) Cost risk - in particular the chance that activities to generate short-term cost 20
reductions (e.g., reduction in DSM activities, temporary load additions) are 21
more than offset by future cost increases 22
(b) Load growth and the chance that load growth exceeds or falls below 23
expectations 24

Chapter 4 - Resource Planning Analysis Framework
Integrated Resource Plan Page 4-10
August 2013
(c) DSM initiatives and the uncertainty whether DSM savings can be ramped up 1
quickly to higher levels of savings in response to emerging energy and capacity 2
needs 3
(d) IPP attrition rates from power acquisition processes and the chance that they 4
are lower than expected, adding to cost through additional energy purchases 5
when the energy is not needed 6
4.2.5 Methods to Reduce Costs Over the Short to Mid-Term Planning 7
Period 8
This section lays out the framework used to assess potential actions and displays 9
anticipated changes to the LRBs. It concludes with the cumulative impacts to the 10
LRBs. 11
4.2.5.1 Reduce Spending on EPAs 12
One potential method considered to decrease energy costs during the short to mid-13
term period after self-sufficiency is achieved is to reduce spending on the contracted 14
energy supply (EPAs). This section identifies three categories of potential 15
opportunities to reduce EPA volume and/or cost and then addresses the method for 16
identifying and selecting specific reduction opportunities. It concludes with a 17
summary of how actions taken to date and actions recommended within this IRP will 18
impact the LRB. 19
BC Hydro identified three categories of potential EPA portfolio supply reductions: 20
(i) Pre-COD EPAs where there is some ability to defer Commercial Operation 21
Date (COD), downsize capacity or terminate the EPA 22
(ii) EPA renewals where contracts are coming to end of life 23
(iii) New EPAs 24
For all three categories, EPAs were assessed based on: 25

Chapter 4 - Resource Planning Analysis Framework
Integrated Resource Plan Page 4-11
August 2013
• Cost - BC Hydro examined the potential PV of energy savings against two 1
bookends to inform decisions: (a) termination of the EPAs; and (b) continuing 2
with the EPA. For cases where the continuation of the EPA is under 3
consideration, options for downsizing capacity or deferring COD were pursued. 4
• Implementation risk - Implementation risk encompasses factors such as: First 5
Nation relationship risk (e.g., loss of economic, training or employment 6
opportunities for First Nations - in some cases a First Nations IBA has been 7
executed with the IPP proponent); reputational risk (e.g., the perception that 8
BC Hydro lacks integrity in managing its contractual obligations under these 9
agreements); and other stakeholder risks (e.g., loss of economic benefits for 10
communities); litigation risk (e.g., pay out of damages exceeds savings) 11
• System benefits - System benefits could include factors such as capacity 12
contribution to generation operations and local transmission, and capital and/or 13
operating cost reductions. For example, bioenergy projects can provide hourly 14
firm capacity. 15
• Economic development benefits - In some cases, local communities and First 16
Nations strongly support the development of energy generation projects due to 17
economic benefits, such as direct and indirect employment, other economic 18
activity, and tax revenues. For example, bioenergy EPAs typically result in 19
broad economic benefits because they also benefit the forestry and 20
transportation sectors, in addition to the benefits associated with construction 21
and operation of the facility itself. 22
Category 1: Deferring, Downsizing or Terminating Pre-COD EPAs 23
BC Hydro reviewed the status of all EPAs that have not reached COD. A total of 51 24
EPAs were examined, representing about 8,100 GWh/year of contracted energy, or 25
about 4,400 GWh/year of firm energy after adjustment for attrition. BC Hydro applied 26
the following review process: 27

Chapter 4 - Resource Planning Analysis Framework
Integrated Resource Plan Page 4-12
August 2013
• Stage 1 - Determine whether each pre-COD EPA project has progressed to 1
substantial construction or if significant First Nation, stakeholder or other 2
implementation risks exist. Projects where significant construction has taken 3
place were deemed unlikely candidates for deferral, downsizing or termination 4
because of the high costs that would be involved in deferring a project that is 5
nearing completion. As a result, 32 pre-COD EPAs proceeded to the next stage 6
of review. This group consisted of 18 projects where development had stalled 7
and termination appeared possible. The remaining 14 EPAs were identified as 8
potential candidates for deferral or downsizing. 9
• Stage 2 – Assess the potential benefits of deferral, downsizing or termination by 10
examining the impact on the PV commitment and the PV of energy savings. In 11
addition, carry out further assessment of implementation risks and other 12
considerations. Based on an assessment of the estimated impact of potential 13
deferral, downsizing or termination, a comparison of current contractual 14
commitments versus expected commitment after implementation was carried 15
out. This analysis indicated that, if successful, these EPA actions could result in 16
an incremental rate reduction of, on average, approximately one per cent in the 17
period F2014 through F2022. 18
To date, BC Hydro has executed mutual agreements to terminate four EPAs, 19
representing 147 MW in nameplate capacity and 980 GWh/year in contracted annual 20
generation (since completion of these projects was not 100 per cent certain prior to 21
termination, the impact on the probability weighted supply forecast as shown in the 22
LRBs is less). 23
BC Hydro is in discussions with other IPPs where development of pre-COD EPA 24
projects has stalled. Based on an assessment of the estimated impact of potential 25
deferral, downsizing or termination, a comparison of current contractual 26
commitments versus expected commitment after implementation was carried out. 27
This analysis indicated that, if successful, these EPA actions could result in: 28

Chapter 4 - Resource Planning Analysis Framework
Integrated Resource Plan Page 4-13
August 2013
• A reduction of contracted energy by F2021 of roughly 1,800 GWh 1
• A reduction in attrition-adjusted forecast firm energy supply by F2021 of 160 2
GWh/year 3
• A reduction in the PV of contractual commitments for electricity supply of more 4
than $1 billion 5
• An incremental rate reduction of, on average, approximately one per cent in the 6
period F2014 through F2022 7
BC Hydro is negotiating agreements to defer COD for projects or to downsize 8
projects where possible; and is declining requests from developers for BC Hydro’s 9
consent to plant capacity increases unless ratepayer value can be achieved.6 For 10
example, value can be realized through a variety of mechanisms, such as deferral of 11
commercial operations, capping overall generation, or other contractual 12
concessions. There may also be some limited opportunity to cost-effectively 13
negotiate agreements to terminate certain EPAs where BC Hydro does not have 14
termination rights, but where a termination agreement may result in benefit to both 15
parties. In these cases, BC Hydro weighs a number of factors to determine the best 16
course of action, including but not limited to: BC Hydro’s contractual rights and 17
obligations; the PV of the purchase commitment; the value of the energy purchased 18
over the term of the EPA; potential impacts on First Nations and other stakeholders; 19
the likelihood that the project will proceed to commercial operations; and the 20
potential cost of a termination agreement, if any. 21
The following tables show the impact on energy and capacity of the proposed 22
changes from deferring, downsizing, or terminating pre-COD EPAs (Category 1). 23
6 BC Hydro has discretion under its EPAs to consent or not consent to various requests. In some cases,
BC Hydro discretion is absolute and in other cases, BC Hydro must not unreasonably withhold condition or delay its consent.

Chapter 4 - Resource Planning Analysis Framework
Integrated Resource Plan Page 4-14
August 2013
Table 4-5 and Table 4-6 show the impact on energy and dependable capacity of the 1
proposed changes from deferring, downsizing or terminating pre-COD EPAs 2
(Category 1) and represent some of the changes reflected in the updated LRBs for 3
energy and capacity presented in Figure 4-3 and Figure 4-4 at the end this section. 4
Table 4-5 Expected Energy from Pre-COD EPA 5 Terminations and Deferrals, GWh 6
F2017 F2018 F2019 F2020 F2021 F2022 F2023 F2028 F2033
Expected Terminations -166 -181 -209 -209 -209 -209 -209 -211 -209
Expected Deferrals7 -331 -76 53 53 53 53 53 53 53
Total -497 -257 -156 -156 -156 -156 -156 -157 -156
Table 4-6 Expected Capacity from Pre-COD EPA 7 Terminations and Deferrals, MW 8
F2017 F2018 F2019 F2020 F2021 F2022 F2023 F2028 F2033
Expected Terminations -7 -7 -11 -11 -11 -11 -11 -11 -11
Expected Deferrals -18 0 3 3 3 3 3 3 3
Total -25 -7 -8 -8 -8 -8 -8 -9 -8
Category 2: EPA Renewals 9
As EPAs expire for projects already in operation, BC Hydro is targeting renewing 10
those facilities that have the lowest cost, greatest certainty of continued operation 11
and best system support characteristics. Due to the fact these are existing projects 12
where the IPP’s initial capital investment has been fully or largely recovered over the 13
years of operations, BC Hydro expects to be able to negotiate a lower energy price. 14
BC Hydro believes that EPA renewals should be completed at a price within a range 15
defined by (i) the seller’s opportunity cost, which is the electricity spot market and (ii) 16
7 In some cases it is expected that there will be additional contracted energy and capacity as part of contract
amendments or prior commitments.

Chapter 4 - Resource Planning Analysis Framework
Integrated Resource Plan Page 4-15
August 2013
the cost of service for the seller’s plant after considering other factors such as the 1
attributes of the energy product and associated non-energy benefits. 2
Previously BC Hydro assumed that no existing bioenergy EPAs would be renewed 3
upon expiry due to pricing and fuel supply risks, and that all other existing EPAs 4
would be renewed for the remainder of the planning horizon. For planning purposes, 5
BC Hydro now estimates that about 50 per cent of the bioenergy EPAs will be 6
renewed, about 75 per cent of the small hydroelectric EPAs that are up for the 7
renewal in the next five years will be renewed, and all remaining EPAs will be 8
renewed. These changes are summed up in Table 4-7 and Table 4-8 and are 9
reflected in the amended LRBs presented for energy and capacity at the end of this 10
section. 11
The above changes for EPA renewals reflect updated planning assumptions for this 12
IRP. On an ongoing basis, IPP projects will continue to be individually assessed as 13
EPAs come up for renewal. Refer to section 8.2.4 for additional detail. 14
The following tables show the impacts to energy and capacity of implementing the 15
proposed changes to EPA renewals (Category 2) using the planning assumptions 16
set out above. 17
Table 4-7 EPA Renewal Energy Differences (F2017 18 – F2023, F2028, F2033), GWh 19
F2017 F2018 F2019 F2020 F2021 F2022 F2023 F2028 F2033 Previous EPA Renewal Assumptions8 1,205 1,297 1,298 1,298 1,298 1,298 3,468 4,316 5,086 Updated EPA Renewal Assumptions
1,147 1,245 1,570 1,683 1,824 2,117
4,357 5,463 6,356
Difference -58 -52 273 385 526 819 889 1,147 1,270
8 For Table 4-7 to 4-10, the “previous” assumptions refer to the illustrative example, starting in the spring of
2013, used to generate a baseline for comparison.

Chapter 4 - Resource Planning Analysis Framework
Integrated Resource Plan Page 4-16
August 2013
Table 4-8 EPA Renewal Capacity Differences 1 (F2017 – F2023, F2028, F2033), MW 2
F2017 F2018 F2019 F2020 F2021 F2022 F2023 F2028 F2033
Previous Renewal Methodology
137 142 142 142 142 142 417 444 470
Updated Renewals 133 146 177 202 214 256 539 603 640
Difference -3 4 35 60 73 114 122 159 170
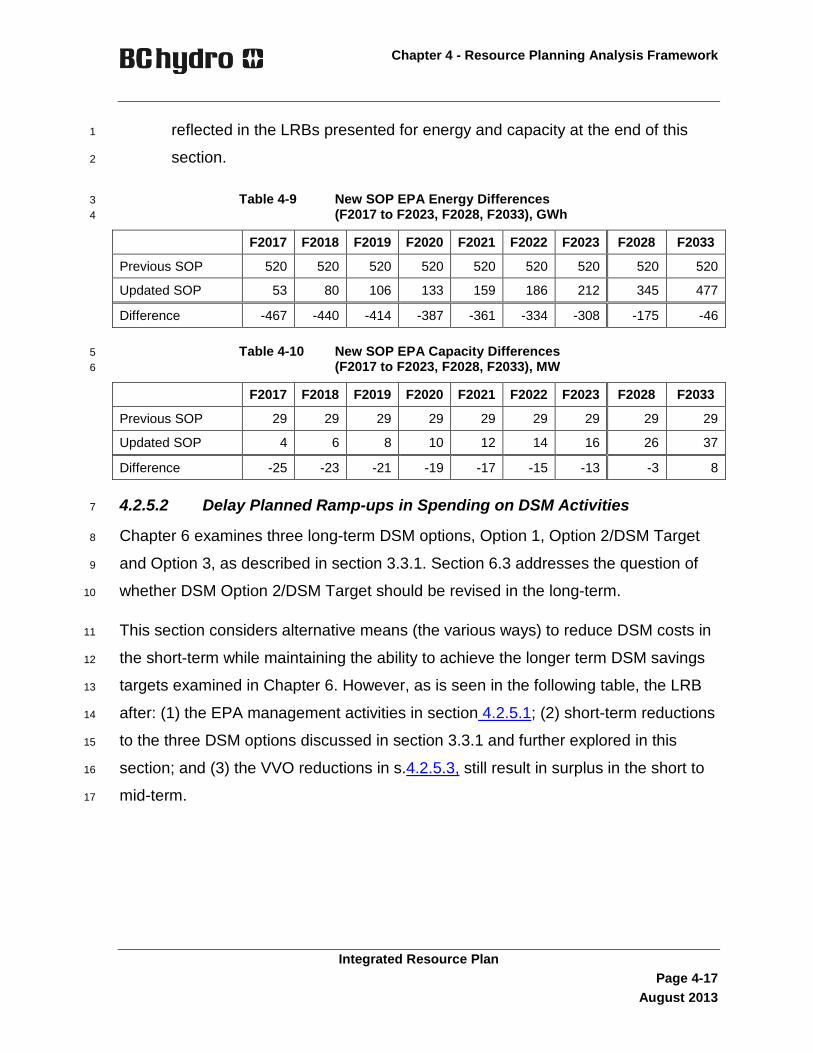
Category 3: New EPAs 3
BC Hydro will minimize acquisition of additional electricity supplies. However, 4
BC Hydro must honour prior agreements to negotiate EPAs: 5
• BC Hydro is committed to the IBAs it has signed with First Nations, and some 6
of those agreements involve consideration of EPAs for energy generation 7
projects. The values of about 170 GWh of firm energy and 25 MW of ELCC 8
beginning in F2020 set out in footnote 4 to Table 4-1 have not been changed 9
and thus are not reflected in Table 4-9 and Table 4-10 below. 10
• BC Hydro, under the B.C. Government direction, has made prior 11
commitments to enter into negotiations for EPAs with certain parties as part 12
of broader economic development opportunities and First Nation initiatives. 13
However, it is uncertain if any EPAs will result and thus this category of 14
potential new EPAs is not reflected in Table 4-9 and Table 4-10. 15
• The Standing Offer Program (SOP) is an exceptional category of acquisitions 16
as it is a legislated requirement pursuant to subsection 15(2) of the CEA; 17
subsection 15(3) provides that BC Hydro may establish the terms and 18
conditions of the offers under the SOP. For example, BC Hydro made 19
changes to the SOP Rules on 26 March 2013 that among other things limit 20
the participation of clustered projects that exceed 15 MW and better manage 21
when SOP energy supply comes on-line; refer to section 8.2.4.2 for more 22
detail. The changes between the illustrative example and what is proposed in 23
this IRP for the SOP are summarized in Table 4-9 and Table 4-10 and are 24
Chapter 4 - Resource Planning Analysis Framework
Integrated Resource Plan Page 4-17
August 2013
reflected in the LRBs presented for energy and capacity at the end of this 1
section. 2
Table 4-9 New SOP EPA Energy Differences 3 (F2017 to F2023, F2028, F2033), GWh 4
F2017 F2018 F2019 F2020 F2021 F2022 F2023 F2028 F2033
Previous SOP 520 520 520 520 520 520 520 520 520
Updated SOP 53 80 106 133 159 186 212 345 477
Difference -467 -440 -414 -387 -361 -334 -308 -175 -46
Table 4-10 New SOP EPA Capacity Differences 5 (F2017 to F2023, F2028, F2033), MW 6
F2017 F2018 F2019 F2020 F2021 F2022 F2023 F2028 F2033
Previous SOP 29 29 29 29 29 29 29 29 29
Updated SOP 4 6 8 10 12 14 16 26 37
Difference -25 -23 -21 -19 -17 -15 -13 -3 8
4.2.5.2 Delay Planned Ramp-ups in Spending on DSM Activities 7
Chapter 6 examines three long-term DSM options, Option 1, Option 2/DSM Target 8
and Option 3, as described in section 3.3.1. Section 6.3 addresses the question of 9
whether DSM Option 2/DSM Target should be revised in the long-term. 10
This section considers alternative means (the various ways) to reduce DSM costs in 11
the short-term while maintaining the ability to achieve the longer term DSM savings 12
targets examined in Chapter 6. However, as is seen in the following table, the LRB 13
after: (1) the EPA management activities in section 4.2.5.1; (2) short-term reductions 14
to the three DSM options discussed in section 3.3.1 and further explored in this 15
section; and (3) the VVO reductions in s.4.2.5.3, still result in surplus in the short to 16
mid-term. 17

Chapter 4 - Resource Planning Analysis Framework
Integrated Resource Plan Page 4-18
August 2013
Table 4-11 Energy Surplus/Deficit with DSM Options, 1 GWh 2
F2014 F2015 F2016 F2017 F2018 F2019 F2020
DSM Option 1 1,100 2,464 2,278 4,778 3,342 1,942 1,099
DSM Option 2/DSM Target 1,119 2,533 2,427 5,041 3,725 2,828 2,366
DSM Option 3 1,142 2,665 2,760 5,601 4,534 3,489 2,980
DSM is a flexible resource in the context of optimizing BC Hydro’s activities over the 3
short to mid-term. To some degree, DSM activity can be ramped up or down over 4
time to better match demand. However, DSM activities are enabled by long-term, 5
sustained relationships with customers and industry partners, and some 6
opportunities are time-limited and may not be deferrable. It is important to 7
understand the limits to which DSM savings can be ramped down (to achieve short 8
term savings) and then ramped back up to achieve long term DSM targets. 9
For DSM Option 3, the ability to reduce current expenditure levels was considered 10
but dismissed. Option 3 targeted increased program activities and expenditures to 11
target the greatest level of DSM program savings currently considered deliverable. It 12
is BC Hydro’s professional judgement that to reduce near-term expenditures but 13
continue to rely upon the longer term savings is not believable or prudent in the case 14
of DSM Option 3. 15
For Option 1 and Option 2/DSM Target assessments were also undertaken on near-16
term expenditure reductions and the ability to recover to the long-term savings 17
targets. For each of DSM Option 1 and DSM Option 2, the alternative means to 18
achieve long term DSM targets would reduce ramp rates. The following sets out the 19
alternative means of achieving the Option 2/DSM Target: 20
• Alternative Means 1: continue with previously planned expenditures to 21
implement the DSM target set out in the F2012-F2014 Revenue Requirements 22
Application (RRA). This is a ‘status quo’ option. 23
Chapter 4 - Resource Planning Analysis Framework
Integrated Resource Plan Page 4-19
August 2013
• Alternative Means 2: adjusts program and supporting initiative expenditures in 1
the near-term and then moderately ramp up to the DSM target by F2021. By 2
F2022, expenditures are reduced by over $330 million relative to Alternative 3
Means 1. The reduction is focused over the near-term (F2015-F2022), where 4
F2014 is a transition year. In F2016, planned expenditures are adjusted to a 5
base level of $125 million. 6
A third path to reach the DSM target was also considered, which reduces 7
expenditures further in the near-term (down to $100 million in expenditures in F2016, 8
the same level of DSM program activity in the near-term as DSM Option 1 described 9
in Chapter 3) and aggressively ramps up to higher levels of activity starting in F2017. 10
However, even with the aggressive ramp up rate, this path fails to return to DSM 11
target levels by F2021. In addition, there are likely additional energy savings delivery 12
risks associated with further carve out of expenditures and the aggressive ramp up 13
rate. For these reasons, BC Hydro does not consider this path to be a viable 14
alternative to return to the current DSM target by F2021. 15
In examining the alternatives, BC Hydro considered a range of inputs and decision 16
criteria. In working with its Energy Conservation and Efficiency Committee, 17
BC Hydro formed these into a framework and then condensed them to a reduced set 18
of comparators:9 19
• Rate Impact – the rate impact relative to the DSM plan baseline over the near 20
and long-term 21
• Cost Effectiveness - relative to BC Hydro’s avoided cost, program and portfolio 22
cost-effectiveness is considered from both a Total Resource Cost (TRC) and 23
9 Other important attributes that were considered include: lost opportunities, customer fairness / equity,
customer and industry relationships, market transformation, economic development and environmental impact. While these were not used as comparators, they were considered either (1) implicitly in the design of the alternative means, (2) as a sub-component of one of the comparators (e.g., lost opportunities, customer fairness / equity and customer and industry relationships affect the ability to ramp back up and therefore relate to risk / flexibility) or (3) as something to describe or report out on, but not actively used to tradeoff between means.
Chapter 4 - Resource Planning Analysis Framework
Integrated Resource Plan Page 4-20
August 2013
Utilty Cost (UC) perspective. The TRC and UC cost-effectiveness test are 1
described in section 3.3.4.1. 2
• Bill Reductions - the change to BC Hydro’s revenue requirements (or aggregate 3
customer bill) resulting from the different DSM options. 4
• Risk/flexibility - the risk and consequence (regret) of not being able to recover 5
to higher levels of DSM activity by certain time periods; this is managed by 6
maintaining the flexibility to ramp up to higher levels of DSM at points of time in 7
the future. 8
As the impacts considered were based on higher level estimates generated for 9
planning purposes, the analysis will need to be further refined. However, some 10
directional conclusions are: 11
• Over the near-term, lower level of expenditures are expected to have a reduced 12
rate impact 13
• Over the long-term, a negligible difference between the average rate impacts of 14
the different alternative means is expected 15
• A negligible impact on bill reductions from Alternative Means 1 to Alternative 16
Means 2 over 20 years is expected 17
• Moving from Alternative Means 1 to Alternative Means 2 may introduce some 18
additional, yet-to-be-quantified, deliverability uncertainty because the reduction 19
in near-term activities may have some effect on the ability to ramp back up 20
As part of the plan to reduce portfolio costs, BC Hydro recommends Alternative 21
Means 2 as the preferred path to reach the DSM target of 7,800 GWh by F2021 and 22
by doing so, reduce expenditures in the near-term by approximately $360 million. 23
The rationale for this recommendation is as follows: 24
• Moving from Alternative Means 1 to Alternative Means 2 provides roughly the 25
same bill reduction benefit over 20 years 26

Chapter 4 - Resource Planning Analysis Framework
Integrated Resource Plan Page 4-21
August 2013
• Moving from Alternative means 1 to Alternative means 2 lowers rate impacts in 1
the near-term by reducing expenditures in the near-term by approximately 2
$330 million 3
While Alternative Means 2 may have more deliverability uncertainty than Alternative 4
Means 1, BC Hydro considers the trade-off between rate impact and this risk to be 5
acceptable. Moreover, the risk of energy savings delivery is mitigated in part through 6
the construction of Alternative Means 2, which was designed to limit the risk of not 7
being able to ramp up to the DSM target. 8
Table 4-12 and Table 4-13 demonstrate the impacts on energy and capacity of 9
adopting Alternative Means 2 early in the planning horizon. As this table shows, this 10
reduces savings in the near term but DSM savings return to the Option 2/DSM 11
Target levels by roughly F2021. 12
Table 4-12 DSM Plan Energy Differences 13 (F2017 to F2023, F2028, F2033), GWh 14
F2017 F2018 F2019 F2020 F2021 F2022 F2023 F2028 F2033
Alt Means 1 Option 2/ DSM Target
5,127 5,689 6,474 7,193 7,790 8,202 8,423 10,196
10,995
Alt Means 2 Option 2/ DSM Target (recommended)
4,364 4,942 5,893 6,842 7,790 8,202 8,423 10,196
10,995
Change in DSM -763 -747 -582 -352 0 0 0 0 0
Table 4-13 DSM Plan Capacity Differences10 15 (F2017 to F2023, F2028, F2033), MW 16
F2017 F2018 F2019 F2020 F2021 F2022 F2023 F2028 F2033
Alt Means 1 Option 2/ DSM Target
781 940 1,090 1,238 1,371 1,460 1,519 1,873 2,074
10 The Option 2/DSM Target does not appear to have the same relative reductions for the peak capacity
savings when compared to the original 2008 LTAP target because the DSM plan has had recent updates to the mix of programs, rates and codes which impacts the associated capacity savings.

Chapter 4 - Resource Planning Analysis Framework
Integrated Resource Plan Page 4-22
August 2013
Alt Means 2 Option 2/ DSM Target (recommended)
820 932 1,078 1,224 1,371 1,460 1,519 1,873 2,074
Change in DSM 39 -8 -12 -14 0 0 0 0 0
Similarly, BC Hydro concluded that it could reduce short-term expenditures if it were 1
to implement DSM Option 1 while maintaining the longer term CEA 66 per cent 2
target in F2021. With the lower DSM Option 1 savings target, there was not as much 3
room to move. 4
In conclusion, Alternative Means 2 is the recommended approach to achieving 5
Option 2/DSM Target. Chapter 6 takes the preferred means of achieving the three 6
DSM options and provides comparisons among maintaining, increasing or 7
decreasing long term levels of DSM savings and how these resource options 8
compare against other supply-side resources available. 9
4.2.5.3 Scale Back Voltage and Var Optimization project implementation 10
VVO technology helps reduce the amount of electricity that must be transmitted to 11
ensure sufficient power quality at customer sites. BC Hydro’s VVO program was 12
developed in October 2011 based on long-term energy requirements and a LRMC of 13
$132/MWh ($F2012) based on the 2010 Clean Power Call. 14
A review of the program’s elements identified that a portion of those energy savings 15
are no longer cost-effective. BC Hydro is recommending that work will be completed 16
as planned for substation VVO projects that are presently being implemented. On a 17
go-forward basis, substation VVO projects will be considered based on system 18
growth, reliability, safety and sustainment requirements, and an updated LRMC 19
revised through this IRP (see section 8.2.11). Table 4-14 and Table 4-15 show that 20
this results in a reduction of estimated VVO savings of about 100 GWh/year and 21
1 MW in F2017, growing to about 250 GWh/year and 1 MW in F2022. 22

Chapter 4 - Resource Planning Analysis Framework
Integrated Resource Plan Page 4-23
August 2013
Table 4-14 VVO Energy Differences 1 (F2017 to F2023, F2028, F2033), GWh 2
F2017 F2018 F2019 F2020 F2021 F2022 F2023 F2028 F2033
Original VVO Program 359 418 496 539 562 576 585 589 594
Updated VVO Program 273 288 304 314 326 328 329 338 346
Change in VVO -86 -129 -193 -225 -235 -248 -256 -252 -248
Table 4-15 VVO Capacity Differences 3 (F2017 to F2023, F2028, F2033), MW 4
F2017 F2018 F2019 F2020 F2021 F2022 F2023 F2028 F2033
Original VVO Program 1 1 1 1 1 1 1 1 1
Updated VVO Program 0 0 0 0 0 0 0 0 0
Change in VVO -1 -1 -1 -1 -1 -1 -1 -1 -1
4.2.5.4 Customer Incentive Mechanisms 5
Another method identified to temporarily increase demand is through specific, 6
temporary and tailored incentives to BC Hydro’s large customers (referred to as 7
Customers Incentive Mechanisms). To date, BC Hydro focused on identifying 8
potential incremental loads from existing Transmission Stepped Rate11 (TSR) 9
customers, which is approximately 300 GWh/year. Examples of incremental load 10
categories for existing customers include: installing new operating lines; restarting 11
existing operating lines/restarting shutdown plants; increased utilization of existing 12
production capacity (load factor, shifting); shift to production of energy-intensive, 13
higher value products. Going forward, BC Hydro will identify potential new customer 14
loads. One example of potential new customer loads is commercial vessels 15
11 Applying to BC Hydro’s largest industrial customers.

Chapter 4 - Resource Planning Analysis Framework
Integrated Resource Plan Page 4-24
August 2013
operating container and cruise ship terminals contemplating investments in shore-1
side electrical service.12 2
There are a limited number of examples of incentive mechanisms to increase 3
demand: (1) B.C.’s Power for Jobs program launched in 1998, (2) Ontario’s 4
‘Industrial Electricity Incentive Program’ announced on June 12, 2012; (3) a Hydro 5
Quebec rate schedule set in 1983 but phased out in 1988; and (3) Manitoba Hydro’s 6
Surplus Energy Program that gives customers access to surplus energy at the same 7
price Manitoba Hydro would receive from the export market. 8
The B.C. Power for Jobs program was enabled by legislation – the Power for Jobs 9
Development Act13 – in 1997. This program was developed to stimulate economic 10
development in B.C. by making a limited amount of discounted power available to 11
new or expanding businesses in B.C., 200 MW of power was notionally allocated to 12
the program from the Canadian Entitlement under the Columbia River Treaty. This 13
power was made available to qualifying companies on the same terms and 14
conditions as BC Hydro’s regular electric tariffs save for the price which the B.C. 15
Government directed BC Hydro to provide at a discount. The program lasted several 16
years and had a number of active participants. The program never achieved its 17
objective of stimulating economic development in a material way. The principal 18
reason for this is that the qualifying criteria were too onerous and screened out most 19
of the potential candidates. However, the criteria were necessarily onerous to 20
address some of the key design considerations which are set out below. 21
There are a number of design considerations: 22
• Eligibility - Should be broad so that all TSR customers have an opportunity to 23
participate, perhaps by sector due to intra-industry competition concerns. 24
12 BC Hydro has an existing Shore Power Rate (Tariff Supplement No. 76) but the rate is exclusive to cruise
ships at Canada Place. BC Hydro estimates that about 60 MW of shore power could be served in the next 2-3 years, and another 80 MW could be served in the next 3-10 years.
13 S.B.C. 1997, c.51.

Chapter 4 - Resource Planning Analysis Framework
Integrated Resource Plan Page 4-25
August 2013
Commercial customers could also be eligible. Related to eligibility, it will be 1
critical for any new mechanism to create broad opportunities for all to 2
participate. 3
• Duration – A shorter term may be appropriate because if the mechanism is 4
extended this may advance the need for new higher-cost energy resources 5
• Pricing – For illustrative purposes, pricing could be set between spot market 6
projections for the years F2013 – F2018 (a ‘BC sell price’14 of about $20/MWh 7
for F2013 (in $F2013, USD) to $23/MWh for F2018 (in $F2013, USD) for light 8
load hours) and industrial/commercial customer Tier-1 pricing (for example, 9
about $37/MWh for F2013 (in $F2013) blended, energy portion only of Rate 10
Schedule 1827 for TSR customers).15 The significant market price differentials 11
between freshet and winter pricing would be considered in the mechanism. 12
A final consideration would be to look at whether there is alignment with the need to 13
conserve due to the longer-term energy and capacity LRB deficits set out at the end 14
of the following section 4.2.6. 15
An approach using Customer Incentive Mechanisms to temporarily increase demand 16
comes with risks: 17
• Favourable agreements that are “temporary” in nature can have a tendency to 18
become entrenched and difficult to withdraw when their reasons for existence 19
end. BC Hydro’s E-Plus rates are an example; 20
• There may be conflict between the need to conserve due to the longer-term 21
energy and capacity LRB deficits and the financial benefits of temporarily 22
increasing demand. 23
14 The ‘BC sell price’ is the Mid-C market electricity price less wheeling and losses from the B.C. border to Mid-
C. 15 The highest ‘Tier-1’ pricing is RIB at $69/MWh for up to 1,350 kilowatt hours bi-monthly ($F2013).

Chapter 4 - Resource Planning Analysis Framework
Integrated Resource Plan Page 4-26
August 2013
While BC Hydro is recommending that the incentive mechanisms over the short to 1
mid-term be explored, no changes to forecasted demand will be made at this time. 2
4.2.6 Short Term Energy Supply Management: Summary and 3
Conclusions 4
The following tables show the cumulative impact of implementing all proposed 5
changes to energy and capacity over the planning horizon discussed in section 4.2. 6
Table 4-16 Cumulative Changes to Incremental 7 Resource Additions, Energy 8 (F2017 to F2023, F2028, F2033), GWh 9
F2017 F2018 F2019 F2020 F2021 F2022 F2023 F2028 F2033
EPA Terminations and Deferrals
-497 -257 -156 -156 -156 -156 -156 -157 -156
EPA Renewals -58 -52 273 385 526 819 889 1,147 1,270
New EPAs (SOP) -467 -440 -414 -387 -361 -334 -308 -175 -46
DSM -763 -747 -582 -352 0 0 0 0 0
VVO -86 -129 -193 -225 -235 -248 -256 -252 -248
Net Change -1,872 -1,626 -1,072 -735 -226 81 170 563 820
Table 4-17 Cumulative Changes to Incremental 10 Resource Additions, Capacity 11 (F2017 to F2023, F2028, F2033), MW 12
F2017 F2018 F2019 F2020 F2021 F2022 F2023 F2028 F2033
IPP Terminations and Deferrals
-25 -7 -8 -8 -8 -8 -8 -9 -8
IPP EPA Renewals -3 4 35 60 73 114 122 159 170
New EPAs (SOP) -25 -23 -21 -19 -17 -15 -13 -3 8
Change in Planning Reserves
8 4 -1 -5 -7 -13 -14 -21 -24
DSM 39 -8 -12 -14 0 0 0 0 0
VVO -1 -1 -1 -1 -1 -1 -1 -1 -1
Net Change -8 -31 -8 13 40 77 86 126 145
Figure 4-3 and Table 4-18, and Figure 4-3 and Table 4-19, show a need for energy 13
and capacity emerges in F2027 and F2021 respectively with no LNG load, and in 14
F2022 and F2020 respectively when including Expected LNG load. 15

Chapter 4 - Resource Planning Analysis Framework
Integrated Resource Plan Page 4-27
August 2013
Figure 4-3 Energy Surplus/Deficit with Incremental 1 Resources 2
Table 4-18 Energy Surplus/Deficit 3 (F2017 to F2023, F2028, F2033), GWh 4
F2017 F2018 F2019 F2020 F2021 F2022 F2023 F2028 F2033
Surplus/Deficit with Incremental Resources and Expected LNG 5,041 3,725 2,828 1,366 179 -1,216 -1,886
-3,864 -7,886
Surplus/Deficit with Incremental Resources without Expected LNG 5,041 3,725 2,828 2,366 2,179 1,784 1,114 -864 -4,886
Chapter 4 - Resource Planning Analysis Framework
Integrated Resource Plan Page 4-28
August 2013
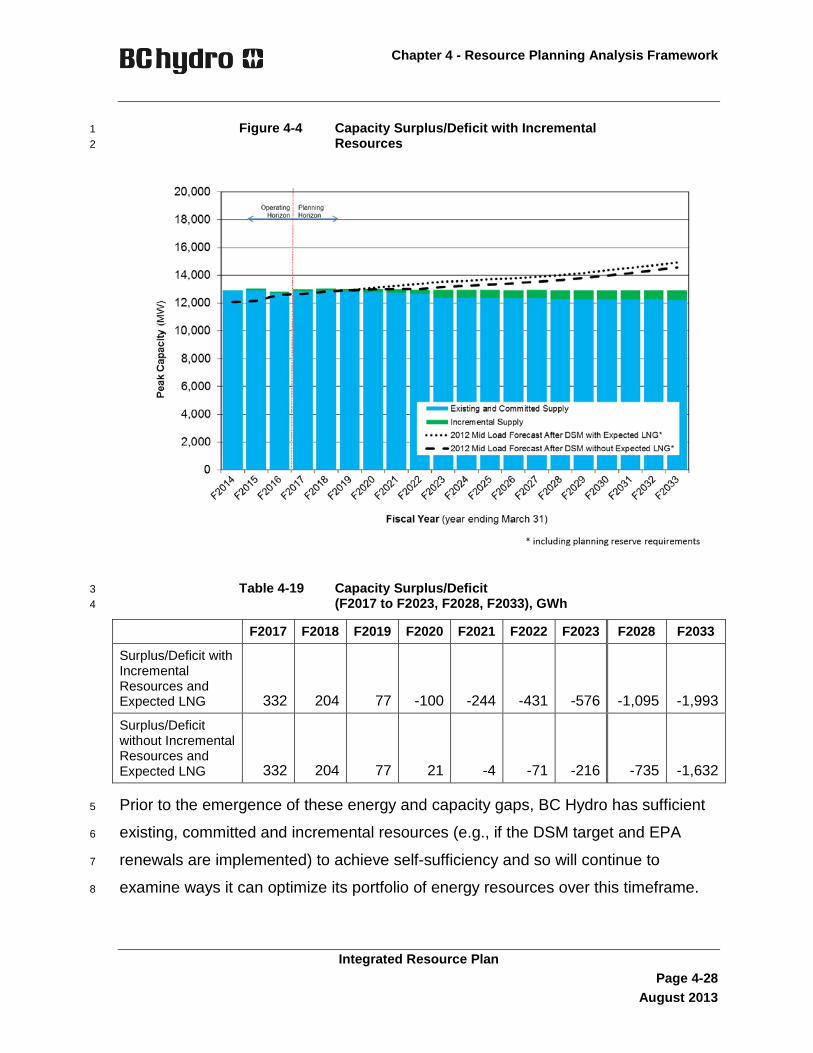
Figure 4-4 Capacity Surplus/Deficit with Incremental 1 Resources 2
Table 4-19 Capacity Surplus/Deficit 3 (F2017 to F2023, F2028, F2033), GWh 4
F2017 F2018 F2019 F2020 F2021 F2022 F2023 F2028 F2033
Surplus/Deficit with Incremental Resources and Expected LNG 332 204 77 -100 -244 -431 -576 -1,095 -1,993
Surplus/Deficit without Incremental Resources and Expected LNG 332 204 77 21 -4 -71 -216 -735 -1,632
Prior to the emergence of these energy and capacity gaps, BC Hydro has sufficient 5
existing, committed and incremental resources (e.g., if the DSM target and EPA 6
renewals are implemented) to achieve self-sufficiency and so will continue to 7
examine ways it can optimize its portfolio of energy resources over this timeframe. 8

Chapter 4 - Resource Planning Analysis Framework
Integrated Resource Plan Page 4-29
August 2013
Chapter 8 summarizes the recommended actions outlined in this section and 1
provides more details regarding how BC Hydro will continue to act on these issues. 2
The remainder of Chapter 4 describes the framework for addressing these long-term 3
resource options. Chapter 5 examines the conditions that influence prices as 4
BC Hydro interacts with external energy markets. Chapter 6 presents analysis and 5
conclusions regarding these long- term resourcing issues. 6
4.3 Long Term Resource Planning Analysis Framework 7
Section 4.2.6 shows a need for energy and capacity in F2027 and F2021 8
respectively based on BC Hydro’s mid Load Forecast before Expected LNG, and a 9
need for energy and capacity in F2022 and F2020 respectively with Expected LNG. 10
This section explains the planning analysis used to compare long-term resource 11
options. Analysis proceeded through the following steps: 12
1. Consider long-term resource planning questions 13
2. Define the main decision objectives used to design and compare long-term 14
resource options 15
3. Assess key uncertainties regarding these resource options 16
4. Establish portfolio analysis methodology and assumptions 17
4.3.1 Key Long Term Resource Planning Questions 18
The key questions to determine the best mix of supply and demand resources are as 19
follows: 20
(a) Natural Gas-Fired Generation: What is the optimal use of natural gas-fired 21
generation within the CEA’s 93 per cent clean or renewable energy objective? 22
And how might natural gas-fired generation be used to serve LNG loads? 23
(b) DSM Target: Should BC Hydro’s current long-term DSM target be adjusted? 24

Chapter 4 - Resource Planning Analysis Framework
Integrated Resource Plan Page 4-30
August 2013
(c) Site C Clean Energy Project: Should BC Hydro continue to advance Site C for 1
its earliest in-service date (ISD)? 2
(d) Serving LNG and North Coast Loads: What actions are needed and what 3
supply options need to be maintained to ensure that BC Hydro is able to supply 4
Expected LNG load, additional LNG load above expected and other loads in the 5
North Coast while considering the specific planning challenges of this region? 6
(e) Fort Nelson/Horn River Basin: What is BC Hydro’s strategy to prepare for 7
significant and uncertain load growth in the combined Fort Nelson and Horn 8
River Basin regions, while ensuring load growth in Fort Nelson is met? What 9
approach should BC Hydro take to respond to the CEA’s subsection 2(h) 10
energy objective to “encourage the switching from one kind of energy source or 11
use to another that decreases [GHG] emissions in” B.C. via enabling 12
electrification in this region? 13
(f) General Electrification: What role should BC Hydro play to support provincial 14
climate policy? What is BC Hydro’s strategy to get ready for potential load 15
driven by general electrification, including assessing potentially significant 16
impacts to existing ratepayers? 17
(g) Transmission: What transmission needs are foreseen over the long-term 18
planning horizon and what actions need to be taken? And to what degree 19
should BC Hydro take a more proactive approach to building transmission 20
infrastructure for clusters of generation locations in advance of need? 21
(h) Capacity Requirements and Contingency Considerations: What additional 22
capacity requirements are foreseen, and what strategies and actions are 23
appropriate in response to these future needs? In addition to filling the most 24
likely mid gap, what are some events that might make the gap larger or smaller, 25
what are the sizes and timing of these events and what actions can BC Hydro 26
prepare as contingencies? 27

Chapter 4 - Resource Planning Analysis Framework
Integrated Resource Plan Page 4-31
August 2013
4.3.2 Comparing Alternatives Using Multiple Planning Objectives 1
For any of the key long-term planning questions highlighted in the previous section, 2
a number of possible solutions may be viable. Table 4-20 lays out the decision 3
objectives by which potential solutions are compared and provides the rationale for 4
their consideration. Many of these considerations are embodied in the CEA section 2 5
British Columbia’s energy objectives, such as GHG emission reduction targets, 6
ratepayer (financial) impacts, and economic development. There is clearly an 7
overlap between these decision objectives and the ones considered for the short-8
term analysis, with the exception of ‘Environmental Footprint’, which is more relevant 9
as resources are being added to meet increased demand. 10
The following sections describe how the financial, environmental and economic 11
development decision objectives were considered in the context of long-term 12
resource planning; minimizing DSM deliverability risk is addressed in detail in 13
section 4.3.4.2. 14
Table 4-20 CEA and Other Resource Planning 15 Decision Objectives 16
Decision Objective Reason for Inclusion
Minimize Financial Impacts, including: • Cost (various measures) • Cost Uncertainty • Differential Rate Impacts
Good utility practice; First Nations, public and stakeholder interests; align with CEA ‘ratepayer’ objectives grouped in Table 1-1
Minimize Environmental Footprint, including: • Land Footprint • Water Footprint • Criteria Air Contaminants • GHG Emissions
Good utility practice; First Nations, public and stakeholder interests; align with CEA ‘clean/renewable/DSM/GHG impacts’ objectives grouped in Table 1-1.
Maximize Economic Development First Nations, public and stakeholder interests; align with CEA ‘economic development’ objectives grouped in Table 1-1
Maximize System Reliability • Minimize DSM Deliverability Risk
Good utility practice; First Nations, public and stakeholder interests

Chapter 4 - Resource Planning Analysis Framework
Integrated Resource Plan Page 4-32
August 2013
4.3.2.1 Financial Impacts 1
In the IRP, the financial implications of the resource options, or strategies, to fill the 2
LRB gap are tracked at a portfolio level both for the cost of acquiring new resources 3
and also for how these resources interact with the existing system and the external 4
electricity market. Costs are expressed on a PV basis to capture the impact of the 5
timing of costs and trade revenues over the planning horizon. Where uncertainty is 6
relevant, cost ranges or costs across scenarios are highlighted. 7
4.3.2.2 Environmental Footprint 8
The environmental footprint of portfolios modelled to meet long-term energy and 9
capacity needs are tracked with respect to potential effects on land, freshwater, 10
marine, air (criteria air contaminants) and climate change (GHG emissions). These 11
footprints were considered at a portfolio level as data does not exist at a regional or 12
local level for all projects (in many cases, generation resources are represented as a 13
“typical” project or bundle of projects). In addition, the resources selected through 14
modelling are not necessarily the ones that would be selected through an actual 15
acquisition process. 16
The full set of environmental information for comparing portfolios with respect to the 17
key IRP questions is presented in Appendix 6A. This information is summarized at a 18
level appropriate for comparing portfolios of resource options in section 6.4. 19
4.3.2.3 Economic Development Impact 20
In response to the CEA’s subsection 2(k) energy objective “to encourage economic 21
development and the creation and retention of jobs”, BC Hydro tracks the possible 22
footprint of each portfolio built to meet long-term energy and capacity needs with 23
respect to effects on employment, Gross Domestic Product (GDP) and government 24
revenue. These measures are generated for a provincial-level view, as the data and 25
modelling did not exist to provide a more regional view of these potential impacts. In 26
addition, given that the modelled resource additions might not be the same as the 27

Chapter 4 - Resource Planning Analysis Framework
Integrated Resource Plan Page 4-33
August 2013
projects selected through an actual acquisition process, these measures are 1
appropriate for high level comparisons of broad impacts. 2
Appendix 3A-5 discusses in more detail the methodology behind these measures. 3
Appendix 6B provides the detailed economic development criteria, including more 4
granular views as to the source of these potential impacts (e.g., construction versus 5
operation; direct versus indirect or induced changes). As this additional level of 6
analysis did not provide additional insight into the comparison of portfolios of 7
resource options it is presented at a higher level in the body of the IRP. 8
BC Hydro notes that rate impacts can also be an economic development issue. 9
4.3.2.4 IRP Treatment of Multiple Decision Objectives 10
In instances where the impacts of different options are quantified with respect to how 11
they impact decision objectives, a consequence table is a useful format in which to 12
present these multiple effects. A consequence table is a collection of alternatives, 13
decision objectives and their estimated attributes arranged in a matrix with the 14
alternatives displayed as column headers (i.e., portfolios representing different 15
strategies for addressing the LRB), and the relevant decision objectives displayed as 16
row labels. An example similar to a consequence table from Chapter 6 is presented 17
in Table 4-21 for illustrative purposes. 18

Chapter 4 - Resource Planning Analysis Framework
Integrated Resource Plan Page 4-34
August 2013
Table 4-21 Example Consequence Table 1
Measure Clean with SCGTs (within CEA 93%
limit)
Clean Power with Transmission
Land total hectares (ha) 22,300 28,200
Marine (valued ecological features)
total ha 49 56
Affected Stream Length km 390 510
GHG Emissions CO2e (‘000 t) 16,400 3,800
Local Air Contaminants Oxides of Nitrogen (‘000 t)
17 12
Local Air Contaminants Carbon Monoxide (‘000 t)
33 12
GDP $ million PV 16,000 16,200
Employment FTEs 317,000 338,100
Government Revenues $ million PV 2,600 2,700
Cost $ million PV 14,948 15,603
While judgment is required to reduce the full analysis to a condensed level, this view 2
allows a reader to see the relative impacts of resource options across alternatives 3
and decision objectives. (The unabridged versions of these tables can be found in 4
Appendix 6A). 5
Consequence tables also help clarify the balance BC Hydro is seeking in developing 6
cost-effective solutions. Given the precision of the measures and the range of their 7
potential impacts across resource options for each IRP question, it cannot be 8
presented as a mechanical weighting and scoring outcome. Rather the consequence 9
tables attempt to summarize what could be gained and what might be given up 10
across resource options. Qualitative factors not captured in the consequence tables 11
and comparisons where impacts are not easily quantified also need to be 12
considered; professional judgment is required to balance the quantified and 13
non-quantified factors across these multiple options and multiple objectives when 14
developing conclusions and recommendations. 15

Chapter 4 - Resource Planning Analysis Framework
Integrated Resource Plan Page 4-35
August 2013
4.3.3 Key Uncertainties and Risks 1
To provide a clear discussion of the uncertainties and risks that BC Hydro is 2
managing, the following definitions are provided: 3
• Uncertainties are variables with unknown outcomes 4
• Risk is commonly defined as the effect of uncertainty on objectives 5
Some key uncertainties and related risks for addressing resource needs over the 6
longer term include: 7
(a) Load growth and the chance that load growth exceeds or falls below 8
expectations 9
(b) DSM initiatives and the chance that DSM savings exceed or fall below 10
expectations 11
(c) Features of BC Hydro’s existing system and its operations, including inflow 12
water variability 13
(d) Natural gas and electricity spot market and long-term market price uncertainty 14
(e) REC prices and GHG emission prices 15
(f) Current and future regulatory and public policy developments such as: GHG 16
regulation, Renewable Portfolio Standard (RPS) targets and eligibility 17
requirements 18
(g) IPP development, including type of resource and location and the risk that 19
these resources require significant capacity and transmission support 20
(h) IPP attrition rates from power acquisition processes and the chance that these 21
exceed or fall below expectations 22
(i) Site C timing and approval to proceed to construction 23
(j) Natural gas-fired generation resources and the uncertainty around the ability to 24
permit these resources in time to respond to short term capacity requirements 25

Chapter 4 - Resource Planning Analysis Framework
Integrated Resource Plan Page 4-36
August 2013
(k) New demand for electricity may develop sooner than transmission lines can be 1
built to provide the service 2
(l) Non-thermal capacity resources and their ability to meet capacity requirements 3
on short notice with high reliability 4
4.3.4 Quantifying Uncertainty 5
Section 4.3.3 laid out key uncertainties and risks that could potentially influence the 6
comparison of resource options with respect to the IRP’s key questions. Where 7
possible, BC Hydro quantified these uncertainties to be transparent about their role 8
in the IRP analysis, results and conclusions. This section describes the different 9
approaches to handling uncertainty in the IRP analysis. These approaches are 10
addressed in more detail in Appendix 4A. 11
Table 4-22 Approaches to Handling Uncertainty 12
Approach Brief Description Examples
Parameterization of Historical Observations
Uses sequences of past data to derive a statistical description of the range of uncertainty
• Load forecast inputs, such as economic growth, housing starts, population growth
Subjective Probability Elicitation
Where good historical data does not exist, uses knowledgeable specialists to construct a description of the range of uncertainty
• Savings from various DSM tools including codes and standards, and programs
• IPP attrition rates for possible future calls
Monte Carlo Analysis
Mechanical way to jointly calculate the influence of several uncertain variables through simulation of thousands of combinations
• Load forecasting • DSM savings (bottom-up
analysis)
Scenario Analysis An alternative way to jointly calculate the influence of several uncertain variables, but only using a few, select combinations
• Market price scenarios • Load/resource gap
Sensitivity Analysis
Testing one variable at a time to see whether different values within the range of uncertainty impact policy considerations
Wind integration cost
Conservative Point Estimates / Managed Costs
Incorporates uncertainty by taking a single point estimate, chosen in a “conservative” fashion
Firm energy expected from IPP hydro projects

Chapter 4 - Resource Planning Analysis Framework
Integrated Resource Plan Page 4-37
August 2013
Approach Brief Description Examples
Best Estimates Does not take into account uncertainty in any fashion; usually reserved for variables where uncertainty is assumed to have a small or manageable impact
Energy from wind projects
The IRP analysis uses a mix of these approaches to explore how uncertainty 1
impacts the comparison of options and the strategies to manage the residual risks of 2
the recommended actions. As always, professional judgment informed by 3
quantitative analysis and qualitative information is required when interpreting data, 4
balancing objectives, and making decisions. 5
4.3.4.1 Load Forecast Uncertainty 6
The uncertainty around the load forecast is one of the largest uncertainties faced by 7
BC Hydro in its long-term planning process. As outlined in section 2.2.4, BC Hydro 8
produces both a mid-Load Forecast as well as a range of uncertainty around that 9
estimate. This range of uncertainty is derived using a Monte Carlo analysis based on 10
the impact on load of the uncertainty associated with a set of key drivers: 11
• The drivers for the commercial and residential sectors include economic 12
activity, weather, electricity rates and demand elasticity 13
• The spread of uncertainty around the large transmission sector was 14
approached separately. Given the large volume of transmission level 15
demand that could increase or drop off in response to rapidly changing 16
external market forces, the load forecast Monte Carlo model was augmented 17
in this forecast to better capture this important influence on load uncertainty. 18
The transmission sector was broken down into four major sub-components: 19
Forestry, Oil and Gas, Mining, and Other. For each sector, BC Hydro 20
produced a range of possible load levels to capture both very high load and 21
very low load growth trajectories. For each sector, these trajectories were put 22
into a triangular probability distribution (see Table A2.2 in Appendix 2A). 23
Tables 2-3 and 2-4 show the speed and the magnitude with which these load 24

Chapter 4 - Resource Planning Analysis Framework
Integrated Resource Plan Page 4-38
August 2013
trajectories could depart from the mid-point estimate. To capture the notion 1
that these sectors likely depart from their mid-forecasts in response to 2
common external shocks, these growth trajectories were modelled with a 3
positive correlation. Finally, the Monte Carlo model also employed a slight 4
positive correlation between these sectors and the overall GDP to capture 5
the common movements of the resource sector and the economy in general. 6
The results of the Monte Carlo simulation are then split into three discrete forecasts: 7
high forecast, mid forecast and low forecast. By construction, the high and low 8
forecasts (shown here as the edges of the fan of uncertainty) are the mean of the 9
upper and lower twentieth percent tails of the load forecast distribution. As the 10
results turn out, the blue shaded area is also approximately the 80 per cent 11
confidence interval for the load forecast. 12
Figure 4-5 Range of Uncertainty Regarding Energy 13 Load Forecast 14

Chapter 4 - Resource Planning Analysis Framework
Integrated Resource Plan Page 4-39
August 2013
Figure 4-6 Range of Uncertainty Regarding Capacity 1 Load Forecast 2
Several key uncertainties are captured through separate analyses due to their large 3
size and uncertain timing: 4
• Potential North Coast LNG loads 5
• Potential Fort Nelson and Horn River Basin loads 6
• Potential general electrification loads 7
These potentially large, discrete additions to load are covered as separate topics of 8
analysis within the IRP. 9
As discussed in section 2.2.4, and in response to the BCUC 2008 LTAP Directive 6, 10
BC Hydro investigated the overlap and interrelationship between load growth and 11
DSM savings (referred to as DSM/Load Forecast Integration). Details of this can be 12
found in Appendix 2B of the IRP, however not all issues have been resolved. Some 13

Chapter 4 - Resource Planning Analysis Framework
Integrated Resource Plan Page 4-40
August 2013
gaps still remain to be addressed, including natural conservation and natural load 1
growth assumptions for the Load Forecast and baseline assumptions for DSM 2
programs. These still have the potential to impact load forecasting accuracy. 3
4.3.4.2 DSM Savings Uncertainty 4
DSM continues to be BC Hydro’s first and best option for meeting load growth. 5
However, precise forecasting of DSM savings for long-term planning purposes is 6
challenging for several reasons, including: 7
• Limited experience with respect to targeting cumulative savings above current 8
levels 9
• Difficulty in distinguishing between load growth and DSM effects 10
• Difficulty linking customer response to DSM actions, and forecasting the timing 11
and efficacy of regulatory changes 12
In view of these challenges, BC Hydro continues to emphasize and build upon 13
approaches described in the 2008 LTAP to understand DSM savings uncertainty. 14
Part of these approaches characterizes the range of uncertainty around DSM 15
savings estimates to better inform decisions regarding energy and capacity planning. 16
BC Hydro is filling the majority of its load/resource gap with DSM, so understanding 17
the range of uncertainty around savings estimates is crucial. Forecasting DSM 18
savings uncertainty is a new field that draws extensively upon unique techniques 19
such as subjective probability judgments. As such, substantial, additional details are 20
provided in Appendix 4B on the methodology and detailed findings. The discussion 21
of DSM savings uncertainty is organized around the following steps: 22
• Jurisdictional Review Summary 23
• Quantified Uncertainty Regarding DSM Energy Savings 24
• Quantified Uncertainty Regarding DSM Energy-Related Capacity Savings 25

Chapter 4 - Resource Planning Analysis Framework
Integrated Resource Plan Page 4-41
August 2013
• Capacity-Focused DSM Savings Uncertainty 1
• Overall Conclusions 2
DSM Jurisdictional Review 3
The key driver behind the DSM uncertainty assessments was to better understand 4
the degree to which BC Hydro could deliver on its DSM targets. While the bulk of 5
this work was based on internal analysis, BC Hydro also looked externally to 6
determine the extent to which other jurisdictions have been able to deliver on similar 7
DSM goals. The resultant DSM jurisdictional assessment can be found in 8
Appendix 4D; its application to DSM Uncertainty can be found in Appendix 4B. This 9
section highlights key findings and draws lessons for DSM uncertainty assessment. 10
The study looked at 26 utilities and DSM implementers in North America. To a 11
certain extent, results are limited by reporting issues and data availability. This 12
sample comprises a snapshot of the leading and most aggressive applications of 13
DSM in the North American electricity sector, and is most useful for comparing 14
changes to program spending and less useful for changes to codes and standards 15
and rate design. At a high level, this is because few jurisdictions report energy 16
savings from codes and standards activity and because other jurisdictions focus on 17
peak shaving rate structures such as Critical Peak Pricing. 18
Using the average annual savings goals for DSM Option 2/DSM Target and 19
comparing this to what has been claimed by other utilities, the following observations 20
can be made: 21
• The study is partially based on claimed savings from other jurisdictions. 22
However, this does not reduce the difficulty of distinguishing between DSM 23
effects and impacts on load growth. Moreover, verification methods and 24
reporting vary across jurisdictions. This means that those levels of savings 25
claimed in other jurisdictions do not necessarily translate into potential to 26
reduce BC Hydro load. 27

Chapter 4 - Resource Planning Analysis Framework
Integrated Resource Plan Page 4-42
August 2013
• No other jurisdiction in this survey is relying on a combination of programs, 1
codes and standards, and rate design in a coordinated way. This makes an 2
“apples to apples” comparison very difficult. 3
• If the future program targets for Option 2/DSM Target are examined alone, then 4
there exists jurisdictions that have claimed past savings in excess of 5
BC Hydro’s planned savings from DSM programs. 6
• At least one other jurisdiction in this sample (PacifiCorp) plans on using less 7
than the full amount of cost-effective DSM potential due to concerns regarding 8
reduced portfolio diversification and deliverability risk, based on professional 9
judgment 10
This jurisdictional assessment was designed to assist in understanding the 11
confidence with which BC Hydro can deliver its planned DSM savings in future 12
years. This gives some reasons for cautious optimism about moving forward with 13
DSM programs at the level of DSM Options 2, but it also highlights the uniqueness 14
of BC Hydro’s combination of all three DSM tools to achieve conservation targets. 15
Quantified Uncertainty Regarding DSM Energy Savings 16
The DSM energy savings uncertainty analysis focuses on quantifying the range of 17
possible outcomes from the following three broad categories: 18
• DSM programs 19
• Codes and standards 20
• Rate Structures – changes considered for all major rate classes 21
BC Hydro undertook analysis of the range of uncertainty for each of these items. By 22
combining all of the quantified sources of uncertainty in a Monte Carlo analysis and 23
adjusting based on professional judgment, BC Hydro produced a quantified range of 24
uncertainty around mid-level DSM estimates. Details of this process can be found in 25
Appendix 4B. 26

Chapter 4 - Resource Planning Analysis Framework
Integrated Resource Plan Page 4-43
August 2013
Figure 4-7 puts the high and low DSM savings forecasts into a band of uncertainty 1
around the mid DSM savings forecast for Option 2 as a way of illustrating the range 2
of DSM savings uncertainty around the mid-point estimates. Similar to the load 3
forecast figure, the high and low DSM savings estimates are calculated as the mean 4
of the upper and lower twentieth percentile tails of the distributions. As the results 5
turned out, the fan of uncertainty roughly corresponds to an 80 per cent confidence 6
interval for DSM savings. Figure 4-7 shows uncertainty regarding DSM forecast 7
savings in the near term is low, but this grows over time creating a broad fan of 8
possible levels of DSM savings in the future. However, BC Hydro emphasizes that 9
BC Hydro must rely on professional judgment given the uncertainty in assessing 10
DSM deliverability. 11
Figure 4-7 Range of Potential Energy Savings for 12 DSM Option 2 13

Chapter 4 - Resource Planning Analysis Framework
Integrated Resource Plan Page 4-44
August 2013
Based on the experience of building several iterations of DSM options, the spread of 1
uncertainty for DSM Options 1 and 3 would be expected to be roughly similar, albeit 2
scaled proportionately to match their levels of savings. 3
Several observations can be made from this analysis. First, there is a substantial 4
amount of uncertainty for all options when planning for the mid forecast. Second, for 5
DSM Options 1 – 3, there is no clear demarcation between “acceptable” and 6
“unacceptable” with respect to savings uncertainty; each option shows a 7
considerable range of potential outcomes, with the larger DSM portfolios containing 8
both larger downside and larger upside uncertainty. 9
To the extent that BC Hydro can react to this potential magnitude of DSM 10
under-performance and increase DSM electricity savings to target levels over this 11
timeframe, then DSM savings uncertainty is manageable. However, if the size and 12
timing of the under-performance poses concerns, then deliverability of DSM energy 13
savings is a risk that needs to be considered, both in choosing the appropriate level 14
of DSM and in managing the risk during the implementation of the IRP 15
recommendations. This underscores the importance of having robust DSM 16
performance management and a robust contingency plan to backstop BC Hydro’s 17
energy and capacity needs. This latter topic is addressed in section 6.9. 18
Quantified Uncertainty Regarding DSM Energy-related Capacity Savings 19
Energy-focused DSM measures also bring associated capacity savings. Two 20
sources of uncertainty were built into the IRP analysis regarding DSM energy-related 21
capacity savings: 22
• The underlying uncertainty around the energy savings themselves (as 23
discussed above) 24
• The capacity factors used to translate energy savings into the associated level 25
of capacity savings 26

Chapter 4 - Resource Planning Analysis Framework
Integrated Resource Plan Page 4-45
August 2013
Capacity factors are used to translate general energy savings into peak savings. 1
These parameters are treated as uncertain estimates to capture the lack of precise 2
knowledge about how energy savings from multiple sources would reduce peak 3
demand. Combining the uncertainty around capacity factor estimates and the 4
uncertainty regarding the underlying savings estimates in a Monte Carlo distribution 5
generated a spread of possible capacity savings around the estimate. Details can be 6
found in Appendix 4B. The outcome of this can be seen in the following graph for 7
DSM Option 2 capacity savings over time. 8
Figure 4-8 Range of Potential Capacity Savings for 9 DSM Option 2 10
Similar to DSM energy savings, the range of capacity savings for Options 1 and 3 11
would be expected to be similar to that shown for Option 2, but proportional to the 12
amount of savings for each option. The observations here somewhat parallel those 13
made with regard to DSM savings uncertainty on the energy side: 14

Chapter 4 - Resource Planning Analysis Framework
Integrated Resource Plan Page 4-46
August 2013
• There is significant uncertainty with respect to DSM capacity savings across all 1
options 2
• Moving to higher levels of DSM increases uncertainty around capacity savings 3
• There is no clear quantified demarcation between “acceptable” DSM options 4
and “unacceptable” DSM options with regard to energy-related capacity savings 5
uncertainty when comparing Options 1 to 3 6
The significant difference that needs to be taken into account on the capacity side is 7
that the consequences of under delivery of capacity resources are much more 8
severe than on the energy side, and may undermine BC Hydro’s fundamental 9
requirement to serve load. As a result, BC Hydro draws the following conclusions: 10
• Choosing options with higher capacity uncertainty should only be done if the 11
option is a cost-effective resource and if the level of deliverability risk can be 12
adequately managed through other means 13
• Preparing contingency responses to prepare for the possibility of DSM under-14
delivery is an important part of BC Hydro’s CRPs, regardless of the DSM option 15
chosen. Refer to section 6.9 and section 8.4 16
Capacity-Focused DSM Savings Uncertainty 17
While the energy-focused DSM options discussed in the previous section have 18
associated capacity savings, additional capacity savings are possible through 19
capacity-focused DSM activities. These were described in section 3.3.2 and at a 20
high level, refer to DSM activities that can reliably reduce peak demand over the 21
long-term (also referred to as peak reduction or peak shaving). This section 22
addresses the uncertainty around the capacity savings forecasts. 23
Capacity-focused DSM savings were grouped into two broad categories: 24
• Industrial load curtailment 25
• Capacity-focused programs 26
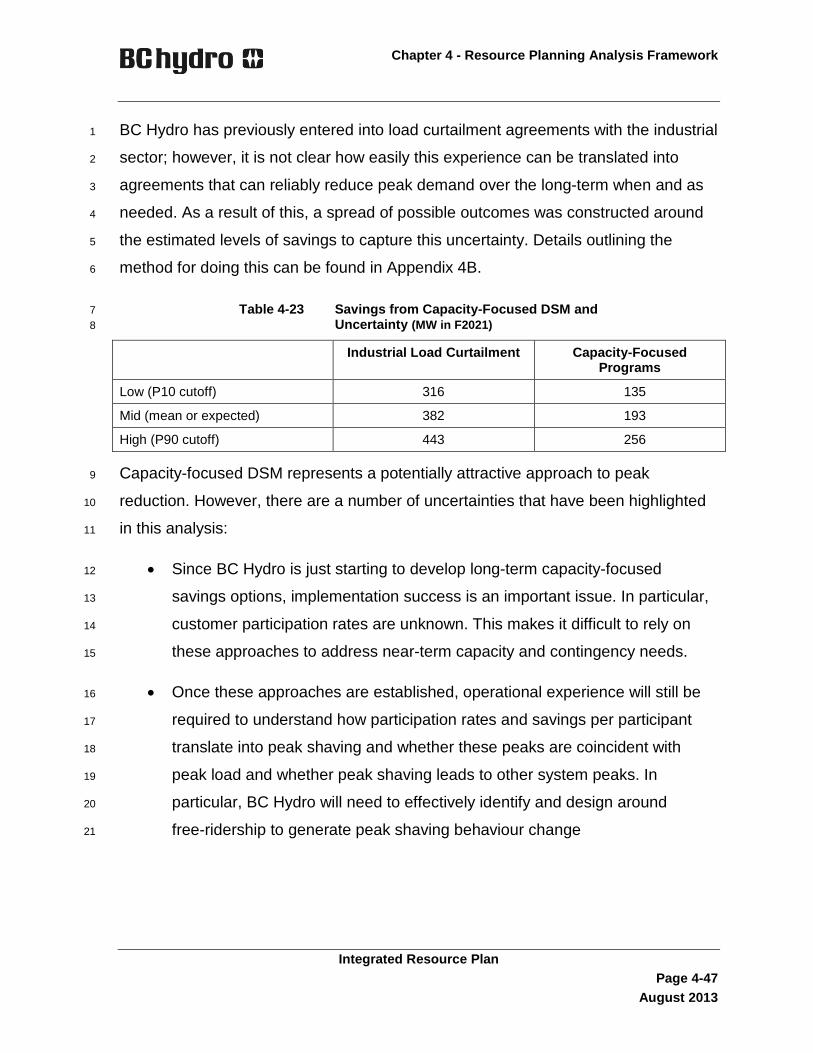
Chapter 4 - Resource Planning Analysis Framework
Integrated Resource Plan Page 4-47
August 2013
BC Hydro has previously entered into load curtailment agreements with the industrial 1
sector; however, it is not clear how easily this experience can be translated into 2
agreements that can reliably reduce peak demand over the long-term when and as 3
needed. As a result of this, a spread of possible outcomes was constructed around 4
the estimated levels of savings to capture this uncertainty. Details outlining the 5
method for doing this can be found in Appendix 4B. 6
Table 4-23 Savings from Capacity-Focused DSM and 7 Uncertainty (MW in F2021) 8
Industrial Load Curtailment Capacity-Focused Programs
Low (P10 cutoff) 316 135
Mid (mean or expected) 382 193
High (P90 cutoff) 443 256
Capacity-focused DSM represents a potentially attractive approach to peak 9
reduction. However, there are a number of uncertainties that have been highlighted 10
in this analysis: 11
• Since BC Hydro is just starting to develop long-term capacity-focused 12
savings options, implementation success is an important issue. In particular, 13
customer participation rates are unknown. This makes it difficult to rely on 14
these approaches to address near-term capacity and contingency needs. 15
• Once these approaches are established, operational experience will still be 16
required to understand how participation rates and savings per participant 17
translate into peak shaving and whether these peaks are coincident with 18
peak load and whether peak shaving leads to other system peaks. In 19
particular, BC Hydro will need to effectively identify and design around 20
free-ridership to generate peak shaving behaviour change 21

Chapter 4 - Resource Planning Analysis Framework
Integrated Resource Plan Page 4-48
August 2013
Overall Conclusions Regarding Long-Term DSM Savings Uncertainty 1
BC Hydro is expected to meet the majority of its load growth through DSM. As such, 2
a considerable effort to better understand the uncertainty inherent in this 3
demand-side resource and incorporate it into the decision-making framework is 4
warranted. 5
Progress has been made since the 2008 LTAP on many of these questions: 6
• A detailed study on load forecast and DSM integration addressed some 7
overlaps and found that other concerns were already adequately addressed by 8
existing processes 9
• A more focused jurisdictional review found evidence pertaining to the 10
experiences of other utilities 11
• A top-down analysis of overall DSM uncertainty tried to capture issues of 12
uncertainty not addressed by the more mechanical, bottom-up Monte Carlo 13
studies 14
In addition, newly emerging circumstances have brought to the fore some additional 15
areas of interest that are just starting to be explored: 16
• Ramp up rates – to what extent can DSM activities be moderated when need is 17
not pressing, but then accelerated if and when demand growth increases? 18
• Capacity – given the emergent importance of capacity issues in this IRP, and 19
given that DSM efforts and verification to date have been energy-focused, is 20
there additional uncertainty with associated capacity savings? 21
Despite the advancement in understanding some of these issues, uncertainty 22
around the large DSM savings being targeted continues to be a key uncertainty in 23
long-term resource planning. These are difficult issues that face the electricity 24
industry at large and none of them can be considered “solved”. Moreover, data sets 25
and learning continue to evolve over time, even over the course of an energy 26

Chapter 4 - Resource Planning Analysis Framework
Integrated Resource Plan Page 4-49
August 2013
planning cycle. As such, professional judgment will continue to play an important 1
role in both the interpretation of data and in balancing DSM deliverability risk with 2
other key energy planning objectives. 3
4.3.4.3 Net Load and Net Gap Uncertainty 4
Net load is the level of load after DSM savings. Forecasting net load is subject to the 5
joint uncertainties of forecasting load growth and forecasting DSM savings. 6
Estimates of the range of outcomes around the forecast were developed for load 7
growth (Chapter 2) and DSM savings (section 4.3.4.2). These were combined to 8
yield a range of possible outcomes for net load, along with the associated relative 9
likelihoods of achieving these outcomes. Details of this process are contained in 10
Appendix 4A. 11
For most IRP questions, the uncertainty regarding future net load is expressed as a 12
three-point, discrete distribution. Combining the net load distribution for a given DSM 13
option with the existing, committed and incremental resource stack yields a large 14
gap, mid gap,16 and small gap.17 To clarify this concept, the table below lays out how 15
these gap levels are defined. 16
Table 4-24 Gap Terminology 17
Small Gap Mid Gap Large Gap
Load Assumptions Low load scenario Mid-load scenario High load scenario
DSM Assumptions High DSM savings scenario, but with scaled back effort.
Modelled as low DSM savings
Mid-DSM savings scenario
Low DSM savings
16 The mid gap corresponds with the load/resource balance shown in section 2.4. 17 While “gap” refers to any situation where demand does not meet supply, it is important to note that “gap”
could refer to deficit (which requires additional resources to fill) or surplus (which may call for strategies to reduce). In periods of surplus, this traditional terminology can be confusing and so care must be taken in its interpretation.

Chapter 4 - Resource Planning Analysis Framework
Integrated Resource Plan Page 4-50
August 2013
The one change to be noted for this IRP is the definition of the “Small Gap” scenario. 1
As discussed in section 3.3.1, there is evidence that a reduced load forecast impacts 2
DSM economic potential. In addition, as recent experience has highlighted, a 3
prolonged period of low load growth would likely not be accompanied by BC Hydro 4
continuing to pursue the same level of DSM savings. Rather, efforts would likely to 5
be scaled back in the face of a prolonged economic slump, even if the conditions for 6
overachieving DSM savings (e.g., high public participation, high savings per 7
participant, large elasticity of demand, better than expected progress on codes and 8
standards implementation) were in place. This combination of scaled back efforts 9
paired with better than expected DSM savings conditions was modelled as a low 10
level of DSM savings. This approach is a rough approximation to capture dynamic 11
decision-making within a static modelling framework and so some care must be 12
taken when interpreting results involving the low gap (large surplus) scenarios. 13
These are shown for each DSM Option in Figure 4-9 and Figure 4-10 for energy and 14
capacity, respectively. The gap between load (after DSM) and resources either 15
represents a surplus where costs need to be managed (if supply is greater than 16
demand) or a deficit that must be filled with supply-side resources. If the comparison 17
between load and resources results in a surplus, the IRP analysis considers the 18
costs of selling the surplus into the market. 19

Chapter 4 - Resource Planning Analysis Framework
Integrated Resource Plan Page 4-51
August 2013
Figure 4-9 Energy Gap18 1
18 The y-axis has been magnified to better demonstrate the variation between the six gap scenarios. The
energy graph y-axis starts at 40,000 GWh/year and the capacity graph y-axis starts at 10,000 MW.

Chapter 4 - Resource Planning Analysis Framework
Integrated Resource Plan Page 4-52
August 2013
Figure 4-10 Capacity Gap 1
The conclusions to the key IRP questions addressed in Chapter 6 are collected into 2
a Base Resource Plan (BRP). The primary focus of the BRP is to address the needs 3
identified by the mid gap. As such, the majority of the analysis in Chapter 6 is based 4
on the mid gap scenario with Option 2/DSM Target, unless otherwise noted. 5
BC Hydro develops additional actions for contingency plans that ensure that 6
alternative sources of energy and capacity supply are available if the risks 7
materialize or additional loads develop. In section 6.9, BC Hydro examines the need 8
for additional energy supply if load differs from the mid gap scenario. The large gap 9
scenario is a useful test of how large and how quickly load can differ from the mid 10
gap. It provides guidance on the range of capacity resources that need to be ready, 11
and the required timing of these resources, to respond effectively. Conversely, the 12
small gap scenario helps explain the benefits of flexibility in the case that need is 13
decreased. 14

Chapter 4 - Resource Planning Analysis Framework
Integrated Resource Plan Page 4-53
August 2013
4.3.4.4 Market Price Forecast Uncertainty 1
Using costs to compare portfolios of DSM and supply-side options requires 2
estimating not only the cost of acquisitions, but also the costs and trade revenues of 3
each portfolio operating over the planning timeframe. The operating costs and 4
revenues are affected by: 5
• Natural gas prices 6
• Electricity prices for import and export 7
• GHG allowance and offset prices 8
• Renewable Energy Credits (RECs) 9
The future price path of each of the above variables is estimated with uncertainty. 10
These price levels vary over time; their estimated levels and departures from their 11
estimated values are some of the main drivers of long-term planning decisions. A 12
further complication is the inter-relationship between these variables. Chapter 5 13
explores each of these price forecasts in more detail. Section 5.2 outlines how these 14
uncertainties were combined into five Market Scenarios, Scenarios 1 through 5, to 15
create combinations of factors that: 16
• Represent a wide, but plausible range of input and output prices 17
• Avoid combinations that were internally inconsistent 18
• Are large enough in number to cover key combinations but small enough in 19
number to be tractable within IRP modelling resource constraints 20
In most cases, the base assumption for the Chapter 6 analysis is Market Scenario 1, 21
as BC Hydro considers this the most likely scenario. Where relevant, resource 22
options were compared using some of the Market Scenarios 1 through 5 to test 23
whether strategies were robust given possible different market price futures. 24

Chapter 4 - Resource Planning Analysis Framework
Integrated Resource Plan Page 4-54
August 2013
4.3.4.5 Wind Integration Cost and ELCC Uncertainty 1
Two main uncertainties were highlighted with respect to wind resources: 2
• Wind integration costs 3
• ELCC (discussed in section 3.2.1). 4
The wind integration cost is described in Appendix 3E. A value of $10/MWh is used 5
as the base case and additional sensitivity tests were performed using $5/MWh and 6
$15/MWh as the lower and upper bounds, respectively. 7
The determination of the wind ELCC value is described in Appendix 3C. The current 8
analysis suggests an ELCC value of 26 per cent of installed capacity. This value is 9
used as the base assumption for all portfolio modelling. The wind ELCC is modelled 10
as a random variable with a lopsided triangular probability distribution function, using 11
a zero per cent ELCC value as a lower bound (worst case) assumption, 26 per cent 12
as the upper bound (best case) assumption, and 26 per cent as the most likely 13
assumption. Changes to this variable did not make a material impact to the overall 14
analysis. 15
4.3.4.6 IPP Attrition Uncertainty 16
IPP clean or renewable energy resources are one of the resource options BC Hydro 17
considers to fill the load/resource gap. However, given that recent BC Hydro 18
acquisition processes have resulted in varying rates of attrition, IPP attrition rate is 19
flagged as an uncertainty that could affect the comparison of resource options. For 20
this IRP, BC Hydro adopted a range of attrition rates, bracketing those evidenced in 21
recent acquisition processes. The lower and upper bounds, as well as a best 22
estimate, are shown in Table 4-25. A triangular distribution was developed for Monte 23
Carlo simulation to help inform the range of uncertainty for net gap estimates. 24
This estimation of IPP deliverability uncertainty could play an important role in 25
estimating risks to supply-reliability. However, given the anticipated small role 26

Chapter 4 - Resource Planning Analysis Framework
Integrated Resource Plan Page 4-55
August 2013
incremental IPP resources are expected to have in the planning horizon, this factor 1
was dropped from analysis in Chapter 6. 2
Table 4-25 IPP Attrition Rates and Uncertainty 3 (per cent) 4
Lowest Credible Bound
Mid (Best) Estimate
Highest Credible Bound
Attrition Rates 5 30 7019
4.3.4.7 Resource Options 5
Chapter 3 outlined the resource options that could be considered in filling the energy 6
and capacity gaps. However, some of these resource options present operational 7
and developmental challenges, as well as uncertainty around their technological 8
maturity. As described in section 3.7, only resource options that have proven 9
development in B.C. and meet legal restrictions and B.C. Government policy 10
objectives were included in portfolio modelling. Section 4.4 provides a list of the 11
resources considered. This list does not imply that any possible future energy and 12
capacity acquisition processes will be limited in such a way. 13
4.3.5 Applying the Resource Planning Analysis Framework to Comparing 14
Alternatives 15
Sections 4.3.2 to 4.3.4 outlined how the IRP’s Resource Planning Analysis 16
Framework provides a process for comparing options, using multiple objectives, 17
given significant planning uncertainty. 18
Figure 4-11 is used in Chapter 6 in the discussion of modelling results to help clarify 19
which options and uncertainties are being explored and which are fixed with respect 20
to each of the key IRP questions. The legend is intended to clarify the background 21
assumptions against which the resource options are examined. As an example, 22
Figure 4-11 shows a portfolio run that has fixed the DSM target at Option 2/DSM 23
19 The upper bound for IPP attrition is based on attrition rates from the F2006 Call for Power. The EPAs
awarded during this call included two coal-fired generation projects, which were subsequently terminated due to change in B.C. Government policy.

Chapter 4 - Resource Planning Analysis Framework
Integrated Resource Plan Page 4-56
August 2013
Target, the market scenario at Market Scenario 1, etc. When the modelling choice 1
for each row is filled in, it becomes easier to understand the key underlying variables 2
chosen for each set of portfolios. The portfolio shown in Figure 4-4 represents the 3
base set of assumptions, and many of the IRP questions are examined in relation to 4
this starting point or analysis. 5
Figure 4-11 Modelling Map and Base Modelling 6 Assumptions 7
Modelling Map
Uncertainties/Scenarios
Market PricesScenario 2
LowScenario 1
MidScenario 3
High
Load Forecast Low Mid High
DSM deliverability Low Mid High
LNG Load ScenariosPrior to
Expected LNG 800 GWh 3000 GWh 6600 GWh
Resource choicesUsage of 7% non-clean Yes No
DSM Options Option 1 Option 2/DSM Target Option 3
Site C (all units in) timing F2024 F2026 No Site C
Modelling Assumptions and ParametersBCH/IPP Cost of Capital 5/7 5/6
Pumped Storage as Option Yes No
Site C Capital Cost Base Base plus 10%
Wind Integration Cost $5/MWh $10/MWh $15/MWh
shows the modeling assumptions

Chapter 4 - Resource Planning Analysis Framework
Integrated Resource Plan Page 4-57
August 2013
4.4 Portfolio Analysis Methodology and Assumptions 1
BC Hydro’s primary method of analysing resource options is portfolio analysis. 2
Portfolio analysis develops and evaluates resource portfolios, consisting of a 3
sequence of demand-side and supply-side resources (including transmission) to 4
meet customers’ energy and capacity needs. Portfolio analysis is part of the overall 5
IRP resource planning analysis framework; and portfolios are compared across the 6
resource planning objectives outlined in Table 4-20 and incorporated the key 7
uncertainties identified in section 4.3.3. 8
BC Hydro has maintained the same portfolio analysis process as was used in the 9
2008 LTAP. In its 2006 IEP/LTAP Decision, the BCUC agreed “that a portfolio 10
analysis is consistent with the Commission’s Guidelines”, and “is a best practice for 11
IEP or IRP analysis”.20 Portfolios for this IRP were created for the planning period 12
from F2017 to F2041.21 13
This section describes the models used and the modelling assumptions made in the 14
portfolio analysis. Figure 4-11 summarizes the range of assumptions made for the 15
key uncertainties present in the portfolios and highlights the base set of 16
assumptions. 17
4.4.1 Portfolio Analysis Models 18
This IRP used the same suite of models as was used in the 2008 LTAP, including: 19
• Hydro Simulation model (HYSIM) 20
• System Optimizer 21
• Multi-Attribute Portfolio Analysis (MAPA) 22
20 2006 IEP/LTAP Decision, pages 89 and 90. 21 The four-years prior to F2017 are within the operational timeframe for which long-term planning actions have
limited impact. Therefore, resources for these three years are assumed common across all portfolios and are not modelled.

Chapter 4 - Resource Planning Analysis Framework
Integrated Resource Plan Page 4-58
August 2013
HYSIM is a system simulation and production costing model developed in-house by 1
BC Hydro which determines a least-cost generation pattern for the large hydropower 2
system using 60 years of historic reservoir inflow records. HYSIM provides insight 3
into how year-to-year inflow variability may impact resource portfolio performance. It 4
is mainly used to estimate the monthly and annual energy produced by the large 5
hydro system under average water conditions. The resulting energy production for 6
the large hydropower plants was input into System Optimizer. 7
Resource portfolios for the IRP were developed using System Optimizer which is a 8
product of Ventyx. System Optimizer is a deterministic mixed integer programming 9
optimization model that determines an optimal sequence of generation and 10
transmission resource expansions, referred to as a portfolio, for a given set of input 11
assumptions. It does so by minimizing the PV of net cost required to meet a given 12
load under average water conditions. The net costs include the incremental fixed 13
capital and operating costs for new resources, total system production costs, and 14
electricity trade cost and revenues. System Optimizer does not value the ancillary 15
benefits provided by future potential resources such as the ability to integrate 16
intermittent resources and to increase the firm capability of other resources. This 17
value could be significant for resources such as Site C, natural gas-fired generation 18
or pumped storage. 19
MAPA is a tool developed within BC Hydro that takes the portfolio output from 20
System Optimizer and tracks various attributes of each portfolio such as 21
environmental and economic development attributes which are described in 22
Chapter 3. 23
For a more detailed description of the models used, refer to Appendix 4C. 24
4.4.2 Modelling Constraints 25
The portfolios created satisfy good utility practice (e.g., they meet reliability criteria 26
as described in section 1.2.2). Three CEA objectives are treated as constraints: 1) 27
Chapter 4 - Resource Planning Analysis Framework
Integrated Resource Plan Page 4-59
August 2013
achieve self-sufficiency; 22 2) meet the 93 per cent clean or renewable energy target 1
described further in section 6.2; and 3) meet the at least 66 per cent of incremental 2
load growth by year 2020 (F2021) with DSM. 3
4.4.3 Financial Parameters 4
The IRP portfolio analysis was performed and presented in F2013 constant dollars. 5
The PVs of the portfolios reflect the costs (or levelized costs where appropriate) for 6
the planning period from F2017 to F2041. The key financial parameters in the IRP 7
analysis include the following: inflation rate, cost of capital, discount rate and 8
U.S./Canadian exchange rate. 9
4.4.3.1 Inflation Rate 10
Where conversion between nominal and real dollars is necessary, an annual rate of 11
two per cent was used as the average inflation rate. This assumption is consistent 12
with the B.C. Consumer Price Index (CPI) outlook which is provided in the Province 13
of B.C. 2013 Budget and Fiscal Plan. Aside from the annual inflation rate 14
assumption, the IRP includes no other incremental cost escalation or allowance for 15
increasing capital costs. This assumption reflects the 2013 BC Hydro recommended 16
project cost estimation outlook based on the following observations: 17
• The Bank of Canada announced that its long term inflation target is centred 18
around the two per cent level, and that it will take action if price increases stray 19
outside of a one to three percent band around this mid-point 20
• While B.C. construction activities have seen a gradual recovery from 21
2011 to 2012: 22
Market competition for BC Hydro construction projects has remained strong 23
in recent years 24
22 Except as noted in the two year proposed economic bridging to Site C’s ISD described in section 8.2.7.
Chapter 4 - Resource Planning Analysis Framework
Integrated Resource Plan Page 4-60
August 2013
The continuing strength of the Canadian dollar has been helping to 1
moderate material and equipment procurement costs in international 2
markets; 3
Having a national CPI below two per cent has been moderating inflationary 4
pressure on the construction sector and contributes to a stable inflation 5
outlook. 6
4.4.3.2 Cost of Capital 7
The cost of capital used is the weighted average cost of debt and equity. The 8
weighted average cost of capital (WACC) is the rate of return that a company could 9
expect to earn in an alternative investment of equivalent risk. As discussed in 10
section 3.2.2, BC Hydro’s WACC is five per cent (real), which is a reduction from six 11
per cent (real) in the 2008 LTAP. The five per cent real rate has been consistently 12
applied in the recent costing of resources developed by BC Hydro such as Resource 13
Smart projects and Site C. BC Hydro used a WACC of seven per cent (real) for IPPs 14
for the analysis in this IRP. Sensitivity of the portfolio results to this assumption is 15
explored by performing several System Optimizer runs using a six per cent (real) 16
WACC for IPP projects. 17
4.4.3.3 Discount Rate 18
Discount rates reflect the market demand for, or opportunity cost of, the capital 19
associated with projects of similar risk. This IRP used five per cent and seven 20
per cent discount rates to calculate levelized resource unit costs (UECs and UCCs) 21
for BC Hydro and IPP resources respectively. The updated discount rates reflect the 22
change in BC Hydro’s WACC and the updated assumption of IPP’s WACC. In the 23
long-term planning context, the discount rate methodology is consistent with the 24
WACC used to calculate cost streams of installed resources. 25
BC Hydro’s discount rate is used to calculate PVs of portfolios. This reflects that the 26
evaluations are performed from the utility’s perspective. 27

Chapter 4 - Resource Planning Analysis Framework
Integrated Resource Plan Page 4-61
August 2013
4.4.3.4 U.S./Canadian Exchange Rate 1
Assumptions about the U.S. dollar to Canadian dollar exchange rate are required to 2
convert the market price forecasts described in Chapter 5. The assumed conversion 3
rate was 0.9693 USD/CAD, which is similar to the exchange provided by the 4
Treasury Board of BC’s December 2012 Outlook.23 5
4.4.4 Load/Resource Assumptions 6
The LRB shown in Figure 4-3 and Figure 4-4 form the base assumption for resource 7
requirements in the IRP portfolio analysis. These LRBs reflect December 2012 Load 8
Forecast described in Chapter 2, as well as the near term reduction conclusions on 9
IPP acquisitions, DSM and VVO and SMI, which is described earlier in this chapter. 10
Incremental load scenarios (i.e., large and discrete loads) as described in 11
section 4.3.4.1 are used to create different portfolios to answer specific questions. 12
4.4.5 Market Price Assumptions 13
The costs and trade revenues of operating each portfolio over the planning time 14
frame are one element used to compare the portfolios. These operating costs and 15
revenues are affected by the natural gas, GHG, electricity, and REC market price 16
assumptions. Chapter 5 describes these market prices under different market 17
scenarios and how they are used in the IRP analysis. Portfolios were generally 18
created for the most likely or expected market scenario (e.g., Market Scenario 1). 19
Portfolios were created and evaluated across different market scenario(s) where 20
warranted. 21
4.4.6 Resource Options 22
Chapter 3 presents an extensive list of resource options within B.C. The resource 23
options described in section 3.6 and 3.7 have been eliminated from consideration in 24
the portfolio analysis. The remaining resource options, referred to as Available 25
23 The Treasury Board of the Province of BC’s December 2012 Outlook quoted a USD/CAD FX Rate is .9770 for
F2018 which covers most years of the planning period.
Chapter 4 - Resource Planning Analysis Framework
Integrated Resource Plan Page 4-62
August 2013
Resource Options, are then made available to System Optimizer for creating 1
portfolios. 2
It is recognized that some of the resources that were screened or not modeled could 3
become viable over the planning horizon. Their exclusion from the IRP portfolio 4
analysis does not imply that they would be excluded from future energy and capacity 5
acquisition processes or from consideration in the IRP recommendations. 6
4.4.6.1 Available Resource Options 7
The remaining resource options are available for portfolio analysis. Apart from 8
pumped storage, all of these resource options have been developed in B.C. 9
• DSM Options 1, 2/DSM Target, and 3 savings, and costs attributed to various 10
DSM options which were modelled in System Optimizer 11
• On-shore wind 12
• Run-of-river hydro 13
• Site C (not including sunk costs) 14
• Biomass – Wood-based biomass (with the exception of the standing timber 15
portion of the potential, which has been excluded in the modeling due to cost 16
and other uncertainty) 17
• Biomass – Municipal Solid Waste 18
• Biomass – Biogas or Landfill Gas (not modeled because it only has small 19
energy and capacity potential, and potentially double counts resources that 20
could be acquired under the existing acquisition program) 21
• Cogeneration (not modeled because it only has small energy and capacity 22
potential, and potentially double counts resources that could be acquired under 23
the existing acquisition program) 24

Chapter 4 - Resource Planning Analysis Framework
Integrated Resource Plan Page 4-63
August 2013
• Resource Smart Projects (GMS Units 1-5 Capacity Increase24 and 1
Revelstoke Unit 625) 2
• Pumped storage: 3
There are no commercial pumped storage facilities in B.C., and only one 4
pumped storage facility operating in Canada which was permitted in the 5
1950s. Siting a pumped storage facility in B.C. triggers a number of 6
regulatory/government agency approvals resulting in timing and outcome 7
uncertainty 8
Pumped storage resources are modeled to be dispatched in generate mode 9
during heavy load/price periods such as weekdays during the day, and in 10
pump mode during light load/price periods such as overnight and on 11
Sundays. The sum of the energy produced and consumed by a pumped 12
storage resource was set to yield a net efficiency of 70 per cent (a net 13
energy consumer), which is in line with efficiencies seen at existing pumped 14
storage facilities 15
• Gas-fired generation – Section 6.2.3 describes how gas-fired generation is 16
considered for resource planning and sets out the rationale for modelling this 17
resource in portfolios as follows: 18
In portfolios where natural gas-fired generation is an available resource, it is 19
limited by the requirement to comply with the CEA 93 per cent clean or 20
renewable energy objective 21
Where natural gas-fired generation is built to serve non-LNG load, the type 22
of generator built is assumed to be a SCGT with a minimum capacity factor 23
of 18 per cent 24
24 The first year that these capacity upgrades were available to System Optimizer is F2021 and reflects
constraints due to on-going work at GMS. 25 The first year that the sixth unit at Revelstoke was available to System Optimizer is F2020 and reflects
constraints due to on-going work at the Mica and Revelstoke powerhouses.

Chapter 4 - Resource Planning Analysis Framework
Integrated Resource Plan Page 4-64
August 2013
Policy Action No. 18 of the 2007 Energy Plan provides that all new natural 1
gas-fired generation must have zero net GHG emissions. The cost to 2
completely offset GHG emissions is captured in the portfolio analysis. These 3
cost assumptions are described in section 5.4.3.3. 4
4.4.6.2 Resource Option Attributes 5
The technical, financial, environmental and economic attributes of the Available 6
Resource Options from Chapter 3 are inputs into the portfolio analysis. When 7
evaluated as part of a resource portfolio, the following generic costs are added to the 8
cost of these resources. 9
• Soft cost adder: This is applied to generic resource options or specific projects 10
that do not have discrete cost estimates which specifically include costs related 11
to mitigation, First Nation, public engagement regulatory review costs (i.e., 12
resource options other than Site C and Revelstoke Unit 6. BC Hydro notes that 13
it has not added a soft cost adder to GMS Units 1-5 Capacity Increase, but the 14
addition of this adder would not materially change the results). The UECs and 15
the UCCs described in Chapter 3 do not include mitigation measures, 16
regulatory review, First Nation consultation and public engagement costs. To 17
reflect the fact that developing future generic resource options would entail 18
additional soft cost expenditures, BC Hydro has added 5 per cent to the cost of 19
these resources. BC Hydro chose 5 per cent based on past experience. The 20
environmental assessment, First Nation, and stakeholder engagement costs in 21
a sample of recent representative BC Hydro capital projects ranged from 22
0.02 per cent to about 10 per cent. 23
• Wind integration cost adder: This is applied to future wind resources. Natural 24
variations in wind speed make the power generated by this resource particularly 25
challenging to both forecast in upcoming hours and days and integrate into the 26
power system on a minute-by-minute basis. Wind power generation is highly 27
variable in the short-term timescale of seconds to minutes resulting in the need 28

Chapter 4 - Resource Planning Analysis Framework
Integrated Resource Plan Page 4-65
August 2013
for additional highly responsive generation capacity reserves on the electric 1
system to maintain system reliability and security. The natural variability in wind 2
power generation also makes it difficult to forecast wind in the hour- to 3
day-ahead timeframe, resulting in the need to set aside system flexibility to 4
address the potential for wind generation to either under- or over-generate in 5
this time frame. Both of these challenges have cost implications that are 6
specific to wind power generation26 and are quantified in a wind integration cost 7
adder that is used in this IRP analysis as well as previous acquisition 8
processes. 9
BC Hydro first started to investigate wind integration costs in 2008. A wind 10
integration cost of $10/MWh was applied in the 2008 LTAP portfolio analysis as 11
well as in the subsequent 2010 Clean Power Call evaluation. In 2010 BC Hydro 12
completed a second, more detailed wind integration study which is included in 13
Appendix 6E. This study considered 12 wind integration scenarios which 14
included: 1) two study years representing different load and system generation 15
configurations; 2) two levels of wind location diversity; and 3) three wind power 16
penetration levels. The wind integration costs for the 12 scenarios ranged from 17
$5/MWh to $19/MWh. Generally speaking, wind integration cost increased as 18
the wind penetration level increased, whereas geographic diversification 19
significantly reduced the wind integration cost for all study years and all 20
penetration levels. Given that $10/MWh is within the range, BC Hydro continues 21
to use this figure for a wind integration cost adder in the IRP analysis. This 22
value will periodically be revisited in the future with further studies on wind 23
integration costs. 24
• Network upgrade cost adder: The network upgrade (NU) cost adder reflects 25
the costs borne by BC Hydro when interconnecting resource options to the bulk 26
26 Other renewable resources, such as solar and wave, are also highly variable in short-term timescales. The
variability of run-of-river generation is largely contained within the monthly/seasonal timeframe, which is captured in the IRP modeling tools.

Chapter 4 - Resource Planning Analysis Framework
Integrated Resource Plan Page 4-66
August 2013
transmission system. This includes cost of upgrades on the transmission 1
circuits leading from the point of interconnection to the bulk 500 kV circuits. A 2
NU cost, estimated based on average NU costs from the Clean Power Call, 3
was added to all resource options except for those that have such costs 4
explicitly included in their cost estimates or those that would interconnect 5
directly to a 500 kV system or to a sub-station in close proximity to a 500 kV 6
substation. 7
4.4.7 Transmission Analysis 8
The analysis of the long-term transmission requirements in this IRP was based on 9
BC Hydro’s Integrated System Planning Criteria (refer to Appendix 2D). These 10
criteria define BC Hydro’s guidelines for planning a reliable transmission network 11
that is adequate for dispatching designated generation resources to serve 12
forecasted demand. For system performance under normal and contingency 13
conditions, BC Hydro’s planning criteria conform to the BCUC-approved North 14
American Electric Reliability Corporation Reliability Standards for transmission 15
planning. 16
In accordance with the criteria that require the bulk transmission system to remain 17
within its thermal and stability limits under all demand conditions, the transmission 18
analysis in System Optimizer identifies where and when incremental transmission 19
capacity will be required for a particular portfolio. The power flows on the bulk 20
transmission network are calculated and, if the expected flow on a transmission 21
cut-plane27 exceeds its most restrictive rating, the cut-plane’s total transfer capability 22
is increased. This increase is achieved by selecting a wire or non-wire transmission 23
improvement option (for a list of options refer to section 3.5) that will alleviate 24
congestion along that existing transmission path. The results from System Optimizer 25
27 BC Hydro’s critical bulk transmission paths are also referred to as transmission cut-planes. These
transmission cut-planes divide the province into regions for transmission analysis (refer to Figure 3-6).

Chapter 4 - Resource Planning Analysis Framework
Integrated Resource Plan Page 4-67
August 2013
are reviewed and, if needed, the reinforcement requirements are adjusted. The PVs 1
of the portfolios presented in Chapter 6 reflect these adjustments. 2
The IRP transmission analysis highlights areas of high-density power flow that may 3
warrant upgrades to the existing bulk transmission grid. It does not compare 4
possible transmission alternatives or recommend optimal transmission solutions. It 5
also does not provide a detailed cost and scope for particular transmission 6
reinforcements. 7