Embed Size (px)
Citation preview

Chapter 4: Social and Political Context_________________________________________________________________________

Chapter 4: Social and Political Context 38
PURPOSE AND OVERVIEW
The success of conservation efforts ultimately depends on understanding the relationshiphumans have with each other and the environment in which they live. Indeed, attempting toimplement a conservation plan that does not consider the complex interactions of social,economic, political, and cultural realities invites conflict. Such an approach may lead to aninefficient use of human and natural resources, and can potentially weaken local support forconservation efforts.
To help maximize the success of conservation efforts of GTRLC and other organizations inthe Manistee study area, this chapter describes the following social context elements:
� Historical and traditional land use� Current land use� Land ownership� Demographics� Government influences on land conservation� Stakeholder profile
The “land use,” “land ownership,” and “demographics” analyses demonstrate the urgencyfor conservation in the study area and describe the characteristics of the landowners withwhom GTRLC will work. The “government influences” and “stakeholder” sectionsdemonstrate that existing policies offer relatively limited protection of ecosystems, andhighlight the myriad of opportunities for GTRLC and others to influence policies and landmanagement practices by collaborating with landowners, private organizations, and publicagencies.
HISTORIC AND TRADITIONAL LAND USE
PRE-SETTLEMENT HISTORY OF THE STUDY AREA
The earliest evidence of human occupation in northern Michigan is dated as being over10,000 years old. It is likely that these earliest inhabitants were nomadic people whofollowed herds of game animals throughout the area. By 500 BC the region’s originalinhabitants had adopted a more settled lifestyle that relied in part on agriculture. Much ofthis evidence is garnered from numerous archeological sites in the area, including nearly 30sites in Kalkaska County. These sites are most commonly burial mounds, village locations,and campgrounds and most date from between 8,000 BC and 500 AD (MDNR, 1998).Archaeological evidence is only one means of compiling a region’s historical context. Thespoken history of the area’s original inhabitants and their descendants maintain that life onearth began in the Great Lakes, and that their existence in the Great Lakes region mayactually exceed the 10,000 Years Before Present mark denoted by archeological evidence.

Chapter 4: Social and Political Context 39
Because of glacial activity in the area, we may never have scientific evidence that supportsor refutes the claims of pre-glacial human existence.
When the first European explorers made their way through the area, three primary tribeslived in the Manistee region. These include the Oddawa, the Potawatomi, and the Ojibwetribes, and are often referred to collectively as the Aanishnabek. In fact, the name“Manistee” is an Aanishnabek word with various possible meanings. The Aanishnabekactively managed the land in the Manistee region prior to European settlement. Thismanagement included the planting of gardens, hunting, fishing, and perhaps most notably,the burning of certain areas to manage habitat and vegetation types.
EUROPEAN SETTLEMENT
Arriving in 1634, Jean Nicolet is thought to be the first white man to visit northernMichigan (MDNR, 1998). His foray into the region started a string of Europeanexploration in the mid-1600s to investigate the area’s trapping and trading potential.Trapping and trading opportunities were abundant, and these activities formed the backboneof the region’s nascent economy throughout the years of French and British control. TheUnites States claimed the Great Lakes area in 1776, and in 1805 an act of Congress createdthe Territory of Michigan. U.S. control of the region did not go uncontested, however.During the war of 1812 the Oddawa, Ojibwe, and Potawatomi joined a British-led effort todefeat the U.S. interests in the region. This effort was ultimately unsuccessful, and inOctober 1813 General Lewis Cass became the first Governor of Michigan.
The Government Land Office began to survey northern Michigan as early as 1830, butsignificant settlement in the area did not begin until the 1850s when workers dug a canalthrough a sand bar at the mouth of the Manistee to open the river to incoming boat trafficfrom Lake Michigan (MDNR, 1998). This event allowed for the development of the Cityof Manistee and for the timber harvest and log drives that would shape the area.
One of the earliest, and perhaps most telling, accounts of the study area before Europeansettlement can be found in the words of A.S. Wordsworth, who lead a survey party into theManistee’s headwaters in 1869. He writes:
“September 18th, in two canoes, so light we could carry them upon ourshoulders, we commenced descent of the Manistee, from Section 18, T28N,R4W (near Deward). The spring sources of this stream are in hardwoodtimber land, but changing to pine land near the south boundary of T29N;thence for sixty miles on either bank is good pine land, or pine plains, somecork pine, but mostly Norway pine…”
“The Manistee River has been long known as one of the most remarkablestreams in the Northwest in this, that it never floods, seldom freezes, and isnever affected by droughts. The secret of these singular features of the riveris found in the fact that it is fed with springs which flow into the stream from

Chapter 4: Social and Political Context 40
its banks every few rods, so that it is safe to say there are more than athousand spring streams that bubble up and empty their pure waters into theriver within fifty miles of Manistee. These streams vary in size from a smallrill to a good mill stream. Everywhere along the banks of this beautiful riverthey boil out and bubble up in their crystal beauty, affording water as pureand sweet as any in the world…”
Source: MDNR, 1998
While numerous pursuits brought settlers to northern Michigan, nothing changed theeconomic, social, and ecological conditions of the region as markedly as logging. By themid-1800s the timber resources of the northeastern U.S. could not keep up with increaseddemand and the nation’s lumber barons turned to the forests of Michigan for a new supply.Northern Michigan’s abundant timber resources, together with rivers such as the Manistee,which could be used to swiftly transport the logs downstream to the city of Manistee,provided an ideal setting for a growing timber industry. From 1869 to 1900, Michiganproduced more lumber then any other state (Quinlan, 2002). While the lumber industrybrought money and people into the area, it also devastated the area’s ecology. Clearcuttingand a lack of reforestation left vast stump forests with little or no vegetation to secure thearea’s topsoil. The erosion caused by the widespread clearcuts created a sediment load sohigh that it continues to damage fish habitat in the Manistee today (MichiganEnvironmental Council, 2002). In addition, the tinder-dry piles of slash fueled catastrophicfires, which burned thousands of square miles, consumed important organic soil layers, andtook hundreds of lives.
POST-SETTLEMENT
During the early 1900s the United States, including northern Michigan, began toindustrialize. Dams helped to power this industrialization. The Manistee River has arelatively steep, high river gradient, and in the early 1900s, the hydroelectric industry sawits unrealized potential for power production as its last great conquest in the state. TippyDam and Hodenpyle Dam, the river’s only remaining hydropower dams, were completed in1918 and 1925 respectively (MDNR, 1998). Although these dams were built far below thestudy area, numerous smaller dams remain on the river’s upper tributaries, including 12dams in Kalkaska County, one in Crawford County, and six in Missaukee County. Smalldams can fragment aquatic habitats, increase water temperatures, and create non-naturalhabitats while providing little benefit to local residents (see Chapter 6).
While dams helped to modernize the area’s economy, a more pressing issue was therestoration of northern Michigan’s forests. The Civilian Conservation Corps (CCC) wascreated by President Roosevelt in 1933 to boost the economy and increase employmentduring the Great Depression. In addition to employing thousands of men in Michigan, theCCC began to repair some of the logging industry’s damage. The CCC started reforestationefforts, built erosion control and fish habitat structures, stocked millions of fish in the area’sstreams, fought forest fires, and constructed numerous campgrounds in the watershed. Thedenuded forests were of little use to the lumber industry, which transferred them to state
Chapter 4: Social and Political Context 41
and federal ownership in lieu of unpaid taxes. By 1949 Michigan had acquired more than3.6 million acres of state forestland (Michigan Environmental Council, 2002). While stateand federal ownership was a step in the right direction, the CCC and other managers usuallymade little effort to restore the forest to pre-settlement conditions. Instead, they activelysuppressed the natural fire regime and replaced naturally diverse forests with replantedmonoculture habitats that greatly reduced the region’s biodiversity and altered its originalecosystems.
Another significant change in the area occurred when oil and gas exploration began in the1940s. Oil and gas development is very common within the Manistee watershed and to aneven greater extent, within the study area. In fact, the watershed has produced more oil andgas than any other watershed in the state. Frederic Township in Crawford County has moreoil wells than any other township in the state (Pratt, 2002). Production of these resources inthe watershed and the study area continues to increase. These operations pose a seriousthreat to the ecological integrity of the watershed, largely as a result of increasedfragmentation caused in part by the wells themselves and even more so by the newly-constructed access roads (see Chapter 6).
Agriculture represents another historical land use still present in the study area.Incompatible agriculture can cause a number of ecological problems including sediment,chemical, and nutrient runoff into streams, habitat fragmentation, and a loss of biodiversity.The majority of the agriculture in the study area consists of pasture or Christmas tree farms.However, there are a few farms in the study area that produce potatoes. Potatoes are arelatively intensive crop that requires supplemental irrigation as well as significant amountsof nutrients and chemicals.
Today, the residents of the study area continue to depend on its natural resources. Largeareas of public land, abundant wildlife, and beautiful natural areas make the upper Manisteeregion a popular recreational destination. The area’s permanent residents and seasonalvisitors either rely on or are attracted by the region’s natural resources. Although manyresidents unknowingly may threaten the ecological integrity of the area through theiractions, they consistently favor natural resource protection (Pratt, 2002).
CURRENT LAND USE
Land use is often closely correlated to land ownership. Both land use and land ownershipare critical to assess protection possibilities and strategies, present and future land uses candetermine a parcel’s ecological integrity and what protection strategies; are mostappropriate. For example, a private parcel used as residential land and for recreational usesmay call for a different conservation strategy or management goal than agricultural land ora hunting reserve. While each of these landowners may be interested in protecting theirland, past, present, and future land uses will affect the ecological resources of each site indifferent ways. Furthermore, one of the most common protection tools, a conservationeasement, is usually tailored to meet the property’s desired land uses. Although the team

Chapter 4: Social and Political Context 42
recognizes a correlation between land ownership and land use, separate analyses areappropriate and should prove helpful to GTRLC and other audiences.
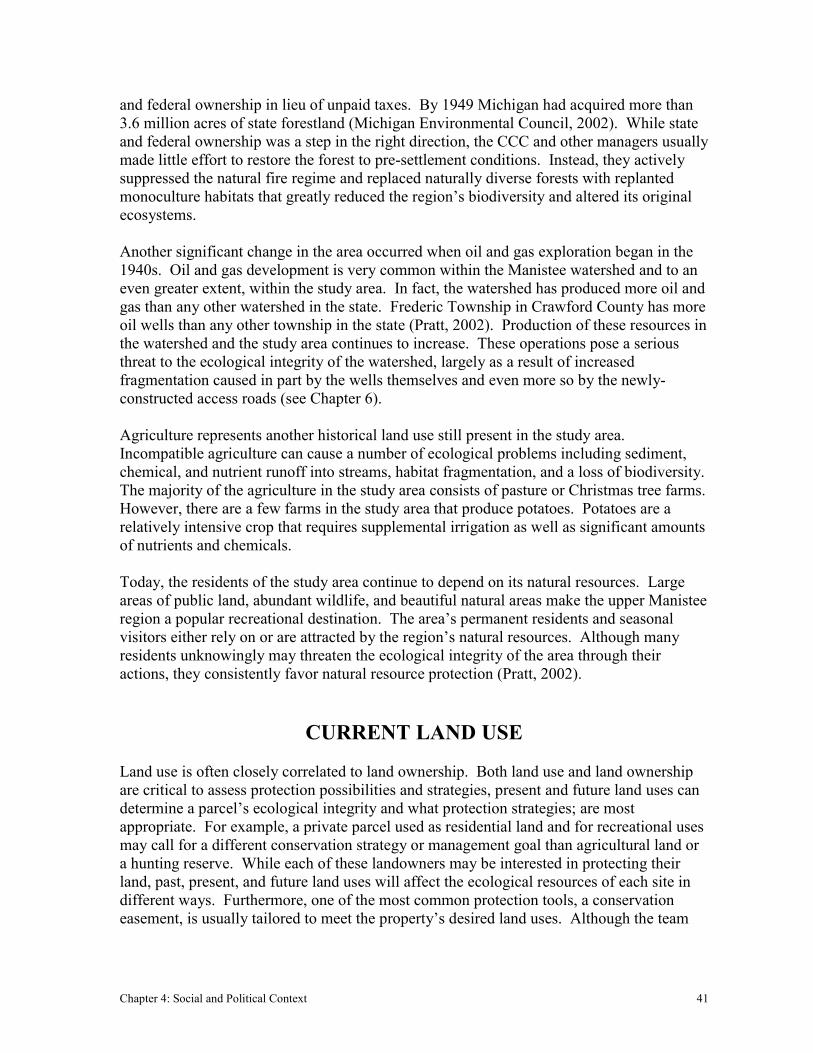
Figure 4.1 is a map of generalized land use and land cover from data collected by MDNR in1978. The level one land classifications are derived from the pioneering work of Andersonet al. and the Michigan adaptation of the Anderson classification system (Olson, 1999).
PRIVATE LAND
There are approximately 150,000 acres of private land in the study area, or roughly 45percent of the total. Private land, like public land, affords widely varying degrees ofprotection to ecological health. The majority of private land is used for residential andrecreational purposes. However, other uses of private land include agricultural activities,hunting reserves, and other commercial uses. Private lands are the primary targets forprotection efforts since the owners generally have the ability to subdivide and sell their landfor development, thus threatening the health of local and regional ecosystems.
RECREATIONAL LAND USE
The most widespread land use in the study area is outdoor recreation. Most local residentsparticipate in some form of outdoor recreation and the majority of the visitors to the areaare interested in the wide range of recreational activities available on public or privatelands. The impacts of recreational activities on the environment are highly variable,ranging from low-impact activities such as bird watching and hiking to high-impactactivities such as off-road vehicle (ORV) use.
Warm Weather Recreation
Although outdoor recreation occurs throughout the year, the most popular activities takeplace during the warm weather months. The area’s rivers and streams are some of the mostpopular summer destinations in Michigan. Such heavy recreational use, if uncontrolled,can seriously impact the area’s natural resources. The popularity of outdoor recreation andits potential for negative impacts warrants the individual review of several of theseactivities.
� Canoeing - Canoeing is one of the most popular recreational activities in the study area.Some of the most heavily canoed stretches of river in the country are found in theManistee River watershed (MDNR, 1998). In the study area, the main-branch of theManistee between Cameron Bridge and Sharon and between Smithville and the U.S.131 Bridge are the most popular stretches for canoeing (MDNR, 1998). Althoughcanoeing is considered a passive form of recreation, it has the potential to negativelyimpact both aquatic and terrestrial resources. Canoeists frequently contribute to
Chapter 4: Social and Political Context 43
Figure 4.1: 1978 land use and land cover, Level I Classifications
N
0 10 20 30 Kilometers
Source: Michigan Department of Natural Resources
1978 Land Use: Level I ClassificationsForest landWetlandsRangelandAgricultural landUrban and built up
Rivers and streamsLakes and reservoirs

Chapter 4: Social and Political Context 44
erosion problems along the riverbank and can pollute the river with litter. The highdemand for canoeing opportunities results in numerous canoe liveries along the river.These commercial properties have the potential to fragment the riparian corridor andincrease human traffic in sensitive natural areas. However, canoeing also allowspeople of all ages and physical conditions to experience nature in a unique andvaluable way. These experiences can change public attitudes and promoteenvironmental conservation.
� Fishing - Fishing is also a major activity along the main branch of the Manistee andmost of its tributaries. The lower segments of the Manistee River, below Tippy Dam,are the most popular due to the salmon and steelhead migration. However, excellenttrout fishing also makes the upper main branch and many of its tributaries very popularamong anglers. Various types of angling are popular in the area including spin castwading, fly fishing, and drift boat or jet boat fishing. Fishing provides an income tonumerous river guides, subsistence fishermen, and fishing supply retailers.Furthermore, many of the other local service industries such as restaurants and motelsdepend on anglers for much of their business. Fishing can create a number ofecological problems including stream bank erosion, introduction of exotic species, andover-fishing.
� Non-motorized Trail Use – The state lands within the study area provide residents and
visitors with ample hiking, biking, and equestrian opportunities. The state forests thatare partially within the study area include many miles of non-motorized trails and arevisited by thousands of people each year. Non-motorized trail use is generally a lowimpact activity. However, the most heavily used trails can produce erosion problemsand require frequent maintenance. Non-motorized trails can also aid in seed dispersalof nuisance species and can fragment the habitats of certain species.
� Motorized Trail Use – In addition to passive, non-motorized trail use, much of thepublic land in the study area is open to ORV use. In contrast to non-motorized trailuse, ORV use can have more serious environmental effects. ORVs can createconsiderable erosion problems and can lead to increased noise, air, and water pollutionin otherwise pristine areas. Trails wide enough for ORV use can serve as fragmentingagents for certain species and they can serve as a conduit for invasive seed dispersal(Watzman, 2001). There are hundreds of miles of trails open to ORV use within thestudy area and thousands of people visit them each year (see Chapter 6).
Cold Weather Recreation Northern Michigan is a year-round recreational destination. While there are some who arenot interested in braving northern Michigan’s sometimes extreme winter conditions, otherssee winter as the best season for recreation. Many of the same activities that are popularduring warmer weather continue throughout the winter, while some activities can only beexperienced during the winter months. These winter activities are economically andsocially important in the upper Manistee area and are outlined below.
Chapter 4: Social and Political Context 45
� Hunting - Hunting is a year-round activity in Michigan, but it reaches a climax inNovember with the beginning of deer season. Some specialty retailers depend onhunters’ business and find deer season to be one of their busiest times of the year. Ingeneral, hunting could be considered a low-impact recreational activity. Deer huntingin particular serves the important function of thinning deer populations that overgrazemany native plant communities. On the other hand, many hunters rely on ORV trails togain access to favorite hunting grounds. As discussed above, these trails harmecosystem health by increasing erosion, creating pollution, and fragmenting naturalsystems. Most hunting occurs on public land, but many local private property ownersmanage their land to improve game habitat. Many landowners own land primarily forhunting purposes. As historic and current members of the conservation movement,hunters could play an important role in future protection efforts.
� Snowmobiling - Snowmobiling is another extremely popular winter activity in northern
Michigan. There are over 6,000 miles of state snowmobile trails in Michigan (MDNR,Snowmobiles, 2002) and as of May 2001, there were over 370,000 snowmobilesregistered in the state. This number has increased every season for the last nine yearsand is expected to continue to grow (MDNR, Snowmobile Program Report, 2001).Retailers in northern Michigan rely heavily on snowmobilers for business through theslower winter months. Snowmobiles use many of the same ORV trails that are popularin the summer months. They also make use of smaller trails and roadsides to get fromplace to place. Snowmobiles may have less impact on plant communities since manyare dormant and buried under the snow during the winter. However, snowmobiles cancause erosion problems in sensitive areas, damage young trees, frighten wildlife, andcontribute significantly to noise and air pollution.
� Ice Fishing - Frozen lakes and cold temperatures allow many northern Michigan
fishermen to ice fish. Many of the area’s lakes including Lake Margrethe, Bear Lake,and Manistee Lake are popular among ice-fishermen. Ice fishing has a very low impacton the environment while bringing much needed income to local retailers.
� Skiing - Cross-county and downhill skiing are also popular in northern Michigan. A
very small downhill facility, Hanson Hills, exists just outside of the study area nearGrayling. Cross-country skiing is more popular in the study area and has minimalimpact on the environment. Skiers can use hiking trails, ORV trails, or no trail at all togain access to remote areas. Cross-country skiing provides a unique opportunity towitness and interact with wildlife due to its lack of noise and low environmental impact.
NATURAL RESOURCE-BASED LAND USE Silviculture Silviculture, the cultivation of forest trees for harvest, is a major industry in the study area.A review of aerial photographs of the study area and conversations with local forestersreveal that natural hardwood woodlots as well as red pine, aspen, and Christmas tree

Chapter 4: Social and Political Context 46
plantations are common. The size and management styles of these forests varyconsiderably depending on ownership and management goals. The ecological impacts ofsilviculture are also quite varied. The management practices of many small private treefarms may benefit local wildlife and ecological integrity. Selective harvest and plantingpractices can actually improve forest quality on many private woodlots. Conversely, largescale industrial tree farms and profit-driven management practices can severely fragmentecosystems, produce chemical and fertilizer pollution, destroy habitat, and encourage thespread of pests and disease (see Chapter 6). There are a number of ways to groupsilvicultural activities in the study area. For the purposes of this report, Christmas treefarms are considered separately from private woodlots or industrial tree farms. � Christmas tree farms - Christmas tree farming is a major land use in the study area. As
recently as 10 years ago, 10,000 acres of land within Kalkaska County were used forChristmas tree production (Bromelmeier, 2002). However, market fluctuations anddevastating pest and disease problems have led to a drastic decrease in Christmas treefarming in the region. There are currently around 4,000 acres of Christmas tree farmsin Kalkaska County, over half of which are within the study area (LaRowe, 2002).Christmas tree farming falls somewhere between traditional agriculture and silviculture.Christmas trees require seven or eight years of growth before harvest. Historically,many of the area’s Christmas tree farms were run by absentee landowners who wereattracted by the relatively small amount of management needed to profit from the land(LaRowe, 2002). However, as the percent of regional acreage planted in Christmastrees grew, pests, and disease were able to spread with little resistance. To overcomethese problems, large amounts of expensive chemicals were needed. With littleexpertise in chemical management and application, many of the smaller farmers wereforced out of the market. This has resulted in thousands of acres of abandonedChristmas tree farms. The restoration of these lands to more natural land cover can bean expensive and slow process. Typically, retired farms are parceled off and sold tonew residents, leaving them to deal with restoration efforts (LaRowe, 2002).
� Private woodlots - Private woodlots are a common land use in the study area. These
“tree farms” are not always monocultural pine plantations planted in neat rows. A moretypical woodlot in the area consists of a variety of tree species and forest types (Stone,2002). While some portion of the woodlot may include the stereotypical rows of redpine, the majority are mixed hardwoods. Tree farms are defined by their management;owners manage the land with periodic timber harvesting as one of many managementgoals. Other goals may include recreation, wildlife, and watershed protection (Stone,2002; Erickson, et al., 2001). Many landowners that periodically harvest their timberresources are enrolled in the Michigan Tree Farm System. Enrollment requires aminimum acreage in forest cover and an approved forest management plan.Membership does not provide any financial incentives or tax breaks. While there is nostereotypical tree farm, an average tree farm may be 40 or 80 acres in size and familyowned (MI Tree Farm System, 2002). Depending on the tree cover, forest thinningevents may occur every 10 to 12 years and small clear-cuts will take place atconsiderably longer intervals.

Chapter 4: Social and Political Context 47
� Industrial tree farms - There is also significant variability among industrial tree farms.They range from small 40 acre parcels to large tracts of land spanning more than 2,000acres. In addition to corporate ownership, industrial tree farms differ from private treefarms in management style. To maximize profit, more emphasis is usually placed ontimber harvest instead of recreation or wildlife management. Some of the majorindustrial timber managers in the area include Georgia Pacific, Weyerhaeuser, Mead,and AJD Forest Products. While some may own land in the area, it is more commonthat they rely on timber resources from other private landowners or from public lands.According to a Weyerhaeuser representative, the Weyerhaeuser OSB (oriented strandboard) plant just south of Grayling consumes approximately 375,000 cords of timberannually. Roughly 65 to 70 percent of this timber comes from private land with the restharvested from mostly state owned land (Malm, 2002).
Mineral Extraction
The area’s geological features are rich in oil and gas resources and mineral extractionactivities are commonplace. The majority of the mineral extraction rights have long beensevered from the properties themselves (Korn, 2002). A typical oil or gas well requires atwo acre clearing and an access road. Much of the mineral extraction is conducted onpublic land, but mineral developers also increasingly target private land. Because few ofthe area’s property owners still possess their mineral rights, they have little say in thedevelopment of the mineral resources beneath their property (Korn, 2002). Thedevelopment of more and more oil and gas wells poses a serious threat to ecologicalintegrity (see Chapter 6).
Agriculture
Traditional agriculture is not a very extensive land use in the study area; according to 1978land use data cropland encompasses just over 20,000 acres in the study area. The region’supland soils are typically either too sandy and nutrient-poor, or soils are too wet near thearea’s wetlands. The tilled cropland found in the study area is most commonly planted withpotatoes. Potatoes are typically grown using large amounts of chemical and nutrient inputsas well as irrigation (Bromelmeier, 2002). Excess chemical or nutrient inputs can runoffinto nearby surface water or sink through the area’s highly permeable soils into shallowgroundwater aquifers causing water pollution problems. Furthermore, there is very littlebiodiversity in the monoculture cropland. Agricultural land can, however, provide positiveelements to the study area. Farmland can serve as migration routes for some mammal andbird species (Reisner, 1997). Additionally, farmlands have scenic and cultural values,providing open space free from residential development. Finally, farms contribute to theeconomic and social fabric of many rural communities.
Many of the area’s farmers have taken their land out of production in recent years, mainlybecause many are becoming too old to work their land (Bromelmeier, 2002). The averageage of farmers in Michigan and across the country has risen dramatically over the last few

Chapter 4: Social and Political Context 48
decades (U.S. Department of Agriculture, 2002). Many farmers depend on the value oftheir land for retirement income. With limited restrictions on land division and conversion,farmers face tremendous pressure to sell their land for development.
Commercial
A very small amount of land in the study area is owned by commercial enterprises. Thesebusinesses mostly focus on tourism and include hotels and motels, restaurants, and retailsupply stores. There are also numerous service-oriented businesses and industriallandowners. The most common industries in the study area are resource-based such asforestry or mining operations.
Right-of-Ways
The term “right-of-ways” is generally used to describe long linear strips of land owned orused by public utilities, railroads, telecommunication companies, or transportationdepartments. Right-of-ways are used to provide public services such as power distribution,phone lines, and roads. In some cases these strips of land are actually owned by privatecompanies. One such example is a thin strip of land owned by Consumer’s Energy that isover 11 miles long and runs through southeastern Antrim County. More commonly, privatecompanies or public agencies will arrange easements across private parcels that allow forthe construction of infrastructure across the property. The ecological implications of right-of-ways vary. Right-of-ways are often cleared of vegetation using large amounts ofherbicide, which may adversely affect wildlife and water quality. They also serve asfragmenters for native flora and fauna, and as pathways for invasive species. The securingof right-of-ways may also be a precursor to development. Often times, new construction isnot permitted until roads and utilities are made available to the area.
Private Hunting Reserves
There is at least one large private game reserve or “hunt club” within the study area. Theselandowners usually have a land management plan that emphasizes the protection andcreation of game species habitat. A board of directors typically makes land managementdecisions to ensure that all members will be in favor of land management practices (Korn,2002). Landowners usually erect tall fences around the perimeter of the property toeliminate trespassing and to keep desirable game species on the property (Bromelmeier,2002). Access to the property and the associated wildlife is restricted to paying customersinterested in this unique and usually successful hunting experience.
Hunting reserves present interesting opportunities and constraints for land protection. Theyare typically large (ranging from 40 to more than 1000 acres) and are managed to improvewildlife habitat - qualities that are attractive to land conservancies. However, they arealmost always fenced, impeding normal wildlife movement and are usually managed with a

Chapter 4: Social and Political Context 49
focus on large game species. Sometimes this management includes the introduction of non-native plant species as cover. Despite these limitations, hunting clubs present anopportunity to protect a large area of land while only dealing with one landowner.
RESIDENTIAL LAND USE
Residential development is a growing concern in many parts of the study area. There is awide variety in size, density, and value of residential land across the study area. Newhomes are continuously being constructed, both on undeveloped land as well as in place ofexisting structures. The large amount of public land and wetlands makes the remainingvacant, buildable parcels prime targets for development. This is particularly true alongwaterfront property. Threats associated with future development are a prime concern to theproject team, GTRLC, and other local and regional land trusts. Potential threats include thedestruction or conversion of wildlife habitat, alteration of hydrologic regimes,fragmentation, and pollution (see Chapter 6).
The majority of the private land in the study area support year-round or seasonal residences.Residences within the study area are more or less equally split between seasonal homes andyear-round residences (Pratt, 2002; Leach, 2002). Parcel size and density vary considerablyranging from 640 acre tracts of individually-owned private land to subdivisions composedof hundreds or even thousands of ¼ acre lots. According to the Michigan Association ofRealtors’ vacant land sales data for Crawford and Otsego Counties, over the last four yearsthe average sized parcel sold is roughly eight acres in size. This average represents theproduct of widespread variability as the size of vacant land sold in the area ranged fromover 370 acres to lots less than ¼ acre (Water Wonderland, 2002).
There are thousands of acres of privately owned land in the study area that contain noformal infrastructure or housing. The current and future land uses of these parcels vary.Eventually, many landowners hope to build a retirement home or seasonal home on theproperty. Other parcels may be effectively not suitable for development and are only usedfor recreational purposes such as hunting or camping.
LAND USE TRENDS
The most notable trend in land use change throughout the study area and much of northernMichigan is the parcelization and development of natural land. Not only is land ownershipbeing dispersed, but the land is changing from forested or recreational land uses toresidential, particularly along river corridors and lakefront property (Pratt, 2002).Unfortunately, this trend is difficult to document accurately. However, a review of landsales and discussions with local planners reveal that development pressure is high andavailable parcels are rarely on the market for any extended period of time (Pratt, 2002).While the state actively pursues the acquisition of valuable inholding properties (Rozich,2001), there are limited opportunities and resources available to acquire expensive privateland.

Chapter 4: Social and Political Context 50
There is a close relationship between land ownership and land use, and indeed, both mayaffect future opportunities for land protection. Just as different landowners have variousopinions about the protection of their land, different land uses may limit protectionpotential. Some land uses, such as hunting, correspond very well with traditional land useprotection strategies, while others, such as residential development or mining operations,are generally incompatible with long-term protection. Due to the size of the study area anda lack of site specific data, this section was intended only as an introduction to the broadcategories of land use and does not convey parcel-level information.
LAND OWNERSHIP
One of the most critical considerations for choosing land protection strategies is landownership. Ownership of land in the study area helps determine what tools and strategiesthe GTRLC and others can use to protect ecological integrity and minimize threats. Privateownership generally affords less protection of ecological health than publicly owned landsand is thus the focus of GTRLC’s conservation efforts. A majority of the land in the studyarea, approximately 55 percent, is publicly owned and is beyond the scope of traditionalprotection methods. However, these public lands are also vulnerable to ecologicaldegradation through land management techniques or transfer of ownership to privateindividuals. Therefore, an inventory and analysis of the various landowners includes bothpublic and private landowners. The team’s intent is to identify non-traditional protectionstrategies and collaboration opportunities that will help the GTRLC further its efforts in thestudy area. Furthermore, the team is distributing this report to other audiences such aspublic land managers, watershed groups, and other land trusts, thereby creatingopportunities for more comprehensive analysis and recommendations.
PROTECTED LAND
For the purpose of this project, “protected land” includes all areas on which development islimited or prohibited either through public ownership, land trust ownership, or conservationeasement. Several different parties manage more than 187,000 acres of protected land inthe study area for a variety of purposes. The vast majority is state land and is open to thepublic. There is also a significant amount of land that is not open to public use but isprotected from commercial or residential development. Examples include the CampGrayling military land, portions of which are closed to public recreational use but willprobably never be parcelized and sold into private ownership, and a few parcels that areowned or managed by private land trusts such as the GTRLC. Although public access tothese lands may be restricted, their use and management provide for long-term protection.
State Forest Land
Nearly all of the public land in the study area is state forest land managed by the MichiganDepartment of Natural Resources (MDNR). Major state forests in the study area include

Chapter 4: Social and Political Context 51
portions of the Pere Marquette State Forest (roughly 125,000 acres), the Au Sable StateForest (roughly 30,700 acres), and the Mackinaw State Forest (roughly 16,000 acres).These areas make up over 50 percent of the study area. Ample recreation opportunitiesexist in these state forests including many miles of trails for ORV use, snowmobiling,biking, hiking, cross-country skiing, and horseback riding. There are also numerouscampsites, boat launches, and other improved facilities for park visitors. Besidesrecreation, MDNR also manages state forest lands for timber and mineral production, fishand wildlife habitat, and environmental quality (MDNR, This is the DNR, 2002). Thismultiple-use doctrine can place ecological health at risk in areas that are not managedsustainably. While GTRLC generally concentrates its efforts on conserving privately-owned lands, the stakeholder analysis section of this report investigates the interests ofMDNR and identifies collaboration opportunities between GTRLC and MDNR to promotebetter protection of the area’s ecological integrity.
Camp Grayling
In addition to the vast areas of state forest land in the study area, there are a few areas ofprotected land managed by various organizations, agencies and companies. Most notable ofthese are a number of large tracts in eastern Kalkaska County managed by the MichiganDepartment of Military and Veterans Affairs (MDMVA). This tract, known as the CampGrayling Maneuver Training Center – South Camp (Camp Grayling), is partially owned byMDMVA and partially leased through indefinite or long-term leases from MDNR.According to the Kalkaska County plat map approximately 14,500 acres of land in thestudy area are owned by the State Military Board for Camp Grayling (Rockford, 1999).The land is used for a variety of military training activities including small arms exercises,heavy artillery drills and air-to-ground bombing (MDMVA, 2001). The majority of thisland is not open to the public and is protected from future development. The location ofCamp Grayling activities is driven by its “Integrated Natural Resources and ManagementPlan” developed by MDNR and the U.S. Fish and Wildlife Service (MDMVA, 2001). Thisplan is very thorough and uses various GIS data to inventory and analyze Camp Graylinglands to assess which areas are more fragile, focusing more destructive exercises on lesssensitive lands.
The Great Lakes Fishery Trust
The Great Lakes Fishery Trust (GLFT) was formed in 1996 as a result of a court settlementbetween the Consumer’s Power Company (now Consumer’s Energy) and the DetroitEdison Company - both co-owners of the Ludington Pumped Storage Project (LPSP)hydroelectric facility - and various plaintiffs including the Michigan Department of NaturalResources (MDNR), the Michigan United Conservation Clubs (MUCC), the NationalWildlife Federation (NWF), the U.S. Department of the Interior, and several NativeAmerican tribes. The settlement sought to make reparations for the destruction of fishcaused by normal operations at the LPSP over the past 20 years. Among other aspects ofthe agreement, Consumer’s Energy deeded 14,000 acres of undeveloped land in Michigan

Chapter 4: Social and Political Context 52
directly to MDNR. Consumer’s Energy also transferred over 10,000 acres of land toGLFT. GLFT then sold this land to private and public landowners to raise money forGLFT to use to protect and restore the health of Great Lakes fisheries (Great Lakes FisheryTrust, 2002). Conservation easements, designating linear 100 ft. shoreline buffers, wereattached to property shorelines to protect sensitive lands, water quality, and fish habitat.GLFT contracts with local and regional land trusts to monitor these easements to ensurethat all aspects of the contract are being upheld. GLFT no longer owns land within thestudy area (Bails, 2002). However, the Grand Traverse Regional Land Conservancy stillmonitors a few easements on properties once owned by GLFT along the main branch of theManistee in Kalkaska County (Rigney, 2002).
Conservancy Land
GTRLC has also protected roughly 1,260 acres in the study area through acquisitions andconservation easements. This includes approximately 160 acres of land in Oliver Townshipin Kalkaska County that has since been transferred to MDNR and approximately 1,100acres of land with conservation easements that GTRLC manages directly. While privateproperty protected with an easement is by no means public land, it is protected from futuredevelopment even more strictly than most public lands.
Municipal Land
A small category of public land in the study area is local municipality land. This landprimarily consists of county or township park land. These parcels are most commonly usedas natural areas, athletic playing fields, picnic areas, campgrounds, or scenic overlooks andprobably total less than 500 acres within the study area (Kutkuhn, 2002).
LAND VALUES
Land values greatly influence the ability of a land conservancy to conserve ecologicalintegrity. There often exists a positive correlation between price per acre and a parcel’secological or aesthetic value. For example, a diverse hardwood forest will probably have ahigher selling price than an equally sized shrubland property. To help inform GTRLC’sconservation decisions, the team investigated the distribution of average land values in thestudy area.
Many factors contribute to the selling price of an acre of land, including land cover,frontage, road access, location, buildable soils, neighboring land use, and overall size of theparcel. These factors can be witnessed in the large range in selling prices of land in thearea. For example, lakefront or river front land will obviously be more expensive thanland-locked or swamp land. However, according to vacant land sales in Otsego andCrawford Counties, the average price per acre is rising regardless of location or type(Figure 4.2). Land use can also have a significant impact on land value. For example, a

Chapter 4: Social and Political Context 53
0.21 acre lot along the edge of a golf course in Hayes Township, Otsego County sold for$33,000 (over $150,000 per acre) in 2000. At the other extreme, a 10.05 acre parcel inMaple Forest Township, Crawford County sold for only $6,500 (less then $650 per acre) in1999 (Water Wonderlands, 2002).
Data indicates that an acre of vacant land has risen in value from roughly $2,500 in 1998 toalmost $6,000 in 2001(Water Wonderlands, 2002). The trend of rising local land values isconfirmed by Tom Lowell, MDNR Office of Property Management, who estimated thatland values in the area had nearly doubled over the last two to three years (Lowell, 2002).
Figure 4.2: Average selling price of an acre of vacant land in Crawford and Otsego counties from 1998 to 2001
TRENDS IN LAND OWNERSHIP
Ownership transactions represent a key component of the overall analysis of landownership in the study area. One particularly critical process in the ownership of land overtime is the subdivision of individual parcels into multiple parcels. These smaller parcels arefrequently sold off to numerous new landowners. This subdivision of land can lead toserious ecological fragmentation and challenge conservation efforts by increasing thenumber of individual landowners and building sites in a specific area. State and localpolicies affecting land division are addressed later in this chapter.
There are also a number of transactions between state land managers and private residents.The Michigan Natural Resources Trust Fund (MNRTF) is the publicly created grantprogram that allocates money for acquisition of land and also for recreational infrastructure.MNRTF was created in 1976 through the passage of Public Act 204 (the KammerRecreational Land Trust Fund Act of 1976) and signed into law on July 23, 1976 (Trust forPublic Land, 2002). The bill established that revenues from oil, gas, and mineral leases on
0
2000
4000
6000
8000
1998 1999 2000 2001
Year
Pric
e pe
r Acr
e

Chapter 4: Social and Political Context 54
state land would fund the purchase of natural and recreational lands. State land managersor local units of government may apply to MNRTF for grants that are awarded to protectspecific parcels. Successful grants must secure at least a 25 percent local match. The grantapplications are evaluated using 11 criteria (MDNR Information Center, 2002):
1. Protection and use of significant natural resources2. Use of inland waters3. Population served4. Economic benefits5. Hunting, fishing, and other wildlife-related values6. Need for proposal7. Capability of applicant8. Site and project quality9. Special initiatives of the MNRTF Board10. Financial need of the applicant11. Local match contribution
Over the last 25 years, MNRTF has distributed more the $325 million to support theprotection of over 140,000 acres (Trust for Public Land, 2002). While year-to-year grantawards vary, MNRTF typically distributes between $20 million and $25 million per year.However, declining revenues from oil, gas, and mineral leases (MDNR Information Center,2002) may lead to less land acquisition by local and state-level agencies.
State land is also frequently taken out of public ownership. Due to the limited amount ofprivate and buildable land in the area, private citizens looking to own land in the areafrequently turn to the state for potential sales. State lands are privatized though four basicprocesses (Thiel, 2002):
1. Private purchase through state auctions - During compartment reviews, state landmanagers may identify a state parcel as “excess” and put the parcel up for auction.These lands are frequently small parcels in or around population centers that havebeen acquired through tax reversions. The state has little use for these small andisolated parcels and sells them to private citizens.
2. Private purchase through request - People submit applications for the purchase ofstate land. This is very common and an increasing trend as the demand for privateland increases. Requests are processed through a number of administrative reviews.Successful applicants work with the state’s Office of Property Management tonegotiate a fair selling price. A small proportion of requests are successful.
3. Public/private land swap - This process is very similar to purchasing, but otherparcels are offered in exchange as opposed to financial payment. This option isusually more attractive to the state because they can evaluate both land parcels anddetermine what they are getting and what they are giving up. However, the popularityof this option began to overload MDNR field staff who were required to evaluate eachproposal. About 12 years ago a $300 application fee was implemented to reduce the

Chapter 4: Social and Political Context 55
number of unrealistic requests (Lowell, 2002). A “land exchange review committee”comprised of state employees evaluates each proposal using field staff notes andissues a decision on each independent proposal.
4. Political land transactions - The Michigan Department of Natural Resources is apolitical entity and is therefore subject to political dealmaking. To achieve otherbureaucratic goals, the MDNR may deed specific state land to local units ofgovernment in return for political support.\
Land ownership and the associated protection status are critical components in thedevelopment of future conservation efforts. Land ownership is particularly important in thestudy area due to the large proportion of state land. Furthermore, the mission andmanagement decisions made by MDNR do not always secure ecological integrity. Theproject team also recognizes that private landowners are far from homogenous. Some maydesire the long-term protection of their property while others are most interested inmaximizing their investment or protecting the full spectrum of their property rights. Thissection merely gives a brief overview of each of these issues. Further consideration mustbe given to every targeted conservation area to evaluate the potential for successful futureprotection efforts.
DEMOGRAPHIC PROFILE
This section provides a demographic analysis for the upper portion of the Manistee Riverwatershed. This analysis is based upon census data information gathered on the countiesand townships in which the study area is located.
Developing a basic profile of the human population living in and around the study areahelps GTRLC and other stakeholders involved with conservation planning to 1) betterunderstand the context of human-related sources of ecological stress, and 2) identify broadcharacteristics and values of various stakeholders and how these may affect thedevelopment and implementation of a conservation plan.
METHODOLOGY AND USE OF DATA
Creating an accurate portrait of the watershed-based study area poses a unique challengebecause demographic data is almost always compiled and reported based on politicalboundaries. Since watershed boundaries do not conform to political boundaries, anaccurate profile of the study area should be based on political boundaries that most closelycorrespond to the study area boundary. To this end, the project team relied on data at thetownship level whenever possible. However, in the absence of township-level data, theteam used county-level data for some analyses. While such data may less accurately reflectthe actual demographic characteristics of the study area, they are still useful in generatinggeneral assumptions on the study area’s demographics.
Chapter 4: Social and Political Context 56
In extending the demographic data from the township and county levels down to thewatershed level, the project team has assumed a uniform distribution of the data. Forexample, although populations in a township may actually be more concentrated in someareas than others, the team assumed a uniform distribution of the population over thetownship in order to create population estimates for portions of the township which overlapthe study area. Using this logic, the team combined some of the raw township demographicdata with GIS data layers to generate population estimates for each portion of the study areaby township. The team then derived the total population estimate for the study area bysumming all township populations within the study area boundary. For example, if atownship has a population of 1,000 and a GIS showed that 50 percent of the township fallswithin the study area, then the team has assumed that the population of the township withinthe study area is 500. By summing together this same information for each of the 17townships clipped to the study area, the team calculated the total population of the studyarea. The townships contain three population centers – Grayling City, Kalkaska Village,and Mancelona Village – that are located outside of the study area boundary. In order toavoid the influence of these population centers on the study area (which has noconcentrated population centers), the populations of these three areas were subtracted fromthe total township population before calculating the percentage of the township landoccupied by the study area.
In instances where characteristics are normalized by area or percent, such as persons perkilometer or percent of persons over 65, no additional data manipulation was required toapply the data to the study area. For example, if the population of a township increased by15 percent over a ten year period, the project team has assumed that the portion of thetownship in the study area also increased by 15 percent.
Except when otherwise noted, the team obtained all demographic data used in this sectionfrom the U.S. Bureau of the Census (2002). The team derived the area of townships and thestudy area, as well as percentages of public and private lands in the study area (all of whichhave been used to adjust data numbers to reflect the study area population) from GIS layersobtained from MDNR. Census data used in this demographic profile is detailed inAppendix H.
POPULATION AND HOUSING CHARACTERISTICS
Historic and Recent Population Change
Although all five counties are experiencing increasing populations, the historical datadisplayed in Figure 4.3 shows that this has not always been the case for the region. For theperiod from 1900 to 1930, Antrim, Kalkaska, and Missaukee counties experienced markedpopulation declines, while declines in Crawford and Otsego counties were less dramatic.According to Ken Darga (2002), the Michigan State Demographer, this trend is consistentwith larger state-wide and national population trends characterized by a shift from ruralareas and agriculture toward urbanization and industry. This shift was particularly strong inMichigan due to the growing influence of the automotive industry (Darga, 2002). Between

Chapter 4: Social and Political Context 57
1930 and 1960, Missaukee and Antrim counties remained reasonably stable, whileCrawford and Otsego experienced steady but slow growth. Only Kalkaska Countyexperienced a loss of population for this period. This general trend may have beeninfluenced by the Great Depression, when many people migrated back to the relativestability of rural living (Darga, 2002). An obvious upturn in population growth beganaround 1960–1970, which continues to the present. This trend may also be associated witha larger statewide and nationwide “rural revival,” characterized by increased interests inrural areas and a shift from urban centers toward urban fringe and rural areas (Darga, 2002).The study area’s rural character and numerous recreational opportunities may make itespecially attractive to people seeking such rural environments.
Figure 4.3: Population trends for the five counties surrounding the study area, 1900-2000
These population increases over the past three decades, adjusted for the study areaboundary, are illustrated in Figure 4.4. The most significant period of population increase,both in terms of raw number and percent, occurred from 1970-1980 with an increase of2,640 people (80.8 percent). From 1980-1990, the population increased by 1,824 people(30.9 percent) and from 1990-2000 it increased by 2,309 (29.9 percent). To put this mostrecent population growth rate in perspective, the average growth rate for Michigan from1990-2000 was 6.9 percent. Therefore, the study area grew at a rate of more than fourtimes the state average. While growth rates for the study area have slowed slightly from1970 to 2000, the total increase for this thirty year period amounts to 6,773 people, or 207.2percent.
While the population of the study area as a whole increased by 30.9 percent from 1990-2000, Figure 4.5 illustrates that the population change in the study area by townshipboundary varies widely across the study area. With a loss of 9.6 percent (only 28 persons)from 1990-2000, the portion of the study area occupied by Oliver Township was the only
0
5,000
10,000
15,000
20,000
25,000
1900 1910 1920 1930 1940 1950 1960 1970 1980 1990 2000
Year
Popu
latio
n
Antrim
Craw ford
Kalkaska
Missaukee
Otsego

Chapter 4: Social and Political Context 58
area to have a negative growth rate. The largest percent increase was in the area withinHayes Township with an increase of 66.0 percent (442 people). Five other townshipsexperienced growth rates above the study area average: Cold Springs (35.0 percent),Garfield (33.2 percent), Mancelona (49.3 percent), Orange (32.9 percent), and Springfield
Figure 4.4: Estimated population growth for the study area (based on township data adjusted for study area boundaries)
Figure 4.5: 1990-2000 population change in the study area by township
ANTRIM OTSEGOCRAWFORD
MISSAUKEE
KALKASKA
Kalkaska
StarHayes
Mancelona
ColdSprings
BlueLake
Frederic
BearLake
Excelsior
Oliver
Grayling
Garfield
Orange
Springfield
Bloomfield Pioneer Norwich
KalkaskaVillage
Manc elonaVillage
GraylingCity
N0 10 20 30 km
Change instudy area population(1990-2000)
-9.6% - 0%1% - 16.9%17% - 29.9%30% - 49.9%50% - 66%
City or villageTownship boundaryCounty boundary
3,268
5,908
7,732
10,041
0
2,000
4,000
6,000
8,000
10,000
12,000
1970 1980 1990 2000
Ye ar
Popu
latio
n

Chapter 4: Social and Political Context 59
(45.8 percent). The remaining ten townships experienced growth rates ranging from 8.9percent in Frederic to 27.9 percent in Norwich, all of which exceed the state average of 6.9percent.
Population Distribution and Density
Table 4.1 shows the population for each township, as well as the population for each portionof the township within the watershed. This information is useful because it shows thedistribution of the population in the watershed according to township boundaries.Populations within the study area according to township boundaries range from 132 peoplein Kalkaska Township to 1,396 people in Mancelona Township. These numbers can bemisleading if not examined closely, however, as they are influenced by the amount of atownship’s land area within the study area. For example, within the study area, more than10 times as many people live in Mancelona Township as in Kalkaska Township. However,this large difference is almost entirely due to the fact that Mancelona Township alsooccupies nearly 10 times as much land area within the study area as does KalkaskaTownship. A more useful way to examine the population distribution within study area is
Table 4.1: Township and study area populations and population densitiesTownship(County)
Population PopulationWithin Study
Area
PopulationDensity
(People/km2)
Percent ofStudy Areain Private
Land
Study AreaPopulation
Density(Private Land
Only)
Bear Lake (Kalkaska) 746 742 4.0 25.2 15.8Bloomfield (Missaukee) 475 209 5.1 31.8 16.2Blue Lake (Kalkaska) 428 428 4.6 29.7 15.4Cold Springs (Kalkaska) 1,449 777 15.4 85.6 18.0Excelsior (Kalkaska) 855 668 9.1 64.5 14.1Frederic (Crawford) 1,401 720 7.5 21.3 35.3Garfield (Kalkaska) 794 667 2.9 30.1 9.5Grayling* (Crawford) 4,564 604 10.1 18.7 54.1Hayes (Otsego) 2,385 1,113 13.1 89.7 14.6Kalkaska* (Kalkaska) 2,604 132 14.1 100.0 14.1Mancelona* (Anrim) 2,692 1,396 14.5 40.5 35.9Norwich (Missaukee) 646 150 3.4 38.7 8.9Oliver (Kalkaska) 263 263 2.8 38.7 7.3Orange (Kalkaska) 1,176 901 13.1 98.5 13.3Pioneer (Missaukee) 460 365 4.9 45.6 10.9Springfield (Kalkaska) 1,270 687 13.8 67.7 20.4Star (Antrim) 745 220 8.4 100.0 8.4Total / Average 22,953 10,041 8.6 44.9 16.2*excludes city and village populations

Chapter 4: Social and Political Context 60
by population density. When the areas in Kalkaska and Mancelona townships are comparedby population density, the two areas are very similar, with 14.1 and 14.5 persons per squarekilometer, respectively.
While there is considerable variation in population density across the study area, and whilethe population in all areas is steadily increasing, the study area as a whole still has relativelylow population densities. The U.S. Bureau of the Census classifies the entire study area asrural. Even the population centers outside the study area – Grayling City (population1,952), Kalkaska Village (population 2,226), and Mancelona Village (population 1,408) –are classified as rural. Therefore, while the area is experiencing rapid growth, thepopulation density is still relatively low with an average of 8.6 people per square kilometer,as compared to the state average of 67.6 people per square kilometer. The distribution ofthis population density, as illustrated in Figure 4.6, reveals that the six townships with thehighest population densities, ranging from 13.1 to 15.4 people per square kilometer,generally extend in a band from the southwest to northeast portions of the study area. Withthe exception of Kalkaska, these townships also had the highest growth rates by percentagefrom 1990-2000 (Figure 4.5). The lowest population densities occur in the central tosoutheastern portions of the study area occupied by Oliver (2.8 people/km2), Garfield (2.9people/km2), and Norwich (3.4 people/km2) townships.
Figure 4.6: Study area population density on public and private land
ANTRIM OTSEGOCRAWFORD
MISSAUKEE
KALKASKA
Kalkaska
StarHayes
Mancelona
ColdSprings
BlueLake
Frederic
BearLake
Excelsior
Oliver
Grayling
Garfield
Orange
Springfield
Bloomfield Pioneer Norwich
KalkaskaVillage
MancelonaVillage
GraylingCity
N0 10 20 30 km
Population density on public and private land(people per sq. km)
City or villageTownship boundaryCounty boundary
2.8 - 4.95 - 7.98 - 11.912 - 14.915 - 21.9
A significant factor in these low population densities is the large amount of public land (55.1percent) within the study area. Given GTRLC’s focus on conserving private land, andbecause most, if not all, of the study area’s population lives on private property, a moreuseful analysis of population density should factor out public lands. Most of the public lands

Chapter 4: Social and Political Context 61
are located in the southern and eastern portion of the study area, where population densitiesare generally lower than the northern and western edges of the study area.
However, as demonstrated in Figure 4.7 and Table 4.1, when population density is adjustedto consider the number of people per square kilometer of private land, many of thetownships show a considerably higher population density. Frederic Township, with only21.3 percent privately owned land, shows the greatest adjustment of more than four-foldfrom 7.5 people per square kilometer to 35.3 people per square kilometer. In contrast,portions of the study area occupied by Kalkaska and Star townships are entirely privatelyowned, and therefore, densities in these areas did not change when public lands weresubtracted from the analysis. When only using private land to calculate population densityfor the study area, the adjusted average density for the study area is 16.2 people per squarekilometer.
Figure 4.7: Study area population density on private land only
0 10 20 30 km
ANTRIM OTSEGOCRAWFORD
MISSAUKEE
KALKASKA
Kalkaska
StarHayes
Mancelona
ColdSprings
BlueLake
Frederic
BearLake
Excelsior
Oliver
Grayling
Garfield
Orange
Springfield
Bloomfield Pioneer Norwich
KalkaskaVillage
MancelonaVillage
GraylingCity
N
Population density onprivate land only(people per sq. km)
City or villageTownship boundaryCounty boundary
5 - 7.98 - 11.912 - 14.915 - 21.922 - 54.1
Another important factor to consider in estimating population and population density is theeffect of non-residents on seasonal population fluctuations. Because the study area andsurrounding lands are popular recreation and vacation destinations, populations mayincrease dramatically during the summer months. For example, Otsego County, a populargolfing destination, increases from approximately 23,000 people in the winter months(mostly county residents) to 100,000 in the summer (Schlink, 2002). Therefore, actualhuman impacts on the landscape and natural resources may be significantly greater thanexpected from population estimates derived from U.S. Census data, that do not includesecond homeowners and other non-residents.

Chapter 4: Social and Political Context 62
County Population Projections
Figures 4.8 and 4.9 display projected population increases through 2020 in raw numbersand percentages for the five counties encompassing the study area (Michigan Department ofManagement and Budget, Office of the State Demographer, 1996). In raw numbers, OtsegoCounty is projected to have the largest increase with approximately 11,600 additionalpeople over the next 20 years – nearly twice the projected population gains of 6,000 peopleeach in the next two largest gaining counties of Antrim and Crawford. Kalkaska andMissaukee Counties are projected to have the smallest increases over the next 20 years withrespective increases of 5,300 and 4,200 people. The total projected growth for the five-county area over the next 20 years is 33,100 people – an increase of 35.3 percent over the2000 Census population of 97,733.
Figure 4.8: County population projections to the year 2020
Figure 4.9: Projected county growth rate by percent through the year 2020
0
2000
4000
6000
8000
10000
12000
Antrim Craw ford Kalkaska Missaukee Otsego
County
Popu
latio
n In
crea
se
2015 - 2020
2010 - 2015
2005 - 2010
2000 - 2005
0%
2%
4%
6%
8%
10%
12%
2000 - 2005 2005 - 2010 2010 - 2015 2015 - 2020
Year
Perc
ent
Antrim
Craw ford
Kalkaska
Missaukee
Otsego
Michigan Average

Chapter 4: Social and Political Context 63
When the same data is presented in terms of percentage increase, Otsego stands out again asthe county with the steepest projected growth rate, followed by Crawford, Kalkaska,Missaukee, and Antrim counties. With the exception of Kalkaska County, the other fourcounties are projected to follow a similar pattern of slightly slowed population growth rates,followed by increased growth rates, and finally ending in 2020 with slowing growth rates.
However, compared with the projected state average growth rate of between 1.6 percent to1.8 percent over the same time period, all five counties are expected to grow at a rate manytimes the statewide average.
Housing Units
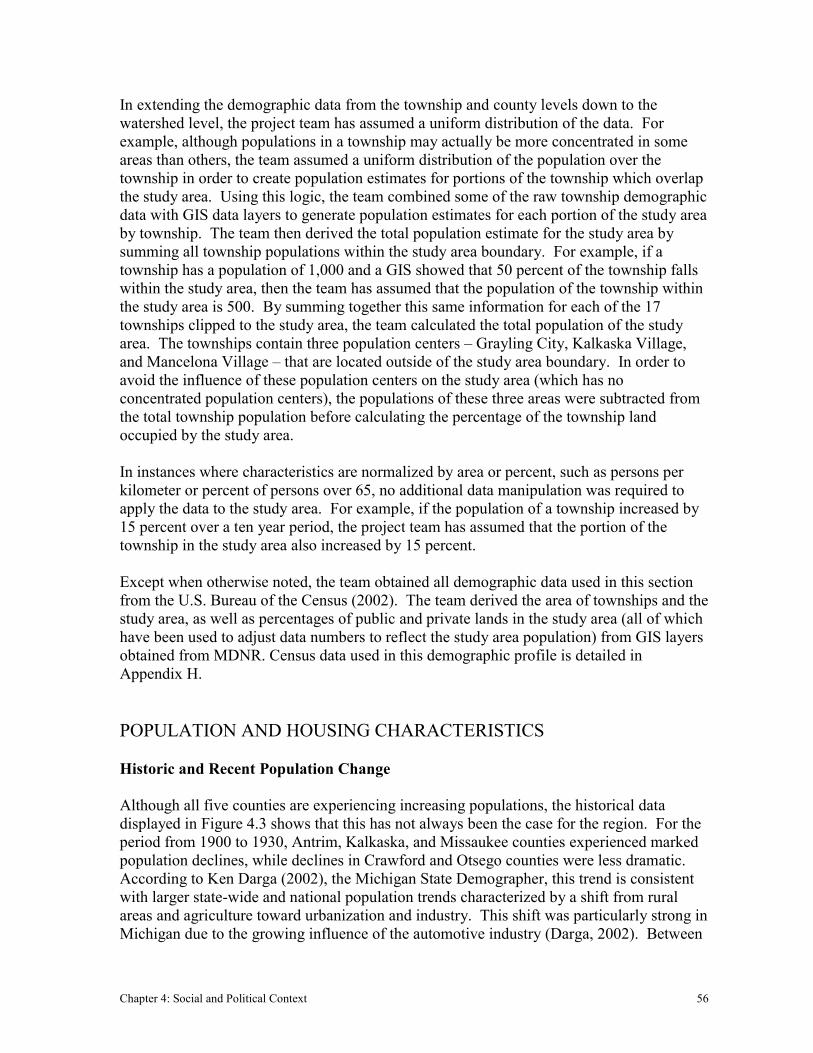
The estimated number of housing units (H.U.) in the study area for 2000 is 8,281 or anaverage of 6.0 H.U.s per square kilometer. As with population estimates for the study area,the team factored out the number of housing units in Mancelona and Kalkaska Villages andGrayling City to avoid any bias toward erroneously high estimates from more populatedareas outside the study area. Figure 4.10 displays the density of housing units for the studyarea and surrounding townships. Cold Springs Township has the highest H.U. density at14.4 H.U. per square kilometer, followed by Mancelona Township with 8.5 H.U. per squarekilometer, Blue Lake Township with 7.7 H.U. per square kilometer, and SpringfieldTownship with 7.5 H.U. per square kilometer. The lowest housing unit densities are foundin Oliver, Garfield, and Norwich Townships ranging from 2.6 to 2.9 H.U. per squarekilometer.
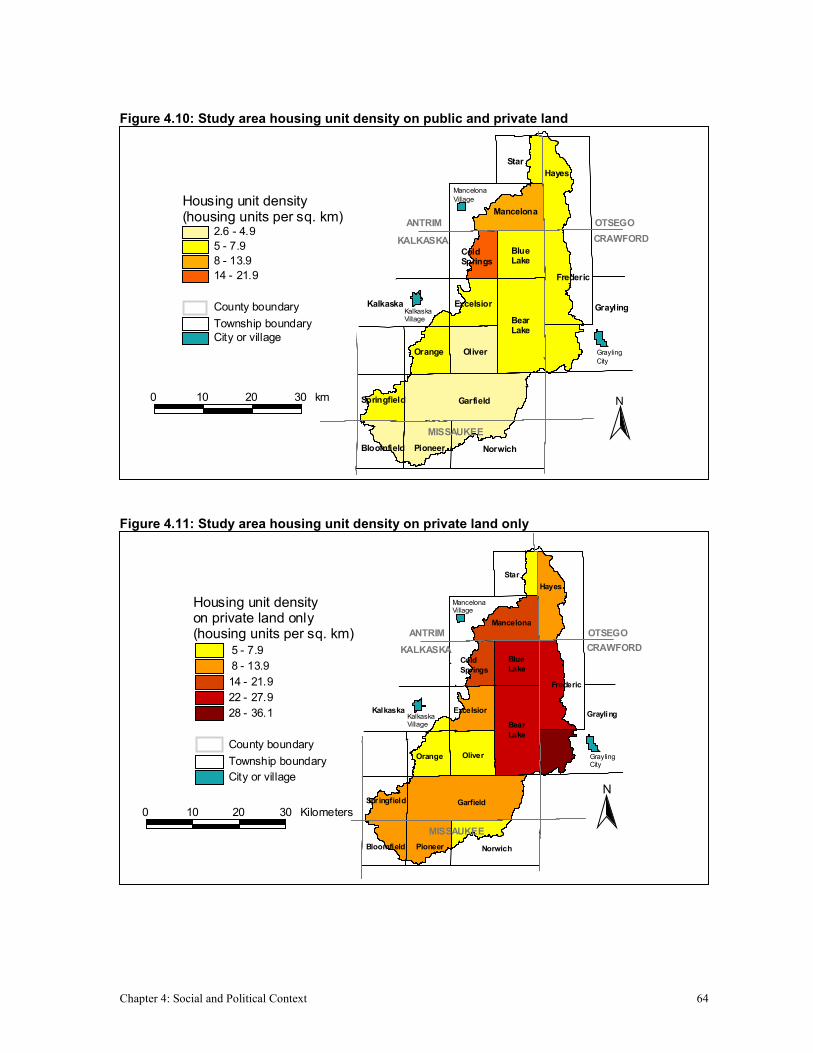
As with population density, the project team also calculated housing unit density on privateland only. The changes, as shown in Figure 4.11, are proportionately equal to the changesin population density. Therefore, just as Bear Lake Township had an increase in populationdensity of nearly four-fold, the same increase occurs in housing density. Overall, theadjusted housing unit density for the study area on private land only changes from 6.0 to 9.6H.U. per square kilometer.
When the ratio of population to housing units is examined, the study area has an average ofone housing unit for every 1.3 people. This ratio is considerably lower than the stateaverage of one housing unit for every 2.4 persons. However, the total number of housingunits in the study area includes a high percentage of housing units used for seasonal,recreational, or occasional use. When the number of seasonal/recreational housing units(3,639) is factored out, the ratio more closely matches the state average. This highpercentage of seasonal housing units is significant because it demonstrates the influence ofrecreational activity on the human and natural environments. A high number of seasonalhousing units indicates a seasonally fluctuating population base that is likely to be muchhigher during the warmer months when residents from outside the study area occupysecond homes in the study area. Therefore, the actual population of the study area duringtimes of peak recreational activity is probably much higher than the reported residentialpopulation of 10,041.
Chapter 4: Social and Political Context 64
Figure 4.10: Study area housing unit density on public and private land
ANTRIM OTSEGOCRAWFORD
MISSAUKEE
KALKASKA
Kalkaska
StarHayes
Mancelona
ColdSprings
BlueLake
Frederic
BearLake
Excelsior
Oliver
Grayling
Garfield
Orange
Springfield
Bloomfield Pioneer Norwich
KalkaskaVillage
MancelonaVillage
GraylingCity
0 10 20 30 km N
Housing unit density(housing units per sq. km)
2.6 - 4.95 - 7.98 - 13.914 - 21.9
City or villageTownship boundaryCounty boundary
Figure 4.11: Study area housing unit density on private land only
ANTRIM OTSEGOCRAWFORD
MISSAUKEE
KALKASKA
Kalkaska
StarHayes
Mancelona
ColdSprings
BlueLake
Frederic
BearLake
Excelsior
Oliver
Grayling
Garfield
Orange
Springfield
Bloomfield Pioneer Norwich
KalkaskaVillage
MancelonaVillage
GraylingCity
N
Housing unit density on private land only(housing units per sq. km)
City or villageTownship boundaryCounty boundary
28 - 36.122 - 27.914 - 21.98 - 13.95 - 7.9
0 10 20 30 Kilometers

Chapter 4: Social and Political Context 65
SOCIO-ECONOMIC CHARACTERISTICS
Population Age 65 and Older
The number of people age 65 and older is of particular interest to GTRLC because olderlandowners tend to own most of the large, intact properties. Many of these landownersinherited forested or farmed land from their parents or grandparents when land was lessexpensive, or in some cases, homesteaded. Many others purchased parcels before landprices increased to reflect the recreational and scenic values (Rigney, April 2002). Inaddition, landowners that have owned or inhabited their property for longer periods of timetend to have a higher sense of environmental stewardship and personal attachment to theland. Furthermore, as a landowner grows older, the landowner may desire to stipulate thatthe land be protected from future development (Ochterski, 1996).
Figure 4.12 shows the distribution of persons aged 65 and older by township for the studyarea. Of the 17 townships, six have a percentage of people aged 65 and older less than thestate average of 12.3 percent. These townships are centered around the southeast andnorthern portions of the study area. The percentage of persons aged 65 and older for theremaining 11 townships is higher than the state average, with the highest two being BlueLake (33.4 percent) and Bear Lake (22.3 percent) townships, which are located in the centerof the study area. The estimated number of people aged 65 and older for the study area is1,602, or 15.9 percent of the total study area population, which is well above the averagefor Michigan as a whole.
Figure 4.12: Percentage of persons age 65 and older in the study area
ANTRIM OTSEGOCRAWFORD
MISSAUKEE
KALKASKA
Kalkaska
StarHayes
Mancelona
ColdSprings
BlueLake
Frederic
BearLake
Excelsior
Oliver
Grayling
Garfield
Orange
Springfield
Bloomfield Pioneer Norwich
KalkaskaVillage
MancelonaVillage
GraylingCity
N0 10 20 30 km
Percent of peopleage 65 and older
9 .0% - 9.9%10.0% - 12.0%12.1% - 16.6%16.7% - 22.3%22.4 %- 33.4%
City or villageTownship boundaryCounty boundary

Chapter 4: Social and Political Context 66
Median Household Income and Poverty Rates
Median household income and percent of a population in poverty are both important factorsto consider when designing and implementing a conservation plan. Receptiveness toconservation activities may be tied to the real or perceived economic impact of suchactivities on individuals and the community as a whole. Individuals with lower incomesmay be under greater pressure to subdivide their property and sell to development interests.Similarly, if property values increase due to development pressures, a parcel may bethought of as a financial investment and one that a landowner may not wish to compromiseby allowing restrictions to be placed on future development and use.
Figure 4.13 displays 1997 median household income for the five counties (U.S. EconomicCensus, 1997). All five counties show a lower median household income than the stateaverage of $38,883. The average median household income for the five counties is$32,579, which is $5,253 below the state average. Crawford County shows the lowestmedian household income at $29,587. Otsego County ranks highest with $37,938 perhousehold, which is only $945 below the state average.
Figure 4.13: Median household income for counties comprising the study area and for Michigan
Figure 4.14 shows percent of persons below the poverty level for each of the five countiesand the state average according to 1997 U.S. Economic Census data. Poverty levels rangefrom a high of 14.6 percent in Crawford County to a low of 8.6 percent in Otsego County.Antrim and Otsego counties are below the state average of 11.5 percent, while Crawford,Kalkaska, and Missaukee Counties have poverty levels that exceed the state average. Thecombined average of persons below poverty for the five counties is 11.9 percent, justslightly higher than the state average.
$34,015$29,587 $30,783 $30,571
$37,938 $38,883
$0
$5,000
$10,000
$15,000
$20,000$25,000
$30,000
$35,000
$40,000
$45,000
Antrim Craw ford Kalkaska Missaukee Otsego MICHIGANAVG.
County
Inco
me

Chapter 4: Social and Political Context 67
Figure 4.14: Percent below poverty line for counties comprising study area and for Michigan
Race
The vast majority (94.7 percent) of the study area’s residents are Caucasian. Blue LakeTownship has the highest percentage at 98.8 percent, while Grayling Township has thelowest percentage of Caucasians with 94.8 percent. All townships have a consistentlyhigher percentage of Caucasian residents than the average for the state of Michigan, whichis 80.2 percent. Of the remaining average of 2.6 percent non-Caucasian population for thetownships, American Indians are the greatest in number at 0.6 percent, followed by AfricanAmerican/Blacks at 0.3 percent and Asians at 0.2 percent. The remaining 1.5 percent of thearea’s population consist primarily of two or more races.
Education
Figure 4.15 shows the 1990 rates of high school and college graduation rates for peopleover age 25 for the five counties in which the study area is located, as well as the averagefor Michigan. Crawford, Kalkaska, and Missaukee counties have similar high schoolgraduation rates, all of which are lower than those for Antrim and Otsego counties. All fivecounties show high school graduation rates that are lower than the state average of 76.8percent, although Antrim County is quite close to the state average. Similar trends areevident for college graduates. All five counties are below the state average of 17.4 percent,ranging from 7.1 percent in Kalkaska County to 13.7 percent in Antrim County.
9.4%
14.6%12.9%
13.9%
8.6%
11.5%
0.0%
2.0%
4.0%
6.0%
8.0%10.0%
12.0%
14.0%
16.0%
18.0%
Antrim Craw ford Kalkaska Missaukee Otsego MICHIGANAVG.
County
Perc
ent
of p
opul
atio
n be
low
pov
erty

Chapter 4: Social and Political Context 68
Figure 4.15: 1990 high school and college graduation rates
SUMMARY OF DEMOGRAPHICS
This demographic analysis provides insight into the potential opportunities and constraintsthat the Grand Traverse Regional Land Conservancy may face when developing andimplementing a conservation plan in the study area. In general, the upper Manistee Riverwatershed still maintains a relatively dispersed and low-density population when comparedto the average for Michigan. This rural quality of the study area works to the advantage ofland conservation efforts.
However, this analysis also shows that population and development pressures haveincreased substantially over the past thirty years. These growth patterns are expected tocontinue, placing increased pressure on the ecological integrity of the study area.Population distribution varies widely across the study area, with areas in the west and northgenerally showing higher population and housing densities, while areas in the south andeast exhibit lower densities. However, the disparity between low density and high densityareas is muted when only private lands are considered. Therefore, while areas with lowerpopulation and housing unit densities generally have more land under public protection, thepressures on the remaining private lands may be some of the highest in the study area,particularly in the northeast portion of the study area. The popularity of recreationalactivities in the study area is also an important factor to consider when planning landconservation strategies. Seasonal population fluctuations due to the presence of visitorsfrom outside the study area significantly impact land use and natural resources in studyarea.
In constructing a demographic profile of human habitation in the study area, some broadsocio-economic characteristics can be applied to the general population. The study areashows little racial diversity; most residents are Caucasian. Median household income for
76.469.3 69.6 69.4
74.9 76.8
13.7 11.97.1 8
12.617.4
0102030405060708090
100
Antrim Craw ford Kalkaska Missaukee Otsego MICHIGANAVG.
County
Gra
duat
ion
Rat
es (p
erce
nt)
High school diploma
College degree

Chapter 4: Social and Political Context 69
the study area and surrounding areas is generally well below the state average, and povertylevels are slightly above the state average. High school graduation rates are slightly lowerthan for Michigan as a whole, and college graduation rates are significantly below the stateaverage. The percentage of people age 65 and older is well above the state average, withthe highest percentages occurring in Kalkaska County, GTRLC’s primary area of interestwithin the study area.
A long-term goal of implementing a landscape-scale conservation plan requires carefulcoordination among a range of stakeholders. At the most fundamental level, thecharacteristics and composition of these stakeholders is closely tied to the population whichthey represent. While GTRLC focuses on individual property owners, which may or maynot fit the general demographic profile for the study area, this demographic analysis may behelpful in determining successful techniques for gaining community support for landconservation efforts within the study area.
GOVERNMENT INFLUENCESON LAND CONSERVATION
Government policies and programs at all levels – federal, state, and local – greatly affectthe ecological integrity of public and private lands. Federal and state regulations broadlyguide land use through the protection of natural features, such as wetlands and endangeredspecies. At the local level, county and township officials frequently use master plans,zoning ordinances, and other tools to direct specific land uses. Local governments candictate the types of land uses that can occur across the landscape; the types of structures thatcan be built; the location of structures in relation to property boundaries, roads, and naturalfeatures; and other specific land use details. Federal and state regulatory frameworks guidelocal land use policies, but in many cases, federal and state policies have little to no impacton local land controls. Combined, federal, state, and local regulations direct private andpublic land use at multiple scales and provide many societal benefits, several of whichinfluence the conservation of landscape ecosystems.
The project team investigated federal, state, and local policies and programs to determinethe level of environmental protection that currently exists on private lands in the study area.The team conducted this analysis because it did not want to recommend that GTRLCconserve areas that existing government activities and regulations already adequatelyprotect. In addition, the analysis provides GTRLC and other conservation organizationsand planning entities with an inventory of land use policies as well as a basis for evaluatingopportunities to influence local zoning and land use provisions.
The analysis demonstrates that a variety of existing provisions contribute to the protectionof the study area’s natural features and ecosystems. However, current regulations fail toprotect ecosystems effectively over the vast majority of the landscape, leaving lands highlyvulnerable to conversion or destruction. Therefore, GTRLC’s efforts to protect andconserve land will not be duplicative or unnecessary, but instead will help ensure the area’secological integrity.

Chapter 4: Social and Political Context 70
FEDERAL AND STATE REGULATIONS AND PROGRAMS
Federal and state regulatory programs can have a considerable but varying effect on landuse and behavior at the local level. Environmental regulations and programs at the statelevel are often a reaction to federal initiatives that require state compliance or action. Astate that creates their own environmental policy or program in response to a federalmandate gains independence and flexibility in the implementation of the mandate. Whilestates must meet minimum federal standards, a state may rely upon implementation andfunding strategies to increase or decrease the level of protection that the federal policy wasintended to provide. The state’s implementation then has a significant influence onimplementation at the local level.
Michigan is a state that has chosen to pursue its own plans in response to most federalenvironmental and natural resource policies. As a home rule state, autonomousgovernments are the norm in Michigan and the state’s pursuit of its own environmentalobjectives has led to an increasing number of county and local initiatives. This autonomyhas contributed to a climate at the local level that is reluctant to allow state or federalgovernments to influence land use. The following sections discuss the policies andprograms that influence conservation in Michigan as they relate to the study area and thelocal political climate.
River Protection
Segments of the Manistee River that lay within the study area are protected only byenvironmental regulations that strive to maintain water quality and protect wetlands at thesame level guaranteed to the rest of the state. These segments do not have any protectionmeasures that ensure that the unique ecology of these river segments remains relativelyundisturbed. However, increased public support could lead to future protection of theUpper Manistee through either the Federal Wild and Scenic Rivers Act or the MichiganNatural Rivers Act.
In 1968, the U.S. Congress enacted the Wild and Scenic Rivers Act, declaring that “certainselected rivers of the Nation, which with their immediate environments, possessoutstanding and remarkable scenic, recreational, geologic, fish and wildlife, historic,cultural or other similar values, shall be preserved in free-flowing condition, and that theyand their immediate environments shall be protected for the benefit and enjoyment ofpresent and future generations” (National Park Service, 2002). The National Park Serviceclassifies designated rivers into three categories:
� Wild - meaning the river is free from impoundment� Scenic - meaning the river has outstanding beauty� Recreational – meaning the river is highly accessible by road and may have
relatively high levels of development but is heavily used by river enthusiasts
The federal government regulates each designated river area using an individualmanagement plan that aims to protect the qualities that warranted the river’s designation.

Chapter 4: Social and Political Context 71
Future development in the riparian corridors of designated rivers is mitigated and addressedthrough federal acquisition programs and planning processes.
In 1983, the U.S. Forest Service (USFS) assessed the entire Manistee River, from its sourceto its mouth, for potential inclusion in the Federal Wild and Scenic Rivers program. In1992, Congress designated a 26-mile segment of the Manistee River, stretching from theTippy Dam to the Michigan State Highway 55 Bridge (downriver from the study area), as aWild and Scenic River based on its recreational value. While not within the study area, thedesignation of the lower Manistee River segment increases public visibility of the entireriver system and draws visitors to recreate and enjoy the surrounding area.
USFS also proposed recommendations for an additional designation of 25 miles betweenLincoln Bridge and Stronach Pond for the segment’s scenic value, but Congress did notapprove the proposed designation. Designation of this segment failed, mainly because ithad a higher percentage of private landowners compared to the section that was designated,which is primarily owned by USFS (U.S. Forest Service, 1983).
The Federal Wild and Scenic River Act contains provisions that direct funding towardstates that have programs in place to protect valuable river corridors. Michigan respondedto this funding opportunity by passing the Natural River Act of 1970. This legislation wasmodeled after the Federal Wild and Scenic Rivers Program but is more specific in itsmission and methods to protect Michigan’s rivers. The Act states that "rivers should beprotected for the purpose of preserving and enhancing their values for water conservation,free flowing condition, and fish, wildlife, boating, scenic, aesthetic, flood plain, ecologic,historic and recreational values and uses” (Michigan Public Act 231). The Act givesauthority to the Michigan Natural Resources Commission (which supervises MDNR) torecommend zoning regulations across designated watersheds and to impose zoningregulations upon private landowners along river corridors. The Act also promotesprotection by directing the Michigan Natural Resources Commission to utilize acquisition,lease, and easement methods to protect sensitive areas. Additionally, the Act has a non-degradation provision, which may prohibit new dams, water quality degradation,channelization, and mining activity, and a consistency provision that requires actions takenby all state agencies to be consistent with river management plans promulgated under theprogram (American Rivers, 2002).
In 1998, MDNR released two reports that prompted debate over the designation of theManistee River as one of Michigan’s “natural rivers.” The first report, the “Manistee RiverAssessment,” provides an ecological overview and history of the river as related to fisheriesmanagement. The report identifies impacts to the river that stem from uncontrolled landuse and development, including erosion, changes to hydrology, and deforestation. Thereport also discusses management options, several of which highlighted the need forcomprehensive protection measures in the Manistee River corridor.
The second report was released by MDNR’s Natural Rivers Program, the office responsiblefor overseeing and implementing Michigan’s Natural River Act. The report was a draft“Natural River Plan” for the Manistee and Pine River watersheds that was developed by

Chapter 4: Social and Political Context 72
four Citizen Advisory Groups that met over a three-year period throughout differentportions of the watersheds. The draft plan was released along with legislation to designatethe Manistee and Pine as Natural Rivers.
The draft Natural Rivers Plan examined the entire Manistee River as well as several smalltributaries that the federal study did not assess. The plan made zoning recommendationsfor private and public land across the watershed and proposed specific zoning standardsalong the river corridors. A summary of these standards is listed in Table 4.2.
Table 4.2: Michigan Natural River Plan zoning recommendationsUpper
ManisteeRiver
(study area)
MiddleManistee
River
LowerManistee
River
LowerManistee
RiverZoning Measure
Wild-Scenic* Wild-Scenic* WildScenic*
CountryScenic*
Natural Vegetation Strip(Mainstream) 75 ft 75 ft 100 ft NA
Natural Vegetation Strip(Tributaries) 75 ft 50 ft 50 ft 50 ft
Building Setback (Mainstream) 150 ft 100 ft 150 ft NA
Building Setback (Tributaries) 100 ft 75 ft 100 ft 75 ft
Bluff Setback (Mainstream) 50 ft 50 ft 50 ft NA
Bluff Setback (Tributaries) 25 ft 25 ft 25 ft 25 ft
Minimum Lot Area (Mainstream) 80,000sq ft
80,000sq ft
80,000sq ft NA
Minimum Lot Area (Tributaries) 80,000sq ft
80,000sq ft
80,000sq ft
40,000sq ft
Minimum Lot Width (Mainstream) 200 ft 200 ft 200 ft NA
Minimum Lot Width (Tributaries) 200 ft 200 ft 200 ft 150 ft* The Michigan Natural River Act designates segments as either “Wild-Scenic” or “Country-Scenic,” with eachclassification having different protection measures that are specific to the river segment.
The report recommends additional standards and guidelines, but the above table providesthe quantifiable standards that were most contentious upon the release of the report.
A coalition of private landowners, many represented by the Citizens Alliance forRegulatory Reform, objected to the proposed designation and organized an oppositioncampaign. Several opponents gave presentations to the township boards and drafted aproposal that would give zoning control only to local authorities. Over 40 townships signedthe proposal and sent it to Michigan Senator George A. McManus. Shortly afterwards, theState of Michigan reduced the staff of the Natural Rivers Office from four to two people,

Chapter 4: Social and Political Context 73
making it very difficult for it to respond to criticism on proposed designation of theManistee and Pine Rivers. The Michigan Legislature never debated the proposedlegislation and the designation attempt therefore failed (Pearson, 2001). In January of2002, the Pine River Watershed Coalition, the Upper Manistee River Association, and analliance of other conservation and angler organizations announced the development of astrategic plan to revive Natural River designation efforts on the Pine and Manistee Rivers.The group intends to work with local citizens, governments, and businesses to build supportfor the original draft plan (Michigan Land Use Institute, 2002).
If this coalition succeeds in securing Natural River designation for the Manistee, GTRLCand other land trusts may find opportunities in new funding sources related to thedesignation. If the new designation attempt fails, it would be advantageous forconservation organizations to work with local governments that may have an interest inindependently adopting the Natural Rivers Plan recommendations or similar protectionmeasures
Clean Water
The U.S. Clean Water Act (CWA) requires all municipal and industrial wastewater to betreated before being discharged into waterways, with the objective of restoring andmaintaining the chemical, physical, and biological integrity of the nation's waters and,where possible, achieving water quality that is both "fishable" and "swimmable." The Actputs the onus of implementation of most CWA provisions on state governments but givesthe federal government enforcement authority. The U.S. Environmental Protection Agencycurrently administers the program.
The CWA as amended in 1972 focused on “point-source” pollution and did not directregulation of “nonpoint source” pollution. In 1987, Congress passed additionalamendments that authorized measures to address non-point source pollution by directingstates to develop and implement nonpoint pollution management programs. States wereencouraged to develop programs to protect groundwater resources as part of their overallnonpoint source pollution control efforts. The legislation also authorized federal financialassistance for states to support demonstration projects and actual control activities(Copeland, 1999).
Michigan has adopted and amended several versions of a State Clean Water Act over thelast 40 years. Today, the Michigan Department of Environmental Quality (MDEQ)oversees the implementation of the CWA. MDEQ promulgates rules, establishes pollutionstandards, and oversees permitting operations. Several of the state provisions are morestringent than federal regulations due to efforts to protect the Great Lakes. However, recentrecords indicate that MDEQ may not enforce CWA provisions according to federalstandards (Environmental Working Group, 2000). For example, in January, 2002, the EPAdelivered a one month notice to the state of Michigan to enforce federal and state cleanwater laws on concentrated animal feeding operations (CAFOs). The notice accusesMichigan of intentionally neglecting to enforce CWA provisions and requires the state to

Chapter 4: Social and Political Context 74
develop a permitting program to address water pollution from CAFOs (EnvironmentalProtection Agency, 2002).
Wetlands
Section 404 of the Federal Clean Water Act prohibits the filling of waters, includingwetlands, without a permit from the Army Corps of Engineers, or in Michigan’s case, froma state wetlands protection permitting program that is approved by the EPA. The fivesubsections of CWA Section 404 that are pertinent to wetland protection in Michiganinclude: (Copeland, 1999)� Section 404(a) – Requires permits for the filling of waters, including wetlands.� Section 404(b) – Requires that permitting agencies follow guidelines developed by
the EPA when issuing fill permits. If practical alternatives exist, the guidelinesrequire that the permit not be granted.
� Section 404(c) – Authorizes EPA to veto fill permits.� Section 404 (f) – Exempts certain activities from the permit requirements.
Exemptions include some farming practices (landowners cannot drain or fill awetland that was not farmed prior to the legislation without permit), some silviculture,minor draining, and upland water and soil conservation practices.
� Section 404 (g) – Allows states to administer permit programs if approved by EPA.The state program is supposed to be stricter than the federal regulations.
Michigan is one of only two states to which EPA has given permitting approval.Michigan’s version of the Clean Water Act, the Goemaere-Anderson Wetland ProtectionAct of 1979 (now Part 303 of the Michigan Natural Resources and EnvironmentalProtection Act), has strict protection measures accompanied by stiff fines. Those laws weredeveloped during an era when Michigan was viewed as a role model for stateenvironmental protection efforts. Provisions in these regulations include buffer distancesaround wetlands and a “no net-loss” wetland policy. Michigan’s CWA defines wetland as“land characterized by the presence of water at a frequency and duration sufficient tosupport, and that under normal circumstances does support, wetland vegetation or aquaticlife, and is commonly referred to as a bog, swamp, or marsh” (Michigan Clean Water Act,§324, Sec. 30301 (d)). The Act only protects wetlands that are more than five acres in size,unless the state determines that “the protection of the area is essential to the preservation ofthe natural resources of the state from pollution, impairment, or destruction” (§324, Sec.30301(d)(iii)).
The Michigan Clean Water Act also allows local governments to enact wetland ordinances,as Antrim County has recently done. Michigan’s wetlands permitting program, givenauthority by EPA in 1984, is now administered through MDEQ (formerly part of theMichigan Department of Natural Resources). MDEQ’s recent record for protectingwetlands is as controversial as the other CWA programs it administers, as it has streamlinedthe permitting process to allow development of wetlands to occur more rapidly and has

Chapter 4: Social and Political Context 75
reduced its staff that is responsible for enforcing wetlands provisions by more than 40percent (National Wildlife Federation, 2002).
While significantly weakened in the 1996 U.S. Farm Bill, another federal wetlandprotection measure that should be noted is the Farm Bill’s Wetland Conservation Provision.This provision requires that agricultural producers who receive aid from the U.S.Department of Agriculture must not farm wetlands that were not converted before 1985 orhave not been farmed for five consecutive years. New mitigation provisions andexemptions significantly weaken this measure but still make it necessary for farmers toobtain a permit to farm wetlands that have not been previously converted.
Despite current wetland protection regulations, the existence of a permitting process forfilling wetlands in Michigan makes it clear that wetlands cannot be considered protected inperpetuity under existing state and federal regulations. GTRLC and other conservationorganizations should therefore take measures to protect these highly valued ecologicalresources.
Wildlife and Biodiversity
The Federal Endangered Species Act (ESA) is the most powerful legislation aimed at theprotection of plant and animal species. ESA forbids the killing or harming of species thatare officially listed under the Act. Significant modification of habitat that directly harms orkills a listed species is also illegal. Michigan enacted its own Endangered Species Act in1974 and, as a result, is permitted by the U.S. Fish and Wildlife Service to maintain the listof threatened and endangered species and oversee enforcement of the federal statute. TheMichigan Endangered Species Act does not protect insects, as the act states that theirprotection would “present an overwhelming and overriding risk to man” (§§299.221).
The MDNR contracted with The Nature Conservancy to survey the state and inventory theoccurrence of listed species. The MDNR uses this information to work with landowners toensure the protection of the listed species on individual properties. Landowners who wantto be sure they are complying with the Act must take the initiative and consult with MDNRand the U.S. Fish and Wildlife Service to be sure there are no endangered species in theirarea (Michigan State University Extension, 1997). Species are listed based on scientificdata only, and critical habitat designation or agency consultation is not required whenworking or developing in an area where endangered species are located (unless direct harmto the species will result). Violations of the ESA are punishable as a misdemeanor offensewith maximum penalties of a $1,000 fine and/or 90 days in jail (Defenders of Wildlife,2002).
Michigan’s Biological Diversity Conservation Act supplements the ESA by recognizing theimportance of conserving diversity and establishing a joint legislative working committeecharged with the development of a state biodiversity conservation recommendation. Sinceits inception in 1993, the only action that the working committee has taken has been thedevelopment of proposed guidelines for the establishment of old growth forest preserves.

Chapter 4: Social and Political Context 76
In addition to these regulations, Michigan has several laws that regulate activities that takeplace on state-owned and adjacent land:
� Michigan Environmental Protection Act (MEPA) - Similar to the federal NationalEnvironmental Policy Act (NEPA), MEPA requires a detailed assessment of all majorstate agency actions that may impact the environment.
� Michigan Wilderness and Natural Areas Act (Mich. Comp. Laws Ann. §§322.751 etseq.) - State-owned lands can be designated “wilderness” or “natural areas” andprotection of these areas often requires cooperative agreements between privatelandowners and government agencies when these lands transcend state-ownedboundaries (Defenders of Wildlife, 2002).
� Michigan Natural Resources Trust Fund Act - The state can acquire private lands thatare deemed scenically beautiful or environmentally important by using moniescollected from oil and gas leases on state lands.
� Michigan's Conservation and Historic Preservation Easement Act, PA 197 of 1980 –The legislation authorizes the use of conservation easements to protect areas of highconservation value.
Federal and state agricultural departments have also been very active in developingprograms to support biological conservation. The United States Department of Agriculture(USDA) has led the way in establishing over 20 different conservation programs directedtowards farmers. These programs include USDA’s Conservation Reserve Program, theForestry Incentives Program, the Wetlands Reserve Program, and the Wildlife HabitatIncentives Program. Most of these programs are reward-based, where farmers arecompensated for not putting sensitive lands into agricultural use. Some programs also use atechnique called cross-compliance, whereby crop subsidies are withheld unlessconservation plans are developed and implemented.
The Michigan Farm Bureau, a state lobbying group, has developed a conservation programstructure similar to USDA’s. The Farm Bureau is now experimenting with its ConservationReserve Enhancement Program (CREP), but CREP currently offers incentives only tofarmers in the southern portion of the state. The program receives 80 percent of its fundingfrom the federal government and will likely expand to other areas of the state in the nearfuture.
While there is a myriad of state and federal programs that work to protect biological andecological diversity, many are voluntary and some are not as effective as intended. GTRLCand other conservation organizations should consider how their activities can work inconjunction with government programs to meet their shared programmatic objectives.
Land Division
The aforementioned policies and programs either regulate or encourage the protection ofspecific natural features. At a broader scale, legislation that regulates permissible landdivision influences the likelihood of conservation or development on private lands acrossthe entire landscape. The State of Michigan is responsible for all land division regulations.

Chapter 4: Social and Political Context 77
Two pieces of legislation have far-reaching influences on the shape and size of Michigan’sland parcels – the Subdivision Control Act of 1967 (P.A. 288) and its successor, the LandDivision Act of 1996 (P.A. 591).
From 1967 to 1996, The Subdivision Control Act permitted two types of land parcelization.The Act defined a “land division” as the parcelization of parent tracts (the original tracts ofland) that produced parcels of more than ten acres each. Parcels could be further dividedand become parent parcels after ten years. The state did not require approval of divisions,thereby resulting in a cost-free method of parcelization for landowners. By contrast, theAct defined a “plat” as parcelization of a parent tract that produced five or more parcels ofless than ten acres each. The state required landowners to submit requests for plat approval,which was a costly and potentially time-consuming process.
Not surprisingly, these distinctions generated incentives for landowners to avoid plat costsby creating as many land divisions as possible. As a consequence, parcels of just over 10acres (i.e., 10.1 acres) abound throughout Michigan. Landowners typically designed longand narrow parcels due to the relatively small minimum road frontage requirements ofcommunities and the lack of provisions on depth-to-width ratios.
The Land Division Act of 1996 revises the provisions of the Subdivision Control Act in anattempt to change the size and shape of lots (to limit the narrowness of lots), reduce the costof platting, and eliminate the incentive to create lots just slightly larger than 10 acres (toencourage higher density developments).
The Land Division Act creates three types of parcelization. At the largest scale, “exemptsplits” produce parcels of more than 40 acres each. The state does not require approval forsuch divisions. At the smallest scale, “subdivisions” generate the smallest-sized parcels,and are essentially the plats that the Subdivision Control Act defines. The state requiresapproval for subdivisions, and submitting applications can be costly to landowners.
At the intermediate scale, “divisions” produce at least one parcel of less than 40 acres insize. The maximum number of parcels into which landowners can divide the parent tract isbased on the following criteria:
� A parent tract of less than 10 acres can be divided into four parcels.� One additional parcel is permitted for each 10 acres beyond the first 10 acres of the
parent tract, up to 120 acres.� One additional parcel is permitted for each 40 acres beyond the first 120 acres of the
parent tract.
Figure 4.16 displays examples of different parcelization scenarios under the Act.
Land divisions must also meet a few other requirements. For one, parcels must beaccessible – driveways must be located either along existing or proposed roads oreasements. In addition, parcel shapes and sizes must also adhere to the width and arearequirements of local land division ordinances. Regardless of local land ordinance
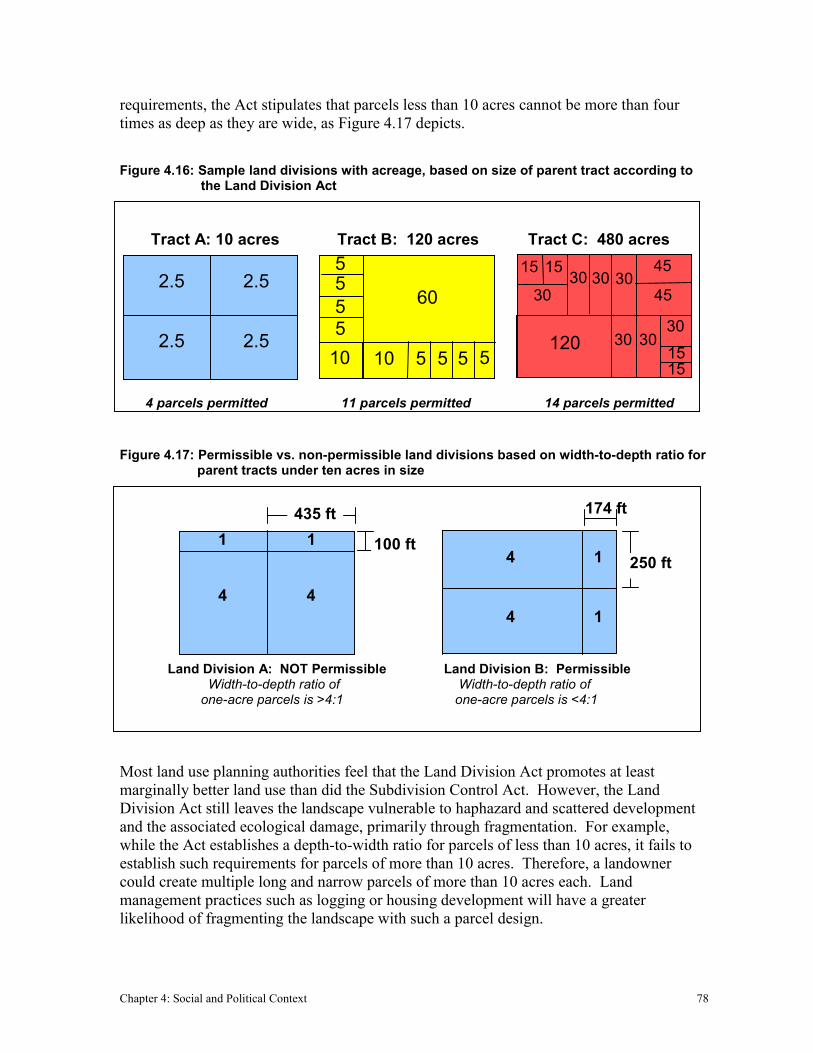
Chapter 4: Social and Political Context 78
requirements, the Act stipulates that parcels less than 10 acres cannot be more than fourtimes as deep as they are wide, as Figure 4.17 depicts.
Figure 4.16: Sample land divisions with acreage, based on size of parent tract according to the Land Division Act
Tract A: 10 acres Tract B: 120 acres Tract C: 480 acres
4 parcels permitted 11 parcels permitted 14 parcels permitted
Figure 4.17: Permissible vs. non-permissible land divisions based on width-to-depth ratio for parent tracts under ten acres in size
Land Division A: NOT Permissible Land Division B: Permissible Width-to-depth ratio of Width-to-depth ratio of one-acre parcels is >4:1 one-acre parcels is <4:1
Most land use planning authorities feel that the Land Division Act promotes at leastmarginally better land use than did the Subdivision Control Act. However, the LandDivision Act still leaves the landscape vulnerable to haphazard and scattered developmentand the associated ecological damage, primarily through fragmentation. For example,while the Act establishes a depth-to-width ratio for parcels of less than 10 acres, it fails toestablish such requirements for parcels of more than 10 acres. Therefore, a landownercould create multiple long and narrow parcels of more than 10 acres each. Landmanagement practices such as logging or housing development will have a greaterlikelihood of fragmenting the landscape with such a parcel design.
174 ft
4
4 1
1 250 ft11
4 4
435 ft
100 ft
2.5
2.5 2.5
2.5
105
5 5 5 510
555
60
120
30 30 30
30 30
45
45
3015
30
15 15
15

Chapter 4: Social and Political Context 79
Also, the Act determines only the number, not the size or location, of parcels permissibleunder the “land division” category. For example, as Figure 4.18 shows, a parent tract of 10acres could be divided into four 2.5-acre parcels, or two four-acre parcels and two one-acreparcels. This division is problematic in that it fails to encourage clustering of smallerparcels, which can lead to ecosystem fragmentation.
Figure 4.18: Sample permissible land divisions of two parent tracts of 10 acres each under the Land Division Act
Land Division A Land Division B
Overall, the Land Division Act provides landowners with a great deal of flexibility inparcelizing their land. The Act greatly threatens ecological integrity, however, as it permitswidely varying numbers, locations, shapes, and sizes of parcels. The vast potential for landdivision across the study area emphasizes the need for organizations such as GTRLC toconserve land sooner rather than later, so that they can work with as few landowners aspossible.
LOCAL PLANNING EFFORTS
As authorized by states, counties and townships have the ability to engage in planning andzoning activities, although not all of these jurisdictions in the Manistee study area havechosen to do so. Four of the five counties in the study area – Antrim, Crawford, Kalkaskaand Otsego – have developed master plans. Crawford, Kalkaska, and Otsego counties alsoutilize zoning ordinances.1 Antrim County has a master plan, but it leaves zoningresponsibilities to the individual townships. Missaukee County uses neither a master plannor a county-wide zoning ordinance to guide its land use.
Several townships in the study area have developed their own master plans and zoningordinances, as permitted under the Township Rural Zoning Act of 1943 (Public Act 184).In Crawford County, Frederic and Grayling townships (the only two Crawford Countytownships in the study area) have established their own planning guidelines. Similarly,
1 Township-level zoning is much more typical than county-level zoning in Michigan. However, the resource-intensive nature of zoning administration, in combination with relatively low township populations, promptedthe townships in Kalkaska County to request and support county-level zoning starting in 1974 (Leach, 2002).
2.5
2.5 2.5
2.5 4
4 1
1

Chapter 4: Social and Political Context 80
Kalkaska County’s Blue Lake and Garfield townships use their own master plans andzoning ordinances. The Antrim County townships in the study area, Mancelona and Star,have neither county-wide zoning nor their own zoning regulations. Table 4.3 displays theplanning entities in the study area and provides the revision dates for their master plans andzoning ordinances. Figure 4.19 displays the locations of these planning entities.
Table 4.3: Master plans and zoning ordinances for counties and townships within the study area
MASTER PLAN ZONING ORDINANCE
Counties &Townships
Lastmajor
revisionRevisionexpected
Teamreviewed
Lastmajor
revisionRevisionexpected
Teamreviewed
Antrim County 1964 2003 No none - -
� Mancelona Twp* 2002 - No 2002 - -
� Star Twp none - - none - -
Crawford County** - - - - - -
� Frederic Twp 2001 2006 Yes 2002 2007 No
� Grayling Twp 1997 2002 Yes 1992 2002 Yes
Kalkaska County*** 1995 2002 Yes 2001 - Yes
� Blue Lake Twp 1988 2005 Yes 1976 2003 Yes
� Garfield Twp 1993 - No 1992 2002 No
Missaukee County none - - none - -
Otsego County 1996 2002 No 1996 2002 Yes* Mancelona Township is in process of creating a Master Plan and Zoning Ordinance for the first time.** Crawford County’s master plan and zoning ordinance do not apply to this project, as Frederic and Grayling Townships comprise all of Crawford County that lies within the study area.*** For the portion of the study area that lies in Kalkaska County, all townships except Blue Lake and Garfield adhere to Kalkaska County’s master plan and zoning ordinance.
To learn about local planning in the study area, the project team collected and reviewedplanning documents (master plans and zoning ordinances) from as many jurisdictions aspossible, and conducted informational interviews with planning officials throughout theregion. The team’s interviews demonstrated that communities support conservation andhope to retain the rural character of the landscape (Bidle, 2002; Durand, 2002; Ingersol,2002; Leach, 2002; Riley, 2002). At the same time, the team’s analysis of master plans andzoning ordinances demonstrates that these planning documents alone will not ensureadequate conservation of natural features. Master plans often communicate goals ofsteering development in desirable directions and ensuring preservation of natural features,but zoning ordinances are not stringent enough to ensure the implementation of these well-intended goals. Therefore, conservation efforts by organizations such as GTRLC areneeded to help ensure ecological protection.

Chapter 4: Social and Political Context 81
Figure 4.19: Jurisdictions within the study area that have adopted or are responsible for planning and zoning activities
Government unit responsible for planning and zoning
No planning or zoningat county or township level
Township
Study area boundary
City or villageTownship boundaryCounty boundary
County
N
0 10 20 30 Kilometers
ANTRIM OTSEGOCRAWFORD
MISSAUKEE
KALKASKA
Kalkaska
StarHayes
Mancelona
ColdSprings
BlueLake
Frederic
BearLake
Excelsior
Oliver
Grayling
Garfield
Orange
Springfield
Bloomfield Pioneer Norwich
KalkaskaVillage
MancelonaVillage
GraylingCity
The remainder of this section details the primary conservation provisions of local masterplans and zoning ordinances. County-specific and township-specific information isprovided whenever available. Note that the information is not entirely complete, as theteam was unable to obtain all master plans and zoning ordinances for the study area.However, the information that is cited offers valuable insights into many of the overallplanning goals and specific conservation provisions for the study area. In addition, theanalysis demonstrates opportunities for conservation organizations to enhance conservationthrough local planning and zoning efforts.
Local Conservation Visions
The study area boasts an array of irreplaceable natural features that cover the vast majorityof the study area. Residents recognize the aesthetic and economic values of natural areas inattracting tourists, new residents, and resource-based industries such as logging (Ingersol,2002; Leach, 2002; Schlink, 2002). Not surprisingly, therefore, all of the master plans thatthe team investigated considered the protection of natural features as primary planninggoals:
� Crawford County: Frederic Township – In 1999, the township surveyed residents inpreparation for the development of its master plan. Though less than two percent ofresidents responded, those that did respond communicated clear concern forenvironmental protection. Specifically, responses suggested that citizens desire

Chapter 4: Social and Political Context 82
policies that protect groundwater and support the sustainable use of natural publicassets (Frederic Township Planning Commission, 2001).
� Crawford County: Grayling Township – At a township meeting in 1996, localresidents imagined themselves in Grayling Township and the City of Grayling in theyear 2020. Among other ideas, residents expressed the following sentiments thatsuggest their support of conservation activities: “[We] appreciate and are goodstewards of the natural environment, protecting wetlands and floodplains fromencroachment and from siltation or dumping. Riparian owners plant and maintainbuffer vegetation….Grayling Township and the City of Grayling are models ofresidential, commercial and industrial resource protection and havens for wildlife.The protection of natural features has resulted in an improved visual character of thecommunity” (City of Grayling City Council et al., 1997).
� Kalkaska County – Similar to Grayling’s township meeting, the residents of KalkaskaCounty were asked about the characteristics they would like to see in the county in theyear 2020. The creators of the county’s master plan summarized the responses intofive main areas of interest. According to the planners, the second highest-rankedinterest is for the county to boast “a natural environment which has been respected,integrated into the rural setting, and generally preserved” (Kalkaska County PlanningCommission, 1995).
� Kalkaska County: Blue Lake Township – As stated in the township’s master plan,residents hope to preserve the environment while limiting development. The plan’sauthors specifically state, “To increase the tax base…should not be our mainobjective…the main objective is to preserve the environment we have and enjoynow…We see a ‘no growth’ to a ‘slow growth’ philosophy” (Blue Lake Township,1976). Though the Master Plan is now 25 years old, planners assert that residents stillsupport the limiting of development.
Location and size of development
The various planning entities permit residential development on virtually all private lands inthe study area for two reasons. First, most of the study area is publicly owned, which limitsopportunities to expand tax bases through additional development. Grayling Townshipprovides an example of this point – the township’s master plan (1997) describes the privateland of the township as “the hole in the donut” of publicly owned land cites the largeamount of public land as limiting the potential of private residential and economicdevelopment. Second, limiting development on private land is challenging because mostlandowners feel they have an inherent right to split and sell off parts of their land, aspermitted under the Land Division Act.
Although the local planning entities have placed few absolute restrictions on private landdevelopment, they have attempted to guide development to help conserve natural features.For example, most counties and townships have “forest recreational” zones that are

Chapter 4: Social and Political Context 83
intended to promote the enjoyment and conservation of natural features. The effectivenessof these zones in ensuring conservation is questionable. Certainly the establishment ofmore conservation-focused zones is a positive step toward greater overall environmentalprotection, but the lot sizes should be increased to prevent further fragmentation of thelandscape.
At least two planning entities within the study area have generated some guidelines thataffect large-scale development beyond simply creating different zones.
� Crawford County: Grayling Township – Grayling’s master plan offers threestrategies to guide the location and extent of future residential development. First, theplan recommends (but does not create incentives or enforce) that housing density beconcentrated within the growth boundaries of the City of Grayling to reduce ruraldevelopment pressures and the associated infrastructure and services costs. Second,the plan proposes that the township and the state work together to consolidate publiclands. This consolidation would involve the release of some state lands to thetownship, and vice versa, and would enable more intact public and private lands andthus more efficient and effective management of each (City of Grayling City Councilet al., 1997).
� Kalkaska County – The county’s master plan advocates the concentration ofresidential land uses, mainly by suggesting that residential development be limited inareas where (a) few public facilities exist, (b) roads are unpaved, (c) no plans exist fornew roads or public utilities, and (d) soils do not permit residential land uses. Inaddition, the plan recommends that development and redevelopment along inlandlakes be permitted only if the land “includes a potable water supply, safe disposal of[waste], water and land carrying capacities, water quality protection, preservation ofopen space, and minimal additional intrusion upon the natural environment”(Kalkaska County Planning Commission, 1995).
Kalkaska County’s guidelines exemplify the type of qualitative criteria that can encourageor discourage development in specific locales. However, planning entities should strive tocomplement their qualitative goals with more objective measures. For example, countyplanners may have difficulty in determining whether a home designed for a lakefront lotwould ensure “water quality protection” as their master plan recommends. Reducing thesubjectivity of the criteria for locating developments would help both planners andlandowners better understand the permissible locations for constructing homes and wouldhelp ensure that the goals in the master plan are put into practice on-the-ground.
Subdivision design
Single-family homes are by far the most common form of development in the study area.The vast majority of these homes are scattered throughout the study area, and concentratedsubdivisions occur sporadically. In anticipation of future additional subdivision-styledevelopments, several of the planning jurisdictions provide ordinances that support

Chapter 4: Social and Political Context 84
“cluster” or “open space” developments to help ensure the conservation of natural features.Cluster and open space developments involve the grouping of buildings in lessenvironmentally sensitive portions of the site, while preserving the overall density of thetract. Rood et al. (2000) cite the value of cluster developments particularly for rural areasthat wish to maintain their rural character while accommodating additional growth. Severalplanning jurisdictions within the study area encourage cluster and open space developmentsthrough their master plans and zoning ordinances:
� Crawford County: Grayling Township – The township’s zoning ordinance requiresthat open space cover at least 40 percent of the total area of Planned UnitDevelopments (PUD). Over half of this open space (at least 25 percent of the totalarea of the PUD) must be used for recreational, park, or environmental purposes (TheTownship Board of Grayling Township, 1992).
� Kalkaska County – The county’s master plan encourages the use of carefully designedcluster and open space developments. However, it does not specify any criteria forthese developments, such as percentage of open space that should remain post-construction (Kalkaska County Planning Commission, 1995).
� Otsego County – The county’s zoning ordinance requires that 75 percent of the totalacreage of a cluster development must remain as open space for Forestry Recreationand Agricultural Resource districts, while 50 percent of the total site must remain asopen space in all other districts. Additionally, the homes in these clusterdevelopments must be contiguous (Otsego County Board of Commissioners, 2001).
Riparian setbacks
The planning jurisdictions in the study area consistently place emphasis on the protection oflands immediately adjacent to lakes, rivers, and streams through the use of “ripariansetbacks.” For the zoning ordinances investigated, the widths of required setbacks rangefrom 30 to 150 feet (9.1-45.7 meters). Specific details are provided below:
� Crawford County: Grayling Township – The township’s zoning requires a 30 foot(9.1 meter) deep strip of natural vegetation wherever residential land borders a bodyof water. Landowners can trim and prune a 50foot (15.2 meter) wide section fromwithin the strip for a view of the water and for dock construction (The TownshipBoard of Grayling Township, 1992).
� Kalkaska County – The county’s zoning ordinance mandates that landownersmaintain a waterfront setback of 60 feet (18.3 meters). However, the setback candecrease by one foot for every one foot rise in the bank height above the water’s edge,for a maximum distance of 30 feet (9.1 meters). To obtain a view and access to theriver, landowners can prune trees and shrubs, remove dead, diseased, or “nuisance”plants (poison ivy, poison sumac, etc.), or selectively remove trees and shrubs for the

Chapter 4: Social and Political Context 85
harvest of timber. Clear cutting is prohibited (Kalkaska County Zoning Ordinance,2001).
� Kalkaska County: Blue Lake Township – For residential uses, the township’s zoningrequires a minimum of 30 feet (9.1 meters) between the high water mark of lakes anda home. For all land uses, the zoning requires the maintenance of a buffer (or “greenbelt” as Blue Lake terms it) that is 25 feet (7.6 meters) from the high water mark oflakes. This buffer must be maintained in its natural state, though landowners can trimtrees and shrubs to provide water views and construct docks and stairs. Unique toBlue Lake Township, the zoning also forbids the construction of channels to increasewater frontage (Blue Lake Township, 1976).
� Otsego County – Otsego provides the most stringent regulations relative to the otherjurisdictions in the study area. The county’s zoning ordinance requires thatlandowners maintain a natural (though not necessarily native) shrub and vegetativecover within 50 feet (15.2 meters) of lakes and within 150 feet (45.7 meters) of allrivers and streams. Landowners may prune live trees or remove dead, diseased ordying trees to obtain views of the water. However, they may not extract any roots asremoval may decrease shoreline stability (Otsego Board of Commissioners, 2001).
Wetland protection
In general, the planning entities in the study area do little to protect wetlands beyondadhering to the state guidelines for wetland protection. However, Antrim County is in theprocess of becoming the first county in Michigan to create its own wetland protectionordinance. In December 2001, Antrim’s County Commissioners passed a wetlandprotection ordinance. The ordinance will become official should it pass an upcomingreferendum – opponents of the measure collected enough signatures to warrant a county-wide vote (Yamaguchi, 2002). Upon passage of the ordinance, landowners will need toobtain permits from the county before filling, draining, or working in wetlands that are atleast half an acre or larger. The ordinance as currently worded will require permitsregardless of whether the wetland lies near a lake or a stream (Matheny, 2001). Theenvironmental protection in which this ordinance results will depend on the county’sadherence to permitting guidelines.
Landscaping
Some counties have developed landscaping regulations, which both positively andnegatively impact natural features, depending on the specific criteria. In terms of positiveimpacts, requirements to plant trees, for example, can reduce the potential for soil erosionand lead to additional habitat for wildlife. Conversely, a requirement that landownersregularly water their yards can tax the water supply, and a failure to encourage the plantingof native species can lead to infestations of exotic species. Specific landscaping provisionsare cited below:

Chapter 4: Social and Political Context 86
� Crawford County: Grayling Township – The township’s zoning ordinance requiresthat yards or open areas be landscaped within six months of the date of occupancy. Inaddition, the ordinance mandates that plants or other materials cover the soil toprevent erosion. The ordinance does not require or explicitly encourage the use ofnative plants (The Township Board of Grayling Township, 1992).
� Kalkaska County – The county’s zoning ordinance encourages (but does not require)planting of perennial native species in the natural vegetation strip along watercourses, especially where exposed soils and steep slopes exist (Kalkaska CountyZoning Ordinance, 2001).
� Otsego County – The county’s zoning ordinance requires landscaping for all land usesexcept single family residences located on individual lots. On regulated properties,landowners should plant trees, shrubs, vines, and groundcover to present “anaesthetically pleasing whole.” The ordinance does not mention whether plantingsshould be native or exotic. Landscaped areas must be equipped with wateringsystems and watered regularly (Otsego County Board of Commissioners, 2001).
CONSERVATION OPPORTUNITIES
The analysis of federal, state, and local regulations and programs demonstrates severalways in which GTRLC and other organizations can work with governments to helpimplement or expand upon existing policies and programs. At the state level, for example,conservation organizations could support efforts to designate the upper Manistee River asone of Michigan’s Natural Rivers.
At the local level, conservation organizations can influence the creation and revision ofmaster plans and zoning ordinances. Table 4.4 cites the anticipated revision dates for theseplanning documents within the study area; note that many planning entities will revise theirplans and ordinances in 2002.
By reviewing the current master plans and zoning ordinances, the project team hasidentified the following opportunities for strengthening conservation through futurerevisions:
� Encourage the incorporation of the land use standards proposed in the draft NaturalRivers Plan for the Manistee River, even if the river is not officially designated
� Promote large (i.e., >40 acre) minimum lot sizes in areas in Conservation Focus Areasand more dense development in less ecologically sensitive areas
� Recommend or require the use of native plants for landscaping� Help generate quantifiable implementation measures for qualitative goals
Because the public must approve all master plans and zoning ordinances, it will be criticalthat planning entities carefully consider the implications of any proposed changes on

Chapter 4: Social and Political Context 87
landowners, explain the rationale behind the proposed changes to local citizens, and involveresidents in the planning process. GTRLC could coordinate efforts with local planners andother organizations to help raise residents’ awareness of conservation opportunities.
Table 4.4: Anticipated revision dates for master plans & zoning ordinancesCounties &Townships 2002 2003 2004 2005 2006 2007
AntrimCounty
Master Plan
� MancelonaTwp*
Master Plan &Zoning
� Star Twp
Crawford County
� FredericTwp
MasterPlan
Zoning
� GraylingTwp
Master Plan &Zoning
KalkaskaCounty
Master Plan
� Blue LakeTwp
Zoning MasterPlan
� Garfield Twp
Master Plan
MissaukeeCountyOtsegoCounty
Master Plan &Zoning
* Mancelona Township is in the process of creating a Master Plan and Zoning Ordinance for the first time.
STAKEHOLDER ANALYSIS
Local and regional land conservancies such as GTRLC typically engage in land protectionefforts through one-on-one contact with landowners. The conservancy contacts individuallandowners who own high value, unique, or threatened land that deserves protection anddiscusses the importance of land conservation and the various protection options available.If the landowner is interested, the conservancy crafts a protection strategy that best suits theindividual landowner’s needs. While this traditional approach to land conservation hasproven successful at some scales, the team feels that GTRLC can achieve large-scalesuccess by establishing new partnerships with state and federal land managers, localmunicipalities, recreation groups, and other local and regional land trusts. Suchpartnerships can be effective ways of sharing resources and making sound conservationdecisions, particularly when working at a regional scale. The following section aims toinventory the region’s stakeholder groups and identity their programmatic activities,resources, and interests. From these groups, the team identified potential partnerships and
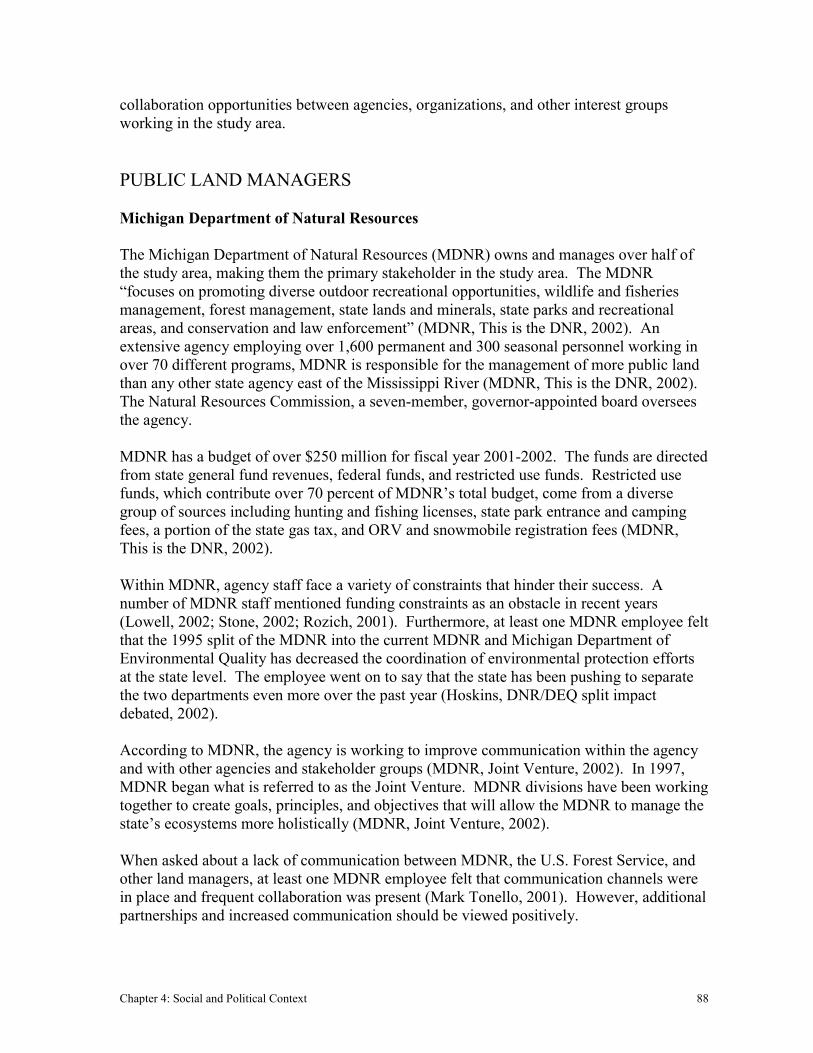
Chapter 4: Social and Political Context 88
collaboration opportunities between agencies, organizations, and other interest groupsworking in the study area.
PUBLIC LAND MANAGERS
Michigan Department of Natural Resources
The Michigan Department of Natural Resources (MDNR) owns and manages over half ofthe study area, making them the primary stakeholder in the study area. The MDNR“focuses on promoting diverse outdoor recreational opportunities, wildlife and fisheriesmanagement, forest management, state lands and minerals, state parks and recreationalareas, and conservation and law enforcement” (MDNR, This is the DNR, 2002). Anextensive agency employing over 1,600 permanent and 300 seasonal personnel working inover 70 different programs, MDNR is responsible for the management of more public landthan any other state agency east of the Mississippi River (MDNR, This is the DNR, 2002).The Natural Resources Commission, a seven-member, governor-appointed board overseesthe agency.
MDNR has a budget of over $250 million for fiscal year 2001-2002. The funds are directedfrom state general fund revenues, federal funds, and restricted use funds. Restricted usefunds, which contribute over 70 percent of MDNR’s total budget, come from a diversegroup of sources including hunting and fishing licenses, state park entrance and campingfees, a portion of the state gas tax, and ORV and snowmobile registration fees (MDNR,This is the DNR, 2002).
Within MDNR, agency staff face a variety of constraints that hinder their success. Anumber of MDNR staff mentioned funding constraints as an obstacle in recent years(Lowell, 2002; Stone, 2002; Rozich, 2001). Furthermore, at least one MDNR employee feltthat the 1995 split of the MDNR into the current MDNR and Michigan Department ofEnvironmental Quality has decreased the coordination of environmental protection effortsat the state level. The employee went on to say that the state has been pushing to separatethe two departments even more over the past year (Hoskins, DNR/DEQ split impactdebated, 2002).
According to MDNR, the agency is working to improve communication within the agencyand with other agencies and stakeholder groups (MDNR, Joint Venture, 2002). In 1997,MDNR began what is referred to as the Joint Venture. MDNR divisions have been workingtogether to create goals, principles, and objectives that will allow the MDNR to manage thestate’s ecosystems more holistically (MDNR, Joint Venture, 2002).
When asked about a lack of communication between MDNR, the U.S. Forest Service, andother land managers, at least one MDNR employee felt that communication channels werein place and frequent collaboration was present (Mark Tonello, 2001). However, additionalpartnerships and increased communication should be viewed positively.

Chapter 4: Social and Political Context 89
Michigan Department of Environmental Quality (MDEQ)
Athough not a land manager in the traditional sense, the Michigan Department ofEnvironmental Quality (MDEQ) is also a major stakeholder in the study area. TheMDEQ’s mission is “to drive improvements in environmental quality for the protection ofpublic health and natural resources to benefit current and future generations… througheffective administration of agency programs, providing for the use of innovative strategies,while helping to foster a strong and sustainable economy” (MDEQ, About DEQ, 2002).This mission makes them a potential partner for GTRLC’s land protection efforts. TheMDEQ is responsible for reviewing various activities that affect the environment in thestudy area, including filling or draining of wetlands and release of point source pollutioninto local waterways.
Governor John Engler created the MDEQ in 1995 when he issued Executive Order No.1995-18. This order split the MDNR into the present day MDNR and MDEQ (MDEQ,History, 2002). Prior to this action, the MDNR was responsible for all environmentalprotection and the permitting programs now held between the two agencies. Some peopleregard the 1995 creation of MDEQ as an important programmatic shift, believing that thesplit from MDNR improved economic efficiency and environmental regulation. However,many observers, including some MDEQ staff, feel that the split has decreasedenvironmental protection in the state. A survey conducted by the Michigan chapter ofPublic Employees for Environmental Responsibility (PEER) asked MDEQ employees fortheir opinion on the affects of the split and the effectiveness of the agency in itsenvironmental protection. Roughly 40 percent of the over 1,400 employees responded tothe survey. The survey revealed that most employees (81 percent) feel that thedepartmental split resulted in weaker environmental protection and that managementregularly stresses economic development over resource protection. In addition, the surveyshows that staff morale has decreased since the split; almost 75 percent of those surveyedrated staff morale as extremely poor or poor (Hoskins, DEQ staff polled on the issues,2002).
Rulings made by MDEQ are critical to other stakeholders in the study area includingMDNR, developers, recreational groups, and residents. This connection illustrates thatMDEQ should be working closely with these groups to ensure that the interests of localgroups are being met. However, collaboration on permitting decisions is not the norm andindividual permit applications are frequently approved with little to no public or stakeholderreview.
Local Municipalities
County and township governments are minor landowners in the study area. Management ofthis land varies from the provision of picnic and scenic overlook areas to more traditionalnatural areas. Locally elected officials play a critical role in the management of bothmunicipal land and privately owned parcels through the creation of land use plans and local
Chapter 4: Social and Political Context 90
zoning decisions. Michigan’s home-rule political structure gives more power to local unitsof government than in most other states. Local policies help to determine theenvironmental, social, and economic quality of an area. While the importance of localdecision-makers is clear, the rural townships and counties in the study area often facesignificant resource deficiencies. For example, Crawford County has been unable to updateits outdated master plan because of recent budget constraints (Compo, 2002). Localpolitical entities are encouraged to pool their resources, expertise, and visions to createregional plans and zoning regulations that will protect their shared natural, social, andeconomic resources.
The Great Lakes Fishery Trust
The Great Lakes Fishery Trust (GLFT) was formed in 1996 as a result of a court settlementregarding the operation of the Ludington Pumped Storage Project hydroelectric facility (seeland ownership section for more information). The GLFT mission statement is “…toprovide funding to enhance, protect, and rehabilitate the Great Lakes fishery resources. TheTrust will manage its resources to compensate for lost use and enjoyment of the LakeMichigan fishery resulting from operation of the Ludington Pumped Storage Plant” (GLFT,2002). Although they are no longer property owners in the study area the GLFT has theability to influence local land management decisions by providing funds to activities thatwill improve Lake Michigan fisheries. However, because Tippy and Hodenpyl dams cutoff the study area from Lake Michigan it is less likely that the GLFT will direct manyresources to the area.
PRIVATE LANDOWNERS
As discussed in the demographic section, the study area is sparsely populated with anaverage of less than 15 people per square kilometer for townships within the study area.The typical resident of the study area is Caucasian, with a high school diploma, makes lessthan $35,000 per year per household, and is older than the state average.
Private landowners in the study area generally favor the protection of their natural resources(Pratt, 2002). They value their quality natural areas and will often take steps to protectthose resources. However, they are also weary of state and federal oversight in land usedecisions (Bromelmeier, 2002). In general landowners in the study area value theirproperty rights and are reluctant to allow the government to restrict their ability to do asthey please on their property. These sentiments were illustrated quite clearly through thefailure to designate the upper Manistee as a Natural River.
Unlike the previously discussed stakeholder groups, there is only weak organization of thegeneral public living in the study area. While a few homeowner associations and lakeassociations do exist, these represent only a small fraction of the general public. However,many of the residents in the area are associated with one or more of the following

Chapter 4: Social and Political Context 91
stakeholder groups: recreational groups, conservation groups, and major industrialstakeholders.
Recreational Groups
The vast amounts of public land and ample recreational opportunities in the study areaattract residents and visitors alike. Recreational groups provide a voice to a wide range ofcitizens who may otherwise be detached from state or local decision-making. These groupshave significant potential to educate and organize their members to influence the decision-making process. Thus, more effort should be made to include these groups in collaborativeendeavors.
River-Specific Groups
Some of the most popular recreational activities in the study area focus on the ManisteeRiver and its tributaries. These groups are usually most concerned with the protection ofwater quality, river access, and aquatic habitats. However, there is a close connectionbetween the health of a river and the surrounding land uses. Therefore, many of thesegroups may be interested in working with the GTRLC to protect valuable parcels.
� Trout Unlimited (TU) – Trout Unlimited is a national nonprofit organization thatcould be considered both a conservation organization and a recreational group. Themission of the Michigan Council of Trout Unlimited (the Council), “to conserve,protect, and restore Michigan's watersheds which support wild trout and salmon,”(Sabina, 2002) hints at this dual role. The Council serves to organize the more than20 individual chapters in Michigan as well as to coordinate other fishing andconservation groups such as Anglers of the AuSable, Michigan River GuidesAssociation, Pere Marquette Watershed Council, Michigan United ConservationClubs (MUCC), Federation of Fly Fishers (FFF), Lake Michigan Task Force, theMichigan Fly Fishing Club, MDNR, MDEQ, the United States Forest Service(USFS), the county drain commissioners, and others (Sabina, 2002). While theCouncil lobbies for improved protection of the state’s rivers and fish habitat,individual chapters are frequently directly involved with restoration and protectionactivities. The George Mason Chapter of TU was established roughly 20 years agoand is the study area’s local chapter, representing roughly 200 active members.Prior to the formation of the Upper Manistee Restoration Committee in 1989, theGeorge Mason Chapter coordinated a number of erosion control and habitatimprovement projects (Andrus, 2002). Today, its main role in the restoration andconservation of the upper Manistee is fundraising from their members andcommunity-wide efforts. Funds are usually directed to action-orientedorganizations such as the Upper Manistee Restoration Committee. Chaptermembers are also active in a number of other local conservation boards and projects(Andrus, 2002).

Chapter 4: Social and Political Context 92
� Federation of Fly Fishers (FFF) and the Anglers of the Au Sable – The upperManistee and its neighbor, the Au Sable River, are considered two of the region’spremier fly fishing rivers. Thus, it is not surprising that a group like the Federationof Fly Fishers has a local chapter, the Anglers of the Au Sable (the Anglers). TheAnglers are based out of Grayling and work in both the Au Sable and the upperManistee Rivers. They have over 600 local members and participate in a widerange of activities including involvement with state-level lobbying, state and federalland management decisions, education, in-stream improvements, and environmentalresearch (Anglers of the Au Sable, 2002). The Anglers have worked closely in thepast with other land managers and stakeholder groups including MDNR, CampGraying, and USFS to protect and improve the Au Sable and Manistee Riverwatersheds.
� Paddler groups – Although canoeing and kayaking are major recreational activitiesin the study area, there seems to be little organization among paddlers. However,the area’s half dozen canoe liveries are represented by the Michigan Association ofPaddelsport Providers (MAPP). MAPP works to protect the abilities of its membersto provide canoeing opportunities, often through the protection of the state’s rivers(Michigan Association of Paddlesport Providers, 2002).
Hunting Groups
Hunting is a major activity for Michigan residents. In 2001 roughly 1.8 million huntinglicenses were issued for a variety of game including deer, waterfowl, small game, and fur-producing species (MDNR, Wildlife Resources, 2002). To meet the needs of the state’shunters, a wide range of hunting organizations are available across the state. The followingprofiles single out a few of these groups that may have partnership potential for landprotection and management opportunities in and around the study area.
� Michigan United Conservation Clubs (MUCC) – MUCC acts as both a hunting andfishing organization as well as a conservation organization. Established in 1937,MUCC is the largest statewide conservation organization in the nation, with nearly100,000 members and more than 500 affiliated clubs. With a mission of “unitingcitizens to conserve Michigan’s natural resources and protect our outdoor heritage,”MUCC informs and educates the public on conservation issues. MUCC’s focus onenvironmental education reaches a broad audience of adults and children through a widerange of education curricula, special recreational courses and events, Michigan Out-of-Doors Magazine, television programs, and radio broadcasting.
MUCC also “advocates for the wise and scientific management of Michigan’s naturalresources through public policy and litigation.” Through working relations with stateand federal agencies, legislators, and other key leaders, MUCC influences the directionof natural resource issues. Within their Resource Policy Department, staff membersspecialize in fisheries, wildlife, land use, solid waste, water quality, air quality, energy,and forestry. MUCC also maintains a legal department with a corporate counsel and

Chapter 4: Social and Political Context 93
law clerks to provide technical assistance on natural resource laws (Michigan UnitedConservation Club, 2002).
� National Wild Turkey Federation (NWTF) – The National Wild Turkey Federation hasroughly 15,000 members in Michigan, participating in roughly 75 local chapters.Members include all types of hunters including women, youth, and physicallyhandicapped individuals (Sharp, 2002). NWTF’s mission is “the conservation of thewild turkey and the preservation of the hunting tradition” (NWTF, 2002). Although theNWFT works on a variety of issues, ITS primary focus is on improving turkey habitatthroughout the state. Working with MDNR and USFS, NWFT plants shrubs, restoresnative grasslands, plants warm season grasses, and conducts prescribed burning. It alsoeducates the state’s youth about the wild turkey and occasionally lobbies the StateLegislature on hunter’s rights and hunter safety issues. The National Wild TurkeyFederation worked closely with other organizations including Pheasants Forever, MeadPaper, Weyerhaeuser, and Consumer’s Energy on a variety of projects (Sharp, 2002).
� Whitetails Unlimited – Whitetails Unlimited is a national organization that includesroughly 65,000 members across the country, with 12,000 in Michigan (Rice, 2002).The organization identifies three goals: 1) education, 2) habitat conservation, and 3)preservation of the hunting tradition. Since the group’s inception in 1982, WhitetailsUnlimited has spent over $22 million in their efforts to meet these goals (WhitetailsUnlimited, Our Mission, 2002). One of the organization’s many programs, the HOPE(Habitat Options & Planned Enhancement) for Wildlife Program promotes activitiessuch as acquisition, restoration, and management of wildlife habitat (WhitetailsUnlimited, Programs, 2002). However, according to WTU field director, George Rice,there has been little habitat restoration or protection effort in the study area due to thesizable existing deer population (Rice, 2002).
ORV User Groups
As discussed in the land use section of this chapter, off-road vehicle use is a common andpopular activity in the study area year round. While this list is not comprehensive, itdescribes a few of the groups that depend on public and private land for their enjoyment.As discussed in Chapter 6, ORV use can be detrimental to ecological integrity. However,individual ORV users and local ORV clubs are often active land stewards. Local chaptersof ORV clubs may organize trail maintenance workdays where members work to repairtrails and improve signage to minimize damaging ORV practices. These activities mayhelp to reduce environmental impacts. Furthermore, they often establish relationships withmajor private landowners and public land managers to secure more extensive trail systemsand protect access to existing trails.
� Michigan Snowmobile Association (MSA) – The Michigan Snowmobile Association isthe state chapter of the American Council of Snowmobile Associations (ACSA).ACSA works to coordinate the nation’s snowmobilers and protect their recreationalrights. Currently, two main issues that ACSA is focusing on at the national level arekeeping public lands open to snowmobile use and limiting the regulation of snowmobile

Chapter 4: Social and Political Context 94
emissions. At the state level, the MSA includes roughly 25,000 members. Theorganization provides a variety of services to its members including education, outingorganization, and lobbying. Roughly 170 clubs exist throughout the state and they arededicated to the creation and maintenance of the more than 6,200 miles of marked andgroomed trails in Michigan (Manson, 2002). Most notable are their trail maintenanceefforts at the beginning and end of the season as well as their frequently closerelationships with private landowners who own trail segments. These personal contactscould benefit land conservancies interested in forming local relationships to implementlong term protection strategies.
� Michigan ATV Association (MATVA) - The Michigan ATV (all-terrain vehicles)Association is a nonprofit organization that works closely with federal, state, and localgovernment agencies as well as other clubs and organizations to maintain, improve, andexpand ATV riding privileges (Michigan ATV Association, 2002). It works to educatemembers on issues such as rider safety and the protection of the state’s naturalresources.
� Cycle Conservation Club of Michigan (CCCM) – Although there does not appear to bea local chapter of the Cycle Conservation Club of Michigan near the study area, it alsowarrants attention in this section of the report due to its lobbying efforts at the statelevel. Like MATVA, CCCM works to protect the rights of members to access publicland for motorized vehicular use.
Conservation Groups and Agencies
Several groups are active in the upper Manistee River watershed that have similar goals andinterests related to conservation issues. While each organization has its own priorities andstrategies for achieving success, there appears to be a high level of interaction, cooperation,and information sharing among these groups, as well as with the other stakeholder groupsdiscussed in this section.
Upper Manistee River Association
The Upper Manistee River Association (UMRA) is a membership organization comprisedprimarily of riparian landowners who are dedicated to the enhancement and protection ofthe upper Manistee River. The Association’s purpose is “to help improve and maintain theupper Manistee River and its subwatersheds so that they achieve and sustain theirmaximum potential for recreational use consistent with necessary safeguards.” UMRAworks to fulfill this goal through financial support and cooperation with other conservation-minded public and private entities.
In addition to active involvement and lobbying for river protection in local and state policy,UMRC finances river rehabilitation initiatives, assists in river and corridor maintenanceprograms, monitors riverflow quality, and provides river and riparian guidelines forproperty owners. UMRA is also the parent organization of the Upper Manistee River

Chapter 4: Social and Political Context 95
Restoration Committee (see below) and has been a long-time advocate for securing NaturalRiver status for the upper Mansitee River (Powers, 2001). Recently, UMRC has partneredwith the Pine River Watershed Coalition to organize a regional campaign involving 11citizen organizations to revive pursuit of Natural River designation for the Pine River andupper reaches of the Manistee River (Guy, 2002).
Upper Manistee River Restoration Committee
Created in 1989 by the Upper Manistee River Association (UMRA) and aided andadministered by the Huron Pines Resource Conservation and Development (RC&D) AreaCouncil, the Upper Manistee River Restoration Committee (UMRRC) focuses primarily onrestoring trout habitat. UMRRC’s two goals are “to restore system potential for top-ranktrout fishery supported by self-sustaining stocks” and to “upgrade public and private use,maintenance, and protection of riparian lands.” These goals are supported by severalobjectives: controlling streambank erosion, removing streambed sediment, enhancing troutcover, maximizing trout production, improving public access, providing adequatesanitation, securing Natural River status, and perpetuating maintenance funding. UMRRCis comprised of 13 partner groups, including the Huron Pines RC&D Council, USDANational Resources Conservation Service, MDNR, Michigan Department of MilitaryAffairs, three soil and water conservation districts and county road commissions, theMichigan chapter of Trout Unlimited, the Manistee River Association, and UMRA (UpperManistee River Restoration Committee, 2000).
To date, UMRRC has spent over $1 million on stream bank and road crossing erosioncontrol. In 1999, UMRRC successfully completed its original 10 year action plan. Becauseof the program’s success, the Committee chose not to dissolve and has operated since 1999under reduced funding to help service and maintain erosion control measures, assist withannual trout surveys, and monitor the performance of restoration measures, among otheractivities (Kutkhun, April 2002).
Grand Traverse Regional Land Conservancy
As discussed in Chapter 1, the Grand Traverse Regional Land Conservancy (GTRLC) is aleading regional land conservancy with a history of successful accomplishments within itsservice area of Antrim, Benzie, Grand Traverse, Kalkaska, and Manistee counties.GTRLC’s mission is “to protect significant natural, scenic, and farm lands for present andfuture generations.” Within the study area, GTRLC is primarily interested in conservingland for its ecological value. GTRLC plans to focus its initial attention on significantlyexpanding its existing land holdings in portions of the Upper Manistee River watershed thatfall within Kalkaska County. Future efforts by GTRLC may eventually lead to expandedconservation efforts in other counties, either through direct involvement or partnering withor assisting other conservation organizations (Rigney, 2001).
The Nature Conservancy
The Nature Conservancy (TNC) is a leader in the conservation of wild and natural lands

Chapter 4: Social and Political Context 96
around the world. Its mission is “to preserve the plants, animals, and natural communitiesthat represent the diversity of life on Earth by protecting the lands and waters they need tosurvive” (TNC, About Us, 2002). The Nature Conservancy has been conserving naturalplaces for over 50 years and has protected over 92 million acres worldwide (TNC, AboutUs, 2002). Sources of financial support for TNC’s activities come from its one millionmembers as well as communities, businesses, governments, and partner organizations.
The Michigan Chapter of TNC has protected over 72,000 acres of land across the state(TNC, Michigan Chapter, 2002). To date, TNC has had limited involvement inconservation activities in the upper Manistee River watershed. However, a team of TNCfreshwater ecologists included the Upper Manistee River as part of their Camp Grayling-AuSable conservation area. TNC identified this area for future conservation efforts because ofits high groundwater, its headwater streams in outwash and ice-contact features, itsheadwater and unconnected lakes in ice contact, and its small, headwater lakes on outwashplains (DePhillips, 2001). Furthermore, the Upper Manistee contains a number of potentialaquatic conservation targets including groundwater-fed headwater streams, wetland-influenced, groundwater-fed headwater streams, and a groundwater-fed mainstem(DePhillips, 2001).
TNC Michigan hopes to increase land conservation collaboration by developing a“partnership program” that will work to coordinate the efforts of approximately 40 landtrusts across the state (McCort, 2001). Although this project is still in its infancy it aims toimprove statewide conservation efforts by pooling expertise, technology, data, and funding.However, success depends in part on a significant commitment by numerous local land truststaff who are already inundated with local endeavors. Whether or not the partnershipprogram is successful, TNC Michigan presently has a close relationship with a number ofother important statewide stakeholders including GTRLC, other Michigan land trusts,MDNR and the USFS (McCort, 2001).
HeadWaters Land Conservancy
The HeadWaters Land Conservancy (HeadWaters) works in 11 counties in northeast LowerMichigan. However, only a small portion of the Manistee River watershed in westernCrawford and Otsego counties lies within its service area. To date, HeadWaters does nothave any conservation properties in the study area, but it could potentially manage land inthe area in the future. Founded in 1993 by a small grassroots group of concerned citizens,the HeadWaters’ mission is “to foster the preservation of open space as an irreplaceablepart of our environment, and to advance the protection of ecologically sensitive areas,scenic landscape, and historic features.” HeadWaters is a small organization that hastraditionally relied exclusively on volunteer work and hired its first paid Executive Directorin December 2001.
HeadWaters relies primarily on donations of property and conservation easements ratherthan purchasing properties. According to Liz Zimmerman, an active volunteer and BoardMember, HeadWaters is faced with more conservation opportunities than they can handle,and inquiries on potential easements come in nearly every day. As a result, HeadWaters is

Chapter 4: Social and Political Context 97
not proactively contacting landowners but is working to accommodate those landownerswho take the initiative. Zimmerman estimates that they presently have 15 potentialeasements in progress. Because HeadWaters is a small organization with limited resourcesand experience, working with other groups, agencies, and organizations is critical to itssuccess. HeadWaters cooperates with local government agencies and MDNR in landstewardship activities and is also currently working on an initiative to expand wildlifecorridors in the Pigeon River watershed that involves the Tip of the Mitt Watershed Counciland Michigan chapters of Trout Unlimited, Ducks Unlimited, and The Nature Conservancy.HeadWaters also works closely with other conservancies, particularly the Little TraverseConservancy and GTRLC, which often serve in a mentoring capacity to HeadWaters(Zimmerman, 2002).
Natural Resources Conservation Service and related partners
The Natural Resource Conservation Service (NRCS) is a division of the U.S. Department ofAgriculture that works in an educational and advisory capacity with private landowners toassist them with the management and conservation of their property’s natural resources.Using scientific and technical expertise, the NRCS partners with local ResourceConservation and Development (RC&D) service districts to promote conservation ofnatural resources in rural areas while improving the social and economic stability of thoseareas. The NRCS and local RC&D districts assist landowners with issues such as waterquality, soil erosion, forestry, wildlife habitat, and conservation buffers. Portions of thestudy area in Antrim, Kalkaska, and Missaukee counties are under the jurisdiction of theNorth West RC&D Council, while the Huron Pines RC&D Council is responsible forportions of the watershed in Otsego and Crawford counties. As previously discussed, theNRCS has several conservation programs that target farmers in the study area.
Huron Pines: Huron Pines works with a variety of state and local government agencies,such as MDNR, MDEQ, county road commissions, and township governments. Asmentioned above, Huron Pines has been active in administering and funding the UpperManistee River Restoration Committee to control stream erosion and point source runoff inthe study area. According to Brian Benjamin, Watershed Coordinator for Huron Pines, amajor concern of the agency is the accelerated development and subdivision of private land.Benjamin feels that these activities have been increasing due to the “perceived threat” of thepotential designation of the Upper Manistee as a Natural River. Landowners perceive anincentive to subdivide their property in the near future, before Natural River designationcould restrict such activities. Benjamin also expressed a need for improved localinvolvement at the township level in planning and zoning, which is limited by a lack ofresources and education (Benjamin, 2001).
Conservation Resource Alliance: The Conservation Resource Alliance (CRA) is a nonprofitorganization that works under the guidance of the North West RC&D Council. Established30 years ago, CRA serves a 13 county area in Lower Michigan, including Antrim,Kalkaska, and Missaukee counties. Consistent with the goals of the Natural ResourceConservation Service and the North West RC&D Council, CRA’s biologists, engineers, andfield technicians work with landowners “to plan, locate funding options, cut through red

Chapter 4: Social and Political Context 98
tape, and implement programs to enhance the habitat value and beauty of the region”(Conservation Resource Alliance, 2002). CRA strives to facilitate collaborative land usesolutions among private landowners, government agencies, and commercial businesses.Through its River Care Program, CRA has worked with the Upper Manistee RiverRestoration Committee and actively prevents erosion and restores eroded stream banks andsedimentation along the Manistee River (Johnson, 2001).
Major Industrial Stakeholders
Timber Companies
A number of major timber companies operate in the study area. These include Mead Paper(Escanaba, MI), Weyerhaeuser (Grayling, MI) and Georgia Pacific (Gaylord, MI). Allthree corporations are members of the Sustainable Forestry Initiative and work to improvetheir management through land stewardship activities. The Sustainable Forestry Initiative(SFI) program is an 11-point commitment addressing reforestation, water qualityprotection, wildlife conservation, visual quality, biological diversity, and efficient use offorest resources (Mead, 2002). Regional and nationwide timber companies have asignificant amount of clout in public land management decisions. They are a valuablesource of income to the state through timber sales on public land and can be critical to localeconomies. One such example is the Weyerhaeuser OSB (oriented strand board) plant justsouth of Grayling that employs 165 people and has been in operation for 20 years (Malm,2002). The role of timber companies in local, regional, and national economies gives thema significant amount of political power over land use policies.
Oil and Gas Extraction and Transmission Companies
Oil and gas development is a major industry in the study area. Like timber companies, oiland gas developers have significant influence over land use decisions because of theamount of money and number of jobs the industry brings to the state. There are a numberof companies that are active with oil and gas development in the area including:
� Muskegon Development Company, of Mount Pleasant, Michigan� MCN Oil & Gas Company, of Traverse City, Michigan� KCS Michigan Resources, Inc. of Traverse City, Michigan� Savoy Energy, L.P., of Traverse City, Michigan� Paxton Resources, L.L.C. of Gaylord, Michigan� Aurora Energy, Ltd. of Traverse City, Michigan� H & H Star Energy, Inc. of Traverse City, Michigan� CMS Gas Transmission and Storage Company, of Dearborn, Michigan

Chapter 4: Social and Political Context 99
Other Stakeholder Groups
Citizens Alliance for Regulatory Reform
Citizens Alliance for Regulatory Reform (CARR) was founded by Calvin Ackley, theOceana County Drain Commissioner, as a result of a conflict with the federal governmentover a wetlands protection law. According to CARR's brochure, it is "an organization bornin the hearts of conservationists and based in the heartland of farms, forests, and great lakes.We recognize that the growth encroachment of the government with "Environmental" lawsand regulations threatens our basic freedom" (Great Lakes Bulletin, 1997). CARR hasproven that they hold a significant amount of power in local politics. As previouslymentioned, CARR played an important role in the failure to designate portions of theManistee River as a state recognized Natural River (Pearson, 2001).
Michigan Militia
The Michigan Militia has a small but real presence in the Manistee River watershed.According to one Michigan Militia web site, its mission is to help Michigan’s citizens“become more able to support, uphold, and defend the Constitution for The United States,and the Constitution for The State of Michigan” (Michigan Militia, 2002). Members alsostate that “to further promulgate the concept of an armed, informed, and educated citizenry,is to better ‘secure the blessings of liberty’” (Michigan Militia, 2002). While the team wasunable to obtain accurate local information on the Michigan Militia in the study area,according to one MDNR employee, it has a significant presence in the watershed andplayed an important role in opposing the Manistee’s Natural River designation (Rozich,2001).
COLLABORATION OPPORTUNITIES
The list of stakeholders presented in this section is not exhaustive. Nevertheless, the teamhopes that, at minimum, it illustrates both the wide range of interests and issues at playwithin the study area, as well as the many similar interests among those with a stake in thefuture of the study area. Many of these organizations and agencies are already workingtogether to achieve common goals. However, the project team believes there is substantialpotential to advance conservation efforts in the upper Manistee River watershed throughadditional communication and improved collaboration among stakeholders. This potentialexists among stakeholders with overlapping interests, as well as between parties withdiffering priorities, motives, and goals.
Including stakeholders that represent a full spectrum of interests is important to minimizingconflict and building trust. While achieving a high level of trust among stakeholdersrequires tremendous patience, understanding, and commitment, (particularly amongadversarial parties or parties with little former interaction) it is an essential component indeveloping long term working relationships that are needed for complex, ongoing, andlarge-scale issues such as conservation planning. Cultivating collaboration among a diverse

Chapter 4: Social and Political Context 100
range of stakeholders builds opportunities for creative problem solving that broadens therange of alternatives to best meet the needs of all stakeholders.
GTRLC already has a strong record of working with a broad range of stakeholders,including township and county government officials, MDNR and MDEQ, other landconservancies and conservation organizations, sportsmen groups, and local naturalists andlandowners (Rigney, March 2002). As an organization with limited resources, GTRLCrecognizes the necessity and benefits of working with others to share information and poolresources. The project team sees opportunity for GTRLC to build upon these existing ties.In addition, because GTRLC has limited knowledge of, and experience in, the study area,building new partnerships with local stakeholders is critical to acquiring detailed data andinformation necessary to implement a conservation plan in the area.
However, the potential benefits of collaboration extend well beyond sharing information.Establishing ties to local groups may help to establish GTRLC’s credibility in localcommunities and improve local awareness and understanding of the benefits ofconservation efforts. By supporting educational outreach and lobbying efforts of othergroups that help with land protection efforts, GTRLC may increase support for its causewithout direct involvement. Ultimately, building trust and increased awareness andunderstanding of conservation issues among local communities translates into betterworking relationships with private landowners.
Perhaps most significantly, collaboration is essential in promoting a true landscapeapproach to conservation planning. Expanding beyond a narrowly-focused, piecemealapproach to land protection requires coordination among many groups, all working towarda larger unified goal. To this end, GTRLC should expand coordination with local groupsfocused on a limited geographic range as well as its larger, more regionally focusedorganizations and agencies such as TNC and MDNR. For example, the Office of PropertyManagement within MDNR, which is responsible for acquiring and selling state land, willoccasionally sell a parcel of land and use the proceeds to purchase a more ecologicallyvaluable piece of property, often an inholding in public land. There may be the potentialfor the Office of Property Mangement to notify GTRLC of such pending transactions, thusgiving GTRLC an opportunity to either purchase the development rights or place aneasement on the property before it is sold to a new private landowner. In more generalterms, a landscape approach to conservation is only possible by coordinating the strategiesof both local and regional land managers. GTRLC should continue to expand its currentcollaboration efforts in the area to meet its goals and objectives most effectively.