Embed Size (px)
Citation preview

31 EnvironmEntal HEaltH
aIr PollutIon and HealtH
Agriculture and household waste burning is
common in rural areas.� Burning of household
waste emits particulates, organic compounds
as well as more persistent and noxious
compounds, such as dioxins and PAHs.
Nationally, 46 percent of all waste is burned
by individual households and the practice is
most common in rural areas.33
Kaingin (slash and burn practices), charcoal
production, and the burning of agricultural
wastes and savannah are also seasonal activities
that emit large quantities of carbon monoxide
and particulates. This can impact the farmers
or land owners undertaking the burning as
well as the community nearby. The country has
over 225,508 hectares of grasslands, 344,671
hectares of land under sugarcane production,
and almost four million hectares of land under
rice cultivation. Much of this land undergoes
periodic burning to remove waste or to
otherwise manage the land.
33 nSo 1998.
Figure 3.4Average annual TSP levels in major cities and urban centers, 2003–04
Source: DEnr-EmB 2005a.
While most people are aware that outdoor air
pollution can damage their health, globally the
worst air pollution conditions have been found
in indoor environments. The potentially high
risk of indoor air pollution relates to the fact
that even small pollution sources can reduce
air quality substantially under the confined
conditions of indoor environments. It is also
related to long exposure times to indoor air,
especially among women that spend much of
their day in households. In the Philippines,
indoor air quality, its human exposure and health
impacts, have only just begun to be understood.
The use of traditional, more polluting household
fuels and the high prevalence of smoking have
been identified as the major potential risks.
TheRisks of Indoor Air
Table 3.5Percent of households usingmajor types of fuel
19952004Change
Electricity8488+4
lPG3352+19
Kerosene8056–14
Fuelwood6455–9
Charcoal3935–5
Biomass2919–10
Source:nSo 2004.
Slash-and-burn agriculture is a seasonal activity that contributes to air pollution.Source:authors
Environmental Risks
30
Chapter 1.IntroductIon
PHiliPPinES EnvironmEnt monitor
aIr PollutIon and HealtH
Box 3.2. Levels of selected outdoor air pollutants and your health
Carbon Monoxide interferes directly with oxygen uptake, causing poisoning at very highconcentrations.at low levels, it impacts the nervous system.the DEnr guideline is 35 µg/m3 for 1-hour exposure and 10 µg/m3 for 8-hour exposure.
Ozone causes direct damage to lung tissue and in high concentrations can cause breathing, eye, and nose irritation. it also contributes to respiratory and heart ailments. the DEnr guideline is 140 µg/nm3
for 1-hour exposure and 60 µg/nm3 for 8-hour exposure.
Sulfur and nitrogen oxides contribute directly or indirectly through reactions with other pollutantsto respiratory and heart conditions and disease.DEnr has set 24 hour exposure guidelines of 150 µg/nm3 for both pollutants. the 1-year exposure guideline for S02 is 60 µg/nm3. Below these levels, So2 has been shown to have health effects at concentrations as low as 10–20 µg/m3.
Lead in air is primarily from leaded gasoline.Exposure even at low concentrations leads to accumulation in blood and neurological damage, especially among children. the DEnr guideline is 1.5 µg/nm3 for 3-month exposure and 1 µg/nm3
for 1-year exposure.
Volatile Organic Compounds include benzene, toluene, and xylene. Depending on the compound, long-term exposure can cause cancer and immune disorders, and can also affect the nervous system. there are no DEnr guidelines. internationalstandards for benzene are 5 ppb (nationalaverage-UK); for toluene, 2,000 ppb for 24-hour exposure (australia); and for xylene, 10,155 ppbover a 24-hour exposure (WHo).
Measurements of volatile organic compounds
at the same station found low levels of benzene
(2 ppb), toluene (12 ppb), and xylene (1 ppb).
While there are no national guidelines for
these parameters, these values are lower than
available international guidelines (Box 3.2).
Similar results have been found for NO2, where
the concentration was between 0.005 and
0.03 ppm, well below the 24-hour guideline
value of 0.08 ppm.
High concentrations of particulates are found
in most major cities.� Based on monitoring of
total suspended particulates (TSP) in 2003–04,
19 cities have average annual concentrations
that exceed the standard, with an average
concentration of 130 µg/m3. Very high levels
were observed in roadsides in Baguio City,
Alaminos City, and Calapan City (Figure 3.4).
Monitoring of other parameters is limited
outside of Metro Manila.� Data for other
parameters is not yet regularly monitored and
reported except for a few cities.
CagayandeOro. Continuous monitoring data
for PM10 in 2003 showed a 24-hour average
of between 35–50 µg/m3 or an annual average
of 40 µg/m3. Both are within the air quality
guidelines. Measurements of SO2 over the
same time period also showed levels below the
standard (24-hour average between 1 and 13
µg/Nm3 and an annual mean of 4.1 µg/Nm3.
DavaoCity. Sulfur dioxide monitoring has
indicated low levels with annual averages
between 1.4 and 2.0 µg/Nm3.
Environmental Risks
34 PhiliPPineS environment monitor
Age, gender, And income level have a
significant impact on a person’s susceptibility
and exposure to environmental hazards. People
of different ages and genders have unique
physiological characteristics that influence
the extent to which they are affected by
disease. It also can affect levels of exposure to
environmental pollution. This section presents
the factors that influence susceptibility and
exposure among different groups and their
relevance in the Philippines context.
40 esrey et al., 1991; hutley et al., 1997; luby et al., 2005.
Chapter 4.Special FocuS: environmental
HealtH, poverty, and vulnerability
Table 4.1 Major water and air pollution-related illnesses predominantly affecting children
DiseaseProportion of
cases affecting children (%)
Proportion of deaths afflicting
children (%)
Diarrhea 85 62
helminthiasis nA 75
Schistosomiasis 51 0.3
Cholera 78 17
Pneumonia 82 16
Bronchitis 70 47
Source: includes reported cases only. Doh-neC 2004a (morbidity) and nSo 2002 (mortality). morbidity data is for children under 14; mortality data is for children under 10. Bronchitis morbidity includes acute and chronic forms, however among children the acute is expected to predominate. the mortality data covers acute bronchitis.
little mortality in adults, they remain a leading
cause of death among children. Diarrhea, for
example, is not among the top ten causes of
death among adults, yet it is the third leading
cause of death among children. Similarly,
STH cases and deaths occur predominately
in children.
This pattern is similar with respect to air
pollution. Acute respiratory infections, including
acute bronchitis and pneumonia, affect mostly
children. As illustrated in Table 4.1, children
account for 82 percent of pneumonia cases and
70 percent of bronchitis cases each year.Age
Children are most vulnerable. Children’s
bodies are in a dynamic state of development
characterized by high breathing and metabolic
rates and higher nutrient absorption rates
than adults. As a result, their bodies absorb
more pollutants than the bodies of adults.
Furthermore, children’s food and liquid
consumption in proportion to their body
weight is significantly higher than that of
adults, which results in greater exposure to
ingested pollutants. Children are also commonly
exposed more to pollution in their daily lives.
They spend a lot of active time outdoors,
commonly in unsanitary conditions, and their
mouths can be exposed to everything from
fingers to toys to soil, increasing the likely
transmission of disease. Additionally, if children
do not practice regular hand washing, the risk
of transmission can nearly double.40
In the Philippines, 80 percent of the reported
cases of diseases attributable to water
pollution, sanitation and hygiene affect
children. Moreover, while these diseases cause
Children playing in polluted water. Source: USAiD Philippines
27EnvironmEntal HEaltH
aIr PollutIon and HealtH
The health risks of exposure to outdoor
air pollution are assessed by monitoring
different pollutant concentrations in urban air
and comparing them against guidelines
established based on health considerations.
While there are no minimum levels of air
pollution that eliminate health impacts, air
quality guidelines can be used as a target to
help minimize health impacts and provide a
warning sign when levels become high. The
guidelines generally recommend maximum
concentrations of pollutants for short-term
exposure (typically less than a day) and
long-term exposure (typically annually), since
pollutants can cause acute effects from high
concentrations and chronic effects from
long-term low-level exposure. Most of the
monitoring is done at roadsides, and thus most
accurately represents the risk in these areas.
Particulates are at unhealthy levels in Metro
Manila.� Particulate emissions in Manila are
largely from motor vehicles (84 percent), solid
waste burning (10 percent), and industries
(5.5 percent). Seventy percent of these motor
vehicle emissions come from the more than
200,000 diesel-powered utility vehicles—such
as jeepneys and the 170,000 gasoline-powered
motorcycles and tricycles in the city.27
Measurements of total suspended particulates
in 2003–04 indicate that all stations exceeded
DENR standards and that the average
concentration (175 µg/m3) was nearly twice
as high as the standard (90 µg/m3) (Figure 3.1,
Box 3.1). For smaller particulate matter (PM10
and PM2.5), monitoring has been undertaken
regularly since 2000, but in fewer sites.28
The available data indicates concentrations
of PM10 and PM2.5 exceed standards in some
stations and are increasing health risks. Annual
average concentrations of PM10 range from
30 to 84 µg/m3; 24-hour mean concentrations
were between 32 and 100 µg/m3, with one
site exceeding the guidelines. Annual average
concentrations of PM2.5 were between 18 and
28 µg/m3; three sites exceeded the USEPA
annual average guideline (15 µg/m3). Over a
24-hour period, concentrations range between
18 and 75 µg/m3; half of the sites measured
exceeded the USEPA 24-hour guideline
(65 µg/m3).
28 DEnr-EmB 2003, 2005a.29 asian regional research Programme on Environmental technologyand manila observatory 2004.27 See aDB, WHo-WPro, and DoH 2004.
The Risks of Outdoor Air Figure 3.1 Average roadside TSP levels in Metro Manila, 2003–04
note: DEnr standard is shown by dotted line.Source: DEnr-EmB 2005a.
Environmental Risks
35environmentAl heAlth
SpeciAl focuS: environmentAl HeAltH, poverty, And vulnerAbility
Gender also affects vulnerability and
exposure to environmental hazards, but this
impact varies across age, geographic area,
and profession.
Women’s bodies are more susceptible to
cardiovascular disease. The overall incidence
of cardiovascular diseases including those
caused by air pollution, is higher in women,
Gender
41 Doh-neC 2004a.
Table 4.2 Major water and air pollution-related illnesses affecting the elderly (>50 yrs)
DiseaseProportion of
cases affecting elderly (%)
Proportion of deaths afflicting
elderly (%)
Schistosomiasis 18 65
Cholera 7 39
Filariasis 18 57
Pneumonia 9 75
Bronchitis 12 84
Source: Doh-neC 2004a (morbidity) and nSo 2002 (mortality). morbidity data is for children under 14; mortality data is for children under 10. Bronchitis morbidity includes acute and chronic forms. themortaility data covers CoPD only.
accounting for 58 percent of the total.41 In
addition to potential differences in exposure
among men and females, one of the main
reasons for this is that women’s coronary
arteries are smaller and their microvessels
more frequently dysfunctional than men’s.
Women with coronary disease also have a
higher risk of dying from the disease than men.
The health consequences for the elderly
are higher. The elderly are, in general, less
exposed to environmental hazards, and hence,
are less likely to be afflicted with environment-
related diseases. Once they do get sick, however,
they are much more likely to die than either
children or adults. For many diseases such
as pneumonia and schistosomiasis, the elderly
account for less than 20 percent of the cases
but over 65 percent of the deaths (Table 4.2).
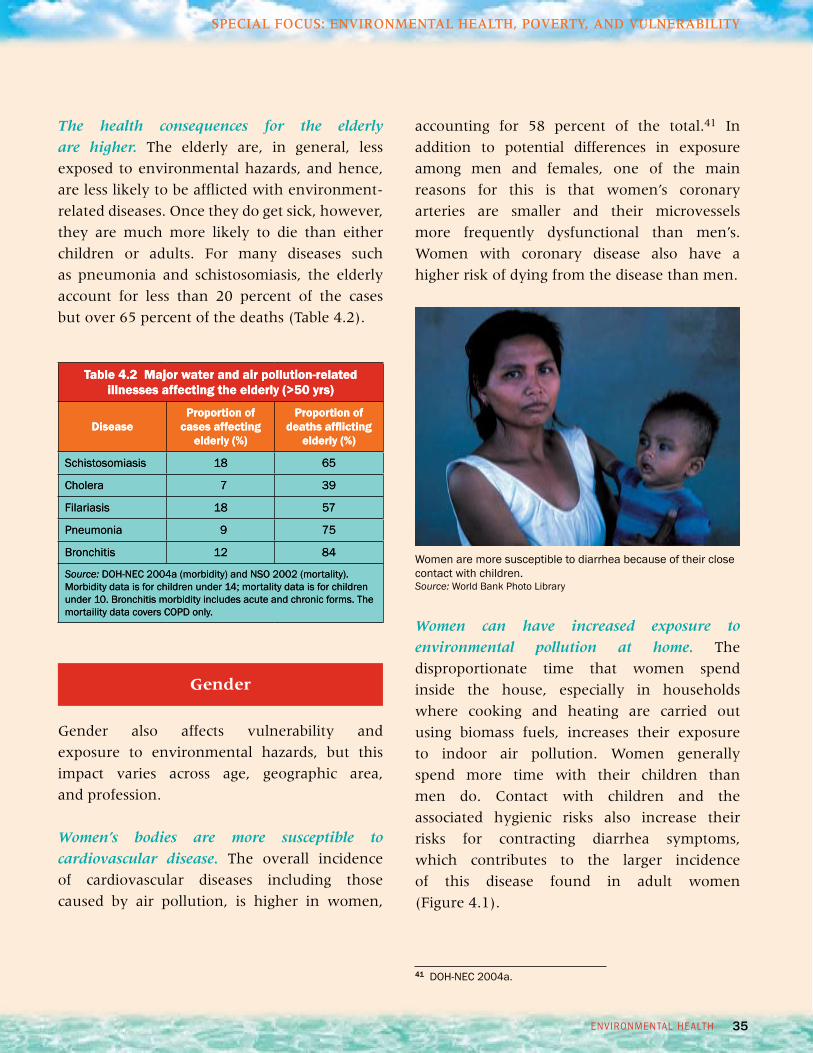
Women can have increased exposure to
environmental pollution at home. The
disproportionate time that women spend
inside the house, especially in households
where cooking and heating are carried out
using biomass fuels, increases their exposure
to indoor air pollution. Women generally
spend more time with their children than
men do. Contact with children and the
associated hygienic risks also increase their
risks for contracting diarrhea symptoms,
which contributes to the larger incidence
of this disease found in adult women
(Figure 4.1).
Women are more susceptible to diarrhea because of their close contact with children. Source: World Bank Photo library
26
Chapter 1. IntroductIon
PHiliPPinES EnvironmEnt monitor
aIr PollutIon and HealtH Disease Burden
Indoor air pollution may also be an important
contributor to disease.� While comprehensive
data on indoor air quality is not available,
estimates using global relationships between
disease and use of solid cooking fuel indicate
that it may be an important contributor to
disease in the Philippines, especially in
households with poor ventilation. Under
conditions where kitchens using solid fuel
have good ventilation, it is estimated that
indoor air pollution would account for just
under 5,000 deaths from respiratory and
cardiovascular disease nationally, which is
one-third of the total estimated deaths due
to air pollution (Table 3.2). The high
dependence on solid fuel for cooking in
rural areas is estimated to contribute over 70
percent of these deaths.
Table 3.4 Additional deaths due to outdoorair pollution in cities
City PrematureDeaths
% of all reported diseases
metro manila 4,968 12
Cabanatuan 134 11
metro Cebu 608 10
Zamboanga City 240 8
Butuan 104 8
Davao City 414 7
Gen. Santos 117 7
Baguio 102 7
tacloban 88 7
iloilo City 204 5
Source: Based on DEnr air quality data and dose-response functions. See methodology section for details. Cities included are those with a population over 200,000 monitored by DEnr for air quality.
many rural household use solid fuels for indoor cooking.Source: r.E.A.P – Canada.
38
chapter 1.introduction
PhiliPPineS environment monitor
SpeciAl focuS: environmentAl HeAltH, poverty, And vulnerAbility
45Subida and torres, 1991.46Subida and torres, 1994.
Lower income groups are also nearly four
times more likely to use fuelwood for cooking
and heating and have a higher smoking
prevalence.44 This puts them at higher risk of
exposure to indoor air pollution.
An increased susceptibility to outdoor air
pollution has also been observed in commuters
and drivers, who use forms of transport that
are cheaper and more exposed to outdoor
air pollution. Jeepney drivers were found to
have a 50 percent higher risk of abnormal
pulmonary function and a 100 percent
higher risk of COPD. Additionally, respiratory
symptoms were twice as prevalent in jeepney
drivers relative to air-conditioned bus drivers
and commuters.45 Child street vendors have
also been shown to have a higher health risk
than other children due to their exposure to
air pollution and lack of access to health care.46
44Smoking data from nSo 2003a and nSo 2006.
Studies have shown that jeepney drivers and street vendors are susceptible to the health effects of air pollution.Source: Authors.
23 EnvironmEntal HEaltH
Water PollutIon, SanItatIon and HealtH
the quality of water supply depends on the distribution system.Source:authors.
Box 2.4Cholera outbreak inCaloocan City Jail
Duringaugust and September 2001, 15 percentof the 1,245 inmates in the Caloocan Jail had diarrhea, resulting in one death. Tests confirmed cholera to be the cause. after investigation by the DoH, it was determined that it was due to a contaminated water supply. Water supply pipes tied together using rubber bands were submerged in stagnant water where human feces were found tobe coming from the septic tank pipes, which were damaged and leaking. a shallow well being used by some of the inmates for washing kitchen utensils and bathing was also found to have a pipe fromthe septic tank lying in it. the Caloocan lGU, Bureau of Jail management,maynilad Water and DoHresponded to the findings by treating the inmates, repairing the distribution pipes, improving hygiene, and improving the septic tank system.
Source: DoH-nEC 2001.
Box 2.3DENR’s Tapwatch Program
in 2005, DEnr monitored 88 shallow wells usedfor water supply in targeted areas. overall, 21 sites were found to be potable, 27 failed to meetdrinking water standards for fecal coliform, and the remainder needed further testing to determine potability. the suspected sources of contamination were defective septic tanks, untreated wastewater, and animal wastes.
Proportion ofLocationWells Below StandardCagayan, nueva vizcaya6 out of 10Pampanga3 out of 3orientalmindoro3 out of 8iloilo City6 out of 8Cebu City2 out of 6leyte1 out of 6Zamboanga City3 out of 8Davao City1 out of 4
Source: DEnr-EmB 2005b.
Wells such as these can be contaminated if located close to an unprotected sanitation facility. Source: World Bank Photo library
Environmental Risks
25EnvironmEntal HEaltH
aIr PollutIon and HealtH
Air pollution Adds to the large health
burden of cardiovascular and respiratory
disease.� These diseases are consistently among
the leading causes of disease and death in
the Philippines. There has been no significant
reduction in their overall incidence over the
past five years. In 2004, air pollution-related
cases of these diseases amounted to an
estimated five percent of all reported diseases
in the country. Air pollution is also estimated
to account for over four percent of all deaths
in the country (Tables 3.1 and 3.2).
The costs are high.� The costs associated with
treating the reported disease cases attributed
to air pollution amount to PHP962 million
(US$19 million) per year (Table 3.3). Similarly
air pollution-related deaths due to pneumonia
in children, and cardiopulmonary disease and
lung cancer in adults, resulted in an additional
PHP6.7 billion (US$134 million) in lost income
per year.26
Metro Manila is estimated to have the largest
disease burden from outdoor air pollution.�
Estimates based on the correlations of particulate
matter concentration in outdoor air and
mortality, indicate that there are nearly 5,000
premature deaths each year in Manila due to
respiratory and cardiovascular diseases from
exposure to poor air quality. This amounts to
12 percent of all deaths in Metro Manila, which
is the highest of any city in the country (Table
3.4).
26 this can be considered a lower bound estimate of economic costs, as it only accounts for the costs associated with cases that are reported to undergo treatment at a clinic or hospital and does not include indirect costs such as pain and suffering associated with having an illness and does not include unreported treatment cases and those for which people do not seek treatment. it also only includes those diseases for which a good correlation to air pollution could be made for the Philippines, and therefore excludes asthma and lung cancer morbidity.
Chapter 3.�Air Pollution
And HeAltH
Table 3.1 Proportion of reported disease cases attributable to air pollution in 2004
DiseaseNumber of reported
cases attributable to air pollution
% of all reported diseases
alri/Pneumonia(Children <5 yrs old)
92,077 2.9
CoPD (adults) 47,190 1.5
Cardiovascular (adults)
15,814 0.5
Total 155,081 4.9
Source: reported disease cases DoH-nEC 2004a; see methodology section for determination of attributable cases.
Table 3.2 Reported deaths attributable toair pollution in 2002
Disease Number of deaths
% of all reported diseases
alri/Pneumonia(Children <5 yrs old)
1,031 0.3
CoPD (adults) 4,853 1.2
Cardiovascular (adults) 6,949 1.8
lung Cancer (adults) 2,849 0.7
Total 15,682 4.0
Source: reported mortality from nSo 2002; see methodology section for determination of attributable deaths.
Table 3.3 Costs of treatment of reported disease cases attributable to air pollution in 2005
Airpollutionrelated disease
Income losses due to reduced
workdays(PHP million/yr)
Medical and Hospitalization
expenses(PHP million/yr)
Total Cost(PHP
million/yr)
alri/Pneumonia(Children<5 yrs old) 24 436 461
CoPD >30 22 347 368
Cardio-vascularDiseases 6.4 127 134
TotalPHP52
(US$1 million)PHP910(US$18 million)
PHP962(US$19million)
Source: Based on reported cases (DoH-nEC 2004a) attributable to air pollution; see methodology section for details. See text for costs of premature death.
Disease Burden
36
chapter 1. introduction
PhiliPPineS environment monitor
SpeciAl focuS: environmentAl HeAltH, poverty, And vulnerAbility
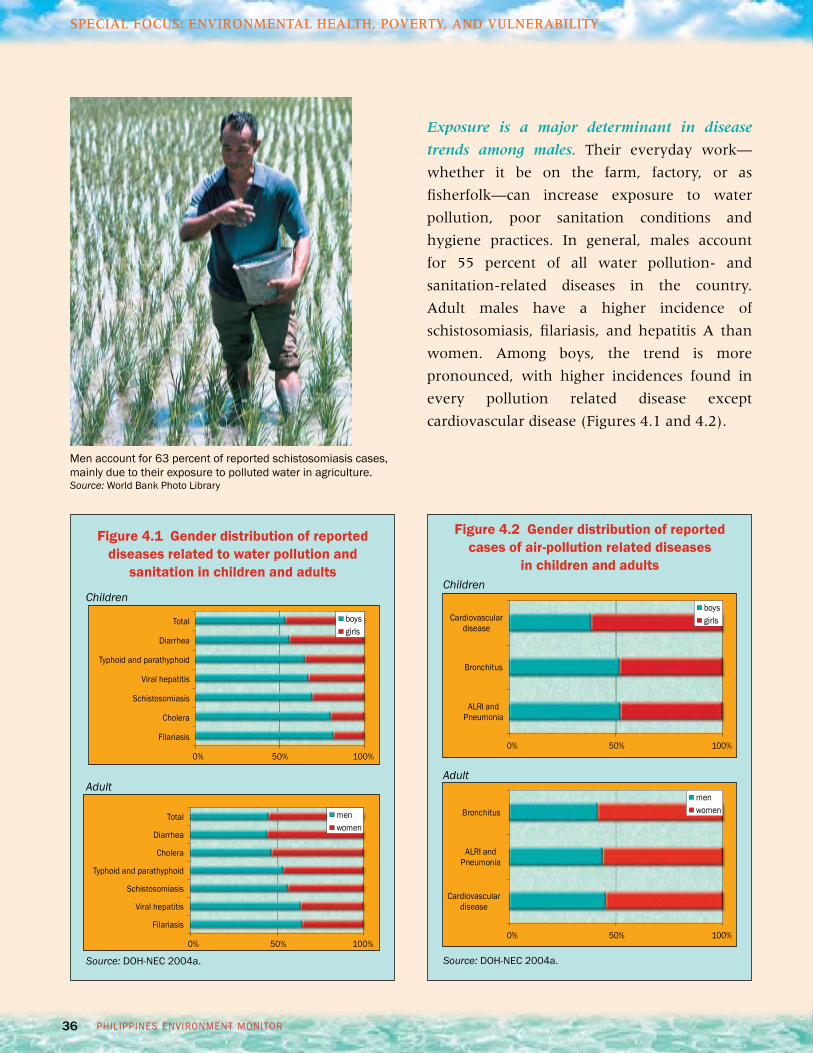
Figure 4.2 Gender distribution of reported cases of air-pollution related diseases
in children and adults
Source: Doh-neC 2004a.
Exposure is a major determinant in disease
trends among males. Their everyday work—
whether it be on the farm, factory, or as
fisherfolk—can increase exposure to water
pollution, poor sanitation conditions and
hygiene practices. In general, males account
for 55 percent of all water pollution- and
sanitation-related diseases in the country.
Adult males have a higher incidence of
schistosomiasis, filariasis, and hepatitis A than
women. Among boys, the trend is more
pronounced, with higher incidences found in
every pollution related disease except
cardiovascular disease (Figures 4.1 and 4.2).
men account for 63 percent of reported schistosomiasis cases, mainly due to their exposure to polluted water in agriculture.Source: World Bank Photo library
Children
Adult
Figure 4.1 Gender distribution of reported diseases related to water pollution and
sanitation in children and adults
Source: Doh-neC 2004a.
Children
Adult
0% 50% 100%
Alri andPneumonia
Bronchitus
Cardiovasculardisease
boysgirls
0% 50% 100%
boysgirls
0% 50% 100%
menwomen
total
Diarrhea
typhoid and parathyphoid
viral hepatitis
Schistosomiasis
Cholera
Filariasis
total
Diarrhea
Cholera
typhoid and parathyphoid
Schistosomiasis
viral hepatitis
Filariasis
24
Chapter 1.IntroductIon
PHiliPPinES EnvironmEnt monitor
Water PollutIon, SanItatIon and HealtHEnvironmental Risks
Box 2.5What are the risks to your water supply?
Individual well systems.the depth and location of a well are risk factors for well-water systems. Shallow wellsdraw from groundwater nearest to the land surface, which is the most likely to be affected by contaminationsources. Deeper wells extract groundwater from areas that benefit from further filtration through soil and from sources less likely to be affected by surface activities.
Countermeasures.locate the well away from and on higher ground than sanitation facilities, sewers, fueltanks, livestock activities, and solid waste disposal sites; dig deep wells where possible; prevent channelingof surface water into well systems using a casing around the well borehole and a well cap; and regularly testthe water quality.
Piped water supply.risks to piped water systems relate to the adequacy of treatment and the integrity ofthe distribution system. typically water service providers treat the water using sediment removal anddisinfection and other treatment depending on the quality of the source water. in cases where the treatmentsystem is adequate, the risk is associated with a malfunctioning water system, especially in cases of floodingor power failure. low water pressure due to aging or unmaintained pipelines also provides an opportunity forsewage to flow into the water supply system or for backflow of contaminated water from users with directconnection to a contaminated pipe or vessel, such as illegal connections or industrial processes. Stores ofbacteria and other material in sediment deposits in low water pressure networks or biofilm formation on pipescan also be resuspended in cases of rapid changes in flow.
Countermeasures.operation, testing, and public information on treatment system performance; providingresidual chlorine to disinfect leakages and control biofilms; reducing the length of time in distribution systemsand pressure surges; providing devices (stop valves or air gaps) that prevent backflow into the water system; providing regular maintenance and rehabilitation of network leaks; and locating new network systems awayfrom septic tanks and sewers.
Water vendors.registered water refilling stations and bottled water are regularly monitored by the Departmentof Health. However, there is limited knowledge and transparency about the source, treatment, and water qualityfrom informal water vendors. the major risks depend on the source of water and share similar risks as pipedwater and wells. For example, shallow wells in urban areas would be considered high-risk sources, while illegal connections or reselling of utility water would share similar risks associated with piped water supply. Duringtransport, delivery, and storage, there are risks associated with the contamination of public faucets, tanks, orother vessels.
Countermeasures. Better knowledge of the source, treatment process, and quality; similar measures to ensure quality of source water as above; and disinfection and covering water transport and storage containers.
37 environmentAl heAlth
SpeciAl focuS: environmentAl HeAltH, poverty, And vulnerAbility
While pollution affects all income groups, the
people most at risk are the poor, who lack basic
resources and often times, live and work in poor
quality environments. On average, provinces
with an income less than PHP 100,000 have
twice the incidence of diarrhea, a six times
higher incidence of typhoid fever, and a 50
percent higher incidence of pneumonia as
compared to those with average incomes of
over PHP200,000 (Table 4.3).
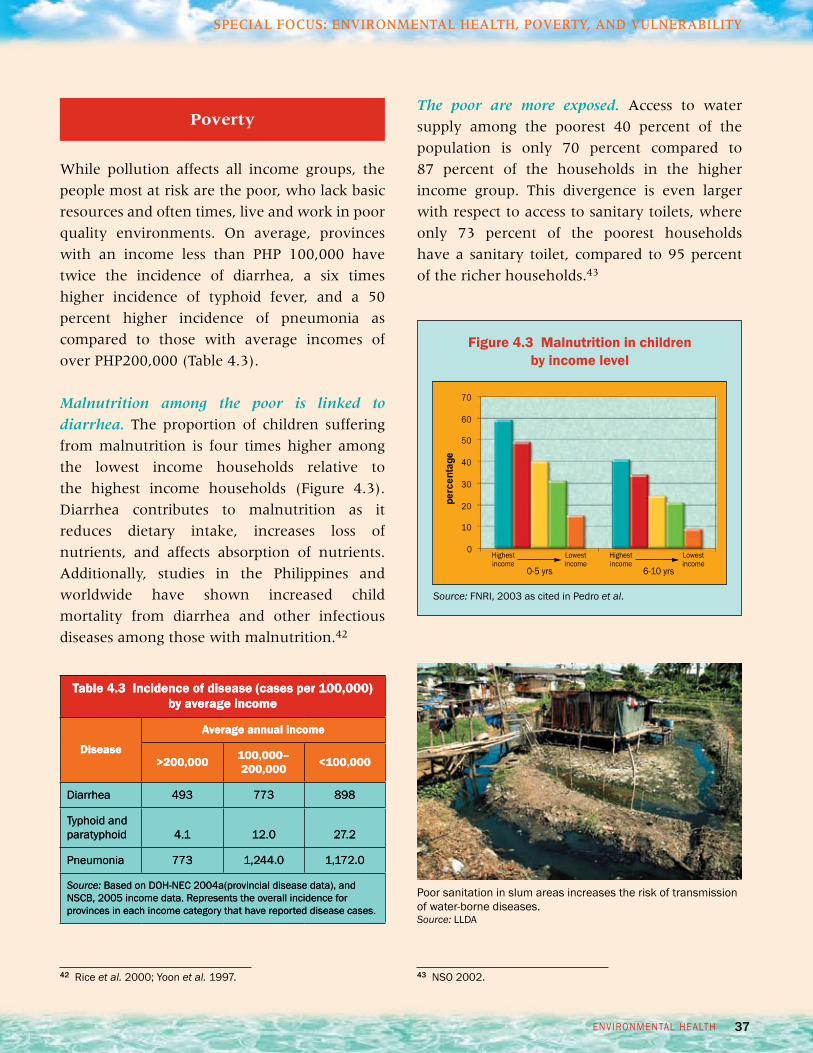
Malnutrition among the poor is linked to
diarrhea. The proportion of children suffering
from malnutrition is four times higher among
the lowest income households relative to
the highest income households (Figure 4.3).
Diarrhea contributes to malnutrition as it
reduces dietary intake, increases loss of
nutrients, and affects absorption of nutrients.
Additionally, studies in the Philippines and
worldwide have shown increased child
mortality from diarrhea and other infectious
diseases among those with malnutrition.42
Poverty
43 nSo 2002.
The poor are more exposed. Access to water
supply among the poorest 40 percent of the
population is only 70 percent compared to
87 percent of the households in the higher
income group. This divergence is even larger
with respect to access to sanitary toilets, where
only 73 percent of the poorest households
have a sanitary toilet, compared to 95 percent
of the richer households.43
Figure 4.3Malnutrition in childrenby income level
Source: Fnri, 2003 as cited in Pedro et al.
Table 4.3Incidence of disease (cases per 100,000) by average income
Disease
Average annual income
>200,000100,000–200,000<100,000
Diarrhea493773898
typhoid and paratyphoid4.112.027.2
Pneumonia7731,244.01,172.0
Source: Based on Doh-neC 2004a(provincial disease data), and nSCB, 2005 income data. represents the overall incidence for provinces in each income category that have reported disease cases.
42 riceet al. 2000; Yoon et al. 1997.
Poor sanitation in slum areas increases the risk of transmission of water-borne diseases.Source:llDA
25 EnvironmEntal HEaltH
aIr PollutIon and HealtH
Air pollution Addsto the large health
burden of cardiovascular and respiratory
disease.� These diseases are consistently among
the leading causes of disease and death in
the Philippines. There has been no significant
reduction in their overall incidence over the
past five years. In 2004, air pollution-related
cases of these diseases amounted to an
estimated five percent of all reported diseases
in the country. Air pollution is also estimated
to account for over four percent of all deaths
in the country (Tables 3.1 and 3.2).
The costs are high.� The costs associated with
treating the reported disease cases attributed
to air pollution amount to PHP962 million
(US$19 million) per year (Table 3.3). Similarly
air pollution-related deaths due to pneumonia
in children, and cardiopulmonary disease and
lung cancer in adults, resulted in an additional
PHP6.7 billion (US$134 million) in lost income
per year.26
Metro Manila is estimated to have the largest
disease burden from outdoor air pollution.�
Estimates based on the correlations of particulate
matter concentration in outdoor air and
mortality, indicate that there are nearly 5,000
premature deaths each year in Manila due to
respiratory and cardiovascular diseases from
exposure to poor air quality. This amounts to
12 percent of all deaths in Metro Manila, which
is the highest of any city in the country (Table
3.4).
26 this can be considered a lower bound estimate of economic costs, as it only accounts for the costs associated with cases that are reported to undergo treatment at a clinic or hospital and does not include indirect costs such as pain and suffering associated with having an illness and does not include unreported treatment cases and those for which people do not seek treatment. it also only includes those diseases for which a good correlation to air pollution could be made for the Philippines, and therefore excludes asthma and lung cancer morbidity.
Chapter 3.�Air Pollution
And HeAltH
Table 3.1Proportion of reported disease cases attributable to air pollution in 2004
DiseaseNumber of reported
cases attributable to air pollution
% of all reported diseases
alri/Pneumonia(Children <5 yrs old)
92,0772.9
CoPD (adults)47,1901.5
Cardiovascular (adults)
15,8140.5
Total155,0814.9
Source:reported disease cases DoH-nEC 2004a; see methodology section for determination of attributable cases.
Table 3.2Reported deaths attributable toair pollution in 2002
DiseaseNumber of deaths
% of all reported diseases
alri/Pneumonia(Children <5 yrs old)
1,0310.3
CoPD (adults)4,8531.2
Cardiovascular (adults)6,9491.8
lung Cancer (adults)2,8490.7
Total15,6824.0
Source:reported mortality from nSo 2002; see methodology section for determination of attributable deaths.
Table 3.3Costs of treatment of reported disease cases attributable to air pollution in 2005
Airpollutionrelated disease
Income losses due to reduced
workdays(PHP million/yr)
Medical and Hospitalization
expenses(PHP million/yr)
Total Cost(PHP
million/yr)
alri/Pneumonia(Children<5 yrs old)24436461
CoPD >3022347368
Cardio-vascularDiseases6.4127134
TotalPHP52
(US$1 million)PHP910(US$18 million)
PHP962(US$19million)
Source: Based on reported cases (DoH-nEC 2004a) attributable to air pollution; see methodology section for details. See text for costs of premature death.
Disease Burden
36
chapter 1.introduction
PhiliPPineS environment monitor
SpeciAl focuS: environmentAl HeAltH, poverty, And vulnerAbility
Figure 4.2Gender distribution of reported cases of air-pollution related diseases
in children and adults
Source: Doh-neC 2004a.
Exposure is a major determinant in disease
trends among males. Their everyday work—
whether it be on the farm, factory, or as
fisherfolk—can increase exposure to water
pollution, poor sanitation conditions and
hygiene practices. In general, males account
for 55 percent of all water pollution- and
sanitation-related diseases in the country.
Adult males have a higher incidence of
schistosomiasis, filariasis, and hepatitis A than
women. Among boys, the trend is more
pronounced, with higher incidences found in
every pollution related disease except
cardiovascular disease (Figures 4.1 and 4.2).
men account for 63 percent of reported schistosomiasis cases, mainly due to their exposure to polluted water in agriculture.Source: World Bank Photo library
Children
Adult
Figure 4.1Gender distribution of reported diseases related to water pollution and
sanitation in children and adults
Source: Doh-neC 2004a.
Children
Adult
0%50%100%
Alri andPneumonia
Bronchitus
Cardiovasculardisease
boysgirls
0%50%100%
boysgirls
0%50%100%
menwomen
total
Diarrhea
typhoid and parathyphoid
viral hepatitis
Schistosomiasis
Cholera
Filariasis
total
Diarrhea
Cholera
typhoid and parathyphoid
Schistosomiasis
viral hepatitis
Filariasis
24
Chapter 1. IntroductIon
PHiliPPinES EnvironmEnt monitor
Water PollutIon, SanItatIon and HealtH Environmental Risks
Box 2.5 What are the risks to your water supply?
Individual well systems. the depth and location of a well are risk factors for well-water systems. Shallow wellsdraw from groundwater nearest to the land surface, which is the most likely to be affected by contaminationsources. Deeper wells extract groundwater from areas that benefit from further filtration through soil and from sources less likely to be affected by surface activities.
Countermeasures. locate the well away from and on higher ground than sanitation facilities, sewers, fueltanks, livestock activities, and solid waste disposal sites; dig deep wells where possible; prevent channelingof surface water into well systems using a casing around the well borehole and a well cap; and regularly testthe water quality.
Piped water supply. risks to piped water systems relate to the adequacy of treatment and the integrity ofthe distribution system. typically water service providers treat the water using sediment removal anddisinfection and other treatment depending on the quality of the source water. in cases where the treatmentsystem is adequate, the risk is associated with a malfunctioning water system, especially in cases of floodingor power failure. low water pressure due to aging or unmaintained pipelines also provides an opportunity forsewage to flow into the water supply system or for backflow of contaminated water from users with directconnection to a contaminated pipe or vessel, such as illegal connections or industrial processes. Stores ofbacteria and other material in sediment deposits in low water pressure networks or biofilm formation on pipescan also be resuspended in cases of rapid changes in flow.
Countermeasures. operation, testing, and public information on treatment system performance; providingresidual chlorine to disinfect leakages and control biofilms; reducing the length of time in distribution systemsand pressure surges; providing devices (stop valves or air gaps) that prevent backflow into the water system; providing regular maintenance and rehabilitation of network leaks; and locating new network systems awayfrom septic tanks and sewers.
Water vendors. registered water refilling stations and bottled water are regularly monitored by the Departmentof Health. However, there is limited knowledge and transparency about the source, treatment, and water qualityfrom informal water vendors. the major risks depend on the source of water and share similar risks as pipedwater and wells. For example, shallow wells in urban areas would be considered high-risk sources, while illegal connections or reselling of utility water would share similar risks associated with piped water supply. Duringtransport, delivery, and storage, there are risks associated with the contamination of public faucets, tanks, orother vessels.
Countermeasures. Better knowledge of the source, treatment process, and quality; similar measures to ensure quality of source water as above; and disinfection and covering water transport and storage containers.
37environmentAl heAlth
SpeciAl focuS: environmentAl HeAltH, poverty, And vulnerAbility
While pollution affects all income groups, the
people most at risk are the poor, who lack basic
resources and often times, live and work in poor
quality environments. On average, provinces
with an income less than PHP 100,000 have
twice the incidence of diarrhea, a six times
higher incidence of typhoid fever, and a 50
percent higher incidence of pneumonia as
compared to those with average incomes of
over PHP200,000 (Table 4.3).
Malnutrition among the poor is linked to
diarrhea. The proportion of children suffering
from malnutrition is four times higher among
the lowest income households relative to
the highest income households (Figure 4.3).
Diarrhea contributes to malnutrition as it
reduces dietary intake, increases loss of
nutrients, and affects absorption of nutrients.
Additionally, studies in the Philippines and
worldwide have shown increased child
mortality from diarrhea and other infectious
diseases among those with malnutrition.42
Poverty
43 nSo 2002.
The poor are more exposed. Access to water
supply among the poorest 40 percent of the
population is only 70 percent compared to
87 percent of the households in the higher
income group. This divergence is even larger
with respect to access to sanitary toilets, where
only 73 percent of the poorest households
have a sanitary toilet, compared to 95 percent
of the richer households.43
Figure 4.3 Malnutrition in childrenby income level
Source: Fnri, 2003 as cited in Pedro et al.
Table 4.3 Incidence of disease (cases per 100,000) by average income
Disease
Average annual income
>200,000 100,000–200,000 <100,000
Diarrhea 493 773 898
typhoid and paratyphoid 4.1 12.0 27.2
Pneumonia 773 1,244.0 1,172.0
Source: Based on Doh-neC 2004a(provincial disease data), and nSCB, 2005 income data. represents the overall incidence for provinces in each income category that have reported disease cases.
42 rice et al. 2000; Yoon et al. 1997.
Poor sanitation in slum areas increases the risk of transmission of water-borne diseases.Source: llDA

35 environmentAl heAlth
SpeciAl focuS: environmentAl HeAltH, poverty, And vulnerAbility
Gender also affects vulnerability and
exposure to environmental hazards, but this
impact varies across age, geographic area,
and profession.
Women’s bodies are more susceptible to
cardiovascular disease. The overall incidence
of cardiovascular diseases including those
caused by air pollution, is higher in women,
Gender
41Doh-neC 2004a.
Table 4.2Major water and air pollution-related illnesses affecting the elderly (>50 yrs)
DiseaseProportion of
cases affecting elderly (%)
Proportion of deaths afflicting
elderly (%)
Schistosomiasis1865
Cholera739
Filariasis1857
Pneumonia975
Bronchitis1284
Source: Doh-neC 2004a (morbidity) and nSo 2002 (mortality). morbidity data is for children under 14; mortality data is for children under 10. Bronchitis morbidity includes acute and chronic forms. themortaility data covers CoPD only.
accounting for 58 percent of the total.41 In
addition to potential differences in exposure
among men and females, one of the main
reasons for this is that women’s coronary
arteries are smaller and their microvessels
more frequently dysfunctional than men’s.
Women with coronary disease also have a
higher risk of dying from the disease than men.
The health consequences for the elderly
are higher. The elderly are, in general, less
exposed to environmental hazards, and hence,
are less likely to be afflicted with environment-
related diseases. Once they do get sick, however,
they are much more likely to die than either
children or adults. For many diseases such
as pneumonia and schistosomiasis, the elderly
account for less than 20 percent of the cases
but over 65 percent of the deaths (Table 4.2).
Women can have increased exposure to
environmental pollution at home. The
disproportionate time that women spend
inside the house, especially in households
where cooking and heating are carried out
using biomass fuels, increases their exposure
to indoor air pollution. Women generally
spend more time with their children than
men do. Contact with children and the
associated hygienic risks also increase their
risks for contracting diarrhea symptoms,
which contributes to the larger incidence
of this disease found in adult women
(Figure 4.1).
Women are more susceptible to diarrhea because of their close contact with children. Source: World Bank Photo library
26
Chapter 1.IntroductIon
PHiliPPinES EnvironmEnt monitor
aIr PollutIon and HealtHDisease Burden
Indoor air pollution may also be an important
contributor to disease.� While comprehensive
data on indoor air quality is not available,
estimates using global relationships between
disease and use of solid cooking fuel indicate
that it may be an important contributor to
disease in the Philippines, especially in
households with poor ventilation. Under
conditions where kitchens using solid fuel
have good ventilation, it is estimated that
indoor air pollution would account for just
under 5,000 deaths from respiratory and
cardiovascular disease nationally, which is
one-third of the total estimated deaths due
to air pollution (Table 3.2). The high
dependence on solid fuel for cooking in
rural areas is estimated to contribute over 70
percent of these deaths.
Table 3.4Additional deaths due to outdoorair pollution in cities
CityPrematureDeaths
% of all reported diseases
metro manila4,96812
Cabanatuan13411
metro Cebu60810
Zamboanga City2408
Butuan1048
Davao City4147
Gen. Santos1177
Baguio1027
tacloban887
iloilo City2045
Source: Based on DEnr air quality data and dose-response functions. See methodology section for details. Cities included are those with a population over 200,000 monitored by DEnr for air quality.
many rural household use solid fuels for indoor cooking.Source:r.E.A.P – Canada.
38
chapter 1. introduction
PhiliPPineS environment monitor
SpeciAl focuS: environmentAl HeAltH, poverty, And vulnerAbility
45 Subida and torres, 1991.46 Subida and torres, 1994.
Lower income groups are also nearly four
times more likely to use fuelwood for cooking
and heating and have a higher smoking
prevalence.44 This puts them at higher risk of
exposure to indoor air pollution.
An increased susceptibility to outdoor air
pollution has also been observed in commuters
and drivers, who use forms of transport that
are cheaper and more exposed to outdoor
air pollution. Jeepney drivers were found to
have a 50 percent higher risk of abnormal
pulmonary function and a 100 percent
higher risk of COPD. Additionally, respiratory
symptoms were twice as prevalent in jeepney
drivers relative to air-conditioned bus drivers
and commuters.45 Child street vendors have
also been shown to have a higher health risk
than other children due to their exposure to
air pollution and lack of access to health care.46
44 Smoking data from nSo 2003a and nSo 2006.
Studies have shown that jeepney drivers and street vendors are susceptible to the health effects of air pollution.Source: Authors.
23EnvironmEntal HEaltH
Water PollutIon, SanItatIon and HealtH
the quality of water supply depends on the distribution system.Source: authors.
Box 2.4 Cholera outbreak inCaloocan City Jail
During august and September 2001, 15 percentof the 1,245 inmates in the Caloocan Jail had diarrhea, resulting in one death. Tests confirmed cholera to be the cause. after investigation by the DoH, it was determined that it was due to a contaminated water supply. Water supply pipes tied together using rubber bands were submerged in stagnant water where human feces were found tobe coming from the septic tank pipes, which were damaged and leaking. a shallow well being used by some of the inmates for washing kitchen utensils and bathing was also found to have a pipe fromthe septic tank lying in it. the Caloocan lGU, Bureau of Jail management, maynilad Water and DoHresponded to the findings by treating the inmates, repairing the distribution pipes, improving hygiene, and improving the septic tank system.
Source: DoH-nEC 2001.
Box 2.3 DENR’s Tapwatch Program
in 2005, DEnr monitored 88 shallow wells usedfor water supply in targeted areas. overall, 21 sites were found to be potable, 27 failed to meetdrinking water standards for fecal coliform, and the remainder needed further testing to determine potability. the suspected sources of contamination were defective septic tanks, untreated wastewater, and animal wastes.
Proportion ofLocation Wells Below StandardCagayan, nueva vizcaya 6 out of 10Pampanga 3 out of 3oriental mindoro 3 out of 8iloilo City 6 out of 8Cebu City 2 out of 6leyte 1 out of 6Zamboanga City 3 out of 8Davao City 1 out of 4
Source: DEnr-EmB 2005b.
Wells such as these can be contaminated if located close to an unprotected sanitation facility. Source: World Bank Photo library
Environmental Risks