Embed Size (px)
Citation preview

CHAPTER 4:CHAPTER 4:Visible Light and Other Electromagnetic Radiation
BLACKBODY RADIATIONBLACKBODY RADIATION
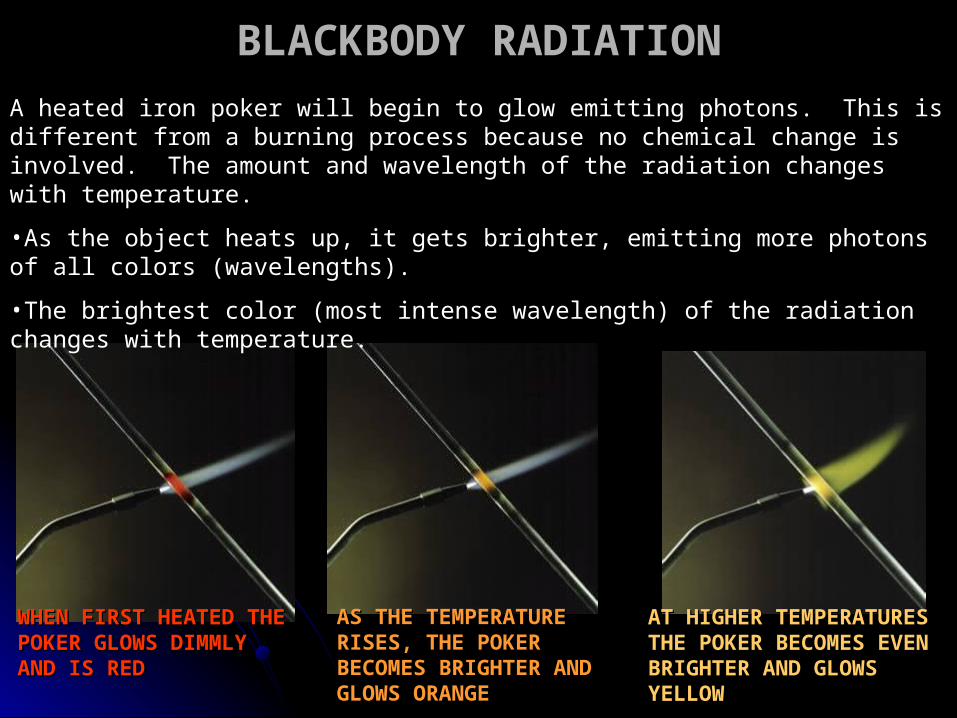
A heated iron poker will begin to glow emitting photons. This is different from a burning process because no chemical change is involved. The amount and wavelength of the radiation changes with temperature.
•As the object heats up, it gets brighter, emitting more photons of all colors (wavelengths).
•The brightest color (most intense wavelength) of the radiation changes with temperature.
WHEN FIRST HEATED THE WHEN FIRST HEATED THE POKER GLOWS DIMMLY POKER GLOWS DIMMLY AND IS REDAND IS RED
AS THE TEMPERATURE AS THE TEMPERATURE RISES, THE POKER RISES, THE POKER BECOMES BRIGHTER BECOMES BRIGHTER AND GLOWS ORANGEAND GLOWS ORANGE
AT HIGHER TEMPERATURES AT HIGHER TEMPERATURES THE POKER BECOMES EVEN THE POKER BECOMES EVEN BRIGHTER AND GLOWS BRIGHTER AND GLOWS YELLOWYELLOW
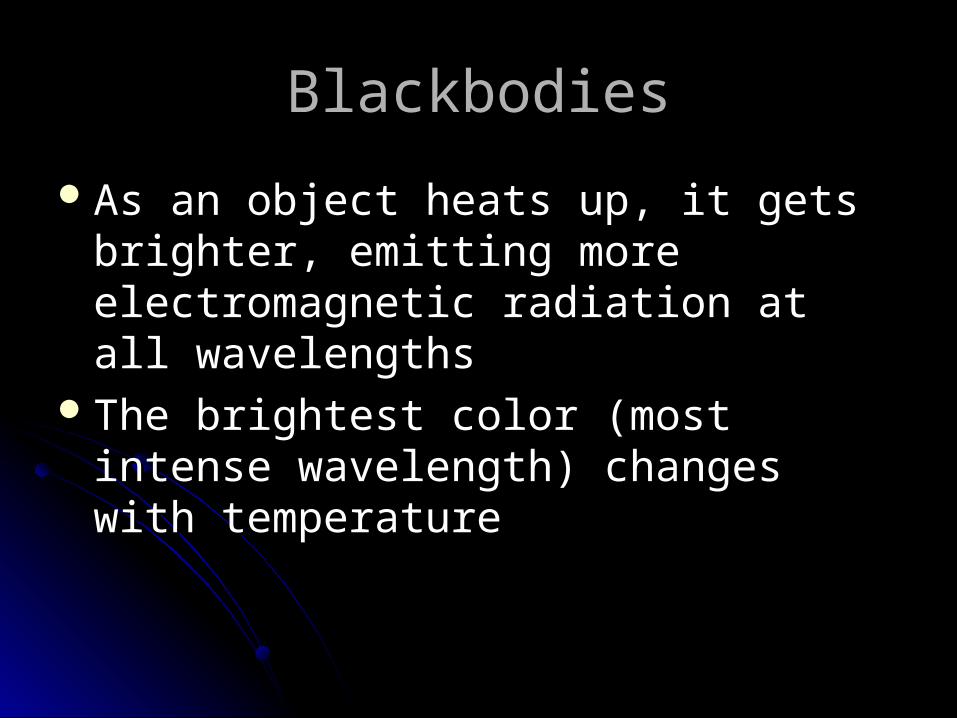
BlackbodiesBlackbodies
As an object heats up, it gets brighter, As an object heats up, it gets brighter, emitting more electromagnetic radiation at emitting more electromagnetic radiation at all wavelengthsall wavelengths
The brightest color (most intense The brightest color (most intense wavelength) changes with temperaturewavelength) changes with temperature
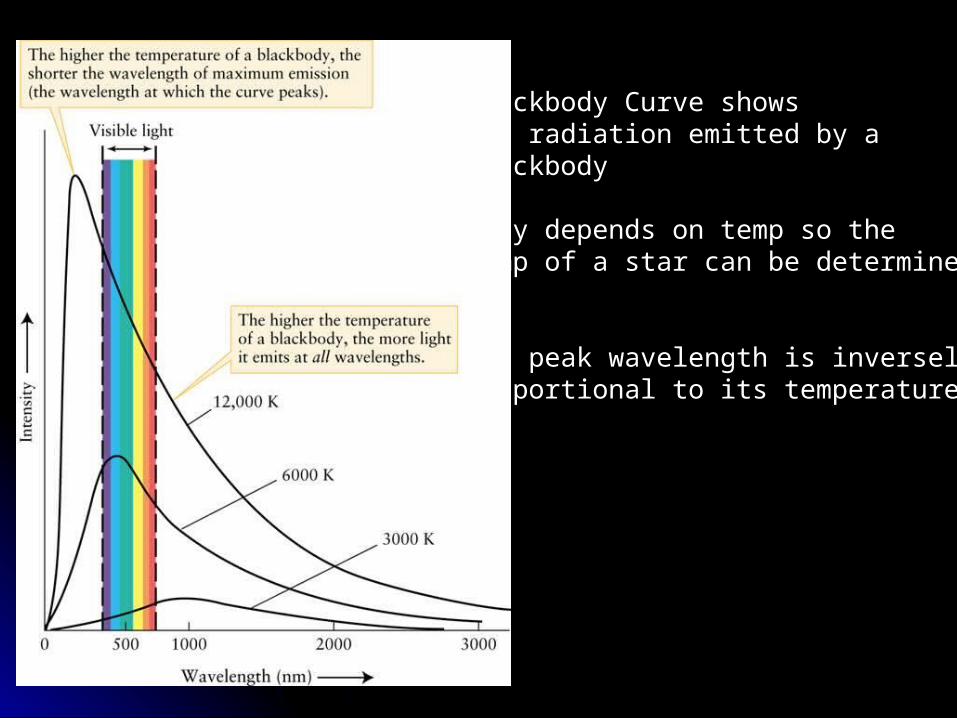
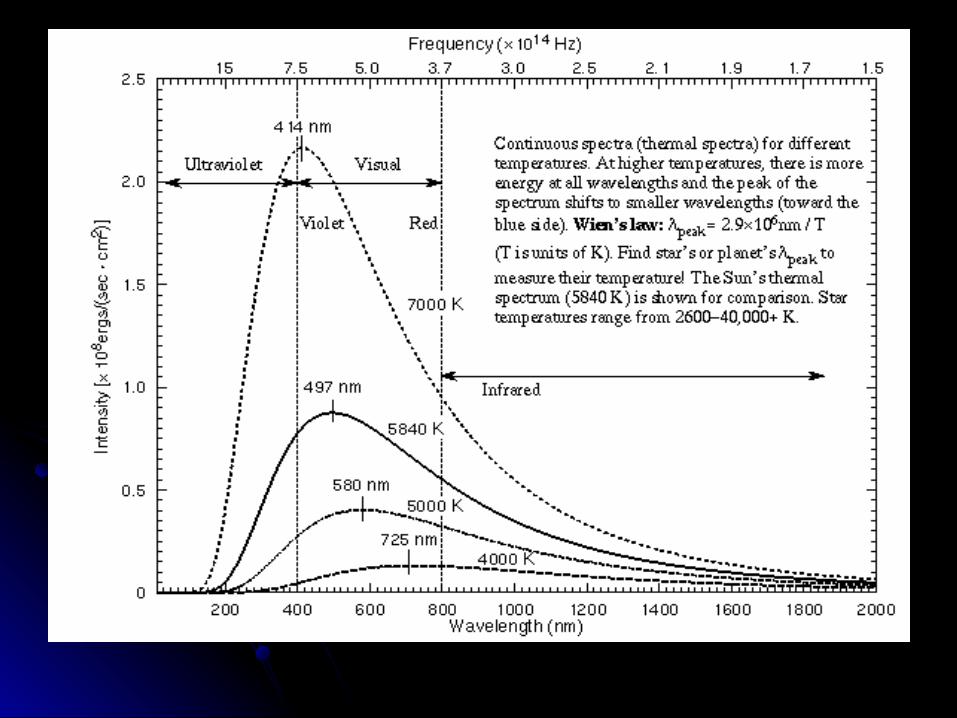
Blackbody Curve showsthe radiation emitted by a blackbody
Only depends on temp so the temp of a star can be determined
The peak wavelength is inversely proportional to its temperature
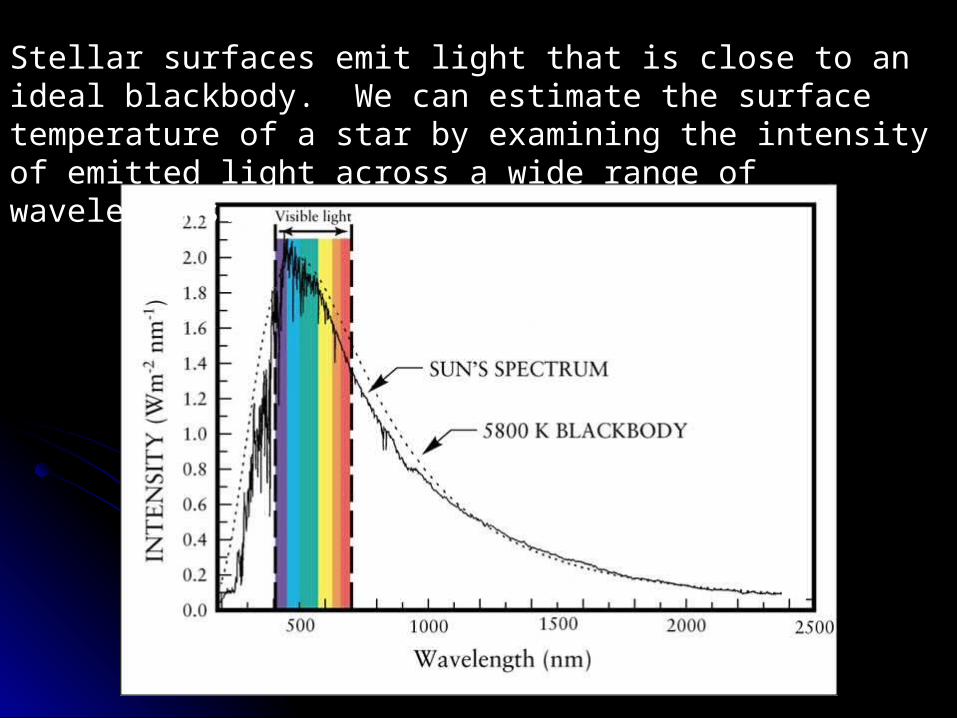
Stellar surfaces emit light that is close to an ideal blackbody. We can estimate the surface temperature of a star by examining the intensity of emitted light across a wide range of wavelengths.
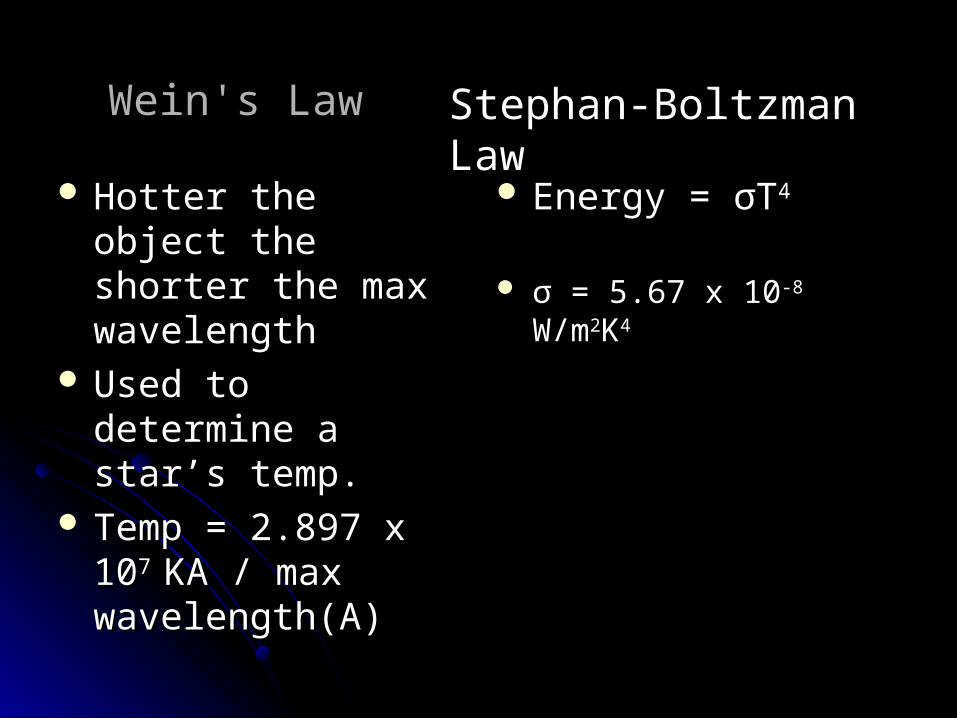
Wein's LawWein's Law
Hotter the object the Hotter the object the shorter the max shorter the max wavelengthwavelength
Used to determine a Used to determine a star’s temp. star’s temp.
Temp = 2.897 x 10Temp = 2.897 x 10⁷ 7
KA / max KA / max wavelength(A)wavelength(A)
Energy = Energy = σσTT44
σσ = 5.67 x 10 = 5.67 x 10⁻⁸ -8 W/mW/m22KK44
Stephan-Boltzman Law
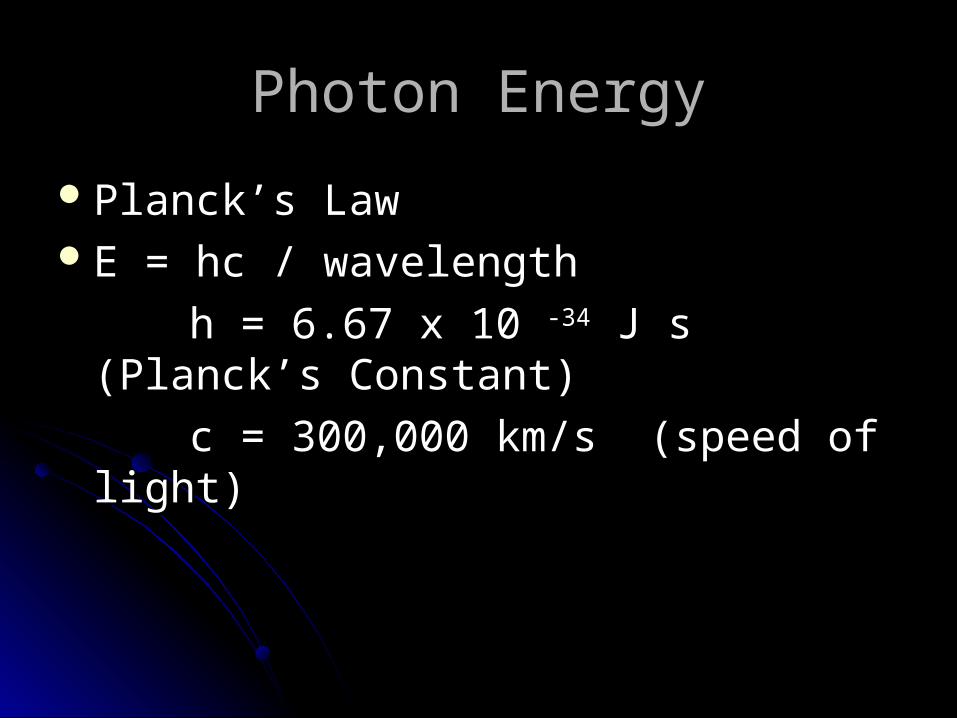
Photon EnergyPhoton Energy
Planck’s LawPlanck’s LawE = hc / wavelengthE = hc / wavelength
h = 6.67 x 10 h = 6.67 x 10 -34-34 J s (Planck’s J s (Planck’s Constant)Constant)
c = 300,000 km/s (speed of light)c = 300,000 km/s (speed of light)
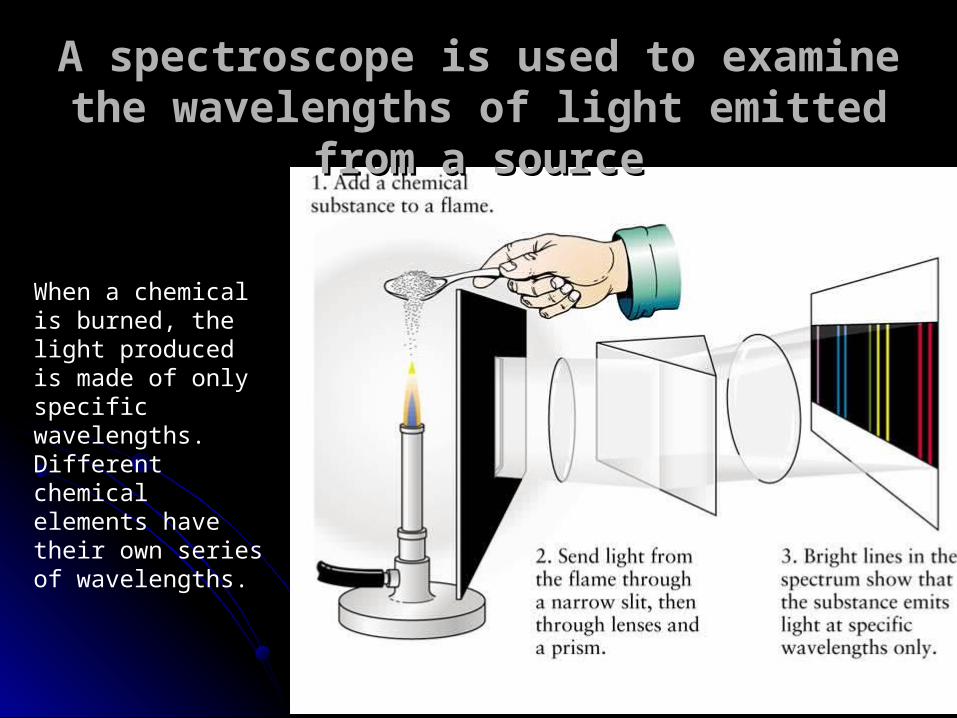
When a chemical is burned, the light produced is made of only specific wavelengths. Different chemical elements have their own series of wavelengths.
A spectroscope is used to examine the A spectroscope is used to examine the wavelengths of light emitted from a sourcewavelengths of light emitted from a source
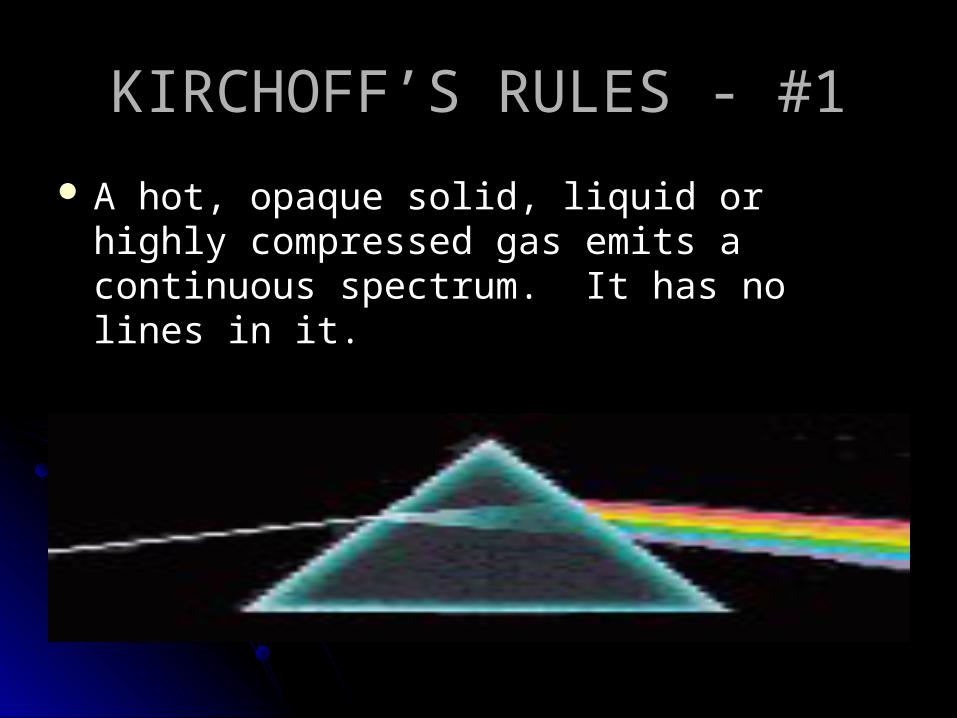
KIRCHOFF’S RULES - #1KIRCHOFF’S RULES - #1
A hot, opaque solid, liquid or highly compressed A hot, opaque solid, liquid or highly compressed gas emits a continuous spectrum. It has no lines gas emits a continuous spectrum. It has no lines in it.in it.
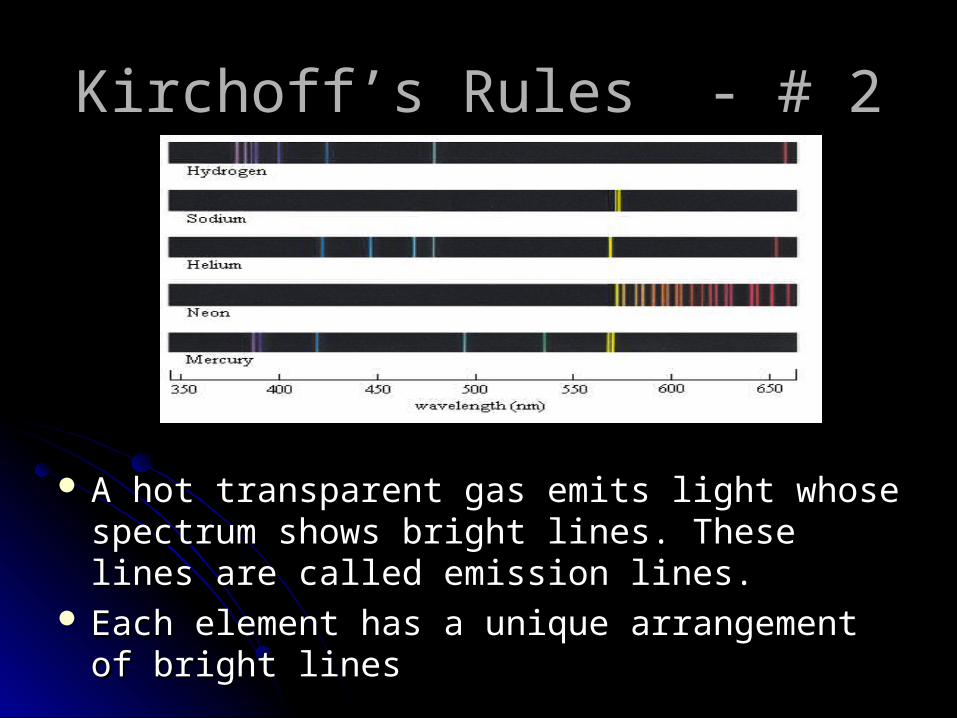
Kirchoff’s Rules - # 2Kirchoff’s Rules - # 2
A hot transparent gas emits light whose spectrum A hot transparent gas emits light whose spectrum shows bright lines. These lines are called shows bright lines. These lines are called emission lines.emission lines.
Each element has a unique arrangement of bright Each element has a unique arrangement of bright lineslines
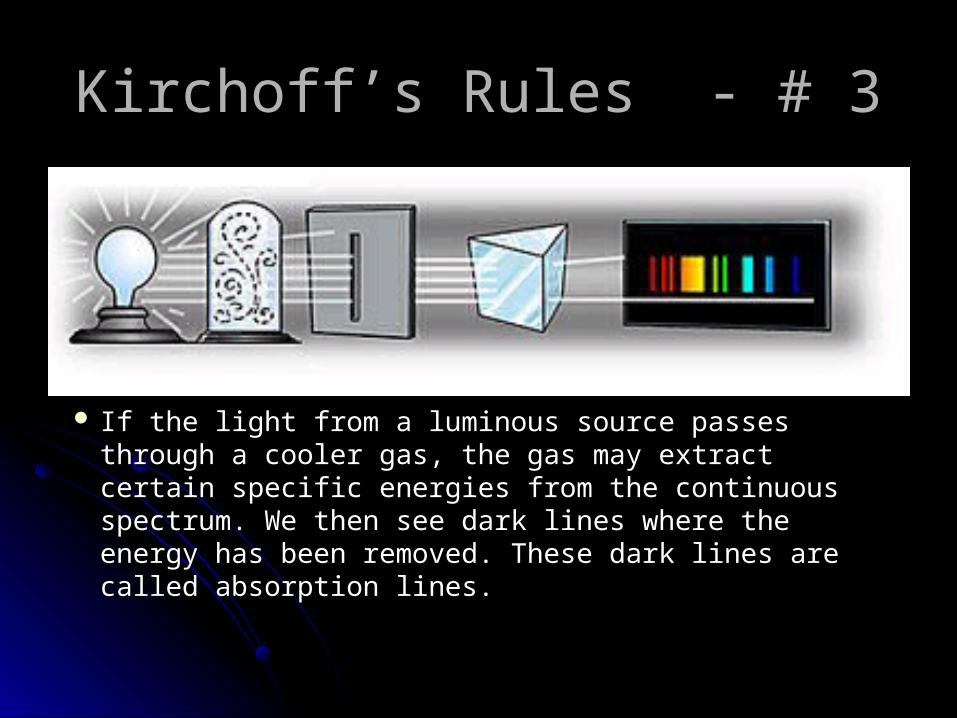
Kirchoff’s Rules - # 3Kirchoff’s Rules - # 3
If the light from a luminous source passes through a If the light from a luminous source passes through a cooler gas, the gas may extract certain specific cooler gas, the gas may extract certain specific energies from the continuous spectrum. We then energies from the continuous spectrum. We then see dark lines where the energy has been removed. see dark lines where the energy has been removed. These dark lines are called absorption lines.These dark lines are called absorption lines.

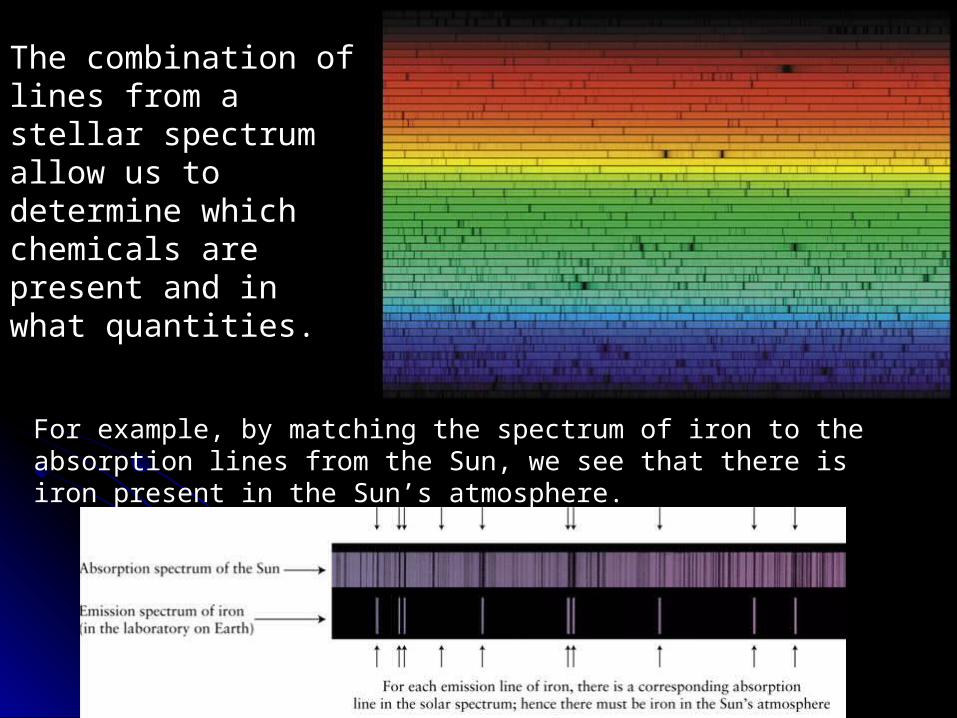
The combination of lines from a stellar spectrum allow us to determine which chemicals are present and in what quantities.
For example, by matching the spectrum of iron to the absorption lines from the Sun, we see that there is iron present in the Sun’s atmosphere.
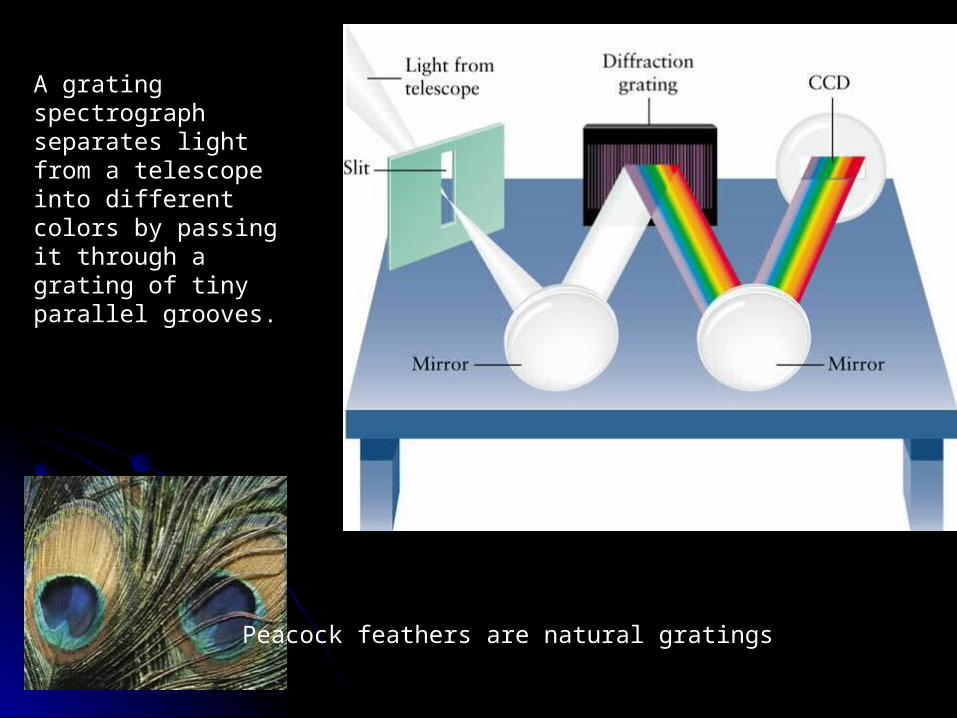
Peacock feathers are natural gratings.
A grating spectrograph separates light from a telescope into different colors by passing it through a grating of tiny parallel grooves.
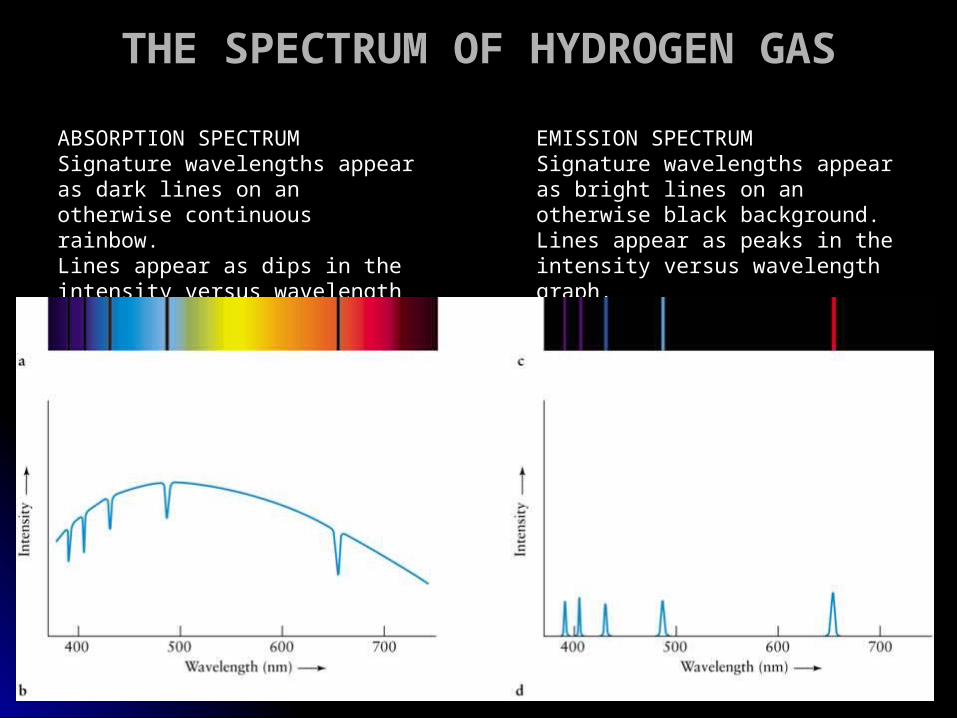
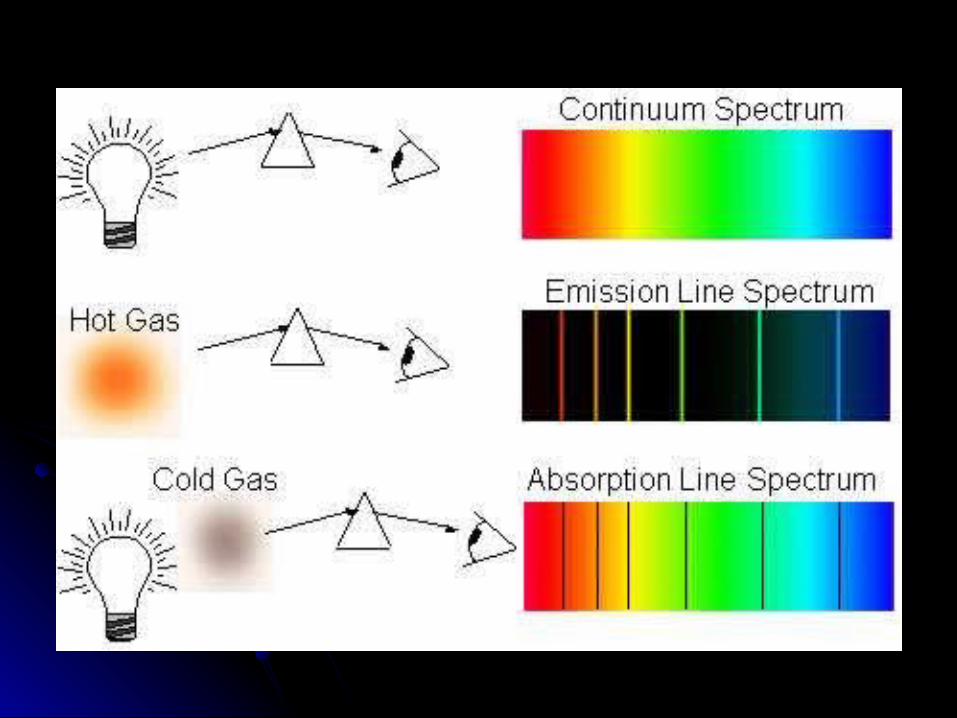
ABSORPTION SPECTRUMSignature wavelengths appear as dark lines on an otherwise continuous rainbow.Lines appear as dips in the intensity versus wavelength graph.
EMISSION SPECTRUMSignature wavelengths appear as bright lines on an otherwise black background.Lines appear as peaks in the intensity versus wavelength graph.
THE SPECTRUM OF HYDROGEN GASTHE SPECTRUM OF HYDROGEN GAS
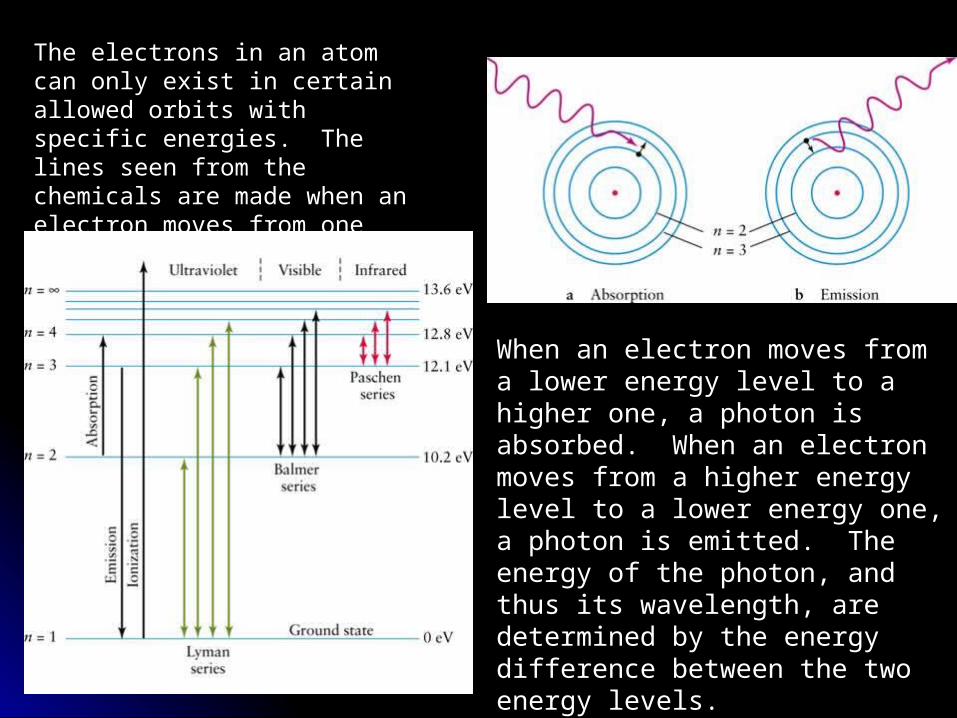
The electrons in an atom can only exist in certain allowed orbits with specific energies. The lines seen from the chemicals are made when an electron moves from one energy level to another.
When an electron moves from a lower energy level to a higher one, a photon is absorbed. When an electron moves from a higher energy level to a lower energy one, a photon is emitted. The energy of the photon, and thus its wavelength, are determined by the energy difference between the two energy levels.
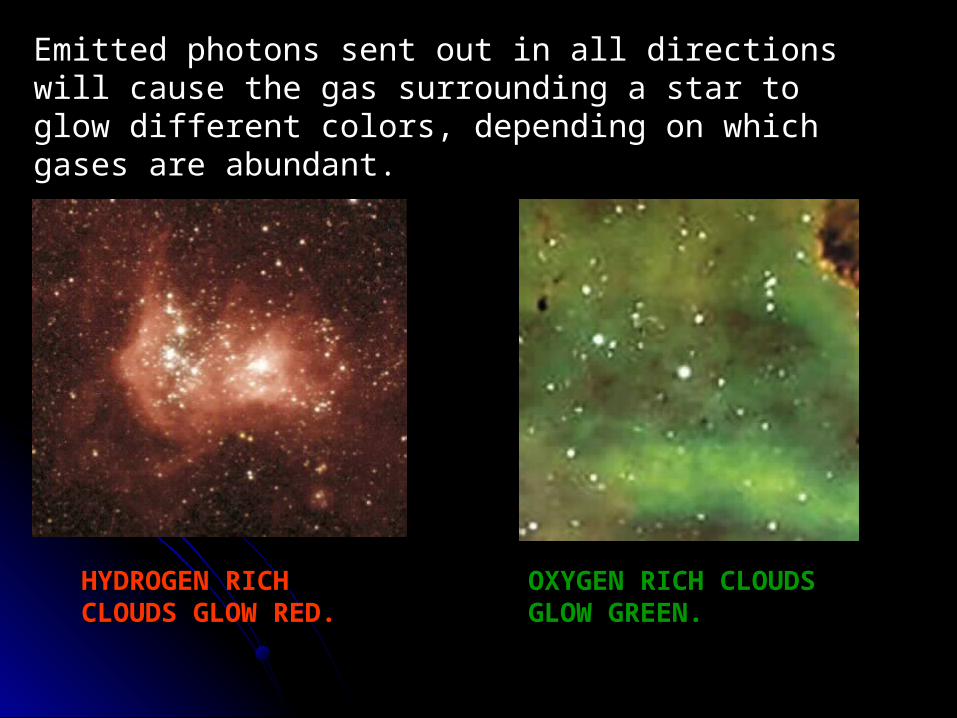
Emitted photons sent out in all directions will cause the gas surrounding a star to glow different colors, depending on which gases are abundant.
HYDROGEN RICH HYDROGEN RICH CLOUDS GLOW RED.CLOUDS GLOW RED.
OXYGEN RICH CLOUDS OXYGEN RICH CLOUDS GLOW GREEN.GLOW GREEN.
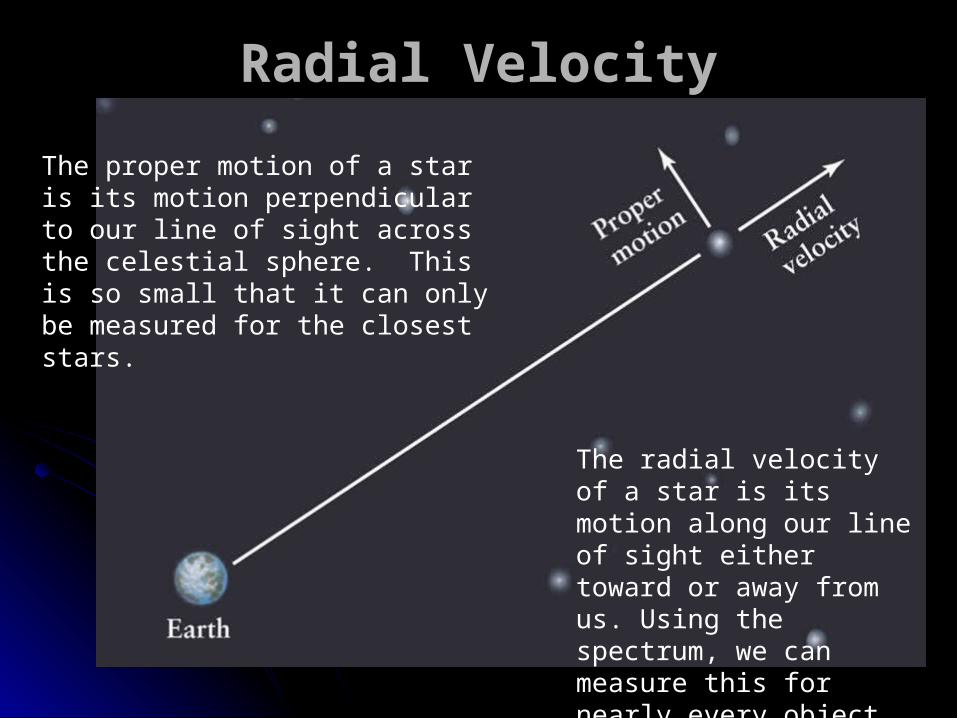
Radial VelocityRadial Velocity
The proper motion of a star is its motion perpendicular to our line of sight across the celestial sphere. This is so small that it can only be measured for the closest stars.
The radial velocity of a star is its motion along our line of sight either toward or away from us. Using the spectrum, we can measure this for nearly every object in space.
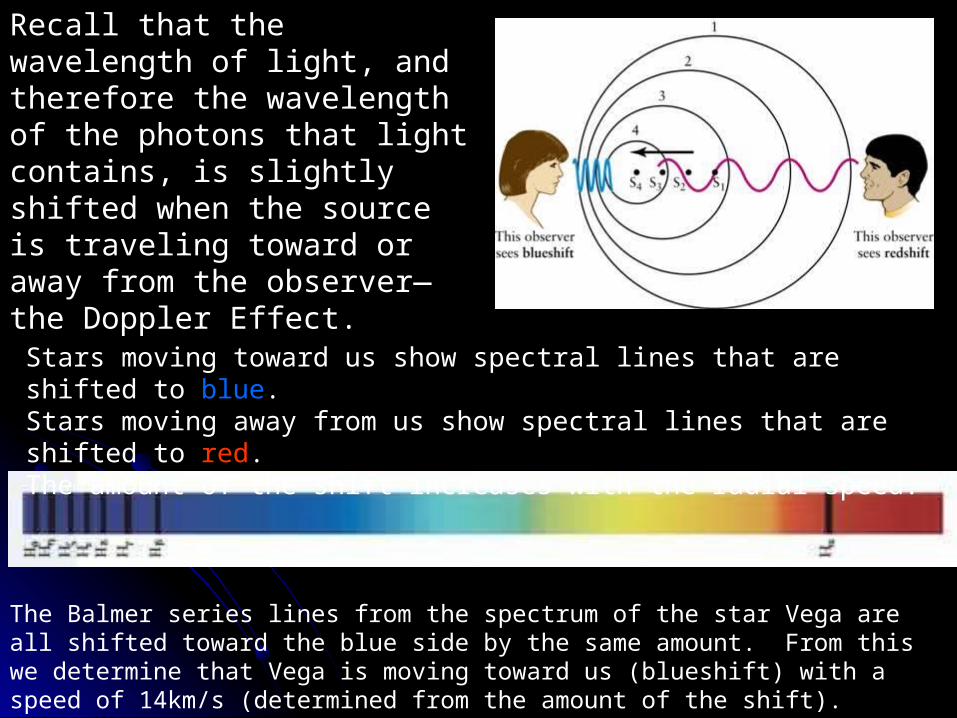
Recall that the wavelength of light, and therefore the wavelength of the photons that light contains, is slightly shifted when the source is traveling toward or away from the observer—the Doppler Effect.
Stars moving toward us show spectral lines that are shifted to blue.Stars moving away from us show spectral lines that are shifted to red.The amount of the shift increases with the radial speed.
The Balmer series lines from the spectrum of the star Vega are all shifted toward the blue side by the same amount. From this we determine that Vega is moving toward us (blueshift) with a speed of 14km/s (determined from the amount of the shift).
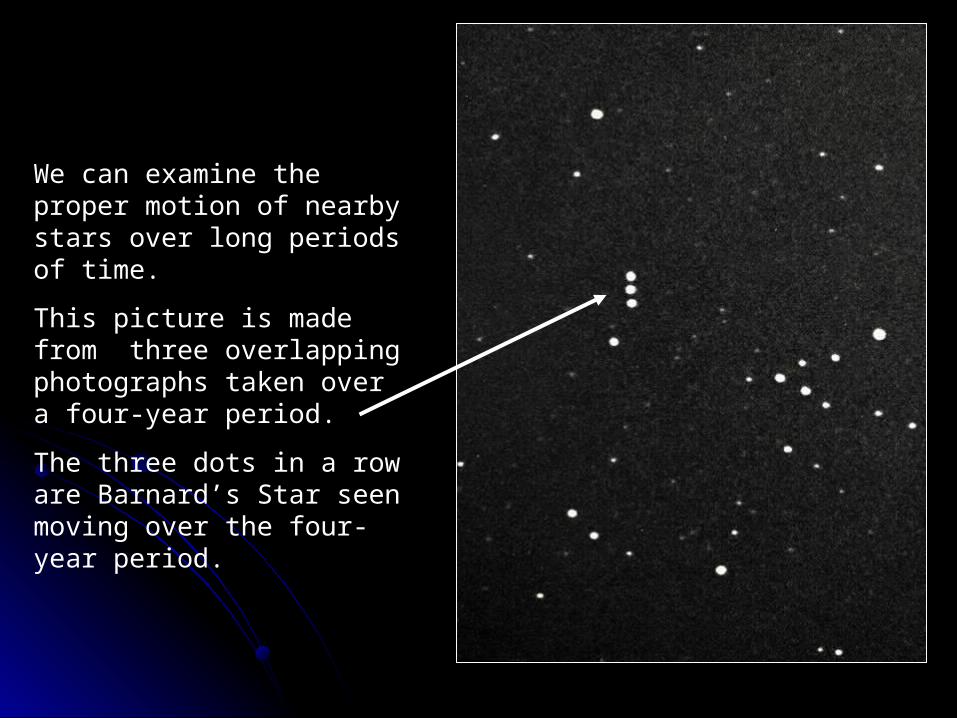
We can examine the proper motion of nearby stars over long periods of time.
This picture is made from three overlapping photographs taken over a four-year period.
The three dots in a row are Barnard’s Star seen moving over the four-year period.