Embed Size (px)
DESCRIPTION
Chapter 5. Macro Measurements Expenditure/Income Approach GDP. Now we study the branch of macroeconomics that examines aggregate performance of all markets in the market system. To measure the performance of the macro economy, economists rely on statistical measurements in three areas: - PowerPoint PPT Presentation
Citation preview

Chapter 5Macro MeasurementsExpenditure/Income ApproachGDP

Now we study the branch of macroeconomics that examines aggregate performance of all markets in the market system.
To measure the performance of the macro economy, economists rely on statistical measurements in three areas:
Gross Domestic Product (GDP) Rate of Inflation (discussed later) Unemployment (discussed later)

macroeconomicsThe study of the nation’s economy as a whole; focuses on the issues of inflation, unemployment, and economic growth.
THE “FLIP” SIDES OF MACROECONOMICACTIVITY: PRODUCTION AND INCOME
The Circular Flow of Production and Income
FIGURE 5.1The Circular Flow of Production and Income
The circular flow shows how the production of goods and services generates income for households and how households purchase goods and services produced by firms.

Gross Domestic Product (GDP)
Gross domestic product (GDP) is the total dollar value of final output produced within a nation’s borders in a given time period.
Gross Domestic Product (GDP)
Each good and service produced and brought to market has a price.
That price serves as a measure of value for calculating total output.

The Measurement of Output

Highlights Most comprehensive measure of output is
GDP GDP = value added at each state of
production – Total value of g & s produced in a given year domestically
Nominal and Real GDP are calculated Nominal= current prices Real = GDP expressed in terms of constant
prices (sans inflation) People basically care about buying power.

GDP Per CapitaTotal GDP divided by Total Population
This is the way to compare international output among different countries/economies.
Divide the pie- how many pieces for each?In 2001 America’s total GDP of $10 trillion was shared by 280
million citizens. Average per capita GDP was around $36,000.
2004 it was $37,600 – population 2004 was 292 million+2005 = $41,8002008 = $46,0002009 = $45,7872010 = $47,1992012 = $51,749

1998 TO 2011 Per Capita U.S.

Richest and Poorest countries 2010

So… What does per capita really tell us?It is a statistical comparison that indicates how well
off people are in a country.Real per capital increases when REAL GDP rises
faster than populationIt can indicate the differences in the ways people live.
How many TVs they have. How many cell phones, Internet connections, cars, refrigerators, paved roads, schools, etc.
All it does is state that if per capita is higher, the average amount of goods/person is higher than the base comparison.

Highlights ContinuedEach year capital is worn out – called depreciation..By subtracting depreciation from GDP we derive net domesticproduct (NDP)Difference between NDP and GDP is equal to the difference between gross investment expenditures and net investment— Expenditure Approach to GDP Measurement
Income Approach to GDP Measurement
Consumption
+
Investment
+
Government
+
Net Exports
Total value of output
Wages and salaries +
Corporate profits +
Proprietors’ income +
Farm Income +
Rents +
Interest +
Sales taxes +
Depreciation =
Total value of income
Value of total expenditure must equal value of total income
OUTPUT = INCOME All the spending that establishes the value of
output also determines the value of incomes. Generally speaking, the market value of
incomes must equal the market value of output.
Every dollar spent on output becomes a dollar of income for someone.

Computing GDP
The value of GDP can be computed by adding up expenditures of market participants:(add up the market value of all domestic expenditures made on final goods and services in a single year.)
GDP = C + I + G + (X – IM)Where:
C = Consumption expenditure X = exports I = investment expenditure IM = importsG = government expenditure
Total Expenditure on final G & S is broken down in four categories:
Consumption expenditures- Comprises the largest share (2/3’s) of
total expenditure. Includes nondurable goods (food,clothing)
and durable goods (appliances, autos) Includes consumption service expenditures
such as barbers, doctors, lawyers, mechanics.

Expenditures ContinuedInvestment ExpendituresIncludes expenditures on fixed investment goods
and inventory investment.Fixed investments goods are those that are useful
over a long period of time- includes purchases of new equipment, factories, other nonresidential housing as well as new residential housing. Also includes cost of replacing existing investment goods that have become worn out or obsolete.
The market value of all investment goods that must be replaced in a single year is referred to as depreciation for that year.

Investment Continued
Inventory Goods are final goods waiting to be sold that firms have on hand at the end of the year.
The year-to-year change in the market value of firms’ inventory goods is considered an investment expenditure because these inventory goods will eventually yield a flow of consumption or production services.
Total Expenditures ContinuedGovernment Expenditures
Includes hiring of civil servants and military personnel, construction of roads and public buildings.Supplies for the war, contracts for many products/services… Boeing…etc.
Social Security, welfare, and other transfer payments are not included.(because government expenditures on transfer payments do not involve the purchase of any new goods or services and are therefore excluded from the calculation.

Total Expenditures Continued
Net ExportsExports are g & s produced domestically but sold to
foreigners.Imports are g & s produced by foreigners, but sold
domestically.Expenditures on exports are added to total
expenditures while expenditures on imports are subtracted.
X-M = value of net exports to nation’s total expenditures.

What’s Not Included in GDP
Certain non-market goods and services such as chores performed at home by family members.

Underground activities, both legal and illegal
What’s Not Included in GDP

What’s Not Included in GDP
Sales of used goods
Financial transactions such as trading of stocks and bonds
What’s Not Included in GDP Government transfer
payments such as social security
Leisure time
Measures of Income
GDP accounts have two sides. One side focuses on expenditure – the
demand side. The other side focuses on income – the
supply side.
Income Approach
Income Approach: Add up all the income earned by households and
firms in a single year. By adding together rent, wages, profit, interest
income, one should obtain the same value of GDP as is obtained using the expenditure approach…BUT…
2 types of expenditures that are included in expenditure, but do not provide households or firms any income (depreciation expenditures and indirect business taxes)
Income Approach ContinuedDepreciation expenditures (replacing existing,
but worn out investment goods, do increase the incomes of those providing the replacement goods, but they also decrease the profit incomes of those purchasing the replacement goods.) Result= aggregate income remains unchanged.
Indirect business taxes consist of sales taxes and other excise taxes that firms collect but not regarded as part of firms’ incomes. (Hence, included in expenditures approach but not income)

Measures of Income
The total value of market incomes must equal the total value of final output, or GDP.

There are two methods of calculating GDP:
Expenditure Approach Resource Cost-Income Approach
Personal Consumption Expenditures
+ Gross Private Domestic Investment
+Government Consumption and Gross Investment
+Net exports of goods and Services
Aggregate Income:
Compensation of employees (Wages and salaries)
Income of self-employed Proprietors
Rents Profits Interest
+
Non-Income Cost Items:
=
GDP
Indirect business taxes Depreciation
Net Income of Foreigners
+ =
GDP
Two Ways of Measuring GDP
It can be calculated either by summing the expenditures on the “final user” goods and services purchased by consumers, investors, governments, and foreigners (net exports), or,
by summing the income payments and direct cost items that accompany the production of goods and services.

Output = IncomeVALUE OF INCOMEVALUE OF OUTPUT
Net exports
Consumer spending
Investment spending
Wages
Profits
Interest
Rent
Government spending
Sales taxes Depreciation
Factor market
Product market

Measuring GDP
GDP is the scoreboard for economic performance GDP is the most widely used measure of economic performance. GDP is measured quarterly. GDP = total value of goods and services produced in the United
States in a given year. Many transactions have to be excluded from GDP
Counts only the g & s purchased by their final users Counts only the g & s produced during the specified period Excludes all financial transactions and income transfers.(because financial transactions do not count for current production- examples
purchase and sale of stocks, bonds, securities= merely transfer of ownership)
Transfer payments are unproductive money into economy (both from GDP standpoint and growth standpoint.

When Goods are measured as output- units of each good are weighted according to their PURCHASE PRICEexample: new car adds more than NIKE shorts
The total spending on ALL g & s produced during the year is then summed (in dollar terms) to obtain the annual GDP
GDP differs from GNP
GDP – g & s produced within the borders of the US whether produced by foreigners or Americans
GNP – measures the output of all Americans, whether the g & s are produced here or abroad.
(The Nissan produced in Tennessee is included in U.S. GDP)

Income Flow Chart
Gross Domestic product (GDP)
less depreciationNet domestic product (NDP)
less direct business taxesNational income (NI)
less corporate taxesless retained earningsless Social Security
taxesPlus net interestPlus transfer payments
Personal Incomeless personal taxes
Disposable Income
Searching for total income earned by factors of production.The figure below = how much income flows into hands of
Consumers.
Net Domestic Product NDP measures the total value of new goods
available in the economy in a given year after worn-out capital goods have been replaced.
Net domestic product (NDP) = GDP – Capital consumption allowance*
*The estimated amount of capital goods used up in production through natural wear, obsolescence, and accidental destruction.

Income Approach ContinuedPersonal Income – total income received by all person in thenation before personal taxes are paid.
To get from NI to PI- must subtract that portion of NI that does not go to households(*social security contributions, undistributed corporate profits*Corporate income taxes) * goes to government
Disposable Income- Subtract personal income taxes
Amount left over is what we can spend or save.

If GDP grows too rapidly, it may cause increased inflation.
If GDP grows too slowly, or declines, there will be an increase in the number of people unemployed.
***What determines the level of GDP?
Ans…(level of spending) ***What determines the level of spending?
Ans…. (add up the level of C + I + G + (X-M)

Business Cycle Recurrent swings (up and down) in Real GDP.

Equilibrium GDP
The level of GDP will depend on the total spending for consumption, investment, and government
Anytime there is a change in the LEVEL
of spending the GDP will begin to move toward the new level of spending.
When GDP is exactly equal to the level of total spending, the economy is in equilibrium.
Achieving equilibrium is not necessarily the goal. The goal is to have growth towards full employment without excessive inflation
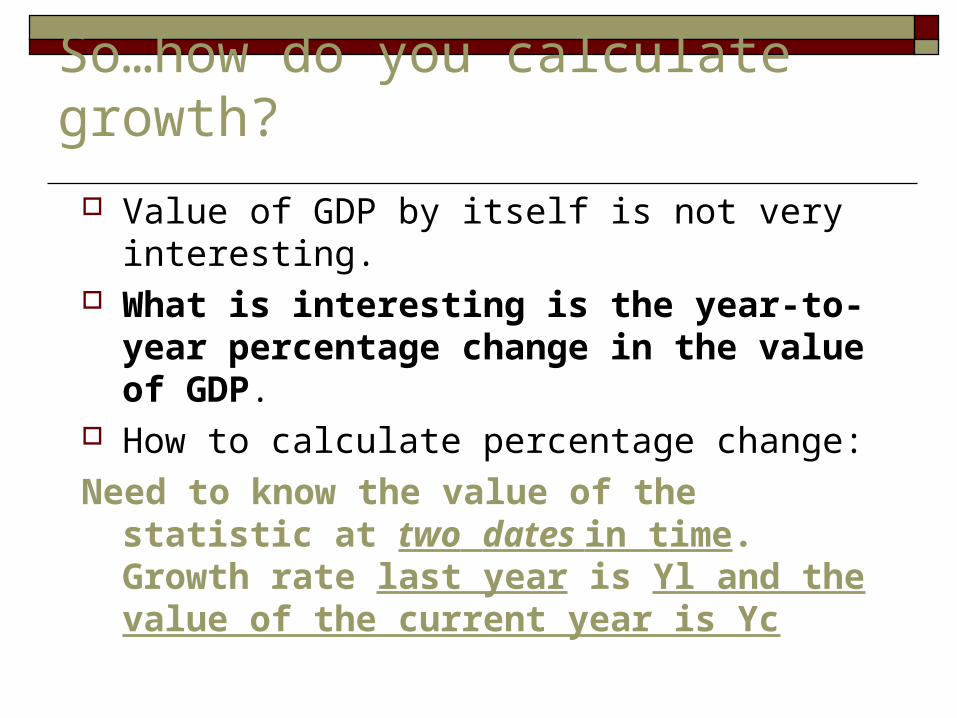
So…how do you calculate growth?
Value of GDP by itself is not very interesting.
What is interesting is the year-to-year percentage change in the value of GDP.
How to calculate percentage change:
Need to know the value of the statistic at two dates in time. Growth rate last year is Yl and the value of the current year is Yc
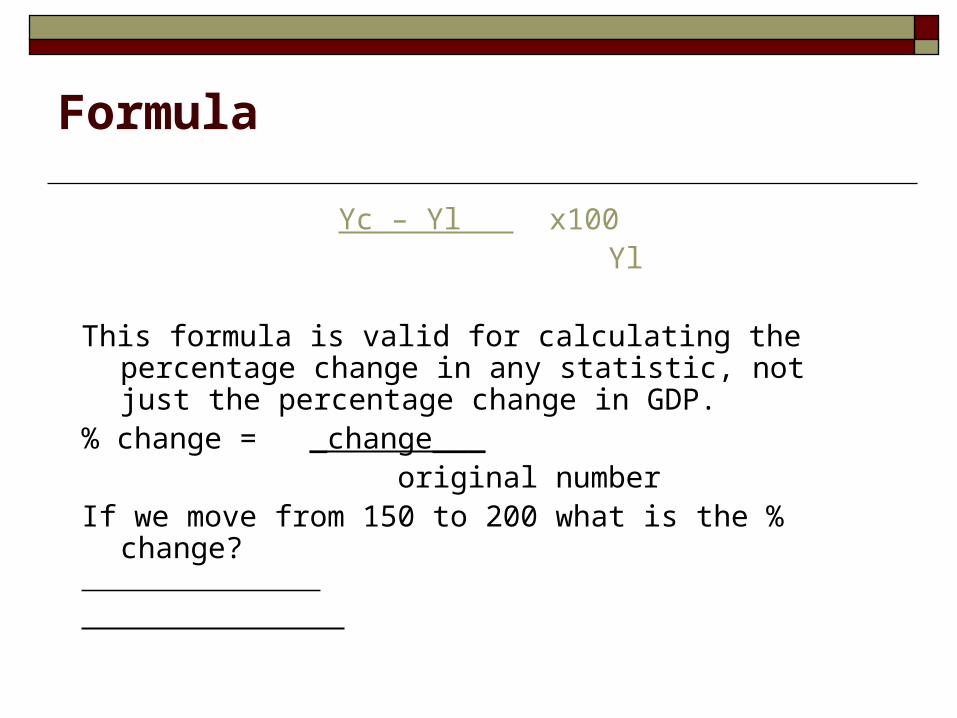
Formula
Yc – Yl x100 Yl
This formula is valid for calculating the percentage change in any statistic, not just the percentage change in GDP.
% change = _change___ original numberIf we move from 150 to 200 what is the % change?

Answer
33 l/3 %
150 – 200 = 50
50 = 5 = 1
150 15 3

Calculate this:::::::In 1999 – Real GDP was 9,299
In 2000 – Real GDP was 9,767What was the % growth from 1999 to 2000
5%
9,767-9,299 = 468468/9,299 = 5

Distinguishing Between Nominal and Real Values Nominal Values
Measurements in terms of the actual market prices at which goods are sold; expressed in current dollars, also called money values
Real Values Measurements after adjustments have been made
for changes in the average of prices between years; expressed in constant dollars

*Price index: measured by the GDP deflator
1718.0132.34
= 1298.1
Real GDP = x 100
Nominal GDP
Price index*
Example: Correcting GDP for Price Index Changes Correcting GDP for price index changes
Nominal (current) dollars GDP
Real (constant) dollars GDP
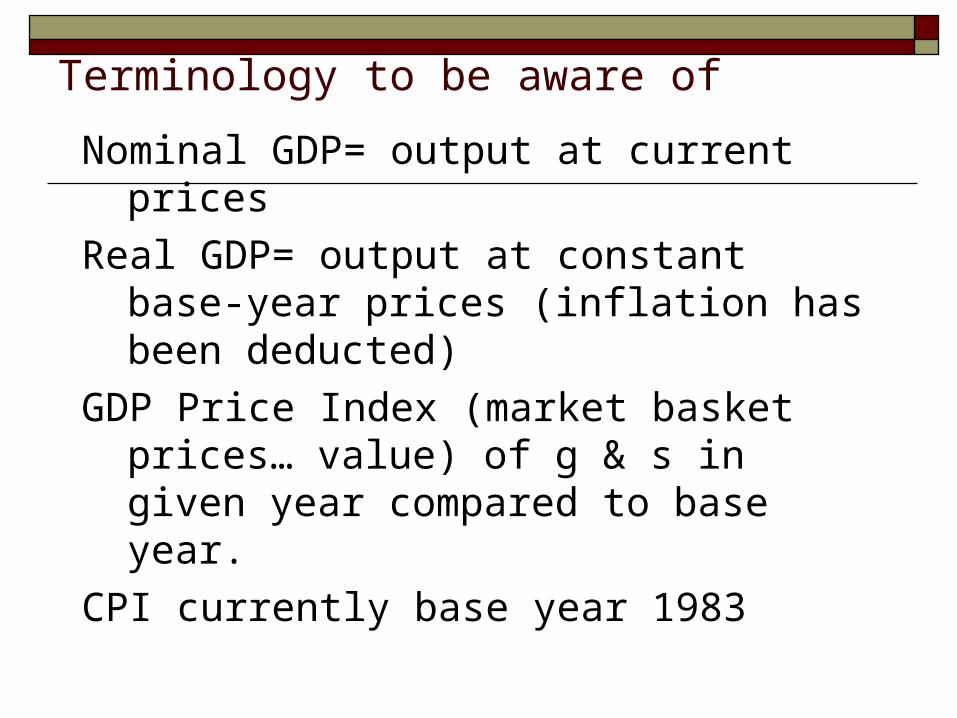
Terminology to be aware of
Nominal GDP= output at current prices
Real GDP= output at constant base-year prices (inflation has been deducted)
GDP Price Index (market basket prices… value) of g & s in given year compared to base year.
CPI currently base year 1983

What is the bottom line? The amount left after
evaluating the income approach is:
Disposable Income
(this is what we have to spend or save)

Would this change GDP?