Embed Size (px)
Citation preview

Chapter 5 – Cell Communication

Figure 11.0 Yeast

Figure 11.1 Communication between mating yeast cells
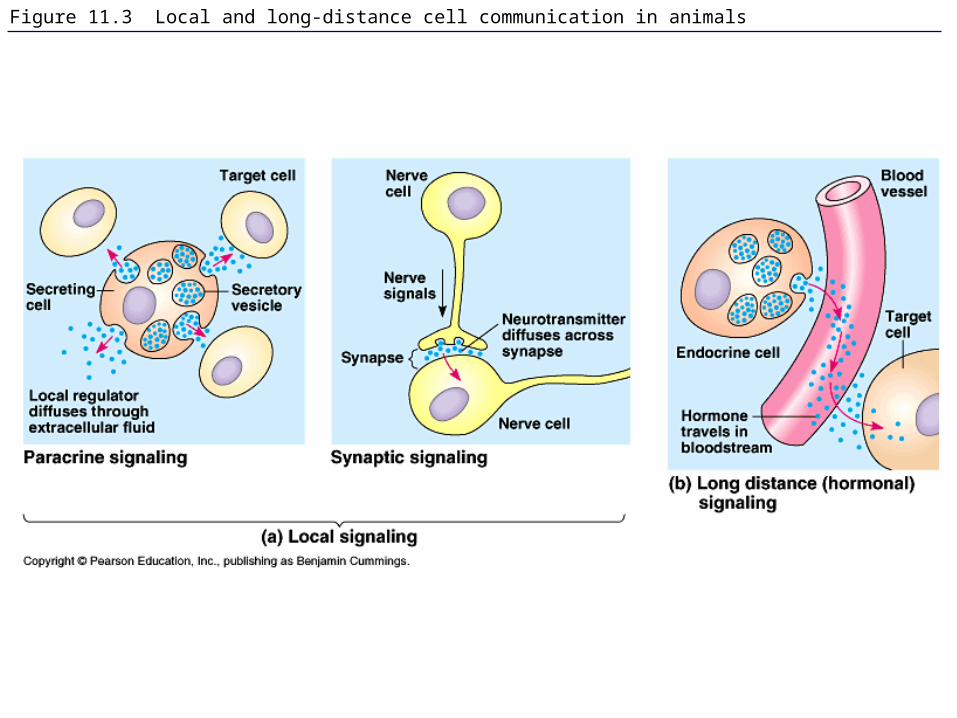
Figure 11.3 Local and long-distance cell communication in animals

Figure 11.4 Communication by direct contact between cells

Figure 11.5 Overview of cell signaling (Layer 3)

Figure 11.6 The structure of a G-protein-linked receptor

Figure 11.7 The functioning of a G-protein-linked receptor

Figure 11.8 The structure and function of a tyrosine-kinase receptor

Figure 11.9 A ligand-gated ion-channel receptor

Figure 11.10 Steroid hormone interacting with an intracellular receptor

Figure 11.11 A phosphorylation cascade

Figure 11.13 cAMP as a second messenger

Figure 11.12 Cyclic AMP

Figure 11-12x cAMP

Figure 11.14 The maintenance of calcium ion concentrations in an animal cell

Figure 11.15 Calcium and inositol triphosphate in signaling pathways (Layer 3)

Figure 11.16 Cytoplasmic response to a signal: the stimulation of glycogen breakdown by epinephrine

Figure 11.17 Nuclear response to a signal: the activation of a specific gene by a growth factor

Figure 11.18 The specificity of cell signaling

Figure 11.19 A scaffolding protein

Chapter 12 – Cell Life Cycle

Figure 12.0 Mitosis


Figure 12.1c The functions of cell division: Tissue renewal

Figure 12.2 Eukaryotic chomosomes

Figure 12.3 Chromosome duplication and distribution during mitosis

Figure 12.5 The stages of mitotic cell division in an animal cell: G2 phase; prophase; prometaphase

Figure 12.5 The stages of mitotic cell division in an animal cell: metaphase; anaphase; telophase and cytokinesis.

Figure 12.5x Mitosis
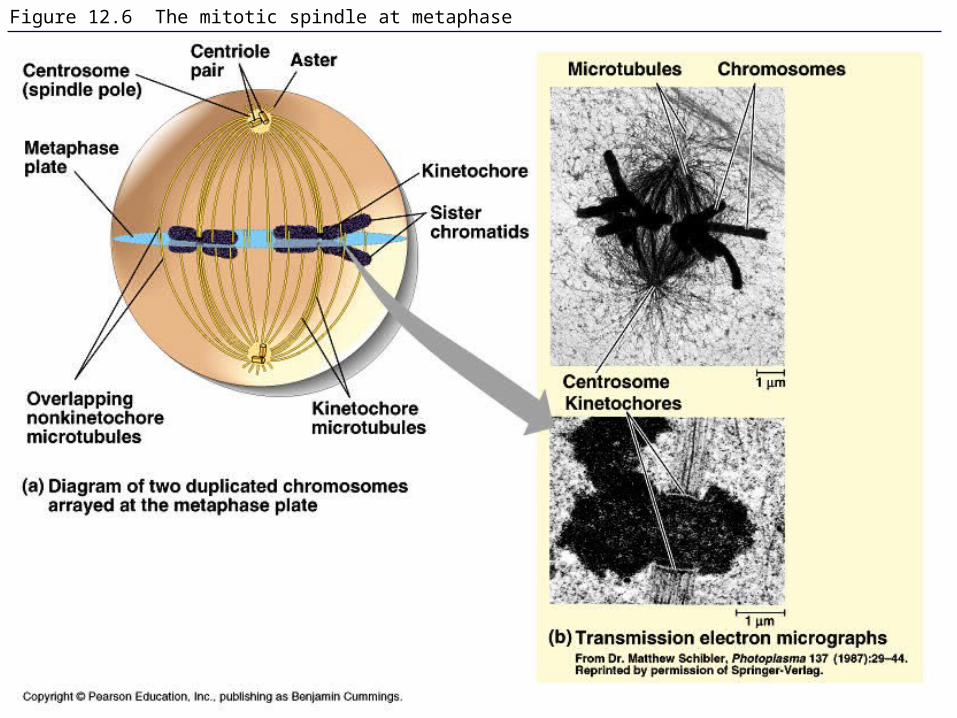
Figure 12.6 The mitotic spindle at metaphase

Figure 12.7 Testing a hypothesis for chromosome migration during anaphase

Figure 12.8 Cytokinesis in animal and plant cells

Figure 12.9 Mitosis in a plant cell

Figure 12-09x Mitosis in an onion root

Figure 12.10 Bacterial cell division (binary fission) (Layer 3)

Figure 12.15 The effect of a growth factor on cell division

Figure 12.16 Density-dependent inhibition of cell division

Figure 12.17 The growth and metastasis of a malignant breast tumor

Figure 12-17x1 Breast cancer cell

Figure 12-17x2 Mammogram: normal (left) and cancerous (right)

Figure 13.1 The asexual reproduction of a hydra

Figure 13.x1 SEM of sea urchin sperm fertilizing egg

Figure 13.3 Preparation of a human karyotype (Layer 4)

Figure 13.x2 Human female chromosomes shown by bright field G-banding

Figure 13.x3 Human female karyotype shown by bright field G-banding of chromosomes

Figure 13.x4 Human male chromosomes shown by bright field G-banding

Figure 13.x5 Human male karyotype shown by bright field G-banding of chromosomes

Figure 13.4 The human life cycle

Figure 13.5 Three sexual life cycles differing in the timing of meiosis and fertilization (syngamy)

Figure 13.6 Overview of meiosis: how meiosis reduces chromosome number

Figure 13.7 The stages of meiotic cell division: Meiosis I

Figure 13.7 The stages of meiotic cell division: Meiosis II
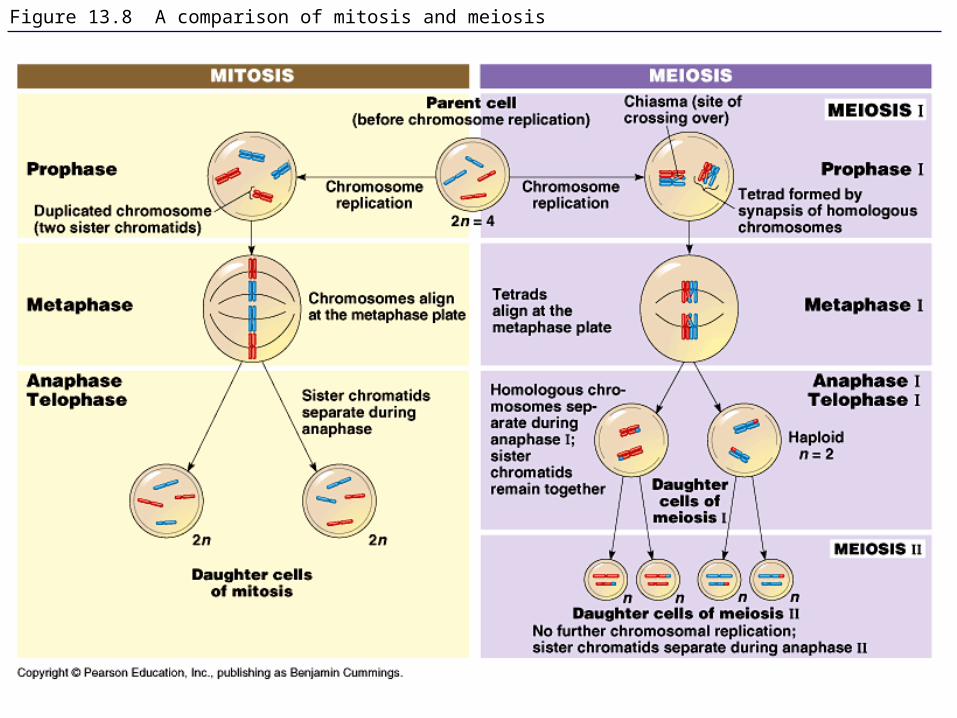
Figure 13.8 A comparison of mitosis and meiosis

Figure 13.8 A comparison of mitosis and meiosis: summary

Figure 13.9 The results of alternative arrangements of two homologous chromosome pairs on the metaphase plate in meiosis I

Figure 13.10 The results of crossing over during meiosis