Embed Size (px)
Citation preview
Chapter 5
Continuous Monitoring of Oxides of Nitrogen

Chapter 5Continuous Monitoring of Oxides of Nitrogen
Table of ContentsPage
1.0 Introduction...........................................................................................................................11.1 NO2 & NOY Monitoring Requirements.......................................................................1
2.0 Probe Siting Criteria.............................................................................................................52.1 Horizontal and Vertical Probe Placement ....................................................................52.2 Spacing from Obstructions...........................................................................................52.3 Spacing from Roads .....................................................................................................52.4 Spacing from Trees ......................................................................................................62.5 Probe Material and NOX Pollutant Residence Time....................................................6
3.0 Monitoring Methodology......................................................................................................73.1 Chemiluminescent Measurement Method of NO2 .......................................................73.2 Chemiluminescent Measurement Method of NOY ......................................................83.3 NO2 Direct Measurement Method ..............................................................................9
4.0 Calibration Methodology ...................................................................................................114.1 Chemiluminescence Analyzers ..................................................................................114.2 NO2 Direct Measurement Systems ............................................................................114.3 Calibration Systems....................................................................................................11
4.3.1 Permeation System (NO2) ............................................................................124.3.2 Blending/Dilution Systems with GPT ..........................................................12
4.4 Certification Requirements.........................................................................................13
5.0 Analyzer Calibrations.........................................................................................................145.1 Analyzer Calibration Procedures for Automated Systems.........................................145.2 Analyzer Calibration Procedures for non-Automated Systems .................................145.3 NO and NOX (NOY) Calibration Procedure...............................................................155.4 NO2 Calibration Procedures for NO/NO2/NOX or NO/NO2/NOY Analyzers...........255.5 NO2 Direct Measurement Calibration Procedures .....................................................28
6.0 Converter Efficiency Calculations.....................................................................................356.1 Calculation Procedure for Converter Efficiency ........................................................35
7.0 Regulator Purge Procedure ...............................................................................................39
8.0 Quality Control and Quality Assurance ...........................................................................408.1 Daily Zero and Span Checks ......................................................................................408.2 Automated Systems Span/1-point Quality Control Checks .......................................408.3 Manual Span/1-point Quality Control Audit..............................................................418.4 Annual Performance Evaluation Audits.....................................................................418.5 Chemiluminescence Analyzer Audit Procedures .......................................................42
Page
8.6 NO2 Direct Measurement Audit Procedures..............................................................46
9.0 Data Reduction and Reporting ..........................................................................................519.1 National Ambient Air Quality Standards ...................................................................519.2 Ambient Data .............................................................................................................519.3 Quality Control/Performance Evaluation Audit Results ............................................51
10.0 Routine Station Operations................................................................................................5210.1 Station Checks............................................................................................................5210.2 Analyzer Checks.........................................................................................................53
FIGURES1 NO/NO2/NOX Analyzer Flow Diagram .................................................................................82 Cavity Attenuated Phase Shift (CAPS) set up ........................................................................93 Phase shift representation of increased NO2 concentration..................................................104 Calibrator Flow Schemes......................................................................................................175 Example NO Calibration.......................................................................................................206 Example NO2 Calibration.....................................................................................................327 Example Converter Efficiency Plot ......................................................................................36
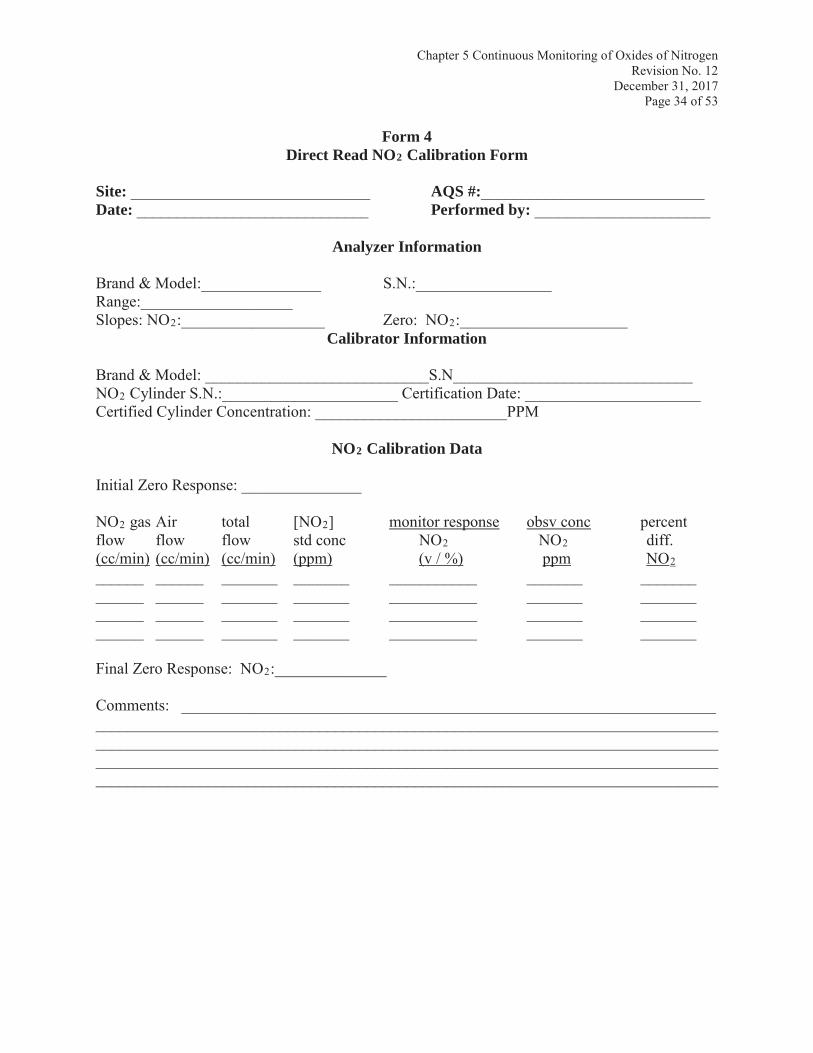
FORMS1 NO/NO2/NOX Calibration Form ..........................................................................................222 NO/NO2/NOY Calibration Form ..........................................................................................233 Diagnostic Checks Form.......................................................................................................244 Direct Read NO2 Calibration Form ......................................................................................345 Converter Efficiency-NO/NO2/NOX ...................................................................................376 Converter Efficiency-NO/NO2/NOY ...................................................................................387 NO/NO2/NOX Audit Form ...................................................................................................498 NO2 Audit Form ...................................................................................................................50
TABLES1 Performance Evaluation NO2 Audit Concentration Ranges...................................................32 Minimum Separation Distance for NO2 Monitoring
(Neighborhood and Urban Scale).................................................................................63 Example NO Standard and Observed Results Comparison..................................................214 Example NO2 Standard and Observed Results Comparison ................................................335 Example of Converter Efficiency Data.................................................................................36
Chapter 5 Continuous Monitoring of Oxides of NitrogenRevision No. 12
December 31, 2017Page 1 of 53
1.0 IntroductionThis chapter outlines the requirements for ambient air monitoring of oxides of nitrogen (NO, NO2, and NOX) and total reactive oxides of nitrogen (NOY).
In atmospheric chemistry, NOX is a generic term for the nitrogen oxides that are most relevant for air pollution, namely nitric oxide (NO) and nitrogen dioxide (NO2). The NOX concentration is sum of the concentrations of NO and NO2.Reactive nitrogen compounds (NOY) refers to the sum of all reactive nitrogen oxides including NOX and other nitrogen oxides referred to as NOZ.The major components of NOZ include nitric acid (HNO3), nitrous acid (HONO), organic nitrates [peroxyl acetyl nitrate (PAN), methyl peroxyl acetyl nitrate (MPAN), and peroxyl propionyl nitrate, (PPN)], and particulate nitrates.
The requirements outlined in this chapter are to be followed by all organizations (e.g. State, localagencies, industrial/consultant) that conduct ambient air monitoring in Indiana and report data to the Air Quality System (AQS).
This chapter does not replace the information contained in the analyzer operation and/ormaintenance manual. The analyzer's operation manual should be reviewed to understand the specific instrument procedures prior to performing any analyzer calibration, audit, or maintenance. The operation manual iis available at each monitoring station, either as a hardcopy or an electronic version, for use as a reference guide. Nor does this chapter replace guidance from the United States Environmental Protection Agency (U.S. EPA) in regards to ambient air monitoring, specifically 40 Code of Federal Regulations (CFR) Parts 50 and 58, and the Quality Assurance Handbook for Air Pollution Measurement Systems Volume II: Ambient Air Quality Monitoring Program EPA-454/B-17-001, January 2017.
1.1 NO2 & NOY Monitoring Requirements1. The minimum site requirements for NO/NO2/NOX sampling are delineated in Appendix E of
the CFR 40 Part 58. The minimum site requirements for NO/NOY sampling are found in 40CFR Part 58 Appendix D, and in Chapter 4 of the Technical Assistance Document (TAD) For Precursor Gas Measurements in the NCore Multi-Pollutant Monitoring Network, version 4(EPA-454/R-05-003, September 2005).
2. Analyzers used for NO/NO2/NOX sampling must be designated as a Federal Reference Method (FRM) or Federal Equivalent Method (FEM). A reference method of NOY has not yet been designated; however, U.S. EPA recommendations for high-sensitivity NOYmonitors can be found in Chapter 4 of the Technical Assistance Document (TAD) For Precursor Gas Measurements in the NCore Multi-Pollutant Monitoring Network, version 4(EPA-454/R-05-003, September 2005).
3. Analyzers for NO/NO2/NOX must be recalibrated at least once every 6 months. A valid calibration consists of adjusting the zero and range span of the instrument, and then three additional concentrations evenly spread out between the zero and range span. Multi-point
Chapter 5 Continuous Monitoring of Oxides of NitrogenRevision No. 12
December 31, 2017Page 2 of 53
calibrations must be completed before the high sensitivity NOY analyzer is put into service and at least quarterly thereafter.
4. A valid calibration requires all calibration points to be within ±2.1% or within ± 1.5 parts per billion (ppb) of the linear calibration line through the data. The slope of the linear calibration curve, should be between 0.095 and 1.05, (expressed as the analyzer concentration per the applied standard concentration).
5. during multi-point calibrations, span/1-point quality control (QC) audits, and performance evaluation (PE) audits.
6. Portable gas phase titration (GPT) gas blenders and NO gas cylinders associated with them must be certified at least once every 6 months by the Certification Facility of the Indiana Department of Environmental Management, Office of Air Quality, Air Monitoring Branch, Quality Assurance Section (IDEM-QAS). Stationary blending systems must be certified by the IDEM-QAS annually. This includes the certification of any mass flow meters used with the calibration or auditing device. Nitric oxide gas cylinders assigned to stationary gas calibrators are certified every three years.
7. Span and zero quality control checks are scheduled to be performed daily.
8. Span and 1-point quality control audits are conducted on each analyzer at a minimum of once every two weeks (bi-weekly).
9. The span concentration should be a concentration value between 70% and 90% of the analyzer range or the calibration range. The 1-point QC audit concentration must be in the range of 0.005 ppm to 0.080 ppm. The analyzer range is the analyzer design operating range that is promulgated in the approved federal reference method (FRM) or federal equivalent method (FEM) designation. The calibration range is the concentration range that the instrument is calibrated over; although it needs to be within the operating range, it typicallycovers concentration levels normally measured by the analyzer.
10. The NO2 span and 1-point QC audit limits are < ±10.1% and < ±15.1%, respectively.* If the 1- 2, a concentration difference less than or equal to 0.0015 ppm (1.5 ppb) also is considered as valid. Results outside these limits indicate issues with the analyzer and data must be invalidated from the preceding passing span or 1-point QC check to the next passing span or 1-point QC check.
_________________________________* Mathematically the intent of the relationship (< ±10.1% or < ± 15.1%) is not correct for the smaller negative results, as -20% is less than -10.1% or -15.1%. A more correct way to show the relationship is either using absolute values (< | ±10.1% |) or as a limit relationship, for example within the limits of ±10.1% (-10.1% < x < +10.1%). However, as the EPA QA Handbook Volume II uses the less than +/- representation (<±), the representation used within this chapter will be consistent with the EPA QA Handbook.
Chapter 5 Continuous Monitoring of Oxides of NitrogenRevision No. 12
December 31, 2017Page 3 of 53
11. Performance evaluation (PE) audits must be performed on at least 25% of the analyzers in the network for each calendar quarter. The IDEM-QAS performs a quarterly PE audit on each analyzer in the network and recommends quarterly PE audits on all gas analyzers monitoring within Indiana.
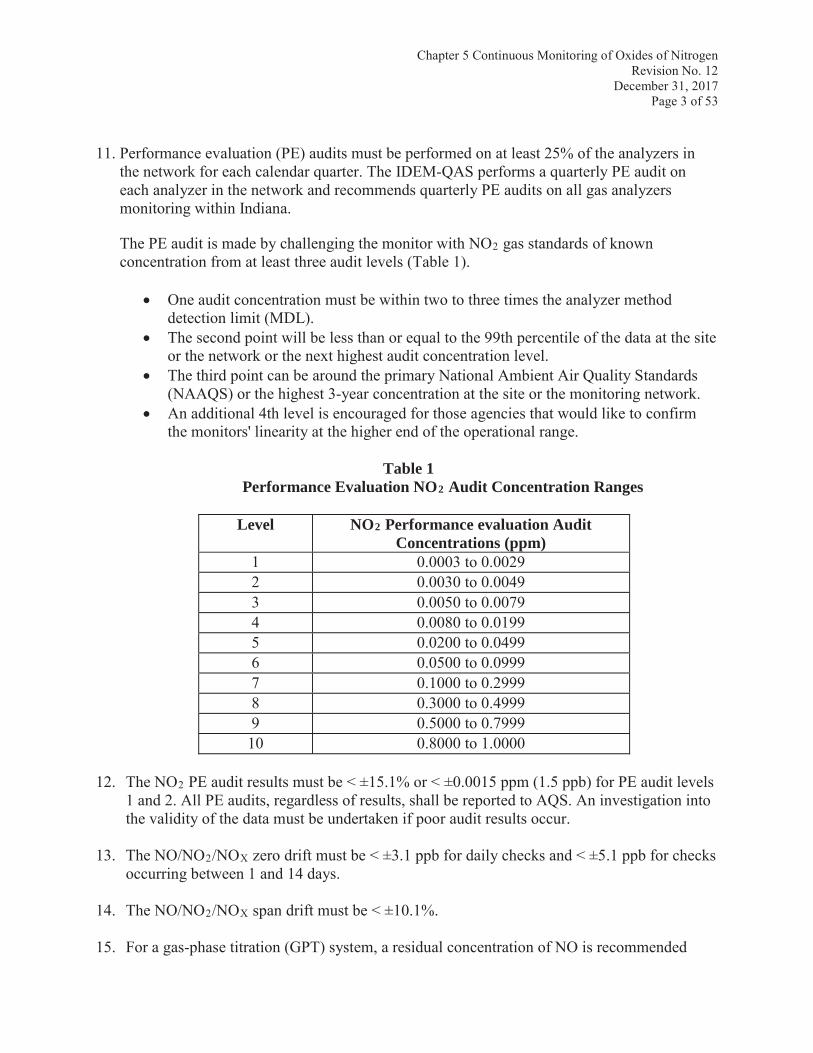
The PE audit is made by challenging the monitor with NO2 gas standards of known concentration from at least three audit levels (Table 1).
One audit concentration must be within two to three times the analyzer method detection limit (MDL).The second point will be less than or equal to the 99th percentile of the data at the site or the network or the next highest audit concentration level.The third point can be around the primary National Ambient Air Quality Standards (NAAQS) or the highest 3-year concentration at the site or the monitoring network.An additional 4th level is encouraged for those agencies that would like to confirm the monitors' linearity at the higher end of the operational range.
Table 1Performance Evaluation NO2 Audit Concentration Ranges
Level NO2 Performance evaluation Audit Concentrations (ppm)
1 0.0003 to 0.00292 0.0030 to 0.00493 0.0050 to 0.00794 0.0080 to 0.01995 0.0200 to 0.04996 0.0500 to 0.09997 0.1000 to 0.29998 0.3000 to 0.49999 0.5000 to 0.799910 0.8000 to 1.0000
12. The NO2 PE audit results must be < ±15.1% or < ±0.0015 ppm (1.5 ppb) for PE audit levels 1 and 2. All PE audits, regardless of results, shall be reported to AQS. An investigation into the validity of the data must be undertaken if poor audit results occur.
13. The NO/NO2/NOX zero drift must be < ±3.1 ppb for daily checks and < ±5.1 ppb for checks occurring between 1 and 14 days.
14. The NO/NO2/NOX span drift must be < ±10.1%.
15. For a gas-phase titration (GPT) system, a residual concentration of NO is recommended
Chapter 5 Continuous Monitoring of Oxides of NitrogenRevision No. 12
December 31, 2017Page 4 of 53
when titrating for NO2 audit levels.
16. The primary 1-hour NAAQS for NO2 is 100 ppb; the design value for comparison to the NAAQS is the 98th percentile concentration averaged over three years. The primary and secondary annual NAAQS for NO2 is 53 ppb; the design value for comparison to the standard is the annual mean.
17. The goal for acceptable measurement uncertainty is defined for precision as an upper 90 percent confidence limit for the coefficient of variation (CV) of 15% and for bias as an upper 95 percent confidence limit for the absolute bias of 15%.
18. The goal for acceptable data completeness for the comparison of the design value to the annual NO2 standard is to obtain data covering greater than 75% of the total hours in a year.
The goal for acceptable data completeness for comparison of the design value to the 1-hour standard is to have three consecutive years of complete data. Other increments of completeness for the 1-hour NO2 standard are:
A calendar year is considered complete if it has four quarters of data; Athe quarter, and A
19. The average shelter temperature should be in the range of 20 °C to 30 °C (68 °F to 86 °F). A temperature recording device must be installed to continuously monitor the site temperature fluctuations as per the USEPA QA Handbook, Vol II, §7.2.2. Data shall be invalidated by the IDEM-QAS any time the shelter temperature is out of the 15 °C to 33 °C (59.0 °F to 91.4 °F) range or other temperature range as designated by the equipment manufacturer whose analyzer is approved as an equivalent method.
20. All hourly NO2 data is reported to the USEPA Air Quality System in units of parts per billion (ppb) with 1 place after the decimal point, with additional digits to the right being truncated with no further rounding.
21. The State of Indiana ambient air monitoring network utilizes the Leading Environmental Analysis Display System (LEADS) as its environmental data acquisition system. For gaseous air pollutants, the system pairs an on-site calibrator with the analyzer in order to perform automated calibrations, zero and span checks, and quality control checks. It can also apply flags to the data automatically, which aids in the QA/QC procedure. See Chapter 1, “Quality Assurance of Air Monitoring” for introductory LEADS information.”
Chapter 5 Continuous Monitoring of Oxides of NitrogenRevision No. 12
December 31, 2017Page 5 of 53
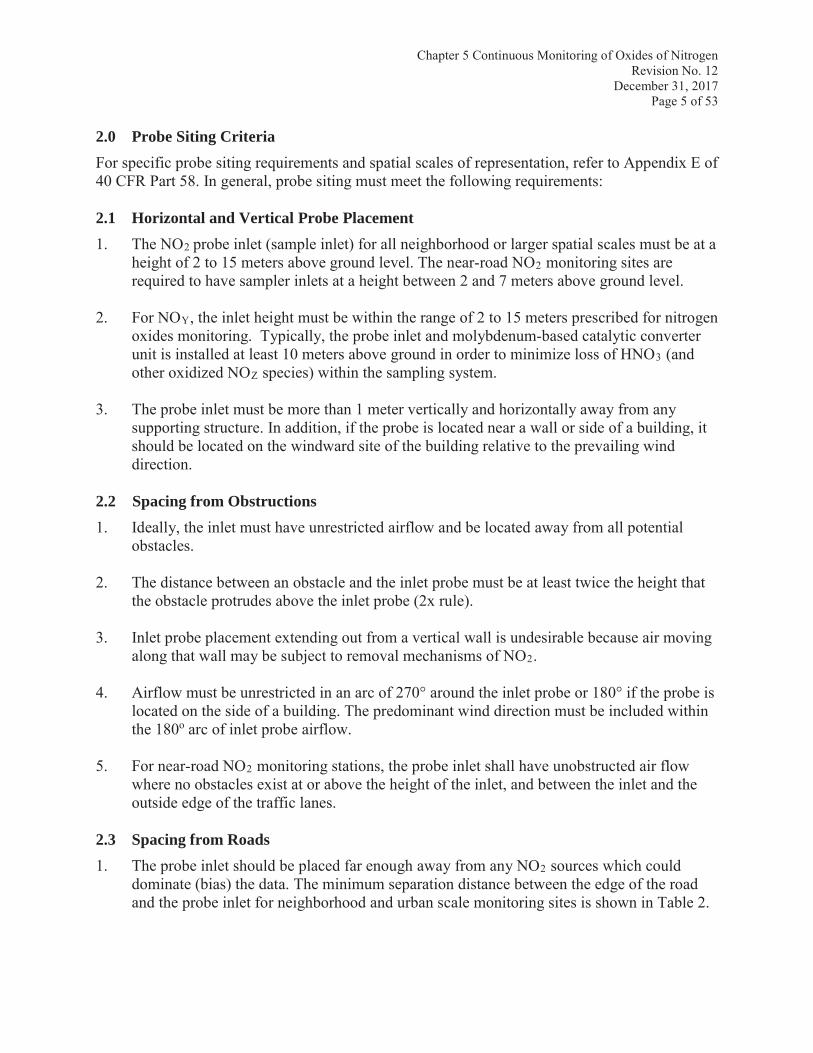
2.0 Probe Siting CriteriaFor specific probe siting requirements and spatial scales of representation, refer to Appendix E of 40 CFR Part 58. In general, probe siting must meet the following requirements:
2.1 Horizontal and Vertical Probe Placement1. The NO2 probe inlet (sample inlet) for all neighborhood or larger spatial scales must be at a
height of 2 to 15 meters above ground level. The near-road NO2 monitoring sites are required to have sampler inlets at a height between 2 and 7 meters above ground level.
2. For NOY, the inlet height must be within the range of 2 to 15 meters prescribed for nitrogen oxides monitoring. Typically, the probe inlet and molybdenum-based catalytic converter unit is installed at least 10 meters above ground in order to minimize loss of HNO3 (and other oxidized NOZ species) within the sampling system.
3. The probe inlet must be more than 1 meter vertically and horizontally away from any supporting structure. In addition, if the probe is located near a wall or side of a building, it should be located on the windward site of the building relative to the prevailing wind direction.
2.2 Spacing from Obstructions1. Ideally, the inlet must have unrestricted airflow and be located away from all potential
obstacles.
2. The distance between an obstacle and the inlet probe must be at least twice the height that the obstacle protrudes above the inlet probe (2x rule).
3. Inlet probe placement extending out from a vertical wall is undesirable because air moving along that wall may be subject to removal mechanisms of NO2.
4. Airflow must be unrestricted in an arc of 270° around the inlet probe or 180° if the probe is located on the side of a building. The predominant wind direction must be included within the 180o arc of inlet probe airflow.
5. For near-road NO2 monitoring stations, the probe inlet shall have unobstructed air flow where no obstacles exist at or above the height of the inlet, and between the inlet and the outside edge of the traffic lanes.
2.3 Spacing from Roads1. The probe inlet should be placed far enough away from any NO2 sources which could
dominate (bias) the data. The minimum separation distance between the edge of the road and the probe inlet for neighborhood and urban scale monitoring sites is shown in Table 2.
Chapter 5 Continuous Monitoring of Oxides of NitrogenRevision No. 12
December 31, 2017Page 6 of 53
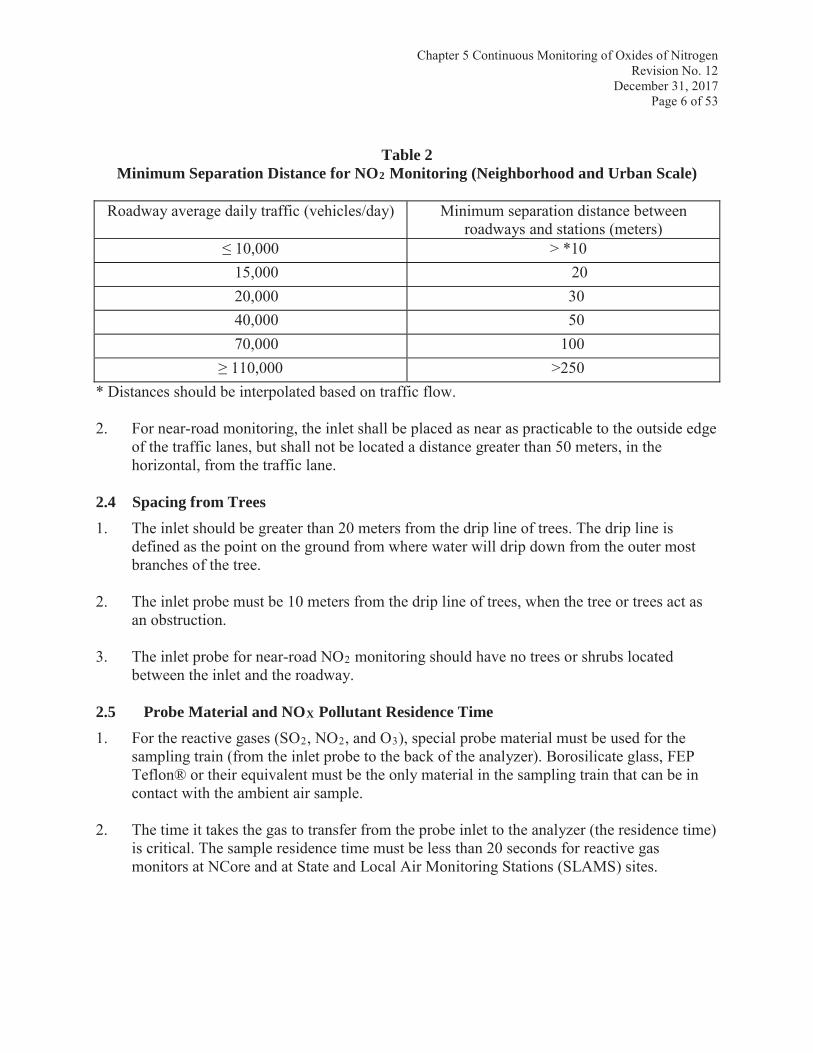
Table 2Minimum Separation Distance for NO2 Monitoring (Neighborhood and Urban Scale)
Roadway average daily traffic (vehicles/day) Minimum separation distance between roadways and stations (meters)
10,000 > *1015,000 2020,000 3040,000 5070,000 100110,000 >250
* Distances should be interpolated based on traffic flow.
2. For near-road monitoring, the inlet shall be placed as near as practicable to the outside edge of the traffic lanes, but shall not be located a distance greater than 50 meters, in the horizontal, from the traffic lane.
2.4 Spacing from Trees1. The inlet should be greater than 20 meters from the drip line of trees. The drip line is
defined as the point on the ground from where water will drip down from the outer most branches of the tree.
2. The inlet probe must be 10 meters from the drip line of trees, when the tree or trees act as an obstruction.
3. The inlet probe for near-road NO2 monitoring should have no trees or shrubs located between the inlet and the roadway.
2.5 Probe Material and NOX Pollutant Residence Time1. For the reactive gases (SO2, NO2, and O3), special probe material must be used for the
sampling train (from the inlet probe to the back of the analyzer). Borosilicate glass, FEP Teflon® or their equivalent must be the only material in the sampling train that can be in contact with the ambient air sample.
2. The time it takes the gas to transfer from the probe inlet to the analyzer (the residence time)is critical. The sample residence time must be less than 20 seconds for reactive gas monitors at NCore and at State and Local Air Monitoring Stations (SLAMS) sites.
Chapter 5 Continuous Monitoring of Oxides of NitrogenRevision No. 12
December 31, 2017Page 7 of 53
3.0 Monitoring MethodologyAll methods used to monitor NO2 must be an USEPA reference or equivalent method as described in 40 CFR Part 50 Appendix F. Continuous ambient NO2 analyzers must have an USEPA reference method number posted on the analyzer or listed in the instrument manual. Atpresent, USEPA has not yet designated a reference or equivalency requirement for NOY.
3.1 Chemiluminescent Measurement Method of NO2
The chemiluminescence measurement method is based on the reaction of ozone (O3) with nitric oxide (NO) to form nitrogen dioxide (NO2) and oxygen (O2) (Equation 5-1). The excited state nitrogen dioxide (NO2*) emits infrared light ( ) with an intensity proportional to the NO concentration.
Equation 5-1
NO + O3 NO2* + O2 NO2 + O2 +h
A chemiluminescent method NO2 analyzer indirectly determines concentrations of NO2 by measuring NO and NOX concentrations. NOX is defined as the sum of the NO2 and NO analyzer measurements (Equation 5-2). The analyzer never directly measures the native NO2 in ambient air.
Equation 5-2
[NOX] = [NO2] + [NO]
Rearranging Equation 5-2 yields
[NO2] = [NOX] – [NO]
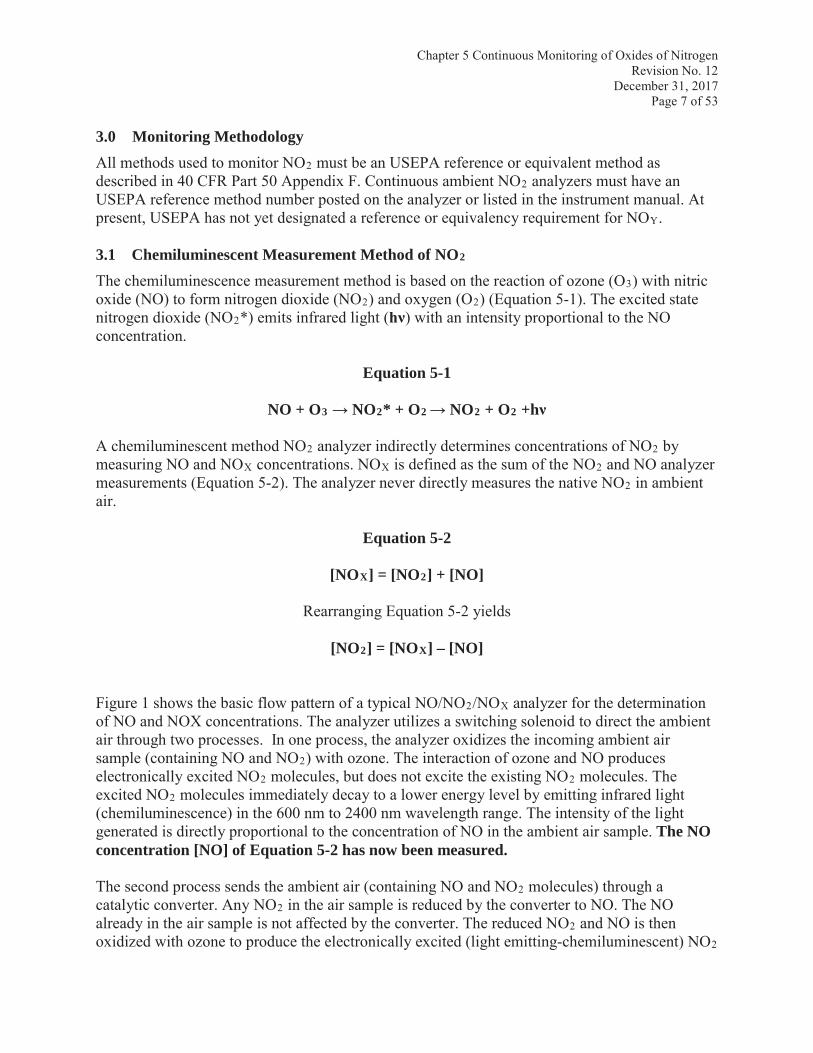
Figure 1 shows the basic flow pattern of a typical NO/NO2/NOX analyzer for the determination of NO and NOX concentrations. The analyzer utilizes a switching solenoid to direct the ambient air through two processes. In one process, the analyzer oxidizes the incoming ambient air sample (containing NO and NO2) with ozone. The interaction of ozone and NO produceselectronically excited NO2 molecules, but does not excite the existing NO2 molecules. Theexcited NO2 molecules immediately decay to a lower energy level by emitting infrared light (chemiluminescence) in the 600 nm to 2400 nm wavelength range. The intensity of the light generated is directly proportional to the concentration of NO in the ambient air sample. The NO concentration [NO] of Equation 5-2 has now been measured.
The second process sends the ambient air (containing NO and NO2 molecules) through a catalytic converter. Any NO2 in the air sample is reduced by the converter to NO. The NO already in the air sample is not affected by the converter. The reduced NO2 and NO is then oxidized with ozone to produce the electronically excited (light emitting-chemiluminescent) NO2
Chapter 5 Continuous Monitoring of Oxides of NitrogenRevision No. 12
December 31, 2017Page 8 of 53
molecule. The intensity of light is measured by the analyzer and is reported as the NOXconcentration. The NOX concentration [NOX] of Equation 5-2 has now been measured.
Using Equation 5-2, the analyzer derives the concentration of NO2 by subtracting the NO concentration from the NOX concentration.
SwitchingSolenoid
Ozonator
CatalyticConverter
2NO2 O2
2])
[NO], [NO2] [NO], [NO2]
[NO] + [NO]NO2 converted
[NO2*]NO = [NO]
[O3]
[NO2 *]NO + [NO2*]NO2 converted = [NOx]
[NO2] = [NOx] - [NO]
Figure 1. NO/NO2/NOX Analyzer Flow Diagram
3.2 Chemiluminescent Measurement Method of NOY
Reactive nitrogen compounds (NOY) have been identified as precursors for the formation of both ozone and fine particulate matter (PM2.5). Reactive nitrogen compounds consists of all oxides of nitrogen in which the oxidation state of the nitrogen atom is +2 or greater. Reactive nitrogen compounds (NOY) refers to the sum of all reactive nitrogen oxides including NOX (NO + NO2)and other nitrogen oxides referred to as NOZ (Equation 5-3). The major components of NOZinclude nitric acid (HNO3), nitrous acid (HONO), organic nitrates [peroxyl acetyl nitrate (PAN), methyl peroxyl acetyl nitrate (MPAN), and peroxyl propionyl nitrate, (PPN)], and particulate
Chapter 5 Continuous Monitoring of Oxides of NitrogenRevision No. 12
December 31, 2017Page 9 of 53
nitrates.Equation 5-3
[NOY] = [NO2] + [NO] + [NOZ]
The same principle used for the measurement of NO, NO2, and NOX is used for the total reactive oxides measurement. The NO and NOY concentrations are determined by photochemically measuring the light intensity at wavelengths greater than 600 nanometers from the chemiluminescent reaction of nitric oxide with ozone (see Equation 5-1). To measure NOY,sample air is passed through a probe-mounted catalytic converter. The nitroxyl compounds present are reduced to NO. The NO already in the air sample is not affected by the converter. The NO resulting from the reduction of these nitroxyl compounds, plus any native NO is directed to a reaction chamber to react with ozone. The intensity of the resulting chemiluminescent light is measured as the total NOY concentration [NOY]. To measure NO separately and specifically, sample air by-passes the catalytic converter so that no reduction of the nitroxyl compounds to NO occurs.
This procedure is similar to the methodology used to measure NOX; however, it uses a higherconverter temperature to more completely convert NOZ species, and the converter is moved near to the sample inlet to avoid line losses of “sticky” NOY species, such as HNO3.
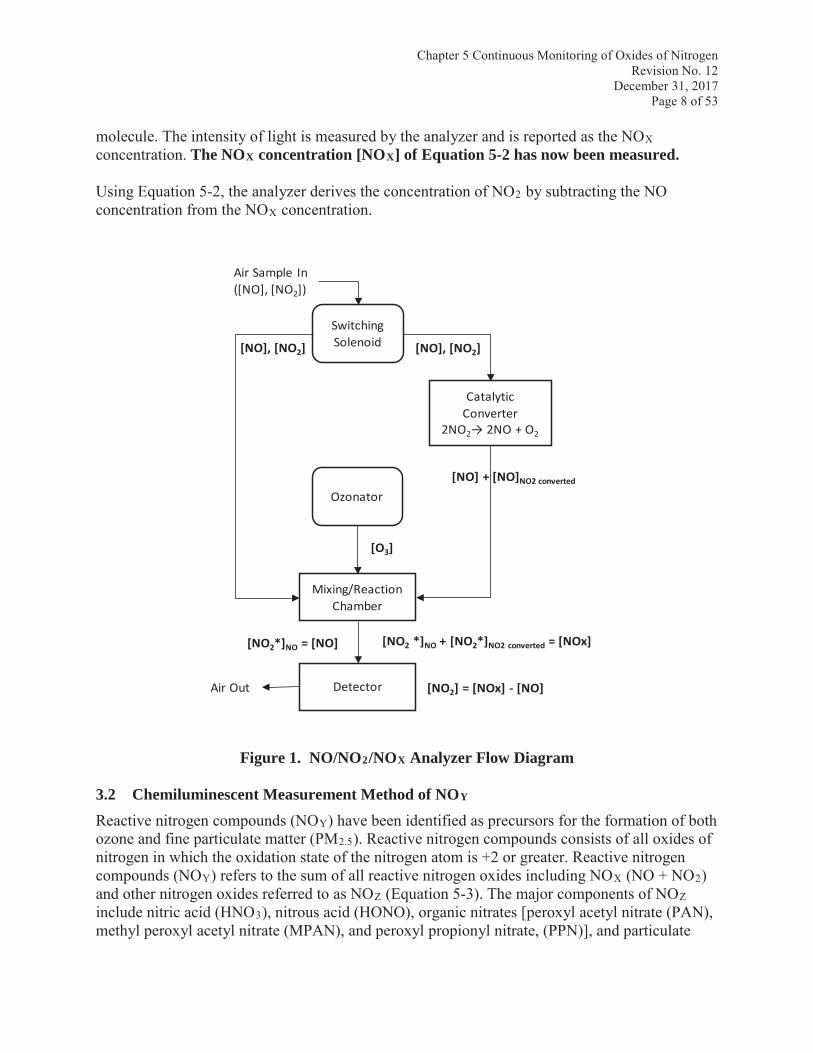
3.3 NO2 Direct Measurement MethodThe Cavity Attenuated Phase Shift (CAPS) NO2 monitor operates as an optical absorption spectrometer yielding direct measurements of ambient nitrogen dioxide down to sub ppb concentrations. The CAPS method uses light from a blue ultraviolet (UV) light emitting diode (LED) centered at 450 nm, a measurement cell with high reflectivity mirrors located at both endsto provide an extensive optical path length, and a vacuum photodiode detector (Figure 2). These components are assembled within an optical cell which resides in a temperature controlled oven. The oven raises the ambient temperature of the sample gas to 45 degrees Celsius to reduce the formation of moisture on the surfaces of the mirrors, while also minimizing changes in the absorption coefficient due to temperature fluctuations.
Figure 2. Cavity Attenuated Phase Shift (CAPS) set up.
Chapter 5 Continuous Monitoring of Oxides of NitrogenRevision No. 12
December 31, 2017Page 10 of 53
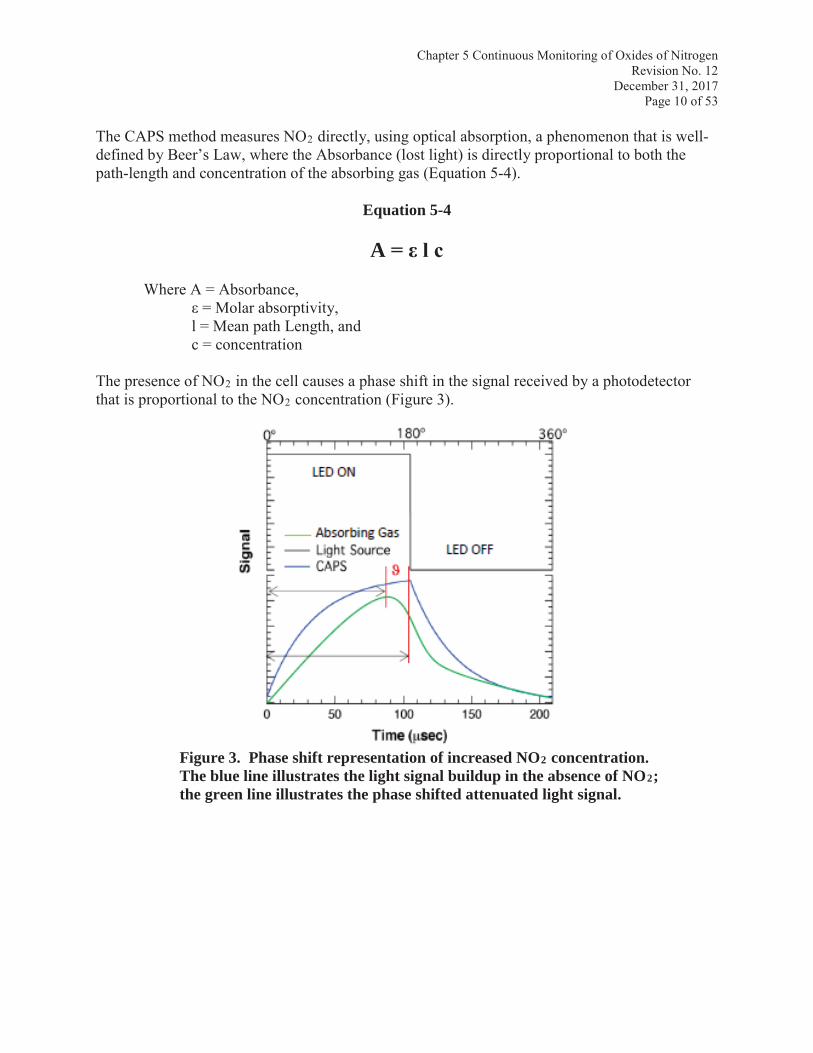
The CAPS method measures NO2 directly, using optical absorption, a phenomenon that is well-defined by Beer’s Law, where the Absorbance (lost light) is directly proportional to both the path-length and concentration of the absorbing gas (Equation 5-4).
Equation 5-4
A
Where A = Absorbance,
l = Mean path Length, and c = concentration
The presence of NO2 in the cell causes a phase shift in the signal received by a photodetector that is proportional to the NO2 concentration (Figure 3).
Figure 3. Phase shift representation of increased NO2 concentration. The blue line illustrates the light signal buildup in the absence of NO2;the green line illustrates the phase shifted attenuated light signal.
Chapter 5 Continuous Monitoring of Oxides of NitrogenRevision No. 12
December 31, 2017Page 11 of 53
4.0 Calibration MethodologyAlways refer to the manufacturer operating manual for analyzer-specific instructions for the calibration of a particular instrument model.
4.1 Chemiluminescence AnalyzersFor chemiluminescence type analyzers, the calibration method for a NO/NO2/NOX analyzer is based on the GPT between O3 and excess NO to produce NO2.
Flow from a cylinder of NO gas is diluted with measured flows of zero air. Zero air is defined as dilution air that is free of moisture and the pollutants being measured by the analyzer. For the NO/NO2/NOX calibration method, dilution air is cleaned or scrubbed of NO, NO2, and O3 with the following: a drying column of silica gel, an oxidizing catalyst column or ultraviolet lamp to convert NO to NO2, and a charcoal column for NO2 and O3 removal. This scrubbing method will remove NO, NO2, and O3 below the minimum detectable limits of the analyzer.
Depending on the desired blended concentrations and the output of the mass flow meters, the cylinder NO concentration should range between 10 and 50 parts per million (ppm) with minimal NO2 impurity. The NO2 concentration should be less than 1% of the NO concentration.
A known concentration of the diluted NO gas is titrated with known concentrations of O3 in order to produce NO2. When titrating NO with O3, the changes in the calibrated NO channel are used to determine NO2 concentrations (Equation 5-2).
The calibration method for NOY is similar to the calibration method of NO/NO2/NOXinstruments. It uses the gas phase titration of an NO standard with O3. When the NO concentration is known, the concentration of NO2 can be determined. Ozone is added to excess NO in a dynamic calibration system, and the NO channel of the chemiluminescence NOYinstrument is used as an indicator of changes in NO concentration. Upon the addition of O3, the decrease in NO concentration observed on the calibrated NO channel is equivalent to the concentration of NO2 produced. The amount of NO2 generated may be varied by adding variable amounts of O3 from a stable O3 generator.
4.2 NO2 Direct Measurement SystemsDynamic calibration of NO2 direct measurement analyzers involve introducing gas samples of known concentrations to an analyzer in order to adjust the instrument to a predetermined sensitivity and to derive a calibration relationship. In general, the systems used for calibrating NO2 analyzers use dilution air (zero air) to dilute (blend down) a high NO2 concentration to the desired concentration. The dilution air is cleaned or scrubbed of NO, NO2, and O3 exactly in the same manner as that for chemiluminescence analyzers.
4.3 Calibration SystemsThe system used to calibrate NO/NO2/NOX, CAPS NO2, or NO/NOY analyzers are of two types: permeation systems or GPT dilution/blending systems.
Chapter 5 Continuous Monitoring of Oxides of NitrogenRevision No. 12
December 31, 2017Page 12 of 53
4.3.1 Permeation SystemNitrogen dioxide can be produced using a permeation system. The permeation system producesNO2 concentrations using a vial of liquid nitrogen dioxide that is contained in a chamber or oven heated to a constant temperature. The vial is under pressure so the NO2 remains in a liquid state. Depending on the oven temperature, gaseous NO2 evaporates from the liquid phase at a given rate (permeation rate) into the chamber. Zero air is passed through this chamber and by varying the flow rate of zero air blending with the flow of NO2, yields different concentrations of NO2.Total flow through system is measured and used in Equation 5-5 to calculate the NO2 concentration.
Equation 5-5
= ( ) .Where C = concentration, μL/L or ppm (by volume)
PR = permeation rate, μg/min24.46 = molar volume @ 25 °C and 760 mm Hg, μL/μmoleMW = molecular weight of permeation gas, μg/μmoleQ = total flow rate, L/min (corrected to 25 °C and 760 mm Hg)
The molecular weight of NO2 is 46.01 μg/μmole, which simplifies Equation 5-5 to
, = ( , / ) .,For chemiluminescence type analyzers, a NO2 permeation system can be used for daily zero and NO2 span checks. An NO2 permeation system is not recommended for bi-weekly 1-point quality control checks, or for performance evaluation audits as the USEPA guidance documents recommend a residual amount of NO when 1-point quality control checks and performance evaluation audits are performed. An NO2 permeation system is of limited use for calibrations,since it cannot be used to calibrate the NO channel of the analyzer.
4.3.2 Blending/Dilution Systems with GPTA GPT blending/dilution system consists of a cylinder of NO (in an oxygen-free gas, usually nitrogen and with an NO2 impurity less than 1% of the NO gas concentration), adilution/blending system, and an ozonator. Specific components of the GPT system include:
1. An air flow controller capable of maintaining and measuring constant air flows within ±2.0% of the standard flow (25 °C and 760 mm Hg). The flow controller may be a mass flow controller, rotameter, or capillary.
2. An NO gas flow controller (made of nonreactive material, i.e. stainless steel) capable of
Chapter 5 Continuous Monitoring of Oxides of NitrogenRevision No. 12
December 31, 2017Page 13 of 53
maintaining and measuring constant flows within ±2% of the standard flow (25 °C and 760mm Hg). The flow controller may be a mass flow controller, rotameter, or capillary.
3. A pressure regulator for connecting to the cylinder of the NO gas standard must be made of nonreactive materials (i.e. stainless steel). The regulator must be able to deliver NO gas at a suitable pressure for the blending system, and have a CGA 660 cylinder connection fitting.
4. An ozone generator capable of generating sufficient, stable levels of O3 for the GPT reaction with NO gas concentrations.
5. A shutoff valve (of nonreactive material) to stop the NO flow when zero air is required.
6. A reaction chamber (of nonreactive material) for the quantitative reaction of O3 with excess NO with sufficient volume to meet the residence requirements of 40 CFR Part 50, Appendix F, Calibration § 1.4.
7. A mixing chamber (nonreactive material) designed to provide thorough mixing of the GPT reaction products and dilution air. The inlet and outlet should be of sufficient diameter so that the chamber is at atmospheric pressure under normal operation, and sufficient turbulence must be created within the chamber to facilitate thorough mixing. Chamber volumes in the range of 150 to 250 cm3 are sufficient to meet the requirements.
Note: Most commercial GPT blending/dilution systems have a combined reaction and mixing chamber. The required residence time has been calculated and should be listed in the operation manual.
8. An output manifold (nonreactive material) to provide a vented sample to the analyzer.
9. A cylinder of NO gas with an NO2 impurity less than 1% of the NO gas concentrationcertified by the IDEM-QAS. The NO gas cylinder valve must be compatible with a CGA 660 regulator fitting.
10. A zero (clean) air system capable of producing air, which is free of the contaminants of NO, NO2, and O3.
4.4 Certification RequirementsThe air and gas mass flow meters of gas dilution/blending systems, used for audits and calibrations, must be certified by the IDEM-QAS. Portable gas blending systems (and the associated gas cylinder(s)) that are transported and used at various sites must be certified at least every 6 months. Stationary gas blending systems, which do not leave a monitoring site, must be certified annually; and the NO gas cylinder, associated with the stationary gas blending system,is certified every three years. Refer to Chapter 6 “Calibration/Certification/Verification Methods for Transfer Standards” for information regarding mass flow controller and gas cylinder certification.
Chapter 5 Continuous Monitoring of Oxides of NitrogenRevision No. 12
December 31, 2017Page 14 of 53
System recertification must be performed immediately, if any of the following conditions occur:
1. Major maintenance on the blending system (e.g. mass flow meter replacement)
2. Any unexplained problems with calibrations or audits (span, zero, 1-point QC check, or performance evaluation) that make calibrator output concentrations questionable
3. Replacement of the certified NO gas cylinder, associated with a portable gas calibrator, with a new cylinder
4. The gas blending system or the gas cylinder have exceeded its certification period.
5.0 Analyzer CalibrationsAll NO/NO2/NOX and NO/NO2/NOY analyzers must be calibrated at least once every six (6) months.
5.1 Analyzer Calibration Procedures for Automated SystemsThe automated calibration procedures for LEADS connected analyzers are outlined in the IPS MeteoStar Indiana LEADS Manual, Chapters 2, 3, and 4. A technical standard operating procedure, Nitrogen Oxide, Nitrogen Dioxide, and Oxides of Nitrogen Calibration with LEADS System S-106-OAQ-AMB-AM-13-T-R0, provides more in-depth information on using LEADS for chemiluminescence NO/NO2/NOX calibration.
5.2 Analyzer Calibration Procedures for non-Automated SystemsThe calibration of a NO/NO2/NOX analyzer actually involves performing three calibrations; one calibration for each of the analyzer's three channels (refer to Form 1). While the NO and NOXchannels can be calibrated simultaneously, a typical GPT calibration may take 3 to 4 hours to complete. Because the principle, equipment, and procedures used to calibrate the NOYinstrument are similar to that of NO/NO2/NOX instruments, the procedures for the calibration of the NO/NO2/NOY analyzer are the same as the NO/NO2/NOX analyzer. The NOX response is replaced with the NOY response, when referring to the NO/NO2/NOY analyzer calibration (see Forms 1 and 2).
The calibrated NO and NOX channels of the analyzer indirectly determine NO2 concentrations (see Equation 5-2). Therefore, the NO and NOX channels must first be calibrated accurately in order to accurately determine NO2.
A span/1-point quality control audit must be conducted prior to any routine recalibration and/orprior to any analyzer adjustments. The purpose of the audit is to determine the validity of the data from the previous audit or calibration to the present audit.
Chapter 5 Continuous Monitoring of Oxides of NitrogenRevision No. 12
December 31, 2017Page 15 of 53
5.3 NO and NOX (NOY) Calibration ProceduresGPT techniques require calibrated NO and NOX channels of the analyzer to determine the amount of NO2 generated through titration prior to calibrating the NO2 channel. When titrating NO with O3, the changes in the calibrated NO channel determine the NO2 concentrations. The calibrated NO and NOX (NOY) channels of the analyzer will then indirectly determine NO2concentrations using Equation 5-2.
Prior to any analyzer adjustments and analyzer calibration, a span/1-point quality control check must be performed. This will verify if the analyzer was collecting valid data prior to any analyzer adjustments or calibration.
During the calibration, the analyzer must be operating in its normal sampling mode. The calibration gas must pass through all filters, scrubbers, conditioners, and other components used during the normal ambient sampling mode. Any operational adjustments to the analyzer (i.e. sample flow, PMT voltages, converter replacement, etc.) must be completed prior to the calibration.
Record all pertinent information on the calibration forms (refer to Forms 1 & 2) or a pre-defined electronic log form provided by the data logger vendor.
1. Record the station name and the AQS (Air Quality System) site identification number on the calibration form.
2. Record the date of the calibration and the identity of the person performing the calibration (initials).
3. Record the analyzer's manufacturer name (brand), model number, and serial number.
4. Record the analyzer's range, span, and zero coefficients prior to any adjustments.
5. Record the GPT system (calibrator) manufacturer name, model number, and serial number.
6. Record the NO calibration gas cylinder number, the certified concentration, and the certification date. All certified gas cylinders must be traceable to a National Institute of Standards and Technology (NIST) Standard Reference Material (SRM). See Chapter 6 of this manual for traceability/certification procedures.
Note: Do not use cylinders with pressures < 200 psig (pounds per square inch gauge) as gases may become unstable at low pressures and cause calibration errors.
7. Use the NO/NOX (NOY) Calibration Data section of the calibration forms (Forms 1 or 2) to record the information.
Note: Select a range for which the analyzer has been designated as an USEPA
Chapter 5 Continuous Monitoring of Oxides of NitrogenRevision No. 12
December 31, 2017Page 16 of 53
reference method. Most analyzers, except for trace level analyzers, are calibrated in the 0 to 0.5 ppm range. Refer to the analyzer's manual for designated ranges. The NOY analyzer can be run at any range that it is capable of and that meets themonitoring needs.
8. Confirm that the analyzer is connected to a recording device such as a data acquisition system (DAS), a strip chart recorder, and/or a digital voltmeter. Since the analyzer will have three output voltage connections (for NO, NO2, and NOX (NOY)), label or be able to differentiate between the three outputs. A +5% offset of the strip chart recorder is recommended to facilitate observing any negative zero drift.
9. Adjust the flow of the diluent air (zero air) on the calibrator so that its total output flow exceeds the total demand of the analyzer(s) by at least 25%. The excess flow from the calibrator is necessary to ensure that the analyzer pump has a sufficient amount of sampleflow. If not, the analyzer could draw air from other than the desired sample stream.
Example: If the analyzer flow demand is 1.00 liters per minute (l/min), the total output flow from the calibrator should be greater than 1.25 l/min.
10. Connect the analyzer's “sample in” port to the “sample out” port of the calibrator using a vented nonreactive (TFE Teflon) sample line/manifold. For the NOY hookup, the calibrator “sample out” line is connected to the inlet at the converter box.
Warning: The sample gas must be delivered to the analyzer at atmospheric pressure. Unvented sample gas could pressurize & damage the analyzer. A manifold or tee vent must be used from the calibrator so that excess sample flow can be vented. For the NOY calibration connection, no manifold or tee vent is used.
11. Allow the analyzer to sample zero air until NO, NOX (NOY), and NO2 responses have stabilized (usually 10 to 20 minutes). After the responses have stabilized, adjust the analyzer zero control(s) to the desired zero value. If using a chart recorder, adjust the zero to the desired zero offset.
12. Record the stable zero air analyzer response for NO, NOX (NOY), and NO2 on the calibration form.
13. Attach a stainless steel regulator to the NO gas calibration cylinder. The regulator must be purged of all air before proceeding with the calibration (see Section 7.0). Atmospheric oxygen in the regulator will react with NO to form unwanted NO2 in the gas stream;moisture in the air can react with the NO2 impurity to form small quantities of nitrous acid.
14. Adjust the NO flow, from the GPT dilution system (calibrator), to generate a concentration of approximately 90% of the upper range limit (URL) of the NO channel. Example: For an analyzer set on a 0.5 ppm range 90% of the URL would be 0.450 ppm.
Chapter 5 Continuous Monitoring of Oxides of NitrogenRevision No. 12
December 31, 2017Page 17 of 53
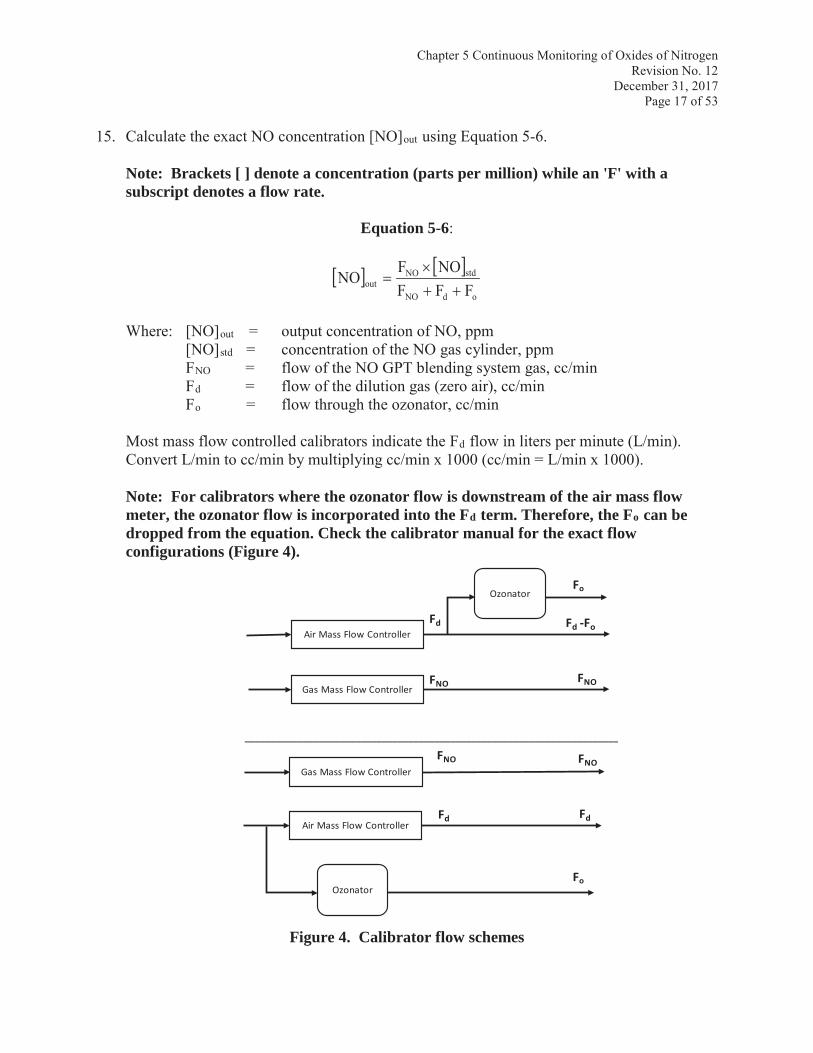
15. Calculate the exact NO concentration [NO]out using Equation 5-6.
Note: Brackets [ ] denote a concentration (parts per million) while an 'F' with a subscript denotes a flow rate.
Equation 5-6:
odNO
stdNOout FFF
NOFNO
Where: [NO]out = output concentration of NO, ppm[NO]std = concentration of the NO gas cylinder, ppmFNO = flow of the NO GPT blending system gas, cc/minFd = flow of the dilution gas (zero air), cc/minFo = flow through the ozonator, cc/min
Most mass flow controlled calibrators indicate the Fd flow in liters per minute (L/min). Convert L/min to cc/min by multiplying cc/min x 1000 (cc/min = L/min x 1000).
Note: For calibrators where the ozonator flow is downstream of the air mass flow meter, the ozonator flow is incorporated into the Fd term. Therefore, the Fo can be dropped from the equation. Check the calibrator manual for the exact flow configurations (Figure 4).
Fo
_______________________________________________________________________
Fo
Ozonator
Ozonator
Fd
FNO
Fd -Fo
FNO
FNO FNO
Fd Fd
Figure 4. Calibrator flow schemes
Chapter 5 Continuous Monitoring of Oxides of NitrogenRevision No. 12
December 31, 2017Page 18 of 53
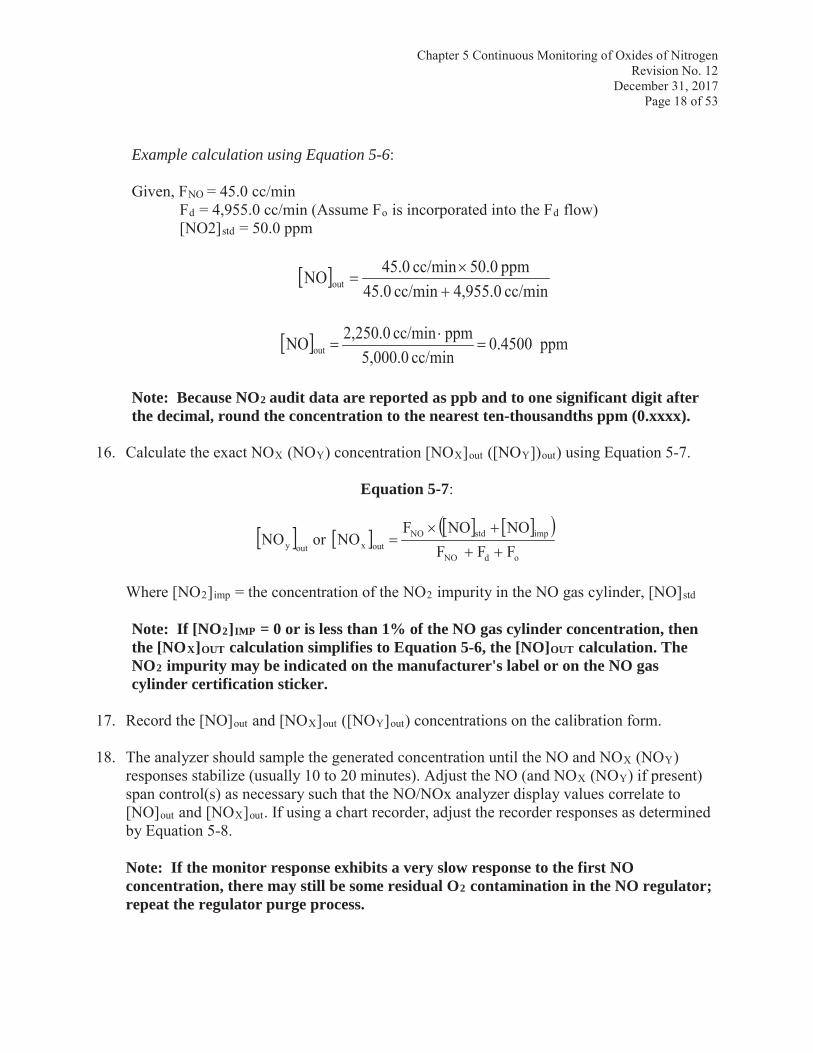
Example calculation using Equation 5-6:
Given, FNO = 45.0 cc/minFd = 4,955.0 cc/min (Assume Fo is incorporated into the Fd flow)[NO2]std = 50.0 ppm
cc/min4,955.0cc/min 45.0ppm50.0cc/min 45.0NO out
ppm0.4500cc/min5,000.0
ppmcc/min2,250.0NO out
Note: Because NO2 audit data are reported as ppb and to one significant digit after the decimal, round the concentration to the nearest ten-thousandths ppm (0.xxxx).
16. Calculate the exact NOX (NOY) concentration [NOX]out ([NOY])out) using Equation 5-7.
Equation 5-7:
odNO
impstdNOoutxouty F FF
NONOFNOorNO
Where [NO2]imp = the concentration of the NO2 impurity in the NO gas cylinder, [NO]std
Note: If [NO2]IMP = 0 or is less than 1% of the NO gas cylinder concentration, then the [NOX]OUT calculation simplifies to Equation 5-6, the [NO]OUT calculation. The NO2 impurity may be indicated on the manufacturer's label or on the NO gas cylinder certification sticker.
17. Record the [NO]out and [NOX]out ([NOY]out) concentrations on the calibration form.
18. The analyzer should sample the generated concentration until the NO and NOX (NOY)responses stabilize (usually 10 to 20 minutes). Adjust the NO (and NOX (NOY) if present) span control(s) as necessary such that the NO/NOx analyzer display values correlate to [NO]out and [NOX]out. If using a chart recorder, adjust the recorder responses as determined by Equation 5-8.
Note: If the monitor response exhibits a very slow response to the first NO concentration, there may still be some residual O2 contamination in the NO regulator; repeat the regulator purge process.
Chapter 5 Continuous Monitoring of Oxides of NitrogenRevision No. 12
December 31, 2017Page 19 of 53
Equation 5-8:
Desired Recorder Response (% of scale) = NOZ100%URL
][NO
Where: URL = upper range limit of the NO channelZNO = recorder response of the NO channel zero
19. After setting the zero and NO/NOX (NOY) span concentrations, determine at least three mid-level concentrations between the zero and span concentrations. Repeat steps 14 through 18 for the listed concentrations, without any further adjustments to the analyzer.
For example, a typical NO/NOX (NOY) calibration with a URL of 0.5 ppm may consist of (listed in order that they should be run):
a. 0.000 ppm (zero)b. 0.400 to 0.450 ppm (span)c. 0.300 to 0.350 ppm (mid-level)d. 0.200 to 0.250 ppm (mid-level)e. 0.100 to 0.150 ppm (mid-level)
These additional concentrations can be generated by either increasing the calibration dilution flow (Fd) or by decreasing the NO cylinder gas flow (FNO) or both. For each concentration generated, calculate the exact NO and NOX (NOY) concentrations using Equations 5-6 and 5-7. Record the required information on the NO/NOX (NOY) calibration data section on the calibration form.
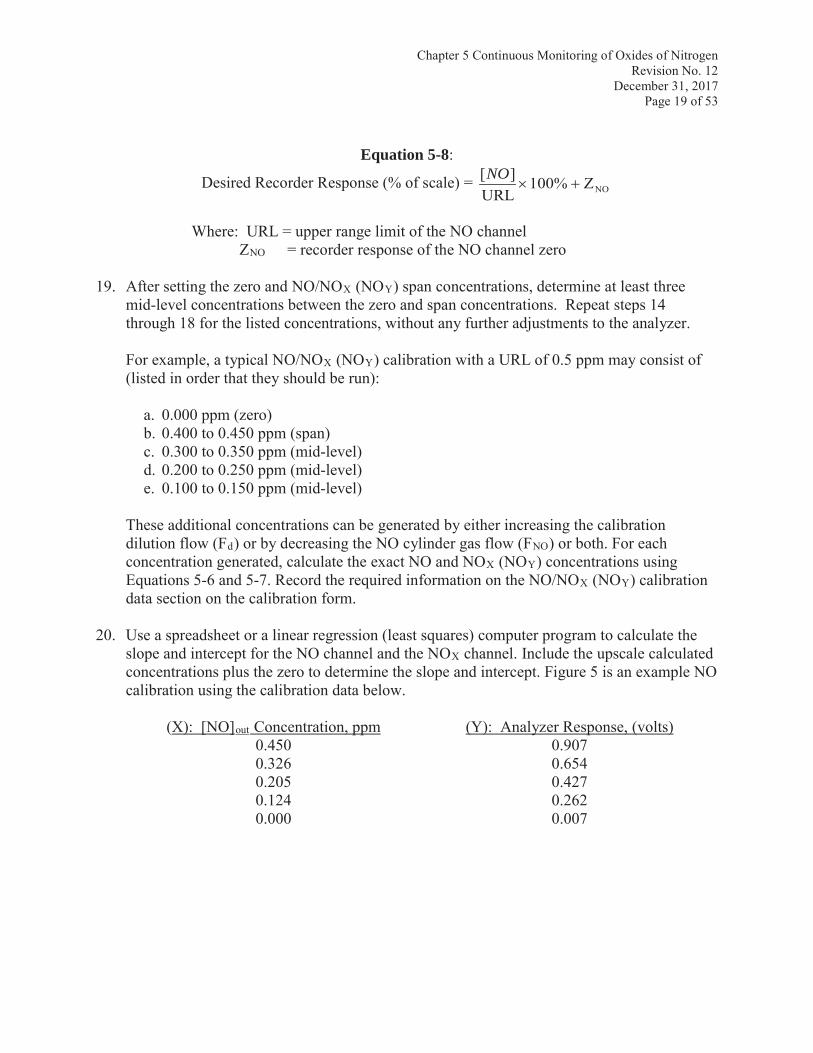
20. Use a spreadsheet or a linear regression (least squares) computer program to calculate the slope and intercept for the NO channel and the NOX channel. Include the upscale calculated concentrations plus the zero to determine the slope and intercept. Figure 5 is an example NO calibration using the calibration data below.
(X): [NO]out Concentration, ppm (Y): Analyzer Response, (volts)0.450 0.9070.326 0.6540.205 0.4270.124 0.2620.000 0.007
Chapter 5 Continuous Monitoring of Oxides of NitrogenRevision No. 12
December 31, 2017Page 20 of 53
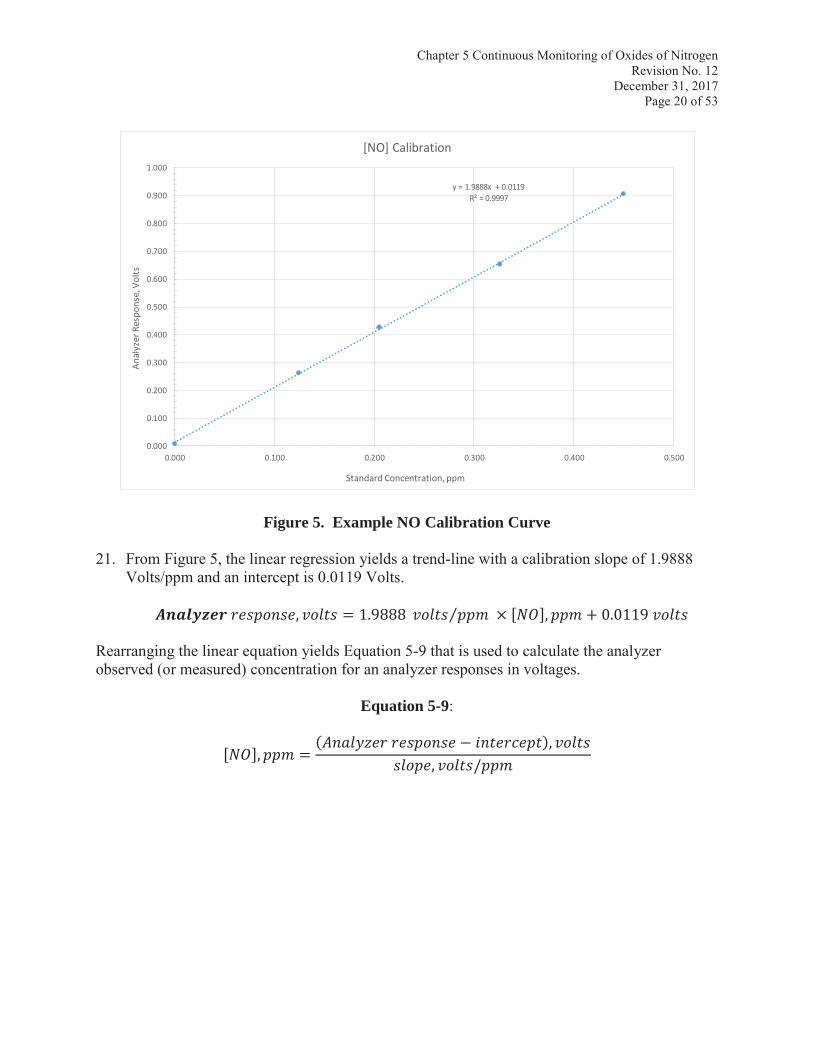
Figure 5. Example NO Calibration Curve
21. From Figure 5, the linear regression yields a trend-line with a calibration slope of 1.9888 Volts/ppm and an intercept is 0.0119 Volts. , = 1.9888 × [ ], + 0.0119
Rearranging the linear equation yields Equation 5-9 that is used to calculate the analyzer observed (or measured) concentration for an analyzer responses in voltages.
Equation 5-9:
[ ], = ( ),, /
Chapter 5 Continuous Monitoring of Oxides of NitrogenRevision No. 12
December 31, 2017Page 21 of 53
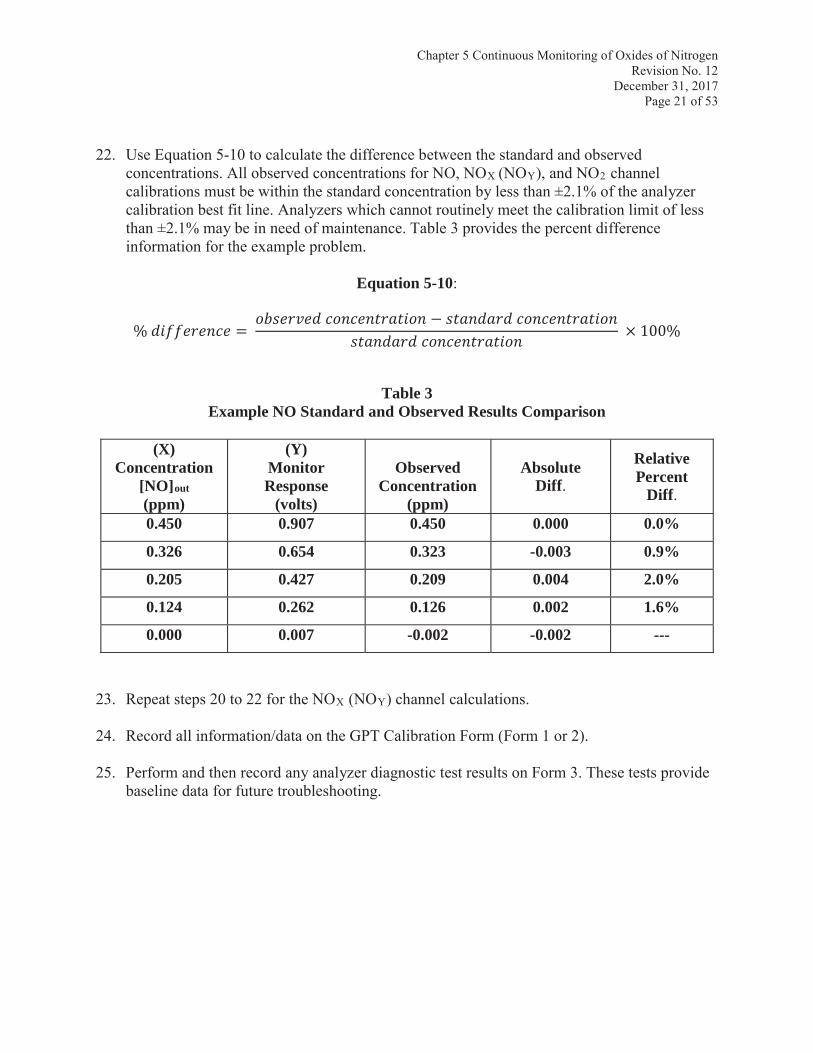
22. Use Equation 5-10 to calculate the difference between the standard and observed concentrations. All observed concentrations for NO, NOX (NOY), and NO2 channel calibrations must be within the standard concentration by less than ±2.1% of the analyzer calibration best fit line. Analyzers which cannot routinely meet the calibration limit of less than ±2.1% may be in need of maintenance. Table 3 provides the percent difference information for the example problem.
Equation 5-10:
% = × 100%Table 3
Example NO Standard and Observed Results Comparison
(X)Concentration
[NO]out
(ppm)
(Y)Monitor Response
(volts)
Observed Concentration
(ppm)
AbsoluteDiff.
RelativePercent
Diff.
0.450 0.907 0.450 0.000 0.0%
0.326 0.654 0.323 -0.003 0.9%
0.205 0.427 0.209 0.004 2.0%
0.124 0.262 0.126 0.002 1.6%
0.000 0.007 -0.002 -0.002 ---
23. Repeat steps 20 to 22 for the NOX (NOY) channel calculations.
24. Record all information/data on the GPT Calibration Form (Form 1 or 2).
25. Perform and then record any analyzer diagnostic test results on Form 3. These tests provide baseline data for future troubleshooting.
Chapter 5 Continuous Monitoring of Oxides of NitrogenRevision No. 12
December 31, 2017Page 22 of 53
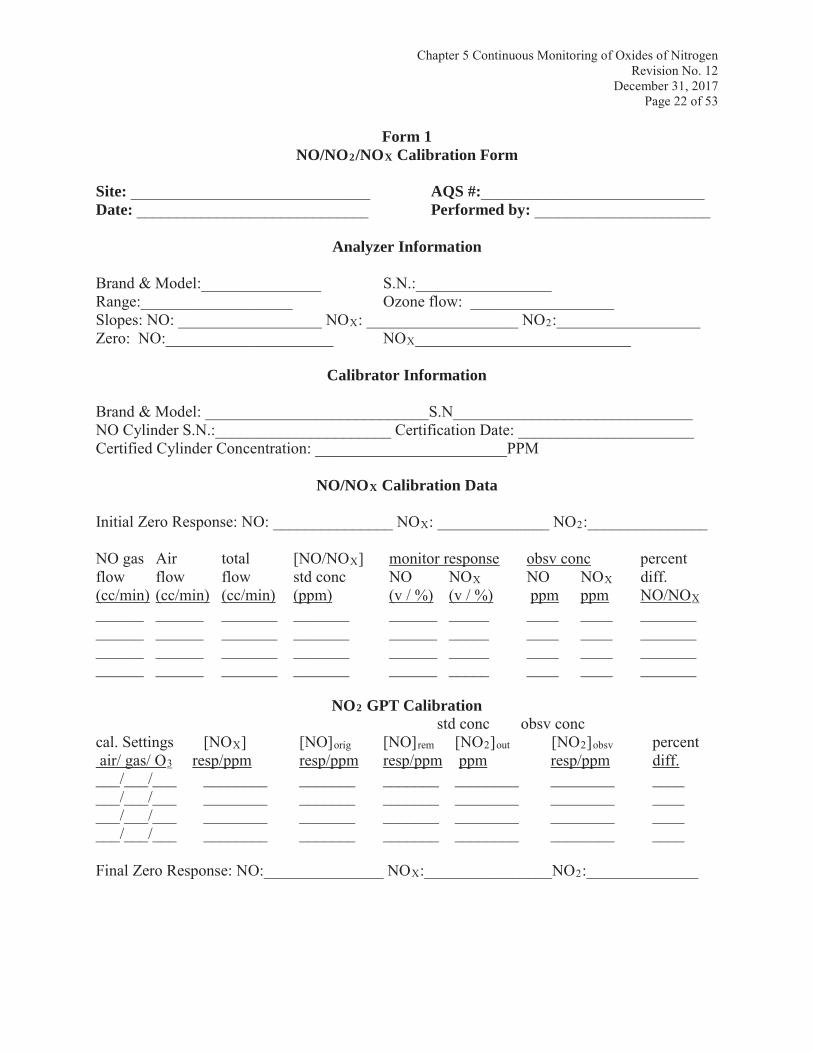
Form 1NO/NO2/NOX Calibration Form
Site: ______________________________ AQS #:____________________________Date: _____________________________ Performed by: ______________________
Analyzer Information
Brand & Model:_______________ S.N.:_________________Range:___________________ Ozone flow: __________________Slopes: NO: __________________ NOX: ___________________ NO2:__________________Zero: NO:_____________________ NOX___________________________
Calibrator Information
Brand & Model: ____________________________S.N______________________________NO Cylinder S.N.:______________________ Certification Date: ______________________Certified Cylinder Concentration: ________________________PPM
NO/NOX Calibration Data
Initial Zero Response: NO: _______________ NOX: ______________ NO2:_______________
NO gas Air total [NO/NOX] monitor response obsv conc percentflow flow flow std conc NO NOX NO NOX diff.(cc/min) (cc/min) (cc/min) (ppm) (v / %) (v / %) ppm ppm NO/NOX______ ______ _______ _______ ______ _____ ____ ____ _____________ ______ _______ _______ ______ _____ ____ ____ _____________ ______ _______ _______ ______ _____ ____ ____ _____________ ______ _______ _______ ______ _____ ____ ____ _______
NO2 GPT Calibrationstd conc obsv conc
cal. Settings [NOX] [NO]orig [NO]rem [NO2]out [NO2]obsv percentair/ gas/ O3 resp/ppm resp/ppm resp/ppm ppm resp/ppm diff.
___/___/___ ________ _______ _______ ________ ________ _______/___/___ ________ _______ _______ ________ ________ _______/___/___ ________ _______ _______ ________ ________ _______/___/___ ________ _______ _______ ________ ________ ____
Final Zero Response: NO:_______________ NOX:________________NO2:______________
Chapter 5 Continuous Monitoring of Oxides of NitrogenRevision No. 12
December 31, 2017Page 23 of 53
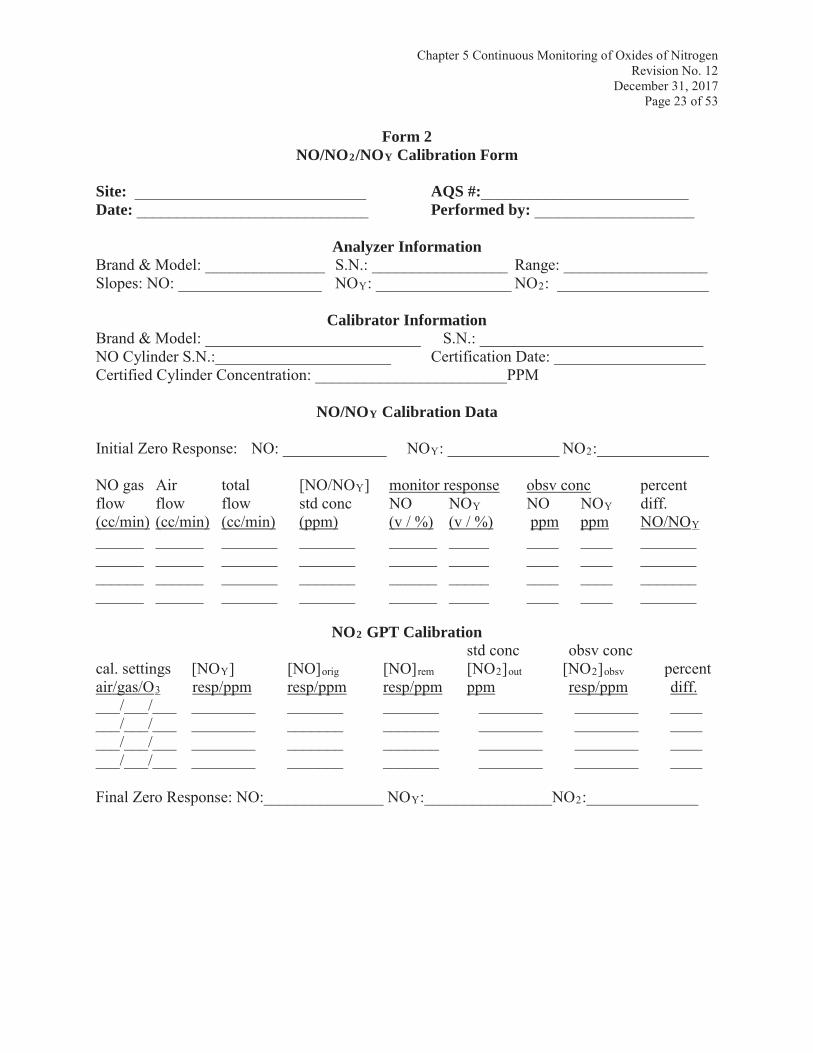
Form 2NO/NO2/NOY Calibration Form
Site: _____________________________ AQS #:__________________________Date: _____________________________ Performed by: ____________________
Analyzer InformationBrand & Model: _______________ S.N.: _________________ Range: __________________Slopes: NO: __________________ NOY: _________________ NO2: ___________________
Calibrator InformationBrand & Model: ___________________________ S.N.: ____________________________NO Cylinder S.N.:______________________ Certification Date: ___________________Certified Cylinder Concentration: ________________________PPM
NO/NOY Calibration Data
Initial Zero Response: NO: _____________ NOY: ______________ NO2:______________
NO gas Air total [NO/NOY] monitor response obsv conc percentflow flow flow std conc NO NOY NO NOY diff.(cc/min) (cc/min) (cc/min) (ppm) (v / %) (v / %) ppm ppm NO/NOY______ ______ _______ _______ ______ _____ ____ ____ _____________ ______ _______ _______ ______ _____ ____ ____ _____________ ______ _______ _______ ______ _____ ____ ____ _____________ ______ _______ _______ ______ _____ ____ ____ _______
NO2 GPT Calibrationstd conc obsv conc
cal. settings [NOY] [NO]orig [NO]rem [NO2]out [NO2]obsv percentair/gas/O3 resp/ppm resp/ppm resp/ppm ppm resp/ppm diff. ___/___/___ ________ _______ _______ ________ ________ _______/___/___ ________ _______ _______ ________ ________ _______/___/___ ________ _______ _______ ________ ________ _______/___/___ ________ _______ _______ ________ ________ ____
Final Zero Response: NO:_______________ NOY:________________NO2:______________
Chapter 5 Continuous Monitoring of Oxides of NitrogenRevision No. 12
December 31, 2017Page 24 of 53
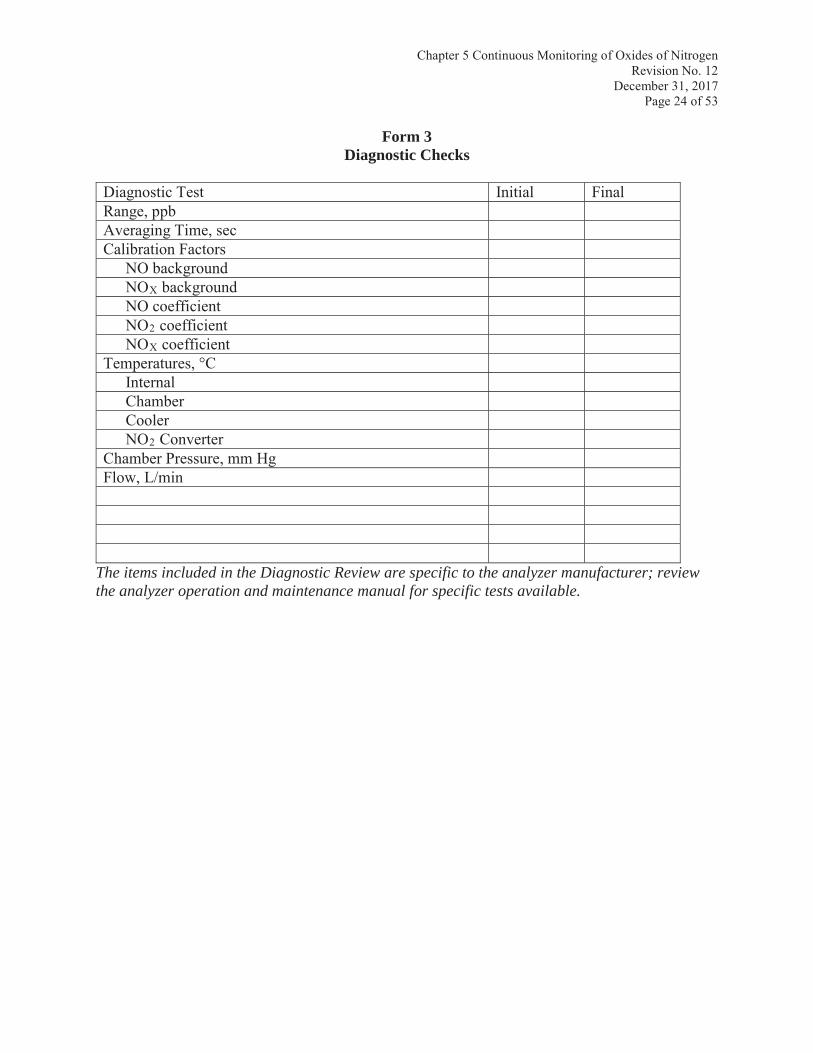
Form 3Diagnostic Checks
Diagnostic Test Initial FinalRange, ppbAveraging Time, secCalibration Factors
NO backgroundNOX backgroundNO coefficientNO2 coefficientNOX coefficient
Temperatures, °CInternalChamberCoolerNO2 Converter
Chamber Pressure, mm HgFlow, L/min
The items included in the Diagnostic Review are specific to the analyzer manufacturer; review the analyzer operation and maintenance manual for specific tests available.
Chapter 5 Continuous Monitoring of Oxides of NitrogenRevision No. 12
December 31, 2017Page 25 of 53
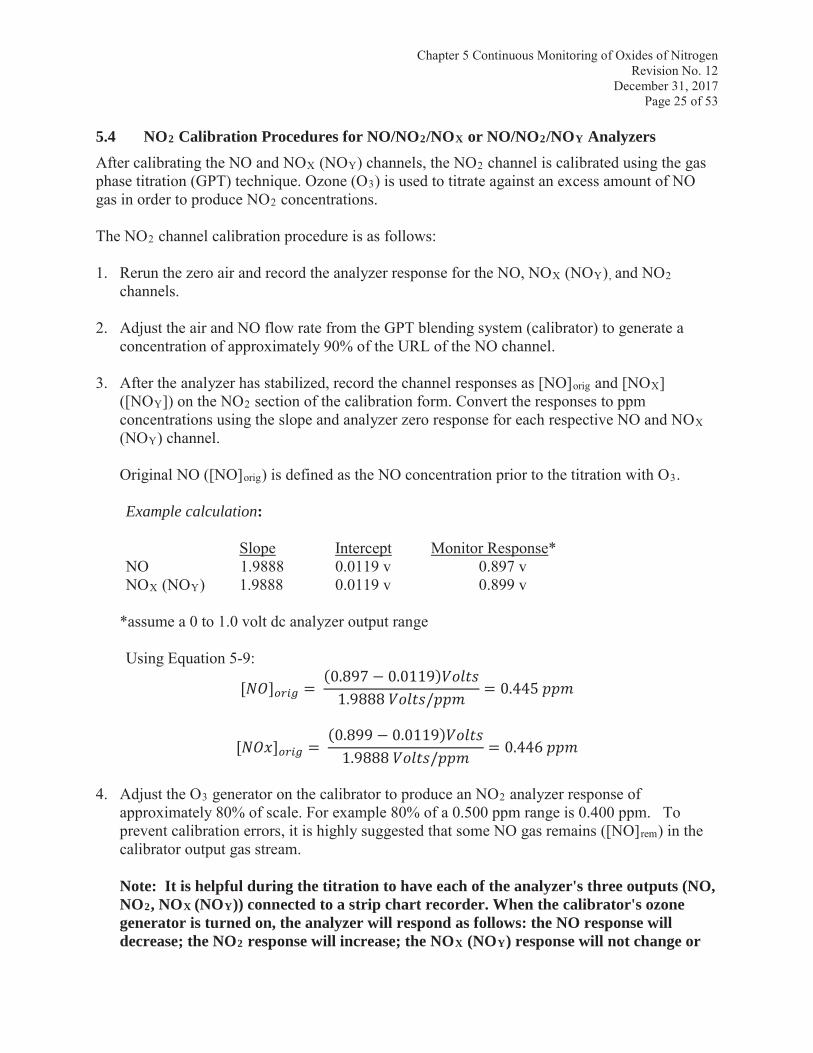
5.4 NO2 Calibration Procedures for NO/NO2/NOX or NO/NO2/NOY AnalyzersAfter calibrating the NO and NOX (NOY) channels, the NO2 channel is calibrated using the gas phase titration (GPT) technique. Ozone (O3) is used to titrate against an excess amount of NO gas in order to produce NO2 concentrations.
The NO2 channel calibration procedure is as follows:
1. Rerun the zero air and record the analyzer response for the NO, NOX (NOY), and NO2channels.
2. Adjust the air and NO flow rate from the GPT blending system (calibrator) to generate a concentration of approximately 90% of the URL of the NO channel.
3. After the analyzer has stabilized, record the channel responses as [NO]orig and [NOX]([NOY]) on the NO2 section of the calibration form. Convert the responses to ppm concentrations using the slope and analyzer zero response for each respective NO and NOX(NOY) channel.
Original NO ([NO]orig) is defined as the NO concentration prior to the titration with O3.
Example calculation:
Slope Intercept Monitor Response*NO 1.9888 0.0119 v 0.897 vNOX (NOY) 1.9888 0.0119 v 0.899 v
*assume a 0 to 1.0 volt dc analyzer output range
Using Equation 5-9:[ ] = (0.897 0.0119)1.9888 / = 0.445 [ ] = (0.899 0.0119)1.9888 / = 0.446
4. Adjust the O3 generator on the calibrator to produce an NO2 analyzer response of approximately 80% of scale. For example 80% of a 0.500 ppm range is 0.400 ppm. To prevent calibration errors, it is highly suggested that some NO gas remains ([NO]rem) in the calibrator output gas stream.
Note: It is helpful during the titration to have each of the analyzer's three outputs (NO, NO2, NOX (NOY)) connected to a strip chart recorder. When the calibrator's ozone generator is turned on, the analyzer will respond as follows: the NO response will decrease; the NO2 response will increase; the NOX (NOY) response will not change or
Chapter 5 Continuous Monitoring of Oxides of NitrogenRevision No. 12
December 31, 2017Page 26 of 53
the response may decrease slightly.
5. After the analyzer's responses have stabilized (usually 15 to 20 minutes), record the analyzer responses for [NO]rem, [NOX]([NOY]), and [NO2]meas in mV, V, or % chart. Refer to the NO2 section of the calibration form (Form 1 or 2).
Remaining NO, [NO]rem, is defined as the concentration of NO remaining after titration with ozone.
Measured or observed NO2, [NO2]meas, is defined as the nitrogen dioxide concentration calculated from the analyzer's response to the NO2 channel.
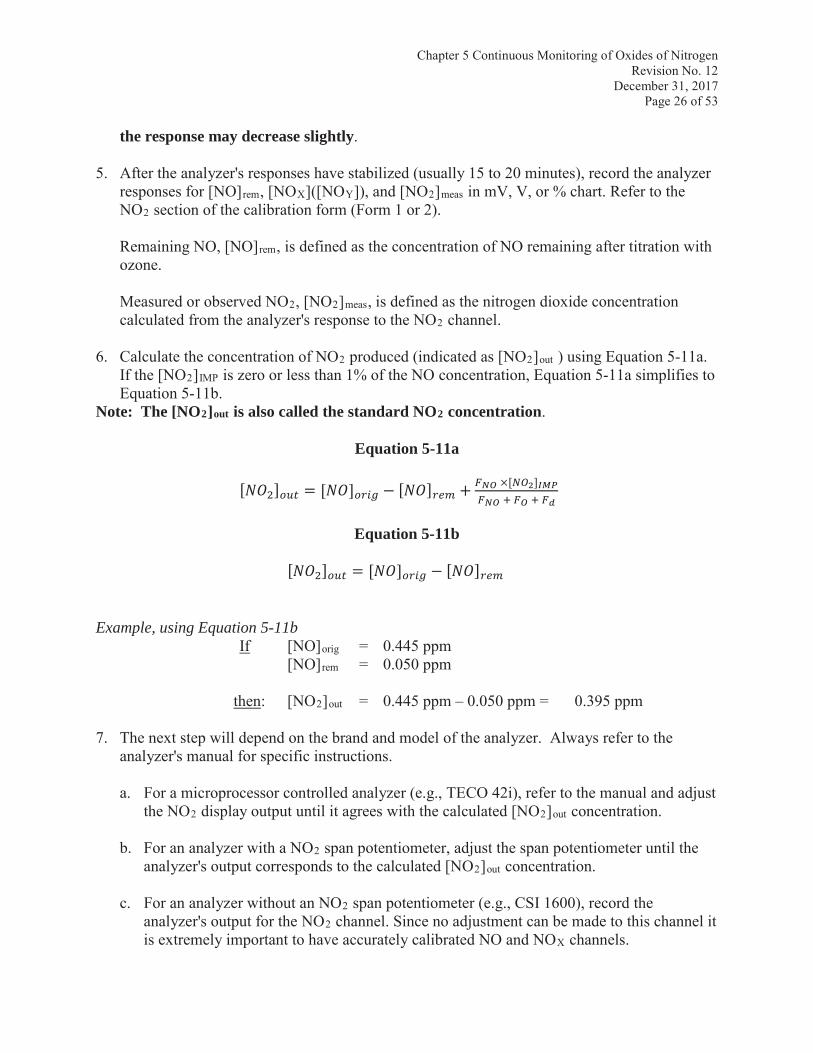
6. Calculate the concentration of NO2 produced (indicated as [NO2]out ) using Equation 5-11a.If the [NO2]IMP is zero or less than 1% of the NO concentration, Equation 5-11a simplifies to Equation 5-11b.
Note: The [NO2]out is also called the standard NO2 concentration.
Equation 5-11a[ ] = [ ] [ ] + ×[ ] Equation 5-11b[ ] = [ ] [ ]
Example, using Equation 5-11bIf [NO]orig = 0.445 ppm
[NO]rem = 0.050 ppm
then: [NO2]out = 0.445 ppm – 0.050 ppm = 0.395 ppm
7. The next step will depend on the brand and model of the analyzer. Always refer to the analyzer's manual for specific instructions.
a. For a microprocessor controlled analyzer (e.g., TECO 42i), refer to the manual and adjust the NO2 display output until it agrees with the calculated [NO2]out concentration.
b. For an analyzer with a NO2 span potentiometer, adjust the span potentiometer until the analyzer's output corresponds to the calculated [NO2]out concentration.
c. For an analyzer without an NO2 span potentiometer (e.g., CSI 1600), record the analyzer's output for the NO2 channel. Since no adjustment can be made to this channel it is extremely important to have accurately calibrated NO and NOX channels.
Chapter 5 Continuous Monitoring of Oxides of NitrogenRevision No. 12
December 31, 2017Page 27 of 53
8. Titrate at least three additional NO2 concentration, [NO2]out, by changing the ozonator output on the GPT blending system (calibrator). For each concentration calculate and record the following:
a. Analyzer response for the NO channel and calculated [NO]rem concentration
b. Analyzer response for the NOX (NOY) channel and the calculated [NOX]([NOY]) concentration
c. Analyzer response for the NO2 channel and the calculated [NO2]out concentration
A typical NO2 calibration will have points in the following ranges:
1. 0.0 ppm (zero)
2. 0.380 to 0.420 ppm (span)
3. 0.280 to 0.320 ppm (mid-level)
4. 0.180 to 0.220 ppm (mid-level)
5. 0.080 to 0.120 ppm (mid-level)
9. Use a spreadsheet or a computer program with a linear regression (least squares) program in order to calculate the slope and intercept for the NO2 channel. Include the upscale NO2concentrations [NO2]out, plus the monitor response for zero air in the linear regression.
10. For all NO2 upscale points, calculate the observed concentration, [NO2]meas, and the percent difference between the standard, [NO2]out, and the observed, [NO2]meas. Use Equations 5-9and 5-10.
11. All observed concentrations for NO2 must be within the corresponding standard concentrations of less than ±2.1% of the best fit line. If any observed concentration is found to be greater than ±2.1% of the best fit line, then rerun that concentration and recalculate thebest fit line and the percent differences.
Note: If the percent difference is greater than ±2%, the NO and/or the NOX channels may have drifted. If this is the case then the entire calibration, starting with the NO/NOX calibration, may have to be repeated.
12. The Code of Federal Regulations requires that all NO/NO2/NOX analyzers have a converter efficiency of at least 96%. Data from analyzers with a converter efficiency of less than 96% is considered invalid.
Chapter 5 Continuous Monitoring of Oxides of NitrogenRevision No. 12
December 31, 2017Page 28 of 53
Converter efficiency is defined as the percent of NO2 which is converted to NO so that the NOX (NOY) component can be measured by the analyzer.
Inefficient converters (< 96%) do not convert all of the NO2 to NO which results in a NOX(NOY) concentration biased low (Refer to Figure 1 for an analyzer diagram.). If the converter efficiency falls below 96%, then the converter must be replaced and the analyzer must then be recalibrated.
Converter efficiency must be calculated at the time of each calibration or audit. Section 6.1outlines this procedure.
Depending on the data acquisition system, the software may calculate an overall converter efficiency or a converter efficiency at each calibration level. LEADS calculates a converter efficiency of each calibration or span/1-point QC level.
13. After finishing an on-site calibration, complete the following steps:
a. Allow the analyzer to sample zero air for 10 – 15 minutes. Residual NO and NO2trapped in a calibrator can cause stability problems during the next calibration. Purge the calibrator with zero air after each calibration is completed
b. Reconnect the analyzer to the sample manifold
c. Ensure that the analyzer is in the monitor mode
d. Ensure that the analyzer is connected to all data recording devices and that all strip charts have been annotated. Thestrip charts should be annotated with the following information: site name, date, chart speed, calibration starting time, initials of the person performing the calibration, all responses with the applicable standard concentrations and the parameter, the initial and final zero, and the calibration ending time.
d. Record all pertinent calibration information in the site logbook
5.5 NO2 Direct Method Calibration ProceduresDirect method NO2 calibration techniques require either the use of
Gas blending system with NO2 gas cylinders, which have stability issues, application of a calibrated chemiluminescence NO/NO2/NOX analyzer to determine the NO2 concentration from a gas calibrator and NO gas standard, orNO2 permeation blending system.
This section details the calibration of direct method NO2 analyzers with NO2 gas cylinders. During the calibration, the analyzer must be operating in its normal sampling mode. The calibration gas must pass through all filters and as much of the sample line as possible as is used during the normal ambient sampling mode. Any operational adjustments to the analyzer (i.e.
Chapter 5 Continuous Monitoring of Oxides of NitrogenRevision No. 12
December 31, 2017Page 29 of 53
sample flow, detector voltages, etc.) must be completed prior to the calibration.
Note: A span/1-point quality control check must be performed prior to any analyzer adjustments and analyzer calibration. This will verify if the analyzer was collecting valid data prior to any analyzer adjustments or calibration.
Record all pertinent information on the calibration form (e.g., Form 4 or an equivalent).
Note: All direct measurement NO2 analyzers must be calibrated at least once every six (6) months.
1. Record the station name and the AQS (Air Quality System) site identification number on the calibration form.
2. Record the date of the calibration and the identity of the person performing the calibration (initials).
3. Record the analyzer's manufacturer name (brand), model number, and serial number.
4. Record the analyzer's range and span and zero coefficients prior to any adjustments.
5. Record the gas calibrator manufacturer name, model number, and serial number.
6. Record the NO2 calibration gas cylinder number, the certified concentration, and the certification date.
Note: Do not use cylinders with pressures < 200 psig (pounds per square inch gauge) as gases may become unstable at low pressures and cause calibration errors.
All NO2 gas cylinders must be traceable to a National Institute of Standards and Technology (NIST) Standard Reference Material (SRM). See Chapter 6 of this manual for traceability and certification procedures.
7. Use the NO2 Calibration Data section of the calibration form (Form 4) to record the analyzer and calibrator information.
Note: Select a range for which the analyzer has been designated as an USEPAreference method. Most analyzers, except for trace level analyzers, are calibrated in the 0 to 0.5 ppm range. Refer to the analyzer's manual for designated ranges.
8. Confirm that the analyzer is connected to a recording device such as a data acquisition system (DAS), a strip chart recorder, and/or a digital voltmeter
Note: Annotate all data recording devices (data acquisition system, strip chart recorder, etc.) with the audit starting date, site, parameter, initials, and time.
Chapter 5 Continuous Monitoring of Oxides of NitrogenRevision No. 12
December 31, 2017Page 30 of 53
9. Adjust the flow of the diluent air (zero air) on the calibrator so that its total output flow exceeds the total demand of the analyzer(s) by at least 25%. The excess flow from the calibrator is necessary to ensure that the analyzer has a sufficient amount of sample. If not, the analyzer could draw air from other than the desired sample stream.
10. Connect the analyzer's “sample in” port to the “sample out” port of the calibrator using a vented nonreactive (TFE Teflon) sample line/manifold.
Warning: The sample gas must be delivered to the analyzer at atmospheric pressure. unvented sample gas could pressurize & damage the analyzer. A manifold or tee vent must be used from the calibrator so that excess sample flow can be vented.
11. Allow the analyzer to sample zero air until NO2 responses have stabilized (usually 10 to 20 minutes). After the responses have stabilized, adjust the analyzer zero control(s) to the desired zero offset. If a strip chart is used to record the data, a +5% offset of the strip chart recorder is recommended to facilitate observing any negative zero drift.
12. Record the stable zero air analyzer response for NO2 on the calibration form.
13. Attach a stainless steel regulator to the NO2 gas calibration cylinder. The regulator must be purged of all air before proceeding with the calibration. (Refer to Section 7.0)
14. Adjust the NO2 flow from the gas dilution system (or calibrator) to generate a concentration of approximately 90% of the upper range limit (URL) of the NO2 analyzer.
Example: For an analyzer set on a 0.5 ppm range 90% of the URL would be 0.450 ppm.
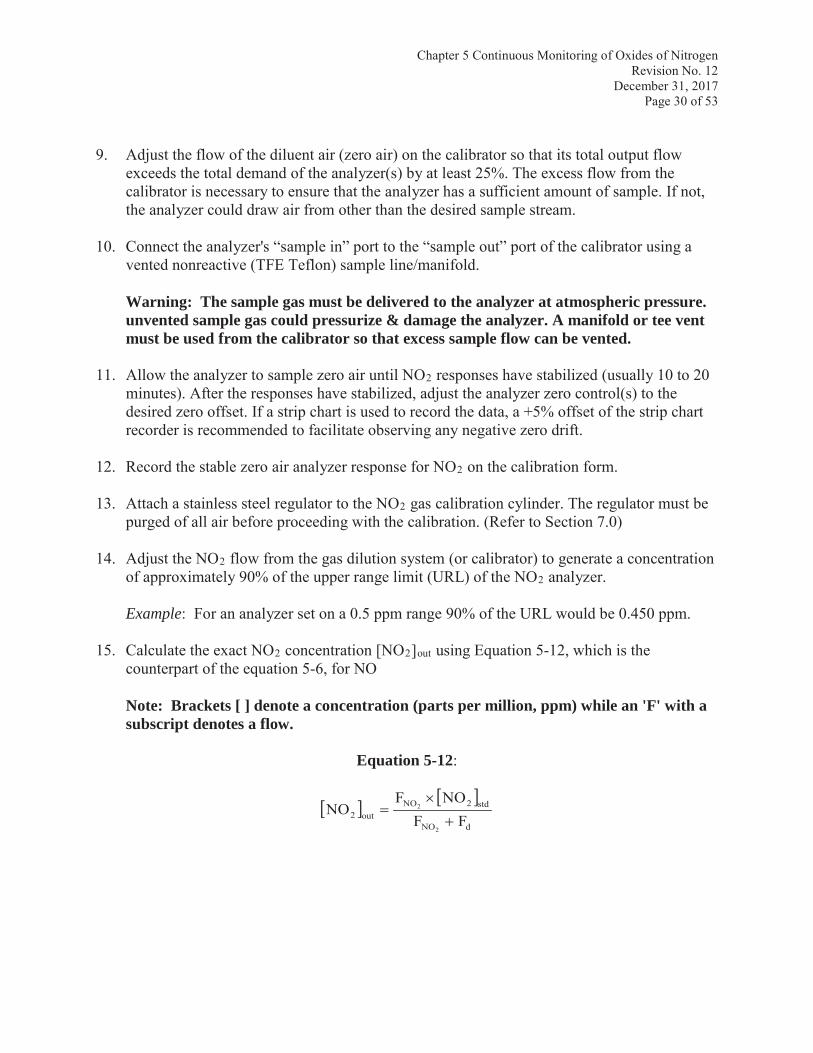
15. Calculate the exact NO2 concentration [NO2]out using Equation 5-12, which is the counterpart of the equation 5-6, for NO
Note: Brackets [ ] denote a concentration (parts per million, ppm) while an 'F' with a subscript denotes a flow.
Equation 5-12:
dNO
std2NOout2 FF
NOFNO
2
2
Chapter 5 Continuous Monitoring of Oxides of NitrogenRevision No. 12
December 31, 2017Page 31 of 53
Where: [NO2]out = output concentration of NO, ppm[NO2]std = concentration of the NO2 gas cylinder, ppmFNO2 = flow of the NO gas blending system gas, cc/minFd = flow of the dilution gas (zero air), cc/min (Most mass flow
controlled calibrators indicate the Fd flow in liters per minute (L/min). Convert L/min to cc/min by multiplying cc/min x 1000 (cc/min = L/min x 1000).
Note: Because data are reported as ppb to one significant digit after the decimal,round the concentration to the nearest ten-thousandths ppm (0.xxxx).
16. Record the [NO2]out concentration on the calibration form.
17. The analyzer should sample the generated concentration until the NO2 response is stable (usually 10 to 20 minutes). Adjust the NO2 span control to obtain an analyzer display response as determined by Equation 5-12. Record the analyzer response on the calibration form.
18. After setting the zero and NO2 span concentrations, determine at least three mid-level concentrations between the zero and span concentrations. Run these concentrations without any further adjustments to the analyzer.
For example, a typical NO2 calibration with a URL of 0.5 ppm would consist of (listed in order that they should be run):
a. 0.000 ppm (zero)b. 0.400 to 0.450 ppm (span)c. 0.300 to 0.350 ppm (mid-level)d. 0.200 to 0.250 ppm (mid-level)e. 0.100 to 0.150 ppm (mid-level)
These additional concentrations can be generated by either increasing the calibration dilution flow (Fd) and/or by decreasing the NO2 cylinder gas flow (FNO2). For each concentration generated, calculate the generated NO2 concentrations using Equation 5-12.Record the required information on the NO2 calibration data section on the calibration form.
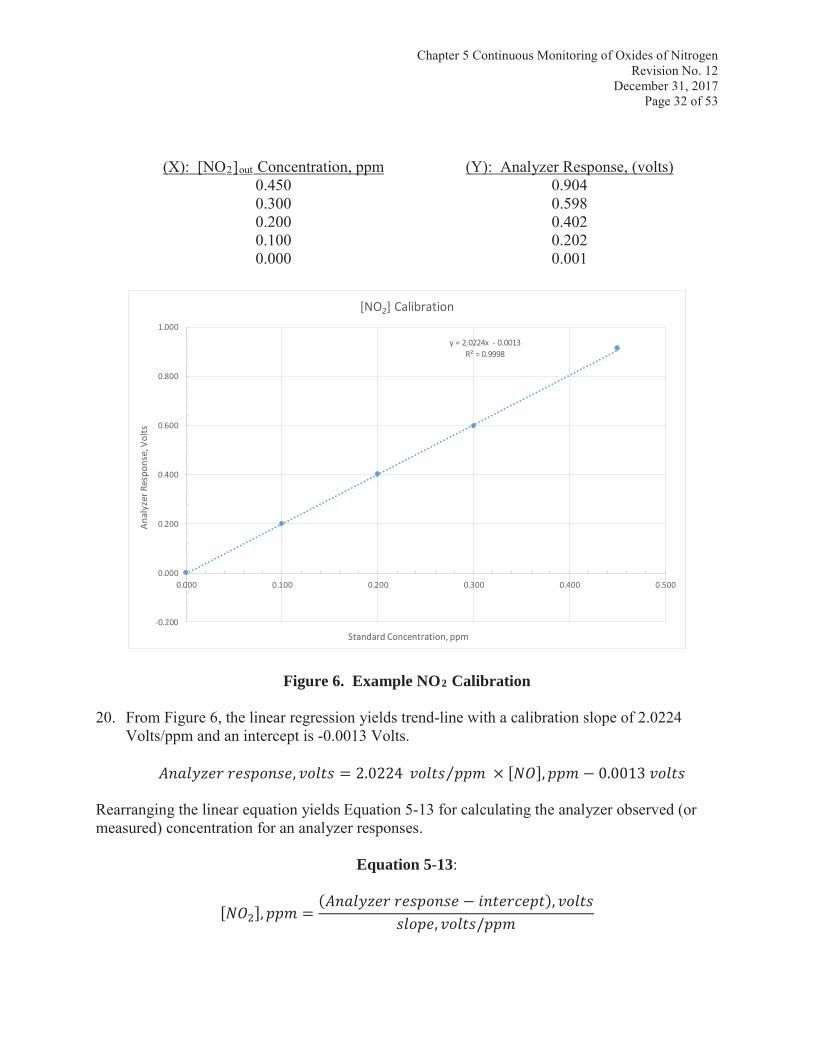
19. Use a spreadsheet or a linear regression (least squares) computer program to calculate the slope and intercept for the NO2 channel. Include the upscale calculated concentrations plus the zero to determine the slope and intercept. See Figure 6 for an example NO2 calibration for the below example calibration data.
Chapter 5 Continuous Monitoring of Oxides of NitrogenRevision No. 12
December 31, 2017Page 32 of 53
(X): [NO2]out Concentration, ppm (Y): Analyzer Response, (volts)0.450 0.9040.300 0.5980.200 0.4020.100 0.2020.000 0.001
-
[NO2
Figure 6. Example NO2 Calibration
20. From Figure 6, the linear regression yields trend-line with a calibration slope of 2.0224 Volts/ppm and an intercept is -0.0013 Volts. , = 2.0224 × [ ], 0.0013
Rearranging the linear equation yields Equation 5-13 for calculating the analyzer observed (or measured) concentration for an analyzer responses.
Equation 5-13:
[ ], = ( ),, /
Chapter 5 Continuous Monitoring of Oxides of NitrogenRevision No. 12
December 31, 2017Page 33 of 53
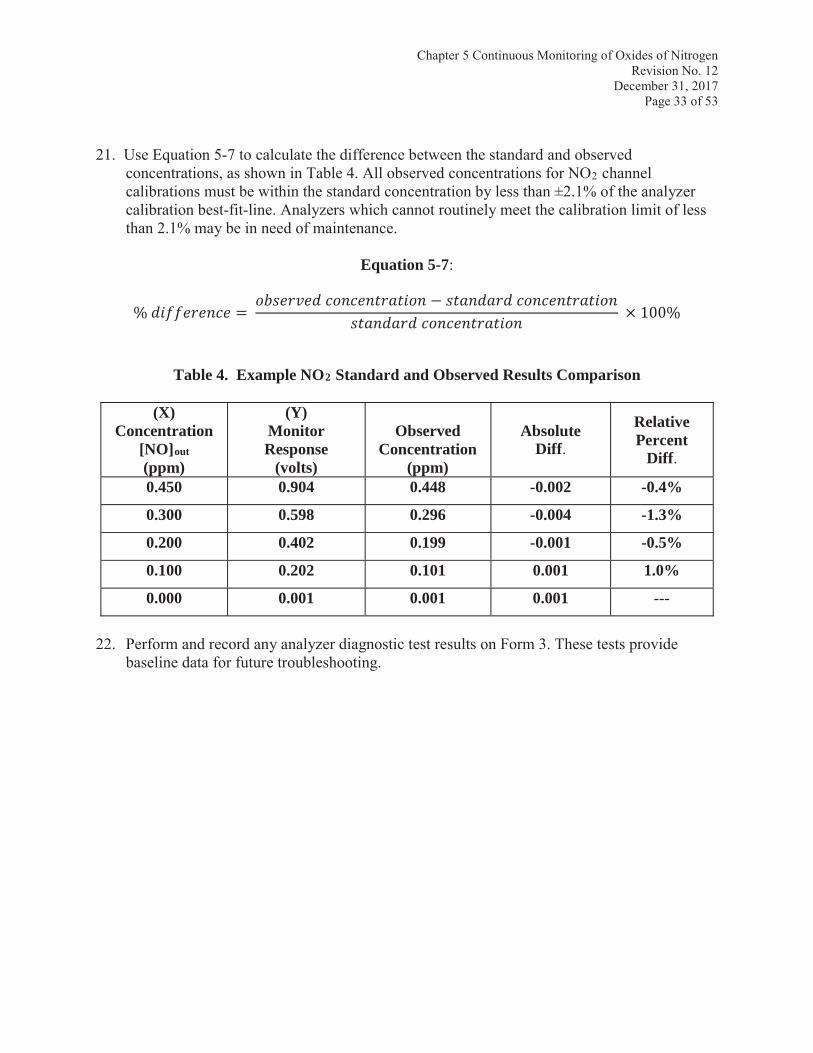
21. Use Equation 5-7 to calculate the difference between the standard and observed concentrations, as shown in Table 4. All observed concentrations for NO2 channel calibrations must be within the standard concentration by less than ±2.1% of the analyzer calibration best-fit-line. Analyzers which cannot routinely meet the calibration limit of less than 2.1% may be in need of maintenance.
Equation 5-7:
% = × 100%Table 4. Example NO2 Standard and Observed Results Comparison
(X)Concentration
[NO]out
(ppm)
(Y)Monitor Response
(volts)
Observed Concentration
(ppm)
AbsoluteDiff.
RelativePercent
Diff.
0.450 0.904 0.448 -0.002 -0.4%
0.300 0.598 0.296 -0.004 -1.3%
0.200 0.402 0.199 -0.001 -0.5%
0.100 0.202 0.101 0.001 1.0%
0.000 0.001 0.001 0.001 ---
22. Perform and record any analyzer diagnostic test results on Form 3. These tests provide baseline data for future troubleshooting.
Chapter 5 Continuous Monitoring of Oxides of NitrogenRevision No. 12
December 31, 2017Page 34 of 53
Form 4Direct Read NO2 Calibration Form
Site: ______________________________ AQS #:____________________________Date: _____________________________ Performed by: ______________________
Analyzer Information
Brand & Model:_______________ S.N.:_________________Range:___________________Slopes: NO2:__________________ Zero: NO2:_____________________
Calibrator Information
Brand & Model: ____________________________S.N______________________________NO2 Cylinder S.N.:______________________ Certification Date: ______________________Certified Cylinder Concentration: ________________________PPM
NO2 Calibration Data
Initial Zero Response: _______________
NO2 gas Air total [NO2] monitor response obsv conc percentflow flow flow std conc NO2 NO2 diff.(cc/min) (cc/min) (cc/min) (ppm) (v / %) ppm NO2______ ______ _______ _______ ___________ _______ _____________ ______ _______ _______ ___________ _______ _____________ ______ _______ _______ ___________ _______ _____________ ______ _______ _______ ___________ _______ _______
Final Zero Response: NO2:______________
Comments: ___________________________________________________________________________________________________________________________________________________________________________________________________________________________________________________________________________________________________________________________________________________________________________________________
Chapter 5 Continuous Monitoring of Oxides of NitrogenRevision No. 12
December 31, 2017Page 35 of 53
6.0 Converter Efficiency CalculationsThe converter efficiency is calculated from data generated from the upscale concentrations titrated during the NO2 portion of an analyzer calibration, span/1-point QC audit, or performance evaluation (Equation 5-14).
Equation 5-14:
[NO2]converted = [NO2]out – ([NOX]orig – [NOX]rem)
OR
[NO2]converted = [NO2]out – ([NOY]orig – [NOY]rem)
Where:[NO2]converted = the concentration (ppm) of NO2 converted by the analyzer's catalytic
converter[NO2]out = the standard concentration (ppm) of NO2 produced by the GPT blending
system[NOX]orig = the concentration (ppm) of NOX (original) before titration [NOX]rem = the concentration (ppm) of NOX (remaining) concentration after titration[NOY]orig = the concentration (ppm) of NOY (original) before titration[NOY]rem = the concentration (ppm) of NOY (remaining) concentration after titration
The required data for a converter efficiency calculation are: the [NOX]orig ([NOY]orig)concentration (prior to O3 titration), the [NOX]rem ([NOY]rem) concentrations (after O3 titration) and the [NO2]out concentrations.
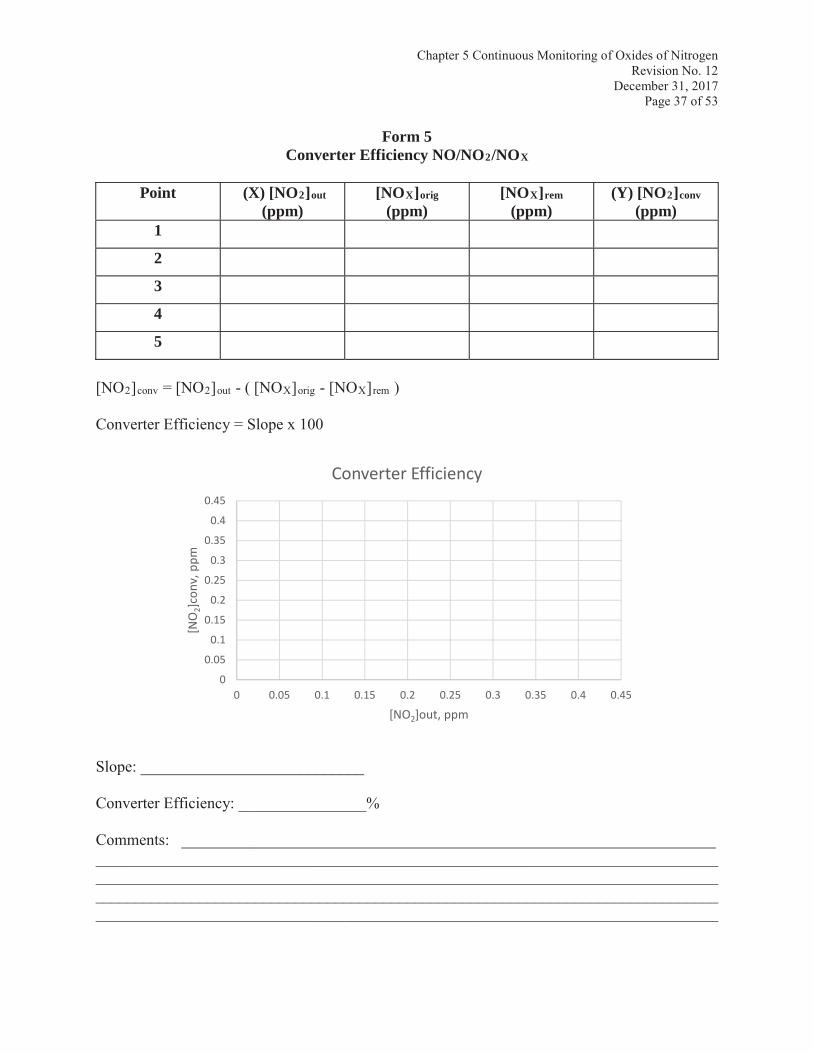
6.1 Calculation Procedure for Converter Efficiency1. Transfer the concentrations of [NO2]out, [NOX]orig ([NOY]orig), and [NOX]rem ([NOY]rem)
from the NO2 GPT data table (Form 1) to the Converter Efficiency data table (Form 5). Also include zero points ([NO2]out = 0 and [NO2]conv = 0) in the data table. For NOY, the concentrations will be transferred from Form 2 to Form 6.
2. Apply Equation 5-14 to calculate the [NO2]converted value.
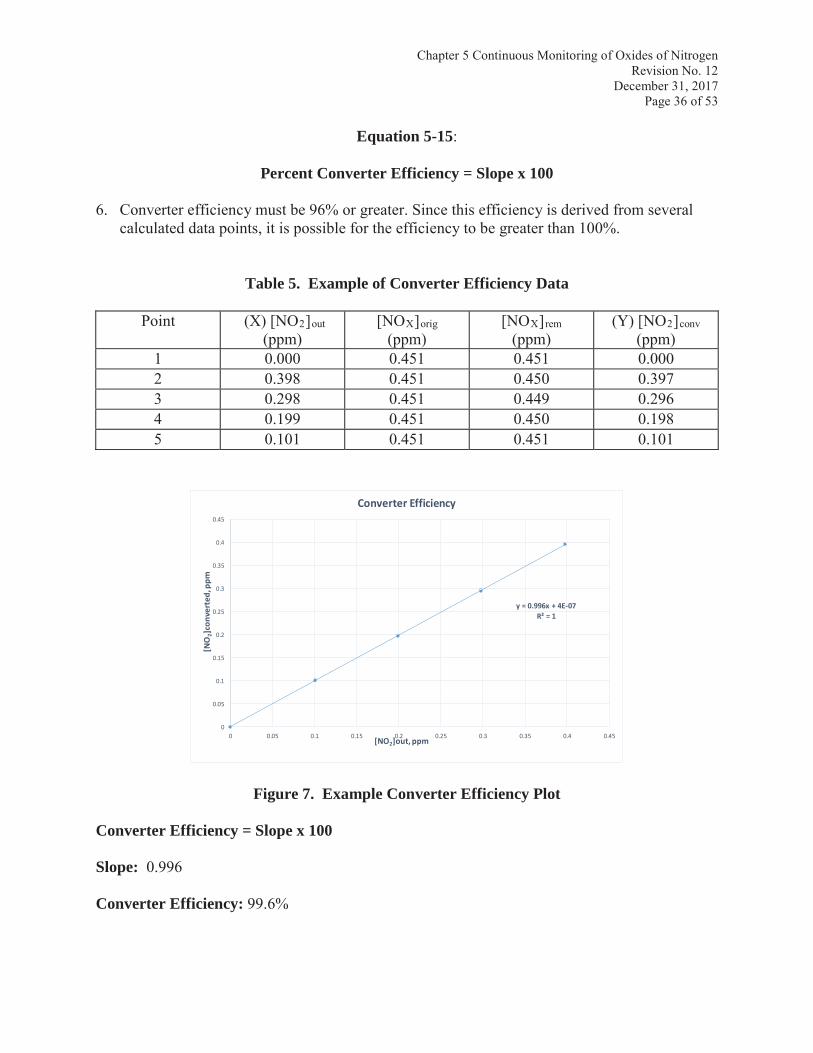
3. Using a spreadsheet (Example seen in Table 5 and Figure 7) or a linear regression (least squares) program, enter the [NO2]out on the x-axis and the [NO2]conv on the y-axis.
4. Use the upscale data sets plus the zero value to determine a linear trend line through the data.
5. Percent converter efficiency is defined by Equation 5-15.
Chapter 5 Continuous Monitoring of Oxides of NitrogenRevision No. 12
December 31, 2017Page 36 of 53
Equation 5-15:
Percent Converter Efficiency = Slope x 100
6. Converter efficiency must be 96% or greater. Since this efficiency is derived from several calculated data points, it is possible for the efficiency to be greater than 100%.
Table 5. Example of Converter Efficiency Data
Point (X) [NO2]out(ppm)
[NOX]orig(ppm)
[NOX]rem(ppm)
(Y) [NO2]conv(ppm)
1 0.000 0.451 0.451 0.0002 0.398 0.451 0.450 0.3973 0.298 0.451 0.449 0.2964 0.199 0.451 0.450 0.1985 0.101 0.451 0.451 0.101
y = 0.996x + 4E-07R² = 1
[NO
2]co
nver
ted,
ppm
[NO2]out, ppm
Converter Efficiency
Figure 7. Example Converter Efficiency Plot
Converter Efficiency = Slope x 100
Slope: 0.996
Converter Efficiency: 99.6%
Chapter 5 Continuous Monitoring of Oxides of NitrogenRevision No. 12
December 31, 2017Page 37 of 53
Form 5Converter Efficiency NO/NO2/NOX
Point (X) [NO2]out
(ppm)[NOX]orig
(ppm)[NOX]rem
(ppm)(Y) [NO2]conv
(ppm)1
2
3
4
5
[NO2]conv = [NO2]out - ( [NOX]orig - [NOX]rem )
Converter Efficiency = Slope x 100
Slope: ____________________________
Converter Efficiency: ________________%
Comments: ___________________________________________________________________________________________________________________________________________________________________________________________________________________________________________________________________________________________________________________________________________________________________________________________
[NO2
[NO2
Chapter 5 Continuous Monitoring of Oxides of NitrogenRevision No. 12
December 31, 2017Page 38 of 53
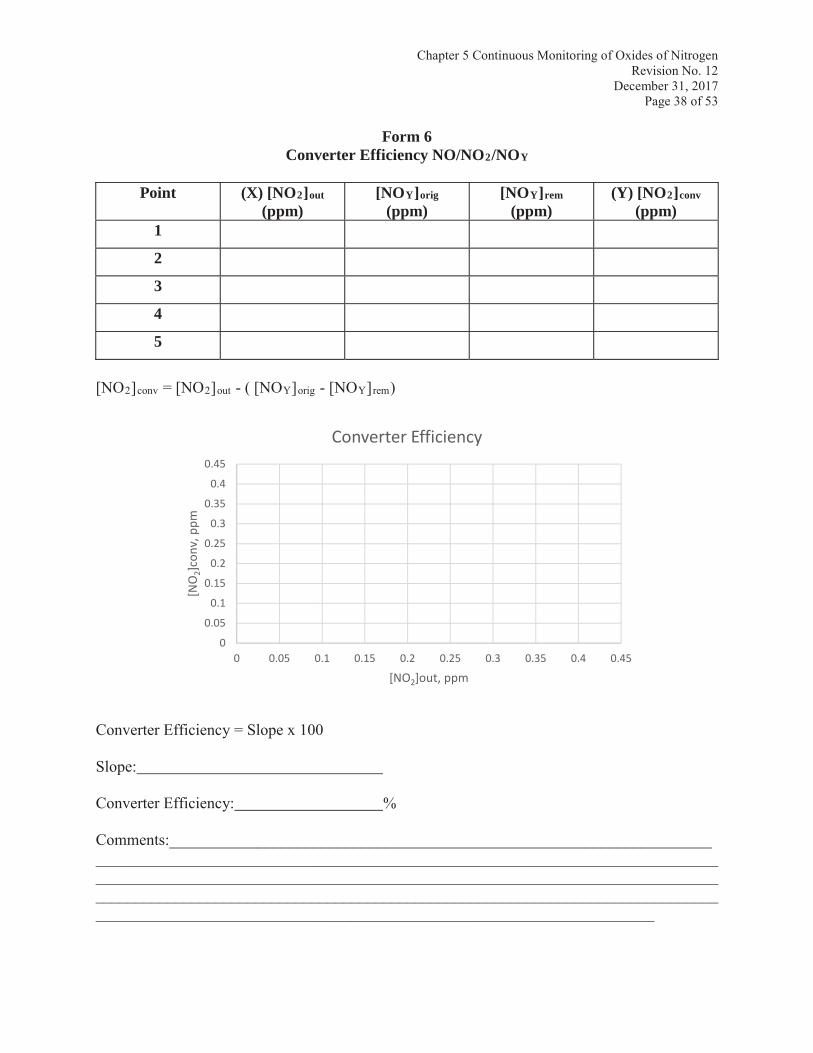
Form 6Converter Efficiency NO/NO2/NOY
Point (X) [NO2]out
(ppm)[NOY]orig
(ppm)[NOY]rem
(ppm)(Y) [NO2]conv
(ppm)1
2
3
4
5
[NO2]conv = [NO2]out - ( [NOY]orig - [NOY]rem)
Converter Efficiency = Slope x 100
Slope:
Converter Efficiency: %
Comments:____________________________________________________________________________________________________________________________________________________________________________________________________________________________________________________________________________________________________________________________________________________________________________________
[NO2
[NO2
Chapter 5 Continuous Monitoring of Oxides of NitrogenRevision No. 12
December 31, 2017Page 39 of 53
7.0 Regulator Purge ProcedureNitric oxide gas is very reactive with atmospheric oxygen and will react to form an NO2impurity within the regulator and gas delivery line, and possibly within the gas cylinder.Therefore, it is necessary to purge and evacuate air from the regulator, and gas delivery line to avoid NO2 formation.
The air and any moisture within the regulator and gas delivery line can be evacuated using an electric pump or a hand operated vacuum pump. The procedure is as follows:
1. Attach a stainless steel regulator (CGA 660 fitting) to the NO gas cylinder. A single or dual stage regulator can be used. The regulator should be equipped with an output shutoff valve made of a nonreactive material.
2. Attach a gas delivery line to the regulator (attach to the output shutoff valve). An 1/8" outside diameter (1/8" OD) Teflon gas delivery line is recommended with a male quick connect type shutoff fitting attached to the end of the gas delivery line.
3. Attach the vacuum pump (equipped with a female quick connect type fitting) to the gas delivery line. Evacuate the regulator and gas delivery line of air with the vacuum pump (hand vacuum or electric pump). If an electric pump is used, evacuate for at least 15 seconds. If a hand vacuum pump is used, draw as much of a vacuum as the hand vacuum will allow.
4. Disconnect the vacuum pump and then open the cylinder valve to fill the regulator and gas delivery line with NO gas.
5. Close the cylinder shutoff valve and reconnect the vacuum pump to the gas delivery line. Immediately start the evacuation of the regulator and gas delivery line.
6. Repeat steps 3 through 5 at least ten (10) times. It is important to evacuate as much air as possible from the regulator and lines. Flushing the system repeatedly will minimize NO2impurity issues with the calibrations or audits (span/1-point QC checks or performance evaluations).
7. If the analyzer responds slowly to the first upscale NO concentration or the analyzer's NO2channel is indicating an upscale concentration of NO2, the regulator purge procedure should be repeated.
Chapter 5 Continuous Monitoring of Oxides of NitrogenRevision No. 12
December 31, 2017Page 40 of 53
8.0 Quality Control and Quality Assurance Quality control checks (Span/1-point Quality Control audits) and quality assurance audits (Performance Evaluation (PE) audits) are conducted to ensure the validity of the NO2 data that is submitted to the USEPA Air Quality System (AQS) database. Results of these quality control checks are used to estimate the Precision and Bias of the monitoring network's data. The results of the 1-point QC checks and the PE audits performed on the statewide network are submitted quarterly by IDEM-QAS to the USEPA. Refer to Chapter 13, “Quality Assessment and Statistical Analysis of Air Monitoring Data”, of this manual for detailed information on precision and bias.
8.1 Daily Zero and Span ChecksZero air and a nitric oxide span concentration that is 70% to 90% of the analyzer or the calibration range should be run each day for chemiluminescence NO/NO2/NOX analyzers. Zero and NO2 span concentration of 70% to 90% of the analyzer or the calibration range should be performed each day for direct read NO2 analyzers. Those analyzers equipped with zero/span options can be set up to automatically cycle through the zero/span check each day. For analyzers not equipped with a daily zero and span feature, perform a manual zero check at least weekly.
The site operator must review the data acquisition system to assess the daily zero and span results. Dramatic shifts in zero and/or spans may require a recalibration of the analyzer.
An activated charcoal column with an NO catalyst can be used to produce the zero air. Because charcoal will not remove NO, a catalyst such as Purafil is required to convert NO to NO2. The charcoal will then remove the NO2.
LEADS is scheduled to perform a NO span and zero check on a daily basis. To minimize data loss, the daily zero and span check is set to run the last 15 minutes of an hour and the first 15 minutes of the succeeding hour. LEADS notates the span/zero with the flag “SPZ.”
8.2 Automated Systems Span/1-point Quality Control Checks.
LEADS performs span/1-point QC checks on a weekly basis to assess the validity and performance of the NO2 analyzers; LEADS notates the span/1-point QC audit with the flag “SPN”. The scheduled weekly audit consists of running a zero concentration and two upscale NO2 concentrations from a GPT blending system (site calibrator) with a certified NO standard gas cylinder. The site calibrator is certified annually by the IDEM-QAS.
The span point consists of an NO2 concentration of approximately 80% URL (0.400 ppm). This concentration is used to validate data and to check the analyzer drift back to the most recent calibration span concentration.
The 1-point QC point consists of an NO2 concentration of 0.070 ppm, which is in the required range of 0.005 ppm to 0.08 ppm. This audit point is used to assess the validity of the data back to
Chapter 5 Continuous Monitoring of Oxides of NitrogenRevision No. 12
December 31, 2017Page 41 of 53
the most recent valid 1-point QC audit or calibration. The assessment and monitor concentrations from the 1-point QC check are submitted to AQS and are used to estimate the precision and bias of the collected data on a quarterly and annual basis.
8.3 Manual Span/1-point Quality Control AuditIn the event of a failure of the automated system, a span/1-point QC checks must be performed manually at a minimum of once every two weeks (bi-weekly) in order to assess the data validity and performance of the NO2 analyzers. The audit consists of running two upscale NO2concentrations from an IDEM-QAS certified GPT blending system (audit device) with a certified NO standard gas cylinder. The same GPT blending system, used to calibrate the analyzer, may be used to perform the bi-weekly audit on the analyzer. The audit consists of the following checks:
Zero CheckSpan check (0.350 – 0.420 ppm NO2)1-Point QC check (0.005 to 0.08 ppm NO2)
The assessment and monitor concentrations from the manual 1-point QC check are submitted to AQS.
8.4 Annual Performance Evaluation AuditPer Appendix A of 40 CFR Part 58, annual performance evaluation (PE) audits must be performed on at least 25% of the network's analyzers each calendar quarter. At the end of the year, all analyzers must have had a PE audit. Networks which have 4 or fewer analyzers must conduct performance evaluation audits, so that all analyzers have had a performance evaluation audit by the end of the year. It is the policy of the IDEM/OAQ/AMB that PE audits are conducted on all NO2 analyzers on a quarterly basis.
Appendix A of 40 CFR Part 58 requires that a different audit GPT blender and gas standard be used to perform the performance evaluation audit from the calibrator used for the calibration and span/1-point QC checks (Appendix A §3.1.2.3). The person who performs the annual performance evaluation audit should be different from that of the parameter specialist who performs the calibration and span/1-point QC checks. (Appendix A §3.1.2)
The evaluation is made by challenging the monitor with NO2 gas standards of known concentration from at least three audit levels. One concentration must be within two to three times the method detection limit of the instruments within IDEM’s network. The second point will be less than or equal to the 99th percentile of the data at the site or the network of sites or the next highest audit concentration level. The third point can be around the primary NAAQS or the highest 3-year concentration at the site or the network of sites. An additional 4th level is encouraged for those agencies that would like to confirm the monitors' linearity at the higher end of the operational range.
Currently, the Quality Assurance Section utilizes the following audit levels when conducting PE
Chapter 5 Continuous Monitoring of Oxides of NitrogenRevision No. 12
December 31, 2017Page 42 of 53
Audits:
Non-trace NO2 PE auditsLevel 7 (0.1000 – 0.2999 ppm)Level 5 (0.0200 – 0.0499 ppm)Level 2 (0.0030 – 0.0049 ppm)
Trace Level NOY-NO PE auditsLevel 6 (0.0500 – 0.0999 ppm)Level 4 (0.0080 – 0.0199ppm)Level 1 (0.0003 – 0.0029 ppb)
The analyzer must be collecting valid data on all channels (NO, NO2, and NOX (NOY)) in order to conduct a performance evaluation audit. The QA Section auditor notates a PE audit in LEADS with the flag “QAS”.
Audit results are considered passing if the NO2 results are < ±15.1% for each audit level. Audit results outside this range do not automatically invalidate data; additional review of other quality control information to determine the need to invalidate the data and must be documented to demonstrate validity (or invalidity) of the data. All performance evaluation audits, regardless of results, are reported to AQS.
8.5 Chemiluminescence Analyzer Audit ProceduresThe procedures in this section are utilized to perform a manual span/1-point QC audit or aperformance evaluation audit. Record all information on a NO/NO2/NOX audit form (e.g., Form 7 or an equivalent form).
Note: Make no adjustments to the analyzer prior to the audit.
1. Record the station name and the AQS site identification number on the NOX audit form.
2. Identify the person performing the audit (initials), and record the audit date.
3. Record the analyzer's manufacturer name, model number, and serial number.
4. Note any alarms or diagnostic issues in the remarks section. It is a good idea to inspect theanalyzer before the start of the field audit. Check that the analyzer is in the sample mode; the sample line is connected to the sample manifold or outside sample line; and if there are any other conditions that could affect the data or the field audit results.
5. Record the analyzer's calibration date and the analyzer slope and intercept for NO/NO2/NOX.Analyzers must be calibrated at least every six months.
6. Record the audit device manufacturer name, model number, and serial number.
Chapter 5 Continuous Monitoring of Oxides of NitrogenRevision No. 12
December 31, 2017Page 43 of 53
7. Record the NO audit gas cylinder number, certified concentration, and certification date.
Note: Be sure that the audit GPT blender and gas cylinder have a current certification before proceeding. Do not use cylinders with pressures < 200 psig; gases may become unstable at low pressures and cause audit errors.
8. Confirm that the analyzer is connected to a recording device such as: a data acquisition system (DAS), a strip chart recorder, and/or a digital voltmeter. [If a digital voltmeter is used,the analyzer will have three output voltage connections (NO, NO2, and NOX (NOY)), label or be able to differentiate between the three outputs.]
9. Logon to the data acquisition system and change the NO/NO2/NOX channel status to indicate an audit. Annotate the strip chart recorder with the audit starting date, site, parameter, initials, and time.
10. Adjust the flow of the diluent air (zero air) on the audit device so that its total output flow exceeds the total demand of the analyzer by at least 25%.
11. Connect the analyzer’s “sample in” port to the “sample out” port of the audit device using a vented nonreactive (TFE Teflon) sample line/manifold such that the audit gas passes through as much of the sample train as possible. For the NOY hookup, connect an unvented sample line from the audit device to the converter.
Warning: The NO sample gas must be delivered to the analyzer at atmospheric pressure. A manifold or tee vent must be used from the audit device so that excess sample flow can be bled off. Unvented sample gas can pressurize & damage the analyzer. For the NOY audit hookup, no manifold or tee vent is used.
12. Allow the analyzer to sample zero air until NO, NO2, and NOX responses stabilize (usually 10 to 20 minutes). Record the analyzer responses to zero air on the audit form.
13. While the analyzer is sampling zero air, attach a stainless steel regulator to the NO audit cylinder and begin the regulator purge procedure (Refer to Section 7.0)
Note: The regulator must be purged of all air before proceeding with the audit.Atmospheric O2 in the regulator will react with the NO and form unwanted NO2 in the gas stream.
14. For the first audit concentration, adjust the NO flow and zero air flow from the audit GPT blending system to generate the desired NO concentration. The certification sticker on the gas blending system contains recommended NO/NOX concentrations and flow settings, along with suggested ozone settings to achieve the desired NO2 concentrations.
Note: If the monitor response exhibits a very slow response to the first NO
Chapter 5 Continuous Monitoring of Oxides of NitrogenRevision No. 12
December 31, 2017Page 44 of 53
concentration, there may still be some residual O2 contamination in the NO regulator. Repeat the purge procedures for the regulator.
15. Calculate the standard NO concentration [NO]out from the calibrator using Equation 5-6 and the standard NOX (or NOY) using Equation 5-7. [If the NO2 impurity in the cylinder is zero or less than 1% of the NO concentration, Equation 5-7 will simplify to Equation 5-6.]Record this concentration under Std. NO/Std. NOX on the audit form. Also record the audit setting, gas flow, and total flow.
Equation 5-6:
odNO
stdNOout FFF
NOFNO
Equation 5-7:
odNO
imp2stdNOoutxouty F FF
NONOFNOorNO
16. After the analyzer responses have stabilized, record the monitor responses for NO and NOX(NOY) on the audit form.
17. Using the analyzer's respective NO/NOX (NOY) calibration slopes and intercepts, convert the analyzer NO response and the NOX response to NO/NOX concentrations (ppm).
18. Record the respective concentrations as the observed NO concentration and observed NOXconcentration.
19. Calculate and record the percent difference (% diff.) between the standard concentration (Std. Conc.) and observed concentration (Meas. Conc.) for the NO and NOX (NOY) channels. Refer to Equation 5-10 for the % diff. calculation.
Equation 5-10:
% = × 100%20. For the NO2 audit concentration, adjust the O3 generator on the audit GPT blending system
to generate the desired NO2 concentration, with some residual NO concentration remaining([NO]rem).
Note: As a general rule, the [NO]rem should be in the 0.05 – 0.08 ppm range for a span audit or PE audit level 7 - 10. For a manual 1-point QC check or PE audit levels 1 -6,the NO remaining should be approximately equal to the desired NO2 concentration.
Chapter 5 Continuous Monitoring of Oxides of NitrogenRevision No. 12
December 31, 2017Page 45 of 53
Appendix A of 40 CFR Part 58 recommends a residual NO concentration, [NO]REM,during the titration of NO2 audit concentrations based on EPA guidance documents and monitoring agency experience.
21. After the analyzer responses have stabilized, record the NO remaining ([NO]rem) response and calculate the NO remaining concentration using the slope and intercept. Calculate the [NO2]std using Equation 5-16, Equation 5-11a or Equation 5-11b. (Equations 5-16 and 5-11a simplify to Equation 5-11b, if the NO zero response is zero and the [NO2]imp is negligible, respectively.) Also, record the O3 SETTING on the audit device.
Equation 5-16:
outNO][responsezeroNO-responseNO
response)NO-response(NONO
orig
remorigstd2
Where: NOorig = the monitor response in % chart, millivolts or volts before O3 titrationNOrem = the monitor response in % chart, millivolts or volts after O3 titration[NO]out = the original NO concentration (ppm) before O3 titration
Equation 5-11a[ ] = [ ] [ ] + ×[ ] Equation 5-11b[ ] = [ ] [ ]
22. After the analyzer responses have stabilized, record the NO2 response readings from the recording device(s).
23. Calculate the measured or observed concentration (obsv. conc.) of NO2 using the observed NO2 response and the analyzer's current slope/intercept for the NO2 channel. Record the analyzer’s NO2 response and the analyzer’s NO2 zero response on the audit form.
24. Calculate and record the percent difference (% diff.) between the [NO2] observedconcentration (obsv. conc.) and the [NO2] standard concentration (std. conc.).
Note: Because data are reported as ppb to one significant digit after the decimal, round the concentration to the nearest ten-thousandths ppm (0.xxxx).
25. Repeat steps 14 through 24 for the remaining NO2 audit levels.
Chapter 5 Continuous Monitoring of Oxides of NitrogenRevision No. 12
December 31, 2017Page 46 of 53
26. After all audit levels have been evaluated, allow the analyzer to sample zero air until NO, NO2, and NOX responses stabilize (usually 10 to 15 minutes). Record the analyzer responses to zero air on the audit form.
27. After the audit has been completed, perform the following:
a. Reconnect the analyzer's sample line to the outside sample line or manifold; ensure that the analyzer is in the sample mode; and has its normal flow.
b. Logon to the data acquisition system and enable the NO/NO2/NOX channels status to ambient monitoring.
c. For a strip chart recorder be sure to indicate on the chart: site name, audit starting and ending date/time, zero response, upscale responses for standard concentrations, the parameter, and the auditor's initials.
d. Record all applicable information in the site or electronic logbook: include the audit date, audit time period, the initials of the auditor, the type of audit (span/1-point quality control or performance evaluation), and the results of the audit (% diff.).
8.6 NO2 Direct Measurement Audit ProceduresDirect read NO2 audit techniques require the application of one of the following techniques:
the use of NO2 gas cylinders, which have stability issues, a calibrated chemiluminescence NO/NO2/NOX analyzer to determine the NO2concentration from a gas calibrator and NO gas standard, ora NO2 gas permeation system.
During the audit, the analyzer must be operating in its normal sampling mode. The audit gas must pass through all filters, scrubbers, conditioners, and other components used during the normal ambient sampling mode.
Record all pertinent information on an audit form (e.g. Form 8).
Note: Make no adjustments to the analyzer prior to the audit.
1. Record the station name and the AQS site identification number on the NO2 audit form.
2. Identify the person performing the audit (initials), and record the audit date.
3. Record the analyzer's manufacturer name, model number, and serial number.
4. It is a good practice to inspect the analyzer before the start of the field audit. Check that the analyzer is in the sample mode; the sample line is connected to the sample manifold or
Chapter 5 Continuous Monitoring of Oxides of NitrogenRevision No. 12
December 31, 2017Page 47 of 53
outside sample line; or if there are any other conditions that could affect the data or the field audit results. Note any alarms or diagnostic issues in the remarks section.
5. Record the analyzer's calibration date and the analyzer slope and intercept for NO2.Analyzers must be calibrated at least every six months.
6. Record the audit device manufacturer name, model number, and serial number.
7. Record the NO audit gas cylinder number, certified concentration, and certification date.
Note: Be sure that the audit blender and gas cylinder have a current certification before proceeding. Do not use cylinders with pressures < 200 psig; gases may become unstable at low pressures and cause audit errors.
8. Confirm that the analyzer is connected to a recording device such as: a data acquisition system (DAS), a strip chart recorder, and/or a digital voltmeter.
9. Logon to the data acquisition system and change the NO2 channel status to indicate an audit. Annotate the strip chart with the audit starting date, site, parameter, initials, and time.
10. Adjust the flow of the diluent air (zero air) on the audit device so that its total output flow exceeds the total demand of the analyzer by at least 25%.
11. Connect the analyzer’s “sample in” port to the “sample out” port of the audit device using a vented nonreactive (TFE Teflon) sample line/manifold, such that the audit gas passes through as much of the normal sample train as possible.
Warning: The sample gas must be delivered to the analyzer at atmospheric pressure.A manifold or tee vent must be used from the audit device so that excess sample flow can be bled off. An unvented sample gas can pressurize & damage the analyzer.
12. Allow the analyzer to sample zero air until NO2 response stabilizes (usually 10 to 20 minutes). Record the analyzer response to zero air on the audit form.
13. While the analyzer is sampling zero air, attach a stainless steel regulator to the NO2 audit cylinder and purge the regulator. (Refer to Section 7.0)
14. For the first audit concentration, adjust the NO2 flow and zero air flow from the audit blending system to generate the desired NO2 concentration. The certification sticker on the audit blending system contains gas and air flow rates to produce the desired audit concentrations.
15. Calculate the exact NO2 concentration [NO2]out using Equation 5-12.
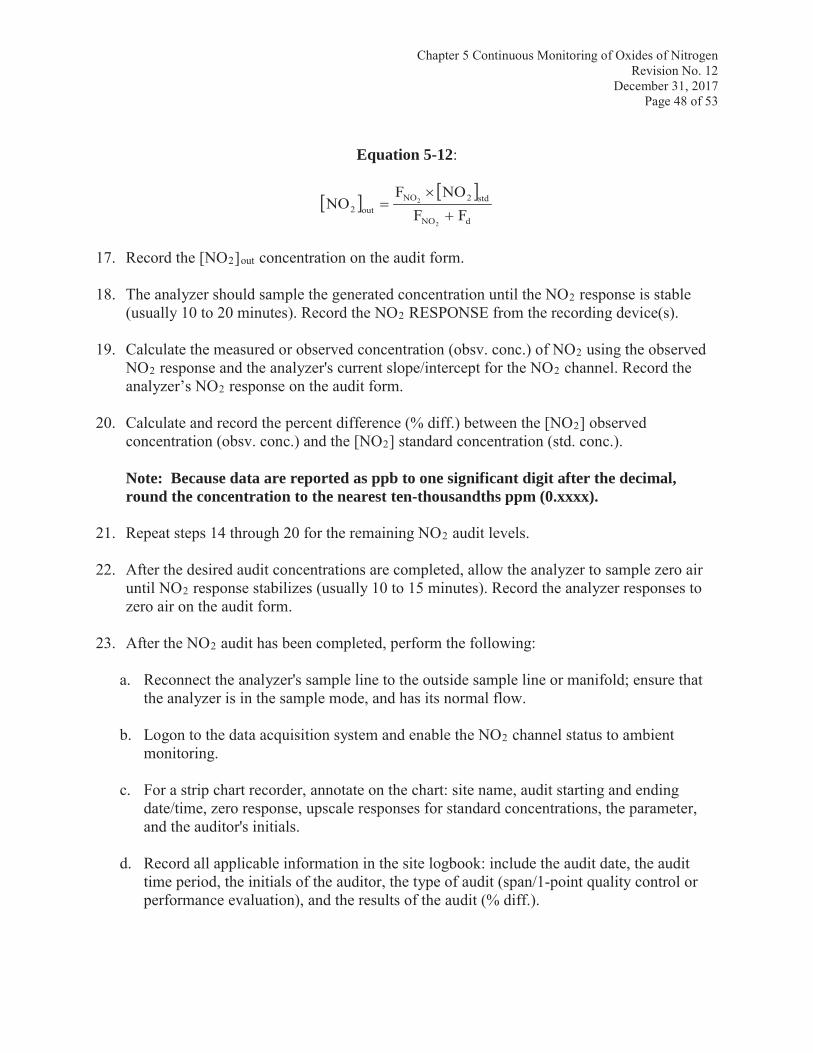
Chapter 5 Continuous Monitoring of Oxides of NitrogenRevision No. 12
December 31, 2017Page 48 of 53
Equation 5-12:
dNO
std2NOout2 FF
NOFNO
2
2
17. Record the [NO2]out concentration on the audit form.
18. The analyzer should sample the generated concentration until the NO2 response is stable (usually 10 to 20 minutes). Record the NO2 RESPONSE from the recording device(s).
19. Calculate the measured or observed concentration (obsv. conc.) of NO2 using the observed NO2 response and the analyzer's current slope/intercept for the NO2 channel. Record the analyzer’s NO2 response on the audit form.
20. Calculate and record the percent difference (% diff.) between the [NO2] observed concentration (obsv. conc.) and the [NO2] standard concentration (std. conc.).
Note: Because data are reported as ppb to one significant digit after the decimal, round the concentration to the nearest ten-thousandths ppm (0.xxxx).
21. Repeat steps 14 through 20 for the remaining NO2 audit levels.
22. After the desired audit concentrations are completed, allow the analyzer to sample zero air until NO2 response stabilizes (usually 10 to 15 minutes). Record the analyzer responses to zero air on the audit form.
23. After the NO2 audit has been completed, perform the following:
a. Reconnect the analyzer's sample line to the outside sample line or manifold; ensure that the analyzer is in the sample mode, and has its normal flow.
b. Logon to the data acquisition system and enable the NO2 channel status to ambient monitoring.
c. For a strip chart recorder, annotate on the chart: site name, audit starting and ending date/time, zero response, upscale responses for standard concentrations, the parameter, and the auditor's initials.
d. Record all applicable information in the site logbook: include the audit date, the audit time period, the initials of the auditor, the type of audit (span/1-point quality control or performance evaluation), and the results of the audit (% diff.).
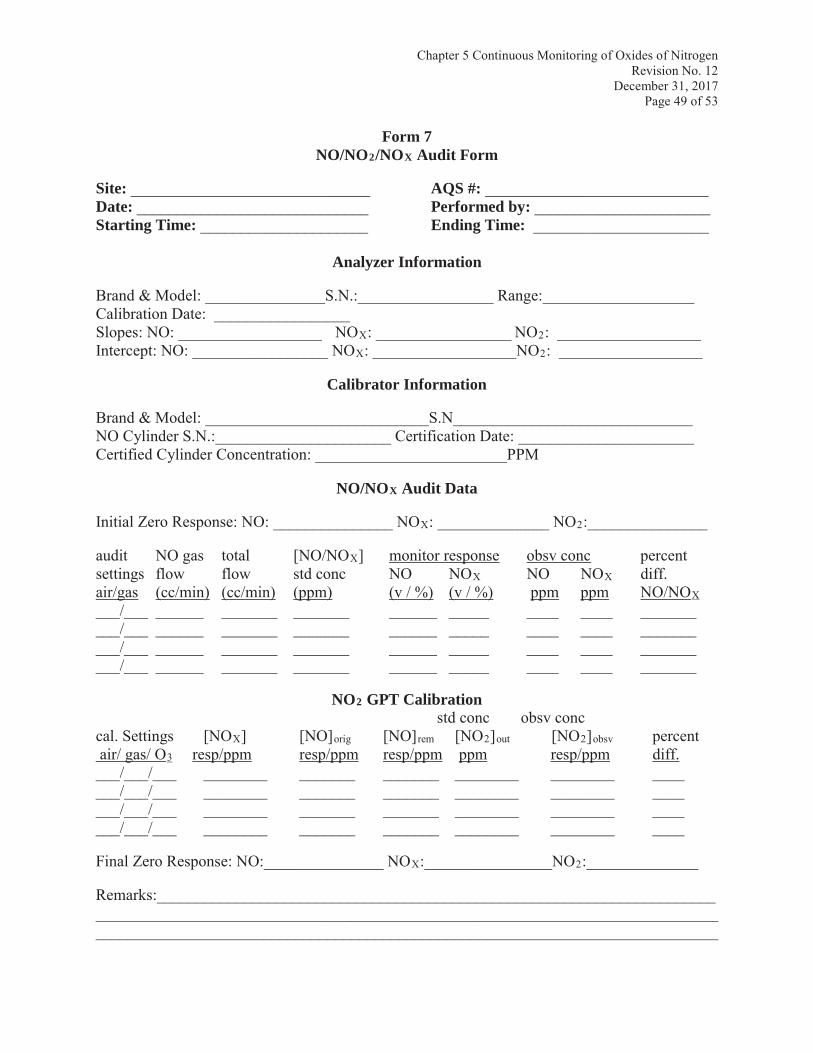
Chapter 5 Continuous Monitoring of Oxides of NitrogenRevision No. 12
December 31, 2017Page 49 of 53
Form 7NO/NO2/NOX Audit Form
Site: ______________________________ AQS #: ____________________________Date: _____________________________ Performed by: ______________________Starting Time: _____________________ Ending Time: ______________________
Analyzer Information
Brand & Model: _______________S.N.:_________________ Range:___________________Calibration Date: _________________Slopes: NO: __________________ NOX: _________________ NO2: __________________Intercept: NO: _________________ NOX: __________________NO2: __________________
Calibrator Information
Brand & Model: ____________________________S.N______________________________NO Cylinder S.N.:______________________ Certification Date: ______________________Certified Cylinder Concentration: ________________________PPM
NO/NOX Audit Data
Initial Zero Response: NO: _______________ NOX: ______________ NO2:_______________
audit NO gas total [NO/NOX] monitor response obsv conc percentsettings flow flow std conc NO NOX NO NOX diff.air/gas (cc/min) (cc/min) (ppm) (v / %) (v / %) ppm ppm NO/NOX___/___ ______ _______ _______ ______ _____ ____ ____ __________/___ ______ _______ _______ ______ _____ ____ ____ __________/___ ______ _______ _______ ______ _____ ____ ____ __________/___ ______ _______ _______ ______ _____ ____ ____ _______
NO2 GPT Calibrationstd conc obsv conc
cal. Settings [NOX] [NO]orig [NO]rem [NO2]out [NO2]obsv percentair/ gas/ O3 resp/ppm resp/ppm resp/ppm ppm resp/ppm diff.
___/___/___ ________ _______ _______ ________ ________ _______/___/___ ________ _______ _______ ________ ________ _______/___/___ ________ _______ _______ ________ ________ _______/___/___ ________ _______ _______ ________ ________ ____
Final Zero Response: NO:_______________ NOX:________________NO2:______________
Remarks:__________________________________________________________________________________________________________________________________________________________________________________________________________________________________
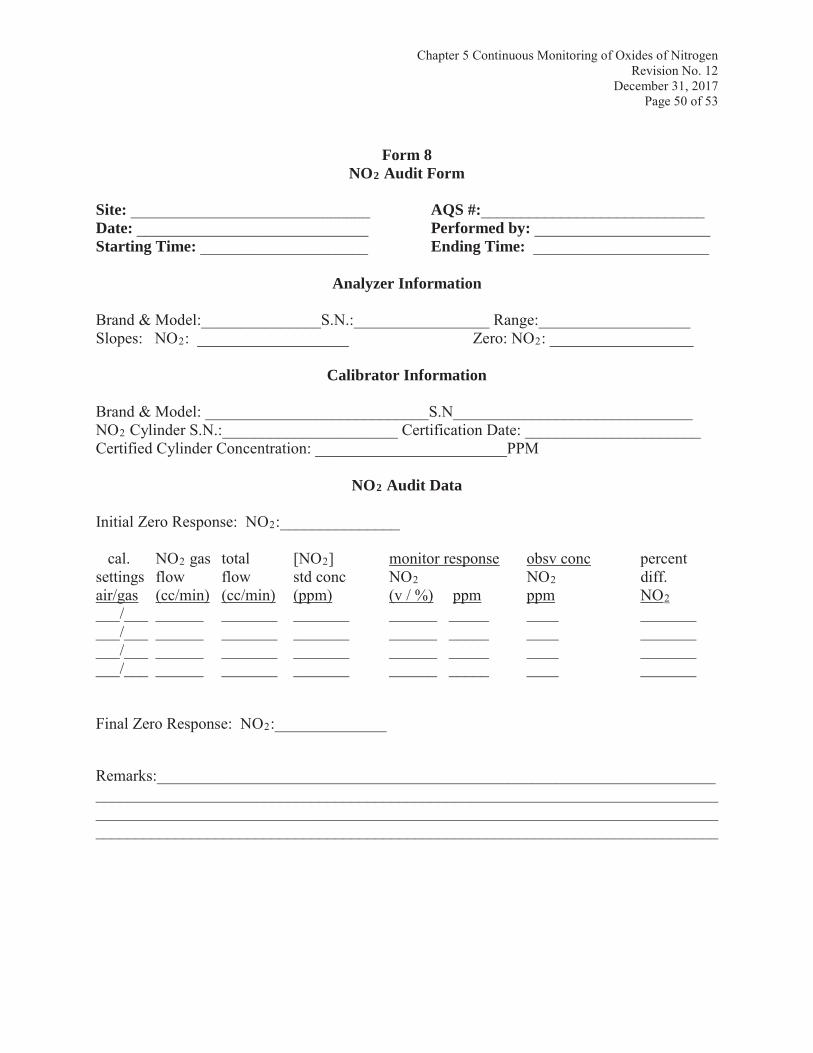
Chapter 5 Continuous Monitoring of Oxides of NitrogenRevision No. 12
December 31, 2017Page 50 of 53
Form 8NO2 Audit Form
Site: ______________________________ AQS #:____________________________Date: _____________________________ Performed by: ______________________Starting Time: _____________________ Ending Time: ______________________
Analyzer Information
Brand & Model:_______________S.N.:_________________ Range:___________________Slopes: NO2: ___________________ Zero: NO2: __________________
Calibrator Information
Brand & Model: ____________________________S.N______________________________NO2 Cylinder S.N.:______________________ Certification Date: ______________________Certified Cylinder Concentration: ________________________PPM
NO2 Audit Data
Initial Zero Response: NO2:_______________
cal. NO2 gas total [NO2] monitor response obsv conc percentsettings flow flow std conc NO2 NO2 diff.air/gas (cc/min) (cc/min) (ppm) (v / %) ppm ppm NO2___/___ ______ _______ _______ ______ _____ ____ __________/___ ______ _______ _______ ______ _____ ____ __________/___ ______ _______ _______ ______ _____ ____ __________/___ ______ _______ _______ ______ _____ ____ _______
Final Zero Response: NO2:______________
Remarks:________________________________________________________________________________________________________________________________________________________________________________________________________________________________________________________________________________________________________________
Chapter 5 Continuous Monitoring of Oxides of NitrogenRevision No. 12
December 31, 2017Page 51 of 53
9.0 Data Reduction and Reporting
9.1 National Ambient Air Quality StandardsThe 1-hour primary standard for NO2 is met when the three-year average of the annual 98th percentile of the daily maximum 1-hour average concentration is less than or equal to 100 ppb,as determined in accordance with 40 CFR Part 50 appendix S for the 1-hour primary standard.The NO2 annual primary standard is met when the annual average concentration in a calendar year is less than or equal to 53 ppb, as determined in accordance with 40 CFR Part 50 Appendix S for the annual primary standard.
The secondary standard is attained when the annual arithmetic mean concentration in a calendar year is less than or equal to 0.0530 ppm, rounded to three decimal places (fractional parts equal to or greater than 0.0005 ppm must be rounded up). To demonstrate attainment, an annual mean must be based upon hourly data that are at least 75 percent complete or upon data derived from manual methods that are at least 75 percent complete for the scheduled sampling days in each calendar quarter.[reference: 40 CFR Part 50 §50.11(g)]
9.2 Ambient DataThe continuous data must be reduced to 24 1-hour averages per day for entry into the USEPA Air Quality System (AQS) database. This reduction must follow the guidelines and requirements set forth in Chapter 12 of this manual.
Although not specified as criteria pollutants, NO and NOX (NOY) data should also be submitted to IDEM for submittal to AQS. NO and NOX (NOY) data may be validated through bi-weeklyQC checks but 1-point Quality Control and performance evaluation audits are not required for this data.
Ambient monitoring data and QA/QC data should be submitted to the IDEM Ambient Monitoring Section within 60 days after the end of the quarter. This allows sufficient time for review before the AQS submittal deadline of 90 days after the end of each reporting calendar quarter; AQS data submittal of less than 60 days is encouraged.
9.3 Quality Control/Performance Evaluation Audit ResultsThe span/1-point QC audits are conducted at a minimum of once every two weeks; this should produce 26 1-point QC checks in a calendar year. If a span or 1-point QC check is outside of its limits (±10.1% and ±15.1%, respectively), data surrounding the failed results must be invalidated. All valid 1-point QC checks must be reported to the AQS. The results of the 1-point QC checks are used to calculate the data quality indicators of precision and bias.
All performance evaluation results must be reported to AQS.
Chapter 5 Continuous Monitoring of Oxides of NitrogenRevision No. 12
December 31, 2017Page 52 of 53
10.0 Routine Station OperationsEssential to a good quality assurance program are scheduled checks for verifying the operation of the monitoring system. At least once per week, an operator should visit each site in order to evaluate operating conditions and to perform routine maintenance.
Conducting routine site/analyzer checks and taking prompt corrective actions for any problems will minimize the loss of data. The results of any of the checks below can directly affect the validity of the data.
Warning: Site calibrator vent/exhaust and analyzer exhaust must be vented to the outside to prevent the buildup of unhealthy concentrations of NO/NO2 at the site. Exhaust gases must be run first through an activated charcoal column before venting to the outside.
Routine maintenance must be performed on all analyzers by the parameter specialists. Consult the analyzer’s operation manual for specific requirements and frequencies that indicate what maintenance must be performed and how often. A schedule of routine maintenance should be made and followed. Some maintenance items common to most analyzers are:
a. sample pump rebuildb. catalytic converter replacementc. interior filters/screens (cleaning or replacement)d. cooling fan (cleaning and lubrication)
10.1 Station ChecksAll sites must have a logbook, hard-bound or electronic, in which site checks/maintenance,analyzer maintenance/checks, and audit information can be recorded.
1. Record all station activities/checks in the site logbook.
2. The average shelter temperature should be in the range of 20 °C to 30 °C (68 °F to 86 °F). A certified thermograph or other temperature recording device must be installed to continuously monitor the site temperature fluctuations as per the EPA QA Handbook, Vol II, §7.2.2. Data shall be invalidated by the IDEM-QAS any time the shelter temperature is out of the 15 °C to 33 °C (59.0 °F to 91.4 °F) range or other temperature range as designated by the equipment manufacturer, whose analyzer is approved as an equivalent method.
3. The sample manifold/blower or lines should be inspected weekly for cleanliness, cracking,obstructions, and blower operation.
4. The sample residence time for the analyzer must be determined and documented on an annual basis. The residence time is the time for an air sample to transit from the probe inlet to the analyzer inlet and must be less than or equal to twenty (20) seconds.
5. Sample lines, candy cane, and rain cap should be inspected weekly for cleanliness, cracking,
Chapter 5 Continuous Monitoring of Oxides of NitrogenRevision No. 12
December 31, 2017Page 53 of 53
and obstructions.
6. All timestamps for data recording devices (data loggers, chart recorders) are based on the local standard time for the location of the monitoring site. All data recording devices should be checked for the correct time (or time synchronization). All chart recording devices should be inspected for ink trace or printout legibility and paper supply.
7. The general condition of the shelter and the surrounding area should be noted in the site logbook. This may assist Ambient Monitoring staff as to when issues (e.g., water leaks, electrical problems) may have started.
8. All compressed gas cylinders must be secured with a cylinder strap to prevent the cylinder from falling over.
10.2 Analyzer Checks1. All analyzers must be equipped with an inlet particulate filter assembly. Check the analyzer's
manual for the recommended filter pore size. Normally a 5 micron pore size, 47 millimeter diameter, nonreactive circular filter is used.
2. The inlet particulate filter must be changed at least every two or three weeks, or more often as needed. A clean filter will minimize the reaction and loss of NO2 in the ambient air with particulate matter collected on the filter. After installing a clean filter, be sure to tightly reassemble the inlet filter holder in order to prevent leaks.
3. NO/NO2/NOX or NO/NO2/NOY analyzers require dry air for the analyzer’s ozonator; depending on the analyzer manufacturer and model, the dry air is obtained either by use of a permeation drier or desiccant columns. The lack of availability of dry air will affect ozone generation and can result in artificially low NO2 concentrations.
If desiccant columns are used to dry the ozonator air, two desiccant columns connected in series must be used. An indicating (color change) type desiccant, silica gel or anhydrous calcium sulfate (CaSO4 (drierite)) should be used in the columns. The desiccant columns should be inspected weekly for any color change. The first column (farthest from the analyzer) should be replaced whenever the desiccant has changed color (color change indicates that the column is no longer removing moisture). Humid conditions, especially in the summer months, will require more frequent changing of the columns.
4. On a weekly basis, record analyzer diagnostics (flow rates, pressure and temperature values, and alarms) in the site log. Diagnostic readings should be consistent to those from the last calibration.
5. Verify that the analyzer is in the sampling mode and that it is connected to and providing a signal to the primary and secondary data recording devices.