Embed Size (px)
Citation preview

CHAPTER 5
COST – VOLUME - PROFIT
Study Objectives
Distinguish between variable and fixed costs.
Explain the significance of the relevant range.
Explain the concept of mixed costs.
List the five components of cost-volume-profit analysis.
Indicate what contribution margin is and how it can be expressed.
Study Objectives: Continued
Identify the three ways to determine the break-even point.
Give the formulas for determining sales required to earn target net income.
Define margin of safety, and give the formulas for computing it.

COST BEHAVIOR ANALYSIS
Definition: The study of how specific costs respond to changes in the level of business activity
Some costs change; others remain the same
Helps management plan operations and make decisions
Applies to all types of businesses and entities
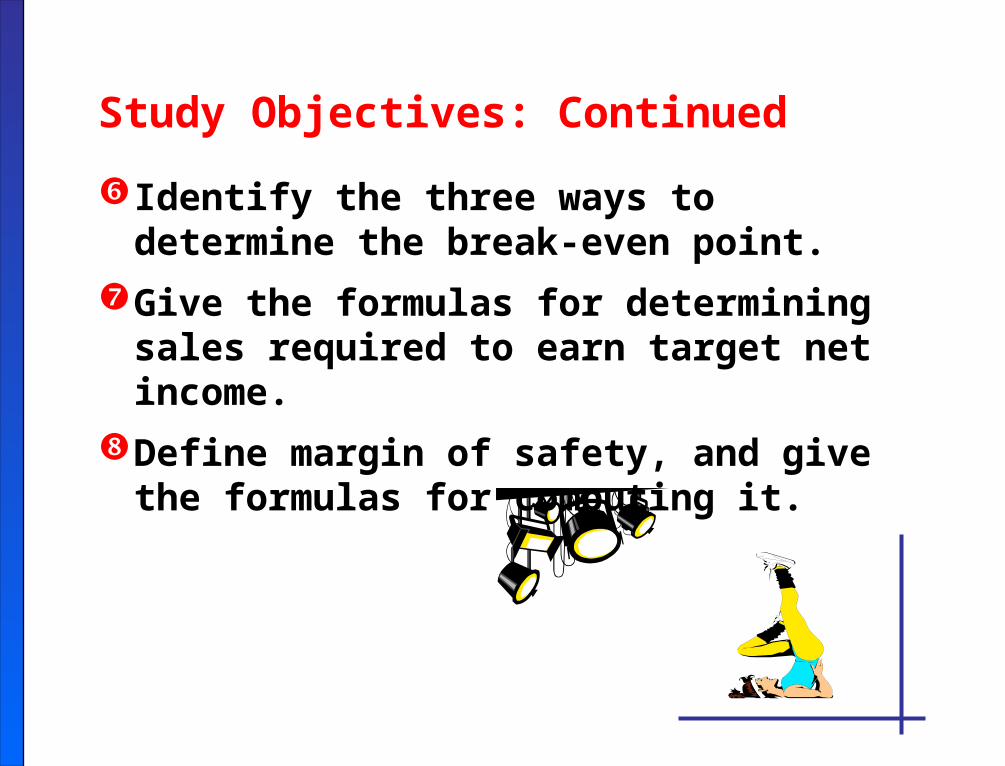
COST BEHAVIOR ANALYSISContinued
Starting point is measuring key business activities
Activity levels may be expressed in terms of Sales dollars (in a retail company)
Miles driven (in a trucking company)
Room occupancy (in a hotel) Dance classes taught (by a dance studio)
COST BEHAVIOR ANALYSIS Continued
Many companies use more than one measurement base
For an activity level to be useful:
Changes in the level or volume of activity should be correlated with changes in cost

COST BEHAVIOR ANALYSISContinued
The activity level selected is called the activity (or volume) index
Identifies the activity that causes changes in the behavior of costs
Allows costs to be classified according to their response to changes in activity as:
Variable Costs
Fixed Costs
Mixed Costs

COST BEHAVIOR ANALYSISVARIABLE COSTS
Study Objective 1
Costs that vary in total directly and proportionately with changes in the activity level
If the activity level increases 10 percent, total variable costs increase 10 percent
If the activity level decreases by 25 percent, total
variable costs will decrease by 25 percent

COST BEHAVIOR ANALYSISVARIABLE COSTS - Continued
Variable costs also remain constant per unit at every level of activity
Examples of variable costs include Direct material and direct labor for a manufacturer Sales commissions for a merchandiser Gasoline in airlines and trucking companies
COST BEHAVIOR ANALYSISVARIABLE COSTS - Continued
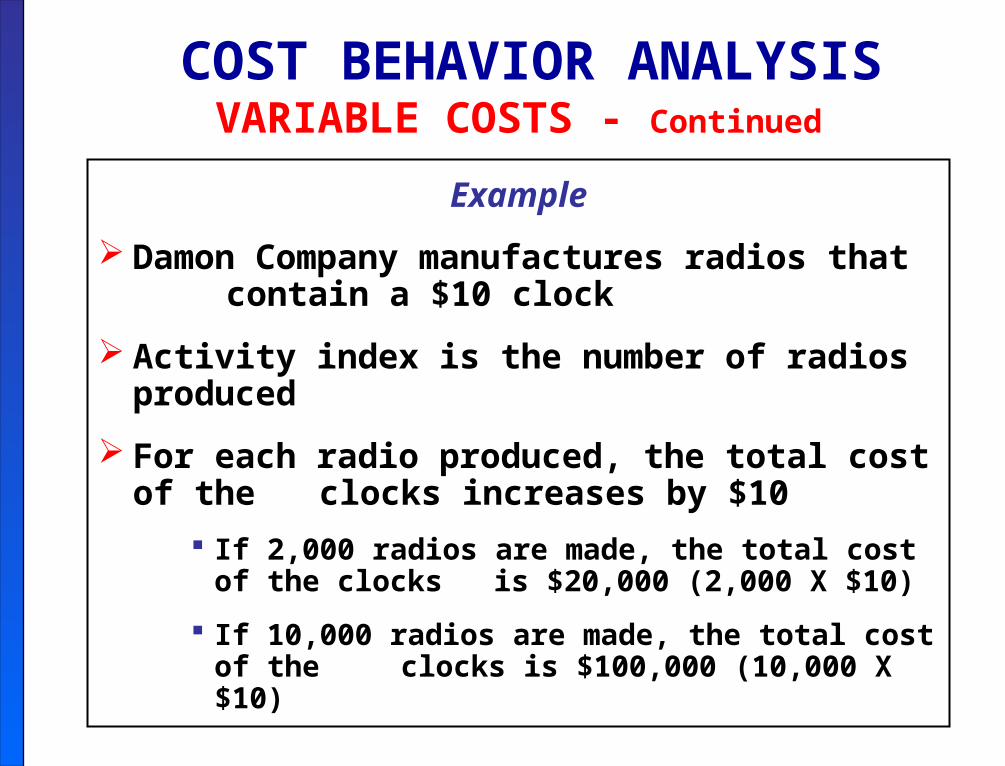
Example
Damon Company manufactures radios that contain a $10 clock
Activity index is the number of radios produced
For each radio produced, the total cost of the clocks increases by $10
If 2,000 radios are made, the total cost of the clocks is $20,000 (2,000 X $10)
If 10,000 radios are made, the total cost of the clocks is $100,000 (10,000 X $10)
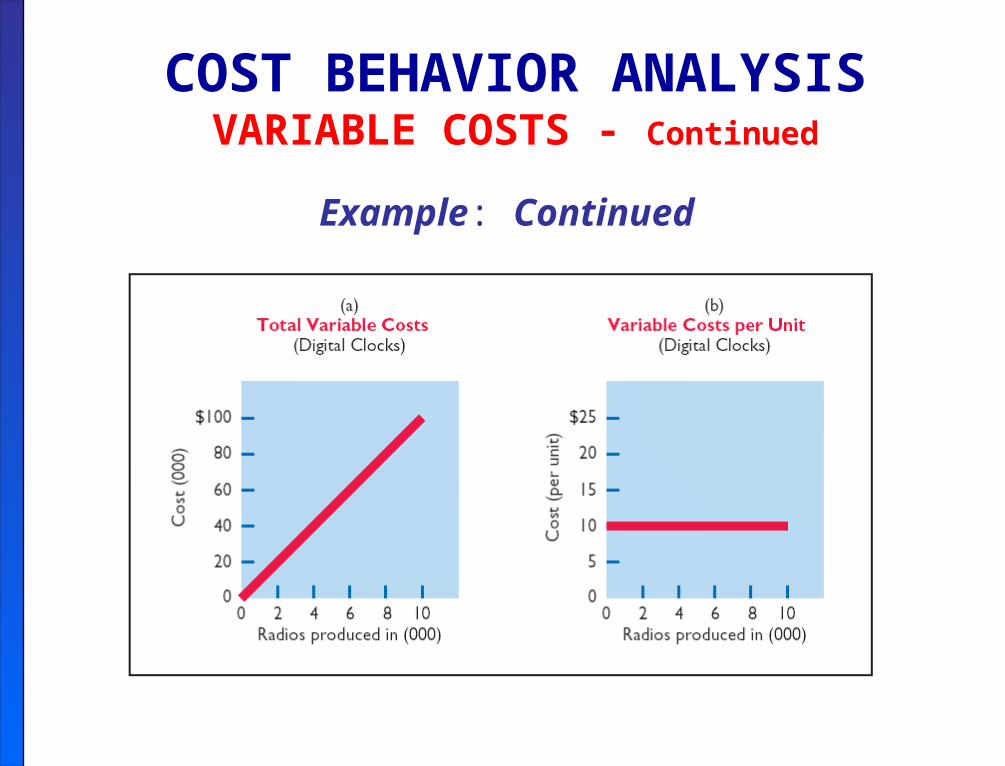
COST BEHAVIOR ANALYSIS VARIABLE COSTS - Continued
Example: Continued
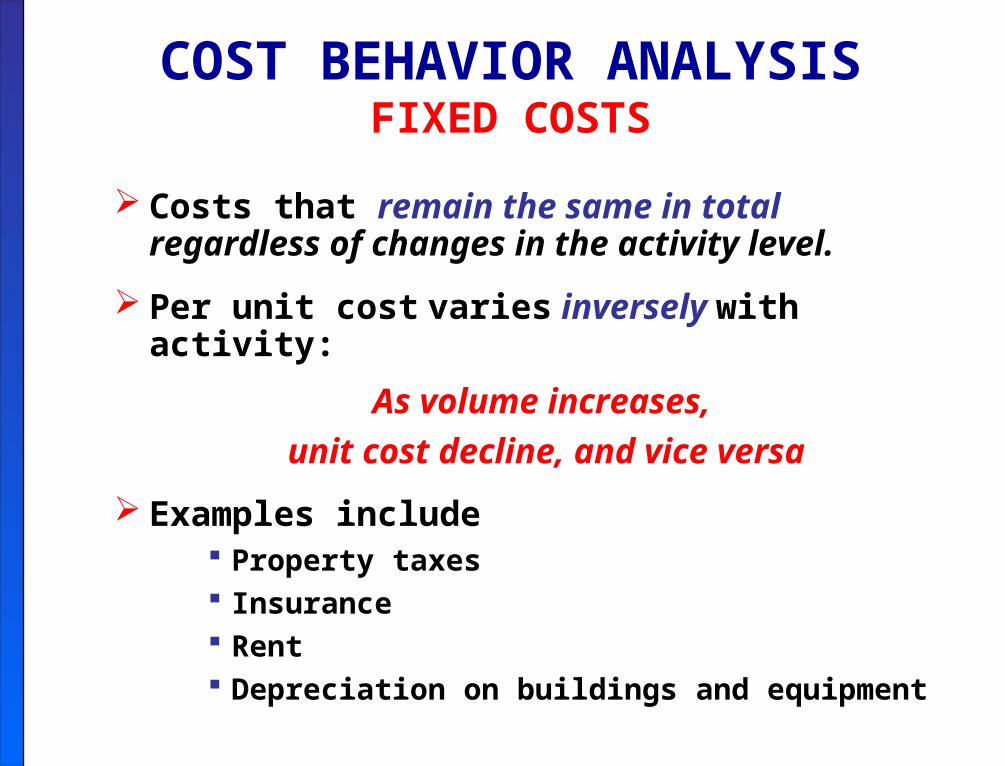
COST BEHAVIOR ANALYSISFIXED COSTS
Costs that remain the same in total regardless of changes in the activity level.
Per unit cost varies inversely with activity:
As volume increases,
unit cost decline, and vice versa
Examples include Property taxes Insurance Rent Depreciation on buildings and equipment
COST BEHAVIOR ANALYSISFIXED COSTS - Continued
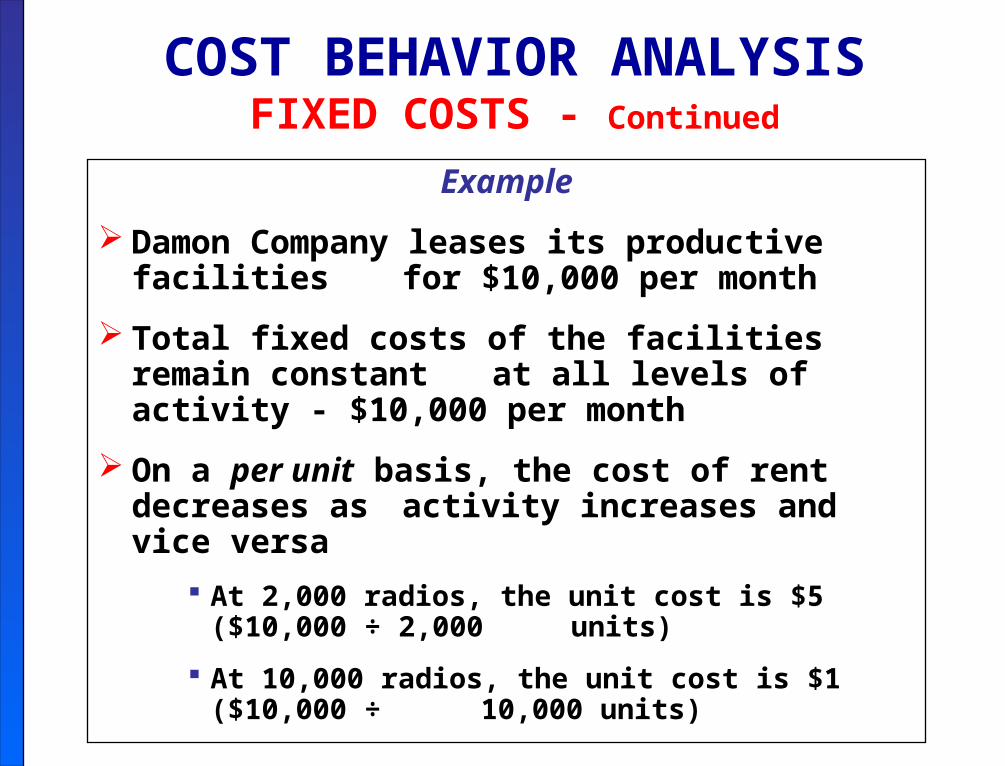
Example
Damon Company leases its productive facilities for $10,000 per month
Total fixed costs of the facilities remain constant at all levels of activity - $10,000 per month
On a per unit basis, the cost of rent decreases as activity increases and vice versa
At 2,000 radios, the unit cost is $5 ($10,000 ÷ 2,000 units)
At 10,000 radios, the unit cost is $1 ($10,000 ÷ 10,000 units)

COST BEHAVIOR ANALYSISFIXED COSTS - Continued
Example: Continued
COST BEHAVIOR ANALYSISRELEVANT RANGE
Study Objective 2
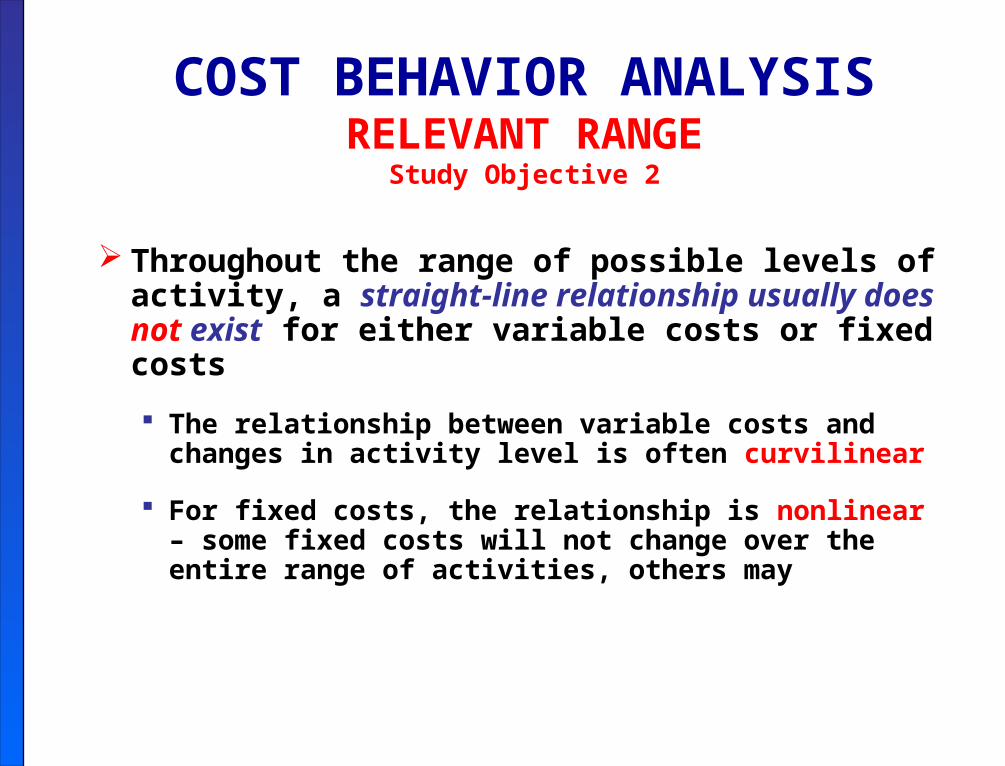
Throughout the range of possible levels of activity, a straight-line relationship usually does not exist for either variable costs or fixed costs
The relationship between variable costs and changes in activity level is often curvilinear
For fixed costs, the relationship is nonlinear – some fixed costs will not change over the entire range of activities, others may

COST BEHAVIOR ANALYSISRELEVANT RANGE - Continued
COST BEHAVIOR ANALYSISRELEVANT RANGE - Continued
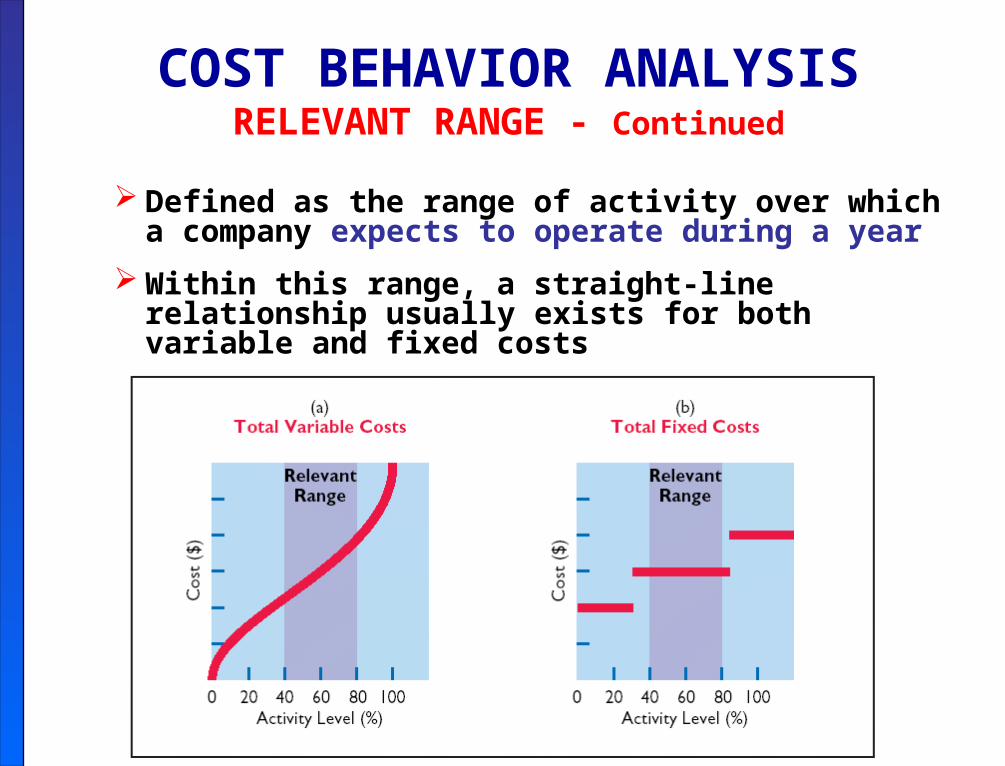
Defined as the range of activity over which a company expects to operate during a year
Within this range, a straight-line relationship usually exists for both variable and fixed costs
COST BEHAVIOR ANALYSISMIXED COSTS
Study Objective 3
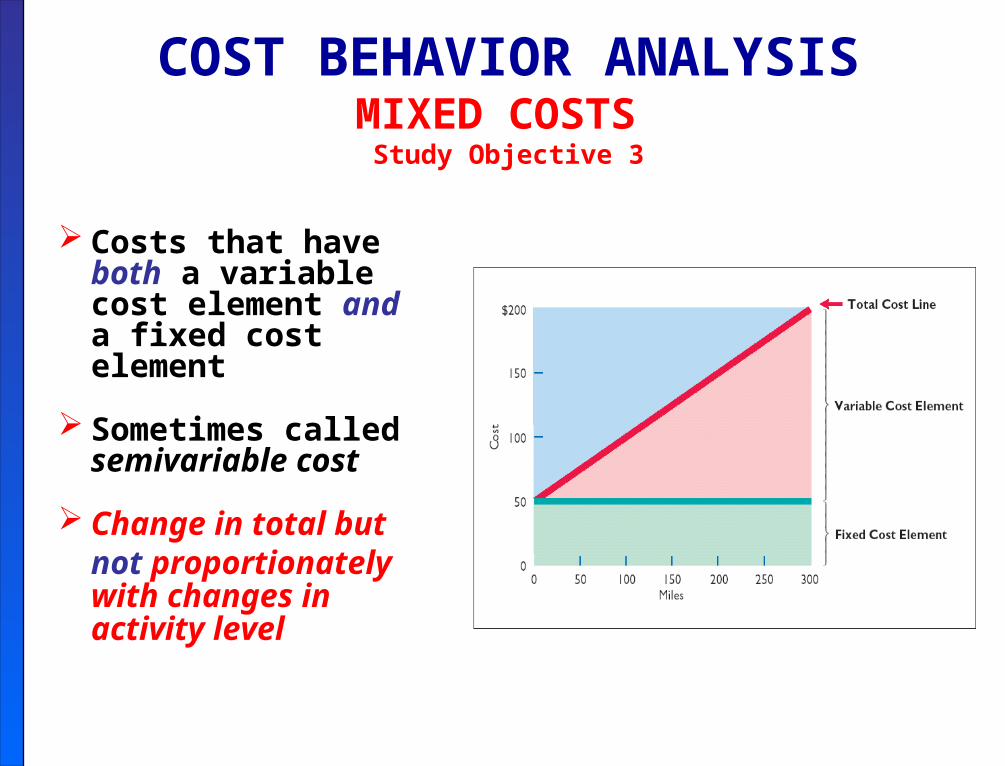
Costs that have both a variable cost element and a fixed cost element
Sometimes called semivariable cost
Change in total but not proportionately with changes inactivity level

COST BEHAVIOR ANALYSISMIXED COSTS – High-Low Method
Mixed costs must be classified into their fixed and variable elements
One approach to separate the costs is called the high-low method
Uses the total costs incurred at both the high and the low levels of activity to classify mixed costs
The difference in costs between the high and low levels represents variable costs, since only variable costs change as activity levels change

COST BEHAVIOR ANALYSISMIXED COSTS – High-Low Method - Continued
Steps in Method
STEP 1: Determine variable cost per unit using the following formula:
STEP 2: Determine the fixed cost by subtracting the total variable cost at either the high or the low activity level from the total cost at that level
÷ =Change in Total Costs
High minus Low Activity Level
Variable Cost per Unit
COST BEHAVIOR ANALYSISMIXED COSTS – High-Low Method - Continued
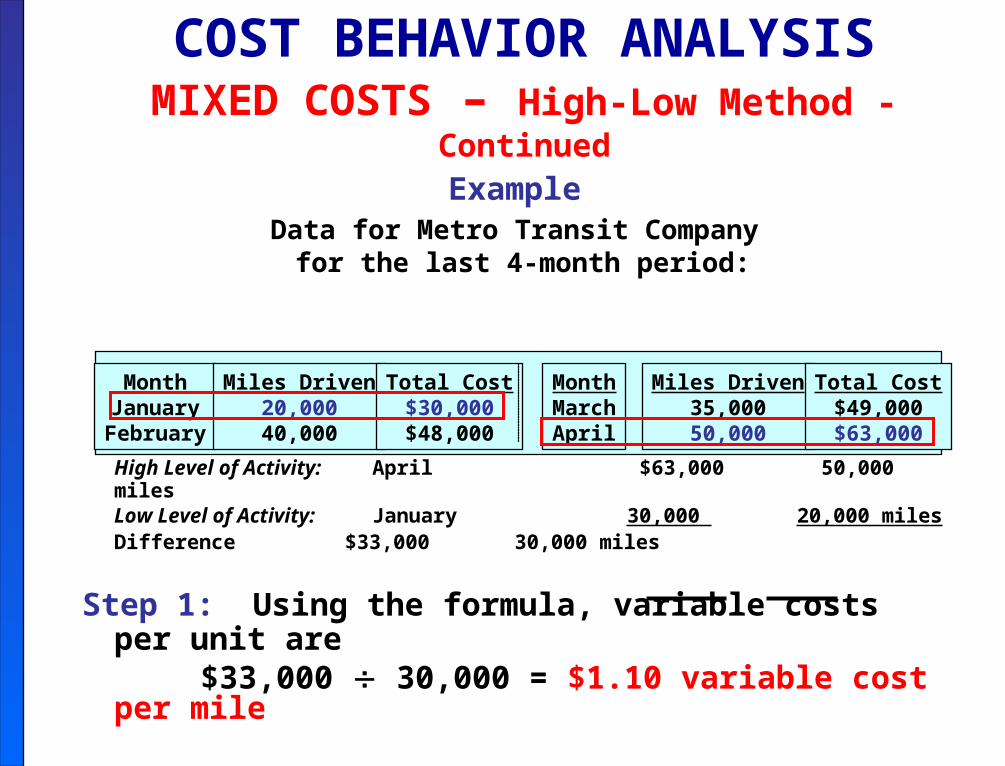
ExampleData for Metro Transit Company
for the last 4-month period:
High Level of Activity: April $63,000 50,000 milesLow Level of Activity: January 30,000 20,000 miles
Difference $33,000 30,000 miles
Step 1: Using the formula, variable costs per unit are $33,000 30,000 = $1.10 variable cost per mile
MonthJanuaryFebruary
Miles Driven20,00040,000
Total Cost$30,000$48,000
MonthMarchApril
Miles Driven35,00050,000
Total Cost$49,000$63,000

COST BEHAVIOR ANALYSISMIXED COSTS – High-Low Method - Continued
Example: ContinuedStep 2: Subtract total variable costs at either the high or low
activity level from the total cost at that same level
Total CostLess: Variable costs (50,000 x $1.10) (20,000 x $1.10)Total fixed costs
High $63,000
55,000
$ 8,000
Low $30,000
22,000
$ 8,000
Activity Level
COST BEHAVIOR ANALYSISMIXED COSTS – High-Low Method - Continued
Example: Continued
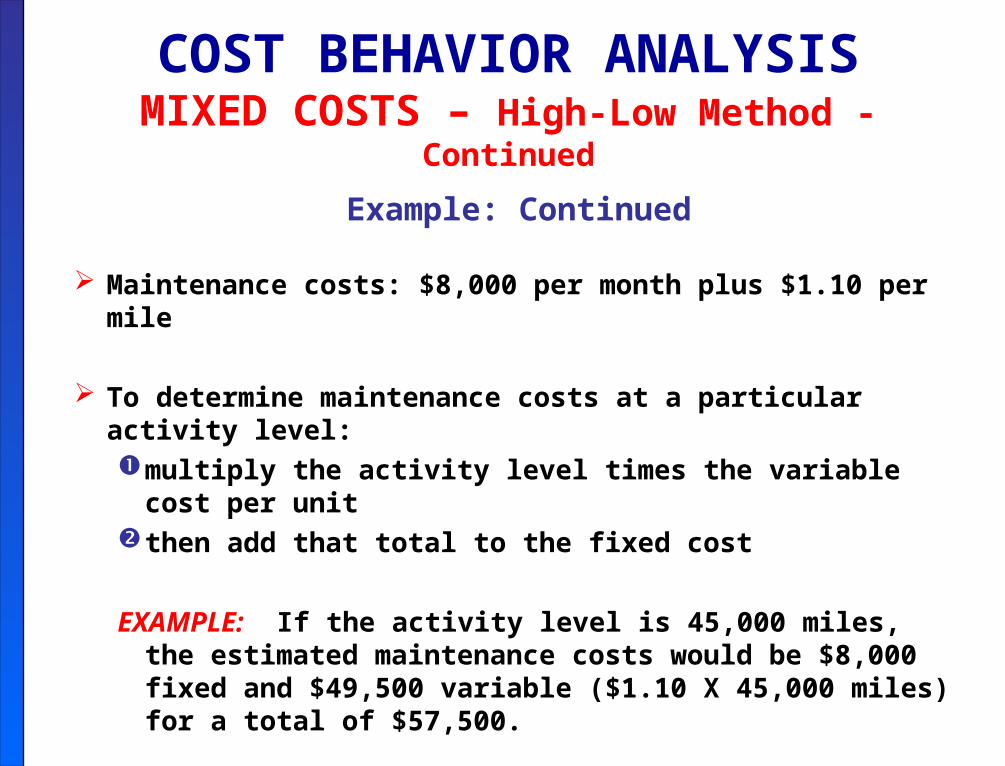
Maintenance costs: $8,000 per month plus $1.10 per mile
To determine maintenance costs at a particular activity level:multiply the activity level times the variable cost per unitthen add that total to the fixed cost
EXAMPLE: If the activity level is 45,000 miles, the estimated maintenance costs would be $8,000 fixed and $49,500 variable ($1.10 X 45,000 miles) for a total of $57,500.

COST-VOLUME-PROFIT ANALYSIS
Study Objective 4
Study of the effects of changes of costs and volume on a company’s profits
A critical factor in management decisions Important in profit planning

COST-VOLUME-PROFIT ANALYSIS
Considers the interrelationships among the five components of CVP analysis:

ASSUMPTIONS UNDERLYINGCVP ANALYSIS
Behavior of both costs and revenues is linear throughout the relevant range of the activity index
All costs can be classified as either variable or fixed with reasonable accuracy
Changes in activity are the only factors that affect costs
All units produced are sold
When more than one type of product is sold, the sales mix will remain constant

CVP INCOME STATEMENTStudy Objective 5
A statement for internal use
Classifies costs and expenses as fixed or variable
Reports contribution margin in the body of the statement.
Contribution margin –amount of revenue
remaining afterdeducting variable costs
Reports the same netincome as a traditionalincome statement

CVP INCOME STATEMENTExample
Vargo Video Company produces DVD players. Relevant data for June 2005:
Unit selling price of DVD player $500Unit variable costs $300Total monthly fixed costs $200,000Units sold
1,600

CVP INCOME STATEMENT Contribution Margin Per Unit
Contribution margin is available to cover fixed costs and to contribute to income
Formula for contribution margin per unit:
Example: Computation for Vargo Video
– =Unit Selling Price Unit Variable Costs
Contribution Margin per Unit
– =Unit Selling Price $500
Unit Variable Costs $300
Contribution Margin per Unit
$200

CVP INCOME STATEMENT Contribution Margin Ratio
Shows the percentage of each sales dollar available to apply toward fixed costs and profits
Example: Computation for Vargo Video
÷ = Contribution Margin Ratio
Unit Selling PriceContribution Margin per Unit
÷ =Contribution Margin Ratio
40%
Unit Selling Price
$500
Contribution Margin per Unit
S200

CVP INCOME STATEMENT Contribution Margin Ratio - Example
Ratio helps to determine the effect of changes in sales on net income

BREAK-EVEN ANALYSISStudy Objective 6
Process of finding the break-even point
Break-even point
Level of activity at which total revenues equal total costs (both fixed and variable)
Can be computed or derived
• from a mathematical equation
• by using contribution margin
• from a cost-volume-profit (CVP) graph
Expressed either in sales units or in sales dollars
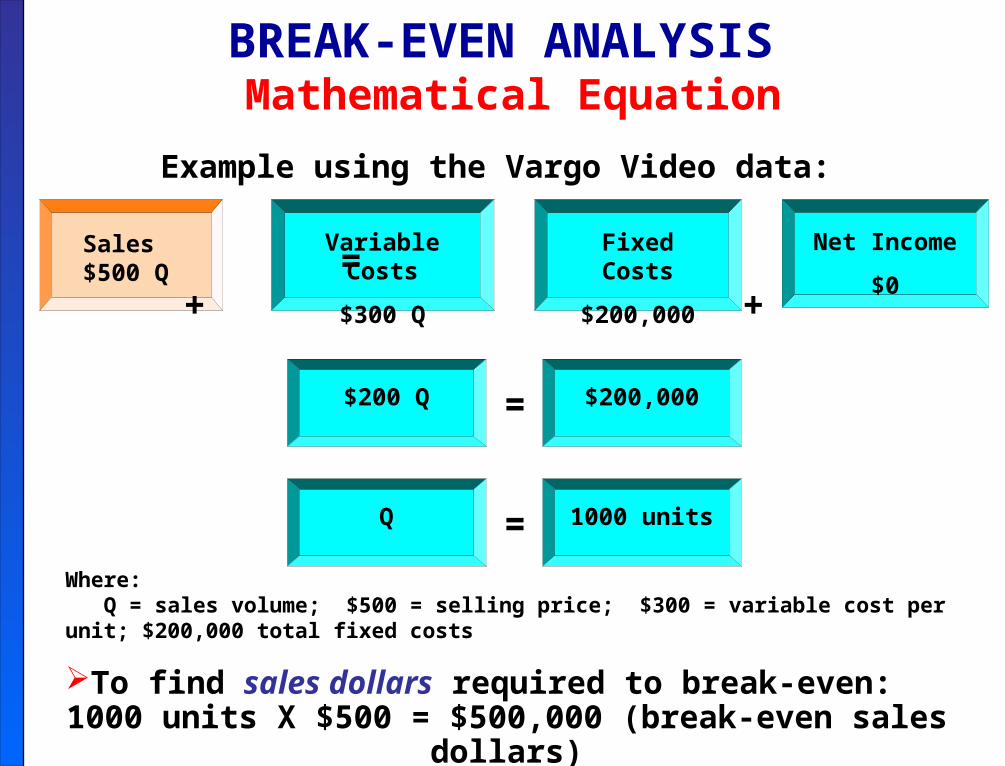
BREAK-EVEN ANALYSIS Mathematical Equation
Variable Costs
$300 Q
Fixed Costs
$200,000
Net Income
$0
Sales$500 Q = + +
Example using the Vargo Video data:
Where: Q = sales volume; $500 = selling price; $300 = variable cost per unit; $200,000 total fixed costs
To find sales dollars required to break-even:1000 units X $500 = $500,000 (break-even sales dollars)
$200 Q $200,000
Q 1000 units
=
=
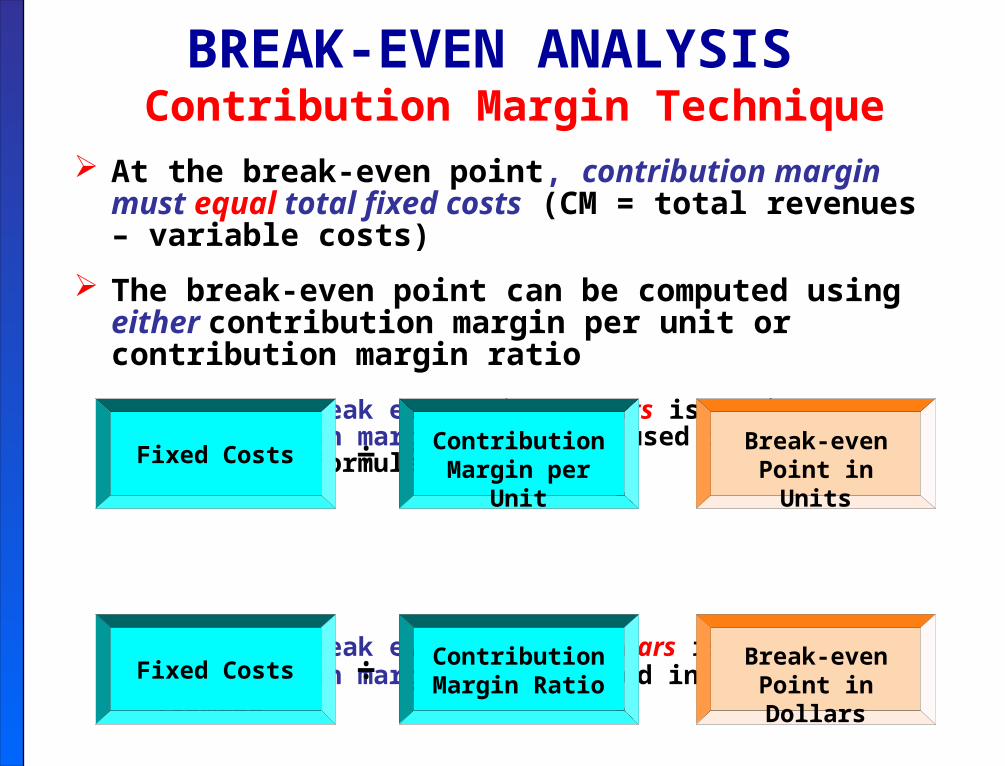
BREAK-EVEN ANALYSIS Contribution Margin Technique
At the break-even point, contribution margin must equal total fixed costs (CM = total revenues – variable costs)
The break-even point can be computed using either contribution margin per unit or contribution margin ratio
When the break even point in units is desired, contribution margin per unit is used in the following formula
When the break even point in dollars is desired, contribution margin ratio is used in the following formula
÷ =Fixed CostsBreak-even Point
in UnitsContribution
Margin per Unit
÷ =Fixed CostsBreak-even Point
in DollarsContribution Margin Ratio

BREAK-EVEN ANALYSIS Contribution Margin Technique
Example using Vargo Video data:
÷ =Fixed Costs
$200,000
Break-even Point in Units
1,000 units
Contribution Margin per Unit
$200
÷ =Fixed Costs
$200,000
Break-even Point in Dollars
$500,000
Contribution Margin per Unit
40%

BREAK-EVEN ANALYSISGraphic Presentation
A cost-volume-profit (CVP) graph shows costs, volume, and profits
Used to visually find the break-even point To construct a CVP graph,
Plot the total revenue linestarting at the zero activity level
Plot the total fixed costby a horizontal line
Plot the total cost line. (Starts at the fixed cost line at zero activity)
Determine the break-even point from the intersection of the total cost line and the total revenue line

BREAK-EVEN ANALYSIS CVP Graph for Vargo Video
BREAK-EVEN ANALYSIS Target Net Income
Study Objective 7
Level of sales necessary to achieve a specified income
Can be determined from each of the approaches used to determine break-even sales/units
May be expressed either in sales dollars or sales units

BREAK-EVEN ANALYSIS Target Net Income - Example
Using the Contribution Margin Approachand the Vargo Video Data:
Formula for required sales in units:
Formula for required sales in dollars
÷ =Contribution Margin Ratio
40%
Fixed Costs + Target Net Income
$200,000 + $120,000
Required Sales in Dollars
$800,000
÷ =Contribution
Margin Per Unit
$200
Fixed Costs + Target Net Income
$200,000 + $120,000
Required Sales in Units
1,600 units

BREAK-EVEN ANALYSIS Margin of Safety
Difference between actual or expected sales and sales at the break-even point
May be expressed in dollars or as a ratio
Example -
To determine the margin of safety in dollars for Vargo Video assuming that actual (expected) sales are $750,000:
– =Margin of Safety
in Dollars
$250,000
Break-even Sales
$500,000
Actual (Expected) Sales
S750,000

BREAK-EVEN ANALYSIS Margin of Safety Ratio
Study Objective 8
Computed by dividing the margin of safety in dollars by the actual or expected sales (using Vargo Video data)
Results indicate that Vargo Video’s sales could fall by 33 percent before it would be operating at a loss.
The higher the dollars or the percentage, the greater the margin of safety.
÷ =Margin of Safety
Ratio
33%
Actual (Expected) Sales
$750,000
Margin of Safety in Dollars
$250,000