Embed Size (px)
Citation preview
179The Eleventh Quadrennial Review of Military Compensation
The views expressed in this paper represent those of the author and are not necessarily those of the Department of Defense.
Chapter 5
Evaluation of the Effect of CSRB Offered to Retirement-Eligible Special Forces Personnel
John t. warner
IntroductionOver the period of the all-volunteer force (AVF), the U.S. Department of Defense (DOD) has made frequent use of bonuses to manage retention of personnel in hard-to-retain occupations. Retention bonuses have been paid to both officers and enlisted personnel, and the bulk of the bonuses have been paid to personnel at the end of their initial service obligation or at the end of the following period of commitment. There is now a substantial literature analyzing the retention effects of the Selective Reenlistment Bonus (SRB), which is paid to enlisted personnel in Zone A (2–6 years of service), Zone B (7–10 years of service), and Zone C (11–14 years of service).1
The National Defense Authorization Act for 2001 gave the Secretary of Defense the authority to designate certain skills as “critical” and permitted payment of reten-tion bonuses of up to $200,000 to personnel with critical skills. The bonus was therefore named the Critical Skills Retention Bonus (CSRB). The CSRB differed from previous bonuses such as SRB by permitting larger payments. And unlike previous bonuses, CSRB was authorized for personnel with more than 14 years of service (YOS).
Faced with the problem of growing its Special Operations Force (SOF) in light of events in Afghanistan and Iraq, on October 1, 2002 the Army began paying CSRB to certain SOFs who had between 20 and 25 years of service, i.e., to personnel who were retirement-eligible.2 SOFs could apply for CSRB after reaching the 19½-year mark and could obligate on a per-year basis beyond the 20-year point out to the
1. Asch, Warner, and Hosek (2007) review the literature on the retention effects of SRBs and Asch et al. (2010) provide an original analysis of SRB effects using data spanning the period of operations in Iraq and Afghanistan.
2. Army Milpers Message 02-256, dated September 27, 2002.
The Eleventh Quadrennial Review of Military Compensation180
Chapter 5
Retention Control Point (RCP) for their rank. Thus, if the RCP was 24 years, they were eligible to receive CSRB for a maximum of four years. CSRBs were paid in a lump-sum based on the agreed-upon additional obligated service. Those in the rank of E-7 (Sergeant First Class) were authorized a bonus of $10,000 per additional year of obligated service, while those in the rank E-8 (Master Sergeant) were authorized a CSRB of only $8,000 per year of additional obligated service. Those in the rank of E-9 were not eligible for CSRB.
On January 1, 2005, the Army overhauled its CSRB program for SOF personnel.3 The first step in the overhaul was to allow personnel to apply for CSRB at the 18½-year mark, with additional obligated service countable for bonus purposes to begin at the start of the 19th year of service rather than the 20th. This step implied that the first year of obligated service for someone just beginning YOS 19 was a year the individual would have had to serve anyway to attain retirement eligibility. The second step was to allow CSRB recipients to obligate to the end of their 25th year of service, thereby deferring their RCP if the RCP for their rank was less than YOS 25.4 The third step was to require a minimum two-year commitment from the contract date for receipt of CSRB. The fourth step was to make E-9s eligible for CSRB. Finally, the January 2005 overhaul changed the bonus amounts, which are displayed in Table 1. These same bonus amounts have been in effect since then.
For an E-7 beyond YOS 19 who had not yet selected CSRB, the new program actually reduced the value of a two-year obligation from $20,000 to $18,000. However, it must be remembered that for someone at YOS 19, the new program effectively reduced by one year the obligated service required to attain the same total service at separation. Thus, under the new program an E-7 obligating for two additional years of service at the 19-year mark would receive an $18,000 CSRB; under the old program an E-7 at the 20-year mark would receive a $10,000 CSRB for one additional year. Thus, the payoff for the same total career length was increased by $8,000; furthermore, personnel got the bonus a year earlier under the new program.
3. Army Milpers Message 04-356, dated December 30, 2004.
4. On January 31, 2006 the Army raised the RCP for E-7s from 22 to 24 years (Department of the Army, 2006). This implied that E-7 SOFs receiving CSRB in the period prior to January, 2005 would have been eligible to receive CSRB for a maximum of two years, with a maximum implied amount of $20,000. The E-8 RCP was YOS 26 throughout 2001–2009 and the E-9 RCP was 30 years. Personnel in these ranks would therefore have been eligible to receive the full five years’ worth of CSRB in the 2003–2004 period.
Table 1. CSRB Award Amounts by Additional Obligated Service (Effective January 2005)
Additional Obligated Service 2 Years 3 Years 4 Years 5 Years 6 Years
Amount $18,000 $30,000 $50,000 $75,000 $150,000
The Eleventh Quadrennial Review of Military Compensation 181
Evaluation of the Effect of CSRB
For E-7s, the modal rank at YOS 20, the program significantly raised the payoff for longer periods of total active service compared to the older program. Under the older program, an E-7 committing to four additional years at YOS 20 would receive a CSRB of $40,000. Under the revised program, an E-7 committing to five additional years at the 19-year mark and remaining for a 24-year career would receive a CSRB of $75,000. Similarly, the value of a 25-year career was increased from $50,000 under the old program to $75,000 under the new program. Most significantly, the maximum CSRB value for a 25-year career was raised by $100,000, from $50,000 to $150,000. Furthermore, due to relaxation of up-or-out points, the revised program made career lengths possible that were not possible under the prior program.
Since under the older program E-8s received smaller CSRB amounts than E-7s, the revised program provided even larger increases for them. And since E-9s were not eligible for CSRB under the older program, the amounts shown in Table 1 reflect the increases they received under the revised program.
The CSRB program for Army SOFs represents the first time that retention bonuses have been aimed at retirement-eligible personnel, and not much analysis has been done of its effects on retention and cost. The purpose of this chapter is to study the retention effects of the program and to estimate its cost.
MethodologyMost analyses of the retention effects of military compensation formulate and estimate an economic model of retention decision-making which includes as an explanatory variable a variable measuring the economic incentive to remain in service.5 A complication for the formal modeling approach is that the CSRB amounts that retirement-eligible SOF personnel faced were not changing randomly or smoothly for different personnel at different points in time. The CSRB was introduced at a low level in 2003 and then dramatically scaled up once-and-for-all in January of 2005. Because so many things were changing at the same time before and after the CSRB expansion, it would be difficult to identify the retention effect of the CSRB increase based simply on analysis of how retention of SOF personnel changed upon program expansion.
Although direct estimation of the retention effect of CSRB from SOF retention data alone is not likely to reveal its true effect, there is a relatively simple method of analysis that is more likely to do so. The method, called difference-in-differences (DID), is easy to implement without formal economic modeling. It says to compare
5. Descriptions of these models are available in Asch et al. (2007), as well as other references cited in that review.
The Eleventh Quadrennial Review of Military Compensation182
Chapter 5
changes in SOF retention before and after the CSRB expansion with changes in retention of an otherwise similar control group that was not eligible for CSRB. To the extent that retention changes of both groups are subject to common retention shocks arising from factors other than the CSRB, this method will “difference out” these common shocks and thereby identify the true bonus effect.
Due to the fact that Army SOF personnel are highly selected and trained, one might argue that there is no perfect control group for a DID analysis. However, an arguably good control group is Army Career Management Field 11 (CMF 11, Infantry). SOF personnel are selected from CMF 11 and personnel in CMF 11 often work under the same conditions as SOF personnel, and furthermore have similar deployment tempos. The analysis below attempts to identify the retention effects of CSRB using retirement-eligible Infantry personnel as a control group. Two DID methods are implemented below, a simple DID estimator and a regression-based estimator. These methods are now briefly described.
Simple DID EstimatorIn the ideal framework for DID estimation, there exist two groups of individuals,
a control group and a treatment group. Individuals of each group are observed during some period of time before the treatment is applied (base period) and then for a period of time after the treatment is applied. The variable Yi,t,j represents an outcome of interest, where j denotes the jth member of group i ( i = 0 = control group and i = 1 = treated group) and t denotes the time period (t = 0 = base period and t = 1 = treat-ment period). The average value of Yi,t is observed for each group and each period. Let
and represent the average values of the outcome variable for the control and treatment groups, respectively, during the base period and let and represent their respective average values during the treatment period. The DID estimator of the effect of the treatment effect, denoted , is given by
(1)
The treatment effect simply shows the difference between the change in the average value of the response variable Y for the treated group and the change in Y for the control group. The intent of the method is to difference out any common factors that are causing the response variable Y to change similarly for both groups between the base period and the treatment period. As an example, if changes in military pay or civilian unemployment cause retention of both SOFs and CMF 11 personnel to change over time, the DID estimator will control for that. That is to say, a requirement for the DID estimator to be unbiased (i.e., on average give the true treatment effect τ), is that the time trend in the response variable Y in fact be the same
The Eleventh Quadrennial Review of Military Compensation 183
Evaluation of the Effect of CSRB
for the two groups. If the trends for the two groups are not the same (common), the DID estimator will be biased.
In the ideal experiment, the members of each group are the same in both time periods. This is ideal because, in addition to any trends affecting Y, any differences in Y due to fixed individual attributes such as race or gender also cancel out. But it is not necessary that the same individuals be observed before and after treatment. In fact, in the application here, different individuals reach retirement eligibility at different points in time, so the groups cannot be the same. But as Cameron and Trivedi (2005, p. 770) discuss, it is not necessary for the same individuals to be in the treatment and control groups before and after treatment; all that is required is that the composition of the groups be stable before and after treatment. If the composition of the groups were not stable, the group averages could be changing due to factors other than the treatment.
In the application here, the outcome variable is a binary indicator for whether the individual remained in service or retired during a given time period. If there are Ni,t individuals in group i at time t, then the estimated sampling variance of the average value of Yi,t is given by the formula . Assuming that the means in equation (1) are independent, the estimated variance of the DID estimator is given by
(2)
This just says that the estimated variance of the simple DID estimator in equation (1) is the sum of the estimated variances of the four group means that comprise the estimator. This variance is easy to calculate from data. The standard error of is given by the square root of its estimated variance.
Regression-Based DID EstimatorIn a regression framework, Yi,t,j is a linear function of (1) observable characteristics
of the individual and any other time-varying variables (Xi,t,j), (2) a dummy variable D i to indicate whether the individual is a member of the control group or the treatment group (Di = 1 if treatment group and Di = 0 if control group), (3) a dummy variable Tt for time period (Tt = 0 if t = 0 and Tt = 1 if t = 1), (4) an interaction variable that is the multiplication of Di and Tt, and (5) a random error ui,t,j that accounts for all other variables omitted from the model. The regression model is written as
The Eleventh Quadrennial Review of Military Compensation184
Chapter 5
(3)
Holding other factors constant, the coefficient δ measures the average overall difference in Y between the two groups. The coefficient γ measures the effect of being in time period 1 rather than time period 0; it is the common time effect for members of either group. The coefficient τ on the interaction variable DiTt is the treatment effect. To see this, note that, since DiTt = 0 for either group in the base period, the change in Y due to being a member of the treatment group in the base period is δ. Since DiTt = 1 when Di = 1 and Tt = 1, the change in Y due to being a member of the treatment group in the treatment period is δ + τ. Thus, τ shows the extra effect on Y due to treatment. Equation (3) is easy to estimate with linear regression.
It may be shown that if the coefficient vector β were equal to 0, regression-based estimation of τ would be equivalent to the simple difference-in-means estimator given by equation (1). All that the regression approach does is to explicitly control for variation in Y arising from factors other than treatment. Furthermore, linear regression gives unbiased, consistent estimates of treatment effects even in the case where the dependent variable is binary.
Panel Data DescriptionThe data for this analysis were provided by the Defense Manpower Data Center (DMDC). DMDC created a panel dataset containing an annual snapshot for each fiscal year (FY) in the period 2001–2009 for each individual whose primary Military Occupation Specialty (MOS) was in Career Field 11 or Career Field 18.6 The dataset contained the individual’s TAFMS (Total Active Federal Military Service) as of the start of each fiscal year, current rank, date of rank, demographic information (age, education, etc.), a separation indicator, separation date, and reason for separation. The dataset includes all individuals with a primary MOS in Career Management Fields 11 and 18 who had more than 204 months of active federal service at the start of the fiscal year. Individuals are tracked until they separate or until the end of FY 2009. Of course, individuals are not eligible to retire from active service until they complete 240 months of active federal service. In fact, personnel losses prior to the 240 month mark are negligible. Almost all losses are due to normal retirement from active duty.7
6. We have information on who was on active duty on September 30, 2001 (end of FY 2001), but not on separations during that year. Information on who stayed and who departed during each fiscal year does not begin until FY 2002.
7. There were only 44 separations due to death among those who separated with more than 19 years of
The Eleventh Quadrennial Review of Military Compensation 185
Evaluation of the Effect of CSRB
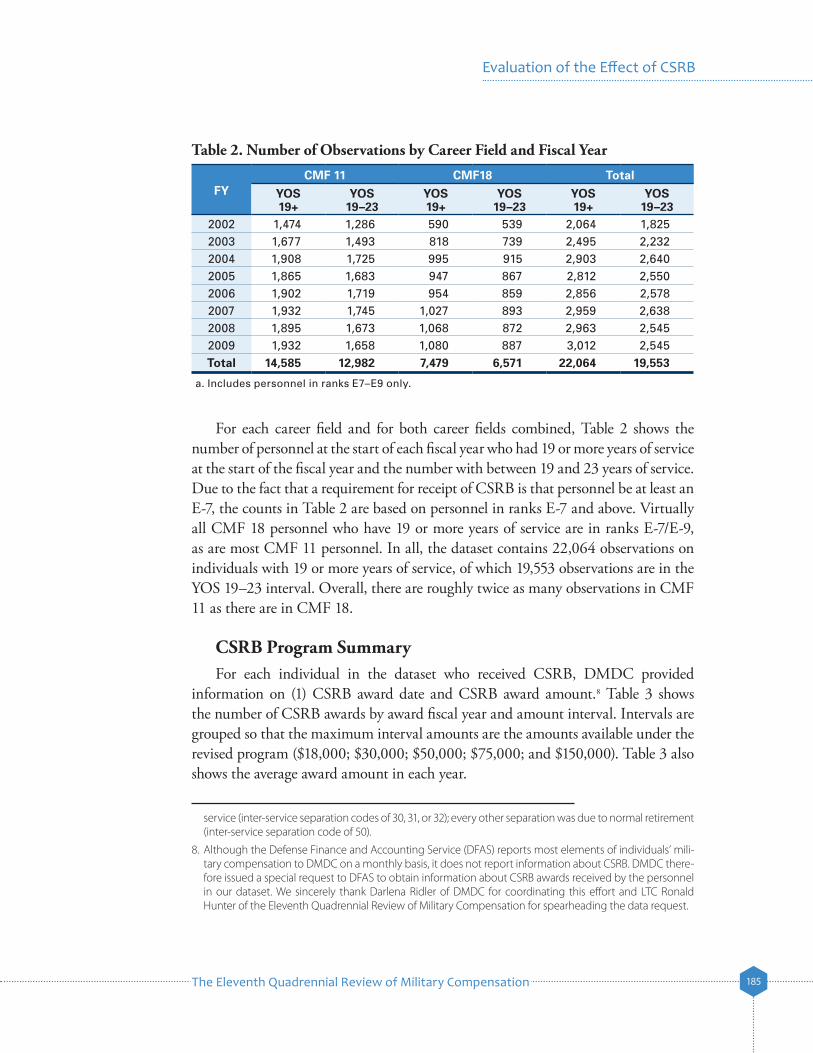
For each career field and for both career fields combined, Table 2 shows the number of personnel at the start of each fiscal year who had 19 or more years of service at the start of the fiscal year and the number with between 19 and 23 years of service. Due to the fact that a requirement for receipt of CSRB is that personnel be at least an E-7, the counts in Table 2 are based on personnel in ranks E-7 and above. Virtually all CMF 18 personnel who have 19 or more years of service are in ranks E-7/E-9, as are most CMF 11 personnel. In all, the dataset contains 22,064 observations on individuals with 19 or more years of service, of which 19,553 observations are in the YOS 19–23 interval. Overall, there are roughly twice as many observations in CMF 11 as there are in CMF 18.
CSRB Program Summary For each individual in the dataset who received CSRB, DMDC provided
information on (1) CSRB award date and CSRB award amount.8 Table 3 shows the number of CSRB awards by award fiscal year and amount interval. Intervals are grouped so that the maximum interval amounts are the amounts available under the revised program ($18,000; $30,000; $50,000; $75,000; and $150,000). Table 3 also shows the average award amount in each year.
service (inter-service separation codes of 30, 31, or 32); every other separation was due to normal retirement (inter-service separation code of 50).
8. Although the Defense Finance and Accounting Service (DFAS) reports most elements of individuals’ mili-tary compensation to DMDC on a monthly basis, it does not report information about CSRB. DMDC there-fore issued a special request to DFAS to obtain information about CSRB awards received by the personnel in our dataset. We sincerely thank Darlena Ridler of DMDC for coordinating this effort and LTC Ronald Hunter of the Eleventh Quadrennial Review of Military Compensation for spearheading the data request.
Table 2. Number of Observations by Career Field and Fiscal Year
FYCMF 11 CMF18 Total
YOS 19+
YOS 19–23
YOS 19+
YOS 19–23
YOS 19+
YOS 19–23
2002 1,474 1,286 590 539 2,064 1,8252003 1,677 1,493 818 739 2,495 2,2322004 1,908 1,725 995 915 2,903 2,6402005 1,865 1,683 947 867 2,812 2,5502006 1,902 1,719 954 859 2,856 2,5782007 1,932 1,745 1,027 893 2,959 2,6382008 1,895 1,673 1,068 872 2,963 2,5452009 1,932 1,658 1,080 887 3,012 2,545Total 14,585 12,982 7,479 6,571 22,064 19,553
a. Includes personnel in ranks E7–E9 only.
The Eleventh Quadrennial Review of Military Compensation186
Chapter 5
The data indicate that 1,352 individuals received CSRB over the 2003-2009 period. All but one of these individuals had a primary MOS in Career Field 18. The fact that only one individual without a primary MOS in Career Field 18 received CSRB is comforting, because maintaining a primary MOS in this career field was one of the criteria for receipt of CSRB.
Retention Rate SummaryAs a prelude to analysis, Table 4 displays the average annual retention rate by
fiscal year of personnel in the YOS interval targeted by CSRB, YOS 19–23. The table shows retention by career field and for the two combined.
Table 4 indicates that, during FY 2002 and FY 2003, SOF retention in YOS 19–23 was much higher than CMF 11 retention. The two career fields then had very similar retention in both FY 2004 and FY 2005. Since FY 2005, SOF retention in YOS 19–23 has risen significantly relative to CMF 11 retention. Just why SOF retention was so much higher in FY 2002 and FY 2003 is explored below.
Table 3. SOF CSRB Award Amount Distribution and Average Amount, by Fiscal Year
Amount($ in thousands)
Fiscal Year of CSRB AwardTotal
2003 2004 2005 2006 2007 2008 2009 $1 – $18 37 8 36 12 8 13 4 118 $19 – $30 85 16 63 19 12 9 4 208 $31 – $50 44 25 62 49 12 12 5 209 $51 – $75 0 1 88 49 21 4 7 170 $76 – $150 0 0 89 163 122 133 140 647Total 166 50 338 292 175 171 160 1,352Average Amount($ in thousands) $24.9 $30.5 $74.0 $106.3 $118.9 $123.5 $136.8 $92.9
Table 4. Retention in YOS 19–23
FYTotal Career Field 11 Career Field 18
Number Rate Number Rate Number Rate2002 1,825 0.775 1,286 0.733 539 0.8762003 2,232 0.782 1,493 0.753 739 0.8402004 2,640 0.714 1,725 0.721 915 0.7012005 2,550 0.715 1,683 0.714 867 0.7192006 2,578 0.742 1,719 0.710 859 0.8082007 2,638 0.760 1,745 0.717 893 0.8432008 2,545 0.763 1,673 0.717 872 0.8522009 2,545 0.813 1,658 0.772 887 0.888
Notes: Number includes personnel in ranks E7–E9 only. Rate is the fraction of personnel in service at the start of the fiscal year who were still in service at the end of the fiscal year.
The Eleventh Quadrennial Review of Military Compensation 187
Evaluation of the Effect of CSRB
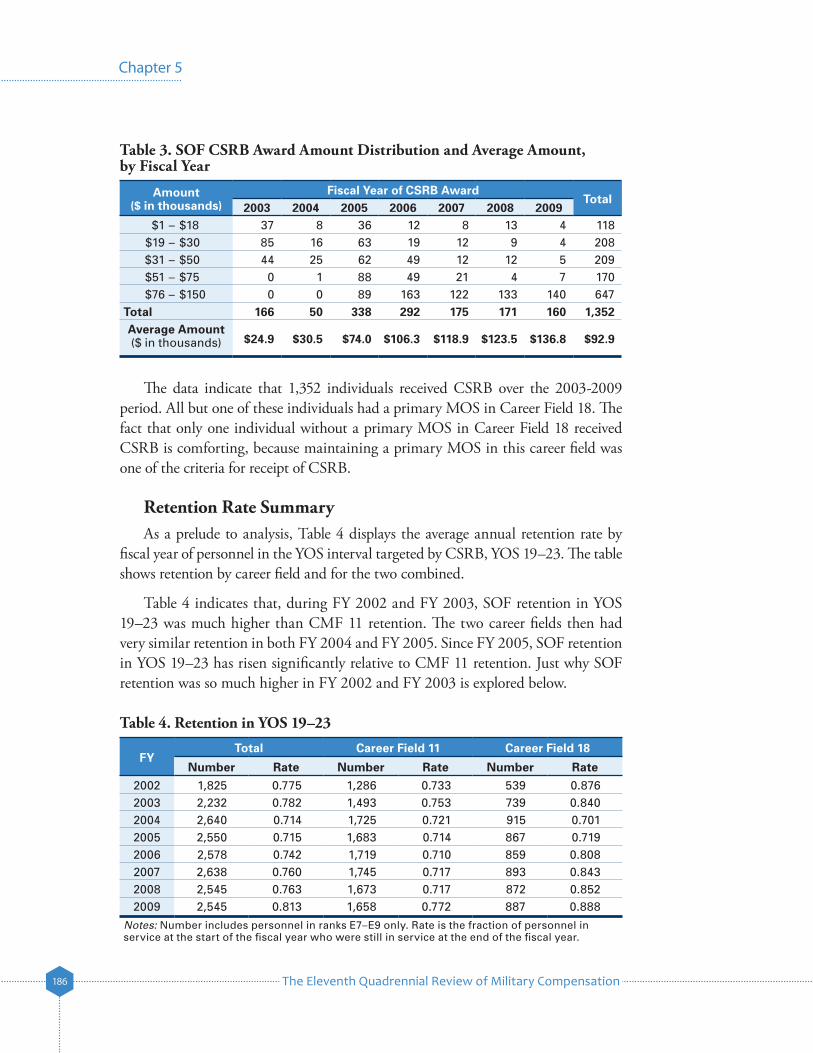
Figures 1 through 4 compare SOF retention and CMF 11 retention in each YOS from 19 to 22 on a year-by-year basis over the FY 2002–2009 period.9 Again, SOF retention at YOS 19, the first YOS cell in which personnel become retirement eligible, was much higher than CMF 11 retention. Retention of the two groups converged in FY 2004. Since then retention of the two groups has risen, with a tendency for SOF retention to rise relative to CMF 11 retention.
9. The raw data underlying Figures 1 through 4 are contained in the appendix at the end of the chapter.
50
Rete
ntio
n Ra
te (p
erce
ntag
e)
55
60
65
70
75
80
85
90
95
100SOF-YOS 19CF 11-YOS 19
2002 2003 2004 2005 2006 2007 2008 2009
Fiscal Year
Figure 1. SOF Retention versus CF 11 Retention at YOS 19
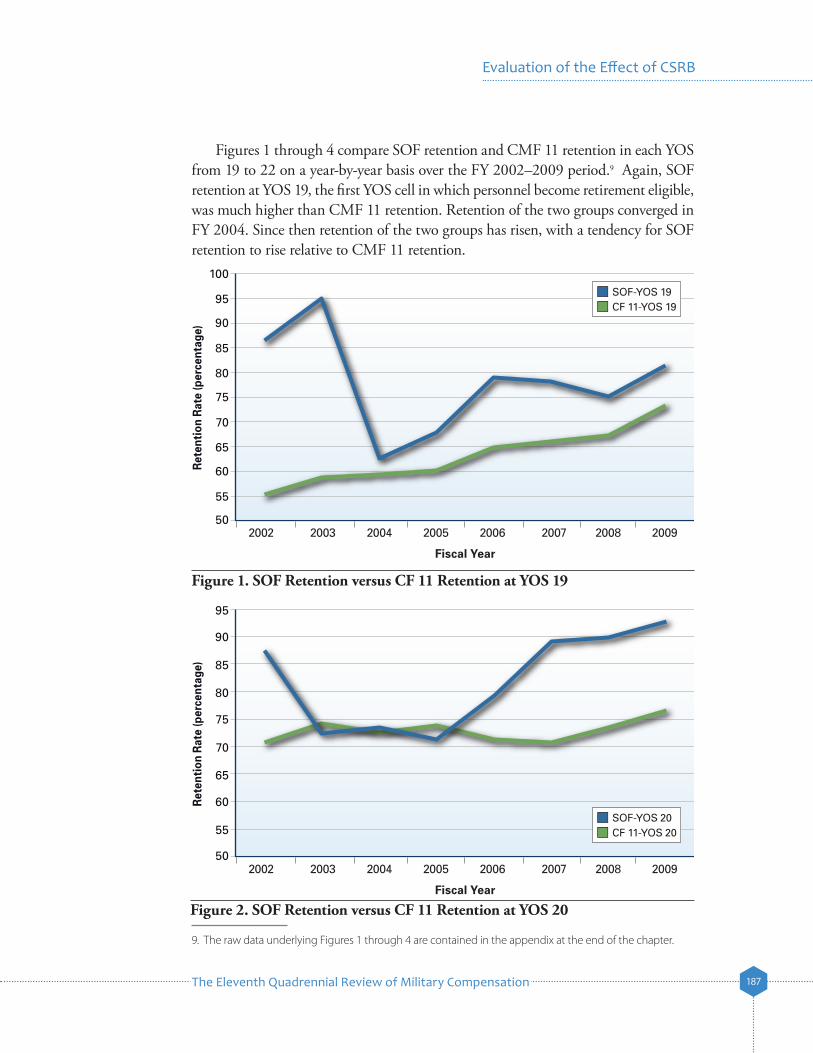
Figure 2. SOF Retention versus CF 11 Retention at YOS 20
50
Rete
ntio
n Ra
te (p
erce
ntag
e)
55
60
65
70
75
80
85
90
95
SOF-YOS 20CF 11-YOS 20
2002 2003 2004 2005 2006 2007 2008 2009
Fiscal Year
The Eleventh Quadrennial Review of Military Compensation188
Chapter 5
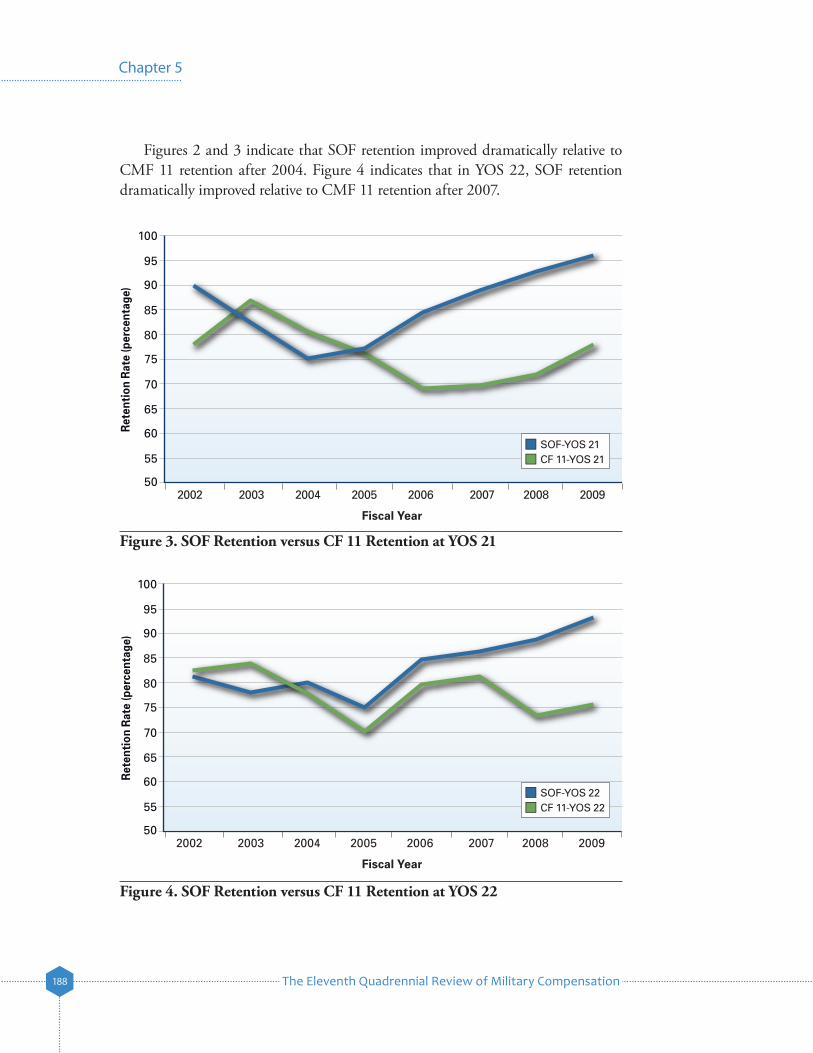
Figure 3. SOF Retention versus CF 11 Retention at YOS 21
50
Rete
ntio
n Ra
te (p
erce
ntag
e)
55
60
65
70
75
80
85
90
95
100
SOF-YOS 21CF 11-YOS 21
2002 2003 2004 2005 2006 2007 2008 2009
Fiscal Year
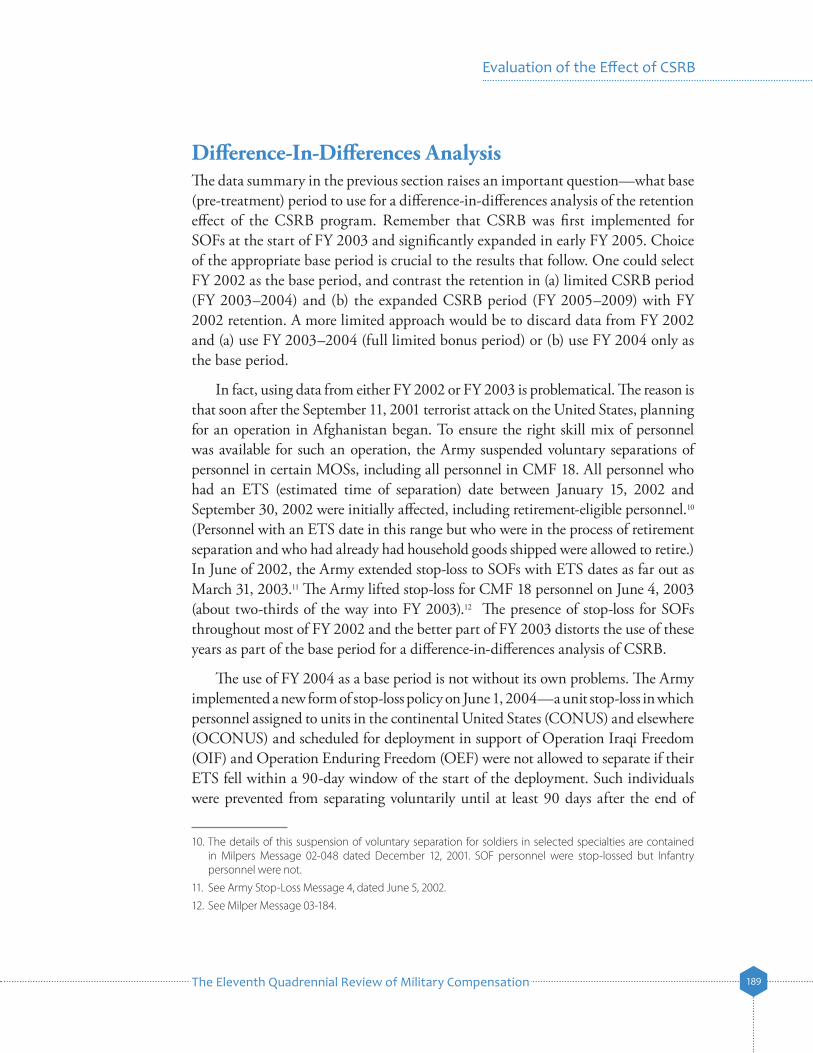
Figure 4. SOF Retention versus CF 11 Retention at YOS 22
50
Rete
ntio
n Ra
te (p
erce
ntag
e)
55
60
65
70
75
80
85
90
95
100
SOF-YOS 22CF 11-YOS 22
2002 2003 2004 2005 2006 2007 2008 2009
Fiscal Year
Figures 2 and 3 indicate that SOF retention improved dramatically relative to CMF 11 retention after 2004. Figure 4 indicates that in YOS 22, SOF retention dramatically improved relative to CMF 11 retention after 2007.
The Eleventh Quadrennial Review of Military Compensation 189
Evaluation of the Effect of CSRB
Difference-In-Differences AnalysisThe data summary in the previous section raises an important question—what base (pre-treatment) period to use for a difference-in-differences analysis of the retention effect of the CSRB program. Remember that CSRB was first implemented for SOFs at the start of FY 2003 and significantly expanded in early FY 2005. Choice of the appropriate base period is crucial to the results that follow. One could select FY 2002 as the base period, and contrast the retention in (a) limited CSRB period (FY 2003–2004) and (b) the expanded CSRB period (FY 2005–2009) with FY 2002 retention. A more limited approach would be to discard data from FY 2002 and (a) use FY 2003–2004 (full limited bonus period) or (b) use FY 2004 only as the base period.
In fact, using data from either FY 2002 or FY 2003 is problematical. The reason is that soon after the September 11, 2001 terrorist attack on the United States, planning for an operation in Afghanistan began. To ensure the right skill mix of personnel was available for such an operation, the Army suspended voluntary separations of personnel in certain MOSs, including all personnel in CMF 18. All personnel who had an ETS (estimated time of separation) date between January 15, 2002 and September 30, 2002 were initially affected, including retirement-eligible personnel.10 (Personnel with an ETS date in this range but who were in the process of retirement separation and who had already had household goods shipped were allowed to retire.) In June of 2002, the Army extended stop-loss to SOFs with ETS dates as far out as March 31, 2003.11 The Army lifted stop-loss for CMF 18 personnel on June 4, 2003 (about two-thirds of the way into FY 2003).12 The presence of stop-loss for SOFs throughout most of FY 2002 and the better part of FY 2003 distorts the use of these years as part of the base period for a difference-in-differences analysis of CSRB.
The use of FY 2004 as a base period is not without its own problems. The Army implemented a new form of stop-loss policy on June 1, 2004—a unit stop-loss in which personnel assigned to units in the continental United States (CONUS) and elsewhere (OCONUS) and scheduled for deployment in support of Operation Iraqi Freedom (OIF) and Operation Enduring Freedom (OEF) were not allowed to separate if their ETS fell within a 90-day window of the start of the deployment. Such individuals were prevented from separating voluntarily until at least 90 days after the end of
10. The details of this suspension of voluntary separation for soldiers in selected specialties are contained in Milpers Message 02-048 dated December 12, 2001. SOF personnel were stop-lossed but Infantry personnel were not.
11. See Army Stop-Loss Message 4, dated June 5, 2002.
12. See Milper Message 03-184.
The Eleventh Quadrennial Review of Military Compensation190
Chapter 5
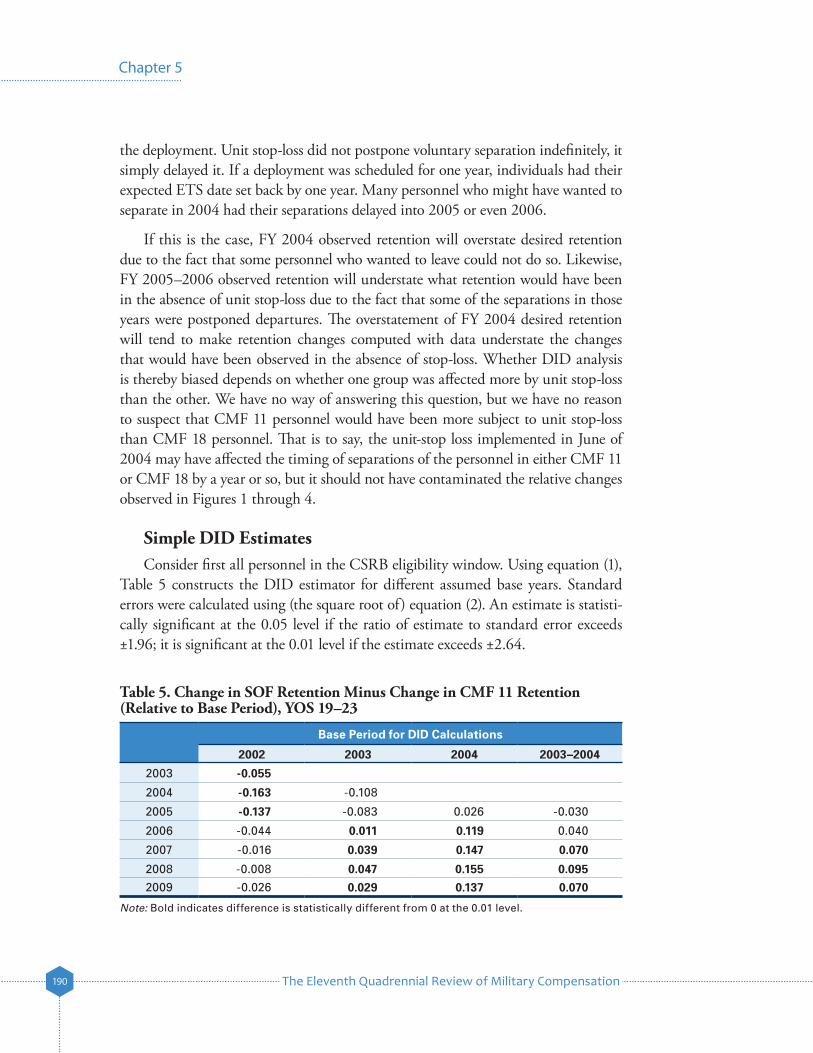
the deployment. Unit stop-loss did not postpone voluntary separation indefinitely, it simply delayed it. If a deployment was scheduled for one year, individuals had their expected ETS date set back by one year. Many personnel who might have wanted to separate in 2004 had their separations delayed into 2005 or even 2006.
If this is the case, FY 2004 observed retention will overstate desired retention due to the fact that some personnel who wanted to leave could not do so. Likewise, FY 2005–2006 observed retention will understate what retention would have been in the absence of unit stop-loss due to the fact that some of the separations in those years were postponed departures. The overstatement of FY 2004 desired retention will tend to make retention changes computed with data understate the changes that would have been observed in the absence of stop-loss. Whether DID analysis is thereby biased depends on whether one group was affected more by unit stop-loss than the other. We have no way of answering this question, but we have no reason to suspect that CMF 11 personnel would have been more subject to unit stop-loss than CMF 18 personnel. That is to say, the unit-stop loss implemented in June of 2004 may have affected the timing of separations of the personnel in either CMF 11 or CMF 18 by a year or so, but it should not have contaminated the relative changes observed in Figures 1 through 4.
Simple DID EstimatesConsider first all personnel in the CSRB eligibility window. Using equation (1),
Table 5 constructs the DID estimator for different assumed base years. Standard errors were calculated using (the square root of) equation (2). An estimate is statisti-cally significant at the 0.05 level if the ratio of estimate to standard error exceeds ±1.96; it is significant at the 0.01 level if the estimate exceeds ±2.64.
Table 5. Change in SOF Retention Minus Change in CMF 11 Retention (Relative to Base Period), YOS 19–23
Base Period for DID Calculations
2002 2003 2004 2003–2004
2003 -0.055
2004 -0.163 -0.108
2005 -0.137 -0.083 0.026 -0.030
2006 -0.044 0.011 0.119 0.040
2007 -0.016 0.039 0.147 0.070
2008 -0.008 0.047 0.155 0.0952009 -0.026 0.029 0.137 0.070
Note: Bold indicates difference is statistically different from 0 at the 0.01 level.
The Eleventh Quadrennial Review of Military Compensation 191
Evaluation of the Effect of CSRB
Consider a DID analysis that uses FY 2002 as the base period. The first column of Table 5 indicates that when this base period is used, SOF retention fell significantly relative to CMF 11 in FY 2003, FY 2004, and FY 2005. Furthermore, when this base period is used, SOF retention did not change significantly relative to CMF 11 retention in any of the years 2006 to 2009.
Previous discussion suggests that the presence of stop-loss for SOF personnel in 2002 makes it an inappropriate base year. Somewhat more positive results are found when FY 2003 is used as the base period. The second column of Table 5 indicates that there was no significant change in SOF retention relative to the change in CMF 11 retention in either FY 2004 or FY 2005. But, the change in SOF retention was significantly different from zero, and positive, in each of the fiscal years 2006–2009. If all of these positive changes were attributable to the CSRB expansion, they would indicate very modest program effects.
As argued above, FY 2004 is the cleanest base period. SOF stop-loss had been revoked by this time although unit stop-loss was in effect for both CMF 11 and CMF 18 personnel. According to column 3 of Table 5, use of FY 2004 as the base period yields much larger estimates of improvement in SOF retention relative to CMF 11 retention in the years following FY 2005. The differences, in fact, are quantitatively large and statistically significant. In fact, the estimates in column 3 suggest that CSRB could have raised YOS 19–23 SOF retention by as much as 11.7–15.5 percentage points relative to what it would have been in the absence of the expansion. If all of the estimated change is in fact due to CSRB, the estimates indicate relatively sizeable program effects. Use of FY 2003–2004 combined as a base period gives smaller, albeit positive and statistically significant, estimates of program effects, in the range of 7 to 9.5 percentage points. However, these estimates may be biased downward for reasons discussed earlier.
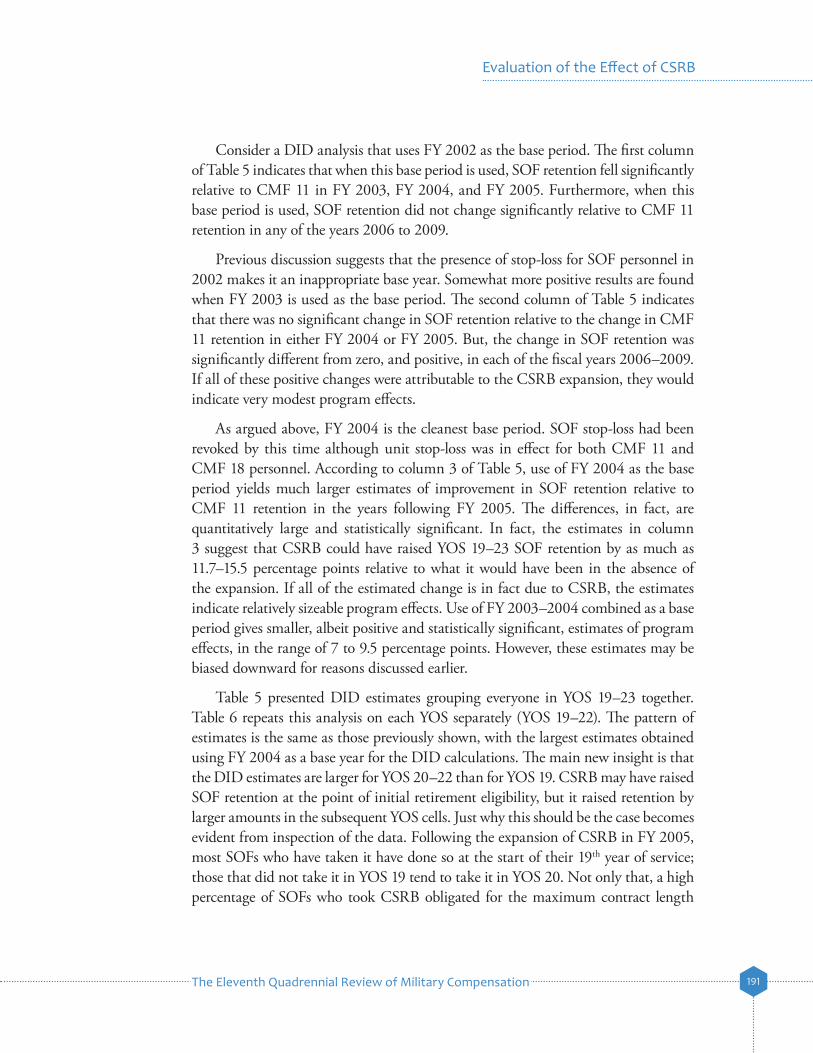
Table 5 presented DID estimates grouping everyone in YOS 19–23 together. Table 6 repeats this analysis on each YOS separately (YOS 19–22). The pattern of estimates is the same as those previously shown, with the largest estimates obtained using FY 2004 as a base year for the DID calculations. The main new insight is that the DID estimates are larger for YOS 20–22 than for YOS 19. CSRB may have raised SOF retention at the point of initial retirement eligibility, but it raised retention by larger amounts in the subsequent YOS cells. Just why this should be the case becomes evident from inspection of the data. Following the expansion of CSRB in FY 2005, most SOFs who have taken it have done so at the start of their 19th year of service; those that did not take it in YOS 19 tend to take it in YOS 20. Not only that, a high percentage of SOFs who took CSRB obligated for the maximum contract length
The Eleventh Quadrennial Review of Military Compensation192
Chapter 5
(Table 4). CSRB thus locks into long-term contracts individuals who would otherwise have been free to make annual retention decisions after becoming retirement-eligible. The data clearly indicate that SOFs under CSRB contract continue from one fiscal year to the next with an almost 100 percent certainty.
Table 6. Change in SOF Retention Minus Change in CMF 11 Retention (Relative to Base Period), by YOS
Base Period for DID Calculations
2002 2003 2004 2003–2004
Panel A: YOS 19
2003 0.068
2004 -0.246 -0.314
2005 -0.162 -0.230 0.083 -0.069
2006 -0.075 -0.143 0.171 0.018
2007 -0.081 -0.149 0.165 0.013
2008 -0.107 -0.175 0.139 -0.014
2009 -0.134 -0.202 0.112 -0.041
Panel B: YOS 20
2003 -0.175
2004 -0.153 0.022
2005 -0.182 -0.008 -0.030 -0.020
2006 -0.084 0.091 0.069 0.079
2007 0.030 0.204 0.183 0.192
2008 0.000 0.174 0.152 0.162
2009 -0.004 0.171 0.149 0.159
Panel C: YOS 21
2003 -0.163
2004 -0.173 -0.010
2005 -0.111 0.052 0.062 0.060
2006 0.019 0.182 0.192 0.190
2007 0.030 0.193 0.203 0.201
2008 0.045 0.207 0.218 0.215
2009 0.036 0.199 0.209 0.207
Panel D: YOS 22
2003 -0.048
2004 0.033 0.081
2005 0.058 0.105 0.025 0.066
2006 0.062 0.109 0.029 0.070
2007 0.054 0.102 0.021 0.062
2008 0.160 0.208 0.127 0.1682009 0.175 0.223 0.142 0.183
Note: Bold indicates difference is statistically different from 0 at the 0.01 level.
The Eleventh Quadrennial Review of Military Compensation 193
Evaluation of the Effect of CSRB
Difference-In-Differences RegressionsTable 7 provides regression-based estimates of the effects of the DID model. Estimates of the effects of key variables are shown for YOS 19–23 combined and for YOS 19–20 and YOS 21–23 separately. The key effects shown in Table 5 are the main SOF effect (the parameter δ in equation (3)) and five interactions between SOF and fiscal year. The coefficients on these interactions indicate how SOF retention changed relative to CMF 11 retention between the base period (FY 2004) and the fiscal year of interest. They are the key estimates of interest (τ effects). The estimated models also included five fiscal year dummies, controls for rank (E-8 and E-9), controls for YOS, controls for the individual’s demographic characteristics, and controls for the number of months the individual spent in a combat zone in the previous fiscal year.13
Real military pay trended upward over the period of the data. In principle, the time effects included in the model should capture this upward trend if the trend is common to both SOF and CMF 11 personnel. To see whether the time effects fully absorb the pay trend, two models were estimated, one without a control for real pay (Model 1) and one with a control for pay (Model 2). The included pay variable was real basic pay (basic pay in 2010 dollars).14 Estimates of program effects obtained with a model that includes real basic pay are less likely to be biased due to exclusion of relevant trend-related variables.
The regression-based DID estimates of CSRB effects have a similar pattern to those shown previously. Consider first the Model 1 estimates. For the whole YOS interval 19–23, the interaction effects (τ estimates) rise in value from the statistically insignificant value of 0.017 in FY 2005 to the highly statistically significant value of 0.139 in FY 2008. Estimates for FY 2007, FY 2008, and FY 2009 hover in a tight range. Going from Model 1 to Model 2, each estimate of τ falls by about 0.02–0.04 upon inclusion of real basic pay as a variable. The most affected, the FY 2009 interaction, declines from 0.116 to 0.076. Despite declining in numerical value, the interaction effects remain statistically significant, usually at the 0.01 level. FY 2007 and FY 2008 estimates are still about 0.1 with real basic pay included in the model.
When models are estimated separately for those in YOS 19–20 and those in YOS 21–23, the pattern and size of estimates are similar to estimates obtained with combined data.
13. Dummies are included for 4–6 months in a combat zone, 7–9 months, and more than 9 months.
14. Although a more comprehensive pay variable such as Regular Military Compensation (RMC) might have been preferable, it was not directly observable. Basic pay was directly observable in the data, and it is highly correlated with more comprehensive compensation measures.
The Eleventh Quadrennial Review of Military Compensation194
Chapter 5
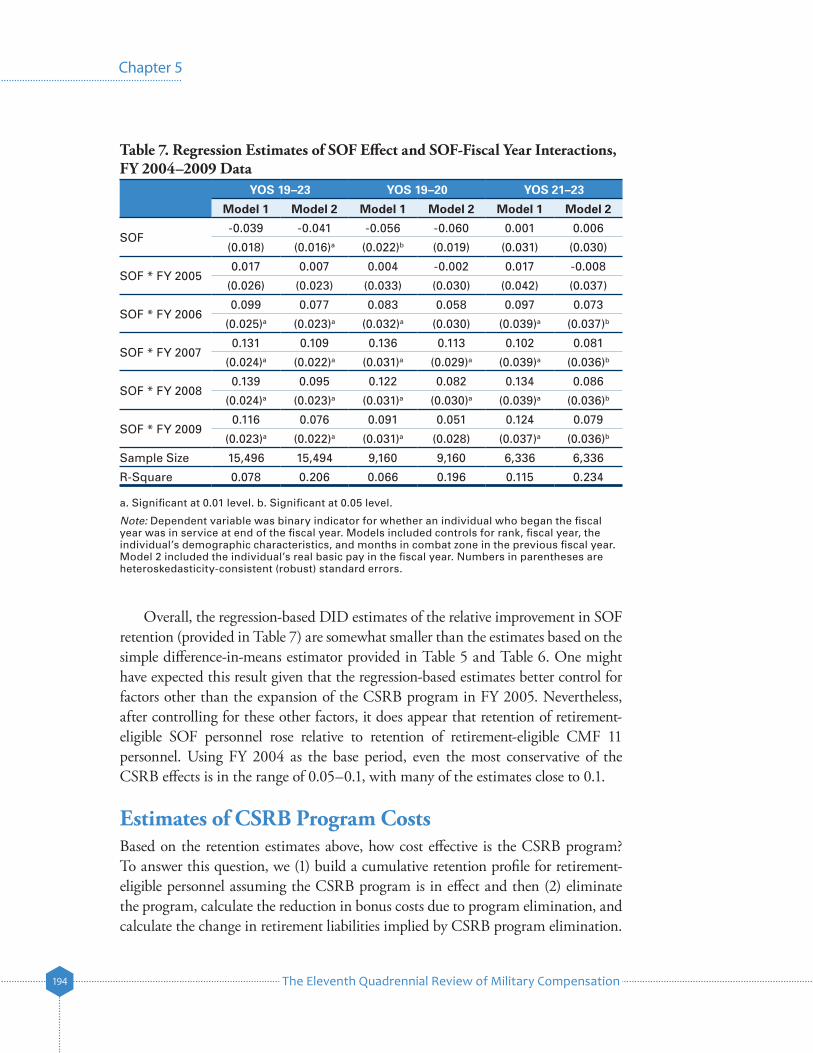
Overall, the regression-based DID estimates of the relative improvement in SOF retention (provided in Table 7) are somewhat smaller than the estimates based on the simple difference-in-means estimator provided in Table 5 and Table 6. One might have expected this result given that the regression-based estimates better control for factors other than the expansion of the CSRB program in FY 2005. Nevertheless, after controlling for these other factors, it does appear that retention of retirement-eligible SOF personnel rose relative to retention of retirement-eligible CMF 11 personnel. Using FY 2004 as the base period, even the most conservative of the CSRB effects is in the range of 0.05–0.1, with many of the estimates close to 0.1.
Estimates of CSRB Program CostsBased on the retention estimates above, how cost effective is the CSRB program? To answer this question, we (1) build a cumulative retention profile for retirement-eligible personnel assuming the CSRB program is in effect and then (2) eliminate the program, calculate the reduction in bonus costs due to program elimination, and calculate the change in retirement liabilities implied by CSRB program elimination.
Table 7. Regression Estimates of SOF Effect and SOF-Fiscal Year Interactions, FY 2004–2009 Data
YOS 19–23 YOS 19–20 YOS 21–23
Model 1 Model 2 Model 1 Model 2 Model 1 Model 2
SOF-0.039 -0.041 -0.056 -0.060 0.001 0.006
(0.018) (0.016)a (0.022)b (0.019) (0.031) (0.030)
SOF * FY 20050.017 0.007 0.004 -0.002 0.017 -0.008
(0.026) (0.023) (0.033) (0.030) (0.042) (0.037)
SOF * FY 20060.099 0.077 0.083 0.058 0.097 0.073
(0.025)a (0.023)a (0.032)a (0.030) (0.039)a (0.037)b
SOF * FY 20070.131 0.109 0.136 0.113 0.102 0.081
(0.024)a (0.022)a (0.031)a (0.029)a (0.039)a (0.036)b
SOF * FY 20080.139 0.095 0.122 0.082 0.134 0.086
(0.024)a (0.023)a (0.031)a (0.030)a (0.039)a (0.036)b
SOF * FY 20090.116 0.076 0.091 0.051 0.124 0.079
(0.023)a (0.022)a (0.031)a (0.028) (0.037)a (0.036)b
Sample Size 15,496 15,494 9,160 9,160 6,336 6,336
R-Square 0.078 0.206 0.066 0.196 0.115 0.234
a. Significant at 0.01 level. b. Significant at 0.05 level.
Note: Dependent variable was binary indicator for whether an individual who began the fiscal year was in service at end of the fiscal year. Models included controls for rank, fiscal year, the individual’s demographic characteristics, and months in combat zone in the previous fiscal year. Model 2 included the individual’s real basic pay in the fiscal year. Numbers in parentheses are heteroskedasticity-consistent (robust) standard errors.
The Eleventh Quadrennial Review of Military Compensation 195
Evaluation of the Effect of CSRB
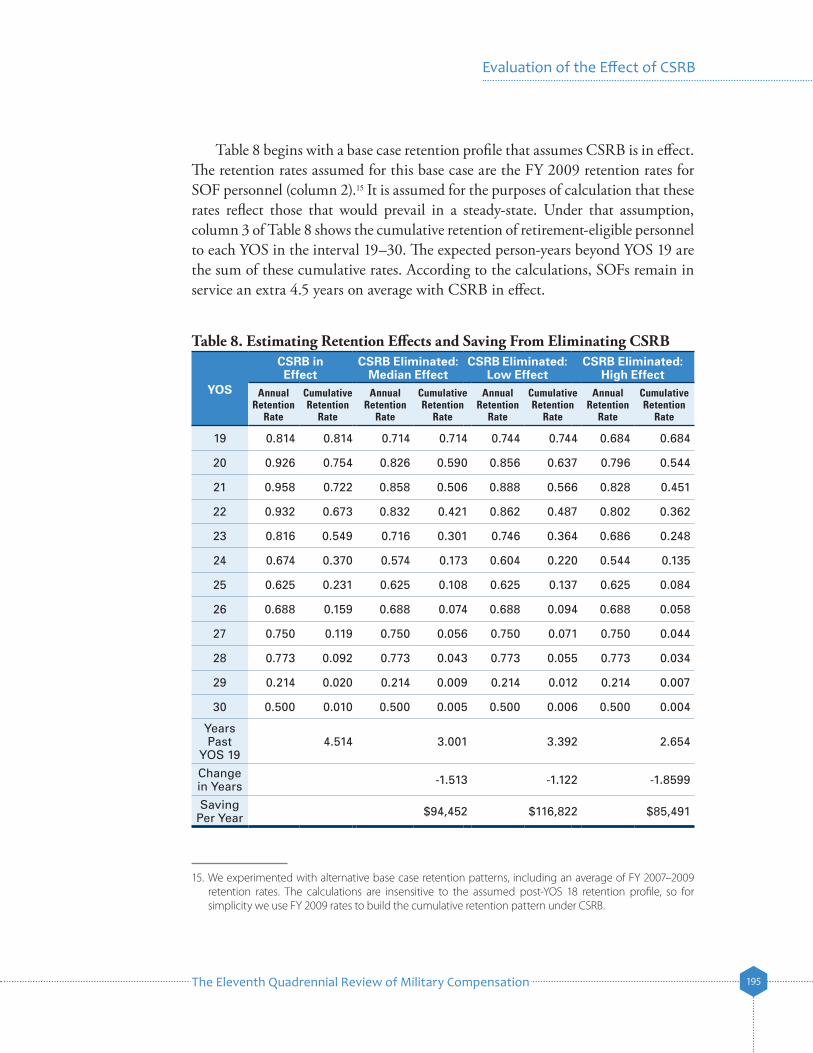
Table 8 begins with a base case retention profile that assumes CSRB is in effect. The retention rates assumed for this base case are the FY 2009 retention rates for SOF personnel (column 2).15 It is assumed for the purposes of calculation that these rates reflect those that would prevail in a steady-state. Under that assumption, column 3 of Table 8 shows the cumulative retention of retirement-eligible personnel to each YOS in the interval 19–30. The expected person-years beyond YOS 19 are the sum of these cumulative rates. According to the calculations, SOFs remain in service an extra 4.5 years on average with CSRB in effect.
15. We experimented with alternative base case retention patterns, including an average of FY 2007–2009 retention rates. The calculations are insensitive to the assumed post-YOS 18 retention profile, so for simplicity we use FY 2009 rates to build the cumulative retention pattern under CSRB.
Table 8. Estimating Retention Effects and Saving From Eliminating CSRB
YOS
CSRB in Effect
CSRB Eliminated:Median Effect
CSRB Eliminated:Low Effect
CSRB Eliminated:High Effect
Annual Retention
Rate
Cumulative Retention
Rate
Annual Retention
Rate
Cumulative Retention
Rate
Annual Retention
Rate
Cumulative Retention
Rate
Annual Retention
Rate
Cumulative Retention
Rate
19 0.814 0.814 0.714 0.714 0.744 0.744 0.684 0.684
20 0.926 0.754 0.826 0.590 0.856 0.637 0.796 0.544
21 0.958 0.722 0.858 0.506 0.888 0.566 0.828 0.451
22 0.932 0.673 0.832 0.421 0.862 0.487 0.802 0.362
23 0.816 0.549 0.716 0.301 0.746 0.364 0.686 0.248
24 0.674 0.370 0.574 0.173 0.604 0.220 0.544 0.135
25 0.625 0.231 0.625 0.108 0.625 0.137 0.625 0.084
26 0.688 0.159 0.688 0.074 0.688 0.094 0.688 0.058
27 0.750 0.119 0.750 0.056 0.750 0.071 0.750 0.044
28 0.773 0.092 0.773 0.043 0.773 0.055 0.773 0.034
29 0.214 0.020 0.214 0.009 0.214 0.012 0.214 0.007
30 0.500 0.010 0.500 0.005 0.500 0.006 0.500 0.004
Years Past
YOS 194.514 3.001 3.392 2.654
Change in Years -1.513 -1.122 -1.8599
Saving Per Year $94,452 $116,822 $85,491
The Eleventh Quadrennial Review of Military Compensation196
Chapter 5
Now consider the effect of eliminating CSRB. Three scenarios are presented in Table 8. The first is a scenario based on a median estimate of the retention effect of CSRB. The median estimate assumed here is an annual retention rate difference of 0.1 due to the program. Low and high scenarios assume CSRB retention effects of 0.13 and 0.07, respectively. According to the median scenario, eliminating the program would reduce the fraction of retirement-eligible personnel remaining from YOS 19 to YOS 24 from 37 percent to 17.3 percent, a decline of more than 50 percent. Average person-years of additional service decline from 4.51 to 3.0. Under the low scenario, the retention response is more muted. Cumulative retention to YOS 24 only drops from 37 to 22 percent and additional years of service beyond YOS 18 only drop by 1.12. Under the high scenario, cumulative retention to YOS 24 drops to 13.5 percent and additional years beyond YOS 18 decline by 1.86.
To calculate the cost saving implied by these scenarios, an average CSRB payment of $136,800 (Table 4) is assumed. It is furthermore assumed that (1) CSRB payments are taken at the start of YOS 19 and (2) 80 percent of those who stay at YOS 19 receive the CSRB.16 CSRB elimination thus saves $89,084 per person who starts YOS 19 (= 0.814*.8*$136,800). CSRB also lowers the average experience level at separation. This means more years over which the government must make retirement payments, but a lower retirement annuity. On average, the present value of retirement payments is calculated to fall upon CSRB elimination because the present value of the liability reduction due to lower average payment more than offsets the extra years over which the annuity must be paid.17 The net saving on a per person-year basis equals the reduction in CSRB plus the reduction in present value of the retirement liability (discounted to YOS 19) divided by the reduction in person-years per retirement-eligible person.
Under the median scenario, CSRB elimination would save about $94,500 per person-year lost due to program elimination. Or to turn it around, if CSRB did not exist, its implementation would add about $94,500 per person-year gained. Under the low scenario, retention falls less upon program elimination. In this case the saving grows to about $116,800 per person-year lost. Again, to turn it around, if CSRB did not exist, implementation would add $116,800 to cost per person-year gained. Finally, under the most optimistic retention scenario, the saving (cost) due to program elimination (implementation) is only about $85,500.
16. Not everyone who stays at YOS 19 takes CSRB. The 2007–2009 average take rate at YOS 19 among those who stayed was approximately 80 percent.
17. The calculations assume a real government discount rate of 3 percent.
The Eleventh Quadrennial Review of Military Compensation 197
Evaluation of the Effect of CSRB
These cost calculations make clear that CSRB is an expensive program. The marginal cost of extra person-years obtained with the program (or, alternatively, the saving due to its elimination) is much larger than costs of SRB paid to reenlistees in Zone A and Zone B. Estimates contained in Asch et al. (2010) indicate that, for Army enlisted personnel, SRB marginal costs per person-year are around $15,000 in Zone A and $21,000 in Zone B (Table 7.13, p. 84). Why are CSRB marginal costs so much higher for senior SOF personnel than for junior personnel in reenlistment zones A and B? The answer, as it is for all military bonus programs, is that bonuses must be paid to all personnel who would have remained in service in the absence of the bonus as well as those induced to remain because of the bonus. Senior SOFs would still have relatively high retention in the absence of CSRB, so a large percentage of those who would have remained in the absence of the bonus get paid economic rents in order to induce those on the margin of staying or leaving to stay.
Plausibility of Estimates: A Check Based on the Dynamic Retention ModelHow plausible are the estimates of retention effects and cost provided above? One way to check the retention estimates is to see what a structural model would have predicted the change in retention due to CSRB to be. The structural model applied here is a variant of the Dynamic Retention Model (DRM) first developed by Gotz and McCall (1984). The DRM is described in some detail in Asch, Hosek, and Warner (2007), and several recent studies have applied this model to military compensation policy. Asch and Warner (2001) used it to simulate the effects of various structural changes to the enlisted basic pay table for the Ninth Quadrennial Review of Military Compensation (QRMC). This model was also used to evaluate proposals that the Defense Advisory Commission on Military Compensation (DACMC, 2006) put forward to overhaul the military retirement system. Asch et al. (2008) developed another variant of the model to predict the effects of changes to the retirement system being considered by the Tenth Quadrennial Review of Military Compensation. Mattock et al. (2010) developed another variant of the model and used it to predict the effects of changes to various special and incentive (S&I) pays for officers.
Here we use the Asch-Warner (2001) variant of the model, which predicts the steady-state retention pattern of a generic enlisted force under alternative policies. The model was originally calibrated so as to mimic, as closely as possible, the Army enlisted force under existing compensation and personnel policies. The model was recalibrated so that it is consistent with the fact that SOF retention is higher than overall average Army retention. The model predicts that in the absence of CSRB, 21.7 percent of entrants will reach retirement eligibility. The model also predicts that,
The Eleventh Quadrennial Review of Military Compensation198
Chapter 5
with CSRB, the fraction of entrants who stay for a 20-year career only rises from 21.7 to 22.1 percent. This indicates that, if the CSRB has an effect on retention, its effect will be at the 20-year mark and beyond and not prior to that point. The model is based on a steady-state force of 6,000 personnel, roughly the size of the SOF force at the end of FY 2009.
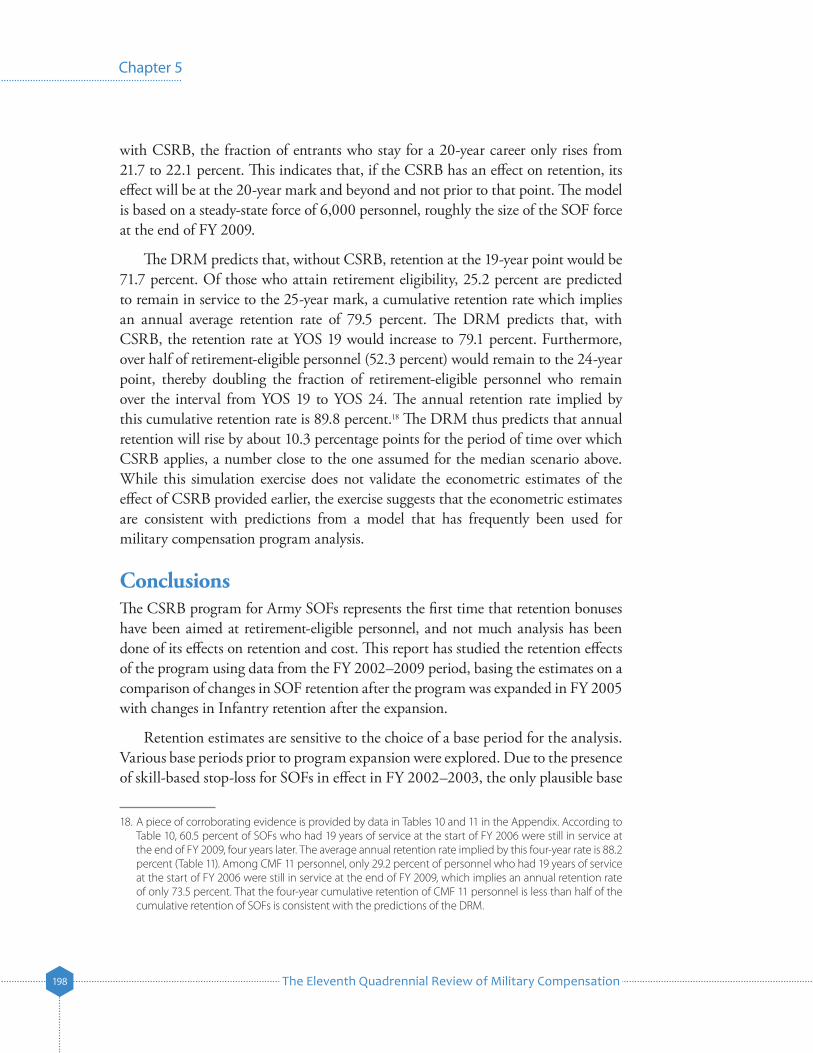
The DRM predicts that, without CSRB, retention at the 19-year point would be 71.7 percent. Of those who attain retirement eligibility, 25.2 percent are predicted to remain in service to the 25-year mark, a cumulative retention rate which implies an annual average retention rate of 79.5 percent. The DRM predicts that, with CSRB, the retention rate at YOS 19 would increase to 79.1 percent. Furthermore, over half of retirement-eligible personnel (52.3 percent) would remain to the 24-year point, thereby doubling the fraction of retirement-eligible personnel who remain over the interval from YOS 19 to YOS 24. The annual retention rate implied by this cumulative retention rate is 89.8 percent.18 The DRM thus predicts that annual retention will rise by about 10.3 percentage points for the period of time over which CSRB applies, a number close to the one assumed for the median scenario above. While this simulation exercise does not validate the econometric estimates of the effect of CSRB provided earlier, the exercise suggests that the econometric estimates are consistent with predictions from a model that has frequently been used for military compensation program analysis.
ConclusionsThe CSRB program for Army SOFs represents the first time that retention bonuses have been aimed at retirement-eligible personnel, and not much analysis has been done of its effects on retention and cost. This report has studied the retention effects of the program using data from the FY 2002–2009 period, basing the estimates on a comparison of changes in SOF retention after the program was expanded in FY 2005 with changes in Infantry retention after the expansion.
Retention estimates are sensitive to the choice of a base period for the analysis. Various base periods prior to program expansion were explored. Due to the presence of skill-based stop-loss for SOFs in effect in FY 2002–2003, the only plausible base
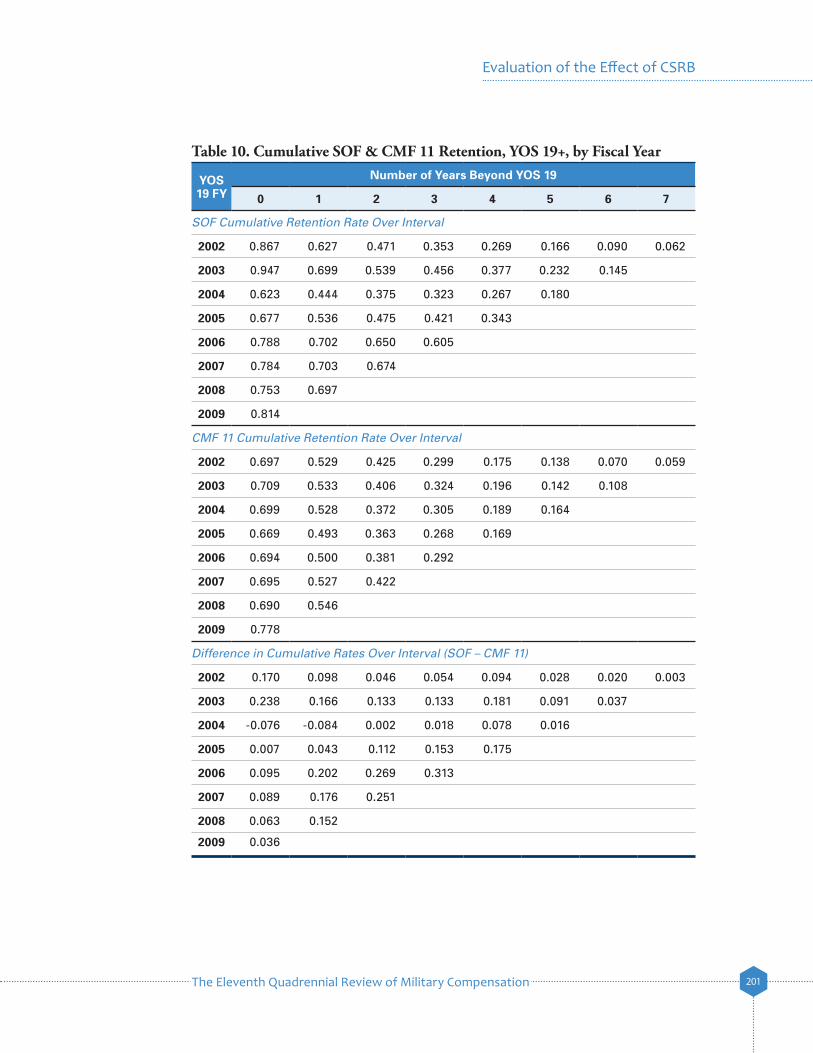
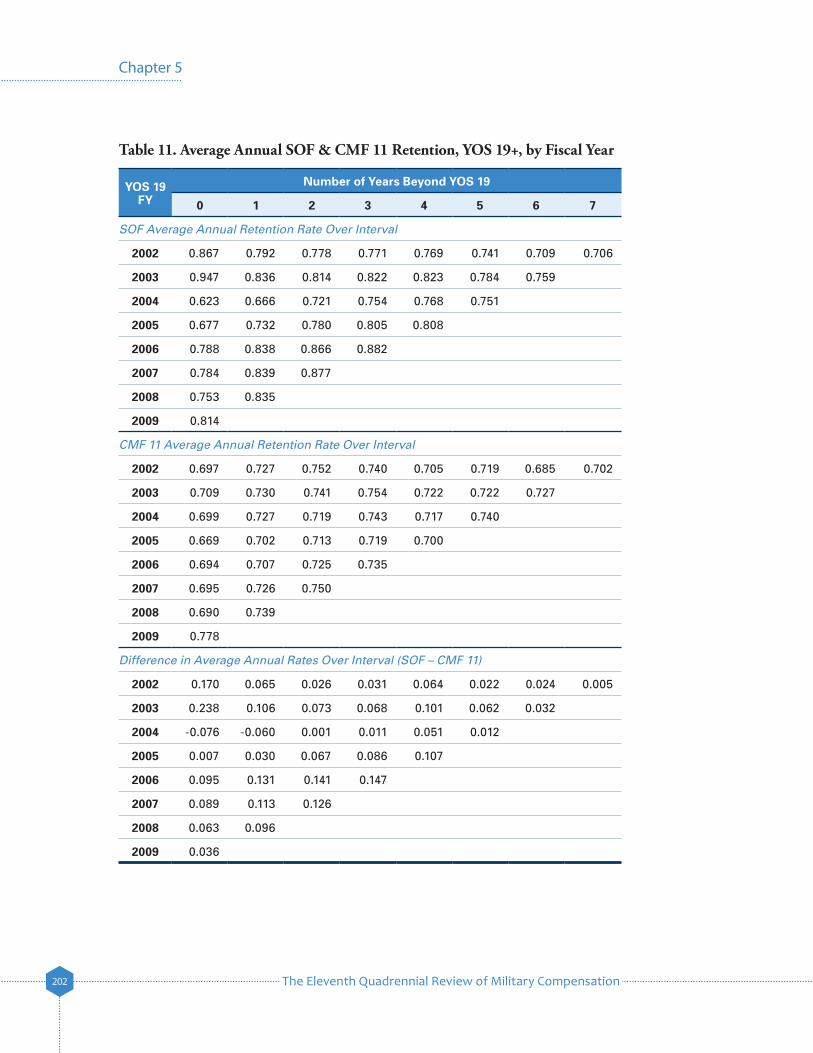
18. A piece of corroborating evidence is provided by data in Tables 10 and 11 in the Appendix. According to Table 10, 60.5 percent of SOFs who had 19 years of service at the start of FY 2006 were still in service at the end of FY 2009, four years later. The average annual retention rate implied by this four-year rate is 88.2 percent (Table 11). Among CMF 11 personnel, only 29.2 percent of personnel who had 19 years of service at the start of FY 2006 were still in service at the end of FY 2009, which implies an annual retention rate of only 73.5 percent. That the four-year cumulative retention of CMF 11 personnel is less than half of the cumulative retention of SOFs is consistent with the predictions of the DRM.
The Eleventh Quadrennial Review of Military Compensation 199
Evaluation of the Effect of CSRB
period for the analysis is FY 2004. Assuming FY 2004 to be the relevant base period, various estimates of the retention effects of CSRB were obtained using (1) a simple difference-in-differences estimator and (2) a regression-based difference-in-differences estimator. Estimates are statistically significant and quantitatively large. Some estimates indicate that the presence of CSRB could have increased annual retention in the YOS 19–23 range by as much as 15 percentage points. Regression-based estimates are somewhat smaller, with a central tendency of around 8–10 percentage points.
These changes in annual retention imply large changes in the fraction of SOFs who reach YOS 19 who will remain in service until the 25-year mark. In fact, a 10-percentage increase in annual retention more than doubles the percentage of personnel who remain from YOS 19 to YOS 25. Though the program has had a marked effect on SOF retention, the retention improvement has not been cheap. Estimates of the marginal cost of the additional person-years induced by the program range from $85,500 to $116,800. The marginal cost of the person-years induced by CSRB is significantly higher than the marginal cost of the person-years induced by the SRB program, which is aimed at junior personnel at the end of their first or second enlistment contracts and considering reenlistment. Like other military compensation programs, the high cost of the CSRB program arises from the fact that many personnel would remain beyond the point of initial retirement eligibility in the absence of the program. In the end, the efficiency of the program depends on the value of having more experienced personnel, as well as the cost of obtaining that extra experience.
The Eleventh Quadrennial Review of Military Compensation200
Chapter 5
Appendix: Tables for SOF Analysis
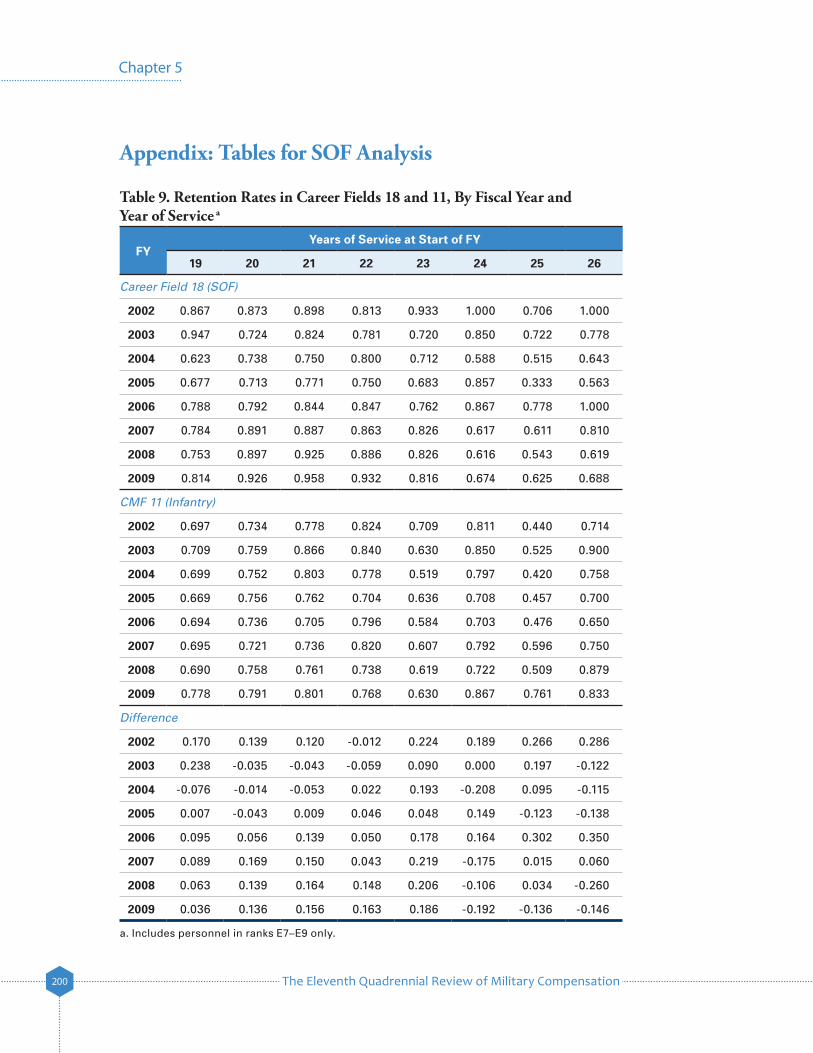
Table 9. Retention Rates in Career Fields 18 and 11, By Fiscal Year and Year of Service a
FYYears of Service at Start of FY
19 20 21 22 23 24 25 26
Career Field 18 (SOF)
2002 0.867 0.873 0.898 0.813 0.933 1.000 0.706 1.000
2003 0.947 0.724 0.824 0.781 0.720 0.850 0.722 0.778
2004 0.623 0.738 0.750 0.800 0.712 0.588 0.515 0.643
2005 0.677 0.713 0.771 0.750 0.683 0.857 0.333 0.563
2006 0.788 0.792 0.844 0.847 0.762 0.867 0.778 1.000
2007 0.784 0.891 0.887 0.863 0.826 0.617 0.611 0.810
2008 0.753 0.897 0.925 0.886 0.826 0.616 0.543 0.619
2009 0.814 0.926 0.958 0.932 0.816 0.674 0.625 0.688
CMF 11 (Infantry)
2002 0.697 0.734 0.778 0.824 0.709 0.811 0.440 0.714
2003 0.709 0.759 0.866 0.840 0.630 0.850 0.525 0.900
2004 0.699 0.752 0.803 0.778 0.519 0.797 0.420 0.758
2005 0.669 0.756 0.762 0.704 0.636 0.708 0.457 0.700
2006 0.694 0.736 0.705 0.796 0.584 0.703 0.476 0.650
2007 0.695 0.721 0.736 0.820 0.607 0.792 0.596 0.750
2008 0.690 0.758 0.761 0.738 0.619 0.722 0.509 0.879
2009 0.778 0.791 0.801 0.768 0.630 0.867 0.761 0.833
Difference
2002 0.170 0.139 0.120 -0.012 0.224 0.189 0.266 0.286
2003 0.238 -0.035 -0.043 -0.059 0.090 0.000 0.197 -0.122
2004 -0.076 -0.014 -0.053 0.022 0.193 -0.208 0.095 -0.115
2005 0.007 -0.043 0.009 0.046 0.048 0.149 -0.123 -0.138
2006 0.095 0.056 0.139 0.050 0.178 0.164 0.302 0.350
2007 0.089 0.169 0.150 0.043 0.219 -0.175 0.015 0.060
2008 0.063 0.139 0.164 0.148 0.206 -0.106 0.034 -0.260
2009 0.036 0.136 0.156 0.163 0.186 -0.192 -0.136 -0.146
a. Includes personnel in ranks E7–E9 only.
The Eleventh Quadrennial Review of Military Compensation 201
Evaluation of the Effect of CSRB
Table 10. Cumulative SOF & CMF 11 Retention, YOS 19+, by Fiscal Year
YOS 19 FY
Number of Years Beyond YOS 19
0 1 2 3 4 5 6 7
SOF Cumulative Retention Rate Over Interval
2002 0.867 0.627 0.471 0.353 0.269 0.166 0.090 0.062
2003 0.947 0.699 0.539 0.456 0.377 0.232 0.145
2004 0.623 0.444 0.375 0.323 0.267 0.180
2005 0.677 0.536 0.475 0.421 0.343
2006 0.788 0.702 0.650 0.605
2007 0.784 0.703 0.674
2008 0.753 0.697
2009 0.814
CMF 11 Cumulative Retention Rate Over Interval
2002 0.697 0.529 0.425 0.299 0.175 0.138 0.070 0.059
2003 0.709 0.533 0.406 0.324 0.196 0.142 0.108
2004 0.699 0.528 0.372 0.305 0.189 0.164
2005 0.669 0.493 0.363 0.268 0.169
2006 0.694 0.500 0.381 0.292
2007 0.695 0.527 0.422
2008 0.690 0.546
2009 0.778
Difference in Cumulative Rates Over Interval (SOF – CMF 11)
2002 0.170 0.098 0.046 0.054 0.094 0.028 0.020 0.003
2003 0.238 0.166 0.133 0.133 0.181 0.091 0.037
2004 -0.076 -0.084 0.002 0.018 0.078 0.016
2005 0.007 0.043 0.112 0.153 0.175
2006 0.095 0.202 0.269 0.313
2007 0.089 0.176 0.251
2008 0.063 0.152
2009 0.036
The Eleventh Quadrennial Review of Military Compensation202
Chapter 5
Table 11. Average Annual SOF & CMF 11 Retention, YOS 19+, by Fiscal Year
YOS 19 FY
Number of Years Beyond YOS 19
0 1 2 3 4 5 6 7
SOF Average Annual Retention Rate Over Interval
2002 0.867 0.792 0.778 0.771 0.769 0.741 0.709 0.706
2003 0.947 0.836 0.814 0.822 0.823 0.784 0.759
2004 0.623 0.666 0.721 0.754 0.768 0.751
2005 0.677 0.732 0.780 0.805 0.808
2006 0.788 0.838 0.866 0.882
2007 0.784 0.839 0.877
2008 0.753 0.835
2009 0.814
CMF 11 Average Annual Retention Rate Over Interval
2002 0.697 0.727 0.752 0.740 0.705 0.719 0.685 0.702
2003 0.709 0.730 0.741 0.754 0.722 0.722 0.727
2004 0.699 0.727 0.719 0.743 0.717 0.740
2005 0.669 0.702 0.713 0.719 0.700
2006 0.694 0.707 0.725 0.735
2007 0.695 0.726 0.750
2008 0.690 0.739
2009 0.778
Difference in Average Annual Rates Over Interval (SOF – CMF 11)
2002 0.170 0.065 0.026 0.031 0.064 0.022 0.024 0.005
2003 0.238 0.106 0.073 0.068 0.101 0.062 0.032
2004 -0.076 -0.060 0.001 0.011 0.051 0.012
2005 0.007 0.030 0.067 0.086 0.107
2006 0.095 0.131 0.141 0.147
2007 0.089 0.113 0.126
2008 0.063 0.096
2009 0.036
The Eleventh Quadrennial Review of Military Compensation 203
Evaluation of the Effect of CSRB
References
Asch, B., J. Hosek, and J. Warner. 2007. The new economics of manpower in the post-Cold War era. In: Handbook of Defense Economics Volume 2. Edited by T. Sandler and K. Hartley, 1075–1138. Amsterdam: Elsevier.
Asch, B., J. Hosek, M. Mattock, and C. Panis. 2008. Assessing compensation reform: research in support of the 10th quadrennial review of military compensation. Santa Monica, Calif.: RAND Corporation.
Asch, B. and J. Warner. 2001. A theory of compensation and personnel policy in hierarchical organizations with application to the U.S. military. Journal of Labor Economics 19: 523–562.
Defense Advisory Committee on Military Compensation. 2006. The military compensation system: Completing the transition to an all-volunteer force. Arlington, Va.: DACMC.
Gotz, G. and J. McCall. 1984. A dynamic model retention model of Air Force officer retention: theory and estimation. R-03028-AF. Santa Monica, Calif.: RAND Corporation.
Mattock, M., B. Asch, J. Hosek, C. Whaley, and C. Panis. 2010. Towards improved management of officer retention: a new capability for assessing officer retention. DRR-5184-OSD. Santa Monica, Calif.: RAND Corporation.