Embed Size (px)
Citation preview
189
Chapter 5
Ion Thruster Accelerator Grids
Ion thrusters are characterized by the electrostatic acceleration of ions extracted
from the plasma generator [1]. An illustration of a direct current (DC) electron
bombardment ion thruster showing the ion accelerator, the plasma generator,
and the neutralizer cathode was shown in Fig. 1-1. The ion accelerator consists
of electrically biased multi-aperture grids, and this assembly is often called the
ion optics. The design of the grids is critical to the ion thruster operation and is
a trade between performance, life, and size. Since ion thrusters need to operate
for years in most applications, life is often a major design driver. However,
performance and size are always important in order to satisfy the mission
requirements for thrust and specific impulse (Isp) and to provide a thruster size
and shape that fits onto the spacecraft.
There are many factors that determine the grid design in ion thrusters. The grids
must extract the ions from the discharge plasma and focus them through the
downstream accelerator grid (accel grid) and decelerator grid (decel grid) (if
used). This focusing has to be accomplished over the range of ion densities
produced by the discharge chamber plasma profile that is in contact with the
screen grid, and also over the throttle range of different power levels that the
thruster must provide for the mission. Since the screen grid transparency was
shown in Chapter 4 to directly impact the discharge loss, the grids must
minimize ion impingement on the screen grid and extract the maximum number
of the ions that are delivered by the plasma discharge to the screen grid surface.
In addition, the grids must minimize neutral atom loss out of the discharge
chamber to maximize the mass utilization efficiency of the thruster. High ion
transparency and low neutral transparency drives the grid design toward larger
screen grid holes and smaller accel grid holes, which impacts the optical
focusing of the ions and the beam divergence. The beam divergence also should
be minimized to reduce thrust loss and plume impact on the spacecraft or solar
arrays, although some amount of beam divergence can usually be

190 Chapter 5
������������
��� ��������
��� ���������
������
� �� � ��
���
���
���
���
���
���
���
� �� �� �� �� ��� ��� ���
�� !"#$
%��&�'"��%��&(!����
Fig. 5-1. Child–Langmuir sheath length versus ion mass for two ion current densities at 1500-V acceleration voltage.
accommodated. Finally, grid life is of critical importance and often drives
thruster designers to compromises in performance or alternative grid materials.
In this chapter, the factors that determine grid design and the principles of the
ion accelerators used in ion thrusters will be described.
5.1 Grid Configurations
To accelerate ions, a potential difference must be established between the
plasma produced inside the thruster plasma generator and the ambient space
plasma. As shown in Chapter 3, simply biasing the anode of a DC plasma
generator or the electrodes of a radio frequency (rf) plasma generator relative to
a spacecraft or plasma in contact with the space potential does not result in ion
beam generation because the voltage will just appear in the sheath at the plasma
boundary with the walls. If the potential is small compared to the electron
temperature Te , then a Debye sheath is established, and if the potential is very
large compared to Te , then a Child–Langmuir sheath exists. Therefore, to
accelerate ions to high energy, it is necessary to reduce the dimension of an
aperture at the plasma boundary to the order of the Child–Langmuir distance to
establish a sheath that will accelerate the ions with reasonable directionality
(good focusing) and reflect the electrons from the plasma. Figure 5-1 shows the
Child–Langmuir length calculated from Eq. (3.7-34) for two singly charged ion
current densities at an acceleration voltage of 1500 V. For xenon, the
characteristic aperture dimension at this voltage is on the order of 2 to 5 mm
and will decrease if the applied voltage is reduced or the current in the aperture
is increased.

Ion Thruster Accelerator Grids 191
!"#$ %��&�'"��)!��(! ���#���(���*�"$
+���,#����
���#���(��-��('��
,#����
��.��.
��.
Fig. 5-2. Simplified 1-D view of an accelerator aperture in contact with a plasma.
The ion current obtainable from each grid aperture is then limited by space
charge. For a 0.25-cm-diameter aperture extracting the space-charge-limited
xenon current density of about 5 mA/cm2 at 1500 V [from Eq. (3.7-56)], the
total ion current per aperture is only 0.25 mA. Assuming this produces a well-
focused beamlet, the thrust produced by this current and voltage according to
Eq. (2.3-9) is only about 16 newtons. Therefore, multiple apertures must be
used to obtain higher beam currents from the ion engine to increase the thrust.
For example, to extract a total of 1 A of xenon ion current for this case would
require over 4000 apertures, which would produce over 60 mN of thrust. In
reality, for reliable high-voltage operation, and due to non-uniformities in the
plasma generator producing varying ion current densities to the boundary, the
current density is usually chosen to be less than the Child–Langmuir space
charge maximum, and an even larger number of apertures are required. This
ultimately determines the size of the ion thruster.
Figure 5-2 shows a simplified one-dimensional (1-D) view of one of these
biased apertures facing the thruster plasma. The Child–Langmuir sheath is
established by the bias potential between the thruster plasma and the accelerator
grid and is affected by the current density of the xenon ions arriving at the
sheath edge from the Bohm current. Ions that arrive on axis with the aperture
are accelerated through to form the beam. However, ions that miss the aperture
are accelerated into the accel grid and can erode it rapidly. For this reason, a
“screen” grid with apertures aligned with the accel grid is placed upstream of
the accel grid to block these ions. This is the classic two-grid accelerator system
[1,2]. The screen grid is normally either allowed to float electrically or is biased
to the cathode potential of the plasma generator to provide some confinement of
the electrons in the plasma and so that ions that strike it have a relatively low
energy and cause little sputtering. In practice, the grids are made of refractory
metals or carbon-based materials, and the apertures are close-packed in a

192 Chapter 5
��$�
���#)����� /���#
����+���/"��!��&� �(!�$�
��'(��#"0�� �(!�$�
�����
/"��!��&�)'--#1
)�����)'--#1
���#�*�"$)'--#1
�����
)-����,�(��("�#
/���#−����#��#(�&�
.�)��������#(�&�
�−
�−
��.
,�(��("�#
Fig. 5-3. Electrical schematic of a DC discharge ion thruster without the cathode heater and keeper supplies.
hexagonal structure to produce a high transparency to the ions from the plasma
generator. These grids are also normally dished to provide structural rigidity to
survive launch loads and to ensure that they expand uniformly together during
thermal loading [1,3].
The electrical configuration of an ion thruster accelerator is shown
schematically in Fig. 5-3. The high-voltage bias supply (called the screen
supply) is normally connected between the anode and the common of the
system, which is usually connected to the neutralizer cathode (called
“neutralizer common”) that provides electrons to neutralize the beam. Positive
ions born in the discharge chamber at high positive voltage are then accelerated
out of the thruster. The accel grid is biased negative relative to the neutralizer
common to prevent the very mobile electrons in the beam plasma from back-
streaming into the thruster, which produces localized heating in the discharge
chamber by energetic electron bombardment, and ultimately overloads the

Ion Thruster Accelerator Grids 193
screen supply if the backstreaming current becomes large. The ion beam is
current neutralized and quasi-neutral (nearly equal ion and electron densities)
by the electrons extracted from the neutralizer cathode. Fortunately, the thruster
self-biases the neutralizer common potential sufficiently negative relative to the
beam potential to produce the required number of electrons to current neutralize
the beam.
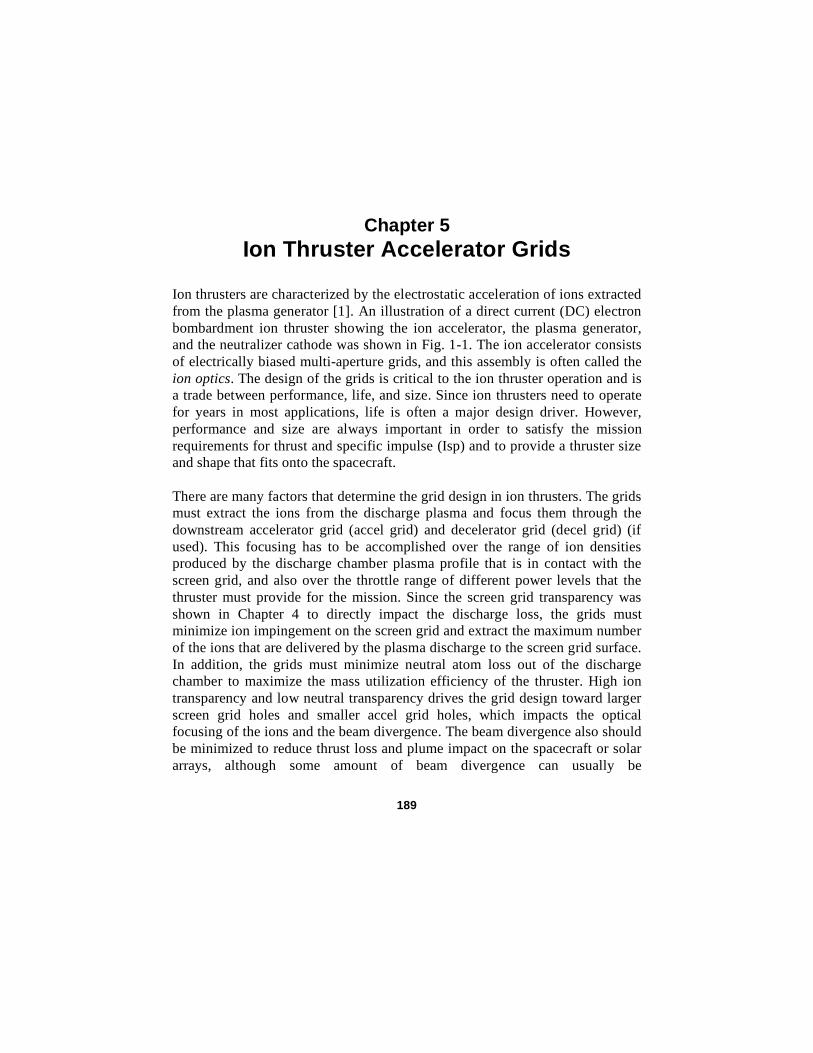
Figure 5-3 showed a generic thruster that includes a three-grid accelerator
system, where a final grid called the “decel grid” is placed downstream of the
accel grid. This grid shields the accel grid from ion bombardment by charge-
exchanged ions produced in the beam backflowing toward the thruster, and
eliminates the downstream “pits-and-grooves erosion” that will be discussed in
Section 5.6. Three-grid systems then potentially have longer accel grid life than
two grid systems and generate less sputtered material into the plume that can
deposit on the spacecraft. These benefits are offset by the increased complexity
of including the third grid.
In actual design, the diameter of each accel grid aperture is minimized to retain
unionized neutral gas in the plasma generator, and the screen grid transparency
is maximized so that that the grids extract the maximum possible number of
ions from the plasma. The electrode diameters and spacing are then optimized
to eliminate direct interception of the beam ions on the accel grid, which would
cause rapid erosion due to the high ion energy. A schematic example of a three-
grid system showing the ion trajectories calculated by a two-dimensional (2-D)
ion optics code [4] is shown in Fig. 5-4. The ions are focused sufficiently by
this electrode design to pass through the accel grid without direct interception.
On the downstream side of the accel grid, the negative accel-grid bias applied
to avoid electron backstreaming results in a relatively small deceleration of the
ions before they enter the quasi-neutral beam potential region. This high
transparency, strong “accel–decel” geometry typical of ion thrusters results in
some beamlet divergence, as suggested by the figure. However, this small
beamlet angular divergence of typically a few degrees causes negligible thrust
lost because the loss scales as cos , and because most of the beam divergence
discussed in Chapter 2 related to the thrust correction factor is due to the
dishing of the grids.
The amount of current that an ion accelerator can extract and focus into a beam
for a given applied voltage is related to the space-charge effects characterized
by the Child–Langmuir equation and is called the perveance:
PIb
V 3/2. (5.1-1)

194 Chapter 5
/"��!��&�,#����
)�����*�"$
���#*�"$
/���#*�"$
Fig. 5-4. Ion trajectories from a plasma sheath (on the left) in a half-beamlet inside an example three-grid accelerator.
The maximum perveance that can be achieved by an accelerator is given by the
coefficient in the Child–Langmuir equation:
Pmax4 o
9
2q
MA/ V3/2[ ]. (5.1-2)
For an electron accelerator, this coefficient is the familiar value of 2.33 10–6
A/V3/2
, and for singly charged xenon ions it is 4.8 10–9
A/V3/2
. For round
apertures, the Child–Langmuir equation can be written
J =Ib
D2
4
=4 o
9
2q
M
V 3/2
d2A/ m2[ ] , (5.1-3)
where d is the effective grid gap and D is the beamlet diameter. Inserting
Eq. (5.1-3) into Eq. (5.1-1), the maximum perveance for round apertures is
Pmaxo
9
2q
M
D2
d2A/ V3/2[ ] . (5.1-4)
Therefore, to maximize the perveance of the accelerator, it is desirable to make
the grid gap smaller than the aperture diameters, as illustrated in the example
configuration shown in Fig. 5-4.
The ion trajectories plotted in Fig. 5-4 that do not intercept either of the grids,
and the minimal beamlet divergence, result from operating at or near the
optimal ion current density and voltage for the grid geometry shown. Operating
at significantly less than the optimal perveance, called “under-perveance” and

Ion Thruster Accelerator Grids 195
corresponding to higher voltages or lower beamlet currents than the optimal
combination, increases the Child–Langmuir (CL) length and pushes the sheath
to the left farther into the plasma. In the extreme case, this situation can launch
ions at a very large angle from the edge region near the screen aperture and
cause “cross-over” trajectories, which can then produce excessive erosion of the
accel grid by direct ion impingement. Likewise, operating at higher than the
optimal perveance, corresponding to higher beamlet currents or lower voltages
than optimal, reduces the Child–Langmuir sheath thickness, and the plasma
boundary pushes toward the screen aperture. This “over-perveance” condition
flattens the sheath edge and accelerates ions directly into the accel grid, again
causing excessive erosion. The optical performance and life of any grid design,
therefore, is acceptable only over a limited range in voltage and current density,
which will be discussed in Section 5.3. For this reason, the uniformity of the
plasma over the grid area is important to avoid either cross-over or direct
interception in different regions of the ion optics that strongly degrade the life
of the grids.
In the two- or three-grid configurations, the geometry of the grid apertures and
gaps is intended to eliminate or at least minimize direct impingement by beam
ions on the most negative potential electrode in the system, namely, the accel
grid. This is required to minimize sputtering of the grid by the high-energy
beam ions. The screen grid does receive ion bombardment from the discharge
plasma due to its finite transparency, but the ions arrive with only an energy of
the order of the discharge voltage in DC discharge thrusters or the floating
potential in rf or microwave thrusters. Sputter erosion of the screen grid then
becomes an issue only at high discharge voltages or due to the production of
high-energy ions in the hollow cathode region [5,6] that can bombard the
screen grid. Likewise, the decel grid is biased near the beam plasma potential
and backflowing ions produced in the beam by charge exchange impact with
very low energy, which causes little or no sputtering. For two grid systems, the
backflowing ions bombard the accel grid with essentially the grid bias voltage.
This can cause significant sputtering of the downstream face of the accel grid
and may determine the grid life.
The decelerating field produced downstream of the accelerator grid by the accel
grid bias acts as a weak defocusing lens for the ions, but keeps electrons
emitted by the neutralizer from entering the high field region and
backstreaming at high energy into the discharge chamber. This decelerating
field is set up either by applying a potential between the accelerator grid and the
decel grid or by applying the bias between the accelerator grid and the hollow
cathode neutralizer and allowing the low energy plasma downstream of the
accelerator grid to act as a virtual anode. Unfortunately, ions generated between
the grids by either charge exchange with unionized neutral gas escaping the

196 Chapter 5
plasma generator or by ionization from the most energetic backstreaming
electrons do strike the accel grid and erode it. Charge exchange ion erosion of
the accel grid ultimately limits the grid life, which will be discussed in
Section 5.6.
5.2 Ion Accelerator Basics
The thruster ion optics assembly serves three main purposes:
1) Extract ions from the discharge chamber
2) Accelerate ions to generate thrust
3) Prevent electron backstreaming
The ideal grid assembly would extract and accelerate all the ions that approach
the grids from the plasma while blocking the neutral gas outflow, accelerate
beams with long life and with high current densities, and produce ion
trajectories that are parallel to the thruster axis with no divergence under
various thermal conditions associated with changing power levels in the
thruster. In reality, grids are non-ideal in each of these areas. Grids have finite
transparency; thus, some of the discharge chamber ions hit the upstream
“screen grid” and are not available to become part of the beam. The screen grid
transparency, Ts , is the ratio of the beam current, Ib , to the total ion current,
Ii , from the discharge chamber that approaches the screen grid:
Ts =Ib
Ii. (5.2-1)
This ratio is determined by comparing the ion beam current with the screen grid
current. The transparency depends on the plasma parameters in the discharge
chamber because the hemispherical sheath edge is normally pushed slightly into
the plasma by the applied voltage if the screen grid is relatively thin. The pre-
sheath fields in the plasma edge then tend to steer some ions that would have
gone to the screen grid into the beam. For this reason, the effective
transparency of the screen grid typically exceeds the optical transparency for
relatively large apertures and thin grid thicknesses. In addition, the screen grid
current must be measured with the screen grid biased negative relative to
cathode potential to reflect energetic electrons in the tail of the Maxwellian
distribution in the plasma. The goal for screen grid design is to maximize the
grid transparency to ions by minimizing the screen thickness and the webbing
between screen grid holes to that required for structural rigidity.
The maximum beam current density is limited by the ion space charge in the
gap between the screen and accelerator grids [2], which was discussed above

Ion Thruster Accelerator Grids 197
/"��!��&�,#����)!��(!Vp��
Vm
ds
ts
r
da
���#*�"$�Va�� +����,#����
,�(��("�#�)'�2���Vbp��
�
lg ld
le
Fig. 5-5. Non-planar sheath model approximation for a two-grid system.
with respect to the perveance that was specified by the Child–Langmuir
equation in which the sheath was considered essentially planar. The problem is
that the sheath shape in the screen aperture is not planar, as seen in Fig. 5-4,
and the exact shape and subsequent ion trajectories have to be solved by 2-D
axi-symmetric codes. However, a modified sheath thickness can be used in the
Child–Langmuir equation to approximately account for this effect, which is
written as
Jmax =4 o
9
2e
M
VT3/2
e2
, (5.2-2)
where VT is the total voltage across the sheath between the two grids and the
sheath thickness, , e is given by
e = g + ts( )2
+ds
2
4. (5.2-3)
The grid dimensions in Eq. (5.2-3) are defined in Fig. 5-5. As illustrated in the
figure, the sheath is allowed to expand essentially spherically through the
screen grid aperture. The sheath thickness e accounts for this non-planar
condition and has been found to be useful in predicting the space-charge-
limited current in ion thruster grid configurations [1,7]. Note that the value of
g is the “hot grid gap” that occurs once the grids have expanded into their
final shape during operation at a given beam current and voltage. For xenon
ions,

198 Chapter 5
Jmax = 4.75 10 9 VT3/2
e2
. (5.2-4)
The units of the current density in the Child–Langmuir equations are amperes
divided by the dimension used for the sheath thickness, e , squared.
The maximum thrust per unit area possible from an ion thruster can also be
found. Thrust was defined in Chapter 2 for electric thrusters as
T =d(mv)
dt= mivi . (5.2-5)
Assuming the ions start at rest, the ion velocity leaving the accelerator is
vi =2eVb
M, (5.2-6)
where eVb is the net beam energy. Using Eq. (2.2-3) for the time rate of change
of the mass, the thrust per unit area of the grids becomes
T
Ag=
Jmax TsMvi
e, (5.2-7)
where Ag is the active grid area (with extraction apertures) and Ts is the grid
transparency defined in Eq. (5.2-1). The effective electric field in the
acceleration gap is
E =VT
e, (5.2-8)
where VT is the total voltage across the accelerator gap (the sum of the screen
and accel voltages):
VT = Vs + Va =VbR
, (5.2-9)
and R is the ratio of the net beam voltage to the total voltage. Using Eq. (5.2-2)
for the space-charge-limited current density and the electric field from
Eq. (5.2-8), the maximum achievable thrust density is

Ion Thruster Accelerator Grids 199
Tmax
Ag=
4
9o Ts
e
2e
M
VT3/2
e2
M2eVb
M=
8
9 o Ts RE2 . (5.2-10)
The maximum thrust density from an ion thruster increases with the screen grid
transparency and the square of the electric field [8]. Ion thrusters with thin, high
transparency grids operating near the perveance limit and at the maximum
possible electric field in the acceleration gap will produce the most thrust for a
given grid area. A key feature of ion thrusters illustrated by Eq. (5.2-10) is that
the thrust density is independent of propellant mass.
The net-to-total voltage ratio from Eq. (5.2-9) is given by
R =Vb
VT=
Vb
Vs + Va. (5.2-11)
This equation describes the relative magnitude of the accel grid bias relative to
the screen potential. Operating with small values of R increases the total
voltage between the screen and accel grids, which, from Eq. (5.2-2), results in a
higher current density of ions accelerated from the thruster. While it appears
desirable to operate with very small values of R (large accel grid negative bias)
to increase the current capability of a grid set, this results in higher energy ion
bombardment of the accel grid and shortens grid life. Operating with small
values of R will also change the beam divergence, but this is a relatively small
effect in ion thrusters for most grid designs. For applications where thruster life
is important, the magnitude of accel grid bias voltage is usually minimized to
the value required to just avoid electron backstreaming, and the value of R
typically ranges from 0.8 to 0.9. Finally, Eq. (5.2-10) suggests that the thrust
density depends on the square root of R and would increase slowly with higher
beam-to-total voltage ratios. This is misleading because the total voltage also
appears in the electric field term (E = VT / e ) , and so higher thrust densities
actually occur with more negative accel grid bias because of the higher voltage
applied across the screen-to-accel gap for a given net (beam) voltage.
Aside from mechanical tolerances, the minimum “hot-gap” grid separation,
g ,
is limited by the vacuum breakdown field of the grid material:
E =V
g< Ebreakdown. (5.2-12)
In practice, grid breakdowns initiated by arcing or small micro-discharges
between the grids cause “recycles” in which the voltages are temporarily

200 Chapter 5
removed to extinguish the arc and then reapplied. It is common to also decrease
the discharge plasma density during a recycle so that the reapplication of the
acceleration voltages corresponds with ramping up the discharge current such
that the accelerator approximately tracks the right perveance during start up.
This minimizes ion bombardment of the accel grid during a recycle. To obtain
reliable operation and avoid frequent recycles, the maximum field strength in
the ion thruster typically is set to less than half the vacuum breakdown field.
For example, if the grid spacing were a millimeter and the acceleration potential
between the grids a thousand volts, the theoretical maximum xenon ion beam
current density would be 15 mA/cm2. A 25-cm-diameter, uniform-profile beam
with a 75% transparent grid system would then produce about 5.5 A of beam
current. In practice, because of high voltage breakdown considerations, the
maximum beam current obtainable from grid sets is typically about half the
theoretical maximum.
The ion thruster size is determined by the perveance limit on the beam current
density and practical considerations on the grids, such as maximum grid
transparency and electric field [1]. For this reason, ion thruster beam current
densities are typically on the order of a tenth that found in Hall thrusters,
resulting in a larger thruster footprint on the spacecraft. Alternatively, the
maximum Isp that is achievable is limited by the voltage that can be applied to
the grids to extract a given current density before electrical breakdown or
electron backstreaming occurs [9]. Very high Isp thrusters (>10,000 s), with a
size that depends on the thrust requirement, have been built and successfully
tested.
5.3 Ion Optics
While the simple formulas above provide estimates of the ion accelerator optics
performance, a number of computer simulation codes have been developed
[4,10–17] to more accurately evaluate the ion trajectories produced by thruster
grids. Ion optics codes solve in two or three dimensions the combined ion
charge density and Poisson’s equations for the given grid geometry and beamlet
parameters [18]. These codes have been used for the design and analysis of
two- and three-grid systems, and were extended to four-grid systems [19] to
examine “two-stage” ion optics performance [20] for very high voltage, high
Isp applications.
5.3.1 Ion Trajectories
There are a number of codes that calculate ion trajectories and grid performance
in ion thrusters, and an extensive analysis of ion optics behavior in thrusters
was recently completed by Farnell [21]. An example of a multi-dimensional
code CEX-2D, which is an ion optics code developed at JPL that calculates ion

Ion Thruster Accelerator Grids 201
trajectories and charge exchange reactions between beam ions and un-ionized
propellant gas in two [4] and three [17] dimensions. The CEX-2D code solves
Poisson’s equation, given in Eq. (3.7-8) in Chapter 3, on a regular mesh in
cylindrical geometry. The code models a single set of screen and accel grid
holes and assumes cylindrical symmetry. The computational space is divided
into a grid of rectangular cells with up to 400 increments radially and 600
axially. The radial grid spacing is uniform; the axial spacing is allowed to
increase in the downstream direction. The computational region is typically a
few millimeters radially and up to 5 centimeters along the axis downstream of
the final grid. With a few exceptions, the code uses a combination of algorithms
used in earlier optics codes for ion thrusters [11–15].
Upstream of the accelerator grid, the electron density is obtained analytically
from the barometric law assuming a Maxwellian distribution:
ne(V ) = ne(0) exp o
Te. (5.3-1)
The upstream reference electron density, ne(0) , is set equal to the input
discharge chamber ion density. Downstream of the accelerator grid, the electron
population is also assumed to be a Maxwellian distribution with a different
reference potential:
ne(V ) = ne( ) expTe
, (5.3-2)
where the downstream reference electron density, ne( ) , is set equal to the
calculated average downstream ion beam density. As a result, downstream
potentials are determined self consistently; there is no need to assume a
neutralization plane. These codes include focusing effects and the fact that the
aperture dimensions are usually significantly larger than the gap size such that
the electric fields are reduced from the ideal maximum.
The potential distributions are calculated using an optimized pre-conditioned
least-square conjugate gradient sparse matrix solver. Results for a given
upstream plasma number density, n, are found by starting from zero density and
iterating. At each iteration, i, a fraction, , of the desired discharge chamber ion
density is blended into the code:

202 Chapter 5
n0
= 0
ni+1= 1( )ni
+ n. (5.3-3)
The density that the code uses asymptotically approaches the final density:
n ni= n 1( )
i. (5.3-4)
If is sufficiently small, approximate results for all upstream densities less
then n can be obtained in a single run:
ni= 1 1( )
i n . (5.3-5)
By saving the intermediate results, only a single run is needed to estimate the
performance of an optics design over a wide range of discharge chamber
densities. However, since the calculation is fully converged only at the final
density, separate runs with different final densities may be necessary to obtain
accurate results over the full range of discharge chamber ion densities. A
typical CEX-2D calculation takes a few minutes on a personal computer. Ion
optic assemblies designed using the CEX-2D code have met the predicted
performance very closely [4], illustrating that grid design techniques are very
mature.
The ion density in the beamlet is obtained in the codes by tracking
representative ion trajectories and accounting for charge exchange collisions
that alter the ion energy. Ions enter the computational region from the upstream
boundary at the Bohm velocity, and their charge density is found by following
their trajectories in a stationary electric field. This is in contrast to the time-
dependent particle in cell (PIC) technique generally used in plasma physics
simulations.
An example of ion trajectories calculated by CEX-2D is shown in Fig. 5-6,
which shows the computational space with the dimensions given in meters used
for three values of beam perveance for half a beamlet in a three-grid
configuration. In this figure, ions from the discharge chamber enter from the
left and are accelerated by the electric field between the screen and accel grids.
The horizontal boundaries represent lines of symmetry such that an ion crossing
at these boundaries has another ion coming in from outside the domain. Figure
5-6(a) shows an over-perveance condition representing a beamlet current too
high for the applied voltage, or too low a voltage for the plasma density and ion
current provided. In this case, ions directly impinge on the upstream face of the
accel grid. This situation is considered to be the perveance limit, where

Ion Thruster Accelerator Grids 203
������−3������−33�����−3������−3������−3�−������−3
��������−3
��������−3
��������−3
��������−�
��������−�
��������−�
��������−�
�
������−3������−33�����−3������−3������−3�−������−3
��������−3
��������−3
��������−3
��������−�
��������−�
��������−�
��������−�
�
������−3������−33�����−3������−3������−3�−������−3
��������−3
��������−3
��������−3
��������−�
��������−�
��������−�
��������−�
�
��
4�
��
Fig. 5-6. Representative ion trajectories from a CEX2D calculation for three perveance conditions: (a) over-perveance with direct accel grid interception, (b) optimal perveance, and (c) under-perveance that can produce cross-over interception.
excessive ion current strikes the accel grid. Figure 5-6(b) shows a near-
optimum perveance condition where the ions are well focused through the accel
and decel grid apertures and do not directly intercept any downstream grid.
Finally, Figure 5-6(c) shows an under-perveance condition where the ions are
over focused and cross over in the accel gap. In this case, ions can directly
intercept the accel grid and, eventually, the decel grid as the apertures wear
open. Note that the length of the computational region shown must be long
compared to its radius and is usually chosen so that neighboring beamlets will
overlap.

204 Chapter 5
���#5(�5+���� '����(�6�("��7�
+���#�(� '����(���
���
���
���
���
���
���
3��
��� ��� ��� ��� ��� ���
��� �����8�
��� �����8�
��� �����8�
Fig. 5-7. Accel grid current-to-beam current ratio as a function of the beamlet current for three values of the beam voltage.
A fraction of the ions from the plasma at the largest radii run directly into the
screen grid, as seen in Fig. 5-6, and do not enter into the thrust beam. These
ions represent the effect of the finite screen grid transparency that was so
important in the discharge loss calculations in Chapter 4. For the near-optimal
and under-perveance conditions, the screen grid transparency is greater than its
geometric open area fraction, as mentioned above, because the self-consistent
electric fields actually extract some of the ions at large radii that would have hit
the screen grid instead of going into the screen aperture.
5.3.2 Perveance Limits
Figure 5-6 demonstrated that electrostatic accelerators produce focused ion
trajectories when operated near a given design perveance and avoid grid
interception or large beam divergence angles over a limited range of voltages
and currents that are related by space charge considerations in the grid gap. In
ion thrusters, operating sufficiently away from the perveance design of the grids
results in beam interception on the downstream accel and (eventually) decel
grids. Figure 5-7 shows an illustration of the accel grid current as a function of
the current in a beamlet (a single aperture) for three different beam voltages. In
this case, the optics were designed to run at about 2 kV and 0.8 mA of beamlet
current, and the design demonstrates low grid interception over about ±50% of
this current. As the beamlet current is increased, by raising the plasma density
in the discharge chamber, the sheath thickness in the acceleration gap
decreases, which flattens the sheath and causes the accel grid interception to
increase. Eventually, the system becomes under-focused at the perveance limit
where a large fraction of the beamlet is intercepted, as shown in Fig. 5-6(a).
The accel grid current then increases rapidly with beamlet current due to the

Ion Thruster Accelerator Grids 205
system running at too high a perveance. At low discharge chamber plasma
densities, which produce low beamlet currents, the beam is over-focused and
interception of the ions on the accel grid due to cross-over trajectories increases
the accel grid current. The ion trajectories for this case are shown in Fig. 5-6(c).
At the nominal beam voltage of 2 kV, this system can be run from about 0.4 to
1.2 mA of beamlet current between the cross-over and perveance limits without
producing excessive accel grid current. If the ion thruster has a current profile
greater than about 3:1 peak to edge over the grid diameter (due to a poor plasma
density uniformity), then grid interception will occur either in the center or at
the edge of the beam. Since the grids are normally designed to deal with the
high perveance condition at the peak current density near the axis, poor plasma
profiles usually result in significant erosion of the edge holes due to cross-over
interception. This will impact the life of the thruster and must be compensated
by either changing the grid gap or screen aperture sizes as a function of the
radius or modifying the plasma generator to produce more uniform profiles.
Increasing the beam voltage shifts the curves in Fig. 5-7 to higher beamlet
currents. This is clear from the dependence in the Child–Langmuir equation
(Eq. 5.3-2) where the current scales as V3/2
if the sheath thickness and grid
dimensions are held constant. In Fig. 5-7, the perveance-limited beamlet
current, where direct grid interception occurs, increases as V3/2
as the beam
voltage is raised. Figure 5-7 also illustrates that, in situations where the thruster
power must decrease, which is typical of deep space solar electric propulsion
missions where the power available decreases as the spacecraft moves away
from the Sun, the beam voltage and Isp of the thruster must eventually decrease
as the current is reduced to avoid grid interception.
The voltage range available from a given accelerator design at a fixed (or nearly
constant) beam current has limitations similar to the current dependence just
discussed. However, the minimum voltage at a given current is of special
interest in an ion thruster because this is related to the minimum Isp of the
engine for a given thrust. The perveance limit of a thruster is usually defined
relative to the rate at which the accel current increases as the beam voltage is
decreased:
Perveance limit 0.02 IA
Vscreen mA/ V[ ] . (5.3-6)
This is related to the optics situation illustrated in Fig. 5-6(a), where the current
at a given voltage is too high for the designed gap and aperture size and the
under-focused beamlet starts to directly intercept accel grid. Figure 5-8 shows
the behavior of the accel grid current for the NASA Solar Electric Propulsion

206 Chapter 5
+����,�9���)'--#1���#(�&����
�
:
�
;
��
��
��
��� :�� ��� ;�� ���� ���� ����
���#�*�"$� '����(���
,��<������%"�"(� ��������
Fig. 5-8. Accel grid current versus the screen supply voltage for the NSTAR thruster at TH15 parameters, showing the perveance limit.
Technology Applications Readiness (NSTAR) engine operating at the full
power parameters of TH15 but with the screen voltage decreasing. In this case,
the perveance limit is found to be at 688.8 V, compared to the nominal 1100 V
of the screen voltage at this throttle level. The perveance limit can also be
defined by a given percentage increase in the accel current. However, the
screen grid transparency usually decreases as the screen power supply voltage
is decreased, which reduces the beam current and accel current during this
measurement. The magnitude of the percentage increase in the accel current
due to direct ion impingement then needs to be defined for the ion optics
assembly.
5.3.3 Grid Expansion and Alignment
A significant issue in ion thrusters that utilize refractory metal grids is thermal
expansion of the grids during thruster operation changing the acceleration gap
dimension between the screen and accel grids. This will directly affect the ion
trajectories and the perveance of the ion optics. Since the screen grid is heated
by direct contact with the discharge plasma and is usually dished outwards and
designed with a minimum thickness to increase the effective transparency, the
screen grid expansion is usually larger than the accel grid and the gap tends to
decrease as the thruster heats up. This shift from the cold gap to the hot gap
causes the perveance of the optics to increase for convex grid curvature (grids
domed outward from the thruster body) and changes the beamlet trajectories at
the given operating point. In addition, for grids designed to hold the applied
voltage across the cold gap, the hot gap may be so small that field emission and
high voltage breakdown become problems. For ion thrusters with refractory
metal grids designed with concave grid curvature (grids domed into the thruster

Ion Thruster Accelerator Grids 207
body), the screen grid expands away from the accel grid and the perveance
decreases as the gap gets larger. In addition, concave grids have a smaller
discharge chamber volume for a given thruster size, which adversely affects the
discharge loss.
Ideally, the ion optics design would have sufficient margin to operate at full
power over the range that the grid gap changes. This is possible for smaller
thrusters and/or lower power levels where the grid deflection is a small fraction
of cold gap. For thrusters with grid diameters greater than 15 to 20 cm
operating at power levels in excess of 1 kW, it is often necessary to design the
optics for the highest power case with the small hot gap, and to start the thruster
in the diode mode (discharge only) or at lower beam powers to pre-heat the
grids to avoid breakdown during thermal motion. This establishes the grid gap
dimension within the range the optics can tolerate for high-power operation
with minimal grid interception. It should be noted that grids fabricated from the
various forms of carbon (graphite, carbon–carbon composite, or pyrolytic) have
smaller or negligible thermal expansion than refractory metal grids and will
have smaller grid gap changes. Ion optics sets that utilize grids made of two
different materials have to deal with this issue of different thermal expansion
coefficients and potentially larger grid gap changes.
Another significant grid issue is alignment of the grid apertures. The ion
trajectories shown in Fig. 5-6 assumed perfect alignment of the screen and
accel grid apertures, and the resultant trajectories are then axi-symmetric along
the aperture centerline. Displacement of the accel grid aperture relative to the
screen grid centerline causes an off-axis deflection of the ion trajectories,
commonly called beam steering. The affect of aperture displacement on the
beamlet steering has been investigated for many years in both ion sources and
ion thrusters [22–25]. The beamlet is steered in the direction opposite to that of
the aperture displacement due to the higher focusing electric field induced at
the accel grid aperture edge. Studies of this effect in ion thruster grid
geometries [24] show that small aperture displacements ( 10% of the screen
aperture diameter) cause a deflection in the beamlet angle of up to about 5
degrees. This phenomenon can be used to compensate for the curvature of the
grids to reduce the overall beam divergence, which is called compensation.
However, the perveance of the aperture is reduced in this case, and interception
of edge ions on the accel grid due to the non-uniform electric fields can be an
issue. Mechanical misalignment of the grids due to manufacturing tolerances or
thermal deformation can also produce aperture displacement and unintended
beamlet steering. This problem has been identified as the cause of thrust vector
variations observed as thrusters heat up [24]. For this reason, precise alignment
of the grid apertures and grid support mechanisms that minimize non-uniform

208 Chapter 5
���#*�"$
)�����*�"$
/"�(����
−���
�
���
����
����
,�(��("�#���
+�(9����+���#�(�
���+���#�(�
Fig. 5-9. Potentials on-axis in an individual beamlet and between the beamlets intersecting the grids.
thermal deformation are generally required to provide stable ion optics
performance with minimal beam divergence.
5.4 Electron Backstreaming
Downstream of the accelerator grid, the ion beam is charge and current
neutralized by electrons from the neutralizer hollow cathode. Since electrons
are much more mobile than ions, a potential barrier is needed to stop neutralizer
electrons from flowing back into the discharge chamber. In the absence of a
potential barrier, the electron current would be several hundred times the ion
current, wasting essentially all of the electrical power. The potential barrier is
produced by the negatively biased accel grid. The minimum potential
established by the accel grid prevents all but the highest energy electrons from
traveling backwards from the beam plasma into the discharge chamber. The so-
called “backstreaming” electron current is not only a parasitic power loss since
these electrons do not add thrust, but it can damage the thruster by overheating
the internal components of the discharge chamber such as the cathode.
The accel grid bias voltage required to limit the electron backstreaming current
to a small value (typically <1% of the beam current) can be determined by
evaluating Poisson’s equation in the grid aperture in the presence of the beamlet
ion current with 2-D computer codes. An example of such a calculation is
shown in Fig. 5-9, where the potential between the electrodes and on the axis of
the half-beamlet is shown. Note that the potential minimum in the center of the
beamlet is only a small fraction of the applied accel grid voltage in this

Ion Thruster Accelerator Grids 209
example, which is due to the beam’s space charge. The actual value of this
minimum potential determines the margin to backstreaming, which should be
set well above the value at which excessive backstreaming occurs.
Examining electron backstreaming in more detail shows that the minimum
potential in the accel grid is determined by three factors: the electrostatic
potential from the bias voltages applied to the different grids, the beamlet space
charge in the accel grid aperture, and the required potential difference between
the beam plasma and minimum voltage to reduce the backstreaming electron
current to insignificant levels. Each of these factors can be evaluated
analytically using simplifying approximations to help in understanding
backstreaming physics.
As stated above, the backstreaming electron current results from the tail of the
beam Maxwellian electron distribution overcoming the potential barrier
established in the accel grid aperture. The current of electrons backstreaming
into the thruster plasma is just the beam plasma random electron flux times the
Boltzman factor for the potential difference between the beam plasma and the
minimum potential in the accel grid region [26]:
Ieb =1
4ne
8kTe
m
1/2
e
(Vbp Vm )
Te Aa , (5.4-1)
where Ieb is the electron backstreaming current, Vbp is the beam plasma
potential, Vm is the minimum potential in the grid aperture, and Aa is the
beamlet area in the grid aperture. The current of ions in the beamlet flowing
through the grid aperture is
Ii = nievi Aa , (5.4-2)
and the ion velocity through the system is
vi =2e Vp Vbp( )
M, (5.4-3)
where Vp is the plasma generator plasma potential at the sheath edge.
Combining Eqs. (5.4-1) through (5.4-3), the minimum potential is
Vm = Vbp + Te ln2Ieb
Ii
m
M
Vp Vbp
Te. (5.4-4)

210 Chapter 5
6�("���2�+��8�(����"�&�=#��(�����(��>��9��$����� '����(�
�7
−������� ����� ����� ����� ����� �����
,�(��("�#�/"22���������
−3�
−3�
−��
−��
−��
−��
−�
�
��� ��
��� �3
��� ��
Fig. 5-10. Potential difference between the beam plasma and the beamlet potential minimum required to achieve a given electron backstreaming current-to-forward ion current ratio for several beam
electron temperatures.
This equation describes the required potential difference between the beam
potential and the minimum potential in the beamlet to produce a specified
amount of electron backstreaming current relative to the beam current. Note
that this equation is independent of the grid geometry because it deals solely
with the potential difference between a given value of Vm (independent of how
it is produced) and the beam-plasma potential. The required potential difference
(Vbp Vm ) between the beam plasma and the minimum voltage in the grids to
produce a given ratio of backstreaming current to beam current is plotted from
Eq. (5.4-4) in Fig. 5-10 for several values of the beam-plasma electron
temperature in a thruster plume with a net accelerating voltage of
Vp Vbp = 1500 V . For an electron temperature of 2 eV in the beam, which is
consistent with values found in NSTAR thrusters plumes [27], a potential
difference between the minimum potential in the beamlet and the beam plasma
of only 12.5 V is required to reduce the backstreaming current to 1% of the
beam current.
The actual minimum potential in the beamlet is determined by the grid
geometry, the applied grid potentials, and the beam’s space charge. The
minimum potential in the two-grid arrangement shown in Fig. 5-5 was first
found without considering space charge effects by an analytic solution to
LaPlaces’ equation by Spangenberg [28] for thin grids in vacuum tubes.
Spangenberg’s expression was simplified by Williams [26] and Kaufman [1]
for most ion thruster grid configurations to

Ion Thruster Accelerator Grids 211
Vm*
= Va +da (Vp Va )
2 e1
2tada
tan 1 da
2tae ta da, (5.4-5)
where Vm* indicates the minimum potential with the ion space charge neglected,
Va is the applied accel grid potential, the grid dimensional terms are defined in
Fig. 5-5, and e is given by Eq. (5.2-3). Equation (5.4-5) provides the
dependence on the geometry of the grids, but is only useful if the beam space
charge is negligible (very low current density beamlets).
The reduction in the magnitude of the minimum beam potential due to the
presence of the ion space charge in the beamlet can be estimated [26] using the
integral form of Gauss’s law:
E dA =1
oS
dVV
, (5.4-6)
where E is the electric field, dA is the differential surface area element, o is
the permittivity of free space, and is the ion charge density within the
Gaussian surface which has a surface area S and encloses volume V. This
equation is solved first in the beamlet and then in the charge-free space between
the beamlet and the accel aperture inside diameter. Then, adding the two
potentials together gives the total potential between the grid and the beamlet
centerline.
Assume that the beamlet has a radius db / 2 inside the accel grid aperture with
a radius of da / 2 . Integration of the left-hand side of Eq. (5.4-6) over a
cylindrical “Gaussian pillbox” aligned with the beamlet axis yields
E dA =
S
Er0
ra
0
2rd dz = Er 2 r z , (5.4-7)
where it has been assumed that Er is constant in the axial direction over a
distance z. If it is also assumed that the ion charge density is uniform in the
volume of the pillbox, the right-hand side of Eq. (5.4-6) can also be integrated
to obtain
1
o dV =
1
oV
r dr d dz =o
r2 zV
. (5.4-8)

212 Chapter 5
Equating Eqs. (5.4-7) and (5.4-8), an expression for the radial electric field in
the beamlet ( Er1 ) from the accel hole centerline to the outer edge of the
beamlet is obtained:
Er1 = r
2 o, 0 < r <
db
2. (5.4-9)
From the edge of the beam to the wall, Gauss’s law is again used, but in this
case the entire beam charge is enclosed in the Gaussian surface. The radial
electric field in this “vacuum region” outside the beamlet ( Er2 ) is then found
in a similar manner to be
Er2 =da
2
8 or,
db
2< r <
da
2. (5.4-10)
The voltage difference V from the centerline to the accel grid barrel due to the
ion space charge is obtained by integrating the electric field between these
limits. Hence,
V = Er1dr0
db 2Er2dr
db 2
da 2=
r
2 odr
0
db 2 db2
8 o rdr
db 2
da 2. (5.4-11)
The total potential from the accel wall to the center of the beamlet due to ion
space charge is then
V =db
2
8 o n
da
db+
1
2. (5.4-12)
The beam current density in the accel aperture is the charge density times the
beam velocity, so the ion charge density is
= 4 Ii
db2 vi
, (5.4-13)
where vi is the ion velocity evaluated at the minimum potential point:
vi =2e Vp Vm( )
M. (5.4-14)

Ion Thruster Accelerator Grids 213
Substituting Eqs. (5.4-13) and (5.4-14) into Eq. (5.4-12) gives
V =Ii
2 ovi n
da
db+
1
2. (5.4-15)
Since scalar potentials can be added, the sum of Eqs. (5.4-15) and (5.4-5) gives
the total of the potential minimum in the accel grid aperture.
Vm = Va + V +da (Vbp Va )
2 e1
2tada
tan 1 da
2tae ta da. (5.4-16)
To calculate the backstreaming current as a function of grid voltage,
Eq. (5.4-16) must be equated to Eq. (5.4-4) and solved for the current:
Ibe
Ii=
e(Va + V +(Vbp Va )C Vbp ) Te
2m
M
(Vp Vbp)
Te
, (5.4-17)
where the geometric term C is given by
C =da
2 e1
2tada
tan 1 da
2tae ta da. (5.4-18)
In practice, the onset of backstreaming is determined by two techniques. One
method is to monitor the increase in the screen power supply current as the
magnitude of the accel grid voltage is decreased. Increases in the measured
current are due to backstreaming electrons, and a 1% increase is defined as the
minimum accel grid voltage to avoid backstreaming: the so-called
backstreaming limit. For example, the power supply current from Eq. (5.4-17),
normalized to the initial beam current, is plotted in Fig. 5-11 as a function of
the accel grid voltage for the NSTAR ion optics [29] for the maximum power
throttle point TH15 at the beginning of life (BOL). In this figure, the beam
potential and electron temperature were assumed to be 12 V and 2 eV,
respectively, consistent with measurements made on this thruster. The onset of
backstreaming occurs at about –150 V on the accel grid, which is consistent
with the data from tests of this engine [30,31].
A second method for determining the backstreaming limit is to monitor the ion
production cost, which is the discharge power required to produce the ion beam
current divided by the beam current. This is an effective method for use in

214 Chapter 5
���#���#(�&����
���
��;
���
���
���
��3
���
−�:�
�)?6�?����+@%
�����#"0�$�+���� '����(
−���−���−���−���−���−���
+��8�(����"�&�%"�"(
Fig. 5-11. Normalized beam current versus applied accel grid voltage, showing the onset of electron backstreaming as the voltage is
decreased.
���#�*�"$���#(�&����
+��8�(����"�&
%"�"(� �−�������
�:�
���
���
�;�
�;�
���
−���
����,��$'�("��� ��(����"���
−���−���−�:�−���
Fig. 5-12. Ion production cost for NSTAR TH15 versus applied accel
grid voltage, showing the onset of electron backstreaming as the voltage is decreased.
thrusters operating in the beam-current-regulated mode where the discharge
power supply is controlled to fix the beam current. Backstreaming then appears
as a decrease in the ion production cost. This method is shown in Fig. 5-12 for
the experimental data taken from the NSTAR thruster at TH15. As the
magnitude of the accel voltage is decreased, a 1% decrease in the ion
production cost represents the defined onset of backstreaming. In this case, the
backstreaming limit was determined to be about –148 V, consistent with the
above analytical model.

Ion Thruster Accelerator Grids 215
=#��(����+��8�(����"�&���#(�&����
=22��("<�����#�*�"$���#��/"���(������
−������ ��3 ��� ��� ��� ��:
−���
−���
−���
−���
−���
−���=%??���
��#� !��2��"�&
�"�"�'���#�
/"���(��
Fig. 5-13. Accel grid voltage at which electron backstreaming occurs in the NSTAR thruster at TH15 power level versus the effective accel grid aperture diameter.
Equations (5.4-17) and (5.4-18) show that the electron backstreaming is a
function of the accel grid hole diameter. Increases in the accel hole diameter
will reduce the penetration of the applied grid bias voltage to the center of the
aperture and reduce the minimum potential on axis. This increases either the
backstreaming current at a given voltage or the backstreaming limit at a given
current. The effect of accel grid hole enlargement due to grid wear is illustrated
in Fig. 5-13, where the grid voltage at which backstreaming started is plotted
versus accel grid hole diameter for the NSTAR TH15 case measured during the
extended life test (ELT) [31]. Larger grid-hole diameters required more
negative biasing of the accel grid to avoid the onset of backstreaming.
Figure 5-13 also shows an interesting effect in that the shape of the grid hole is
important. Early in life, the grid aperture diameter eroded due to sputtering, and
the barrel diameter was adequately described by the minimum hole diameter
observed optically during running of the test. However, as the test progressed,
the erosion of the upstream aperture edge essentially stopped and the aperture
was observed to be chamfered on the downstream portion. An effective grid
diameter had to be calculated to take into account the non-uniform hole erosion
in determining the backstreaming onset, shown on the right-hand side of
Fig. 5-13. While the above analytical model accounts for grid diameter and
thickness, additional terms would have to be added to account for this conical
erosion shape. This situation is best handled by 2-D models that both determine
the time-dependent shape of the grid hole and calculate the potential on axis
appropriately.

216 Chapter 5
It should be noted that while the analytical model described above illustrates
the mechanisms involved in electron backstreaming and provides reasonable
agreement with the experimental data shown, the results are very sensitive to
the dimensions and beam parameters assumed in the calculation. This is largely
because the potential minimum is the difference between two large numbers
representing the contributions of the electrostatic fields and the space charge
fields. Therefore, this backstreaming model actually provides only an estimate
of the backstreaming voltage and current levels, which can easily be off 10% to
20%. The 2-D grid codes described above that solve Poisson’s equation exactly
provide more accurate calculations of the backstreaming limit.
Finally, electron backstreaming occurs first in the region of the highest beamlet
current where the ion space charge is the highest in the ion optics assembly.
Thrusters with non-uniform beam profiles, such as NSTAR with a flatness
parameter (defined as average-to-peak current density) of about 0.5 and
therefore a 2:1 peak-to-average current density profile [30], will tend to
backstream primarily from the center beamlets. This localized backstreaming
accelerates electrons on axis and can overheat components such as the cathode
at the center-back of the thruster. Thrusters designed to have flat profiles, such
as the Nuclear Electric Xenon Ion Thruster System (NEXIS), with a better than
0.9 flatness parameter [33], will tend not to backstream easily because of a
lower peak ion current density for a given total beam current, and also, if
backstreaming starts, it will be over a larger area that minimizes the localized
heating issue in the discharge chamber.
5.5 High-Voltage Considerations
As shown in Section 5.3, the maximum thrust that can be produced by an ion
thruster is a function of the electric field that can be sustained between the
screen and accelerator grids:
Tmax = 8
9 o Ts Ag RE2. (5.5-1)
From Eq. (5.5-1), the maximum space-charge-limited (sometimes called
perveance-limited) thrust of the accelerator system is directly proportional to
the intra-grid electric field squared. To produce compact ion thrusters with the
highest possible thrust, it is necessary to maximize the electric field between
the grids. The maximum thrust in ion engines is then limited primarily by the
voltage hold-off capability of the grids.

Ion Thruster Accelerator Grids 217
The ability of the accelerator grids to hold off high voltage reliably and to
withstand occasional breakdowns without significant damage or loss of voltage
standoff capability is therefore of critical importance for ion thrusters. The
high-voltage behavior of vacuum-compatible materials has been summarized in
recent books on high-voltage engineering [34,35]. In plasma devices [36],
electric fields of up to 40 kV/cm were found useful for refractory metal
electrodes and of the order of 25 kV/cm for carbon materials. Degradation of
the voltage hold-off due to surface damage incurred during breakdowns has
been investigated for molybdenum and carbon electrodes [36] commonly used
in ion thruster applications. The surfaces of these materials can be carefully
prepared to withstand high electric fields required to produce the highest thrust
density. However, sputter erosion over time and electrical breakdowns between
grids cause some fraction of the stored energy in the power supply to be
deposited on the grid surface. The formation of an arc at the cathode electrode
(the accel grid) and the deposition of a significant amount of electron power
from discharge into the anode electrode (the screen grid) can cause both the
screen and accel grid surfaces to be modified and/or damaged. The breakdown
events usually impact the subsequent voltage hold-off capability of the grid
surfaces, which affects the long-term performance of the thruster.
5.5.1 Electrode Breakdown
The grids in ion thrusters have high voltages applied across small grid gaps,
which can lead to high-voltage breakdown and unreliable thruster operation.
High-voltage breakdown is usually described in terms of the electric field
applied to the surface that causes an arc or discharge to start. Arc initiation is
well correlated to the onset of field emission [37,38]. If sufficient field emission
occurs due to excessive voltage or a modification to the surface that enhances
field emission, the gap breaks down. Physical damage to arced surfaces during
the breakdown is attributed to localized energy deposition on the electrode that
causes melting or evaporation of the material. On the cathode surface (the accel
grid), the energy is deposited primarily by ion bombardment from the arc
plasma. On the anode surface (the screen grid), the energy is deposited from the
plasma or electron stream that crosses the gap and results in localized surface
heating and vaporization. The energy provided to the arc from the power supply
is distributed between any series resistance in the electrical circuit, the voltage
drop at the cathode surface, and the voltage drop in the plasma discharge and
anode sheath. These voltage drops can be modeled using discrete series
resistances in the energy balance of the system. Engineers often rate the
possibility of a power supply damaging the electrodes by the amount of stored
energy in the power supply. However, the amount of material removed from the
surfaces and the lifetime of high-voltage electrodes is usually characterized [36]
by the amount of current that passes through the arc. This “coulomb-transfer

218 Chapter 5
rating” is related to the energy deposition in the electrodes in a simple manner.
The power running in the arc is P = IVarc , where I is the discharge current and
Varc is the voltage drop in the arc. Assuming that most of the voltage drop is in
the cathode sheath, the energy E deposited by the arc on the cathode surface is
E = P dt = IVarc dt . (5.5-2)
The voltage drop of refractory metal and graphite arcs is nearly independent of
the amount of current running in the arc up to several hundred amperes [39,40].
Therefore the arc voltage can be considered to be essentially a constant, and the
energy deposited by the arc on the cathode is
E = Varc I dt = Varc Q , (5.5-3)
where Q is the total charge transferred in the arc. The arc energy deposited on
the cathode surface for a given electrode material is characterized by the total
charge transferred by the thruster power supplies during the arc time and not
just the stored energy in the power supply. Assuming that the arc remains lit
during the entire time required to discharge the filter capacitor in the power
supply, the total charge transferred through the arc is Q = CV, where C is the
capacitance and V is the capacitor charging voltage. If the arc current falls
below the minimum value to sustain the arc, called the “chopping current,” and
is prematurely extinguished, then the total charge transferred is reduced.
It should be emphasized that the amount of energy delivered to the cathode
surface by the arc and the amount of damage to the surface incurred by material
removal are independent of any series resistance in the circuit as long as the
current is stable for the duration of the event (i.e., the current is above the
chopping current). This means that simply adding a series resistor to one leg of
the high-voltage power supply circuit or the accel grid circuit will not reduce
the surface damage due to an arc unless the arc current drops to less than the
chopping current. The only mechanism that reduces surface damage if the
current is large compared to the chopping current is to limit the total charge
transfer. This requires either reducing the power supply capacitance at a given
voltage (which reduces the total stored energy) or actively shunting or opening
the circuit to reduce the arc duration.
5.5.2 Molybdenum Electrodes
Molybdenum is a standard electrode material used in ion thrusters due to its
low sputter erosion rate, ability to be chemically etched to form the aperture
array, and good thermal and structural properties. The surface of the

Ion Thruster Accelerator Grids 219
molybdenum grid is often slightly texturized to retain sputtered material to
avoid flaking of the sputter-deposited material [41]. The threshold voltage for
the onset of field emission versus the gap spacing measured for molybdenum
electrodes using a standard “plate-and-ball” test arrangement in a high vacuum
facility [42] is shown in Fig. 5-14. The data show a classic power-law
dependence of the threshold voltage with gap spacing for small gaps, which is
sometimes called the “total voltage effect” [43]. While there are numerous
possible mechanisms for the total-voltage effect, the increased gap reduces the
surface electric field and the field emission current but increases the probability
of an atom or particulate being ionized while traversing the gap. The ionized
atom or particle is then accelerated into the cathode potential electrode and
produces secondary electrons. If sufficient ionizations and secondary electrons
are produced, the process cascades and the gap breaks down. Therefore, the
voltage that can be held across a gap does not increase linearly with the gap
dimension. This is equivalent to the Paschen breakdown [35] mechanism in
gas-filled devices and is caused by the release of gases or particulates from the
surfaces in vacuum gaps. After 10 arcs of 1 mC in charge transfer, the threshold
voltage was measured again, and the threshold voltage was observed to increase
for every gap tested, indicating that the surface was being conditioned.
Improving voltage standoff of electrodes with a series of low coulomb-transfer
arcs is common practice in the high-voltage industry and historically is often
called “spot-knocking.” This process removes small field emitters and tends to
clean oxides and impurities off the surface without damaging the surface, which
reduces the onset of field emission. Higher coulomb transfer arcs on
molybdenum (10 and 20 mC) improve the voltage hold-off by cleaning larger
areas of the surface and removing field emission sites. This effect will continue
��9A�*�"(�+#��(�$
��������(����
��������(�����
��������(�����
?!���!�#$���#(�&��8��
*�-����
�
�
�
3
�
�
�
��� ��� ��� ��� ��� ���
Fig. 5-14. Threshold voltage versus gap for molybdenum after 10 arcs of varying charge transfer (from [36]).

220 Chapter 5
until the surface is well conditioned or the arc anchors in one spot and causes
damage to the surface.
As the gap between the electrodes increases, the threshold voltage curves
become more linear and the surface asymptotes to a constant threshold electric
field. Figure 5-15 shows the threshold electric field for large gaps for a flat
molybdenum surface texturized by grit blasting and actual texturized grid
material with apertures chemically etched into the material. In this case, high
coulomb transfer arcs tend to damage and degrade the voltage standoff of the
grids. Scanning electron microscope photographs show localized damage to the
edge of the beam apertures, resulting in more field emission sites. The
molybdenum surfaces are initially capable of holding electric fields of well
over 200 kV/cm, but the surface roughening to retain flakes and the aperture
��9���#14$��'��*�"$
���
����
=#��(��$��*�-����
�
��
���
���
���
���
3��
� � � 3
?!���!�#$�=5>"�#$�8�����
4�
��9���#14$��'��,#�(�
���
����
��
�
��
���
���
���
���
3��
?!���!�#$�=5>"�#$�8�����
Fig. 5-15. Threshold electric field versus gap for (a) textured molybdenum plate and (b) textured grid material (from [36]).

Ion Thruster Accelerator Grids 221
edges associated with real grids cause the voltage hold-off to decrease. For
molybdenum material with apertures, the resulting surface is susceptible to
breakdown at electric fields of 40 to 50 kV/cm, which should be considered the
maximum electric field for designing molybdenum grids.
5.5.3 Carbon–Carbon Composite Materials
Carbon is a desirable material for ion thruster grid electrodes because of its low
sputtering yield under xenon ion bombardment [44] as compared with most
refractory grid materials. However, the structural properties of graphite are
usually insufficient for thin graphite grids of any reasonable size (greater than a
5- to 10-cm diameter) to survive launch vibrations. This problem can be solved
by using carbon material with better structural properties, such as carbon–
carbon composites and pyrolytic graphite. Grids made of these materials have
demonstrated low erosion in life tests and flown successfully [45]. However,
the more complex structures of these materials leads to lower thresholds for
field emission and less voltage standoff for grids made of these materials.
Carbon–carbon composite material used for grid electrodes [46] is based on
carbon fibers woven into a matrix with the fibers oriented in one or two
dimensions. This material has enhanced strength and flexural modulus
compared to pure graphite due to the carbon-fiber properties. The carbon-fiber
weave is impregnated with a resin and built up to the desired shape by
progressive laminate layers on a mold. The resulting material is usually
densified and graphitized at high temperature, and may be further impregnated
or over-coated with a thin chemical-vapor-deposition (CVD) carbon layer after
this process to fill any voids or smooth the final surface. High-voltage
breakdown tests were conducted with and without this final surface graphite
coating.
The threshold voltage of the carbon–carbon composite samples is shown in
Fig. 5-16, where the threshold for field emission is plotted as a function of the
electrode gap for various levels of coulomb-transfer arcing. New material
(without arcing) with a fresh CVD layer has a high threshold for field emission,
and therefore holds voltage well. High coulomb-transfer arcs (>1 mC) tend to
damage that surface and return it to the state of the material without the CVD
over-layer. Higher coulomb-transfer arcs also tend to damage the surface. In
fact, in this example, the 10-mC arcs resulted in damage to the opposite anode
electrode, which evaporated and redeposited material back on the cathode-
potential surface, improving its voltage hold-off capability. For this reason, the
coulomb-transfer limit for carbon–carbon (CC) grids should be set to about
1 mC such that conditioning and no damage to either the screen or accel grid
occurs during any breakdowns.

222 Chapter 5
The threshold electric field for CC material with grid apertures is shown in
Fig. 5-17 for new material and after a series of arcs. After the initial charac-
terization with 10 arcs of 1 mC each, 10 arcs of 10 mC were delivered to the
surface, which degraded the voltage standoff. However, the application of
4 sets of 10 arcs of only 1 mC re-conditioned the surface. The threshold electric
field was found to asymptote to just below the same 40-kV/cm field at larger
gap sizes observed for low coulomb-transfer arcs of flat material, suggesting
that the aperture edges function in a similar manner as does material roughness.
��9���(��"�#�.� �/
��� �/� ��("�&
�����
�����
����
?!���!�#$���#(�&��8��
*�-����
�
�
�
3
�
�
��� ��� ��� ��� ��� ��� ��� ���
Fig. 5-16. Threshold voltage for carbon–carbon composite material
after 10 arcs at various coulomb transfers (from [36]).
�.� �/
���
����
��� B�
��� B�
?!���!�#$�=5>"�#$�8�����
=#��(��$��*�-����
�
��
��
��
��
���
���
� � � 3 � �
���
���
���
���
Fig. 5-17. Threshold electric field versus electrode gap for CC grid material with apertures (from [36]).

Ion Thruster Accelerator Grids 223
=#��(��$��*�-����
�
� � � 3 � �
?!���!�#$�=5>"�#$�8�����
��
��
��
��
���
���
���
���
,*�*�"$���(��"�#
��9
���
����
Fig. 5-18. Threshold electric field for pyrolytic graphite with grid
apertures (from [36]).
These results suggest that carbon–carbon composite grids can be designed for
reliable high-voltage standoff utilizing a field emission threshold of about
35 kV/cm, even for large gaps and voltages in excess of 10 kV, provided that
the coulomb transfer is limited by the power supply to less than about 1 mC.
This 35-kV/cm field limit is the highest voltage stress that should be allowed,
and conservative design practices suggest that a 50% margin (to 23 kV/cm)
should be considered in designing these types of grids.
5.5.4 Pyrolytic Graphite
Pyrolytic graphite (PG) is also a candidate for accelerator grid electrodes in ion
thrusters [47]. This material is configured with the carbon crystal planes
parallel to the surface. Pyrolytic graphite is grown a layer at a time to near the
desired shape on a mandrel and then finish machined to the final configuration.
Flat test coupons were fabricated in this manner, but they featured small surface
bumps and depressions that were residual from the growth process. Figure 5-18
shows the behavior of a PG grid sample that had apertures laser-machined into
it and then the surface lightly grit blasted. The as-new PG material
demonstrated threshold electric fields of 20 to 30 kV/cm for gaps of 1 mm or
larger, which is lower than that found for the CC grid material. However, a
series of ten 1-mC arcs tends to smooth and condition the surface and raise the
threshold electric field to the order of 30 kV/cm. Higher coulomb arcs (up to
about 10 mC) also improve the voltage standoff to about 40 kV/cm. The
pyrolytic graphite is more susceptible to field emission and breakdown than the
carbon–carbon material, but appears to tolerate higher coulomb-transfer arcs.

224 Chapter 5
#��C
���
�D�����
�������−��
−3�
��������−� ��������−3
�� ��$"("��"�&
3�������− � ��������− � :�������− � ;�������− �
−�;
−�:
−��
−�3
−��
����:��
3�� �����5� ����
�
�
Fig. 5-19. Fowler–Nordheim plots of field emission, showing conditioning of carbon–carbon grids by increasing numbers of 1-mC arcs (from [8]).
5.5.5 Hold-off and Conditioning in Ion Thrusters
Tests have shown that the arc initiation voltage is directly related to the
threshold voltage and electric field for field emission in Figs. 5-14 through 5-18
[36]. Arc initiation voltages tend to be less than 10% higher than the threshold
values for field emission shown here. This is consistent with experimental
observations that low levels of field emission and/or corona can be tolerated
before full arc breakdown occurs, but arcing and recycling tend to increase once
significant field emission starts. Molybdenum has been found to have a good
tolerance for high coulomb-transfer arcs, and grids can be designed to reliably
hold electric fields well in excess of 40 kV/cm. Carbon-based materials have
more structure than the refractory metals and tend to form field emitters if
excessive charge transfers are allowed. Nevertheless, grids utilizing carbon-
based materials can be designed with electric fields in excess of 20 kV/cm if the
coulomb transfer during breakdowns is limited to about 1 mC or less. Detailed
investigations of the voltage hold-off and conditioning of carbon–carbon
thruster grids were performed by Martinez [8], who documented the effect for
larger area grid sets. Figure 5-19 shows their reduction in field emission from
carbon–carbon grids plotted on a Fowler–Nordheim plot [43] for increasing
numbers of 1-mC arcs. This work shows that even if the surface of carbon–
carbon grids evolve field emitters over time due to erosion from ion
bombardment, proper design of the power supply to limit the coulomb-transfer
rate will result in reconditioning of the grid surfaces with every recycle event.

Ion Thruster Accelerator Grids 225
5.6 Ion Accelerator Grid Life
The most important wear mechanism in modern ion thrusters is accelerator grid
erosion. Even though properly designed optics attempt to make all of the ions
extracted from the discharge chamber focus through the accelerator grid
apertures, a current of secondary ions generated downstream of the discharge
chamber impacts the accelerator grid. These secondary ions are generated by
resonant charge exchange (CEX) between beam ions and neutral propellant gas
escaping from the discharge chamber. The cross section for resonant charge
exchange—that is, the transfer of an electron from a propellant atom to a
beamlet ion—is very large: on the order of a hundred square angstroms [48].
This process results in a fast neutral atom in the beam and a slow thermal ion.
These slow ions are attracted to the negatively charged accelerator grid, and
most hit with sufficient energy to sputter material from the grid. Eventually the
accelerator grid apertures become too large to prevent electron backstreaming
or enough material is sputtered away that the grids fail structurally.
The erosion geometry is naturally divided into two regions. The first region,
barrel erosion, is caused by ions generated between the screen grid aperture
sheath and the downstream surface of the accelerator grid, as shown in
Fig. 5-20. Charge exchange ions generated in this region impact the inside
surface of the accelerator grid aperture, which results in enlargement of the
aperture barrel. As the barrel diameter increases, the grid must be biased more
and more negatively in order to establish the minimum potential required in the
aperture to prevent neutralizer electrons from backstreaming into the discharge
chamber. Thruster failure occurs when, at its maximum voltage, the accelerator
grid power supply is unable to stop electron backstreaming.
The second region of grid erosion is caused by charge exchange ions generated
downstream of the accelerator. Since the beamlets are long and thin, inside each
beamlet the radial electric forces dominate and expel the slow, charge-exchange
ions into the gaps between the beamlets. Charge exchange ions generated in the
region before the beamlets merge to form a continuous ion density are then
attracted back to the accelerator grid by its large negative potential. This is
illustrated in Fig. 5-21. On impact, these ions sputter away material from the
downstream surface of the accelerator grid. Sputter erosion by these
backstreaming ions results in a hexagonal “pits-and-grooves” erosion pattern on
the downstream grid surface, which can lead to structural failure of the grids if
the erosion penetrates all the way through the grid. Erosion of the accel grid
aperture edge by backstreaming ions can also effectively enlarge the accel grid
aperture diameter, leading to the onset of electron backstreaming.

226 Chapter 5
BeamletDischargeChamberPlasma
ScreenGrid
AccelGrid
Xe+
Fig. 5-20. Ions that cause barrel erosion are generated by
charge exchange upstream and within the accelerator grid aperture.
Beamlets
Accel Grid
Xe+
Xe+
Fig. 5-21. Ions that cause pits and grooves erosion are generated between the downstream surface of the accel grid and where the beamlets overlap.
Erosion of the accelerator grid by charge exchange ion sputtering was the major
life-limiting mechanism observed during the ELT of the NSTAR flight spare
thruster [49] for operation at the highest power TH15 level. Photographs of
center holes in the grid at the beginning and the end of the 30,000-hour test are
shown in Fig. 5-22 where barrel-erosion enlargement of the aperture diameters
is evident. Note that the triangle patterns where the webbing intersects in the
end-of-test picture are locations where the erosion has completely penetrated
the grid. The scanning electron microscope (SEM) photograph shown in
Fig. 5-23 illustrates the deep erosion of the pits-and-grooves pattern and shows
that full penetration of the grid had occurred when the test was stopped.
Continued operation would have eventually resulted in structural failure of the
grid, but this was not considered imminent at the end of the test.

Ion Thruster Accelerator Grids 227
(a) (b)
Fig. 5-22. NSTAR thruster accelerator grid at (a) 125 hours and (b) 30,352 hours.
Fig. 5-23. SEM photograph shows that sputtering in the webbing between the holes had almost
destroyed the structural integrity of the NSTAR grids.
5.6.1 Grid Models
As discussed above, the primary erosion mechanism of the accelerator grid is
caused by sputtering from charge exchange ions. At the simplest level, all that
is needed to predict erosion rates is to calculate the number of ions generated in
the beamlets, find where they hit the grids, and then to determine the amount of
material that they sputter. The total calculated charge exchange ion current
accounts for nearly all of the measured accelerator grid current in a properly
designed ion thruster (i.e., no direct interception of the beam current). The
measured accelerator grid current in NASA’s NSTAR thruster [30] ranged from

228 Chapter 5
�
�������
����� �������
����
����
����
����
����
����
��� ��� ��� ��� ��� ��� ���
Fig. 5-24. Ratio of the accel grid current to the beam current as a function
of the beam current in NSTAR, showing that the accel current is typically less than 1% of the beam current (from [30]).
0.2% to 0.3% of the total beam current, which is shown in Fig. 5-24. Accel grid
currents on the order of 1% or less of the beam current are standard in most ion
thrusters.
Calculating the ion generation rate in the grid region due to charge exchange is
relatively straightforward. The charge exchange currents generated by a single
aperture’s beamlet are given by
ICEX = IBeamlet no CEX d , (5.6-1)
where d is the effective collection length downstream of the accel grid from
which ions flow back to the grid and no is the average neutral density along
this length. The charge exchange cross section, CEX, is well known and varies
slowly with beam energy [48]. The average neutral density along the path
length d is estimated from the thruster propellant flow rate utilization
fraction, which is the difference between the neutral atom flow rate and the
beam ion current over the open area fraction of the accel grid. The neutral
density is usually assumed to remain constant in the accel grid hole and
decreases as the gas expands downstream of the grid surface. The neutral gas
density is normally highest in holes near the edge of the grid and lower at the
center where nearly all the gas has been “burned up” through ionization in the
discharge chamber. The effective path length, d , is a basic result of the ion
optics calculations, and is essentially the distance downstream at which the
beamlets have completely merged to form a beam plasma with a uniform
potential across the beam diameter. An estimate of the effective path length is
needed when setting up a grid erosion calculation to make certain that the

Ion Thruster Accelerator Grids 229
computational region is long enough to include all the charge exchange ions
that can return to the grid.
Using Eq. (5.6-1) and the current ratio from Fig. 5-24, an estimate can be made
of the effective path length ( d ) for the NSTAR thruster. If the measured accel
grid current is all due to charge exchange (i.e., no direct interception), then
Eq. (5.6-1) can be rewritten as
d =Iaccel
IBeam CEX no. (5.6-2)
Assuming the effective charge exchange path length is much longer than the
gap between the screen and accelerator grids, the average neutral gas density
can be estimated from the grid diameter, the flow of neutral gas out of the
thruster, and the thruster beam current. The neutral gas density downstream of
the grids close to the thruster is then
no =o
vo rgrid2
, (5.6-3)
where vo is the neutral velocity, and o is the flux of unutilized propellant
escaping from the discharge chamber. Using the parameters for the NSTAR at
TH15 from [29], the total neutral flow into the thruster is 28 sccm. The thruster
discharge chamber has a mass utilization efficiency of about 88%, so the
neutral gas flow escaping the thruster is about 3.4 sccm, which corresponds to
1.5 1018
particles per second. Assuming the gas exits the thruster at about an
operating temperature of 250˚C, the neutral velocity c /2 is about 110 m/s. The
average neutral density from Eq. (5.6-3) is then about 2.3 1017
m–3
, and
neutral density varies over the grid by more than a factor of two. Using the data
in Fig. 5-24 extrapolated to the beam current of 1.76 A in TH15, and a charge
exchange cross section of 5 10–19
m2, the average effective path length from
Eq. (5.6-2) becomes
d =(0.003)
5 10 19( ) 2.3 1017( )= 0.03[m] . (5.6-4)
The path length is more than an order of magnitude larger than the grid gap,
consistent with our assumption. The very long path length compared with grid
hole spacing means that the computational space in ion optics codes is very
long (several centimeters), and so the computer codes must allow for the axial
zone sizes to increase downstream of the grids.

230 Chapter 5
5.6.2 Barrel Erosion
As was illustrated in Fig. 5-20, charge exchange ions generated between the
screen grid and the upstream surface of the accel grid can impact the interior
surface of the accel grid holes. These ions sputter away grid material,
increasing the barrel radius. While computer codes, such as CEX-2D [4], are
normally used to calculate the erosion rate, it is instructive to derive an
analytical estimate. The following calculation is based upon published
performance and erosion data for NASA’s NSTAR thruster operating at its
highest power TH15 level [29,50].
Assume that any ions generated downstream of the discharge chamber are not
focused through the hole in the accelerator grid. For barrel erosion, the path
length is taken as the sum of the grid gap and the accelerator grid thickness,
which for NSTAR is about a millimeter. The upstream gas density is estimated
by dividing the downstream density by the grid open area fraction, fa , and the
Clausing [51] factor, c , which reduces the gas transmission due to the finite
thickness of the accel grid. The Clausing factor depends only on the aperture
length-to-radius ratio. The neutral gas density is then
no =o
vo rgrid2
1
fa c. (5.6-5)
The neutral gas density in the accelerator grid apertures is higher than the gas
density downstream of the accelerator grid, which was calculated using
Eq. (5.6-2), due to the effects of the open area fraction and the Clausing factor.
For an open area fraction of 0.24 and a Clausing factor of 0.6, the neutral
density in the grid gap is about 9 1018
m–3
.
The number of grid apertures is approximately the grid open area divided by
the area per aperture:
Naperturefa rgrid
2
raperture2
. (5.6-6)
The average aperture current is the total beam current divided by the number of
apertures,
Iaperture =Ib
Naperture. (5.6-7)

Ion Thruster Accelerator Grids 231
The maximum aperture current is obtained using the definition of beam
flatness, which is given as
fbAverage current density
Peak current density=
Iaperture
Iaperturemax
. (5.6-8)
The published value of NSTAR beam flatness from Polk [30] is 0.47. Using
Eqs. (5.6-6), (5.6-7), and (5.6-8), the maximum current per aperture is
2.5 10–4
A. Charge exchange ions that can hit the accel grid are generated in
between the screen grid exit and the accel grid exit. The distance d between the
screen grid exit and the accel grid exit is about 1.12 mm [4]. The charge
exchange ion current to the central aperture barrel is then
ICEX = Iaperturemax no CEX d = 1.4 10 6 [A]. (5.6-9)
The CEX-2D computer code simulations [4] show that charge exchange ions
hit the accelerator grid with about three-tenths of the beam potential. For
NSTAR, the beam potential is 1100 V; thus, the average charge exchange ion
energy is about 330 V. Using the curve fit in reference [4] for sputtering yield
Y, the aperture atom sputter rate is obtained:
nsputter =ICEX
eY 3.5 1012
[particles/s]. (5.6-10)
This atom sputtering rate can be used to find an initial wall erosion rate by first
calculating the volumetric erosion rate:
Vaperture =nsputter
Mo
M Mo
, (5.6-11)
where the density of molybdenum is Mo = 1.03 104 and the mass of
molybdenum is M Mo = 95.94 AMU = 1.6 10–25
kg. The volumetric erosion
rate from Eq. (5.6-11) is then
Vaperture =nsputter
Mo
mMo
=3.5 1012
1.03 104
1.6 10 25
5.5 10 17 [m3/s]. (5.6-12)

232 Chapter 5
��������������
� ����! �"�#��� � ���! �"�#���
Fig. 5-25. Computational domain of the CEX-3D code (from [17]).
Assuming the erosion rate is uniform throughout the barrel, the rate of increase
of the aperture radius is just the volumetric erosion rate divided by the barrel
area,
raperture =Vaperture
2 rawaccel3 10 11[m/ s] , (5.6-13)
where the accel grid aperture radius ra is 0.582 mm and the accel grid
thickness waccel is a half-millimeter. For the 8200-hour NSTAR wear test
results described by Polk [30], this corresponds to an increase in diameter of
about 0.2 mm, roughly what was observed.
More accurate predictions of the accel grid barrel erosion rate are found using
the 2D and 3D computer simulations [4]. However, the codes use the same
basic technique as that shown here to determine the amount of material
removed by the charge exchange sputtering. The better predictions result from
more accurate calculations of the neutral density and ion current densities
across the grid surfaces and through the grid apertures.
5.6.3 Pits-and-Grooves Erosion
Using three-dimensional ion optics codes, it is possible to reproduce the details
of the pits-and-grooves geometry of accelerator grid downstream surface
erosion. The JPL CEX-3D code was developed [17] to solve for potentials and
ion trajectories in a two-grid ion optics system, and was later modified to
include a third grid [52]. The computational domain, illustrated in Fig. 5-25, is
a triangular wedge extending from the axis of a hole pair to the midpoint
between two aperture pairs. The wedge angle of 30 degrees is chosen to give

Ion Thruster Accelerator Grids 233
(a) (b)
Fig. 5-26. CEX-3D calculation of the pits-and-grooves erosion wear patterns that match the experimental patterns shown in (a) Fig. 5-22(a) and (b) 5-22(b).
the smallest area that can be used to model the ion optics in order to minimize
computational time. Similar triangles will cover each aperture pair by a
combination of reflections and rotations. The computational domain extends
from a few millimeters into the discharge chamber through the grids to a few
centimeters downstream of the final grid.
In addition to tracking the beam-ion trajectories, the code calculates charge
exchange ion production rates and charge exchange trajectories in three
dimensions. Erosion of the accel grid barrel and downstream face is caused by
these charge exchange ions. The location, kinetic energy, incidence angle, and
current of each particle are recorded and used to compute the rate at which the
grid material is removed. As shown above, charge exchange ions that strike the
downstream surface of the accelerator grid can come from several centimeters
downstream of the grid. Therefore, the computations domain is usually
extended to 5-cm downstream of the final grid.
An example of the accel-grid downstream face erosion pattern predicted by
CEX-3D is shown in Fig. 5-26. The triangular patches (the “pits”), where the
grid webbing intersects, are shown in the photograph of the NSTAR ELT grid
at the end of the test [49] and are predicted by the code in Fig. 5-26(a). In
addition, the depth of the ring of erosion around the aperture (“the grooves”) is
also seen in Fig. 5-26(b) from the code predictions.
Accelerator grid pits-and-grooves erosion can be almost eliminated by the use
of a third decelerator grid [44]. The Xenon Ion Propulsion System (XIPS®)
thruster [53] is an example of an ion thruster that uses a three-grid ion optics
system. As shown in Fig. 5-27, the third grid reduces from centimeters to
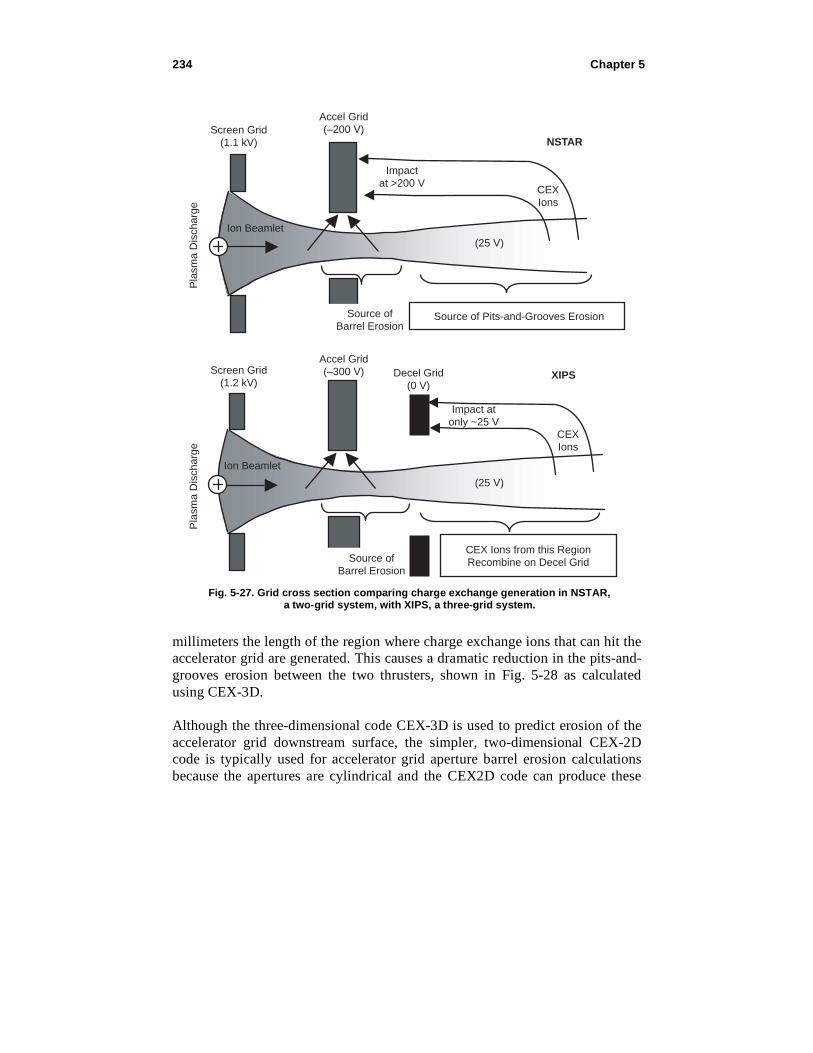
234 Chapter 5
Screen Grid(1.1 kV)
Screen Grid(1.2 kV)
Accel Grid(–200 V)
Accel Grid(–300 V) Decel Grid
(0 V)
NSTAR
XIPS
Pla
sma
Dis
char
geP
lasm
a D
isch
arge
CEXIons
CEXIons
Impactat >200 V
Impact atonly ~25 V
(25 V)
(25 V)
Ion Beamlet
Ion Beamlet
Source ofBarrel Erosion
CEX Ions from this RegionRecombine on Decel Grid
Source of Pits-and-Grooves ErosionSource ofBarrel Erosion
Fig. 5-27. Grid cross section comparing charge exchange generation in NSTAR, a two-grid system, with XIPS, a three-grid system.
millimeters the length of the region where charge exchange ions that can hit the
accelerator grid are generated. This causes a dramatic reduction in the pits-and-
grooves erosion between the two thrusters, shown in Fig. 5-28 as calculated
using CEX-3D.
Although the three-dimensional code CEX-3D is used to predict erosion of the
accelerator grid downstream surface, the simpler, two-dimensional CEX-2D
code is typically used for accelerator grid aperture barrel erosion calculations
because the apertures are cylindrical and the CEX2D code can produce these

Ion Thruster Accelerator Grids 235
����
����
��
��
�
��
��
��
�
���
���
��
���
��
���
���
Fig. 5-28. CEX-3D results showing the XIPS third grid almost eliminates pits and grooves erosion evident in the NSTAR
thruster (from [52]).
results more quickly. CEX-2D and CEX-3D use the same algorithms for the
discharge chamber plasma and for beam ion trajectories. The codes have been
benchmarked with each other, and for round beamlets that can be handled by
CEX-2D, their results are within a few percent.
References
[1] H. R. Kaufman, “Technology of Electron-Bombardment Ion Thrusters,”
in Advances in Electronics and Electron Physics, vol. 36, edited by
L. Marton, New York: Academic Press, 1974.
[2] A. T. Forrester, Large Ion Beams, New York: John Wiley and Sons, 1988.
[3] G. R. Brewer, Ion Propulsion Technology and Applications, New York:
Gordon and Breach, 1970.
[4] J. R. Brophy, I. Katz, J. E. Polk, and J. R. Anderson, “Numerical
Simulations of Ion Thruster Accelerator Grid Erosion,” AIAA-2002-
4261, 38th Joint Propulsion Conference, July 7–10, 2002.
[5] V. J. Friedly and P. J. Wilbur, “High Current Hollow Cathode
Phenomena,” Journal of Propulsion and Power, vol. 8, no. 3, pp. 635–
643, 1992.
[6] I. Kameyama and P. J. Wilbur, “Measurement of Ions from High Current
Hollow Cathodes Using Electrostatic Energy Analyzer,” Journal of
Propulsion and Power, vol. 16, no. 3, pp. 529–535, 2000.

236 Chapter 5
[7] P. J. Wilbur, J. R. Beattie, and J. Hyman, Jr., “An Approach to the
Parametric Design of Ion Thrusters,” Journal of Propulsion and Power,
vol. 6, no. 5, pp. 575–583, 1990.
[8] R. A. Martinez, J. D. Williams, and D. M. Goebel, “Electric Field
Breakdown Properties of Materials Used in Ion Optics Systems,” AIAA-
2006-5004, 42nd Joint Propulsion Conference, Sacramento, California,
July 10–13, 2006.
[9] P. Wilbur, “Limits on High Specific Impulse Ion Thruster Operation,”
AIAA-2004-4106, 40th Joint Propulsion Conference, Fort Lauderdale,
Florida, July 11–14, 2004.
[10] J. H. Whealton, R. W. McGaffey, and P. S. Meszaros, “A Finite
Difference 3-D Poisson-Vlasov Algorithm for Ions Extracted from a
Plasma,” Journal of Computational Physics, vol. 63, pp. 20–32, 1986.
[11] Y. Arakawa and M. Nakano, “An Efficient Three Dimensional Optics
Code for Ion Thruster Research,” AIAA-96-3198, 32nd Joint Propulsion
Conference, Lake Buena Vista, Florida, July 1–3, 1996.
[12] M. Nakano and Y. Arakawa, “Ion Thruster Lifetime Estimation and
Modeling Using Computer Simulation,” IEPC-99-145, 27th International
Electric Propulsion Conference, Pasadena, California, October 15–19,
2001.
[13] Y. Nakayama and P. Wilbur, “Numerical Simulation of High Specific
Impulse Ion Thruster Optics,” IEPC-01-099, 27th International Electric
Propulsion Conference, Pasadena, California, October 15–19, 2001.
[14] I. Boyd and M. Crofton, “Grid Erosion Analysis of the T5 Ion Thruster,”
AIAA-2001-3781, 37th Joint Propulsion Conference, Salt Lake City,
Utah, July 8–11, 2001.
[15] Y. Okawa, H. Takegahara, and T. Tachibana “Numerical Analysis of
Ion Beam Extraction Phenomena in an Ion Thruster,” IEPC-01-097, 27th
International Electric Propulsion Conference, Pasadena, California,
October 15–19, 2001.
[16] J. Wang, J. E. Polk, J. R. Brophy, and I. Katz, “Three-Dimensional
Particle Simulations of NSTAR Ion Optics,” IEPC-01-085, 27th
International Electric Propulsion Conference, Pasadena, California,
October 15–19, 2001.
[17] J. J. Anderson, I. Katz, and D. Goebel, “Numerical Simulation of Two-
Grid Ion Optics Using a 3D Code,” AIAA-2004-3782, 40th Joint
Propulsion Conference, Ft. Lauderdale, Florida, July 11–14, 2004.
[18] Ian Brown, The Physics and Technology of Ion Sources, New York: John
Wiley and Sons, 1989.

Ion Thruster Accelerator Grids 237
[19] Y. Nakayama and P. J. Wilbur, “Numerical Simulations of Ion Beam
Optics for Many-grid Systems,” Journal of Propulsion and Power, vol.
19, no. 4, pp. 607–613, 2003.
[20] J. Kim, J. H. Wealton, and G. Shilling, “A Study of Two-stage Ion Beam
Optics,” Journal of Applied Physics, vol. 49, no. 2, pp. 517–524, 1978.
[21] C. Farnell, “Performance and Life Simulation of Ion Thruster Optics,”
Ph.D. Dissertation, Colorado State University, Fort Collins, Colorado,
2007.
[22] L. D. Stewart, J. Kim, and S. Matsuda, “Beam Focusing by Aperture
Displacement in Multiampere Ion Sources,” Review of Scientific
Instruments, vol. 46, pp. 1193–1196, 1975.
[23] J. H. Whealton, “Linear Optics Theory of Ion Beamlet Steering,” Review
of Scientific Instruments, vol. 48, pp. 1428–1429, 1977.
[24] M. Tarz, E. Hartmann, R. Deltschew, and H. Neumann, “Effects of
Aperture Displacement in Broad-Beam Ion Extraction Systems,” Review
of Scientific Instruments, vol. 73, no. 2, pp. 928–930, 2002.
[25] Y. Okawa, Y. Hayakawa, and S. Kitamura, “Experiments on Ion Beam
Deflection Using Ion Optics with Slit Apertures,” Japanese Journal of
Applied Physics, vol. 43, no. 3, pp. 1136–1143, 2004.
[26] J. D. Williams, D. M. Goebel, and P. J. Wilbur, “Analytical Model of
Electron Backstreaming for Ion Thrusters,” AIAA-2003-4560, 39th Joint
Propulsion Conference, Huntsville, Alabama, July 20–23, 2003.
[27] V. A. Davis, I. Katz, M. J. Mandell, D. E. Brinza, M. D. Henry, and D. T.
Young, “Ion Engine Generated Charge Exchange Environment:
Comparison between NSTAR Flight data and Numerical Simulations,”
AIAA-2001-0970, 39th Aerospace Sciences Meeting, Reno, Nevada,
January 8–11, 2001.
[28] K. R. Spangenberg, Vacuum Tubes, New York: McGraw-Hill, p. 348,
1948.
[29] J. R. Brophy “NASA’s Deep Space 1 Ion Engine,” Review of Scientific
Instruments, vol. 73 pp. 1071–1078, 2002.
[30] J. Polk, J. R. Anderson, J. R. Brophy, V. K. Rawlin, M. J. Patterson,
J. Sovey, and J. Hamley “An Overview of the Results from an 8200 Hour
Wear Test of the NSTAR Ion Thruster,” AIAA Paper 99-2446, 35th Joint
Propulsion Conference, Los Angeles, California, June 20–24, 1999.
[31] A. Sengupta, J. R. Brophy, and K. D. Goodfellow, “Status of the
Extended Life Test of the Deep Space 1 Flight Spare Ion Engine After
30,352 Hours of Operation,” AIAA-2003-4558, 39th Joint Propulsion
Conference, Huntsville, Alabama, July 20–23, 2003.

238 Chapter 5
[32] A. Sengupta, “Experimental Investigation of Discharge Plasma Magnetic
Confinement in an NSTAR Ion Thruster,” AIAA-2005-4069, 41st Joint
Propulsion Conference, Tucson, Arizona, July 10–13, 2005.
[33] J. E. Polk, D. M. Goebel, I. Katz, J. S. Snyder, A. C. Schneider,
L. Johnson, and A. Sengupta, “Performance and Wear Test Results for a
20-kW Class Ion Engine with Carbon-Carbon Grids,” AIAA-2005-4393,
41st Joint Propulsion Conference, Tucson, Arizona, July 10–13, 2005.
[34] E. Kuffel and W. S. Zaengl, High Voltage Engineering Fundamentals,
Oxford, England: Pergamon Press, 1984.
[35] W. H. Kohl, Handbook of Materials and Techniques for Vacuum Devices,
New York: Reinhold Publishing Corporation, 1967.
[36] D. M. Goebel and A. C. Schneider, “High Voltage Breakdown and
Conditioning of Carbon and Molybdenum Electrodes,” IEEE
Transactions on Plasma Science, vol. 33, issue 4, pp. 1136–1148, 2005.
[37] P. A. Chatterton, “Theoretical Study of the Vacuum Breakdown Initiated
by Field Emission,” Proceedings of the Physics Society, vol. 88, pp. 231–
243, 1966.
[38] F. R. Schwirzke, “Vacuum Breakdown on Metal Surfaces,” IEEE
Transactions on Plasma Science, vol. 19, pp. 690–696, 1991.
[39] W. D. Davis and H. C. Miller, “Analysis of the Electrode Products
Emitted by dc Arcs in a Vacuum Ambient,” Journal of Applied Physics,
vol. 40, pp. 2212–2221, 1969.
[40] A. Anders, B. Yotsombat, and R. Binder, “Correlation Between Cathode
Properties, Burning Voltage, and Plasma Parameters of Vacuum Arcs,”
Journal of Applied Physics, vol. 89, pp. 7764–7771, 2001.
[41] J. S. Sovey, J. A. Dever, and J. L. Power, “Retention of Sputtered
Molybdenum on Ion Engine Discharge Chamber Surfaces,” IEPC-01-86,
27th International Electric Propulsion Conference, Pasadena, California,
October 15–19, 2001.
[42] D. M. Goebel, “High Voltage Breakdown Limits of Molybdenum and
Carbon-based Grids for Ion Thrusters,” AIAA-2005-4257, 41st Joint
Propulsion Conference, Tucson, Arizona, July 10–13, 2005.
[43] M. J. Druyvesteyn and F. M. Penning, “The Mechanism of Electrical
Discharge in Gases,” Reviews of Modern Physics, vol. 12, pp. 87–174,
1940.
[44] R. Doerner, D. White, and D. M. Goebel, “Sputtering Yield
Measurements during Low Energy Xenon Plasma Bombardment,”
Journal of Applied Physics, vol. 93, no. 9, pp. 5816–5823, 2003.

Ion Thruster Accelerator Grids 239
[45] H. Kuninaka, I. Funaki, K. Nishiyama, Y. Shimizu, and K. Toki, “Results
of 18,000 hour Endurance Test of Microwave Discharge Ion Thruster
Engineering Model,” AIAA-2000-3276, 36th Joint Propulsion
Conference, Huntsville, Alabama, July 16–19, 2000.
[46] J. S. Snyder and J. R. Brophy, “Performance Characterization and
Vibration Testing of 30-cm Carbon-Carbon Ion Optics,” AIAA-2004-
3959, 40th Joint Propulsion Conference, Ft. Lauderdale, Florida, July 11–
14, 2004.
[47] M. De Pano, S. Hart, A. Hanna, and A. Schneider, “Fabrication and
Vibration Results of 30-cm Pyrolytic Graphite Ion Optics,” AIAA-2004-
3615, 40th Joint Propulsion Conference and Exhibit, Fort Lauderdale,
Florida, July 11–14, 2004.
[48] J. S. Miller, S. H. Pullins, D. J. Levandier, Y. Chiu, and R. A. Dressler,
“Xenon Charge Exchange Cross Sections for Electrostatic Thruster
Models,” Journal of Applied Physics, vol. 91, no. 3, pp. 984–991, 2002.
[49] A. Sengupta, J. R. Brophy, J. R. Anderson, C. Garner, K. deGroh,
T. Karniotis, and B. Banks, “An Overview of the Results from the 30,000
Hour Life Test of the Deep Space 1 Flight Spare Ion Engine,” AIAA-
2004-3608, 40th Joint Propulsion Conference, Fort Lauderdale, Florida,
July 11–14, 2004.
[50] J. E. Polk, R. Y. Kakuda, J. R. Anderson, J. R. Brophy, V. K. Rawlin,
M. J. Patterson, J. Sovey, and J. Hamley, “Performance of the NSTAR
Ion Propulsion System on the Deep Space One Mission,” AIAA-2001-
965, 39th Aerospace Sciences Meeting and Exhibit, Reno, Nevada,
January 8–11, 2001.
[51] P. Clausing, “The Flow of Highly Rarefied Gases Through Tubes of
Arbitrary Length,” Journal of Vacuum Science and Technology, vol. 8,
pp. 636–646, 1971.
[52] R. Wirz and I. Katz, “XIPS Ion Thruster Grid Erosion Predictions for
Deep Space Missions,” 30th International Electric Propulsion Conference,
Florence, Italy, September 17–20, 2007.
[53] J. R. Beattie, J. N. Matossian, and R. R. Robson, “Status of Xenon Ion
Propulsion Technology,” Journal of Propulsion and Power, vol. 6, no. 2,
pp. 145–150, 1990.

240 Chapter 5
Homework Problems
1. For an ion accelerator that is described by the Child–Langmuir law, derive
the dependence of the minimum Isp on the beam voltage for a given thrust
level.
2. A 1-kV ion accelerator has a grid spacing of 1 mm and a screen aperture
diameter of 1 mm.
a. What is the space-charge-limited beamlet current density for Xe+
assuming a very thin screen grid and a planar sheath?
b. If the screen grid is 0.25 mm thick, what is the maximum beamlet
current density for a non-planar sheath? How does this compare to the
classic planar Child–Langmuir result?
3. An ion thruster with a grid diameter of 20 cm has a beam current density
that varies with the radius as kr2, where k is a constant.
a. If the peak current density on axis is J p and the current density at the
edge of the grid is J p /10 , find the expression for J(r) .
b. If the peak current density is 5 mA/cm2, what is the total beam
current?
c. What is the flatness parameter?
d. What is the percent reduction in the beam current compared to the
case of a uniform beam current density of the peak value (the flatness
is 1)?
4. An ion thruster has a beam plasma potential of 20 V and an electron
temperature in the beam of 5 eV.
a. For a plasma potential at the screen grid sheath edge of 1000 V, what
potential must be established in the accel grid aperture to keep the
electron backstreaming current to 1% of the beam current?
b. Neglecting space charge in the beamlet, what voltage must be applied
to the accel grid to achieve the minimum potential in (a) for the case
of a 3-mm screen grid diameter, 0.25-mm screen grid thickness, 2-mm
accel grid diameter, and 0.5-mm accel grid thickness with a 1-mm
grid gap?
c. If the beamlet current is 0.2 mA and the beamlet has a diameter in the
accel grid aperture of 1 mm, what must the accel grid voltage be to
maintain the 1% backstreaming current specification?

Ion Thruster Accelerator Grids 241
5. One of the first ion thrusters to fly in space was a cesium surface ionization
thruster where cesium ions were pulled from a hot surface by the electric
field that also produced the beam. Model the thruster as a diode, with
cesium ions at 7.5 mA/cm2 coming from one surface and with the other
electrode an accel grid with 80% transparency and a grid gap “d” from the
ion source.
a. Assuming 100% mass utilization efficiency, neglecting the angular
divergence of the beam, and using a 200-V negative bias on the accel
grid, what is the voltage, current, thruster diameter, and gap size
required to produce 5 mN of thrust at an Isp of 3000 s?
b. If the thruster has 95% mass utilization efficiency and a total angular
divergence of the beam of 10 deg, how does that change the results of
part (a)?
c. If it takes 100 W of power to heating the cesium ion-emitting surface
to the required surface temperature of about 1350 K, what is the total
efficiency of the thruster, using the parameters from part (b)?


![IAEA · Field-shaains tes Ucntilalin ho e Upper ion source 5segnents Locally ma sKe11 Of 10 s operation Of 24H9 ... Multi-apertures grids (24 x 9] witti aperture displacemen Grids](https://img.pdfslide.net/doc/110x75/5f6e69074be73d36e53610f3/iaea-field-shaains-tes-ucntilalin-ho-e-upper-ion-source-5segnents-locally-ma-ske11.jpg)