Embed Size (px)
Citation preview

CHAPTER 5CHAPTER 5 Learning About Learning About Return and Risk Return and Risk from the from the Historical RecordHistorical Record
5-2
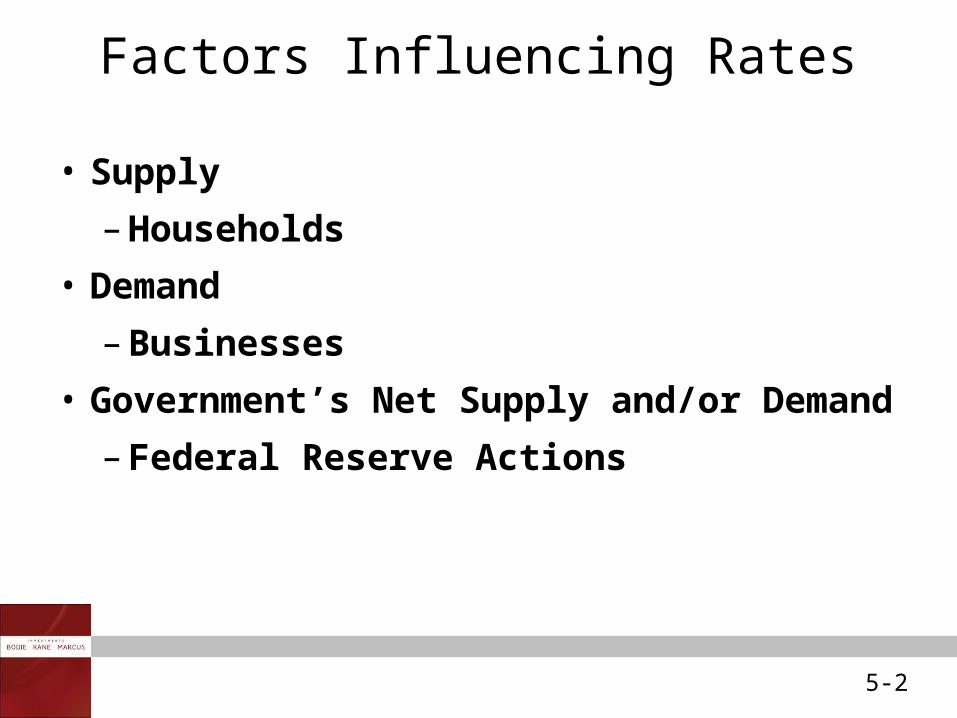
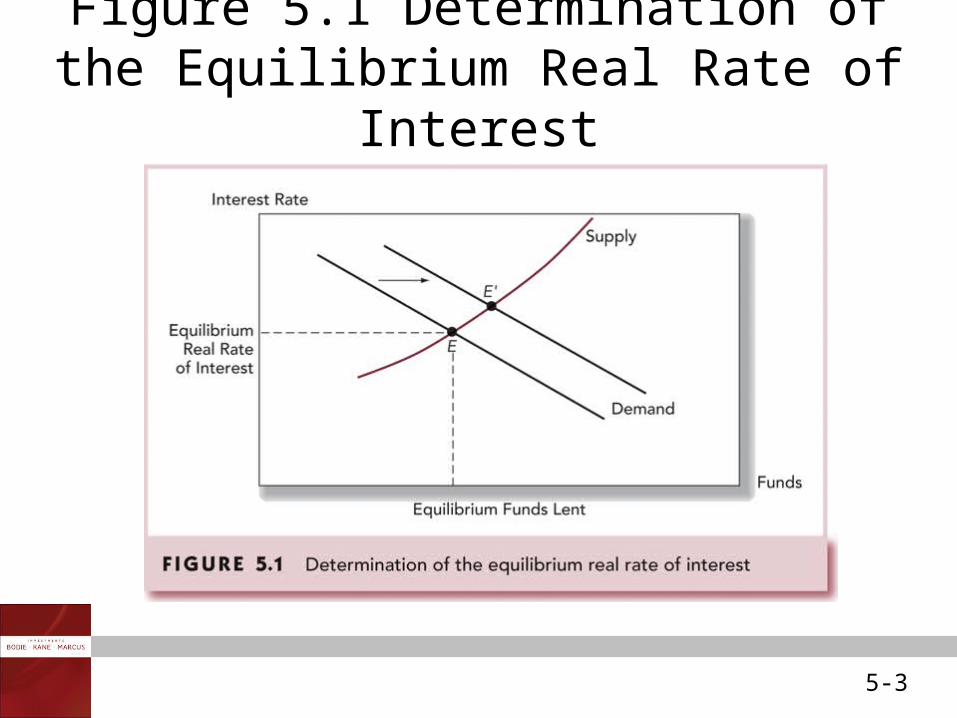
Factors Influencing Rates
• Supply
– Households
• Demand
– Businesses
• Government’s Net Supply and/or Demand
– Federal Reserve Actions
5-3
Figure 5.1 Determination of the Equilibrium Real Rate of Interest

5-4
Equilibrium Nominal Rate of Interest
• As the inflation rate increases, investors will demand higher nominal rates of return
• If E(i) denotes current expectations of inflation, then we get the Fisher Equation:
( )R r E i

5-5
Taxes and the Real Rate of Interest
• Tax liabilities are based on nominal income
– Given a tax rate (t), nominal interest rate (R), after-tax interest rate is R(1-t)
– Real after-tax rate is:
(1 ) ( )(1 ) (1 )R t i r i t i r t it

5-6
Comparing Rates of Return for Different Holding Periods
100( ) 1
( )fr T P T
Zero Coupon Bond

5-7
Formula for EARs and APRs
1
{ } 11 ( )
1(1 )T
TfEAR r T
EARAPRT

5-8
Bills and Inflation, 1926-2005
• Entire post-1926 history of annual rates:
– www.mhhe.com/bkm
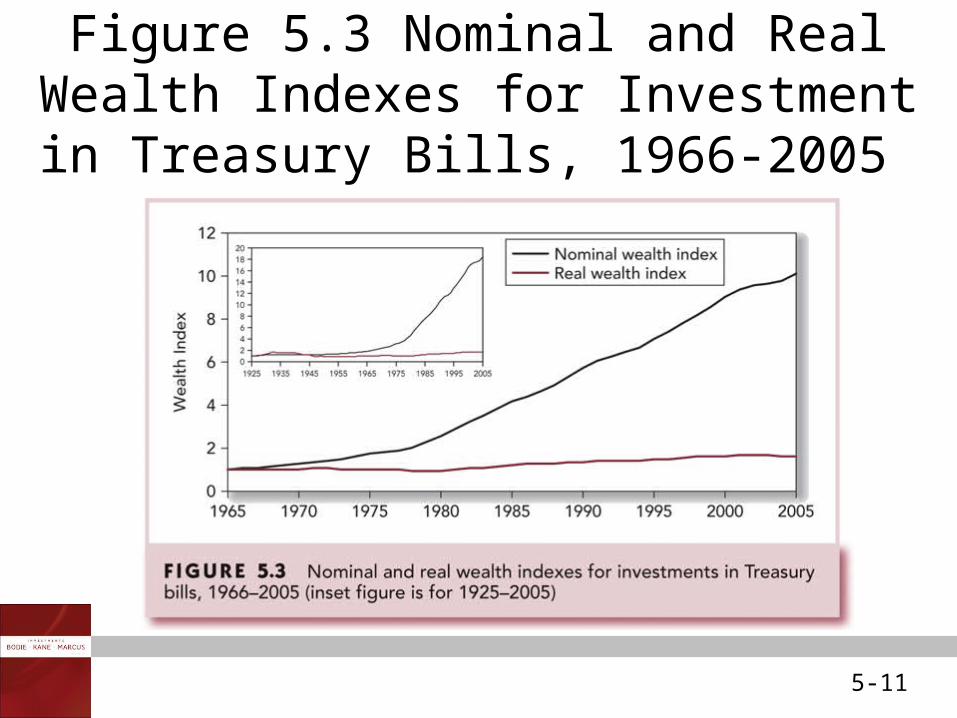
• Average real rate of return on T-bills for the entire period was 0.72 percent
• Real rates are larger in late periods

5-9
Table 5.2 History of T-bill Rates, Inflation and Real Rates for Generations, 1926-2005

5-10
Figure 5.2 Interest Rates and Inflation, 1926-2005
5-11
Figure 5.3 Nominal and Real Wealth Indexes for Investment in Treasury Bills,
1966-2005

5-12
Risk and Risk Premiums
P
DPPHPR0
101
HPR = Holding Period Return
P0 = Beginning price
P1 = Ending price
D1 = Dividend during period one
Rates of Return: Single Period

5-13
Ending Price = 48
Beginning Price = 40
Dividend = 2
HPR = (48 - 40 + 2 )/ (40) = 25%
Rates of Return: Single Period Example

5-14
Expected returns
p(s) = probability of a stater(s) = return if a state occurss = state
Expected Return and Standard Deviation
( ) ( ) ( )s
E r p s r s

5-15
State Prob. of State r in State 1 .1 -.052 .2 .053 .4 .154 .2 .255 .1 .35
E(r) = (.1)(-.05) + (.2)(.05)… + (.1)(.35)E(r) = .15
Scenario Returns: Example

5-16
Standard deviation = [variance]1/2
Variance:
Var =[(.1)(-.05-.15)2+(.2)(.05- .15)2…+ .1(.35-.15)2]Var= .01199S.D.= [ .01199] 1/2 = .1095
Using Our Example:
Variance or Dispersion of Returns
22 ( ) ( ) ( )s
p s r s E r

5-17
Time Series Analysis of Past Rates of Return
n
s
n
ssr
nsrsprE
11)(
1)()()(
Expected Returns and the Arithmetic Average

5-18
Geometric Average Return
1 2(1 )(1 ) (1 )nnr r rx xTV
TV = Terminal Value of the Investment
1/1 TVg n
g= geometric average rate of return

5-19
Variance and Standard Deviation Formulas
• Variance = expected value of squared deviations
• When eliminating the bias, Variance and Standard Deviation become:
22
1
1( )
n
s
r s rn
2
1
1( )
1
n
j
r s rn

5-20
The Reward-to-Volatility (Sharpe) Ratio
Sharpe Ratio for Portfolios =Risk PremiumSD of Excess Return

5-21
Figure 5.4 The Normal Distribution

5-22
Figure 5.6 Frequency Distributions of Rates of Return for 1926-2005

5-23
Table 5.3 History of Rates of Returns of Asset Classes for Generations, 1926- 2005

5-24
Table 5.4 History of Excess Returns of Asset Classes for Generations, 1926- 2005
5-25
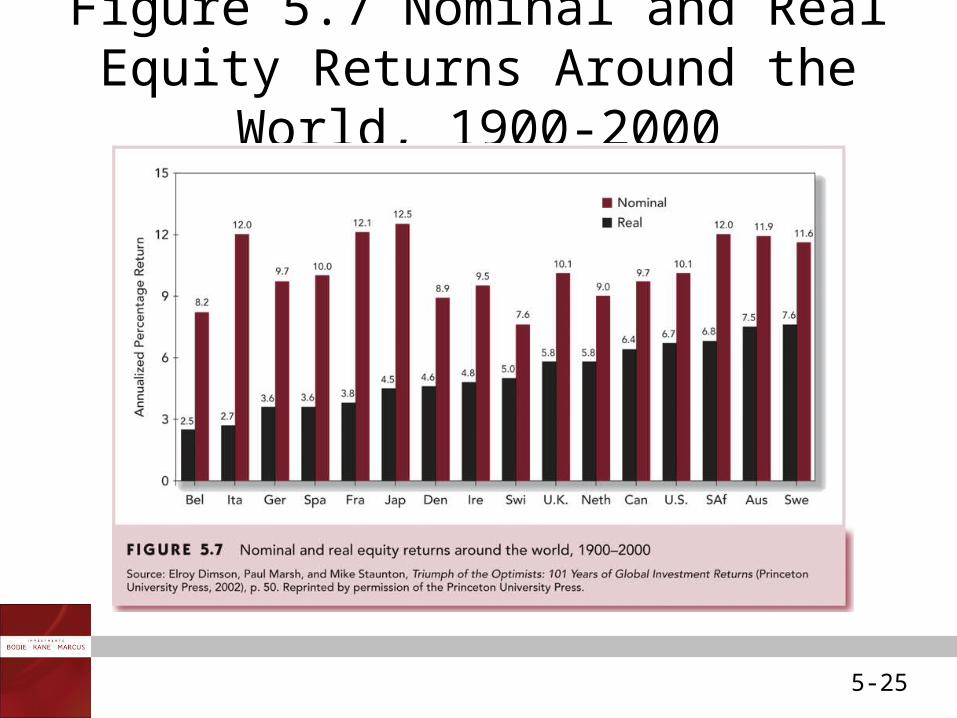
Figure 5.7 Nominal and Real Equity Returns Around the World, 1900-2000

5-26
Figure 5.8 Standard Deviations of Real Equity and Bond Returns Around the World, 1900-2000