Embed Size (px)
Citation preview
2018 USRDS ANNUAL DATA REPORT | VOLUME 2: ESRD IN THE UNITED STATES 411
Chapter 5: Mortality
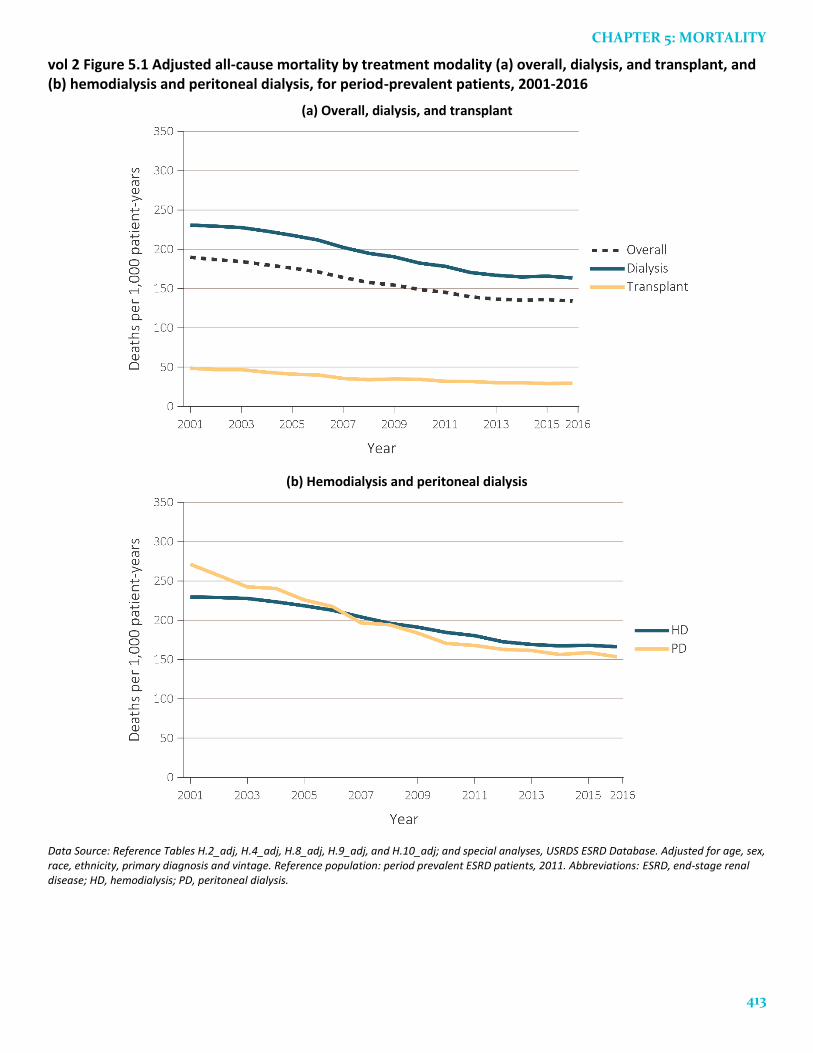
In 2016, adjusted mortality rates for ESRD, dialysis, and transplant patients were 134, 164, and 29 per 1,000 patient-years. By dialysis modality, mortality rates were 166 for hemodialysis (HD) patients and 154 for peritoneal dialysis (PD) patients, per 1,000 patient-years (Figure 5.1).
Between 2001 and 2016, adjusted mortality rates decreased for dialysis patients by 29%. The net reductions in mortality from 2001 to 2016 were 28% for HD patients and 43% for PD patients (Figure 5.1).
Between 2001 and 2016, unadjusted (crude) mortality rates decreased by 2% for transplant recipients. After accounting for changes in population characteristics (primarily increasing age), trends in post-transplant mortality were much more pronounced, with adjusted mortality rates decreasing by 40% (Figure 5.1).
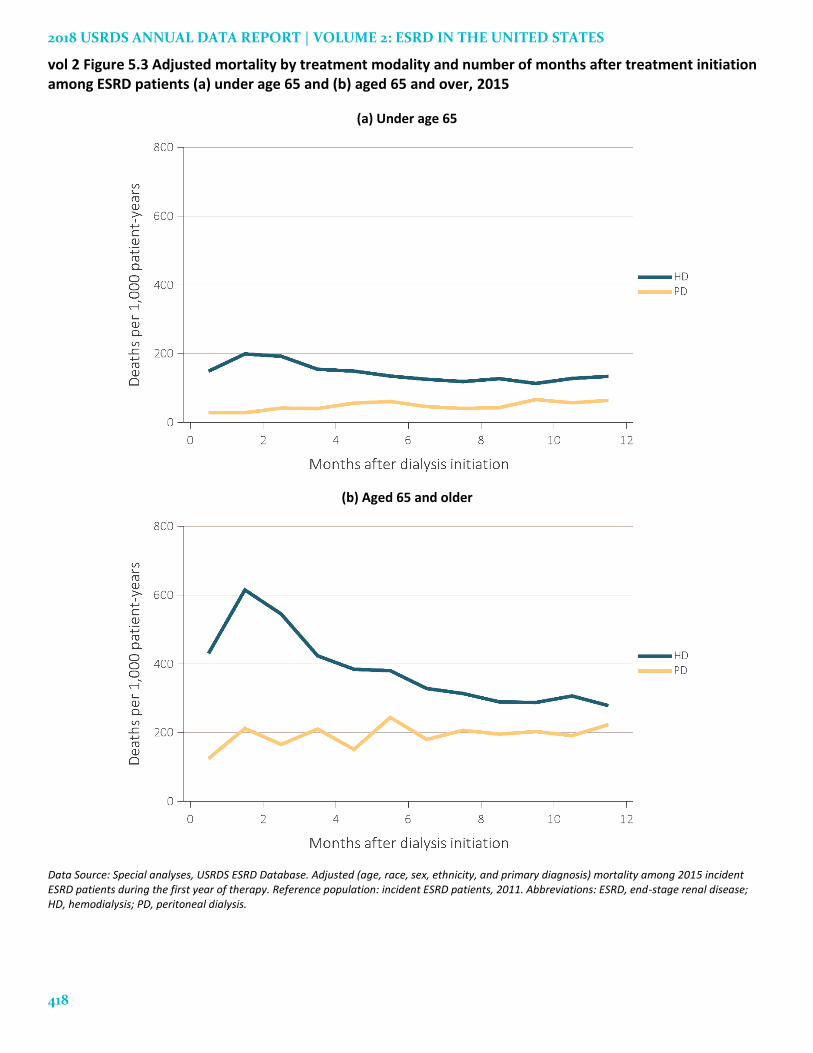
Patterns of mortality during the first year of dialysis differed substantially by modality. For HD patients, reported mortality was highest in month two, but declined thereafter; this effect was more pronounced for patients aged 65 and older. In contrast, mortality for PD patients was relatively low initially, but rose slightly over the course of the year (Figure 5.3).
Dialysis patients over the age of 65 continued to have substantially higher mortality compared to the general population and Medicare populations with cancer, diabetes, or cardiovascular disease. The relative decline in mortality for dialysis patients in the past 20 years has been similar to that of Medicare patients with cancer and diabetes, and greater than for Medicare patients with cerebrovascular disease or an acute myocardial infarction (Table 5.5, Figure 5.5).
The decline in mortality shown in this chapter has important implications for both patients and resource allocation. Increasing lifespan among ESRD patients is a primary reason for continued growth in the prevalent ESRD population.
Introduction
Kidney disease is among the 10 leading causes of
premature mortality in the United States—persons
with end-stage renal disease (ESRD) have a shortened
life expectancy as compared to their peers without
kidney disease. Examining trends related to death
from this chronic condition is essential to guide and
evaluate efforts in reducing the risk of death and
increasing the potential life span.
There are many points in the life cycle of kidney
disease in which to make an impact. These include
promoting healthy lifestyle habits, delaying disease
progression and the resulting need to initiate renal
replacement therapy for compromised individuals,
and more widely applying the best practices known to
prolong health and quality of life.
In this chapter, we examine and highlight the
variables that contribute to ESRD mortality. Common
chronic comorbidities, particularly cardiovascular
diseases, and acute conditions such as infections are
linked to higher rates of death. Treatment modality
also has an impact—transplant recipients have
improved life expectancy as compared to those on
dialysis. Increasing length of time on dialysis is also
related to higher mortality rates. Regional differences
in mortality rates vary substantially, and may indicate
avenues for targeted intervention. Thus, attending to
the trends and interrelationships between renal
disease and mortality is an important component of
reducing the public health burden of ESRD.
Methods
The findings presented in this chapter are based on
data from multiple data sources, including the Centers
for Medicare & Medicaid Services (CMS), the Organ
Procurement and Transplantation Network (OPTN),
2018 USRDS ANNUAL DATA REPORT | VOLUME 2: ESRD IN THE UNITED STATES
412
the Centers for Disease Control and Prevention
(CDC), the U.S. Census, and the National Vital
Statistics Report. Details of these are described in the
Data Sources section of the ESRD Analytical Methods
chapter.
Mortality analyses in this chapter were based on
both ESRD data and general population data. ESRD
data were from the USRDS ESRD Database. General
population data were based on the Medicare 5%
standard analytical files and U.S. Census mortality
data. Note that universal reporting of ESRD patient
deaths to the CMS is required via CMS form 2746 as a
condition of coverage for dialysis units and transplant
centers. In addition, mortality ascertainment was
augmented by Social Security Death Master File data
to the extent allowed by regulation (which differs by
state).
For an explanation of the analytical methods used
to generate the study cohorts, figures, and tables in
this chapter, see the section on Chapter 5 within the
ESRD Analytical Methods chapter. Note that the
reference population for each adjusted rate is
described within the footnote of each table or figure;
e.g., for Figure 5.1, the reference population consists of
period prevalent ESRD patients in 2011. Downloadable
Microsoft Excel and PowerPoint files containing the
data and graphics for these figures and tables are
available on the USRDS website.
Mortality among ESRD Patients: Overall and by Modality
Overall mortality rates among ESRD (dialysis and
transplant) patients have consistently declined over
the last 15 years, with rates levelling during recent
years. Between 2001 and 2016, the unadjusted death
rate (not shown) for the ESRD population decreased
by 27%, from 187 to 136 per 1,000 patient-years, while
the adjusted death rate (Figure 5.1.a) decreased by
29%. The unadjusted death rate for the dialysis
population decreased by 27%, while the adjusted
death rate decreased by 29%. The unadjusted death
rate for the transplant population decreased by 2%,
while the adjusted death rate decreased by 40%.
Differences between the unadjusted and adjusted
rates largely reflect changes in the age distribution of
the ESRD population. Death rates for dialysis and
transplant patients decreased by over 30% between
2001 and 2016 within most age groups, and the
adjusted rate reflects this decrease. The unadjusted
rate was affected by both this decrease and by the fact
that the ESRD population was older in 2016 than in
2001, which offsets the effect. For example, patients
over the age of 65 comprised 43% of the dialysis
population in 2001 and 44% in 2016; in the same years,
transplant recipients over the age of 65 comprised 8%
and 24% of the transplant recipient population. Thus,
the increase in age among transplant patients masked
overall improvements in mortality.
From 2001 to 2006, the adjusted mortality rate
decreased by 10%, and by 18% from 2007 to 2016 for
the ESRD population (Figure 5.1.a). The trend was
similar for dialysis (HD and PD) patients, with the
adjusted mortality rate decreasing by 8% from 2001 to
2006 and by 19% from 2007 to 2016 (Figure 5.1.a).
Among transplant patients, adjusted mortality
decreased by 18% from 2001 to 2006 and by 17% from
2007 to 2016.
Among HD patients, the adjusted mortality rate
decreased by 7% from 2001 to 2006 and by 19% from
2007 to 2016. Among PD patients, the mortality rate
decreased by 20% from 2001 to 2006 and by 22% from
2007 to 2016 (Figure 5.1.b). The net reductions in
mortality from 2001 to 2016 were 28% for HD patients
and 43% for PD patients.
Adjusted mortality rates in 2016 were 134, 164, and
29 per 1,000 patient-years for ESRD, dialysis, and
transplant patients. By dialysis modality, mortality
rates were 166 per 1,000 patient-years for HD patients
and 154 for PD patients.
CHAPTER 5: MORTALITY
413
vol 2 Figure 5.1 Adjusted all-cause mortality by treatment modality (a) overall, dialysis, and transplant, and (b) hemodialysis and peritoneal dialysis, for period-prevalent patients, 2001-2016
(a) Overall, dialysis, and transplant
(b) Hemodialysis and peritoneal dialysis
Data Source: Reference Tables H.2_adj, H.4_adj, H.8_adj, H.9_adj, and H.10_adj; and special analyses, USRDS ESRD Database. Adjusted for age, sex, race, ethnicity, primary diagnosis and vintage. Reference population: period prevalent ESRD patients, 2011. Abbreviations: ESRD, end-stage renal disease; HD, hemodialysis; PD, peritoneal dialysis.
2018 USRDS ANNUAL DATA REPORT | VOLUME 2: ESRD IN THE UNITED STATES
414
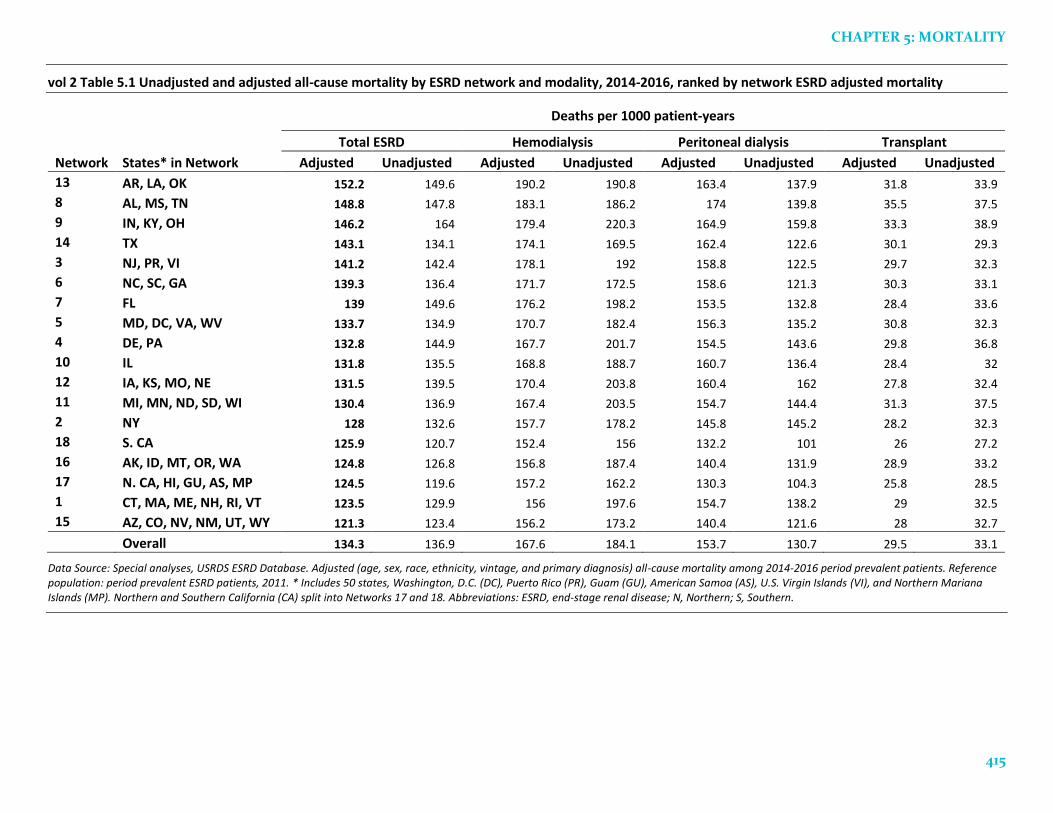
Mortality by ESRD Network
There are geographic differences in mortality rates
for each modality. Table 5.1 shows adjusted and
unadjusted death rates within each of the 18 regional
ESRD networks in the United States. The between-
network variability was lower after adjustment for age,
ethnicity, race, sex, diagnosis, and vintage, indicating
that regional differences in these factors explain some,
but not all of the between-region differences in
mortality rates.
Variation in ESRD mortality rates among the 18
ESRD Networks remained substantial (Table 5.1).
Adjusting for differences in age, sex, race, ethnicity,
diagnosis, and vintage, the rate was lowest at 121.3 per
1,000 patient-years at risk in Network 15 (AZ, CO, NV,
NM, UT, and WY), and highest at 152.2 in Network 13
(AR, LA, and OK), 25% higher than Network 15.
CHAPTER 5: MORTALITY
415
vol 2 Table 5.1 Unadjusted and adjusted all-cause mortality by ESRD network and modality, 2014-2016, ranked by network ESRD adjusted mortality
Deaths per 1000 patient-years
Total ESRD Hemodialysis Peritoneal dialysis Transplant
Network States* in Network Adjusted Unadjusted Adjusted Unadjusted Adjusted Unadjusted Adjusted Unadjusted
13 AR, LA, OK 152.2 149.6 190.2 190.8 163.4 137.9 31.8 33.9
8 AL, MS, TN 148.8 147.8 183.1 186.2 174 139.8 35.5 37.5
9 IN, KY, OH 146.2 164 179.4 220.3 164.9 159.8 33.3 38.9
14 TX 143.1 134.1 174.1 169.5 162.4 122.6 30.1 29.3
3 NJ, PR, VI 141.2 142.4 178.1 192 158.8 122.5 29.7 32.3
6 NC, SC, GA 139.3 136.4 171.7 172.5 158.6 121.3 30.3 33.1
7 FL 139 149.6 176.2 198.2 153.5 132.8 28.4 33.6
5 MD, DC, VA, WV 133.7 134.9 170.7 182.4 156.3 135.2 30.8 32.3
4 DE, PA 132.8 144.9 167.7 201.7 154.5 143.6 29.8 36.8
10 IL 131.8 135.5 168.8 188.7 160.7 136.4 28.4 32
12 IA, KS, MO, NE 131.5 139.5 170.4 203.8 160.4 162 27.8 32.4
11 MI, MN, ND, SD, WI 130.4 136.9 167.4 203.5 154.7 144.4 31.3 37.5
2 NY 128 132.6 157.7 178.2 145.8 145.2 28.2 32.3
18 S. CA 125.9 120.7 152.4 156 132.2 101 26 27.2
16 AK, ID, MT, OR, WA 124.8 126.8 156.8 187.4 140.4 131.9 28.9 33.2
17 N. CA, HI, GU, AS, MP 124.5 119.6 157.2 162.2 130.3 104.3 25.8 28.5
1 CT, MA, ME, NH, RI, VT 123.5 129.9 156 197.6 154.7 138.2 29 32.5
15 AZ, CO, NV, NM, UT, WY 121.3 123.4 156.2 173.2 140.4 121.6 28 32.7
Overall 134.3 136.9 167.6 184.1 153.7 130.7 29.5 33.1
Data Source: Special analyses, USRDS ESRD Database. Adjusted (age, sex, race, ethnicity, vintage, and primary diagnosis) all-cause mortality among 2014-2016 period prevalent patients. Reference population: period prevalent ESRD patients, 2011. * Includes 50 states, Washington, D.C. (DC), Puerto Rico (PR), Guam (GU), American Samoa (AS), U.S. Virgin Islands (VI), and Northern Mariana Islands (MP). Northern and Southern California (CA) split into Networks 17 and 18. Abbreviations: ESRD, end-stage renal disease; N, Northern; S, Southern.
2018 USRDS ANNUAL DATA REPORT | VOLUME 2: ESRD IN THE UNITED STATES
416
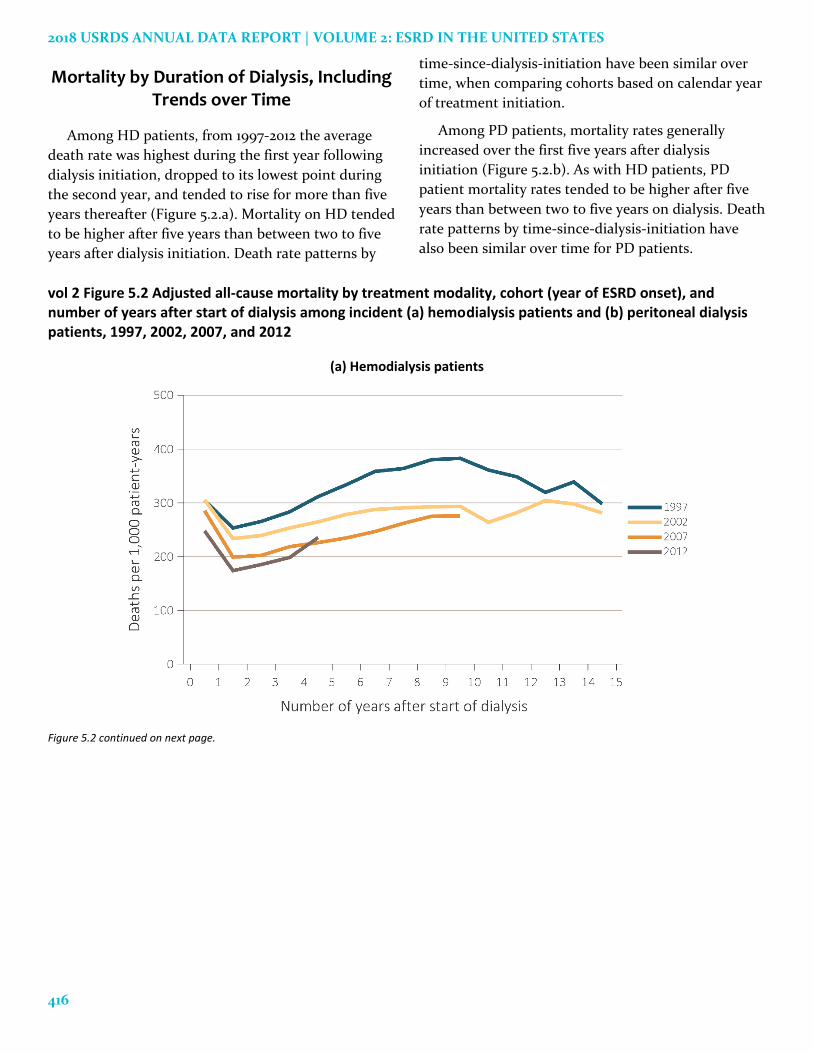
Mortality by Duration of Dialysis, Including Trends over Time
Among HD patients, from 1997-2012 the average
death rate was highest during the first year following
dialysis initiation, dropped to its lowest point during
the second year, and tended to rise for more than five
years thereafter (Figure 5.2.a). Mortality on HD tended
to be higher after five years than between two to five
years after dialysis initiation. Death rate patterns by
time-since-dialysis-initiation have been similar over
time, when comparing cohorts based on calendar year
of treatment initiation.
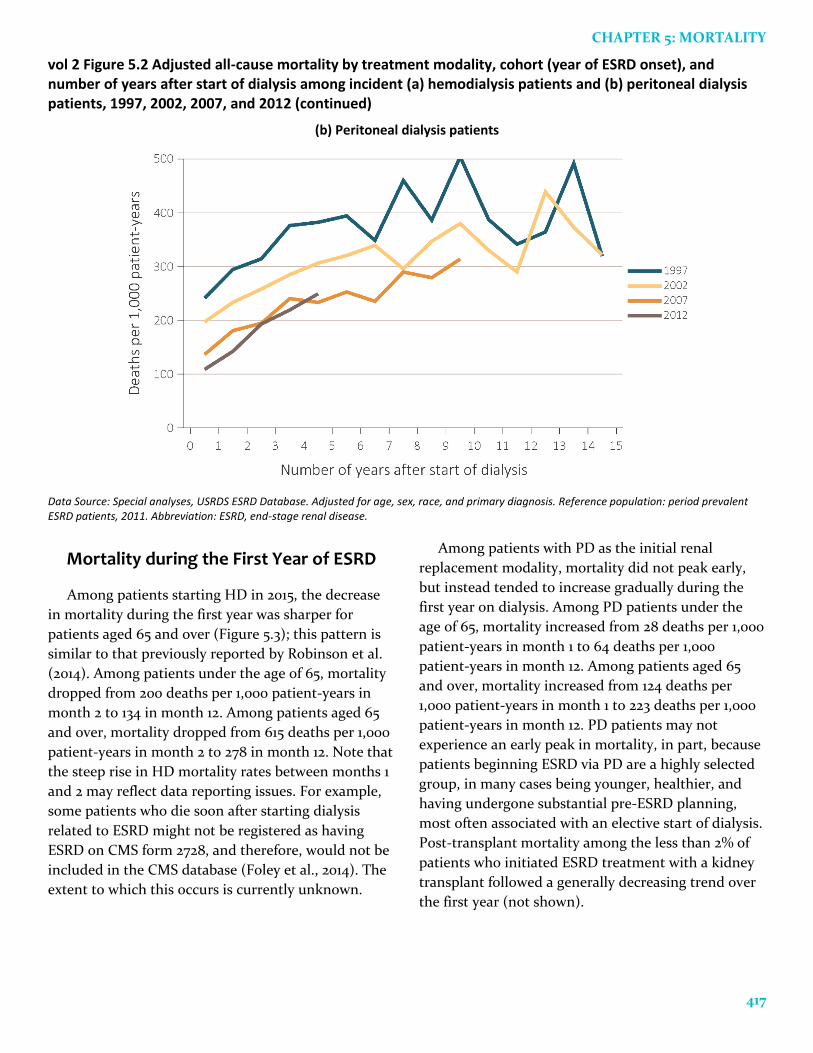
Among PD patients, mortality rates generally
increased over the first five years after dialysis
initiation (Figure 5.2.b). As with HD patients, PD
patient mortality rates tended to be higher after five
years than between two to five years on dialysis. Death
rate patterns by time-since-dialysis-initiation have
also been similar over time for PD patients.
vol 2 Figure 5.2 Adjusted all-cause mortality by treatment modality, cohort (year of ESRD onset), and number of years after start of dialysis among incident (a) hemodialysis patients and (b) peritoneal dialysis patients, 1997, 2002, 2007, and 2012
(a) Hemodialysis patients
Figure 5.2 continued on next page.
CHAPTER 5: MORTALITY
417
vol 2 Figure 5.2 Adjusted all-cause mortality by treatment modality, cohort (year of ESRD onset), and number of years after start of dialysis among incident (a) hemodialysis patients and (b) peritoneal dialysis patients, 1997, 2002, 2007, and 2012 (continued)
(b) Peritoneal dialysis patients
Data Source: Special analyses, USRDS ESRD Database. Adjusted for age, sex, race, and primary diagnosis. Reference population: period prevalent ESRD patients, 2011. Abbreviation: ESRD, end-stage renal disease.
Mortality during the First Year of ESRD
Among patients starting HD in 2015, the decrease
in mortality during the first year was sharper for
patients aged 65 and over (Figure 5.3); this pattern is
similar to that previously reported by Robinson et al.
(2014). Among patients under the age of 65, mortality
dropped from 200 deaths per 1,000 patient-years in
month 2 to 134 in month 12. Among patients aged 65
and over, mortality dropped from 615 deaths per 1,000
patient-years in month 2 to 278 in month 12. Note that
the steep rise in HD mortality rates between months 1
and 2 may reflect data reporting issues. For example,
some patients who die soon after starting dialysis
related to ESRD might not be registered as having
ESRD on CMS form 2728, and therefore, would not be
included in the CMS database (Foley et al., 2014). The
extent to which this occurs is currently unknown.
Among patients with PD as the initial renal
replacement modality, mortality did not peak early,
but instead tended to increase gradually during the
first year on dialysis. Among PD patients under the
age of 65, mortality increased from 28 deaths per 1,000
patient-years in month 1 to 64 deaths per 1,000
patient-years in month 12. Among patients aged 65
and over, mortality increased from 124 deaths per
1,000 patient-years in month 1 to 223 deaths per 1,000
patient-years in month 12. PD patients may not
experience an early peak in mortality, in part, because
patients beginning ESRD via PD are a highly selected
group, in many cases being younger, healthier, and
having undergone substantial pre-ESRD planning,
most often associated with an elective start of dialysis.
Post-transplant mortality among the less than 2% of
patients who initiated ESRD treatment with a kidney
transplant followed a generally decreasing trend over
the first year (not shown).
2018 USRDS ANNUAL DATA REPORT | VOLUME 2: ESRD IN THE UNITED STATES
418
vol 2 Figure 5.3 Adjusted mortality by treatment modality and number of months after treatment initiation among ESRD patients (a) under age 65 and (b) aged 65 and over, 2015
(a) Under age 65
(b) Aged 65 and older
Data Source: Special analyses, USRDS ESRD Database. Adjusted (age, race, sex, ethnicity, and primary diagnosis) mortality among 2015 incident ESRD patients during the first year of therapy. Reference population: incident ESRD patients, 2011. Abbreviations: ESRD, end-stage renal disease; HD, hemodialysis; PD, peritoneal dialysis.
CHAPTER 5: MORTALITY
419
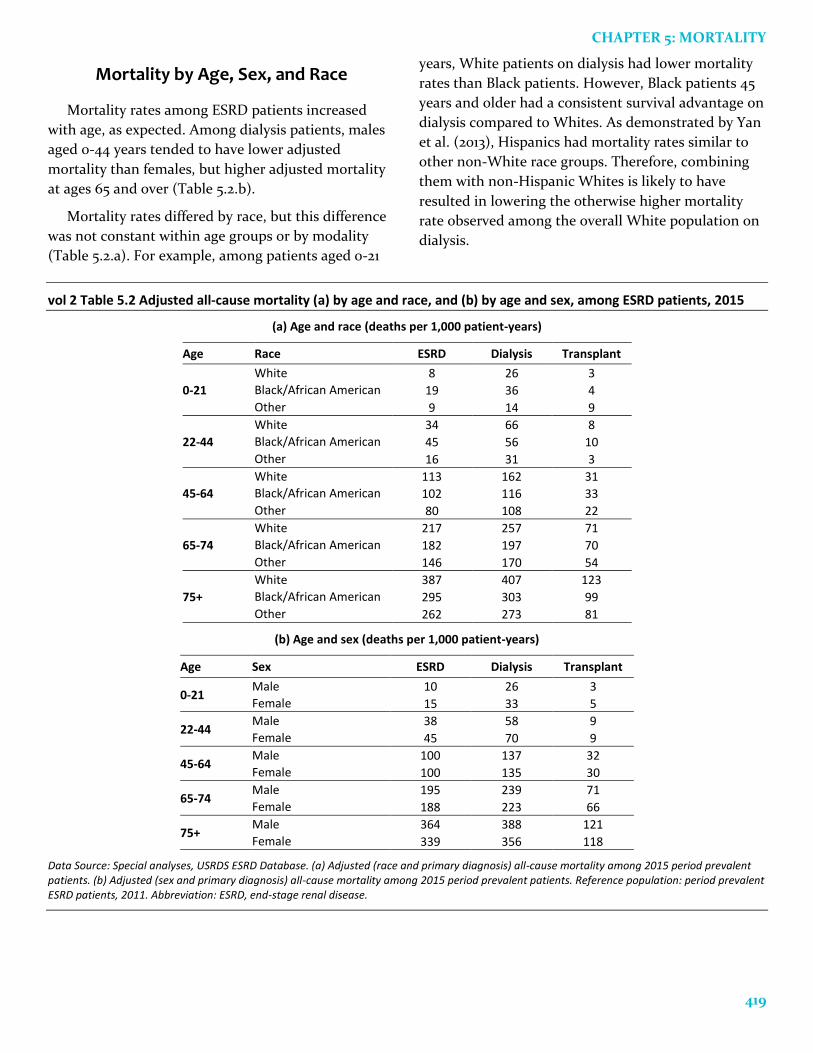
Mortality by Age, Sex, and Race
Mortality rates among ESRD patients increased
with age, as expected. Among dialysis patients, males
aged 0-44 years tended to have lower adjusted
mortality than females, but higher adjusted mortality
at ages 65 and over (Table 5.2.b).
Mortality rates differed by race, but this difference
was not constant within age groups or by modality
(Table 5.2.a). For example, among patients aged 0-21
years, White patients on dialysis had lower mortality
rates than Black patients. However, Black patients 45
years and older had a consistent survival advantage on
dialysis compared to Whites. As demonstrated by Yan
et al. (2013), Hispanics had mortality rates similar to
other non-White race groups. Therefore, combining
them with non-Hispanic Whites is likely to have
resulted in lowering the otherwise higher mortality
rate observed among the overall White population on
dialysis.
vol 2 Table 5.2 Adjusted all-cause mortality (a) by age and race, and (b) by age and sex, among ESRD patients, 2015
(a) Age and race (deaths per 1,000 patient-years)
Age Race ESRD Dialysis Transplant
0-21
White 8 26 3
Black/African American 19 36 4
Other 9 14 9
22-44
White 34 66 8
Black/African American 45 56 10
Other 16 31 3
45-64
White 113 162 31
Black/African American 102 116 33
Other 80 108 22
65-74
White 217 257 71
Black/African American 182 197 70
Other 146 170 54
75+
White 387 407 123
Black/African American 295 303 99
Other 262 273 81
(b) Age and sex (deaths per 1,000 patient-years)
Age Sex ESRD Dialysis Transplant
0-21 Male 10 26 3
Female 15 33 5
22-44 Male 38 58 9
Female 45 70 9
45-64 Male 100 137 32
Female 100 135 30
65-74 Male 195 239 71
Female 188 223 66
75+ Male 364 388 121
Female 339 356 118
Data Source: Special analyses, USRDS ESRD Database. (a) Adjusted (race and primary diagnosis) all-cause mortality among 2015 period prevalent patients. (b) Adjusted (sex and primary diagnosis) all-cause mortality among 2015 period prevalent patients. Reference population: period prevalent ESRD patients, 2011. Abbreviation: ESRD, end-stage renal disease.
2018 USRDS ANNUAL DATA REPORT | VOLUME 2: ESRD IN THE UNITED STATES
420
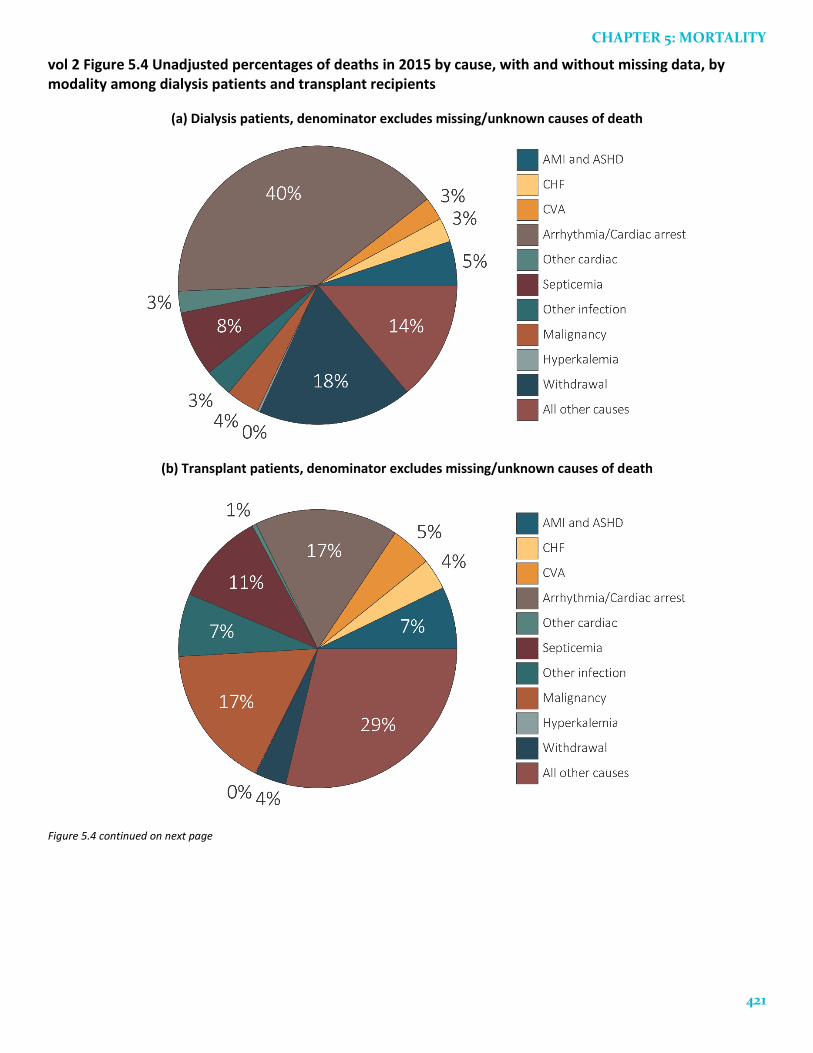
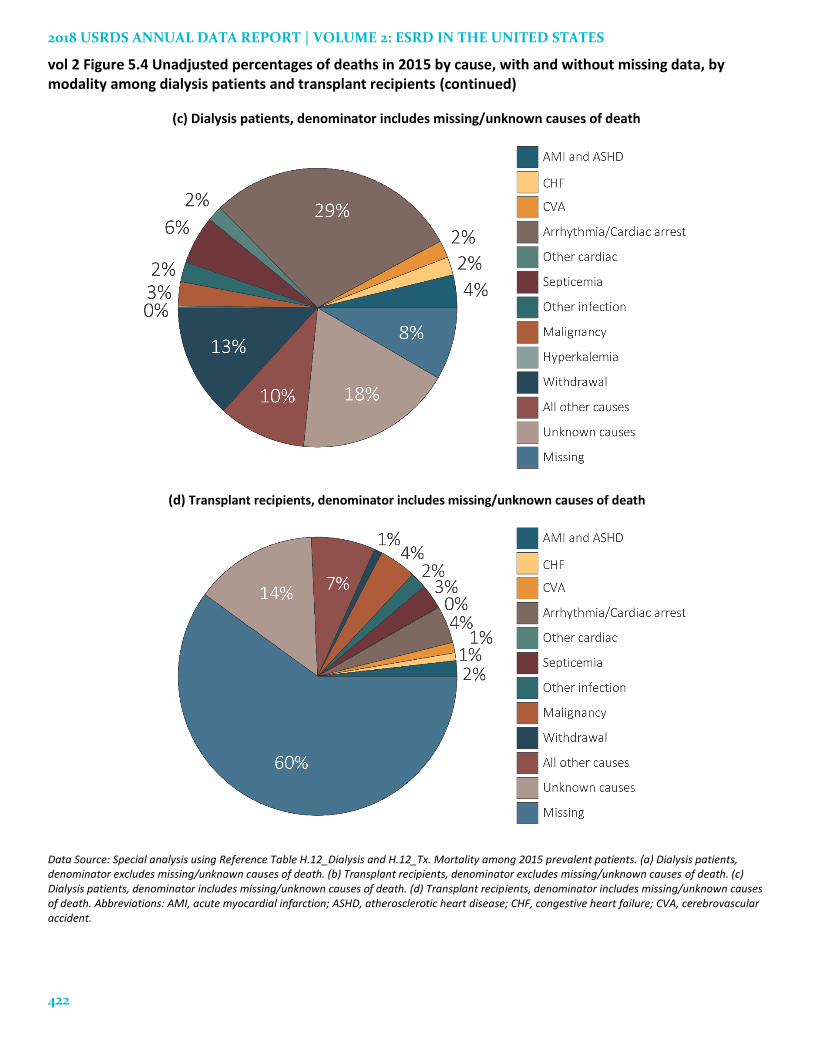
Cause-Specific Mortality Rates
The largest category of known cause-specific
mortality for dialysis patients is death due to
cardiovascular disease. Arrhythmia and cardiac arrest
comprised 40% of known causes of death among
dialysis patients, and 17% of the known causes of
death among transplant recipients. The cause of death
information (based on CMS form 2746) was missing or
unknown for 27% of dialysis patients and 74% of
transplant patients. Note that lacking cause of death
information does not imply that the date of death is
missing. The date of death comes from several
potential sources, including OPTN transplant data
(see “Death date determination” in the ESRD
Analytical Methods chapter). For example, in 2015 the
form 2746 was the source of date of death for 86% of
dialysis patients, but only 34% of transplant patients.
Most of the other death dates came from the CMS
enrollment database, which does not include cause of
death information. Figures 5.4.a and 5.4.b show the
distributions of deaths in 2015, excluding missing and
unknown causes as categories, while Figures 5.4.c and
5.4.d show the distributions including deaths where
the causes were missing or unknown. Cardiovascular
causes—including arrhythmias, cardiac arrest,
congestive heart failure (CHF), acute myocardial
infarction (AMI), and atherosclerotic heart disease
(ASHD)—were responsible for 48% of deaths among
dialysis patients and 28% of deaths among transplant
recipients. Given these rates, it is plausible that
cardiovascular conditions (e.g., sudden cardiac death
due to cardiac arrhythmia) may indeed have been the
true underlying cause of death among many patients
in the missing and unknown categories.
We recognize that while medical terminology calls
for use of the term heart failure, since not all heart
failure is congestive, this chapter uses the term
congestive heart failure based on the data source —
CMS 2746, ESRD Death Notification form.
CHAPTER 5: MORTALITY
421
vol 2 Figure 5.4 Unadjusted percentages of deaths in 2015 by cause, with and without missing data, by modality among dialysis patients and transplant recipients
(a) Dialysis patients, denominator excludes missing/unknown causes of death
(b) Transplant patients, denominator excludes missing/unknown causes of death
Figure 5.4 continued on next page
2018 USRDS ANNUAL DATA REPORT | VOLUME 2: ESRD IN THE UNITED STATES
422
vol 2 Figure 5.4 Unadjusted percentages of deaths in 2015 by cause, with and without missing data, by modality among dialysis patients and transplant recipients (continued)
(c) Dialysis patients, denominator includes missing/unknown causes of death
(d) Transplant recipients, denominator includes missing/unknown causes of death
Data Source: Special analysis using Reference Table H.12_Dialysis and H.12_Tx. Mortality among 2015 prevalent patients. (a) Dialysis patients, denominator excludes missing/unknown causes of death. (b) Transplant recipients, denominator excludes missing/unknown causes of death. (c) Dialysis patients, denominator includes missing/unknown causes of death. (d) Transplant recipients, denominator includes missing/unknown causes of death. Abbreviations: AMI, acute myocardial infarction; ASHD, atherosclerotic heart disease; CHF, congestive heart failure; CVA, cerebrovascular accident.
CHAPTER 5: MORTALITY
423
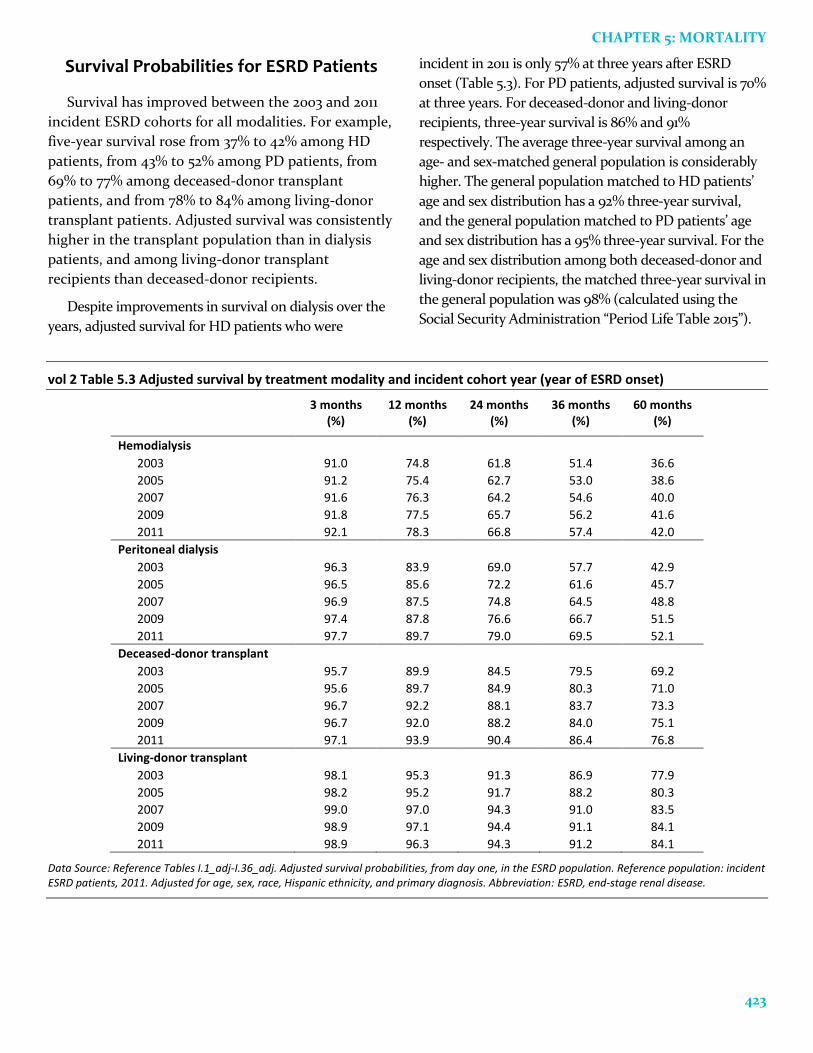
Survival Probabilities for ESRD Patients
Survival has improved between the 2003 and 2011
incident ESRD cohorts for all modalities. For example,
five-year survival rose from 37% to 42% among HD
patients, from 43% to 52% among PD patients, from
69% to 77% among deceased-donor transplant
patients, and from 78% to 84% among living-donor
transplant patients. Adjusted survival was consistently
higher in the transplant population than in dialysis
patients, and among living-donor transplant
recipients than deceased-donor recipients.
Despite improvements in survival on dialysis over the
years, adjusted survival for HD patients who were
incident in 2011 is only 57% at three years after ESRD
onset (Table 5.3). For PD patients, adjusted survival is 70%
at three years. For deceased-donor and living-donor
recipients, three-year survival is 86% and 91%
respectively. The average three-year survival among an
age- and sex-matched general population is considerably
higher. The general population matched to HD patients’
age and sex distribution has a 92% three-year survival,
and the general population matched to PD patients’ age
and sex distribution has a 95% three-year survival. For the
age and sex distribution among both deceased-donor and
living-donor recipients, the matched three-year survival in
the general population was 98% (calculated using the
Social Security Administration “Period Life Table 2015”).
vol 2 Table 5.3 Adjusted survival by treatment modality and incident cohort year (year of ESRD onset)
3 months (%)
12 months (%)
24 months (%)
36 months (%)
60 months (%)
Hemodialysis
2003 91.0 74.8 61.8 51.4 36.6
2005 91.2 75.4 62.7 53.0 38.6
2007 91.6 76.3 64.2 54.6 40.0
2009 91.8 77.5 65.7 56.2 41.6
2011 92.1 78.3 66.8 57.4 42.0
Peritoneal dialysis
2003 96.3 83.9 69.0 57.7 42.9
2005 96.5 85.6 72.2 61.6 45.7
2007 96.9 87.5 74.8 64.5 48.8
2009 97.4 87.8 76.6 66.7 51.5
2011 97.7 89.7 79.0 69.5 52.1
Deceased-donor transplant
2003 95.7 89.9 84.5 79.5 69.2
2005 95.6 89.7 84.9 80.3 71.0
2007 96.7 92.2 88.1 83.7 73.3
2009 96.7 92.0 88.2 84.0 75.1
2011 97.1 93.9 90.4 86.4 76.8
Living-donor transplant
2003 98.1 95.3 91.3 86.9 77.9
2005 98.2 95.2 91.7 88.2 80.3
2007 99.0 97.0 94.3 91.0 83.5
2009 98.9 97.1 94.4 91.1 84.1
2011 98.9 96.3 94.3 91.2 84.1
Data Source: Reference Tables I.1_adj-I.36_adj. Adjusted survival probabilities, from day one, in the ESRD population. Reference population: incident ESRD patients, 2011. Adjusted for age, sex, race, Hispanic ethnicity, and primary diagnosis. Abbreviation: ESRD, end-stage renal disease.
2018 USRDS ANNUAL DATA REPORT | VOLUME 2: ESRD IN THE UNITED STATES
424
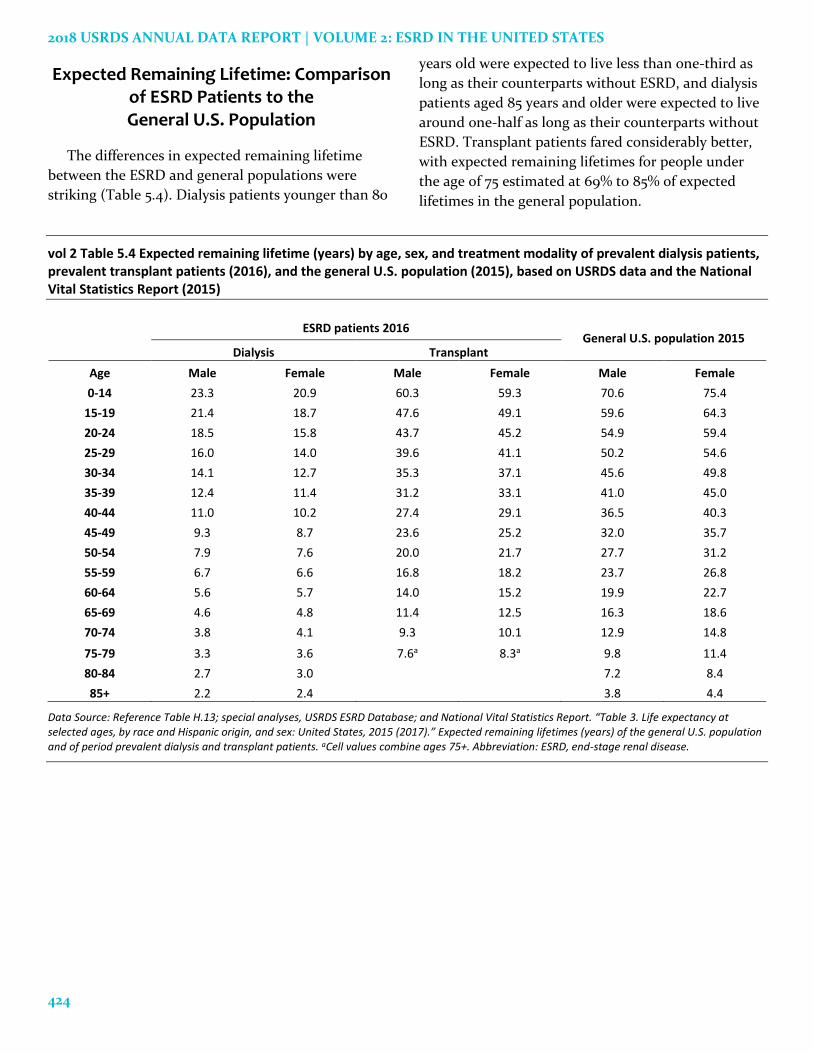
Expected Remaining Lifetime: Comparison of ESRD Patients to the General U.S. Population
The differences in expected remaining lifetime
between the ESRD and general populations were
striking (Table 5.4). Dialysis patients younger than 80
years old were expected to live less than one-third as
long as their counterparts without ESRD, and dialysis
patients aged 85 years and older were expected to live
around one-half as long as their counterparts without
ESRD. Transplant patients fared considerably better,
with expected remaining lifetimes for people under
the age of 75 estimated at 69% to 85% of expected
lifetimes in the general population.
vol 2 Table 5.4 Expected remaining lifetime (years) by age, sex, and treatment modality of prevalent dialysis patients, prevalent transplant patients (2016), and the general U.S. population (2015), based on USRDS data and the National Vital Statistics Report (2015)
ESRD patients 2016 General U.S. population 2015
Dialysis Transplant
Age Male Female Male Female Male Female
0-14 23.3 20.9 60.3 59.3 70.6 75.4
15-19 21.4 18.7 47.6 49.1 59.6 64.3
20-24 18.5 15.8 43.7 45.2 54.9 59.4
25-29 16.0 14.0 39.6 41.1 50.2 54.6
30-34 14.1 12.7 35.3 37.1 45.6 49.8
35-39 12.4 11.4 31.2 33.1 41.0 45.0
40-44 11.0 10.2 27.4 29.1 36.5 40.3
45-49 9.3 8.7 23.6 25.2 32.0 35.7
50-54 7.9 7.6 20.0 21.7 27.7 31.2
55-59 6.7 6.6 16.8 18.2 23.7 26.8
60-64 5.6 5.7 14.0 15.2 19.9 22.7
65-69 4.6 4.8 11.4 12.5 16.3 18.6
70-74 3.8 4.1 9.3 10.1 12.9 14.8
75-79 3.3 3.6 7.6a 8.3a 9.8 11.4
80-84 2.7 3.0 7.2 8.4
85+ 2.2 2.4 3.8 4.4
Data Source: Reference Table H.13; special analyses, USRDS ESRD Database; and National Vital Statistics Report. “Table 3. Life expectancy at selected ages, by race and Hispanic origin, and sex: United States, 2015 (2017).” Expected remaining lifetimes (years) of the general U.S. population and of period prevalent dialysis and transplant patients. aCell values combine ages 75+. Abbreviation: ESRD, end-stage renal disease.
CHAPTER 5: MORTALITY
425
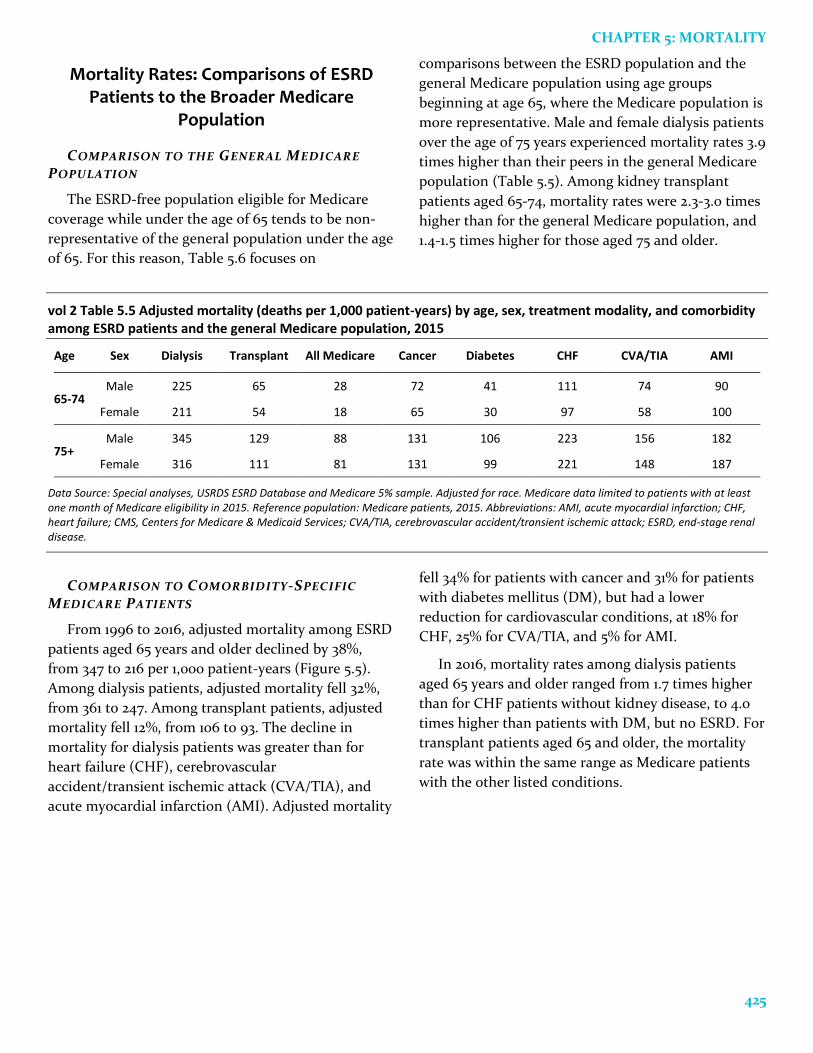
Mortality Rates: Comparisons of ESRD Patients to the Broader Medicare
Population
COMPARISON TO THE GENERAL MEDICARE
POPULATION
The ESRD-free population eligible for Medicare
coverage while under the age of 65 tends to be non-
representative of the general population under the age
of 65. For this reason, Table 5.6 focuses on
comparisons between the ESRD population and the
general Medicare population using age groups
beginning at age 65, where the Medicare population is
more representative. Male and female dialysis patients
over the age of 75 years experienced mortality rates 3.9
times higher than their peers in the general Medicare
population (Table 5.5). Among kidney transplant
patients aged 65-74, mortality rates were 2.3-3.0 times
higher than for the general Medicare population, and
1.4-1.5 times higher for those aged 75 and older.
vol 2 Table 5.5 Adjusted mortality (deaths per 1,000 patient-years) by age, sex, treatment modality, and comorbidity among ESRD patients and the general Medicare population, 2015
Age Sex Dialysis Transplant All Medicare Cancer Diabetes CHF CVA/TIA AMI
65-74 Male 225 65 28 72 41 111 74 90
Female 211 54 18 65 30 97 58 100
75+ Male 345 129 88 131 106 223 156 182
Female 316 111 81 131 99 221 148 187
Data Source: Special analyses, USRDS ESRD Database and Medicare 5% sample. Adjusted for race. Medicare data limited to patients with at least one month of Medicare eligibility in 2015. Reference population: Medicare patients, 2015. Abbreviations: AMI, acute myocardial infarction; CHF, heart failure; CMS, Centers for Medicare & Medicaid Services; CVA/TIA, cerebrovascular accident/transient ischemic attack; ESRD, end-stage renal disease.
COMPARISON TO COMORBIDITY-SPECIFIC
MEDICARE PATIENTS
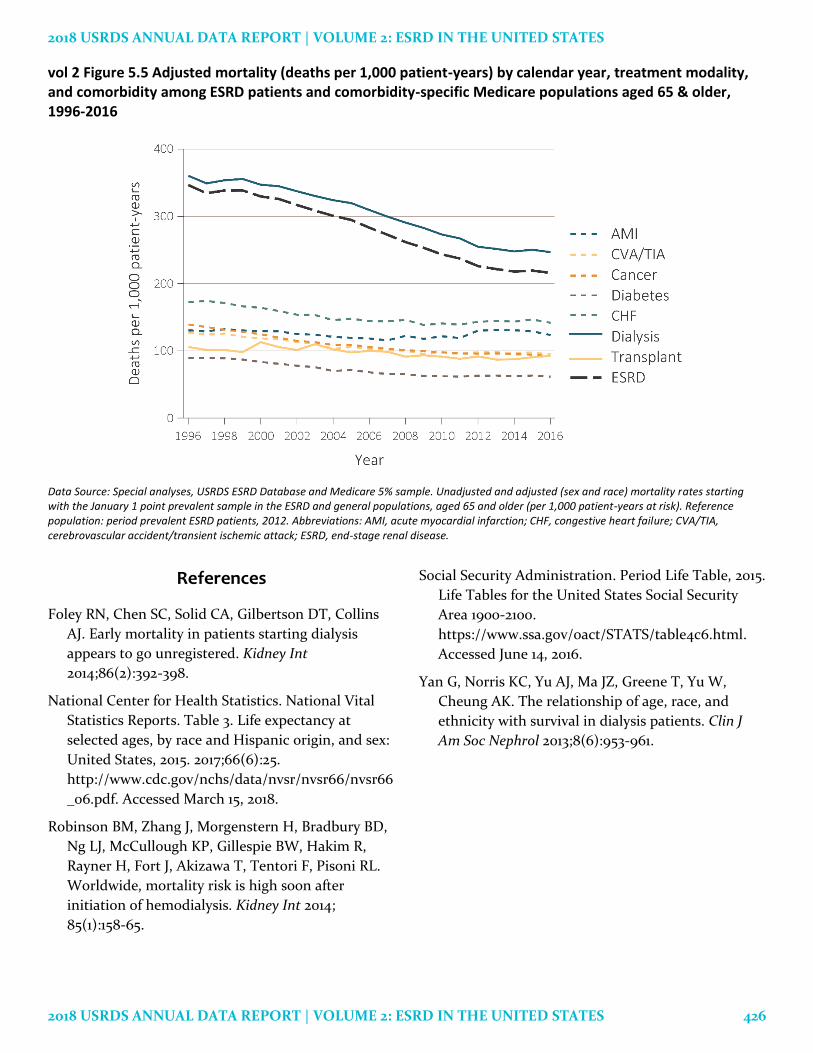
From 1996 to 2016, adjusted mortality among ESRD
patients aged 65 years and older declined by 38%,
from 347 to 216 per 1,000 patient-years (Figure 5.5).
Among dialysis patients, adjusted mortality fell 32%,
from 361 to 247. Among transplant patients, adjusted
mortality fell 12%, from 106 to 93. The decline in
mortality for dialysis patients was greater than for
heart failure (CHF), cerebrovascular
accident/transient ischemic attack (CVA/TIA), and
acute myocardial infarction (AMI). Adjusted mortality
fell 34% for patients with cancer and 31% for patients
with diabetes mellitus (DM), but had a lower
reduction for cardiovascular conditions, at 18% for
CHF, 25% for CVA/TIA, and 5% for AMI.
In 2016, mortality rates among dialysis patients
aged 65 years and older ranged from 1.7 times higher
than for CHF patients without kidney disease, to 4.0
times higher than patients with DM, but no ESRD. For
transplant patients aged 65 and older, the mortality
rate was within the same range as Medicare patients
with the other listed conditions.
2018 USRDS ANNUAL DATA REPORT | VOLUME 2: ESRD IN THE UNITED STATES
2018 USRDS ANNUAL DATA REPORT | VOLUME 2: ESRD IN THE UNITED STATES 426
vol 2 Figure 5.5 Adjusted mortality (deaths per 1,000 patient-years) by calendar year, treatment modality, and comorbidity among ESRD patients and comorbidity-specific Medicare populations aged 65 & older, 1996-2016
Data Source: Special analyses, USRDS ESRD Database and Medicare 5% sample. Unadjusted and adjusted (sex and race) mortality rates starting with the January 1 point prevalent sample in the ESRD and general populations, aged 65 and older (per 1,000 patient-years at risk). Reference population: period prevalent ESRD patients, 2012. Abbreviations: AMI, acute myocardial infarction; CHF, congestive heart failure; CVA/TIA, cerebrovascular accident/transient ischemic attack; ESRD, end-stage renal disease.
References
Foley RN, Chen SC, Solid CA, Gilbertson DT, Collins
AJ. Early mortality in patients starting dialysis
appears to go unregistered. Kidney Int
2014;86(2):392-398.
National Center for Health Statistics. National Vital
Statistics Reports. Table 3. Life expectancy at
selected ages, by race and Hispanic origin, and sex:
United States, 2015. 2017;66(6):25.
http://www.cdc.gov/nchs/data/nvsr/nvsr66/nvsr66
_06.pdf. Accessed March 15, 2018.
Robinson BM, Zhang J, Morgenstern H, Bradbury BD,
Ng LJ, McCullough KP, Gillespie BW, Hakim R,
Rayner H, Fort J, Akizawa T, Tentori F, Pisoni RL.
Worldwide, mortality risk is high soon after
initiation of hemodialysis. Kidney Int 2014;
85(1):158-65.
Social Security Administration. Period Life Table, 2015.
Life Tables for the United States Social Security
Area 1900-2100.
https://www.ssa.gov/oact/STATS/table4c6.html.
Accessed June 14, 2016.
Yan G, Norris KC, Yu AJ, Ma JZ, Greene T, Yu W,
Cheung AK. The relationship of age, race, and
ethnicity with survival in dialysis patients. Clin J
Am Soc Nephrol 2013;8(6):953-961.