Embed Size (px)
Citation preview
OECD ECONOMIC OUTLOOK PRELIMINARY EDITION
263
CHAPTER 5
RETURN TO WORK AFTER THE CRISIS
Introduction and Main Findings
OECD economies have
suffered a massive
negative shock
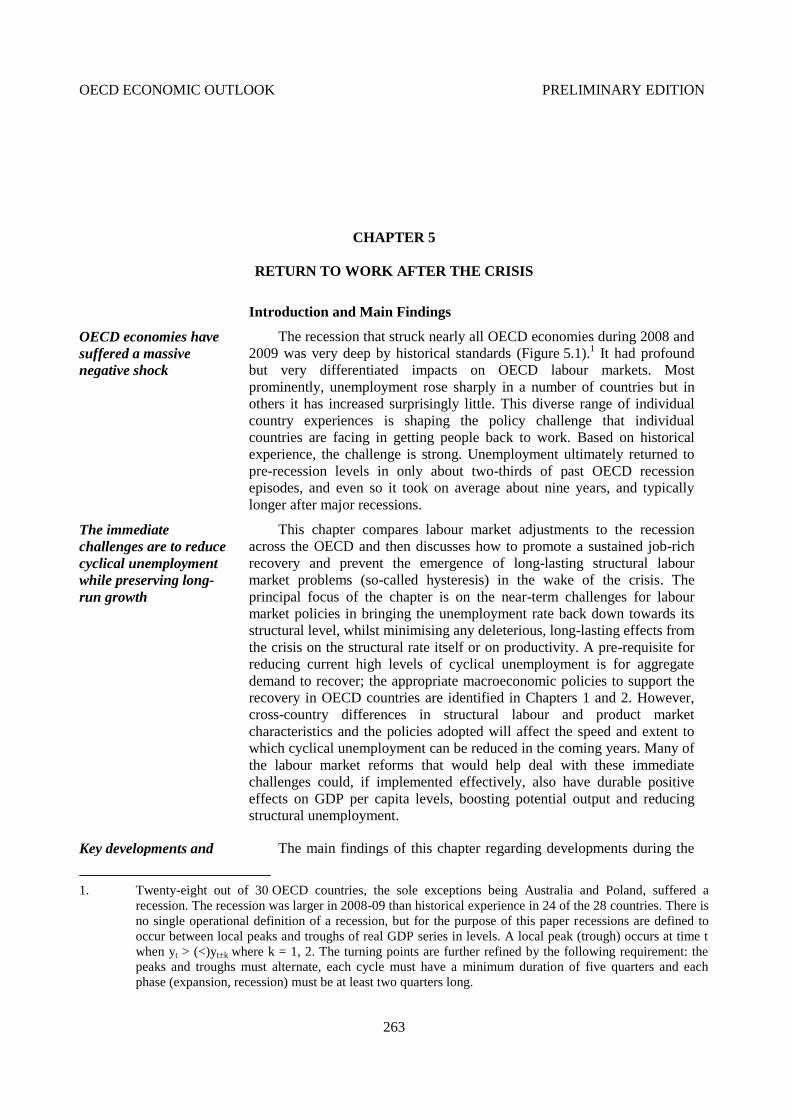
The recession that struck nearly all OECD economies during 2008 and
2009 was very deep by historical standards (Figure 5.1).1 It had profound
but very differentiated impacts on OECD labour markets. Most
prominently, unemployment rose sharply in a number of countries but in
others it has increased surprisingly little. This diverse range of individual
country experiences is shaping the policy challenge that individual
countries are facing in getting people back to work. Based on historical
experience, the challenge is strong. Unemployment ultimately returned to
pre-recession levels in only about two-thirds of past OECD recession
episodes, and even so it took on average about nine years, and typically
longer after major recessions.
The immediate
challenges are to reduce
cyclical unemployment
while preserving long-
run growth
This chapter compares labour market adjustments to the recession
across the OECD and then discusses how to promote a sustained job-rich
recovery and prevent the emergence of long-lasting structural labour
market problems (so-called hysteresis) in the wake of the crisis. The
principal focus of the chapter is on the near-term challenges for labour
market policies in bringing the unemployment rate back down towards its
structural level, whilst minimising any deleterious, long-lasting effects from
the crisis on the structural rate itself or on productivity. A pre-requisite for
reducing current high levels of cyclical unemployment is for aggregate
demand to recover; the appropriate macroeconomic policies to support the
recovery in OECD countries are identified in Chapters 1 and 2. However,
cross-country differences in structural labour and product market
characteristics and the policies adopted will affect the speed and extent to
which cyclical unemployment can be reduced in the coming years. Many of
the labour market reforms that would help deal with these immediate
challenges could, if implemented effectively, also have durable positive
effects on GDP per capita levels, boosting potential output and reducing
structural unemployment.
Key developments and The main findings of this chapter regarding developments during the
1. Twenty-eight out of 30 OECD countries, the sole exceptions being Australia and Poland, suffered a
recession. The recession was larger in 2008-09 than historical experience in 24 of the 28 countries. There is
no single operational definition of a recession, but for the purpose of this paper recessions are defined to
occur between local peaks and troughs of real GDP series in levels. A local peak (trough) occurs at time t
when yt > (<)yt±k where k = 1, 2. The turning points are further refined by the following requirement: the
peaks and troughs must alternate, each cycle must have a minimum duration of five quarters and each
phase (expansion, recession) must be at least two quarters long.
OECD ECONOMIC OUTLOOK PRELIMINARY EDITION
264
risks include… recession and key risks and uncertainties in the early stages of the recovery
are as follows:
… labour input
adjustment has differed
across countries in size…
Labour markets have adjusted to the recession in very different
ways across the OECD, and this heterogeneity has been greater
than in past recessions. Given the magnitude of output losses,
most European countries and Japan have seen relatively small
declines in labour input (total hours worked) and large drops in
productivity, while in North America as well as Spain labour
input fell sharply and productivity increased.
Figure 5.1. The 2008-09 recession in historical comparison
Percentage change in real GDP from peak to trough
Note: The number of recessions used to calculate the historical average varies across countries depending on data availability and the frequency of recessions. Recessions that occurred in the period from approximately 1960 until 2009 are included. Australia and Poland did not have a recession in the 2008-09 period but are shown for comparison purposes over the period 2008q3 to 2009q2. Ireland and Poland have no historical episodes available for comparison and Hungary and the Slovak Republic have only one episode available. Turning points are calculated using actual GDP data only. For Greece the period between 2008Q3 and 2009Q4 is shown because there is no trough in the most recent recession in the available data.
Source: OECD Economic Outlook 87 database; and various national sources for data on hours worked.
… as well as in
composition…. OECD countries also differed in how they adjusted labour input.
Most continental European countries and Japan experienced
stronger reductions in working time, and thus suffered a much
lower drop in employment, than for example the United States
and Spain. Labour force participation declined in about half of
OECD countries but it increased in the other half, arithmetically
either damping or amplifying the unemployment effects of
employment declines.
… with the response of
average hours differing
widely
Cross-country differences in the response of average hours
worked reflect a number of features, including collective
bargaining and policy settings. Stricter employment protection
(EP), more flexible hours averaging rules, and in some cases
collective bargaining agreements tend to encourage
working-hours adjustment. But many countries, especially in
Europe, have also encouraged employment retention by

OECD ECONOMIC OUTLOOK PRELIMINARY EDITION
265
introducing or scaling-up often generous short-time working
schemes (STWs). New OECD analysis suggests that, where they
have been most used, STWs may have dampened declines in
employment of permanent workers by between 0.1% and 1.3%.
Employment preservation
in the recession could
raise the risk of a jobless
recovery…
Past experience suggests that the extent of employment
preservation through labour hoarding during a recession provides
only a rough indication of how job-rich or poor the recovery will
be. However, in cases of extreme labour hoarding (as measured
by a sharp fall in labour productivity) during a recession, the risk
of a jobless recovery is likely to be higher, hinting at a larger risk
at the current juncture in a number of European countries and
Japan than in North America. Indeed if working hours and
productivity per hour worked were to rise back to their normal
trend levels, GDP could rise from its trough by over 8% without
any increase in employment in Germany and Japan and by several
per cent in most other European countries, as opposed to about
1½ per cent in the United States.
… though past structural
reforms have reduced the
risk of persistently higher
unemployment
Past structural reforms and the small magnitude of job losses
since the onset of this recession in a number of OECD countries
have reduced the risk that employment declines persist as seen in
the crises of the 1970s and 1980s. Nonetheless, under current
institutional settings and based on empirical evidence from past
recessions, the current crisis could raise structural unemployment
in the medium term by about ½ percentage point on average.
However, there is wide cross-country variation around these
estimates, as well as sizeable uncertainties, reflecting in part the
peculiar features of this crisis.
Policy settings going
forward will have to
reflect…
Going forward, the lessons from past experience can help guide the
mix of labour market and other structural policy settings needed to reduce
cyclical unemployment whilst preserving long-term growth. The following
are some of the key policies that would improve the functioning of the
labour market coming out of the crisis:
… a starting point of
higher spending As part of the fiscal stimulus packages, most OECD countries
have devoted greater resources to labour market and social policy
measures to cushion the negative effects of the crisis on workers
and low-income households. While unemployment benefits have
automatically stepped in to sustain the income of many job losers,
several countries have extended their coverage and, in some
cases, maximum duration to provide a better safety net. At the
same time, many countries have introduced or scaled up measures
to support labour demand and provided additional funding to
active labour market policies (ALMPs).
Pressure to extend STWs
should be resisted Under tight fiscal conditions, most OECD countries intend to
maintain over the near term the resources they have devoted to
labour market policy measures since the start of the crisis. Even
so, the focus of policy interventions is often shifting to respond to
the evolving conditions in the labour market. In this context,

OECD ECONOMIC OUTLOOK PRELIMINARY EDITION
266
STWs are scheduled to be phased out in most countries by the end
of 2010. It will be important to resist political-economy pressures
to extend such plans to minimise the risk of persistent declines in
hours worked and to ensure that STWs do not hinder
productivity-enhancing labour reallocation across the economy
during the recovery.
Tight budgets favour a
move towards temporary
net hiring subsidies
Many countries have also supported labour demand through
different types of labour tax cuts, in particular reductions in social
security contributions – sometimes targeted to disadvantaged
groups of workers – and hiring subsidies. Fiscal constraints and
growing dead-weight losses as the recovery proceeds counsel
increased reliance on employment subsidies that target net
employment increases. Temporary use of such schemes could
help speed up the job recovery, but achieving high take-up rates
requires addressing complex design issues.
Activation is an essential
tool for getting people
back into work
ALMPs are an important ingredient for preventing unemployment
hysteresis and maintaining labour market attachment. While
ALMPs have been scaled up to provide support to the greater
number of jobseekers, the mix of services provided also needs
adjustment to ensure that different jobseekers receive the
appropriate support. In this regard, it is essential to maintain core
job-search assistance, while greater efforts may be needed to
provide training opportunities or even subsidised work experience
as a backstop to activation for the most hard-to-place
unemployed.
Increased benefit
generosity will require
scaling back in some
cases
Where unemployment benefits were already high and/or long-
lasting, recent extensions will need to be scaled back in the
recovery to reduce the risk of unemployment hysteresis. By
contrast, recent increases in coverage could be made permanent
provided similar effective activation requirements are applied to
the new recipients.
Structural reforms would
encourage a more job-
rich and equitable
recovery
Further structural reforms including reductions in
anti-competitive product market regulations (PMRs) could also
make the recovery more job-rich, especially if they take place in
sectors with immediate job-creation potential such as retail trade
and professional services. Likewise, some rebalancing of EP
towards less strict protection for regular workers, but more
protection for temporary workers, along with further reforms to
make activation more effective, could enhance both labour market
efficiency and – by reducing dualism – equity.
Governments should
avoid relaxing access to
early retirement, sickness
and diability benefits
Finally, efforts are needed to maintain or strengthen the labour
market attachment of vulnerable groups that otherwise could be
discouraged from participating in the labour force. Unlike in past
recessions, the participation of older workers has increased in
most countries so far in this crisis, reflecting in part large pension
and housing wealth losses and past efforts to tighten access to de

OECD ECONOMIC OUTLOOK PRELIMINARY EDITION
267
facto early retirement systems. Governments should continue to
resist the temptation to relax eligibility criteria to such schemes,
and even consider tightening them as past experience points to a
risk of over-use in the aftermath of recessions. Transferring the
unemployed to long-term sickness or disability benefits should
also be eschewed, as experience shows that this is a one-way
street – the probability of a return to the labour market is
extremely low.
Combined training and
work programmes can
help reduce the impact of
the crisis on youth
Young persons are likely to suffer large participation declines and
scarring effects from the recession and therefore merit special
attention. In this context, it is important to ensure that
out-of-school youth who are encountering difficulty in the labour
market can access appropriate active labour market programmes.
For low-skilled youth jobseekers, whose chances of finding a job
in the short-term are weak, governments should consider a
combined training and work approach to enhance their human
capital and maintain their labour market attachment.
Response of the labour market to the recession
How has labour input adjusted to the shock?
Hourly labour
productivity fell in most
countries
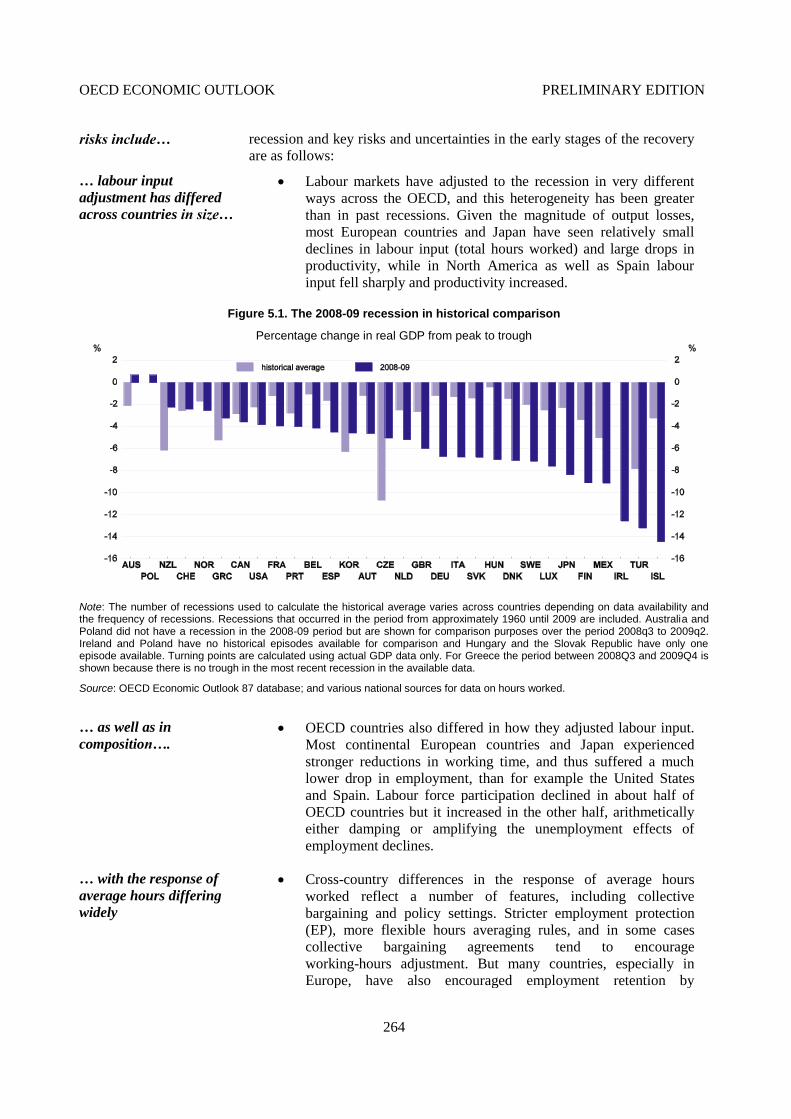
In most countries for which data are available, total hours worked
were reduced less than output, meaning that productivity declined on an
hourly basis during the 2008-09 recession (Figure 5.2). In general,
productivity declines have also been larger, and – given the magnitude of
output losses – labour input adjustment has been smaller during this
downturn than in earlier ones.2 Some notable exceptions were North
America and Spain where labour input actually fell faster than output,
translating into a productivity increase in this recession which was stronger
than in previous episodes.3
Hours took more of the
adjustment in some
countries this time
around
OECD countries differed not only in how much, but also in how they
adjusted labour input. In many European countries and Japan, adjustment
mainly took place through cuts in working hours rather than through
employment declines (Figure 5.3).4 In Germany, extreme labour hoarding
occurred as employment continued to rise during the recession, with the
reduction in average hours accounting for more than 100% of the total net
reduction in labour input. By contrast, in a few countries, including Spain
and the United States, adjustment mainly took place at the extensive rather
than at the intensive margin.
2. The historical experience is based on previous downturns whose number and characteristics vary across
countries.
3. Due to varying lags between changes in activity and labour input across countries, the adjustment of labour
input to the negative output shock may have been more advanced in some countries than others when GDP
reached its trough,
4. See Table 5.A1 for further details on the definitions and sources of the hours worked series.
OECD ECONOMIC OUTLOOK PRELIMINARY EDITION
268
Figure 5.2. Labour productivity in the 2008-09 recession in historical comparison
Percentage change in hourly productivity from peak to trough
Note: Czech Republic, Ireland and Poland have no historical episodes available and Austria, Belgium, Hungary, Korea, the Netherlands, the Slovak Republic and Spain have only one historical episode available.
Source: OECD Economic Outlook 87 database; and various national sources for data on hours worked.
Figure 5.3. Contribution of average working time to labour input adjustment during recessions
Note: The contribution is equal to the percentage of the total net change in labour input from the peak to trough in GDP due to average hours worked. A negative contribution arises when average hours worked rose during the recession.
1. The historical average is computed across previous recession episodes. For Austria, Belgium, Hungary, Korea, the Netherlands, the Slovak Republic and Spain, there is only one previous episode with declining labour input available for comparison. Czech Republic and Ireland have no historical episodes available.
Source: OECD Economic Outlook 87 database; and various national sources for data on hours worked.
OECD ECONOMIC OUTLOOK PRELIMINARY EDITION
269
Different responses of
labour force participation
also contributed to…
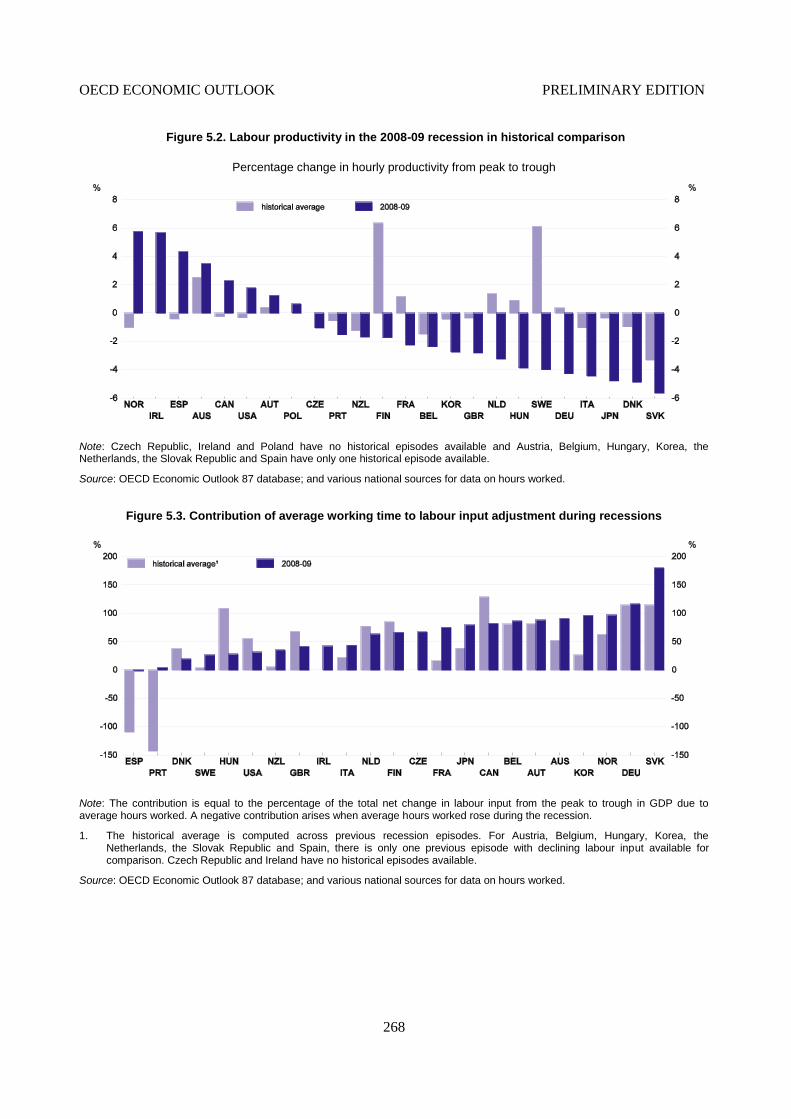
The pattern of labour force participation changes showed wide
variation across the OECD throughout the crisis, although the typical
response has been milder than in past recession episodes, especially given
the greater magnitude of the shock (Figure 5.4). In about half of the OECD
countries, labour force participation has actually increased, possibly
amplifying the short-term rise in unemployment in some of them. These
jumps in participation may reflect partly the entry of second earners,
particularly females, into the labour force following job losses by
predominantly male primary earners, and partly older workers staying on
longer in the labour force as the value of pension saving declined. By
contrast, in other countries including in Iceland, Ireland, Norway, Sweden,
and to a lesser degree in the United States, discouraged-worker effects
appeared to have dominated and participation has fallen.
Figure 5.4. Change in the Labour Force Participation Rate in the 2008-09 recession
Note: For Iceland, Ireland and Poland there are no historical episodes available for comparison and for the Czech Republic, Hungary, Korea, Turkey and the Slovak Republic there is only one episode available.
Source: OECD Economic Outlook 87 database.
… highly variable
impacts on
unemployment
Reflecting the different adjustment patterns of labour input, hours and
participation, unemployment has been far more sensitive to the magnitude
of GDP losses in some OECD countries than in others (Figure 5.5). For
example, although the decline in output in Spain and the United States
during the recession was below-average, the rise in unemployment has been
much higher than average, while in Germany, where output declined by
more than in both these economies, the unemployment rate actually fell
during the recession. More generally, the unemployment response in this
episode was muted in many European countries, as well as in Japan. An
overall summary of the various labour market impacts of the crisis across
OECD countries is shown in Table 5.1.

OECD ECONOMIC OUTLOOK PRELIMINARY EDITION
270
Table 5.1. Decomposition of the Recessions Impact on OECD Labour Markets
Level at the recession trough, Peak = 100
GDP
Volume
Productivity
per hour
Average
hours
worked
Participation
rate
One minus
Unemployment
rate
Working Age
Population
Australia 100.7 103.5 97.5 99.9 99.6 101.8
Austria 95.4 101.2 94.9 100.1 99.7 100.5
Belgium 95.9 97.6 98.4 100.0 100.1 100.8
Canada 96.4 102.3 95.2 100.0 98.5 101.7
Czech Republic 95.0 100.4 98.8 100.4
Denmark 92.9 95.1 99.5 100.3 98.4 100.5
Finland 90.9 98.3 94.9 99.5 99.0 100.2
France 96.1 97.8 98.7 100.4 99.6 100.5
Germany 93.3 95.8 97.0 100.4 101.3 99.7
Greece 96.8 101.0 98.3 99.8
Hungary 93.0 96.1 99.1 100.1 98.9 99.8
Ireland 87.4 95.9 92.8 101.4
Iceland 85.6 97.3 97.0 102.0
Italy 93.2 95.6 98.9 99.4 100.0 101.0
Japan 91.6 95.2 97.0 100.6 100.4 99.1
Korea 95.4 97.2 98.2 99.8 100.9 100.3
Luxembourg 92.4 100.3 99.6 101.6
Mexico 90.9 99.2 101.7
Netherlands 94.8 96.8 98.7 99.5 100.5 100.3
Norway 97.5 105.8 92.4 99.3 100.4 101.3
New Zealand 97.8 98.3 99.8 99.9 99.4 101.4
Poland 100.7 100.7 99.5 101.0 99.7 100.3
Portugal 96.0 98.5 99.9 99.4 99.4 100.0
Slovak Republic 93.2 94.4 97.8 100.2 101.2 100.6
Spain 95.5 104.3 100.1 100.9 91.6 101.2
Sweden 92.8 96.0 99.1 99.2 98.0 101.6
Switzerland 97.6 100.1 100.1 101.2
Turkey 86.8 101.4 96.7 101.7
United Kingdom 94.0 97.2 98.6 100.1 98.5 100.7
United States 96.2 101.8 98.2 99.7 97.0 100.9
Note : Index values show the level of the variables when GDP reached its trough during the recession.
Source: OECD calculations using Economic Outlook Database 87; National Statistical Offices.
Why did hours contribute differently across countries to labour input
adjustment?
The response of hours
partly reflects the
duration of labour
market adjustment…
Some of the current cross-country differences in the contribution of
hours worked to labour input adjustment may simply reflect differences in
the duration of labour adjustment. For example, driven by a decline in
average hours, labour input began to decline in the United States in the
autumn of 2007, perhaps a leading indicator of a weakening economy. In
Germany, on the other hand, labour input only started declining a year

OECD ECONOMIC OUTLOOK PRELIMINARY EDITION
271
later.5 With the passage of time, one might expect more resemblance across
these contributions. Indeed, an examination of labour adjustment across
53 recession episodes in 20 OECD countries reveals that adjustments in
average hours tend to make the greatest contribution to changes in overall
labour input at the start of a downturn. As the recession progresses, the
scope for further adjustments of working time diminishes, employers
increasingly cut employment and the contribution of hours to adjustment of
labour input typically falls (Figure 5.6).
Figure 5.5. Change in the unemployment rate in the 2008-09 recession in historical comparison
Note: The calculation of averages implicitly assumes linearity in the effect of recessions on unemployment because past episodes include both mild and severe recessions. This figure shows only the immediate effect of the recession on unemployment. Due to lags between output and labour market changes, the eventual rise in unemployment may be higher in some countries. For Greece, Iceland, Ireland and Poland there are no historical episodes available for comparison and for the Czech Republic, Hungary, Korea, Turkey and the Slovak Republic there is only one episode available.
Source: OECD Economic Outlook 87 database.
5. A comparison of peaks and troughs in labour input and GDP reveals that the decline in both series usually
starts around the same quarter. In some cases the decline in GDP may lead labour input by a quarter or two.
Perhaps more surprising is that a decline in labour input, usually due to a fall in hours, sometimes leads
GDP recessions. In recovery phases, an increase in labour input almost always lags an increase in GDP.

OECD ECONOMIC OUTLOOK PRELIMINARY EDITION
272
Figure 5.6. The contribution of hours worked to total labour input adjustment in the current and past recession episodes
Share of net percent change in labour input from the peak of labour input accounted for by hours adjustment, in percent
Note: The length of adjustment shown varies across countries because labour input ceases to decline more quickly in some countries than others.
Source: OECD Economic Outlook 87 database; and various national sources for data on hours worked.
… the nature of the
shock…
In some countries, the large contribution of employment to labour
adjustment during the recession was likely exacerbated by particularly
sharp adjustments in the construction sector, where employment is typically
more responsive to output shocks than in other industries.6 Indeed countries
that faced a severe housing downturn (e.g. Spain and the United-States)
seem to have experienced unusually large job losses compared with those
that were primarily hit by the crisis through the financial and international
trade channels (e.g. Australia, Austria, Germany), ceteris paribus.7
… as well as more
structural factors...
Some of the cross-country differences in the magnitude of average
hours adjustment are also structural. Simple panel regressions covering
recession episodes since the early 1970s suggest that some countries
including Austria, Germany and Norway rely significantly more on
adjusting average hours during recessions, ceteris paribus.8 In other
6. OECD analysis based on a sample of over 230 000 firms across ten European countries also suggests that a
number of firm characteristics play a role in the degree of reliance on the extensive versus intensive margin
of adjustment. In particular, firms that have less debt leverage, are smaller and/or are more technology-
oriented and skill-intensive tend to hoard labour more.
7. Analysis of a sample of European countries shows that the cyclical component of employment in the
construction sector is about two times more volatile than employment across all industries. See OECD
(2010) for further details.
8. The panel regressions take the form θie = λi+ λe +εie, where θie is the contribution of average hours to total
labour input adjustment from the peak to the trough of GDP (i.e. during the recession), e denotes recession
episodes, i denotes countries, λi is a country dummy and λe is a recession episode dummy (one for each of
the periods 1970-75, 1976-85, 1986-95, 1996-2005 and 2005 onwards).

OECD ECONOMIC OUTLOOK PRELIMINARY EDITION
273
countries, including New Zealand, Spain and the United States,
employment tends to play a stronger role in adjusting labour input.9 While
cross-country differences were even larger than usual in this recession, the
average contribution of hours across the OECD was in line with past
recessions, although it was higher than during the early-1990s recessions.
… including labour
market institutional
arrangements
A number of labour market institutional arrangements appear to
account for some of these cross-country differences in hours adjustment
both in the past and during this crisis:
Industry-level analysis reveals that tight employment protection
(EP) legislation and more flexible hours-averaging rules increase
the importance of average hours adjustment (Figure 5.7).10,11
When there is a shock to output, strict EP encourages employment
preservation through labour hoarding in a number of continental
European countries compared with their English-speaking
counterparts.12
Empirical evidence also suggests that STWs have played a role in
reducing average working hours (OECD, 2010). STWs have
become an increasingly popular tool for preserving jobs, with
three-quarters of OECD countries using such schemes during the
recession, some for the first time (Box 5.1).
Experience in Germany suggests that other institutional
arrangements, including collective bargaining arrangements and
company agreements negotiated by work councils, have played an
important role in adjusting hours by arranging for hours bands
and individual working-time accounts.
How have real wages adjusted to the output shock?
Wage developments in
the recession have varied
significantly across
countries.
Real wage flexibility could speed up the job recovery going forward.
Wide variations in real wage developments across OECD countries since
the onset of the recession may be suggestive of different degrees of
flexibility although they could also just reflect different adjustment lags
(Figure 5.8). In a first group, which includes North America and Spain, real
wages have increased significantly, despite a sizeable increase in
unemployment. However, this may in part reflect sectoral and workforce
9. However, this is based on relatively few data points (recession episodes) for each country.
10. Hours-averaging allows employers to vary the number of weekly hours worked over time provided the
average number of weekly hours worked over a defined period of time stays within agreed limits.
11. This industry-level evidence covers 18 European and 4 non-European countries for the period 1980-2005.
Panel regressions were estimated taking the basic form: Δsict= β1sict-1 + β2Δyict+ β3sict-1Pc + β4ΔyictPc + λt +
λic + εict where s is the log of average hours worked, P is the policy or institution, y is the log of output, λt
and λic are time and country-industry fixed effects and c, i and t denote country, industry and time,
respectively. Estimation is for the manufacturing sector only. Policies were tested both separately and
jointly in the equation, with consistent results across both exercises. For further details, see OECD (2010).
12. Hours-averaging rules encourage labour hoarding particularly in the United States, where standard hours
can be averaged over two years. However, this was dominated by other factors during the recent recession
including its nature and the lack of effective short-time working schemes (STWs).

OECD ECONOMIC OUTLOOK PRELIMINARY EDITION
274
composition effects rather than real wage rigidity, as the disproportionate
dismissal of lower-paid, lower-productivity workers has raised the average
wage.13
In a second group, increases in the unemployment rate have been
accompanied by a fall in average compensation per hour worked relative to
previous trends, suggesting some downward wage flexibility. By contrast,
in a third group that includes several European countries and Japan, wage
growth actually rose in the recession relative to previous trends, with less
evidence of a work-force composition effect as hourly productivity was
declining.
Figure 5.7. The impact of employment protection and hours regulations on average hours worked
Simulated effect of each country's policy settings on the effect of a ten percent decline in output on average hours worked, percent¹
Note: The chart shows for each country the contemporaneous impact of its policy stance in two areas (employment protection in Panel A, hours averaging rules in panel B) on the impact of a ten percent negative output shock on average hours worked. For instance stricter employment protection legislation in Portugal is estimated to reduce average hours worked by 1%, compared with just over 0.4% in the United States. Although the size of these effects may not appear large, the overall elasticity of average hours to output is small so that the contribution of these policies to changes in hours worked is non-negligible.
1. Manufacturing sector only. Unbalanced panel for 22 countries (18 European and 4 non-European).
2. The flexibility of hours averaging rules is measured by the number of weeks during which usual hours can be averaged.
Source: OECD estimates based on EUKLEMS Database.
13. For example, in Spain employment of workers with up to lower-secondary education fell by 10% in 2009,
compared to a fall of around 1% in the employment of tertiary qualified workers. This is in contrast with
the average OECD country, where employment declines have been larger for medium-skilled workers than
for low-skilled ones (see Figure 5.9).

OECD ECONOMIC OUTLOOK PRELIMINARY EDITION
275
Box 5.1 Are short-time working schemes a good way to reduce job losses and prevent unemployment hysteresis?
Short-time working schemes (STWs) involve the government subsidising part of the foregone income of employees that have had their working hours reduced by a firm facing demand short-falls. The rationale for such schemes is to avoid “excessive” layoffs, i.e. cases where employers encountering temporary difficulties dismiss workers, even though the jobs in question would be viable in the long-run (OECD, 2009d). Although they are
receiving much attention in this recession, STWs are only one among several institutions that can encourage hours over employment adjustment in response to output shocks. In Germany, where hours adjustment has played a major role in overall labour input changes during the recession, a recent study finds that the STW accounted for only 25% of the total reduction in average hours from 2008 to 2009 (IAB, 2009). Indeed, the main source of flexibility – accounting for approximately 40% of the recent reduction in hours – has been employer-initiated reductions in working time which can be implemented within existing collective agreements. In addition, German employers achieved reductions in average hours by reducing the volume of paid over-time work (20% of the total reduction) and encouraging employees to run down the positive balances in their individual working-time accounts (another 20%).
1 All such schemes have exhibited some automatic stabiliser properties for employment
during this recession.
Experience in the United States also suggests that the design of the STW is important for how it will affect take-up rates and therefore hours adjustment. Although seventeen US states had STW programmes in place in 2009, the take-up rate was very low. The low take-up rate may reflect the relative generosity of the scheme (Van Audenrode, 1994; Vroman and Brutsentsev, 2009). By contrast to the system in European countries and Canada, STW payments in the US reduce a worker’s entitlement to unemployment benefits dollar-for-dollar if they are subsequently laid-off, making workers reluctant to take up the STW.
An industry-level panel analysis for European countries assessing the effect of the most recent recession on employment and average hours provides evidence that STWs do achieve some of their short-term goals (OECD, 2010).
2. In particular, STWs tend to reduce the employment sensitivity of permanent workers to output
changes and increase the sensitivity of average hours. However, STWs do not appear to have reduced the sensitivity of temporary employment to output shocks, suggesting they primarily shelter so-called labour market insiders.
Estimates of the reduced sensitivity of employment to output under STWs, were used to calculate an estimate of the jobs saved by STWs during the recession (see figure). The largest proportions of permanent jobs saved were in Belgium. Finland and Italy. In the case of Belgium, taken at face value, the estimates suggest that STWs may have damped the fall in permanent employment by as much as 1.3% by the autumn of 2009, relative to a scenario where such schemes would not have been available.
Estimated country-specific effect of short-time work schemes on employment
Impact on employment of permanent workers, in per cent
Note: See footnote 2 for details on the empirical framework that underpins these estimates. The proportional impact of the crisis due to short-time working is calculated by multiplying the coefficient on the interaction term of the change in output, the crisis dummy and average take-up rate by the total change in output and the average national take-up rate during the crisis period.
Source: OECD estimates.

OECD ECONOMIC OUTLOOK PRELIMINARY EDITION
276
Box 5.1 Are short-time working schemes a good way to reduce job losses and prevent unemployment hysteresis? (continued)
A concern with STWs is that if kept too long during the recovery, they may lower medium-term productivity growth if they significantly impede the reallocation of labour from declining firms/sectors to growing firms/sectors.
There is as yet no empirical work on the size of these effects. In Europe, STWs have been used in the past to assist firms facing structural declines in demand as opposed to short-run dips in sales.
3 In the former case,
negative productivity effects of STW are likely to be larger because they send misleading signals to workers about the likelihood of retaining their jobs. This may inhibit them from voluntary mobility and engaging in additional training (Mosley and Kruppe, 1996). To minimise locking labour into failing firms and sectors, it is important to attach clear and credible time limits to STW measures and to design interventions in ways that encourage viable firms to self-select into them (OECD, 2009d). For example, the Netherlands introduced a
requirement that half of STW subsidies be repaid if the employee is laid off within three months of the end of short-time work. _____________________
1. For further details of institutional arrangements and their effect on hours adjustment in Germany, see OECD (2010), Employment Outlook, forthcoming.
2. The following equation was estimated:
∆𝑙𝑛𝑙𝑖𝑘𝑡 = 𝛼0 + 𝛼1∆𝑙𝑛𝑦𝑖𝑘𝑡 + 𝛼2∆𝑙𝑛𝑦𝑖𝑘𝑡 ∗ 𝐷𝑘𝑡𝑐𝑟𝑖𝑠𝑖𝑠 + 𝛼3∆𝑙𝑛𝑦𝑖𝑘𝑡 ∗ 𝐷𝑘𝑡
𝑐𝑟𝑖𝑠𝑖𝑠 ∗ 𝑇𝑘𝑡𝑠𝑡𝑤 +∝4 𝐷𝑘𝑡
𝑐𝑟𝑖𝑠𝑖𝑠 +∝5 𝑇𝑘𝑡𝑠𝑡𝑤 + 𝛽𝑖𝑡𝐷𝑖𝑡
+ 𝛾𝑘𝐷𝑘 + 𝜀𝑖𝑘𝑡 where i refers to industry, k to country, l to the outcome variable which may refer to permanent employment, temporary
employment, average hours worked or the average hourly wage, y to gross output, 𝐷𝑘𝑡𝑐𝑟𝑖𝑠𝑖𝑠 is a country-specific crisis dummy
which equals one from the most recent peak in quarterly GDP to the end of the sample (2009Q3). is the country-specific
take-up rate averaged over the period of the crisis during which the STW operated. It lies between zero and one in countries
with a STW and equals zero in countries without a scheme. represents a full set of industry-by-time dummies and a full
set of country dummies. For further details of both methodology and results, see OECD (2010), Employment Outlook, forthcoming.
3. Prior to this recession both Belgium and France had a non-negligible proportion of employees participating in STWs which appears to be inconsistent with their use for cyclical adjustment purposes. Germany also used STWs for structural adjustment purposes in the coal and steel industries in the 1980s and then subsequently in the eastern states of Germany following reunification. Experience with this led to changes to restrict the duration of STWs. Italy also used STWs for structural adjustment purposes in the 1980s and eventually restricted the duration of STWs (Mosley, 1995).
Figure 5.8. Changes in real wages and unemployment relative to trend during the 2008-09 recession
Note: Changes in unemployment, productivity and wages are measured relative to trend.
Source: OECD Economic Outlook 87 database; and various national sources for data on hours worked.

OECD ECONOMIC OUTLOOK PRELIMINARY EDITION
277
How has the recession affected different workforce groups?
Youth have been hit
particularly hard in this
recession…
As in past recessions, job losses have been relatively larger for some
workforce groups than for others. On average for the OECD area,
employment for youth fell by around 7%, nearly four times the declines in
prime-age and overall employment (Figure 5.9, Panel A). The larger
relative fall in youth employment is consistent with historical patterns but
was even more pronounced on this occasion (Figure 5.9, Panel B). A
relative decline of youth jobs typically coincided with a relative decline of
workers under temporary contracts during this crisis.14
… while employment
actually rose for older
workers…
There have been a number of departures from historical group-specific
employment patterns during this recession, however. In particular, the
employment of older workers, which was about as cyclical as overall
employment in past recessions, has actually increased so far in this
recession. This novel development may reflect, at least in part, the lesser
availability of early retirement options in national pension and social
protection systems and, to a lesser extent, the labour supply responses to
sometimes large losses in retirement savings (see Box 5.2).
… and men and
medium-skilled workers
have been more affected
than usual
Employment losses for men were disproportionately large in the
2008-09 recession, a clear break with the historic pattern where
employment for men and women has been about equally affected by
cyclical downturns. This probably reflects the sector composition of the
negative shock to aggregate demand, especially that associated with the
unprecedentedly deep fall in world trade that began in late 2008 (Baldwin,
2009; Cheung and Guichard, 2009) and which particularly affected
production workers in durables manufacturing, who tend to be males. The
sharp contraction of construction activity in those countries where a
housing bubble burst also likely reinforced the relative vulnerability of men
to job loss. The sectoral profile of the recession may also help to explain
why employment losses have been particularly large for medium-skilled
workers. This broke with the historic pattern in which relative jobs losses
declined monotonically with skill levels.15
14. The dataset for the number of temporary employees includes European Union countries and Turkey only.
15. There may also be a relationship between the strengthened (negative) association between age and
employment losses and the relative improvement in how well low-skilled workers fared. In most OECD
countries, the low skilled share of the population – assessed in terms of educational attainment – is much
lower for youth than for older cohorts.

OECD ECONOMIC OUTLOOK PRELIMINARY EDITION
278
Box 5.2. Pension Wealth Losses and the Participation of Older Workers
Older workers postponing their retirement to try to make up for pension wealth losses incurred during the recession may act as an offsetting effect on participation to that arising from weak labour market conditions and/or high retirement incentives embedded in social transfer programmes (Coile and Levine, 2009). Despite their rally over the past year, equity prices remain below their pre-recession peaks. This has led to large changes in the investment returns of pension funds across the OECD, especially in countries where equities make up a high proportion of the overall asset portfolio (see first figure). In addition, in some OECD countries including Ireland, New Zealand, Spain, the United Kingdom and the United States, housing is an important component of retirement savings, and house price declines have put further downward pressure on older workers wealth compared with their pre-crisis expectations (OECD, 2009).
The older workers that are most affected by the movements in asset prices are those that will derive a high share of their retirement income from capital in defined-contribution pension schemes with a heavy exposure to equities. An approximate guide to the reliance of older workers on capital income can be gained from current retirees’ sources of income. In Australia, Canada, Denmark, the Netherlands, the United Kingdom and the United States, 30% or more of current retirement income was derived from capital (mainly private pensions) in the mid- 2000s (see second figure). In Japan and many other continental European countries, the proportion of retirement income derived from capital is small, indicating that any participation offset effect from asset price falls will be negligible.
Pension funds' equity exposure in 2007
Percent of total portfolio
Note: See OECD (2009a) for further details on investment return. Equity exposure is shown for countries with available data.
Source: OECD (2009a), Pensions at a Glance; and OECD (2009b), Pension Markets in Focus, October.

OECD ECONOMIC OUTLOOK PRELIMINARY EDITION
279
Box 5.2. Pension Wealth Losses and the Participation of Older Workers (continued)
Current retirees' income derived from capital
Percentage of household disposable income, mid 2000s
Note: Includes income from all private savings, both private pensions as well as income from non-pension savings.
Source: OECD (2009a), Pensions at a Glance.
Of the countries where capital income accounts for a high proportion of retirement income, older workers in Australia, the United Kingdom and the United States appear to be the most highly exposed to equity losses due to the greater prevalence of defined-contribution (as opposed to defined-benefit) schemes in these countries. The Australian defined-contribution pension scheme has been running for nearly 20 years so today’s older workers have had time to build up substantial balances and around 60% of people use the default investment option where equities account for approximately 60% of the portfolio. In the United States, nearly 45% of 55-65 year olds hold more than 70% of their private pension assets in equities (OECD, 2009c). In the United Kingdom, voluntary private pensions are increasingly defined-contribution based and overall pensions have around a 50% exposure to equities. By contrast, in the Netherlands, private pensions are of the defined-benefit type and 80% of Canadian
voluntary pensions were defined benefit in 2003 (OECD, 2009a).
Recent research suggests that the effect of wealth declines in increasing participation currently remains limited, even in the United States. This is partly because only a relatively small proportion of overall wealth of those currently close to retirement is directly exposed to equity price risk via direct contribution schemes and direct stock holdings (Gustman et al., 2010). However, with the trend away from defined-benefit schemes towards schemes of the defined-contribution type in many OECD countries, the potential for asset price movements to affect older workers participation is growing over time.
1
____________________
1. Evidence from Australia suggests workers tend to exhibit passive behavior in allocating assets in defined-contribution schemes (OECD, 2009c). This may argue for countries to put in place voluntary opt-out or even mandatory asset reallocation mechanisms into their defined-contribution schemes that would automatically shift asset allocation away from riskier classes towards safer ones as workers approached retirement.

OECD ECONOMIC OUTLOOK PRELIMINARY EDITION
280
Figure 5.9. The effect of the recession on workforce groups in the 2008-09 recession and historically
Note: Shorter annual time series are used for some countries and workforce groups (see OECD (2009), Table 1.A3.1).
1. Unweighted averages for all the OECD countries excluding Switzerland for gender and age groups and only for the European countries for Education and work status.
2. Panel B shows the percentage standard deviation in the cyclical component of employment of each workforce group relative to the average percentage standard deviation in the cyclical component of employment across all workforce groups.
Source: OECD estimates based on the European Union Labour Force Survey (EULFS) and national sources for Panel A; and OECD estimates based on the European Union Labour Force Survey (EULFS) for gender and age and EUKLEMS Database for education in Panel B. See OECD (2009) Annex 1.A3 for further details on the sample coverage and the methodology.

OECD ECONOMIC OUTLOOK PRELIMINARY EDITION
281
Risks and Uncertainties Going Forward
What will happen to cyclical unemployment and hours worked?
Labour hoarding might
imply a job-less recovery
The experience of past recoveries is that it can take several years
before strong job growth is achieved and cyclical unemployment is
reduced, pointing to the risk of a “jobless recovery”, especially if final
demand recovers only slowly. Cuts in working hours and the declines in
productivity seen since the onset of recession could slow down job growth
in some countries. Past experience suggests that while most recessions
entail a productivity decline followed by a productivity pick-up during the
recovery, the extent of employment preservation provides only limited
information on how job-rich or poor the recovery will be (Box 5.3).
However, as noted in OECD (2010a), in cases of extreme labour hoarding
during a recession, the risk of a jobless recovery tends to be higher. Indeed
if cyclical changes over the recession in hours worked per employee and
hourly labour productivity were to be reversed in the recovery, GDP could
rise by over 8% without any increase in employment in Germany and Japan
and by several per cent in most other European countries, as opposed to just
about 1½ per cent in the United States – all else being equal, and leaving
aside any negative impact that the crisis has had on potential output
(Figure 5.10).16
What will happen to long-term unemployment and structural
unemployment?
Past experience suggests
that unemployment
hysteresis is a risk…
In the wake of past recessions, structural unemployment has tended to
rise, reflecting in part hysteresis effects. In particular, many European
countries exhibited a ratchet effect where each successive recession from
the 1970s onwards resulted in a rise in the unemployment rate that was not
fully reversed in subsequent recoveries even as output returned to potential.
The magnitude of this structural unemployment increase was typically
proportional to the severity of the recession, underlining the risk of
hysteresis in the wake of the most recent episode (Figure 5.11). For most
non-European economies, and in particular the United States, no such
relationship appears to hold, or is much weaker. Real wage flexibility could
help to contain the rise in structural unemployment in the years ahead,
especially in those euro area countries that need to restore external cost
competitiveness.
16. See Chapter 4 for current OECD estimates of the effect of the crisis on potential output.

OECD ECONOMIC OUTLOOK PRELIMINARY EDITION
282
… although previous
policy reforms may
contain the risk …
The increase in long-term and structural unemployment following the
current recession could be lower than in the past due to past reforms to
enhance labour and product market flexibility (Furceri and Mourougane,
2009). For most European countries, where such reforms have been more
wide-ranging, preliminary estimates suggest that the reforms could have
reduced the share of any unemployment increase transmitted into long-term
unemployment and on into structural unemployment by up to one-quarter
compared with the average share since the mid-1980s.17
Box 5.3. Does preserving more labour input during the recession imply weak labour demand later?
A simple comparison of cyclical developments in hourly productivity during historical recession and recovery episodes across the OECD suggests that a fall in labour productivity during the recession is almost always followed by a cyclical pick-up in the recovery (see first figure). However, somewhat surprisingly, the strength of the productivity pick-up in the initial couple of years after the trough appears to bear no significant relationship with the magnitude of the productivity decline during the recession. Going forward, this tentatively suggests a given output recovery will not necessarily deliver larger increases in labour input (total hours worked) where hourly productivity declined less (or even increased) during the recession.
Changes in hourly productivity relative to trend in recessions and subsequent recoveries
Note: Percentage change in hourly productivity relative to trend. Recessions are defined as the period between the peak and trough in GDP. The recovery is the eight quarter period following the trough in GDP.
Source: OECD Economic Outlook 87 database; various national sources for data on hours worked; and OECD calculations.
17. OECD calculations of potential output incorporate an assumption that two-thirds of any increase in long-
term unemployment translates into structural unemployment in continental Europe, but only one-third
elsewhere (OECD, 2010a). This is broadly consistent with empirical evidence which suggests that the
long-term unemployed have a weaker impact than the short-term unemployed on wage bargaining and that
this difference is more marked in European than non-European countries, partly reflecting differences in
institutional settings (Llaudes, 2005; Guichard and Rusticelli, 2010).

OECD ECONOMIC OUTLOOK PRELIMINARY EDITION
283
Box 5.3. Does preserving more labour input during the recession imply weak labour demand later? (continued)
This apparent lack of symmetry in hourly productivity during the recession and recovery could be due to average hours worked and employment developments or both. Further analysis suggests that this may be partially due to a lack of symmetry in average hours worked per employee (OECD, 2010a). Likewise, a comparison of cyclical productivity on a per employee basis suggests that for countries experiencing no or very small declines in productivity per employee during the recession (e.g. Spain and the United States in this
episode), history provides only limited information as to whether the subsequent recovery is job-rich or not. This is because for smaller falls in labour productivity during the recession (below 4%), productivity dynamics in the recessions and subsequent recoveries are largely uncorrelated (see second figure).
1
However, where productivity per employee has fallen faster, the risk of jobless recovery may be higher. In particular, countries that experienced sharp falls in labour productivity (i.e. those on the far left of the figure) generally recorded a strong pickup in labour productivity growth in the recovery period. In six out of seven historical episodes where the falls in cyclical labour productivity during the downturns exceeded 6%, cyclical labour productivity per employee was very strong in the subsequent recovery. The remaining episode involved a supply shock (the first 1970s oil shock) where the large fall in labour productivity was due in part to a structural decline in productivity and incomes rather than cyclical employment preservation through labour hoarding.
Cyclical labour productivity per employee in the recovery and the previous recession
Note: Cyclical labour productivity is the difference between actual and trend labour productivity where trend productivity is measured as the OECD measure of potential output for each country divided by trend employment. Recessions are defined as the period between the peak and trough in GDP. The recovery is the eight quarter period following the trough in GDP.
Source: OECD Economic Outlook 87 database; and OECD calculations.
This conclusion is tempered by the limited number of episodes with a symmetric behaviour of productivity in the recession and recovery periods. However, these episodes are likely to be highly relevant to the current recession where many countries, including Denmark, Finland, Germany, Italy, Japan, Luxembourg, the Slovak Republic and Turkey, have experienced a similar sharp drop in labour productivity. These results tentatively suggest that countries, which have experienced stronger employment preservation through labour hoarding and greater falls in labour productivity in the recession may face a higher risk of a jobless recovery than others where there has been very little or no labour hoarding.
___________________
1. A simple panel regression including time and country dummies explaining de-trended productivity growth in the recovery confirms that the coefficient on de-trended productivity growth in the recession is not significantly different from zero and is significantly different from -1 (perfect symmetry).

OECD ECONOMIC OUTLOOK PRELIMINARY EDITION
284
Figure 5.10. Contribution to cyclical change in output during the recession from cyclical changes in average hours and hourly productivity
Note: Combined effect of cyclical changes in average hours worked and hourly labour productivity from the peak to trough in output in the recent recession. Cyclical changes are calculated by subtracting estimated structural changes in hours worked and hourly productivity from the actual changes. These calculations assume no further reductions to trend hourly productivity and average hours worked in the aftermath of the recession.
Source: OECD Economic Outlook 87 database; various national sources for data on hours worked; and OECD calculations.
Figure 5.11. Unemployment hysteresis has been stronger in Europe in the past
Note: The scatter plot shows the increase in the unemployment rate from the quarter when the output gap was closest to zero prior to a severe downturn to the quarter when the output gap was again closest to zero following it. Only downturns where the cumulative output gap exceeds 2 percentage points are considered.
Source: OECD Economic Outlook 85 database; and OECD calculations.

OECD ECONOMIC OUTLOOK PRELIMINARY EDITION
285
… as well as the limited
rise in actual
unemployment
Unemployment developments since the start of this crisis also suggest
that at least some continental European countries and Japan face less risk of
unemployment hysteresis this time around. In particular, the increase in
actual unemployed to date may be too small to create a longer-term
structural unemployment problem in a number of countries including
e.g. Austria, Germany, Japan and the Netherlands. Furthermore, matching
of the unemployed with vacancies, as indicated by the Beveridge curve,
also appears to have improved in these countries recently, consistent with a
fall in the structural unemployment rate (Box 5.4). Estimates (Guichard and
Rusticelli, 2010) that take account of both past reforms and recent
unemployment changes suggest that overall structural unemployment could
increase by over 3 percentage points in Spain and Ireland, between ¾ to
1 percentage points in Italy and the United Kingdom and around
½ percentage point in most continental European economies (Figure 5.12).
There is considerable uncertainty about the size and cross-country
dispersion of these estimates. If the rise in unemployment during the early
stages of the recovery continues to be more muted than projected in the
immediate aftermath of the recession, the effects on structural
unemployment will be reduced accordingly.
Figure 5.12. Projected increase in the long-term and structural unemployment rate
Note: Structural unemployment is expected to fall in Slovak Republic and Poland as a result of past structural reforms. The peak is 2012Q4 in all countries.
Source: Guichard and Rusticelli (2010); OECD long-term scenario; and OECD Economic Outlook 87 database.

OECD ECONOMIC OUTLOOK PRELIMINARY EDITION
286
Box 5.4. Job Mismatch: An examination using Beveridge curves
One preliminary way to assess whether structural unemployment has risen as a result of the recession is to look at whether the relationship between unemployment and vacancy rates – the so-called Beveridge curve – has shifted recently. A shift of the curve to the right would indicate that matching workers to vacant jobs is becoming more difficult, consistent with a higher structural unemployment rate. By contrast, a movement along the curve to the right would be consistent with a purely cyclical rise in unemployment. In the United States, the recession has led to a large movement along the Beveridge curve to the right with the vacancy rate falling and the unemployment rate rising (see figure). However, the position of the curve appears to be quite stable suggesting that the matching performance of the labour market has remained constant over the last decade and into the most recent recession. Other countries that exhibit a similarly stable Beveridge curve include Hungary, Norway and the United Kingdom.
Beveridge Curves in selected OECD countries
2001q1-2009q4
Note: The fourth quarter of each year has a year label.
Source: OECD, Main Economic Indicators database; OECD Economic Outlook 87 database; and United States Bureau of Labour Statistics.
By contrast, job matching might have worsened in a number of other OECD countries. In some of these, including Switzerland, Luxembourg, Portugal and to a lesser degree Sweden, the rightward shift in the Beveridge curve observed since the early-2000s downturn seems to have continued during this recession. In other countries such as Germany, Japan, Austria and the Netherlands, the curve appeared to move rightwards from the early to mid-2000s before shifting left again from the mid-2000s to the late 2000s. The Hartz IV reforms may have contributed to the recent improvement in Germany. Countries that have experienced a worsening job matching process over the past decade and/or in the current recession may face greater difficulties in reducing unemployment than in previous episodes, raising the challenge for policies designed to tackle unemployment hysteresis discussed below.

OECD ECONOMIC OUTLOOK PRELIMINARY EDITION
287
… compared with more
flexible economies
In the more flexible economies, increases in structural unemployment
are estimated at under ¼ percentage point in Canada and Korea and
0.7 percentage points in the United States. Despite the large increases in
unemployment in the United States, job matching does not seem to have
worsened so far; the strong productivity performance during the recession
raises the likelihood of a job-rich recovery, and favourable institutional
arrangements have traditionally limited the risk of cyclical unemployment
becoming structural. However, hysteresis effects could nonetheless be
larger in this episode than in the past, due to the unusually large increase in
unemployment combined with a long-term trend towards a falling outflow
rate (Elsby et al., 2010), which has reached historically low levels recently
and has boosted long-term unemployment to over 40% of total
unemployment.18
No similar downward trend in the outflow rate is apparent
in Canada, for which comparable data are available (Figure 5.13).
What will happen to labour force participation?
This recession could also
durably reduce labour
force participation…
An examination of past episodes suggests that unlike mild downturns,
severe recessions, particularly those of a long duration such as the current
one, typically have long-lasting adverse consequences on trend labour force
participation, largely reflecting so-called discouraged-worker effects.19
Based on current institutional settings, the risk of decline may be largest in
those European countries that have suffered a relatively large increase in
unemployment, as well as in Japan and the United States.
... although this time
might be different
However, the policy reforms carried out in many OECD countries
over the past two decades, especially across continental Europe, might also
have reduced the risk of persistent declines in labour force participation.
Relevant reforms in this regard include inter alia less strict EP for
temporary workers, strengthened activation policies, including for social
assistance recipients, as well as tightened eligibility criteria to, and reduced
financial incentives embedded in, de facto, early retirement schemes
(see Section 4 below). Furthermore, the unemployment response has been
milder than expected in many European countries and Japan, thereby
limiting the risk of worker discouragement. In addition, and as discussed
above, in a number of (mainly English-speaking) OECD countries, older
workers may seek to work longer in order to recoup some or all of the
recent losses in their pension and housing wealth (Box 5.2). Indeed,
somewhat unexpectedly, the participation rate of older workers has
increased so far in this recession, the OECD average increasing by
0.9 percentage points between mid-2008 and mid-2009 (Figure 5.14). By
contrast, although there are some notable exceptions, youth participation
rates generally fell over the same period.
18. Over the period 1950 to 2010, the next highest peak of 25% was reached in the second quarter of 1983.
19. This is not straightforward a priori since the expected decline in labour force participation from
discouraged-worker effects may be partially offset by the labour market entry of those previously outside
the labour force – including secondary earners – to make up for the loss of family income (the so-called
“added-worker” effect).

OECD ECONOMIC OUTLOOK PRELIMINARY EDITION
288
Figure 5.13. Unemployment Dynamics over the business cycle in Canada and the United States
Source: OECD Economic Outlook 86 database; and OECD estimates based on national Labour Force Surveys.
Figure 5.14. Labour Force Participation Rates for Older and Younger Workers
Change in percentage points between 2008q2 and 2009q2
Source: OECD estimates based on the European Union Labour Force Survey (EULFS) and national sources.

OECD ECONOMIC OUTLOOK PRELIMINARY EDITION
289
Summing up: policy challenges ahead in OECD countries
The recession has
created a cyclical
unemployment problem
in some countries…
Overall, the policy challenges posed by the aftermath of the
2008-09 recession vary significantly across the OECD (Table 5.2).20
In
Canada, as well as most OECD Pacific and some continental European
countries such as Germany, Luxembourg and Norway, the risk of hysteresis
effects appears low, at least at first glance, due to a small-to-moderate rise
in actual unemployment and/or favourable institutional settings. However,
hysteresis could become an issue if the stronger risk of a jobless recovery in
these countries materialises. In the case of the United States, the possibility
of non-linear effects arising from the large size of the shock and the marked
rise in long-term unemployment caution against dismissing the risk of
hysteresis despite favourable institutions.
Table 5.2. Potential vulnerability to an increase in structural unemployment varies by country
Change in unemployment rates from peak to latest available data1
Estimated relative sensitivity of structural
unemployment to a cyclical increase in
aggregate unemployment2
No/small unemployment impact
(Less than a 1.5pp increase)
Medium-small unemployment
impact
(At least a 1.5pp increase but less
than a 3pp increase)
Large unemployment impact
(At least a 3pp increase)
Low Korea Canada Denmark
Mexico Iceland
New Zealand
Sweden
United States
Medium Australia Austria Hungary
Germany Finland
Japan France
Luxembourg United Kingdom
Norway
High Belgium Greece Czech Republic
Netherlands Italy Ireland
Switzerland Portugal Spain
Turkey
Note : pp: Percentage-point.
1. Peak defined in terms of real quarterly GDP.
Source: OECD calculations based on OECD Economic Outlook 87 Database and Guichard and Rusticelli (2010).
2. Based on OECD estimates of how the impact of recessions on structural unemployment is affected by cross-country differences in labour market
institutions and policies (see Guichard and Rusticelli, 2010).
… while in others the
challenge is to prevent
the effects of the
recession becoming
permanent
However, in a number of OECD countries including Southern, Central
and Eastern European countries as well as Ireland and Turkey, the
likelihood of potential structural labour problems arising from the recession
appears to be higher because policy institutions that make the structural
unemployment rate more sensitive to cyclical shocks are combined with
generally moderate to large unemployment shocks. A third group of
20. This discussion is confined to the potential long-term problems created by cyclical developments in the
recession rather than being a full assessment of the structural labour market problems faced by OECD
countries.
OECD ECONOMIC OUTLOOK PRELIMINARY EDITION
290
countries including Austria, Finland, France, Luxembourg and the United
Kingdom faces moderate risks of unemployment hysteresis. Recent
developments also suggest that some countries may need to focus more
attention on certain groups at risk of labour force withdrawal including
youth (Australia, Ireland, Italy, Norway and Spain) and older workers
(Finland, Iceland, Mexico, Portugal and Turkey).21
Labour market policy responses to the recession and policy options
going forward22
Policy responses and options to address growing unemployment
Most countries have
introduced a range of
measures to tackle
growing unemployment
OECD countries have taken a broad range of labour market policy
measures in response to the jobs crisis, particularly in the areas of labour
taxes and job subsidies, short-time work schemes, ALMPs and
unemployment benefits (OECD, 2009d) (Figure 5.15).23
Going forward,
difficult choices will have to be made if cyclical unemployment is to be
reduced and damaging rises in structural unemployment prevented,
reflecting the need to ensure the recovery of aggregate demand whilst
pursuing sustained fiscal consolidation in a context of limited political
capital. Recent information concerning 2010 shows that few countries have
near-term intentions to cut back on the resources devoted to labour market
policies (OECD, 2010). Indeed, half or more expect to put more resources
into job-search assistance, some ALMPs and unemployment benefits, and a
large minority will put more resources into job-subsidy schemes, public
sector job creation and social assistance and other support programmes for
job losers. By contrast, resources devoted to lower social security
contributions and STW schemes are set to remain fairly constant or decline
in several countries as these schemes are wound back and temporary
measures expire.
Short-time work schemes
have been helpful but
must be phased out
gradually
With the exceptions of Belgium, Finland and France, few employees
were participating in short-time work or partial unemployment schemes
prior to the onset of the recession.24
Since the onset of the recession, many
countries have introduced such schemes, or scaled them up by increasing
replacement rates. Partly as a result, take-up rates have increased rapidly
since 2007, and have been highest in Belgium, Germany, Italy, Japan and
21. The countries under brackets had strong falls in the labour force participation of youth and/or older
workers in both absolute terms and relative to the participation of prime-age workers.
22. This section relies heavily on OECD (2010) which contains a more detailed discussion of these issues.
23. The detailed information on country policy responses comes from a joint questionnaire sent out by the
OECD and the European Commission to all their members. The first survey covered measures taken in
response to the recession up until mid 2009. Most measures were taken in late 2008 and early 2009. The
latest information was collected in a second joint questionnaire in early 2010 and covers labour market
policy plans for 2010.
24. The use of short-time working schemes before the recession suggests that they have also been used for
structural adjustment purposes rather than solely as short-term labour input management tools.

OECD ECONOMIC OUTLOOK PRELIMINARY EDITION
291
Turkey (Figure 5.16). Because they have contained job losses – although
their contribution should not be over-estimated (see Box 5.1) – during the
recession, STWs will de facto help contain unemployment hysteresis.
However, to minimise the risk of hours declines becoming permanent and
ensure that STWs do not impede efficiency-enhancing labour reallocation
across firms and industries, it is important to attach clear and credible time
limits to such measures despite the political economy pressures to extend
them.25
In that regard, it is good news that recent expansions of STWs are
scheduled to be phased out by the end of 2010 in most countries. By
contrast, Germany is currently considering extending to 2012 the
crisis-related scaling-up of its STW.
Figure 5.15. Discretionary Changes in Labour Market Policy in Response to the Recession by mid 2009
Number of OECD countries¹ that have taken different types of measures
Note: This measures the number of countries that made changes to their policy settings - scaling-up existing measures and/or introducing new ones - in these four areas since the onset of the recession.
1. Statistics based on 29 countries, Iceland being excluded.
2. Does not include measures to increase aggregate labour demand such as fiscal packages.
Source: OECD (2009d), Responses to 2009 OECD/EC questionnaire.
25. It is also important to design the interventions in ways that encourage viable firms to self-select into them
(e.g. firms in the Netherlands have to pay back 50% of the subsidy if they dismiss the workers within
3 months after the end of the short-time work period).

OECD ECONOMIC OUTLOOK PRELIMINARY EDITION
292
Figure 5.16. Annual average stock of employees participating in short-time work schemes as a percentage of all employees
Note: Until 2009q3 for Austria and the Netherlands; August 2009 for Portugal and Spain; September 2009 for the Slovak Republic; and October 2009 for Luxembourg and New Zealand.
Source: Data on short-time workers are from the OECD-EC questionnaire, except in the following cases: * indicates that data are from national sources; ** indicates that data are OECD estimates based on OECD-EC questionnaire or national sources. Data on employees are from OECD Main Economic Indicators database.
The expansion of job
subsidies…
Job subsidies to private employers have been introduced or expanded
in many countries since the onset of the crisis. Subsidies have differed in
terms of targeting (to specific groups or not). They have also differed in
form, with choices having to be made about whether they take the form of
labour tax cuts applied to all jobs (labelled here as stock subsidies), or of
explicit subsidies either to new hires (gross hiring subsidies) or only to new
hires associated with net job creation (net hiring or marginal subsidies). A
number of countries reduced labour costs across-the-board mainly through
general reductions in employer social security contributions (e.g. in
Germany, Japan, Portugal and Hungary). By contrast, some countries
targeted labour tax cuts at new hires (e.g. France, Spain, Ireland and
Portugal), or introduced or scaled up gross hiring subsidies targeted at
specific groups such as the long-term unemployed (Austria, Korea,
Portugal, Sweden). Across-the-board labour tax cuts have been phased out
and, on current plans, hiring subsidies are set to be phased out by early
2011 or earlier in many countries, with some exceptions where they are
scheduled to continue longer, including Turkey.26
26. For further details of schedules for phasing-out measures and discussion of these issues, see OECD (2010)
“The Policy Response to the Jobs Crisis in OECD countries: from the Recession to the Early Phase of the
Recovery”, Note Prepared by the Directorate for Employment, Labour and Social Affairs for the G20
Labour Ministerial in April 2010.

OECD ECONOMIC OUTLOOK PRELIMINARY EDITION
293
... needs to be cost-
effective and temporary
Stock subsidies, for example an across-the-board cut in employer
social security contributions, can assist in boosting employment,27
but they
are also expensive and involve large dead-weight losses because they
subsidise jobs that would have existed without the subsidy. Gross hiring
subsidies, such as recently introduced in the United States, entail smaller
dead-weight losses, and if targeted these can also be effective in bringing
about a more equal distribution of unemployment across labour force
groups. However, gross subsidies can be “gamed” by private firms through
an increase in labour turnover. Net hiring subsidies, used in several
countries including Hungary, Ireland, Portugal and Turkey, partly answer
these concerns, and they are also more cost-effective and involve fewer
deadweight losses than gross subsidies. At the same time, they tend to be
more complex and have been difficult to administer in the past. At the
current juncture, two considerations that support a move away from using
stock and gross subsidies towards temporary net hiring subsidies to
encourage a job-rich recovery are that many countries are under severe
fiscal constraints and that deadweight loss will grow as recoveries become
more established.28
Some recent increases in
unemployment benefits
could be rolled back
Along with strengthened activation requirements (see below), a
number of OECD countries have increased the level and/or the duration of
unemployment benefits to mitigate the impact of job losses on individual
and family incomes.29
High and long-lasting unemployment benefits have
been found to weaken job-search activity (Lalive, 2008; Krueger and
Mueller, 2010). They also tend to raise wage claims and to reduce real
wage flexibility. Reflecting both factors, high and long-lasting
unemployment benefits have been found to increase structural
unemployment, and more tentatively to amplify hysteresis effects.30
This
may particularly be the case at a time when job losers who previously
enjoyed high wages due to specific human capital and/or wage rents (e.g. in
the car industry and manufacturing more broadly) have to seek lower-paid
27. For further discussion of the issue of employment subsidies, see OECD (2010). In-work benefits are
another possible measure to boost participation and employment of marginal groups in the labour force.
However, they are not discussed here because their effects take time to materialise. More broadly, in the
short run labour supply elasticities are likely to be lower than labour demand elasticities, making policies
(such as hiring subsidies) that act on labour demand more effective job recovery measures.
28. While budgetary considerations might also suggest restricting eligibility to the unemployed, this could
reduce the impact of the scheme by reducing the pool of potential candidates for employers and thereby
take-up rates.
29. Austria, Belgium, Denmark, Greece, Poland and Turkey increased replacement rates. Canada, France,
Japan, Portugal and Switzerland increased the duration of unemployment benefits. Finland and the United
States did both. The Czech Republic and Poland permanently reduced the duration of benefits.
30. See Bassanini and Duval (2006); Blanchard and Wolfers (2000); Furceri and Mourougane (2009);
Gianella, Koske, Rusticelli and Chatal (2008).

OECD ECONOMIC OUTLOOK PRELIMINARY EDITION
294
employment, while their benefits are tied to their past wages (Ljungvist and
Sargent, 1998). Crisis-related measures in this area should therefore be
reconsidered as the recovery strengthens and vacancy rates increase,
especially in countries where benefits were high to start with (Figure 5.17).
On current plans, most of the recent measures are due to come to an end
during 2010 (Canada, United States). However, they are planned to last
longer in Japan and to be permanent in Belgium and Turkey.
Figure 5.17. Income support in OECD countries in 2007
Average net replacement rates over a 5-year unemployment spell
Note: The average of the replacement rate in the first five years of unemployment is shown. See (2009d) for further details on how these averages are calculated. Housing-related benefits are those available to families living in rented accommodation with rent plus other housing costs (e.g. utility bills) assumed to equal 20 per cent of the average wage. In some countries, housing-related support is covered by social assistance payments instead. Social assistance in the United States also includes the value of a near-cash benefit (Food Stamps).Net replacement rates are evaluated for a prime-age worker (aged 40) with a 'long' and uninterrupted employment record. They are averages over four different stylised family types (single and one-earner couples, with and without children) and two earning levels (67% and 100% of average full-time wages).
Source: OECD (2009d); and OECD tax-benefit models (www.oecd.org/els/social/workincentives).
... while extensions in
their coverage could be
made permanent
About half of actions taken in the area of unemployment benefits have
broadened eligibility criteria, expanding coverage among the working-age
population, which in some cases (e.g. Spain, Japan) was weak because of
substantial labour market dualism. Indeed non-standard workers, such as
temporary or part-time workers, tend to have less access to unemployment
benefits. These recent extensions of coverage could be made permanent
insofar as the same activation requirements are applied strictly to both
standard and non-standard workers, and provided they are not ad hoc and
apply in a consistent manner across different categories of workers. On
current plans, wider eligibility criteria will become permanent in Finland,
Japan and Korea.

OECD ECONOMIC OUTLOOK PRELIMINARY EDITION
295
Recent increases in
ALMP spending should
in general be maintained
for a while
Most countries responded to the surge in the number of jobseekers
registered with Public Employment Services (PES) from 2008 to 2009 by
increasing PES staff levels, with net increases of 10% or more over the past
three years in Germany, Hungary, Japan, Mexico, Poland and Turkey.31
Increased staffing mitigated the rise in the caseload compared with past
crises but it did not prevent it altogether (e.g. the caseload rose by around
50% or more in the United Kingdom, Czech Republic, New Zealand and
Mexico), with Germany and Japan being noticeable exceptions.32
Most
countries – particularly those with low initial spending – have also
increased resources devoted to ALMP measures including training, work
experience and business start-up incentives, or support for apprentices
(Figure 5.18). Previous OECD analysis suggests that well-designed ALMP
expenditures can mitigate the adverse employment effects of high and long-
lasting unemployment benefits, and damp hysteresis effects.33
Therefore,
even as they move to consolidate public budgets governments should as far
as possible maintain the capacity to provide adequate case management and
re-employment services for job seekers.34
Unlike many labour-demand
measures, recession-related ALMPs (e.g. job-search assistance and
training) are currently due to continue well into 2011 in most countries.
Figure 5.18. Discretionary spending on active labour market programmes
Average annual planned additional expenditure in response to the economic downturn, in per cent of GDP¹
1. Average annual expenditure for 2008-10. Analysis limited to countries for which spending estimates could be obtained.
Denmark and Switzerland are not shown because ALMP expenditure automatically rises with unemployment in these countries, greatly limiting the need for discretionary increases.
Source: OECD calculations based on the OECD Labour Market Programmes Database and responses to the 2009 OECD/EC questionnaire.
31. Includes equivalent private-sector employment services providers in countries where PES activities are
contracted out to private providers (e.g. Australia).
32. Growth in the caseload is proxied by the growth of the ratio of registered jobseekers (or registered
unemployed in Poland and the Czech Republic) to total PES staff.
33. See Bassanini and Duval (2006); Duval and Vogel (2008).
34. A constraint in this regard is that it is difficult to rapidly expand job-search support and training services
while maintaining quality. An increased use of private sector employment service providers may partly
address this problem if service contracts are well designed in order to minimise gaming and encourage
employment outcomes in line with public objectives (OECD, 2005).
OECD ECONOMIC OUTLOOK PRELIMINARY EDITION
296
… as well as the greater
intensity of interventions
by the PES and emphasis
on job seeker
responsibilities…
Governments have also made efforts to strengthen core activation
measures such as job-search support and obligations or work-availability
requirements, although not all such measures were taken explicitly in
response to the crisis. In some countries, assessment and intake procedures
for job-search assistance have been brought forward in the unemployment
spell (Finland), even helping some workers into new jobs before they have
lost their current job (United Kingdom). Immediate activation into training
or work-experience places is being implemented for youth directly upon
registering for social assistance (Netherlands, Denmark). Jobseekers are
now denied benefits if, for no justified reason, they refuse to accept a
suitable job (Poland) and they are required to look for jobs in wider
geographical areas (Finland). Such measures should be maintained even in
the present weak labour market conditions, as they strengthen the
effectiveness and credibility of the “mutual obligations” principle that is the
cornerstone of a well-functioning activation system (OECD, 2009d).
The ALMP mix could
also be moved...
However, in the current context, an important part of improving
activation is to calibrate the range and relative intensity of ALMPs to take
account of the relative effectiveness of these policies when vacancies are
limited and competition among job seekers is high. A priority is to ensure
that job losers do not become disconnected from the labour market. To this
end, core components of activation, such as a personal re-employment plan
and regular meetings with case-managers and obligations to actively search
for jobs, should be maintained for all job seekers, even if higher case-loads
and capacity constraints mean reducing the intensity of this type of measure
for some individuals. As employers are aware that the proportion of
well-qualified job seekers in total unemployment is higher than in normal
times (OECD, 2009d), and in an environment of relatively low job
openings, the PES may have to focus temporarily on the most employable
job seekers to avoid losing credibility.
… towards training… For those harder-to-place job seekers, job-search assistance may have
to be combined with training opportunities. In a number of European
countries as well as in Australia and New Zealand, new training places
provided during the crisis have focused more specifically at those at risk
such as youths and older workers, or on sectors judged as having high
potential job creation prospects (Australia, Austria, Belgium, Switzerland,
United Kingdom). Indeed in a recession, the lower opportunity cost of time
spent training tips the cost-benefit analysis more in favour of such
programmes.35
In addition, recessions may result in accelerated structural
change, increasing the requirement for workers to shift occupations and
therefore the need for training. At the same time, high costs for training and
the risk of compromising quality counsel against a major expansion of
training slots. Up-scaling existing programmes rather than creating them
35. Based on German data, Lechner and Wunsch (2009) find for example that the negative impact of
undergoing training on job-search intensity is smaller, and the positive long-run employment effects are
larger when unemployment is higher. Conversely, McVicar and Podivinsky (2007) find in the context of
the UK New Deal for Young People that ALMPs are less effective when the local unemployment rate is
higher.

OECD ECONOMIC OUTLOOK PRELIMINARY EDITION
297
from scratch is likely to be the most effective way to quickly increase
places (OECD, 2009d). Also, with previous experience in Europe showing
that immigrants suffer disproportionally in recessions (OECD, 1999; 2003),
integration programmes need to be maintained, and immigrants enabled to
profit equally from ALMPs.
… while direct public job
creation should be used
only as a last resort
option
A number of OECD countries have directly created jobs in the public
sector during the crisis. In several cases, these measures are due to continue
somewhat longer than other initiatives to support labour demand (until
early 2012 in Japan and indefinitely in Mexico). Past experience with
public-sector job creation is not encouraging – these programmes are costly
and tend to have very little success in helping unemployed people get
permanent jobs in the open labour market. However, in a long and deep
recession, where there are few vacancies relative to job seekers, they might
provide a way of keeping harder-to-place job seekers connected to the
labour market (Gregg and Layard, 2009), and in that respect they may be
seen as a back stop to activation, provided they remain highly targeted and
are unwound rapidly once hiring picks up.
The strength of the jobs
recovery will also depend
on the broader
institutional
frameworks…
More broadly, the strength of the jobs recovery will likely depend on
the entire range of labour and product market institutions and the
interactions between them. In the current recession, stringent EP and PMR
may have dampened the initial labour market impact of the shock, but are
also likely to delay the return to pre-recession unemployment levels going
forward.36
A rebalancing of employment protection legislation in current
circumstances, focusing on lower protection for regular workers in
countries in which such protection is extensive, whilst improving security
for temporary workers in countries in which their protection is relatively
weak, could, if combined with further reforms to make activation more
effective, enhance both labour market efficiency and – by addressing
dualism – equity.37
In a number of OECD countries including most of
continental Europe and Japan, reducing EP for regular contracts (at least for
new hires) and/or PMR in industries with strong short-term job creation
potential such as retailing and professional services could make the
recovery more job-rich, while also boosting medium-run economic growth
(Table 5.3).
36. For some OECD empirical evidence, see Bassanini and Duval (2006) and Duval and Vogel (2008),
Consistent with these findings and also with those of Blanchard and Wolfers (2000), Furceri and
Mourougane (2009) find that stringent EPL and PMR amplify the impact of major downturns on structural
unemployment. In the case of EPL, such an effect had long been identified as a possibility in economic
theory (see e.g. Blanchard and Summers, 1986). Recent OECD work also suggests that overly stringent EP
exacerbates the impact of recessions on long-term participation (OECD, 2010d), possibly by hampering job
hiring in the recovery phase (OECD, 2004; Cazes and Nesporova, 2004).
37. One option that could both alleviate the political economy obstacles to permanent employment protection
(EP) reform and magnify the short-term employment impact of reform may be to restrict permanent EP
relaxation to new hires only. By cutting hiring costs while leaving firing costs unchanged, such a reform
could deliver a temporary, so-called “honeymoon effect” on employment (Boeri and Garibaldi, 2007).
However, two major drawbacks would include the possibility of a temporary increase (before a subsequent
decline) in labour market dualism and reduced incentives to labour mobility for those workers with the
“old” permanent contracts.

OECD ECONOMIC OUTLOOK PRELIMINARY EDITION
298
…including policies that
directly affect wage
formation
Other policy and institutional reforms that directly affect wage
formation could, where needed, facilitate real wage adjustment, thereby
promoting job creation and a return of unemployment to pre-recession
levels over the medium run. Possible measures may include for instance
reconsidering administrative extensions of, and facilitating opt-out clauses
from collective agreements, as well as containing increases in minimum
wages where these are already high. However, given their potential short-
term deflationary effects, reforms in these areas may have to proceed
carefully and wait until deflationary risks have clearly abated.
Table 5.3. Policy reforms to reduce unemployment in the long-run
In the average OECD country, the unemployment rate can be reduced by 1 percentage point…
- by reducing the average unemployment benefit replacement rate by 8 percentage points
or
- by reducing the overall tax wedge on labour income by 3.5 percentage points
or
or
- by raising spending on active labour market policies per unemployed worker (as a share of GDP per capita) to the Swedish level
… or by several percentage points through a combination of the above policy reforms
Source: OECD(2007).
- through product market liberalisation of the same order of magnitude as that which has taken place in the average OECD country
over the past ten years
Note: Based on empirical analysis carried out in the context of the reassessment of the OECD Jobs Strategy (2007). These are average long-run effects; the short-term effect in the recovery period may differ substantially. Moreover, no account is made for interactions between policy measures, which implies that the impact of a given reform may vary significantly depending on the underlying institutional environment of each country.
Policy options to alleviate labour market withdrawal of vulnerable groups
Action is needed to
maintain the labour
market ties of vulnerable
groups
Policy reforms to tackle unemployment hysteresis could go a long way
towards minimising worker discouragement and the risk of persistent
declines in participation. Nevertheless, the magnitude of the shock in some
countries, the risk of a jobless recovery in others, and available evidence
from past recessions all suggest that traditionally vulnerable groups such as
older workers, low-skilled youths or migrants could be at risk of permanent
labour force withdrawal. A range of policies could help maintain their ties
to the labour market.
Governments should not
relax access to early
retirement…
Governments need first to avoid succumbing to the temptation to open
pathways to early retirement (Blöndal and Scarpetta, 1999; Casey et al.,
2004) that were used in the past to ease pressure on the labour market
during downturns. Such actions could reduce labour force participation not
only temporarily but also more durably if they became entrenched and led
to permanent changes in retirement habits and norms. Damaging measures
in this regard would include, for example, looser enforcement of job-search
and health criteria in unemployment and disability benefit systems,
respectively, which, along with the financial disincentives to continued
work embedded into such schemes, have been found to have lowered

OECD ECONOMIC OUTLOOK PRELIMINARY EDITION
299
effective retirement ages in the aftermath of past recessions (OECD,
2010d). So far in this recession, the good news is that governments have
not given in to this temptation. For instance, while several OECD countries
have raised the level and/or duration of unemployment benefits, no specific
measures have been taken for older workers (OECD, 2010b).
… and even consider
tightening it to deter
over-use
The recession suggests that governments should go further and tighten
eligibility criteria because previous experience shows that following a
downturn, existing lax structural policy settings are exposed to pressure on
a greater scale. In Finland, for example, although an early retirement
scheme was in place years before the recession of the early 1990s, its
generosity was largely exploited by both employers and workers during the
course of the recession.
A pick-up in disability
benefit recipiency also
needs to be alleviated…
Tightening eligibility criteria to schemes that encourage labour market
withdrawal has proved difficult, however. Even during a period of
generally strong economic growth, more than half of OECD countries,
including Sweden, Norway and all the English-speaking ones, saw a
substantial increase in disability-benefit recipient rates over the past decade
(Figure 5.19, OECD, 2009e). The shift to disability benefits is not confined
to older workers, with the numbers of beneficiaries in the 20-34 age group
doubling in some countries, increasingly due to difficult-to-verify mental
health issues. Labour market weakness following the recession may well
exacerbate these trends. For instance, available evidence for the
Netherlands, the United Kingdom and the United States points to greater
inflows to disability schemes in the wake of recessions (Nickell & van
Ours, 2000; Autor and Duggan, 2003). Limiting new inflows into disability
schemes is all the more important as the exit rate is extremely low. In most
countries for which data are available, only 1-2% of all disability
beneficiaries leave annually for reasons other than death or retirement.
… through gate-keeping
and other structural
policy measures
Strict health criteria have to be enforced to alleviate increases in
disability benefit recipient rates going forward. Structural reforms should
also be undertaken where needed, including a shift from an assessment of
whether someone is incapable of work at all towards an appraisal of how
much work capacity people still retain or could recover with rehabilitation.
It is also important to move from one-off medical assessments to a more
comprehensive periodic review of work capacity. The increase in mental
illness cases makes it important to ensure that assessments are suited for
this specific type of claim, as well as to carry out regular reviews since such
cases are often more curable or temporary in nature. Greater monitoring of
long-term sickness leave, which experience shows is often a pathway to
permanent disability benefits, is also important. Imposing obligations on
new disability beneficiaries such as mandatory vocational rehabilitation
should also be considered to reduce the probability of a permanent shift to
benefits (OECD, 2009e).38
38. For further discussion of disability policies aimed at minimising labour force withdrawal, see
OECD (2009e).

OECD ECONOMIC OUTLOOK PRELIMINARY EDITION
300
Figure 5.19. Disability benefit recipient rates are high and still increasing in many countries
Disability benefit recipients in percent of the population aged 20-64 in 28 OECD countries
Note: OECD refers to the unweighted average of the 27 countries.
1. 2004 for France; 2005 for Luxembourg; 2006 for Denmark, Italy, Japan, the Slovak Republic and the United States.
2. 1996 for Belgium and Canada; 1999 for the Netherlands; 2000 for Hungary and Italy; 2001 for Ireland; 2003 for Japan and 2004 for Poland; 1995 for all other countries.
Source: OECD (2009e). Data provided by national authorities.
The “scarring” effects of
this downturn on youths
could be strong…
Youth unemployment is more responsive to the business cycle, and
especially for youth lacking basic education, it may have “scarring” effects
i.e. long-lasting effects on incomes and the risk of future unemployment
(OECD, 2009f). On average, a spell of youth unemployment at entry in the
labour market has been found to have more serious impacts on incomes
than unemployment later in life (Ellwood, 1982; Arulampalam, 2001).
Unemployment immediately after graduation from college is associated
with substantial, permanent earnings losses (Oreopoulos et al., 2008;
Gartell, 2009). Also, recessions have been found to severely reduce youth
labour force participation. This reflects in part increased education
programme enrolments and attainments, and indeed past experience
suggests that youth participation declines are more likely where there is
easier access to post-secondary education. The welfare implications are not
obvious, since higher levels of human capital might lead to increased total
factor productivity and higher future levels of income.
… making it important to
strengthen their labour
market attachment
Governments should act to reduce the impact of the current recession
on youth. In addition to extended job-search assistance for those that are
job-ready and maintaining the mutual obligation for youth to actively
search for work and accept suitable job offers, governments should
consider putting greater emphasis on a combined training and work
approach to help maintain labour market attachment, especially for those
youth that are having major difficulties finding a job (Scarpetta et al.,
2010). Experience shows that work/training opportunities such as
apprenticeships and internships facilitate labour market entry of youth
(OECD, 2009f), although scaling up such schemes under short notice could

OECD ECONOMIC OUTLOOK PRELIMINARY EDITION
301
be challenging. Strengthening the skills and labour market experience of
low-skilled youths could be especially effective if combined with reducing
the cost of employing them where it is high, and reducing the gap between
EP for temporary and permanent contracts to smooth the transition of
newcomers. Countries with strong apprenticeship systems and/or less-
regulated labour markets – e.g. Germany and the United Kingdom,
respectively – have the largest shares of youth that spend most of their time
in employment (Quintini and Manfredi, 2009).

OECD ECONOMIC OUTLOOK PRELIMINARY EDITION
302
APPENDIX 5.A1.
Table 5.A1. Quarterly Hours Worked Data Sources
Provider Frequency Starts Description
Australia Australian Bureau of Statistics Monthly Jan-78 Aggregate weekly hours worked
Austria Statistics Austria Quarterly Mar-94 Hours actually worked per quarter and per employee
Belgium Eurostat Quarterly Mar-99 Average number of hours actually worked in the reference
week
Canada Statistics Canada Monthly Jan-76 Average actual hours
Denmark Statistics Denmark Quarterly Mar-90 Aggregate hours worked seasonally adjusted
Finland Statistics Finland Quarterly Mar-89 Actual hours worked monthly seasonally adjusted
France Datastream Quarterly Mar-78 Aggregate actual hours worked (excl. agriculture)
Germany Federal Statistics Office Quarterly Mar-70 Actual hours worked per employed person, 1970 -1990 West
Germany, 1991-2009 Germany.
Hungary Eurostat Quarterly Mar-99 Average number of hours actually worked in the reference
week
Ireland Eurostat Quarterly Jun-99 Average number of hours actually worked in the reference
week
Italy Eurostat Quarterly Mar-98 Average number of hours actually worked in the reference
week
Japan Statistics Japan Monthly Jan-68 Aggregate weekly hours of work (non-agricultural industries)
Korea Datastream
(National Statistical Office)
Monthly Jul-82 Hours worked
Luxembourg Eurostat Quarterly Mar-03 Average number of hours actually worked in the reference
week
Netherlands Eurostat Quarterly Mar-00 Average number of hours actually worked in the reference
week
New Zealand Statistics New Zealand Quarterly Mar-89 Total paid hours seasonally adjusted
Norway Statistics Norway Quarterly Mar-96 Aggregate hours worked, National Accounts
Poland Bank of Poland (1992-2006)
Eurostat (2006-2009)
Quarterly Jun-92 Average weekly hours
Portugal National Statistics Institute
1992-1998/ Eurostat 1998-2009
Quarterly Jun-92 Average number of hours actually worked in the reference
week
Slovak Republic Eurostat Quarterly Mar-98 Average number of hours actually worked in the reference
week
Spain National Statistics Institute
1987-1997/ Eurostat 1998-2009
Quarterly Jun-87 Average number of hours actually worked in the reference
week
Sweden Statistics Sweden Quarterly Mar-93 Aggregate hours worked
United
Kingdom
Office of National Statistics Quarterly Mar-71 Total actual weekly hours worked (millions)
seasonally adjusted
United
States
Bureau of Labour Statistics Monthly Jan-64 Average weekly hours of production and nonsupervisory
workers on private nonfarm payrolls, seasonally adjusted
1. Unless otherwise noted, the series are seasonally adjusted in Eviews using X-12 ARIMA.
2. Where applicable, aggregate hours series are converted to average hours series per employee by dividing aggregate hours by total employment.
3. Total employment is sourced from the OECD Economic Outlook Database
4. Where applicable, the quarterly series is calculated by taking the average of hours worked in the 3 months of that quarter.
5. Unless otherwise noted, the hours worked series are the average of or the aggregate of hours worked by all employees
6. Where necessary, series are backcast using the growth rates of the earlier series.
Source: National authorities.

OECD ECONOMIC OUTLOOK PRELIMINARY EDITION
303
BIBLIOGRAPHY
Arulampalam, W. (2001), “Is Unemployment Really Scarring? Effects of
Unemployment on Wages”, Economic Journal, Vol. 111, pp. 585-
606.
Autor, D. and M. Duggan (1993), “The Rise in Disability Rolls and the
Decline in Unemployment”, The Quarterly Journal of Economy,
Vol. 118.
Baldwin, R. (2009), The Great Trade Collapse, Electronic Book
downloadable at www.voxeu.org/index.php?q=node/4297.
Bassanini, A. and R. Duval (2006), “Employment Patterns in OECD
Countries: Reassessing the Role of Policies and Institutions”, OECD
Economics Department Working Papers, No. 486, Paris.
Blanchard, O. and L. Summers (1986), “Hysteresis and the European
Unemployment Problem”, in S. Fischer (ed.), NBER
Macroeconomics Annual, Vol. 1, Paris.
Blanchard, O. and J. Wolfers (2000), “The Role of Shocks and Institutions
in the Rise of European Unemployment: The Aggregate Evidence”,
The Economic Journal, Vol. 110.
Blöndal, S. and S. Scarpetta (1999), ”The Retirement Decision in OECD
Countries”, OECD Economics Department Working Papers,
No. 202, Paris.
Boeri, T. and P. Garibaldi (2007),“Two Tier Reforms of Employment
Protection: A Honeymoon Effect?”, The Economic Journal,
Vol. 117.
Casey, B.H. (2004), “The OECD Jobs Strategy and the European
Employment Strategy: Two Views of the Labour Market and the
Welfare State”, European Journal of Industrial Relations, Vol. 10.

OECD ECONOMIC OUTLOOK PRELIMINARY EDITION
304
Cazes, S. and A. Nesporova (2004), “Labour Markets in Transition:
Balancing Flexibility and Security in Central and Eastern Europe”,
Revue de L’OFCE.
Cheung, C. and S. Guichard (2009), “Understanding the World Trade
Collapse”, OECD Economics Department Working Papers, No. 729.
Coile, C. and P.B. Levine (2009), “The Market Crash and Mass Layoffs:
How the Current Economic Crisis May Affect Retirement”, NBER
Working Paper No. 15395.
Duval, R. (2003), “The Retirement Effects of Old-Age Pension and Early
Retirement Schemes in OECD Countries”, OECD Economics
Department Working Papers, No. 370, Paris.
Duval, R. and L. Vogel (2008), “Structural Policies and Economic
Resilience to Shocks”, OECD Economic Studies, 44, Paris.
Ellwood, D. T. (1982), “Teenage Unemployment: Permanent Scars
Temporary Blemishes”, in Freeman R.B. and D. A. Wise (eds.) The
Youth Labour Market problem: Its Nature, Causes and
Consequences, University Chicago Press, pp. 349-390, Chicago.
Elsby, M., B. Hobijn and A. Sahin (2010), „The Labor Market in the Great
Recession”, Federal Reserve Bank of San Francisco Working Paper,
No. 2010-07.
Furceri, D. and A. Mourougane (2009), “How Do Institutions Affect
Structural Unemployment in Times of Crisis?”, OECD Economics
Department Working Papers, No. 730.
Gianella, C., I. Koske, E. Rusticelli and O. Chatal (2008), “What Drives the
NAIRU? Evidence from a Panel of OECD Countries”, OECD
Economics Department Working Papers, No. 649.
Gartell, M. (2009), “Unemployment and Subsequent Earnings for Swedish
College Graduates: a study of Scarring Effects”, Working Paper 10,
IFAU, Uppsala.
Gregg, P. and R. Layard (2009), “A Job Guarantee,” mimeo, Center for
Economic Performance, London School of Economics. Available at
http://cep.lse.ac.uk/textonly/_new/staff/layard/pdf/001JGProposal-
16-03-09.pdf.
Guichard, S. and E. Rusticelli (2010), “Assessing the Impact of the
Financial Crisis on Structural Unemployment in OECD Countries”,
OECD Economics Department Working Papers, Paris, forthcoming.

OECD ECONOMIC OUTLOOK PRELIMINARY EDITION
305
Gustman, A.L., T.L. Steinmeier, N. Tabatabai (2010),“What the Stock
Market Decline Means for the Financial Security and Retirement
Choices of the Near-Retirement Population”, Journal of Economic
Perspectives, Vol. 24.
IAB (Institut für Arbeitsmarkt- und Berufsforschung)(Institute for
Employment Research)(2009), “Die Krise wird deutliche Spuren
hinterlassen”, IAB Kurzbericht, 20/2009.
Krueger, A.B. and A. Mueller (2010), “Job Search and Unemployment
Insurance: New Evidence from Time Use Data”, Journal of Public
Economics, Vol. 94.
Lalive, R. (2008), “How Do Extended Benefits Affect Unemployment
Duration? A Regression Discontinuity Approach”, Journal of
Econometrics, Vol. 142.
Lechner, M. and C. Wunsch (2009), “Are Training Programs More
Effective When Unemployment is High?”, Journal of Labour
Economics, Vol. 27.
Ljungvist, L. and T. Sargent (1998), “The European Unemployment
Dilemna”, Journal of Political Economy, Vol. 106.
Llaudes, R. (2005), “The Phillips Curve and Long-term Unemployment”,
February, ECB Working Paper, No. 441.
McVicar, D. and J.M. Podivinsky (2007), “Does the Impact of Active
Labour Market Programs Depend on the State of the Labour Market?
The Case of the UK New Deal for Young People”, Discussion paper,
No. 0704, University of Southampton.
Mosley, H. (1995), “Short-time work Schemes in France, Germany, Italy,
and Spain: from Cyclical to Structural Intervention”, InforMISEP,
No. 52/ Winter 1995.
Mosley, H, and T. Kruppe (1996), “Short-time Work in Structural
Adjustment: European Experience”, European Journal of Industrial
Relations, Vol. 2.
Nickel, S. and J. van Ours (2000), “Why has Unemployment in the
Netherlands and the United Kingdom Fallen so Much?”, Canadian
Public Policy, Vol. 26.
OECD (1999), Trends in International Migration, Paris.
OECD (2003), Trends in International Migration, Paris.
OECD (2004), Employment Outlook, Paris.

OECD ECONOMIC OUTLOOK PRELIMINARY EDITION
306
OECD (2005), Employment Outlook, Paris.
OECD (2007), Going for Growth 2007, Paris.
OECD (2009), “The Jobs Crisis: What are the implications for Employment
and Social Policy – Further Material”, Paris, Available only online at
www.oecd.org/els/employment/outlook.
OECD (2009a), Pensions at a Glance, Paris.
OECD (2009b), Pension Markets in Focus, October, Paris.
OECD (2009c), Pensions and the Crisis: How Should Retirement-Income
Systems Respond to Financial and Economic Pressure?, Paris,
www.oecd.org/dataoecd/10/26/43060101.pdf.
OECD (2009d), Employment Outlook, Paris.
OECD (2009e), Sickness, Disability and Work, Keeping on Track in the
Economic Downturn, Paris,
www.oecd.org/dataoecd/42/15/42699911.pdf.
OECD (2009f), “Helping Youth to Get a Firm Foothold in the Labour
Market”, Paper for the Meeting of the Employment, Labour and
Social Affairs Committee at Ministerial Level.
OECD (2010), Employment Outlook, forthcoming, Paris.
OECD (2010a), Labour Markets and the Crisis, OECD Economics
Department Working Papers, No. 756, Paris.
OECD (2010b), Going for Growth 2010, Paris.
Oreopoulos, P., T. von Wachter and A. Heisz (2008), “The Short and Long-
Term Career Effects of Graduation in a Recession: Hysterisis and
Heterogeneity in the Market for College Graduates”, Discussion
Paper, No. 3578, IZA, Bonn.
Quintini, G. and T. Manfredi (2009), “Going Separate Ways?
School-to-Work Transitions in the United States and Europe”, OECD
Social, Employment and Migration Working Papers, No. 90, Paris.
Scarpetta, S. A. Sonnet and T. Manfredi (2010), “Rising Youth
Unemployment during the Crisis: How to Prevent Negative Long-
Term Consequences on a Generation”, OECD Social, Employment
and Migration Papers, No. 106, Paris.

OECD ECONOMIC OUTLOOK PRELIMINARY EDITION
307
Van Audenrode, M.A. (1994), “Short-Time Compensation, Job Security,
and Employment Contracts: Evidence from Selected OECD
Countries”, Journal of Political Economy, Vol. 102.
Vroman, W. and V. Brusentsev (2009), “Short-Time Compensation as a
Policy to Stabilise”, Department of Economics, University of
Delaware Working Paper, 2009-10.