Embed Size (px)
Citation preview
209
Chapter 5
The Central Asian Republics
By Ram Upendra Das
Introduction
Regional economic integration has gained prominence in recent years as a mechanism to
achieve various objectives such as market access, enhancement of manufacturing
capabilities, the creation of regional value chains (RVCs) and, in turn, employment generation
and poverty alleviation. In addition, the recent initiatives created by the Trans-Pacific
Partnership (TPP) and the Trans-Atlantic Trade and Investment Partnership (TTIP) seek
not only to take advantage of Asian economic dynamism but also to consolidate the
leading economic forces of the United States of America and the European Union. This is
corroborated by the fact that while TPP members include the dynamic Asian economies,
the TTIP is an attempt to consolidate the economic might of the Western world by forging
partnership agreements between the United States and the European Union. The European
Union and Central Asia relations have been progressing under the Strategy for a New
Partnership since 2007. The Customs Union (CU) and the Single Economic Space (SES)
among Belarus, Kazakhstan and the Russian Federation were replaced by the Eurasian
Economic Union (EAEU), which came into effect on 1 January 2015. The EAEU comprises
Armenia, Belarus, Kazakhstan, Kyrgyzstan and the Russian Federation.
On the other hand, Asian economic regionalism is characterized by private sector-driven
production fragmentation and RVCs as well as the phenomenon of variable geometry. The
latter is explained in terms of various Pan-Asian economic integration initiatives expressed
over time, i.e., the Asia-Pacific Trade Agreement (APTA), ASEAN+1, ASEAN+3, ASEAN+6,
and the East Asia Summit. APTA is the oldest of these initiatives. More recently, the
ASEAN+6 process is being consolidated with the launch of negotiations on the Regional
Comprehensive Economic Partnership (RCEP).
In addition, several of the East and South-East Asian countries are now also part of the
interregional TPP, in which the United States plays a predominant role. This is clearly an
effort by the Americas to tap into the economic dynamism of the Asian region. More
recently, China’s suggestion for another mega-grouping viz. the Free Trade Area of the
Asia-Pacific (FTAAP), under the aegis of the Asia-Pacific Economic Cooperation (APEC)
forum, is yet another development that makes the trends towards regionalism in the
Asia-Pacific region more pronounced. These examples serve to highlight the imperative of
evolving a Pan-Asian economic integration strategy, fostered through strong and efficient
institutional mechanism.
Overall, one implication of the above trends in Asia is that they are challenging one of the
oldest groupings, i.e., APTA. One of the merits of APTA is that it includes some of the most
major dynamic economies of Asia such as China, India and the Republic of Korea. If APTA
210
fails to take advantage of its dynamic membership it will be marginalized by a grouping
such as the RCEP, since it also includes these three economies as members. However,
another merit of APTA is that it has an open membership.
The outcome of the above Asian economic configurations is the importance of exploring
whether APTA can eventually evolve into a Pan-Asian economic grouping, which could be
by expanding the membership of APTA to cover other regions of Asia, in order to make the
grouping the most representative of the Asia-Pacific region.
Available researches suggest that the Central Asian Republics (CARs) have enormous
potential to benefit from regional economic integration (ADB, 2006; Das, 2012). On the
other hand, existing Asian initiatives have not been able to include them in any meaningful
regional economic integration processes, with a few exceptions. This chapter assesses the
potential benefits from accession to APTA by the CARs as well as the Participating States
of APTA and possible strategies for expanding APTA membership to the CARs.
A. Macroeconomic performance
of the CARs
The CARs are rich in natural and human resources but quite diverse in terms of their
stages of development. This is most evident in terms of their levels of GDP; for example,
the GDP of Kazakhstan is $231 billion while the GDP of Kyrgyzstan is $7.22 billion. While
Tajikistan’s GDP is also very low, Uzbekistan and Turkmenistan have GDP in the medium
range. The varying level of development among Central Asian economies is an aspect that
stands out quite clearly. However, with the exception of Kyrgyzstan, in terms of GDP
growth, all the other CARs have recorded impressive and high growth rates. With regard to
purchasing power, the CARs display a wide range of per capita GDP, but on average they
are characterized by good market size. Similarly, except for Kyrgyzstan, per capita GDP is
rising at a healthy rate in these countries.
In terms of the structure of CARs economies, the services sector is the most dominant
sector, except in the case of Turkmenistan, where manufacturing has the highest share in
GDP. This is important in the light of developments made in APTA to which subsequent
sections of this chapter revert.
Manufacturing also remains a sector of significance in the GDP of other CARs. What is
disturbing to note in the macroeconomic indicators is a very high inflation rate, except in
the case of Turkmenistan. Savings and investment ratios are moderate, suggesting further
room for improvement that can have growth-inducing effects in future.
The external sector shows very high trade openness; however, with the exception of
Kazakhstan, the absolute level of trade is meagre with total trade value of $116 billion in
2013. However, a much clearer picture of FDI inflows would be provided by the cumulative
FDI in each of these countries. For the same year, FDI inflows appear important, except in
Tajikistan.
211
Overall, the macroeconomic context suggests that the Central Asian economies have
tremendous scope for development through higher savings and investment rates as well
as through greater trade and FDI integration. This is supported by their reasonably good
social indicators pertaining to health and education. The only worrying factor is the high
rates of inflation in these economies; apart from that, the macroeconomic context makes
these economies quite amenable to regional economic integration, which can help them to
achieve their growth and developmental objectives.
B. Trade in goods: Structure, direction
and trade policies
1. Structure and directions of trade
(a) Structure
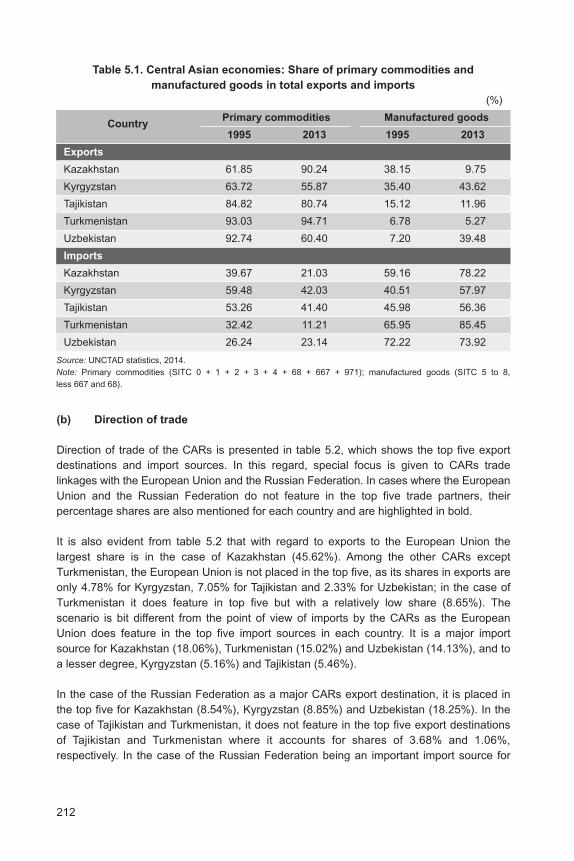
Since the focus of this study is on APTA’s integration with Central Asia, the analysis of the
structure of exports and imports in each of the CARs is relevant. This is captured in
table 5.1, which shows that the share of primary commodities in the export basket of
almost all the countries in Central Asia is very high. A notable feature is that the share or
primary commodities actually increased between 1995 and 2013 in the case of Kazakhstan
and Turkmenistan, while the share declined in the cases of Kyrgyzstan, Tajikistan and
Uzbekistan. The shares have remained high, most notably in the case of Turkmenistan.
Together with the structure of GDP in these countries, in which agriculture occupies the
least share of GDP while industrial and services sectors remain significant, such a high
percentage of primary commodities in the export basket of these economies highlights the
phenomenon of production-export mismatch.
Further, the import basket of CARs (table 5.1) shows that the share of manufactured
goods in total imports is high. What is more, it increased between 1995 and 2013. These
figures point to another notable feature of these economies in terms of high dependence of
imported manufactured goods. This implies that these economies need to create a more
diversified manufacturing base through an industrialization policy helped by regional
cooperation in the areas of trade and FDI by exploiting the trade-investment nexus.
The trade structures of the CARs provide three important insights – production-trade
mismatches, a less diversified manufacturing base and adverse terms of trade due to the
fact that exports mainly comprise primary products whereas imports largely consist of
manufactured products.
212
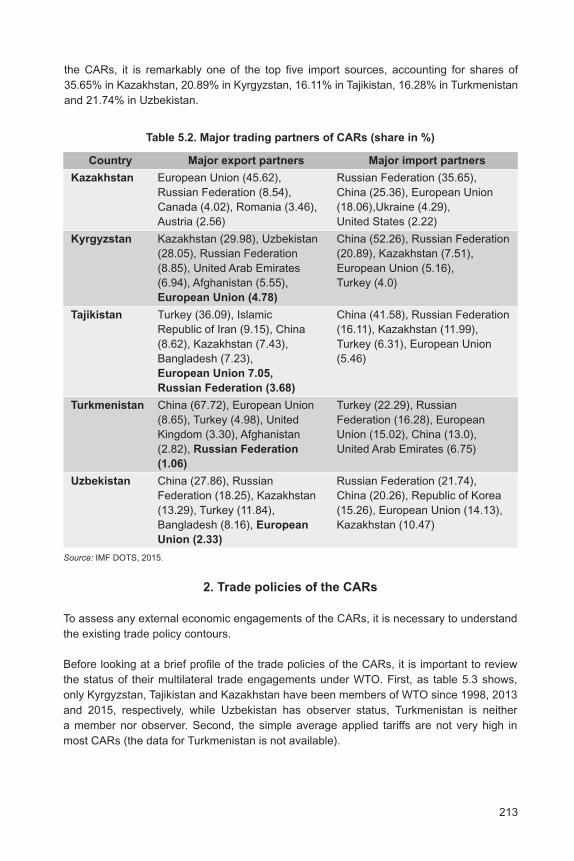
(b) Direction of trade
Direction of trade of the CARs is presented in table 5.2, which shows the top five export
destinations and import sources. In this regard, special focus is given to CARs trade
linkages with the European Union and the Russian Federation. In cases where the European
Union and the Russian Federation do not feature in the top five trade partners, their
percentage shares are also mentioned for each country and are highlighted in bold.
It is also evident from table 5.2 that with regard to exports to the European Union the
largest share is in the case of Kazakhstan (45.62%). Among the other CARs except
Turkmenistan, the European Union is not placed in the top five, as its shares in exports are
only 4.78% for Kyrgyzstan, 7.05% for Tajikistan and 2.33% for Uzbekistan; in the case of
Turkmenistan it does feature in top five but with a relatively low share (8.65%). The
scenario is bit different from the point of view of imports by the CARs as the European
Union does feature in the top five import sources in each country. It is a major import
source for Kazakhstan (18.06%), Turkmenistan (15.02%) and Uzbekistan (14.13%), and to
a lesser degree, Kyrgyzstan (5.16%) and Tajikistan (5.46%).
In the case of the Russian Federation as a major CARs export destination, it is placed in
the top five for Kazakhstan (8.54%), Kyrgyzstan (8.85%) and Uzbekistan (18.25%). In the
case of Tajikistan and Turkmenistan, it does not feature in the top five export destinations
of Tajikistan and Turkmenistan where it accounts for shares of 3.68% and 1.06%,
respectively. In the case of the Russian Federation being an important import source for
Table 5.1. Central Asian economies: Share of primary commodities and
manufactured goods in total exports and imports
(%)
Country Primary commodities Manufactured goods
1995 2013 1995 2013
Exports
Kazakhstan 61.85 90.24 38.15 9.75
Kyrgyzstan 63.72 55.87 35.40 43.62
Tajikistan 84.82 80.74 15.12 11.96
Turkmenistan 93.03 94.71 6.78 5.27
Uzbekistan 92.74 60.40 7.20 39.48
Imports
Kazakhstan 39.67 21.03 59.16 78.22
Kyrgyzstan 59.48 42.03 40.51 57.97
Tajikistan 53.26 41.40 45.98 56.36
Turkmenistan 32.42 11.21 65.95 85.45
Uzbekistan 26.24 23.14 72.22 73.92
Source: UNCTAD statistics, 2014.
Note: Primary commodities (SITC 0 + 1 + 2 + 3 + 4 + 68 + 667 + 971); manufactured goods (SITC 5 to 8,
less 667 and 68).
213
the CARs, it is remarkably one of the top five import sources, accounting for shares of
35.65% in Kazakhstan, 20.89% in Kyrgyzstan, 16.11% in Tajikistan, 16.28% in Turkmenistan
and 21.74% in Uzbekistan.
Table 5.2. Major trading partners of CARs (share in %)
Country Major export partners Major import partners
Kazakhstan European Union (45.62), Russian Federation (35.65),
Russian Federation (8.54), China (25.36), European Union
Canada (4.02), Romania (3.46), (18.06),Ukraine (4.29),
Austria (2.56) United States (2.22)
Kyrgyzstan Kazakhstan (29.98), Uzbekistan China (52.26), Russian Federation
(28.05), Russian Federation (20.89), Kazakhstan (7.51),
(8.85), United Arab Emirates European Union (5.16),
(6.94), Afghanistan (5.55), Turkey (4.0)
European Union (4.78)
Tajikistan Turkey (36.09), Islamic China (41.58), Russian Federation
Republic of Iran (9.15), China (16.11), Kazakhstan (11.99),
(8.62), Kazakhstan (7.43), Turkey (6.31), European Union
Bangladesh (7.23), (5.46)
European Union 7.05,
Russian Federation (3.68)
Turkmenistan China (67.72), European Union Turkey (22.29), Russian
(8.65), Turkey (4.98), United Federation (16.28), European
Kingdom (3.30), Afghanistan Union (15.02), China (13.0),
(2.82), Russian Federation United Arab Emirates (6.75)
(1.06)
Uzbekistan China (27.86), Russian Russian Federation (21.74),
Federation (18.25), Kazakhstan China (20.26), Republic of Korea
(13.29), Turkey (11.84), (15.26), European Union (14.13),
Bangladesh (8.16), European Kazakhstan (10.47)
Union (2.33)
Source: IMF DOTS, 2015.
2. Trade policies of the CARs
To assess any external economic engagements of the CARs, it is necessary to understand
the existing trade policy contours.
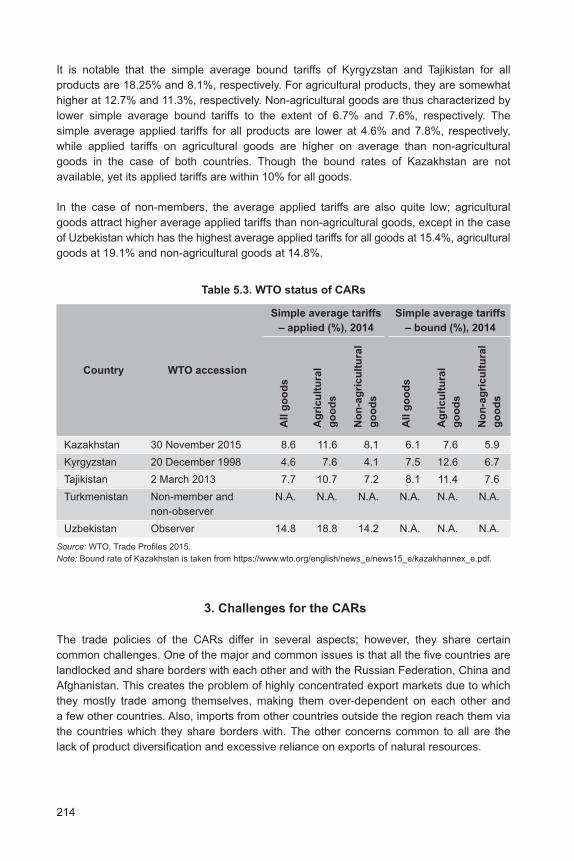
Before looking at a brief profile of the trade policies of the CARs, it is important to review
the status of their multilateral trade engagements under WTO. First, as table 5.3 shows,
only Kyrgyzstan, Tajikistan and Kazakhstan have been members of WTO since 1998, 2013
and 2015, respectively, while Uzbekistan has observer status, Turkmenistan is neither
a member nor observer. Second, the simple average applied tariffs are not very high in
most CARs (the data for Turkmenistan is not available).
214
It is notable that the simple average bound tariffs of Kyrgyzstan and Tajikistan for all
products are 18.25% and 8.1%, respectively. For agricultural products, they are somewhat
higher at 12.7% and 11.3%, respectively. Non-agricultural goods are thus characterized by
lower simple average bound tariffs to the extent of 6.7% and 7.6%, respectively. The
simple average applied tariffs for all products are lower at 4.6% and 7.8%, respectively,
while applied tariffs on agricultural goods are higher on average than non-agricultural
goods in the case of both countries. Though the bound rates of Kazakhstan are not
available, yet its applied tariffs are within 10% for all goods.
In the case of non-members, the average applied tariffs are also quite low; agricultural
goods attract higher average applied tariffs than non-agricultural goods, except in the case
of Uzbekistan which has the highest average applied tariffs for all goods at 15.4%, agricultural
goods at 19.1% and non-agricultural goods at 14.8%.
Table 5.3. WTO status of CARs
Simple average tariffs Simple average tariffs
Country WTO accession
– applied (%), 2014 – bound (%), 2014
Kazakhstan 30 November 2015 8.6 11.6 8.1 6.1 7.6 5.9
Kyrgyzstan 20 December 1998 4.6 7.6 4.1 7.5 12.6 6.7
Tajikistan 2 March 2013 7.7 10.7 7.2 8.1 11.4 7.6
Turkmenistan Non-member and N.A. N.A. N.A. N.A. N.A. N.A.
non-observer
Uzbekistan Observer 14.8 18.8 14.2 N.A. N.A. N.A.
Source: WTO, Trade Profiles 2015.
Note: Bound rate of Kazakhstan is taken from https://www.wto.org/english/news_e/news15_e/kazakhannex_e.pdf.
All
go
od
s
Ag
ric
ult
ura
l
go
od
s
No
n-a
gri
cu
ltu
ral
go
od
s
All
go
od
s
Ag
ric
ult
ura
l
go
od
s
No
n-a
gri
cu
ltu
ral
go
od
s
3. Challenges for the CARs
The trade policies of the CARs differ in several aspects; however, they share certain
common challenges. One of the major and common issues is that all the five countries are
landlocked and share borders with each other and with the Russian Federation, China and
Afghanistan. This creates the problem of highly concentrated export markets due to which
they mostly trade among themselves, making them over-dependent on each other and
a few other countries. Also, imports from other countries outside the region reach them via
the countries which they share borders with. The other concerns common to all are the
lack of product diversification and excessive reliance on exports of natural resources.
215
Since they gained independence from the former Soviet Union, the five Central Asian
economies of Kazakhstan, Kyrgyzstan, Tajikistan, Turkmenistan and Uzbekistan have been
liberalizing their trade policies in order to integrate their economies with the global economy.
The path to this aim has been varied; however, it includes some similarities that arise due
to the similar nature of these five economies. All the CARs have been trying to increase
their trade within the region as well as with other economies, and it is a well-known fact
that both exports and imports of these countries have increased over the years. However,
where some countries have focused more on exports, some have chosen the path of
reducing import value to achieve a trade account balance.
Kyrgyzstan and Tajikistan have put greater emphasis on increasing their export volumes
by using export development and promotion strategies. They try to make their customs
procedures less stringent. One such example is the uniform information system established
by Kyrgyzstan to streamline its custom procedures. These two countries are trying to
formulate their custom procedures to bring them into line with internationally-set norms
and regulations in order to further enhance the process of integration with the world
economy.
The economies of Kazakhstan, Turkmenistan and Uzbekistan, on the other hand, rely
more on import substitution policies that are intended to protect their domestic industries.
They use various tariff and non-tariff barriers to restrict the volume of imports; however, the
intensity of protection differs from country to country. Uzbekistan has relatively more stringent
laws as the Government requires a licensing system designed to restrict both exports and
imports in order to avoid high trade deficit.
C. Services sector and trade in services
It is a well-known fact that economic growth in Central Asian countries has primarily been
driven by oil and natural resources in past decades. The growing concern that these
resources will eventually be exhausted has led to some shifts towards industrial goods as
well as the services sector across the region (box 5.1). The services sector has gained
significance in Central Asia and constitutes approximately half of the value-added of GDP
in the region. Although Kazakhstan exceeds in this area, as the value-added from its
services sector is quite large; the sector has also undergone expansion in other four
CARs.
The financial sector in Kazakhstan has expanded and remittance incomes have increased
for Kyrgyzstan and Tajikistan. Furthermore, financial services, telecommunications, real
estate and tourism are expected to gain even more importance and greater financial
deepening, boosted by higher domestic demand for credit. Investment in infrastructure,
including further upgrading of telecommunications and business services, will help support
production, employment and international trade in services (ADB, 2014b).
216
Box 5.1. Importance of the services sector in the CARs
Kazakhstan is the largest economy in Central Asia. The services sector is an important
component of its national economy and accounts for 54% of total GDP. The largest
segments within the services sector are retail trade, transport, information and
communications technology, real estate and professional services. However, despite the
rise of the services sector, exports are largely concentrated in the oil-related extraction,
construction and pipeline transport services.
The services sector is also the biggest sector in Kyrgyzstan, having overtaken agriculture
as the main contributor to GDP. At an average growth rate of more than 8.1% between
2000 and 2010, it is the fastest-expanding sector in the Kyrgyzstan economy. Much of the
sector’s contribution comes from retail trade and the tourism services sector (e.g.,
restaurants and hotels). Lake Issyk-Kul is one of the largest alpine lakes in the world and
a prominent destination for international tourists in Kyrgyzstan.
Tajikistan’s services sector has also seen dramatic improvement in the past five years,
with both exports and imports of services increasing significantly. The increase is mainly
attributable to increased exports of transport and business services, including mining
services in which Tajikistan has a comparative advantage. In 2012, exports of services
amounted to approximately $817 million, whereas imports stood at approximately
$1 billion. This increased importance of trade in services is reflected in the percentage
share of trade in services in the GDP for Tajikistan, which increased from 12.3% in 2008
to 24.5% in 2012.
In Uzbekistan, the services sector constitutes about 48% of GDP and has contributed
more to growth than either industry or agriculture in the past decade. From 2007 to 2010,
the services sector in Uzbekistan grew by 13.3%, well above the 8.7% of overall economic
growth rate. The growth was driven by strong performance in financial and
telecommunications services, which posted a combined growth of 24% in 2011.
Because of its rich culture and heritage, Uzbekistan also has enormous potential for
developing its tourism sector. Even though the country possesses various tourism attractions
and resources, and leads the region in the number of UNESCO-designated world heritage
sites, tourism accounts for only 0.2% of the services sector output and has seen little
growth over the past five years. This is due to an underdeveloped air transport market,
strict visa regime and an unorganized tourism sector.
Turkmenistan’s economy is dominated by large, state-owned companies. Initially, after
independence from the former Soviet Union, emphasis was placed on heavy industry and,
more recently, on the oil and gas industry. The country’s services sector remains neglected,
and unlike other post-communist countries in the region, the percentage of workers in the
services sector has decreased since the breakup of the former Soviet Union. Services
contribution to the national output is also the lowest in comparison with other countries in
the region. Moreover, unlike other CARs, Turkmenistan’s share of services has fallen
sharply since 2006. This can be attributed to the increasing role of the hydrocarbon
economy in Turkmenistan and inadequate macroeconomic reforms to increase the role of
the private sector in the economy. However, despite the relatively less importance of
services sector, it grew by 13.9% in 2013, which was well above the country’s 7.3%
growth in industry and 10% in agriculture.
Source: Excerpted from USAID, 2014.
217
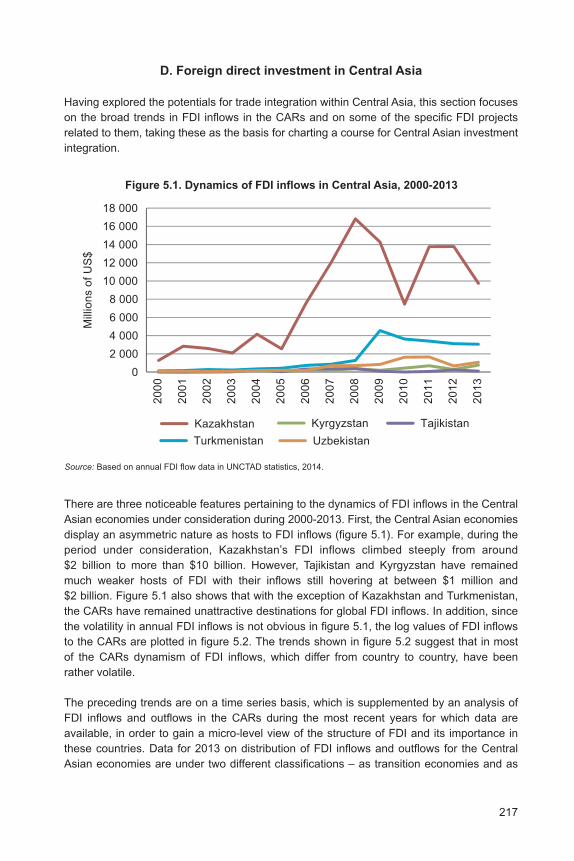
D. Foreign direct investment in Central Asia
Having explored the potentials for trade integration within Central Asia, this section focuses
on the broad trends in FDI inflows in the CARs and on some of the specific FDI projects
related to them, taking these as the basis for charting a course for Central Asian investment
integration.
Figure 5.1. Dynamics of FDI inflows in Central Asia, 2000-2013
Source: Based on annual FDI flow data in UNCTAD statistics, 2014.
0
2 000
4 000
6 000
8 000
10 000
12 000
14 000
16 000
18 000
20
00
20
01
20
02
20
03
20
04
20
05
20
06
20
07
20
08
20
09
20
10
20
11
20
12
20
13
Kazakhstan Kyrgyzstan Tajikistan
Turkmenistan Uzbekistan
Mill
ion
s o
f U
S$
There are three noticeable features pertaining to the dynamics of FDI inflows in the Central
Asian economies under consideration during 2000-2013. First, the Central Asian economies
display an asymmetric nature as hosts to FDI inflows (figure 5.1). For example, during the
period under consideration, Kazakhstan’s FDI inflows climbed steeply from around
$2 billion to more than $10 billion. However, Tajikistan and Kyrgyzstan have remained
much weaker hosts of FDI with their inflows still hovering at between $1 million and
$2 billion. Figure 5.1 also shows that with the exception of Kazakhstan and Turkmenistan,
the CARs have remained unattractive destinations for global FDI inflows. In addition, since
the volatility in annual FDI inflows is not obvious in figure 5.1, the log values of FDI inflows
to the CARs are plotted in figure 5.2. The trends shown in figure 5.2 suggest that in most
of the CARs dynamism of FDI inflows, which differ from country to country, have been
rather volatile.
The preceding trends are on a time series basis, which is supplemented by an analysis of
FDI inflows and outflows in the CARs during the most recent years for which data are
available, in order to gain a micro-level view of the structure of FDI and its importance in
these countries. Data for 2013 on distribution of FDI inflows and outflows for the Central
Asian economies are under two different classifications – as transition economies and as
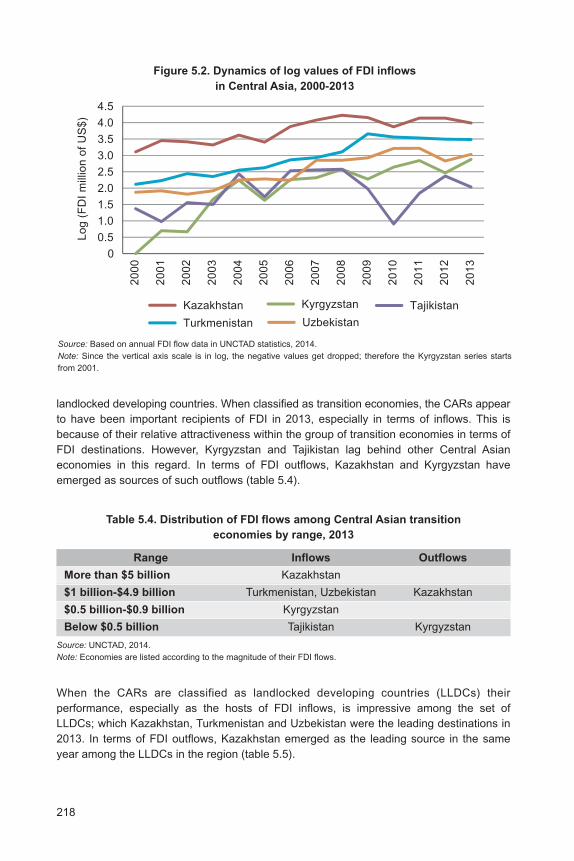
218
landlocked developing countries. When classified as transition economies, the CARs appear
to have been important recipients of FDI in 2013, especially in terms of inflows. This is
because of their relative attractiveness within the group of transition economies in terms of
FDI destinations. However, Kyrgyzstan and Tajikistan lag behind other Central Asian
economies in this regard. In terms of FDI outflows, Kazakhstan and Kyrgyzstan have
emerged as sources of such outflows (table 5.4).
Figure 5.2. Dynamics of log values of FDI inflows
in Central Asia, 2000-2013
Source: Based on annual FDI flow data in UNCTAD statistics, 2014.
Note: Since the vertical axis scale is in log, the negative values get dropped; therefore the Kyrgyzstan series starts
from 2001.
0
0.5
1.0
1.5
2.0
2.5
3.0
3.5
4.0
4.5
20
00
20
01
20
02
20
03
20
04
20
05
20
06
20
07
20
08
20
09
20
10
20
11
20
12
20
13
Uzbekistan
Kazakhstan Kyrgyzstan Tajikistan
Turkmenistan
Lo
g (
FD
I m
illio
n o
f U
S$
)
Table 5.4. Distribution of FDI flows among Central Asian transition
economies by range, 2013
Range Inflows Outflows
More than $5 billion Kazakhstan
$1 billion-$4.9 billion Turkmenistan, Uzbekistan Kazakhstan
$0.5 billion-$0.9 billion Kyrgyzstan
Below $0.5 billion Tajikistan Kyrgyzstan
Source: UNCTAD, 2014.
Note: Economies are listed according to the magnitude of their FDI flows.
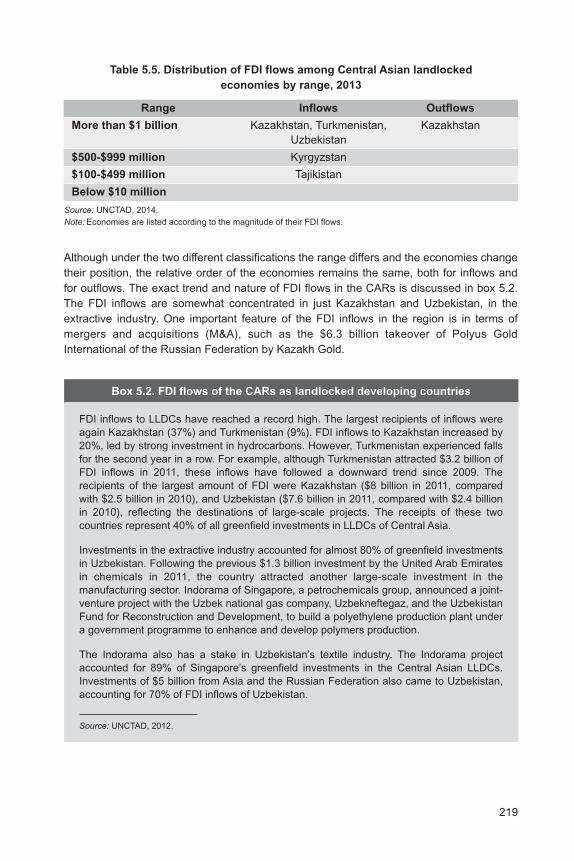
When the CARs are classified as landlocked developing countries (LLDCs) their
performance, especially as the hosts of FDI inflows, is impressive among the set of
LLDCs; which Kazakhstan, Turkmenistan and Uzbekistan were the leading destinations in
2013. In terms of FDI outflows, Kazakhstan emerged as the leading source in the same
year among the LLDCs in the region (table 5.5).
219
Table 5.5. Distribution of FDI flows among Central Asian landlocked
economies by range, 2013
Range Inflows Outflows
More than $1 billion Kazakhstan, Turkmenistan, Kazakhstan
Uzbekistan
$500-$999 million Kyrgyzstan
$100-$499 million Tajikistan
Below $10 million
Source: UNCTAD, 2014.
Note: Economies are listed according to the magnitude of their FDI flows.
Although under the two different classifications the range differs and the economies change
their position, the relative order of the economies remains the same, both for inflows and
for outflows. The exact trend and nature of FDI flows in the CARs is discussed in box 5.2.
The FDI inflows are somewhat concentrated in just Kazakhstan and Uzbekistan, in the
extractive industry. One important feature of the FDI inflows in the region is in terms of
mergers and acquisitions (M&A), such as the $6.3 billion takeover of Polyus Gold
International of the Russian Federation by Kazakh Gold.
Box 5.2. FDI flows of the CARs as landlocked developing countries
FDI inflows to LLDCs have reached a record high. The largest recipients of inflows were
again Kazakhstan (37%) and Turkmenistan (9%). FDI inflows to Kazakhstan increased by
20%, led by strong investment in hydrocarbons. However, Turkmenistan experienced falls
for the second year in a row. For example, although Turkmenistan attracted $3.2 billion of
FDI inflows in 2011, these inflows have followed a downward trend since 2009. The
recipients of the largest amount of FDI were Kazakhstan ($8 billion in 2011, compared
with $2.5 billion in 2010), and Uzbekistan ($7.6 billion in 2011, compared with $2.4 billion
in 2010), reflecting the destinations of large-scale projects. The receipts of these two
countries represent 40% of all greenfield investments in LLDCs of Central Asia.
Investments in the extractive industry accounted for almost 80% of greenfield investments
in Uzbekistan. Following the previous $1.3 billion investment by the United Arab Emirates
in chemicals in 2011, the country attracted another large-scale investment in the
manufacturing sector. Indorama of Singapore, a petrochemicals group, announced a joint-
venture project with the Uzbek national gas company, Uzbekneftegaz, and the Uzbekistan
Fund for Reconstruction and Development, to build a polyethylene production plant under
a government programme to enhance and develop polymers production.
The Indorama also has a stake in Uzbekistan’s textile industry. The Indorama project
accounted for 89% of Singapore’s greenfield investments in the Central Asian LLDCs.
Investments of $5 billion from Asia and the Russian Federation also came to Uzbekistan,
accounting for 70% of FDI inflows of Uzbekistan.
Source: UNCTAD, 2012.
220
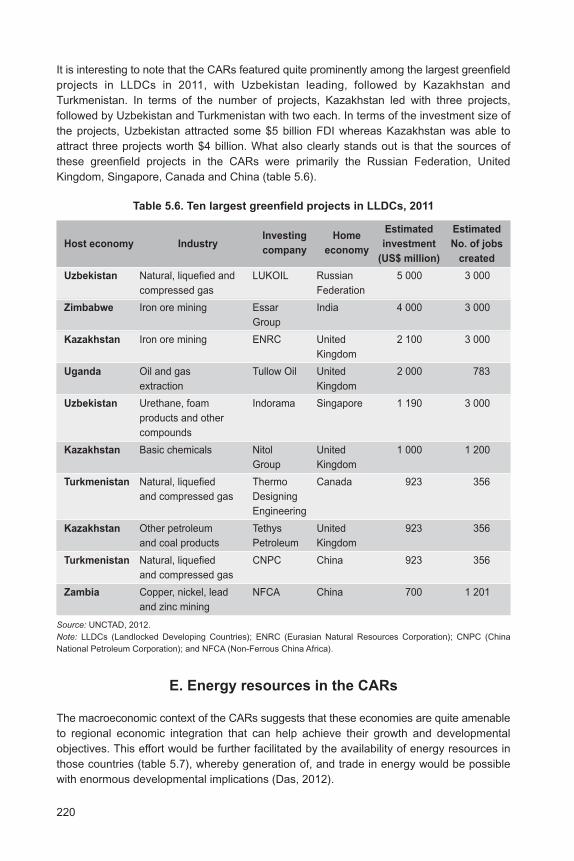
It is interesting to note that the CARs featured quite prominently among the largest greenfield
projects in LLDCs in 2011, with Uzbekistan leading, followed by Kazakhstan and
Turkmenistan. In terms of the number of projects, Kazakhstan led with three projects,
followed by Uzbekistan and Turkmenistan with two each. In terms of the investment size of
the projects, Uzbekistan attracted some $5 billion FDI whereas Kazakhstan was able to
attract three projects worth $4 billion. What also clearly stands out is that the sources of
these greenfield projects in the CARs were primarily the Russian Federation, United
Kingdom, Singapore, Canada and China (table 5.6).
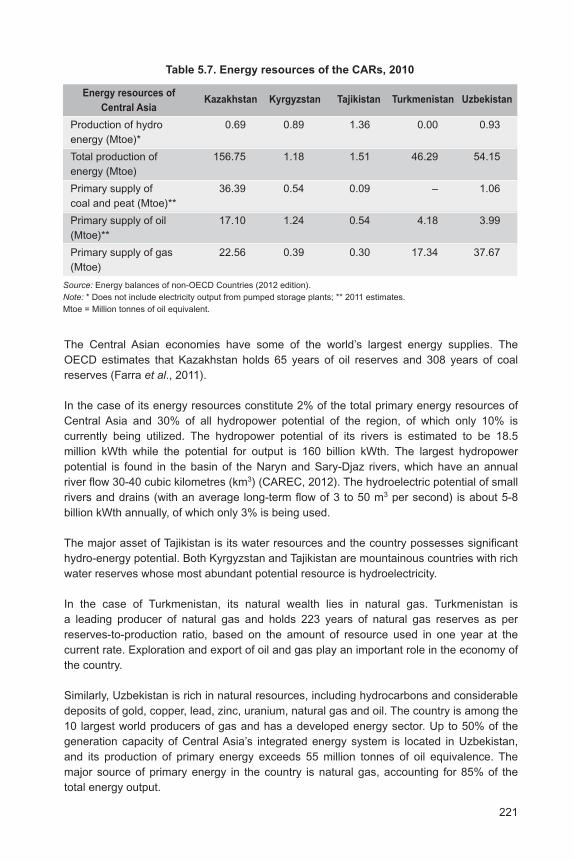
E. Energy resources in the CARs
The macroeconomic context of the CARs suggests that these economies are quite amenable
to regional economic integration that can help achieve their growth and developmental
objectives. This effort would be further facilitated by the availability of energy resources in
those countries (table 5.7), whereby generation of, and trade in energy would be possible
with enormous developmental implications (Das, 2012).
Table 5.6. Ten largest greenfield projects in LLDCs, 2011
Investing HomeEstimated Estimated
Host economy Industrycompany economy
investment No. of jobs
(US$ million) created
Uzbekistan Natural, liquefied and LUKOIL Russian 5 000 3 000
compressed gas Federation
Zimbabwe Iron ore mining Essar India 4 000 3 000
Group
Kazakhstan Iron ore mining ENRC United 2 100 3 000
Kingdom
Uganda Oil and gas Tullow Oil United 2 000 783
extraction Kingdom
Uzbekistan Urethane, foam Indorama Singapore 1 190 3 000
products and other
compounds
Kazakhstan Basic chemicals Nitol United 1 000 1 200
Group Kingdom
Turkmenistan Natural, liquefied Thermo Canada 923 356
and compressed gas Designing
Engineering
Kazakhstan Other petroleum Tethys United 923 356
and coal products Petroleum Kingdom
Turkmenistan Natural, liquefied CNPC China 923 356
and compressed gas
Zambia Copper, nickel, lead NFCA China 700 1 201
and zinc mining
Source: UNCTAD, 2012.
Note: LLDCs (Landlocked Developing Countries); ENRC (Eurasian Natural Resources Corporation); CNPC (China
National Petroleum Corporation); and NFCA (Non-Ferrous China Africa).
221
The Central Asian economies have some of the world’s largest energy supplies. The
OECD estimates that Kazakhstan holds 65 years of oil reserves and 308 years of coal
reserves (Farra et al., 2011).
In the case of its energy resources constitute 2% of the total primary energy resources of
Central Asia and 30% of all hydropower potential of the region, of which only 10% is
currently being utilized. The hydropower potential of its rivers is estimated to be 18.5
million kWth while the potential for output is 160 billion kWth. The largest hydropower
potential is found in the basin of the Naryn and Sary-Djaz rivers, which have an annual
river flow 30-40 cubic kilometres (km3) (CAREC, 2012). The hydroelectric potential of small
rivers and drains (with an average long-term flow of 3 to 50 m3 per second) is about 5-8
billion kWth annually, of which only 3% is being used.
The major asset of Tajikistan is its water resources and the country possesses significant
hydro-energy potential. Both Kyrgyzstan and Tajikistan are mountainous countries with rich
water reserves whose most abundant potential resource is hydroelectricity.
In the case of Turkmenistan, its natural wealth lies in natural gas. Turkmenistan is
a leading producer of natural gas and holds 223 years of natural gas reserves as per
reserves-to-production ratio, based on the amount of resource used in one year at the
current rate. Exploration and export of oil and gas play an important role in the economy of
the country.
Similarly, Uzbekistan is rich in natural resources, including hydrocarbons and considerable
deposits of gold, copper, lead, zinc, uranium, natural gas and oil. The country is among the
10 largest world producers of gas and has a developed energy sector. Up to 50% of the
generation capacity of Central Asia’s integrated energy system is located in Uzbekistan,
and its production of primary energy exceeds 55 million tonnes of oil equivalence. The
major source of primary energy in the country is natural gas, accounting for 85% of the
total energy output.
Table 5.7. Energy resources of the CARs, 2010
Energy resources ofKazakhstan Kyrgyzstan Tajikistan Turkmenistan Uzbekistan
Central Asia
Production of hydro 0.69 0.89 1.36 0.00 0.93
energy (Mtoe)*
Total production of 156.75 1.18 1.51 46.29 54.15
energy (Mtoe)
Primary supply of 36.39 0.54 0.09 – 1.06
coal and peat (Mtoe)**
Primary supply of oil 17.10 1.24 0.54 4.18 3.99
(Mtoe)**
Primary supply of gas 22.56 0.39 0.30 17.34 37.67
(Mtoe)
Source: Energy balances of non-OECD Countries (2012 edition).
Note: * Does not include electricity output from pumped storage plants; ** 2011 estimates.
Mtoe = Million tonnes of oil equivalent.
222
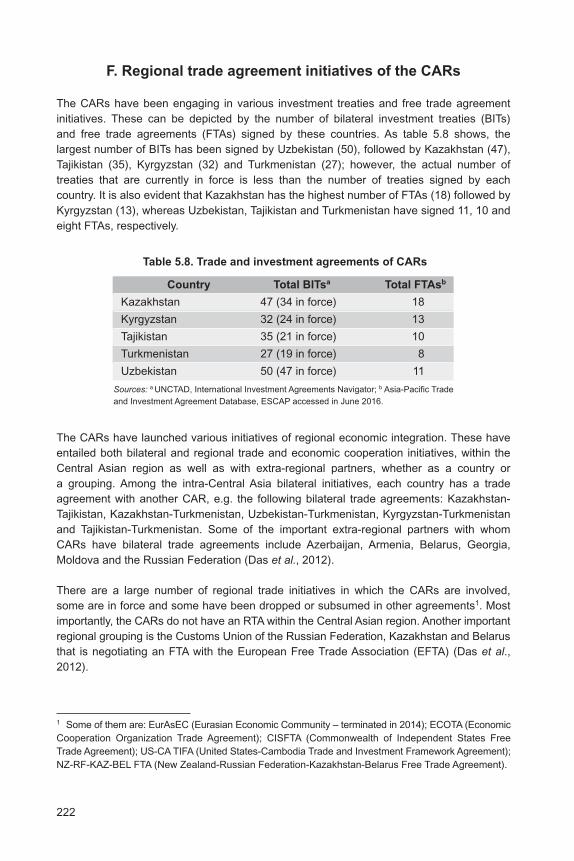
F. Regional trade agreement initiatives of the CARs
The CARs have been engaging in various investment treaties and free trade agreement
initiatives. These can be depicted by the number of bilateral investment treaties (BITs)
and free trade agreements (FTAs) signed by these countries. As table 5.8 shows, the
largest number of BITs has been signed by Uzbekistan (50), followed by Kazakhstan (47),
Tajikistan (35), Kyrgyzstan (32) and Turkmenistan (27); however, the actual number of
treaties that are currently in force is less than the number of treaties signed by each
country. It is also evident that Kazakhstan has the highest number of FTAs (18) followed by
Kyrgyzstan (13), whereas Uzbekistan, Tajikistan and Turkmenistan have signed 11, 10 and
eight FTAs, respectively.
Table 5.8. Trade and investment agreements of CARs
Country Total BITsa Total FTAsb
Kazakhstan 47 (34 in force) 18
Kyrgyzstan 32 (24 in force) 13
Tajikistan 35 (21 in force) 10
Turkmenistan 27 (19 in force) 8
Uzbekistan 50 (47 in force) 11
Sources: a UNCTAD, International Investment Agreements Navigator; b Asia-Pacific Trade
and Investment Agreement Database, ESCAP accessed in June 2016.
The CARs have launched various initiatives of regional economic integration. These have
entailed both bilateral and regional trade and economic cooperation initiatives, within the
Central Asian region as well as with extra-regional partners, whether as a country or
a grouping. Among the intra-Central Asia bilateral initiatives, each country has a trade
agreement with another CAR, e.g. the following bilateral trade agreements: Kazakhstan-
Tajikistan, Kazakhstan-Turkmenistan, Uzbekistan-Turkmenistan, Kyrgyzstan-Turkmenistan
and Tajikistan-Turkmenistan. Some of the important extra-regional partners with whom
CARs have bilateral trade agreements include Azerbaijan, Armenia, Belarus, Georgia,
Moldova and the Russian Federation (Das et al., 2012).
There are a large number of regional trade initiatives in which the CARs are involved,
some are in force and some have been dropped or subsumed in other agreements1. Most
importantly, the CARs do not have an RTA within the Central Asian region. Another important
regional grouping is the Customs Union of the Russian Federation, Kazakhstan and Belarus
that is negotiating an FTA with the European Free Trade Association (EFTA) (Das et al.,
2012).
1 Some of them are: EurAsEC (Eurasian Economic Community – terminated in 2014); ECOTA (Economic
Cooperation Organization Trade Agreement); CISFTA (Commonwealth of Independent States Free
Trade Agreement); US-CA TIFA (United States-Cambodia Trade and Investment Framework Agreement);
NZ-RF-KAZ-BEL FTA (New Zealand-Russian Federation-Kazakhstan-Belarus Free Trade Agreement).
223
Most of the trade agreements have focused on tariff liberalization based on the negative
list approach to negotiation. An absence of clarity on rules of origin (RoO) in these
agreements suggests that the analytical rationale on the RoO role in the trade agreements
of the CARs, whether within the region or outside, is not well understood. The RoO
formulations could be moulded in such a way that they play a developmental role within
a trade agreement.
In addition, these agreements only focus on trade in goods and do not include trade in
services and investment; therefore, they are not comprehensive in their coverage. Possibly,
the region lacks the analytical understanding of the fact that trade in goods, trade in
services and investment have to be taken together, in light of their interlinkages, when
adopting an integrative approach. Similar observations can be made in the case of regional
trade agreements entered into force by the Central Asian countries with countries outside
the region.
It should be mentioned that despite a whole range of bilateral and plurilateral agreements,
there is only one that is in operation in any significant manner which is relevant to the
purpose of this study – i.e., the CU and the SES among Belarus, Kazakhstan and the
Russian Federation which is replaced by Eurasian Economic Union (EAEU). The Eurasian
Economic Community (EurAsEC) is an international organization that ensures multilateral
economic cooperation among its member States. Incorporated as an international legal
body, in 2003 EurAsEC was granted observer status in the United Nations General Assembly.
During its sixty-second session in December 2007, the General Assembly adopted the
resolution “Cooperation between the United Nations and the Eurasian Economic Community
(EurAsEC)”. The Eurasian Economic Commission (EEC), a single permanent regulatory
body of the Eurasian Economic Union, and the SES started functioning on 2 February
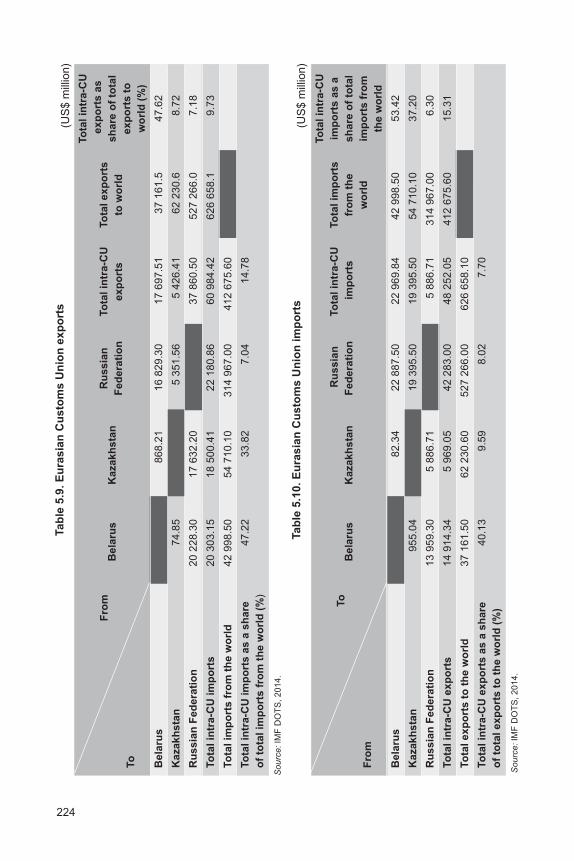
2012. The intra-Eurasian Customs Union’s share of total CU exports to the world markets
stood at 9.73%, which is not very high by global standards (table 5.9), whereas the share
of Intra-Eurasian CU imports in total imports stood at 15.31% (table 5.10).
The implications of this important initiative are analysed towards the end of this study in
the context of the inclusion of the CARs as the Participating States of APTA.
Having analysed the macroeconomic performance, energy resources, trade structure, trade
policies, FDI linkages and regional economic integration schemes of the CARs, it is clear
that those countries have the necessary conditions to become the Participating States of
APTA in a mutually beneficial manner. However, this needs to be ascertained empirically
with an analysis which provides a brief review of the current Participating States of APTA.
224
Tab
le 5
.9. E
ura
sia
n C
usto
ms U
nio
n e
xp
ort
s
Fro
m
To
tal
intr
a-C
U
Ru
ssia
nTo
tal in
tra-C
UTo
tal exp
ort
s e
xp
ort
s a
s
Bela
rus
Kazakh
sta
nF
ed
era
tio
nexp
ort
sto
wo
rld
sh
are
of
tota
l
exp
ort
s t
oTo
wo
rld
(%
)
Be
laru
s
868.2
116 8
29.3
017 6
97.5
137 1
61.5
47.6
2
Kazakh
sta
n74.8
5
5 3
51.5
65 4
26.4
162 2
30.6
8.7
2
Ru
ss
ian
Fe
de
rati
on
20
22
8.3
01
7 6
32
.20
3
7 8
60
.50
52
7 2
66
.07
.18
To
tal in
tra-C
U im
po
rts
20
30
3.1
51
8 5
00
.41
22
18
0.8
66
0 9
84
.42
62
6 6
58
.19
.73
To
tal im
po
rts f
rom
th
e w
orl
d4
2 9
98
.50
54
71
0.1
03
14
96
7.0
04
12
67
5.6
0
To
tal in
tra-C
U im
po
rts a
s a
sh
are
47.2
233.8
27.0
414.7
8
of
tota
l im
po
rts f
rom
th
e w
orl
d (
%)
So
urc
e: IM
F D
OT
S,
20
14
.
Tab
le 5
.10
. E
ura
sia
n C
us
tom
s U
nio
n i
mp
ort
s
To
To
tal
intr
a-C
U
Ru
ss
ian
To
tal
intr
a-C
UTo
tal
imp
ort
sim
po
rts
as
a
Bela
rus
Kazakh
sta
nF
ed
era
tio
n im
po
rts
fro
m t
he
sh
are
of
tota
l
wo
rld
imp
ort
s f
rom
Fro
mth
e w
orl
d
Be
laru
s
82.3
422 8
87.5
022 9
69.8
442 9
98.5
053.4
2
Kazakh
sta
n955.0
4
19 3
95.5
019 3
95.5
054 7
10.1
037.2
0
Ru
ss
ian
Fe
de
rati
on
13
95
9.3
05
88
6.7
1
5 8
86
.71
31
4 9
67
.00
6.3
0
To
tal in
tra-C
U e
xp
ort
s1
4 9
14
.34
5 9
69
.05
42
28
3.0
04
8 2
52
.05
41
2 6
75
.60
15
.31
To
tal
ex
po
rts
to
th
e w
orl
d3
7 1
61
.50
62
23
0.6
05
27
26
6.0
06
26
65
8.1
0
To
tal
intr
a-C
U e
xp
ort
s a
s a
sh
are
40.1
39.5
98.0
27.7
0
of
tota
l exp
ort
s t
o t
he w
orl
d (
%)
So
urc
e: IM
F D
OT
S,
20
14
.
(US
$ m
illio
n)
(US
$ m
illio
n)
225
G. Suitability of APTA for Pan-Asian economic
integration
There are various reasons as to why APTA is suited for Pan-Asian economic integration.
APTA is possibly the most broad-based grouping in Asia as it comprises membership from
the South Asian, South-East Asian and East Asian sub-regions. The South Asian region is
represented by Bangladesh, India and Sri Lanka; the South-East Asian region by the Lao
People’s Democratic Republic; and the East Asian region by the Republic of Korea and
China. It is the only regional grouping in Asia with the most comprehensive scope of
cooperation, including trade in goods, trade in services, investment, and several other
areas of cooperation, including non-tariff measures (NTMs). It is also the only grouping
with three of the world’s most dynamic economies, i.e., China, India and the Republic of
Korea, as current members. It also has a structured institutional mechanism with
a Secretariat at the United Nations Economic and Social Commission for Asia and the
Pacific (ESCAP) in Bangkok.
China and India have been playing an important role in the faster recovery of the
Asia-Pacific economies due to their large import demand during the period of global
economic recession. This exemplifies the extent of the future impact of APTA in the
Asia-Pacific region, as it is the only preferential trade agreement to have both these two
giant economies as members with populations and GDP that represent 67% and 38% of
the region, respectively (APTA, 2013).
APTA has already progressed with regard to trade in goods negotiations, and the modalities
are in place. The Participating States of APTA are about to conclude the Fourth Round of
negotiations, which covers more than 10,000 items under preferential trade.
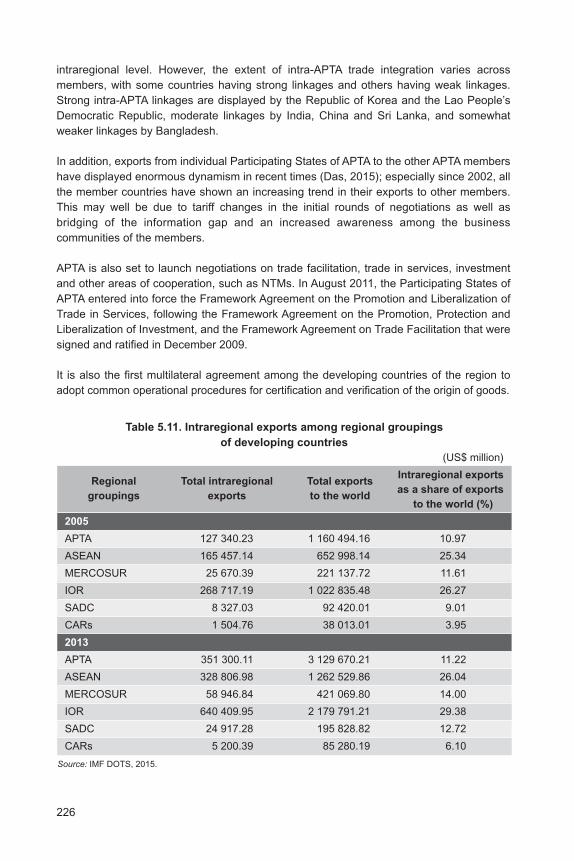
Current intra-APTA trade is not insignificant, with its exports accounting for 11.2% of total
exports to the world (table 5.11). However, it is important to note that the absolute volume
of intra-APTA exports increased from approximately $127 billion in 2005 to $351 billion in
2013, which represents an increase of 175%. This growth in intraregional exports in
absolute terms is much higher than the 98% increase in the case of ASEAN, 130%
increase for MERCOSUR, and 139% increase for IOR during the same period. Also, it is
only just below the approximate 200% increase for SADC. It is equally important to
observe that, in absolute terms, intra-APTA exports stood at $351 billion, ahead of ASEAN
($328 billion), MERCOSUR ($59 billion) and SADC ($24 billion), but behind IOR
($640 billion) in 2013.
More importantly, in comparison to APTA, the least integrated among the sample of regional
groupings, the intraregional exports of the CARs as a share of its global exports was very
low at 4% in 2005 and 6.1% in 2013. Thus, a detailed analysis of CARs membership in
APTA deserves serious consideration. This would be hypothetically helpful in augmenting
the overall trade flows of APTA through CARs-APTA trade linkages.
It is worth mentioning that in analysing the intraregional trade flows, only export trends
have been included because imports would only mirror the export behaviour at the aggregate
226
intraregional level. However, the extent of intra-APTA trade integration varies across
members, with some countries having strong linkages and others having weak linkages.
Strong intra-APTA linkages are displayed by the Republic of Korea and the Lao People’s
Democratic Republic, moderate linkages by India, China and Sri Lanka, and somewhat
weaker linkages by Bangladesh.
In addition, exports from individual Participating States of APTA to the other APTA members
have displayed enormous dynamism in recent times (Das, 2015); especially since 2002, all
the member countries have shown an increasing trend in their exports to other members.
This may well be due to tariff changes in the initial rounds of negotiations as well as
bridging of the information gap and an increased awareness among the business
communities of the members.
APTA is also set to launch negotiations on trade facilitation, trade in services, investment
and other areas of cooperation, such as NTMs. In August 2011, the Participating States of
APTA entered into force the Framework Agreement on the Promotion and Liberalization of
Trade in Services, following the Framework Agreement on the Promotion, Protection and
Liberalization of Investment, and the Framework Agreement on Trade Facilitation that were
signed and ratified in December 2009.
It is also the first multilateral agreement among the developing countries of the region to
adopt common operational procedures for certification and verification of the origin of goods.
Table 5.11. Intraregional exports among regional groupings
of developing countries
(US$ million)
Regional Total intraregional Total exportsIntraregional exports
groupings exports to the worldas a share of exports
to the world (%)
2005
APTA 127 340.23 1 160 494.16 10.97
ASEAN 165 457.14 652 998.14 25.34
MERCOSUR 25 670.39 221 137.72 11.61
IOR 268 717.19 1 022 835.48 26.27
SADC 8 327.03 92 420.01 9.01
CARs 1 504.76 38 013.01 3.95
2013
APTA 351 300.11 3 129 670.21 11.22
ASEAN 328 806.98 1 262 529.86 26.04
MERCOSUR 58 946.84 421 069.80 14.00
IOR 640 409.95 2 179 791.21 29.38
SADC 24 917.28 195 828.82 12.72
CARs 5 200.39 85 280.19 6.10
Source: IMF DOTS, 2015.
227
However, despite its high potential, APTA did not progress fast enough in terms of deepening
and widening preferential trade. One of the ways in which this could be achieved is by
expanding the APTA membership. Hence, this chapter explores the possibility of membership
expansion that will have positive impacts not only on the potential member countries from
the CARs but also the Participating States of APTA.
H. Benefits from expansion of APTA membership
Having underscored some of the major aspects pertaining to the suitability of evolving
APTA as the Pan-Asian economic integration mechanism and forum as well as the Ministerial
mandate for expanding APTA membership, this section focuses on the quantification of
benefits for new members from the Central Asian region and Mongolia.
1. Trade linkages between the Participating States
of APTA and the CARs
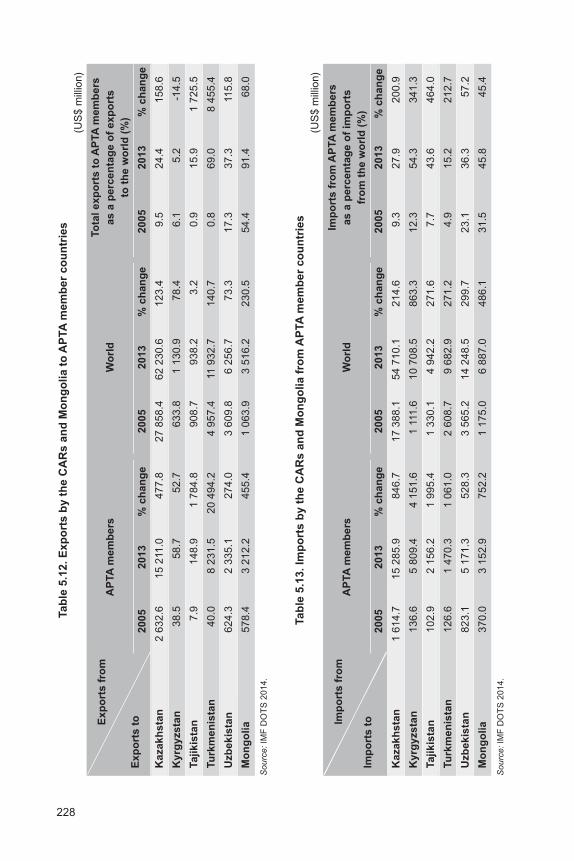
It is evident from table 5.12 that more than 90% of Mongolia’s exports to the world are
directed towards the Participating States of APTA (mostly China). Mongolia’s imports from
APTA as a percentage of its total imports also stand at more than 44% (table 5.13). This
obviously means that Mongolia is a good choice for APTA membership. However, future
negotiations could focus on the potential for Mongolia’s imports from APTA to increase
further. The negotiations also need to focus through the APTA Framework Agreement on
Investment to help diversify Mongolia’s exports to other regions of the world, especially
South Asia and Central Asia, which would be possible if the CARs become members of
APTA. This is important in reducing overdependence of Mongolia on the Participating
States of APTA for its exports.
In terms of growth rates, exports by the CARs to APTA members in relation to those to the
world are very high and, at times, quite erratic. There are a number of reasons including
a low base and almost no trade in some cases. In absolute volumes, the CARs’ existing
trade linkages with the Participating States of APTA are also quite impressive, making the
CARs amenable to APTA membership. Inclusion of the CARs in APTA would help to create
opportunities for them, with the exception of Turkmenistan which already has a high share
of exports to APTA. From the import side, most of the CARs have significant potential to
increase their imports from the Participating States of APTA. However, it should be noted
that while the CARs are quite well integrated with APTA on the import side, APTA
membership would provide possibilities for harnessing an increase in the trade in goods,
given that FDI and trade in services interlinkages would take the levels of integration to
a much higher level. In this regard, the CARs are good candidates for APTA membership.
It is worth mentioning that between 2005 and 2013, the CARs and Mongolia recorded
much faster export growth to APTA member countries as a whole than with the world.
The exports of the CARs and Mongolia to the Participating States of APTA as a percentage
of their total exports to the world also registered a phenomenal rise during the same
period except in the case of Kyrgyzstan. Similar trends are also evident on the import side
(tables 5.12 and 5.13).
228
Tab
le 5
.12.
Exp
ort
s b
y t
he
CA
Rs
an
d M
on
go
lia
to
AP
TA
me
mb
er
co
un
trie
s
(US
$ m
illio
n)
Ex
po
rts
fro
mTo
tal exp
ort
s t
o A
PTA
mem
bers
AP
TA
mem
bers
Wo
rld
as a
perc
en
tag
e o
f exp
ort
s
Exp
ort
s t
oto
th
e w
orl
d (
%)
2005
2013
% c
han
ge
2005
2013
% c
han
ge
2005
2013
% c
han
ge
Kazakh
sta
n2 6
32.6
15 2
11.0
477.8
27 8
58.4
62 2
30.6
123.4
9.5
24.4
158.6
Ky
rgy
zs
tan
38.5
58.7
52.7
633.8
1 1
30.9
78.4
6.1
5.2
-14.5
Tajikis
tan
7.9
148.9
1 7
84.8
908.7
938.2
3.2
0.9
15.9
1 7
25.5
Tu
rkm
en
ista
n40.0
8 2
31.5
20 4
94.2
4 9
57.4
11 9
32.7
140.7
0.8
69.0
8 4
55.4
Uzb
ek
ista
n624.3
2 3
35.1
274.0
3 6
09.8
6 2
56.7
73.3
17.3
37.3
115.8
Mo
ng
olia
578.4
3 2
12.2
455.4
1 0
63.9
3 5
16.2
230.5
54.4
91.4
68.0
So
urc
e: IM
F D
OT
S 2
01
4.
Tab
le 5
.13.
Imp
ort
s b
y t
he
CA
Rs
an
d M
on
go
lia
fro
m A
PTA
me
mb
er
co
un
trie
s
(US
$ m
illio
n)
Imp
ort
s f
rom
Imp
ort
s f
rom
AP
TA
mem
bers
AP
TA
mem
bers
Wo
rld
as a
perc
en
tag
e o
f im
po
rts
Imp
ort
s t
ofr
om
th
e w
orl
d (
%)
2005
2013
% c
han
ge
2005
2013
% c
han
ge
2005
2013
% c
han
ge
Kazakh
sta
n1 6
14.7
15 2
85.9
846.7
17 3
88.1
54 7
10.1
214.6
9.3
27.9
200.9
Ky
rgy
zs
tan
136.6
5 8
09.4
4 1
51.6
1 1
11.6
10 7
08.5
863.3
12.3
54.3
341.3
Tajikis
tan
102.9
2 1
56.2
1 9
95.4
1 3
30.1
4 9
42.2
271.6
7.7
43.6
464.0
Tu
rkm
en
ista
n126.6
1 4
70.3
1 0
61.0
2 6
08.7
9 6
82.9
271.2
4.9
15.2
212.7
Uzb
ek
ista
n823.1
5 1
71.3
528.3
3 5
65.2
14 2
48.5
299.7
23.1
36.3
57.2
Mo
ng
olia
370.0
3 1
52.9
752.2
1 1
75.0
6 8
87.0
486.1
31.5
45.8
45.4
So
urc
e: IM
F D
OT
S 2
01
4.
229
2. Mutual economic gains from CARs-APTA trade
integration: CGE simulations
To realize the gains from trade integration, implementing an RTA is one of the most
important steps. The effects of an RTA for the CARs with APTA member countries are
simulated, using CGE modelling based on the latest GTAP 8 database released in 2012.
Reduction or elimination of tariff barriers is a prerequisite under any RTA in order to step
up bilateral and overall regional trade flows in the region under consideration. Considering
the fact that trade flows are a function not only of tariff reduction or elimination, but also of
trade facilitation measures – which may include simplification of customs clearance
procedures, mutual recognition agreements for standards, technical cooperation and
improvement in trade facilitation infrastructure – it was imperative to factor in both tariff
liberalization and trade facilitation while assessing the possible trade and welfare gains.
Thus, this exercise included full tariff liberalization together with import-augmenting technical
change denoting trade facilitation effects. This was done based on the latest GTAP 8
database. Regional aggregation included East Asia, South Asia, North America, the
European Union-25, Central Asia, APTA Participating States and the rest of the world. In
terms of sectoral aggregation, 57 sectors were mapped in terms of 10 sectors, with five
sectors capturing the manufacturing sector as a whole.
Trade facilitation measures were formulated in the simulation as an “import-augmenting
technical change” to estimate the impacts. In the model, a positive “import-augmenting
technical change” or an improvement in efficiency of importing products lowers the market
price (domestic price) of imported products. Specifically, the effects of 10% exogenous
change in this efficiency improvement were investigated. The solution method was adopted
as 1-Step Johansen and the parameters were taken as default.
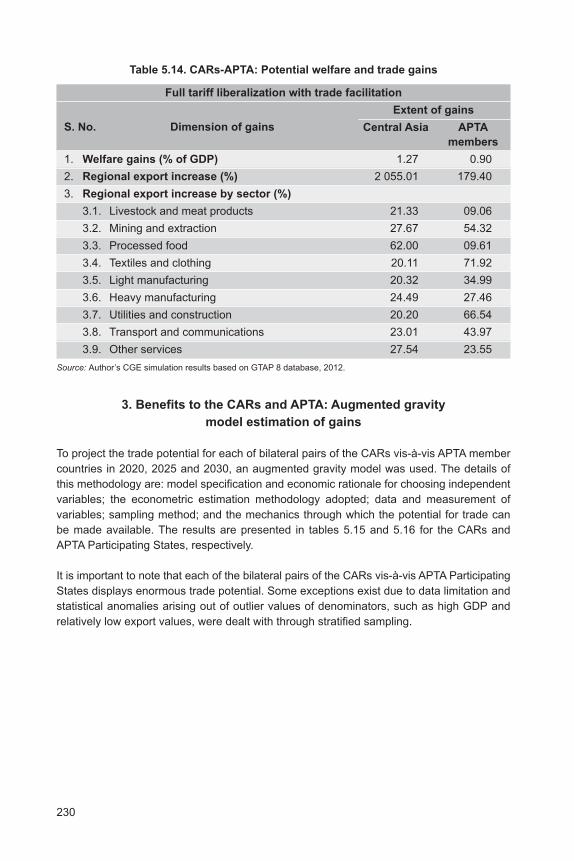
The CGE modelling simulations were undertaken with trade liberalization and trade facilitation
scenarios together. The simulated potential welfare and trade gains of an RTA among the
CARs are presented in table 5.14, which presents a scenario of full tariff liberalization
coupled with trade facilitation. Under this scenario, the welfare gains and regional exports
accruing to the CARs and APTA member countries are both positive and substantive.
Obviously, the gains in dynamic setting would be much more. Some of the sectors also
show meaningful gains for both APTA member countries and the CARs. While the CARs
gain potentially in sectors such as processed food, mining and extraction, other services
and heavy manufacturing, APTA member countries’ potential gains may lie in sectors that
include textiles and clothing, utilities and construction, mining and extraction, transport and
communications, and light manufacturing. In sum, a Central Asian RTA with APTA member
countries through their membership is both welfare-enhancing and trade-inducing.
230
3. Benefits to the CARs and APTA: Augmented gravity
model estimation of gains
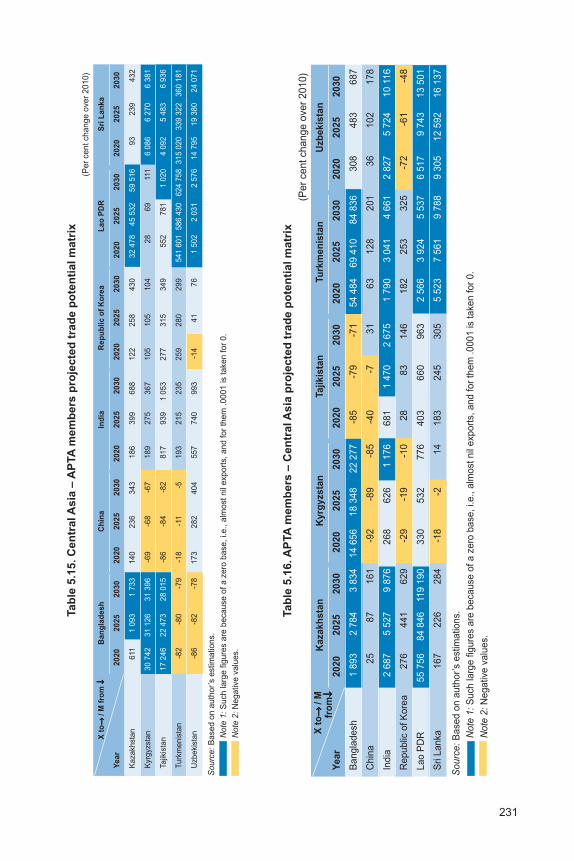
To project the trade potential for each of bilateral pairs of the CARs vis-à-vis APTA member
countries in 2020, 2025 and 2030, an augmented gravity model was used. The details of
this methodology are: model specification and economic rationale for choosing independent
variables; the econometric estimation methodology adopted; data and measurement of
variables; sampling method; and the mechanics through which the potential for trade can
be made available. The results are presented in tables 5.15 and 5.16 for the CARs and
APTA Participating States, respectively.
It is important to note that each of the bilateral pairs of the CARs vis-à-vis APTA Participating
States displays enormous trade potential. Some exceptions exist due to data limitation and
statistical anomalies arising out of outlier values of denominators, such as high GDP and
relatively low export values, were dealt with through stratified sampling.
Table 5.14. CARs-APTA: Potential welfare and trade gains
Full tariff liberalization with trade facilitation
S. No. Dimension of gains
Extent of gains
Central Asia APTA
members
1. Welfare gains (% of GDP) 1.27 0.90
2. Regional export increase (%) 2 055.01 179.40
3. Regional export increase by sector (%)
3.1. Livestock and meat products 21.33 09.06
3.2. Mining and extraction 27.67 54.32
3.3. Processed food 62.00 09.61
3.4. Textiles and clothing 20.11 71.92
3.5. Light manufacturing 20.32 34.99
3.6. Heavy manufacturing 24.49 27.46
3.7. Utilities and construction 20.20 66.54
3.8. Transport and communications 23.01 43.97
3.9. Other services 27.54 23.55
Source: Author’s CGE simulation results based on GTAP 8 database, 2012.
231
Tab
le 5
.16. A
PTA
me
mb
ers
– C
en
tra
l A
sia
pro
jec
ted
tra
de
po
ten
tia
l m
atr
ix
(Per
cent change o
ver
2010)
Kazakh
sta
nK
yrg
yzsta
nTajikis
tan
Tu
rkm
en
ista
nU
zb
ekis
tan
Year
2020
2025
2030
2020
2025
2030
2020
2025
2030
2020
2025
2030
2020
2025
2030
Ba
ng
lad
esh
1 8
93
2 7
84
3 8
34
14
65
61
8 3
48
22
27
7-8
5-7
9-7
15
4 4
84
69
41
084
83
63
08
48
36
87
Ch
ina
25
87
16
1-9
2-8
9-8
5-4
0-7
31
63
12
82
01
36
10
21
78
India
2 6
87
5 5
27
9 8
76
26
86
26
1 1
76
68
11
47
02
67
51
79
03
04
14
66
12
82
75
72
41
0 1
16
Re
pu
blic
of
Ko
rea
27
64
41
62
9-2
9-1
9-1
02
88
31
46
18
22
53
32
5-7
2-6
1-4
8
Lao P
DR
55
75
68
4 8
46
119
19
03
30
53
27
76
40
36
60
96
32
56
63
92
45
53
76
51
79
74
31
3 5
01
Sri
La
nka
16
72
26
28
4-1
8-2
14
18
32
45
30
55
52
37
56
19
78
89
30
512
59
21
6 1
37
Sourc
e:
Based o
n a
uth
or’
s e
stim
ations.
Note
1:
Such larg
e fig
ure
s a
re b
ecause o
f a z
ero
base, i.e., a
lmost nil
export
s, and for
them
.0001 is taken for
0.
Note
2:
Negative v
alu
es.
X t
o→
→
→
→
→
/ M
fro
m↓↓↓↓ ↓
Tab
le 5
.15.
Cen
tral A
sia
– A
PTA
me
mb
ers
pro
jec
ted
tra
de
po
ten
tia
l m
atr
ix(P
er
cent change o
ver
2010)
X t
o→
→
→
→
→
/ M
fro
m ↓↓↓↓ ↓
Ba
ng
lad
es
hC
hin
aIn
dia
Re
pu
bli
c o
f K
ore
aL
ao
PD
RS
ri L
an
ka
Ye
ar
20
20
20
25
20
30
20
20
20
25
20
30
20
20
20
25
20
30
20
20
20
25
20
30
20
20
20
25
20
30
20
20
20
25
20
30
Ka
za
kh
sta
n6
111 0
93
1 7
33
140
236
343
186
399
688
122
258
430
32
47
84
5 5
32
59
51
693
239
432
Kyrg
yzsta
n3
0 7
42
31
12
63
1 3
96
-69
-68
-67
18
92
75
36
71
05
10
51
04
28
69
111
6 0
86
6 2
70
6 3
81
Ta
jikis
tan
17
24
62
2 4
73
28
01
5-8
6-8
4-8
2817
939
1 0
53
277
315
349
552
781
1 0
20
4 0
92
5 4
83
6 9
36
Turk
menis
tan
-82
-80
-79
-18
-11
-5193
215
235
259
280
299
541 6
01
586 4
30
624 7
58
315 0
20
339 3
22
360 1
81
Uzb
ekis
tan
-86
-82
-78
17
32
82
40
45
57
74
09
93
-14
41
76
1 5
02
2 0
31
2 5
76
14
79
51
9 3
80
24
07
1
So
urc
e:
Ba
se
d o
n a
uth
or’
s e
stim
atio
ns.
No
te 1
: S
uch
la
rge
fig
ure
s a
re b
eca
use
of
a z
ero
ba
se
, i.e
., a
lmo
st
nil
exp
ort
s,
an
d f
or
the
m .
00
01
is t
ake
n f
or
0.
Note
2:
Negative v
alu
es.
232
4. Mutual intra-APTA aggregate trade gains
with membership of the CARs
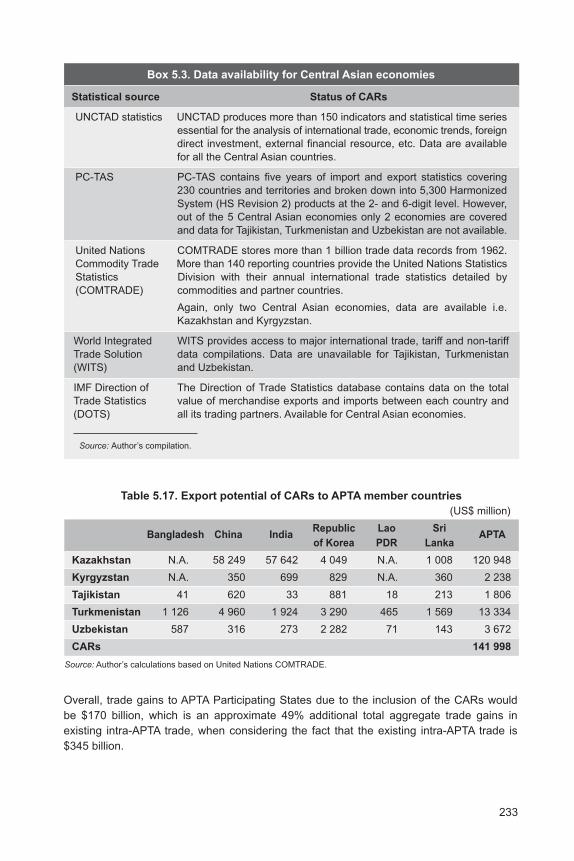
After revealing that an aggregate level trade potential exists among the CARs and the
Participating States of APTA through CARs membership in APTA, this study attempted to
identify items with high trade potential across different pairs of the CARs and the Participating
States of APTA at the product level.
It is important to highlight the type of data constraints that were faced during the course
of the study. Detailed trade data for all the CARs was not available for PCTAS at the
HS 6-digit level, which prevented identification of potential items for intraregional trade
between the CARs and the Participating States of APTA. Therefore, the UNCTAD database
was used in undertaking the same exercise at SITC 3-digit level. A synoptic view of data
availability is given in box 5.3.
Identification of the items was made at the HS 6-digit level and SITC 3-digit level with the
help of two empirical techniques, i.e., (a) the RCA index and (b) the Dynamic Comparative
Advantage.
(a) RCA = (Xij /X
it) ÷ (X
wj / X
wt)
where
Xij = Export of jth commodity from ith country to the world
Xit = Total export of ith country to the world
Xwj
= Σ Xij i(1)w, where w = set of country. = world’s total export jth commodity.
Xwt
= Σ Xit i(1)w, = world’s total export of all the commodities.
(b) The Dynamic Comparative Advantage is defined as products satisfying three
conditions of RCA that included feasibility and dynamism. Feasibility implies those products
that reveal comparative advantage, i.e. RCA >1 for CARs (APTA) was matched with RCA
<1 for APTA (CARs). The second criterion was to find which products show comparative
advantages through the period under consideration, i.e., 2008-2012. This implies that RCA
>1 is increasing over the period under consideration for one side viz. CARs (APTA) was
matched with items with RCA <1 and RCA was decreasing during the same period for the
other side viz. APTA (CARs). In order to measure how dynamic the comparative advantage
of a particular product was, the growth rate of calculated RCA value between 2008 and
2012 was considered. Next, only those products whose RCA values exhibit strictly positive
growth rate were considered. However, the number of products was being compressed
because of this technique; therefore, the results obtained from the first technique of RCA
are mainly presented here.
The trade gains by the CARs in terms of market access to APTA member countries after
becoming the Participating States of APTA turns out to be approximately $142 billion.
Similar gains for APTA some $28 billion (table 5.17 and 5.18).
233
Box 5.3. Data availability for Central Asian economies
Statistical source Status of CARs
UNCTAD statistics UNCTAD produces more than 150 indicators and statistical time series
essential for the analysis of international trade, economic trends, foreign
direct investment, external financial resource, etc. Data are available
for all the Central Asian countries.
PC-TAS PC-TAS contains five years of import and export statistics covering
230 countries and territories and broken down into 5,300 Harmonized
System (HS Revision 2) products at the 2- and 6-digit level. However,
out of the 5 Central Asian economies only 2 economies are covered
and data for Tajikistan, Turkmenistan and Uzbekistan are not available.
United Nations COMTRADE stores more than 1 billion trade data records from 1962.
Commodity Trade More than 140 reporting countries provide the United Nations Statistics
Statistics Division with their annual international trade statistics detailed by
(COMTRADE) commodities and partner countries.
Again, only two Central Asian economies, data are available i.e.
Kazakhstan and Kyrgyzstan.
World Integrated WITS provides access to major international trade, tariff and non-tariff
Trade Solution data compilations. Data are unavailable for Tajikistan, Turkmenistan
(WITS) and Uzbekistan.
IMF Direction of The Direction of Trade Statistics database contains data on the total
Trade Statistics value of merchandise exports and imports between each country and
(DOTS) all its trading partners. Available for Central Asian economies.
Source: Author’s compilation.
Table 5.17. Export potential of CARs to APTA member countries
(US$ million)
Bangladesh China India
Republic Lao SriAPTA
of Korea PDR Lanka
Kazakhstan N.A. 58 249 57 642 4 049 N.A. 1 008 120 948
Kyrgyzstan N.A. 350 699 829 N.A. 360 2 238
Tajikistan 41 620 33 881 18 213 1 806
Turkmenistan 1 126 4 960 1 924 3 290 465 1 569 13 334
Uzbekistan 587 316 273 2 282 71 143 3 672
CARs 141 998
Source: Author’s calculations based on United Nations COMTRADE.
Overall, trade gains to APTA Participating States due to the inclusion of the CARs would
be $170 billion, which is an approximate 49% additional total aggregate trade gains in
existing intra-APTA trade, when considering the fact that the existing intra-APTA trade is
$345 billion.
234
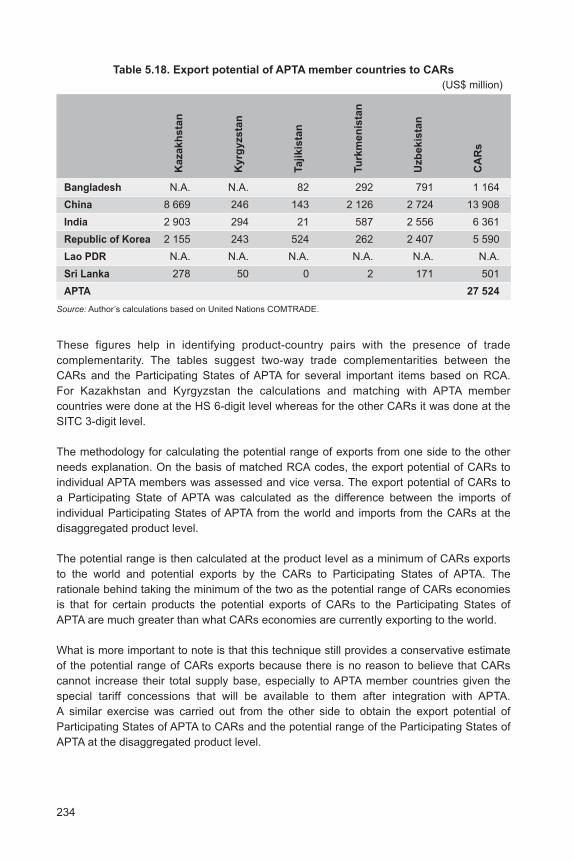
These figures help in identifying product-country pairs with the presence of trade
complementarity. The tables suggest two-way trade complementarities between the
CARs and the Participating States of APTA for several important items based on RCA.
For Kazakhstan and Kyrgyzstan the calculations and matching with APTA member
countries were done at the HS 6-digit level whereas for the other CARs it was done at the
SITC 3-digit level.
The methodology for calculating the potential range of exports from one side to the other
needs explanation. On the basis of matched RCA codes, the export potential of CARs to
individual APTA members was assessed and vice versa. The export potential of CARs to
a Participating State of APTA was calculated as the difference between the imports of
individual Participating States of APTA from the world and imports from the CARs at the
disaggregated product level.
The potential range is then calculated at the product level as a minimum of CARs exports
to the world and potential exports by the CARs to Participating States of APTA. The
rationale behind taking the minimum of the two as the potential range of CARs economies
is that for certain products the potential exports of CARs to the Participating States of
APTA are much greater than what CARs economies are currently exporting to the world.
What is more important to note is that this technique still provides a conservative estimate
of the potential range of CARs exports because there is no reason to believe that CARs
cannot increase their total supply base, especially to APTA member countries given the
special tariff concessions that will be available to them after integration with APTA.
A similar exercise was carried out from the other side to obtain the export potential of
Participating States of APTA to CARs and the potential range of the Participating States of
APTA at the disaggregated product level.
Table 5.18. Export potential of APTA member countries to CARs
(US$ million)
Bangladesh N.A. N.A. 82 292 791 1 164
China 8 669 246 143 2 126 2 724 13 908
India 2 903 294 21 587 2 556 6 361
Republic of Korea 2 155 243 524 262 2 407 5 590
Lao PDR N.A. N.A. N.A. N.A. N.A. N.A.
Sri Lanka 278 50 0 2 171 501
APTA 27 524
Source: Author’s calculations based on United Nations COMTRADE.
Kazakh
sta
n
Ky
rgy
zs
tan
Tajikis
tan
Tu
rkm
en
ista
n
Uzb
ek
ista
n
CA
Rs
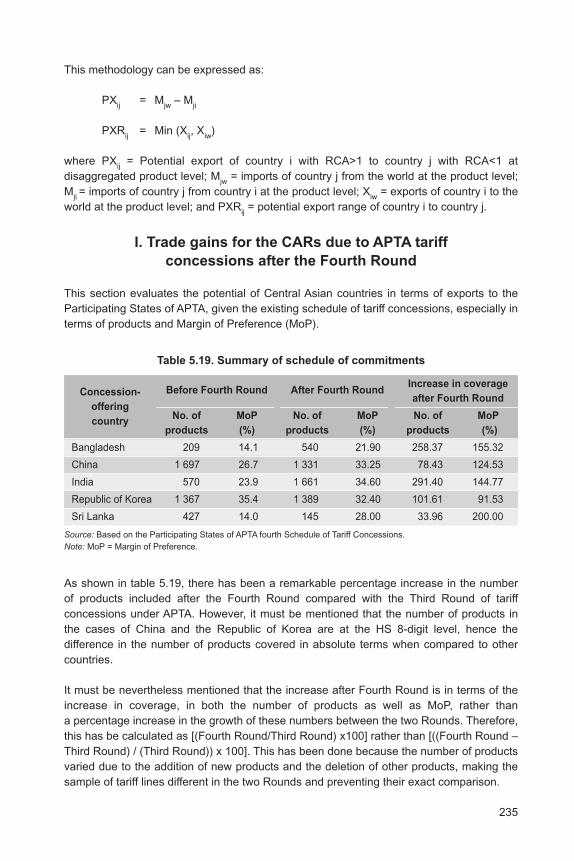
235
This methodology can be expressed as:
PXij
= Mjw
– Mji
PXRij
= Min (Xij, X
iw)
where PXij = Potential export of country i with RCA>1 to country j with RCA<1 at
disaggregated product level; Mjw
= imports of country j from the world at the product level;
Mji = imports of country j from country i at the product level; X
iw = exports of country i to the
world at the product level; and PXRij = potential export range of country i to country j.
I. Trade gains for the CARs due to APTA tariff
concessions after the Fourth Round
This section evaluates the potential of Central Asian countries in terms of exports to the
Participating States of APTA, given the existing schedule of tariff concessions, especially in
terms of products and Margin of Preference (MoP).
Table 5.19. Summary of schedule of commitments
Before Fourth Round After Fourth RoundIncrease in coverage
after Fourth Round
No. of MoP No. of MoP No. of MoP
products (%) products (%) products (%)
Bangladesh 209 14.1 540 21.90 258.37 155.32
China 1 697 26.7 1 331 33.25 78.43 124.53
India 570 23.9 1 661 34.60 291.40 144.77
Republic of Korea 1 367 35.4 1 389 32.40 101.61 91.53
Sri Lanka 427 14.0 145 28.00 33.96 200.00
Source: Based on the Participating States of APTA fourth Schedule of Tariff Concessions.
Note: MoP = Margin of Preference.
Concession-
offering
country
As shown in table 5.19, there has been a remarkable percentage increase in the number
of products included after the Fourth Round compared with the Third Round of tariff
concessions under APTA. However, it must be mentioned that the number of products in
the cases of China and the Republic of Korea are at the HS 8-digit level, hence the
difference in the number of products covered in absolute terms when compared to other
countries.
It must be nevertheless mentioned that the increase after Fourth Round is in terms of the
increase in coverage, in both the number of products as well as MoP, rather than
a percentage increase in the growth of these numbers between the two Rounds. Therefore,
this has be calculated as [(Fourth Round/Third Round) x100] rather than [((Fourth Round –
Third Round) / (Third Round)) x 100]. This has been done because the number of products
varied due to the addition of new products and the deletion of other products, making the
sample of tariff lines different in the two Rounds and preventing their exact comparison.
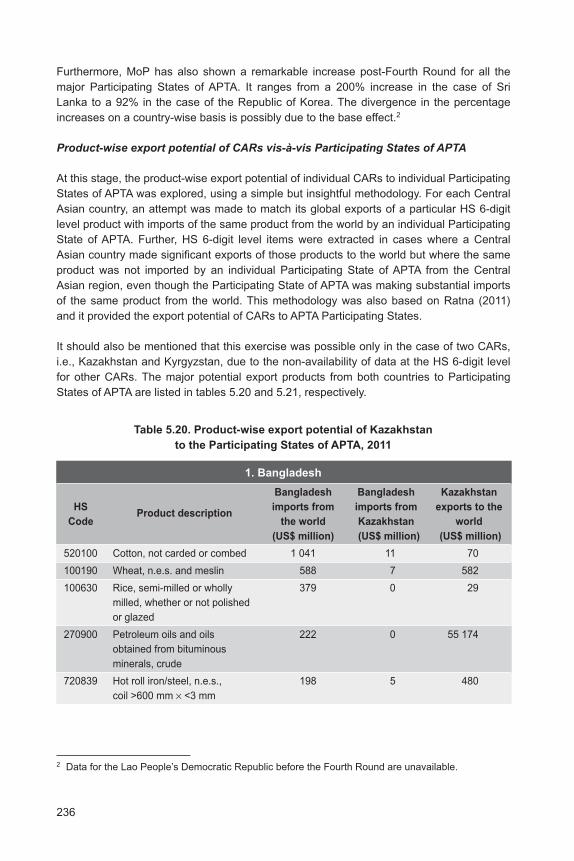
236
Furthermore, MoP has also shown a remarkable increase post-Fourth Round for all the
major Participating States of APTA. It ranges from a 200% increase in the case of Sri
Lanka to a 92% in the case of the Republic of Korea. The divergence in the percentage
increases on a country-wise basis is possibly due to the base effect.2
Product-wise export potential of CARs vis-à-vis Participating States of APTA
At this stage, the product-wise export potential of individual CARs to individual Participating
States of APTA was explored, using a simple but insightful methodology. For each Central
Asian country, an attempt was made to match its global exports of a particular HS 6-digit
level product with imports of the same product from the world by an individual Participating
State of APTA. Further, HS 6-digit level items were extracted in cases where a Central
Asian country made significant exports of those products to the world but where the same
product was not imported by an individual Participating State of APTA from the Central
Asian region, even though the Participating State of APTA was making substantial imports
of the same product from the world. This methodology was also based on Ratna (2011)
and it provided the export potential of CARs to APTA Participating States.
It should also be mentioned that this exercise was possible only in the case of two CARs,
i.e., Kazakhstan and Kyrgyzstan, due to the non-availability of data at the HS 6-digit level
for other CARs. The major potential export products from both countries to Participating
States of APTA are listed in tables 5.20 and 5.21, respectively.
2 Data for the Lao People’s Democratic Republic before the Fourth Round are unavailable.
Table 5.20. Product-wise export potential of Kazakhstan
to the Participating States of APTA, 2011
1. Bangladesh
Bangladesh Bangladesh Kazakhstan
HSProduct description
imports from imports from exports to the
Code the world Kazakhstan world
(US$ million) (US$ million) (US$ million)
520100 Cotton, not carded or combed 1 041 11 70
100190 Wheat, n.e.s. and meslin 588 7 582
100630 Rice, semi-milled or wholly 379 0 29
milled, whether or not polished
or glazed
270900 Petroleum oils and oils 222 0 55 174
obtained from bituminous
minerals, crude
720839 Hot roll iron/steel, n.e.s., 198 5 480
coil >600 mm × <3 mm
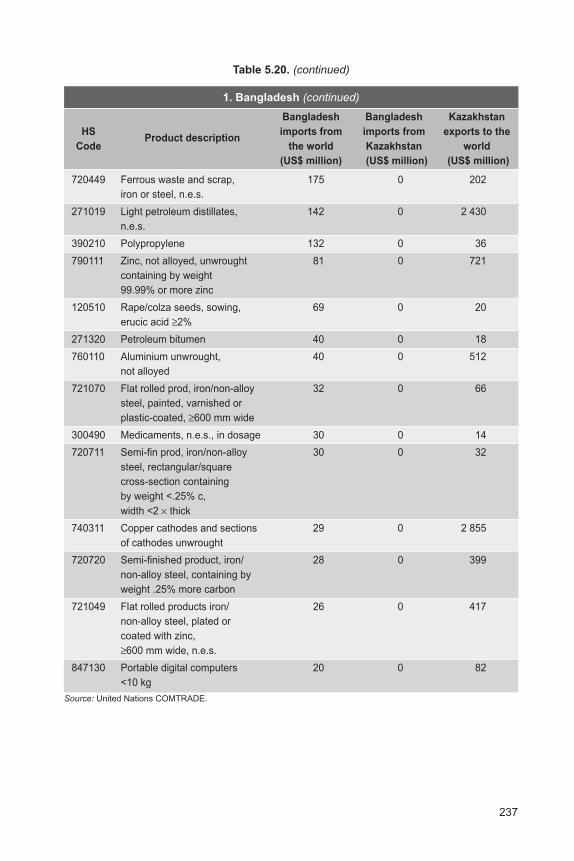
237
Table 5.20. (continued)
1. Bangladesh (continued)
Bangladesh Bangladesh Kazakhstan
HSProduct description
imports from imports from exports to the
Code the world Kazakhstan world
(US$ million) (US$ million) (US$ million)
720449 Ferrous waste and scrap, 175 0 202
iron or steel, n.e.s.
271019 Light petroleum distillates, 142 0 2 430
n.e.s.
390210 Polypropylene 132 0 36
790111 Zinc, not alloyed, unwrought 81 0 721
containing by weight
99.99% or more zinc
120510 Rape/colza seeds, sowing, 69 0 20
erucic acid ≥2%
271320 Petroleum bitumen 40 0 18
760110 Aluminium unwrought, 40 0 512
not alloyed
721070 Flat rolled prod, iron/non-alloy 32 0 66
steel, painted, varnished or
plastic-coated, ≥600 mm wide
300490 Medicaments, n.e.s., in dosage 30 0 14
720711 Semi-fin prod, iron/non-alloy 30 0 32
steel, rectangular/square
cross-section containing
by weight <.25% c,
width <2 × thick
740311 Copper cathodes and sections 29 0 2 855
of cathodes unwrought
720720 Semi-finished product, iron/ 28 0 399
non-alloy steel, containing by
weight .25% more carbon
721049 Flat rolled products iron/ 26 0 417
non-alloy steel, plated or
coated with zinc,
≥600 mm wide, n.e.s.
847130 Portable digital computers 20 0 82
<10 kg
Source: United Nations COMTRADE.
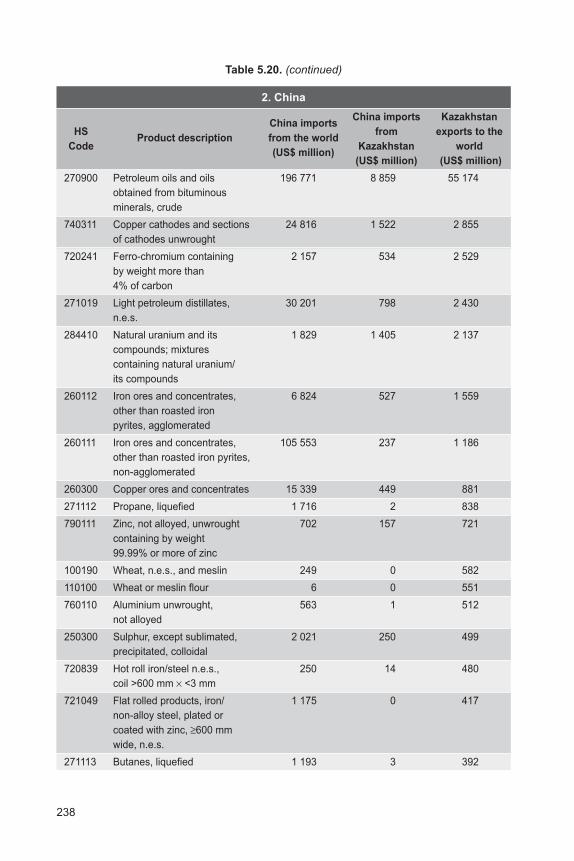
238
Table 5.20. (continued)
2. China
China importsChina imports Kazakhstan
HSProduct description from the world
from exports to the
Code(US$ million)
Kazakhstan world
(US$ million) (US$ million)
270900 Petroleum oils and oils 196 771 8 859 55 174
obtained from bituminous
minerals, crude
740311 Copper cathodes and sections 24 816 1 522 2 855
of cathodes unwrought
720241 Ferro-chromium containing 2 157 534 2 529
by weight more than
4% of carbon
271019 Light petroleum distillates, 30 201 798 2 430
n.e.s.
284410 Natural uranium and its 1 829 1 405 2 137
compounds; mixtures
containing natural uranium/
its compounds
260112 Iron ores and concentrates, 6 824 527 1 559
other than roasted iron
pyrites, agglomerated
260111 Iron ores and concentrates, 105 553 237 1 186
other than roasted iron pyrites,
non-agglomerated
260300 Copper ores and concentrates 15 339 449 881
271112 Propane, liquefied 1 716 2 838
790111 Zinc, not alloyed, unwrought 702 157 721
containing by weight
99.99% or more of zinc
100190 Wheat, n.e.s., and meslin 249 0 582
110100 Wheat or meslin flour 6 0 551
760110 Aluminium unwrought, 563 1 512
not alloyed
250300 Sulphur, except sublimated, 2 021 250 499
precipitated, colloidal
720839 Hot roll iron/steel n.e.s., 250 14 480
coil >600 mm × <3 mm
721049 Flat rolled products, iron/ 1 175 0 417
non-alloy steel, plated or
coated with zinc, ≥600 mm
wide, n.e.s.
271113 Butanes, liquefied 1 193 3 392
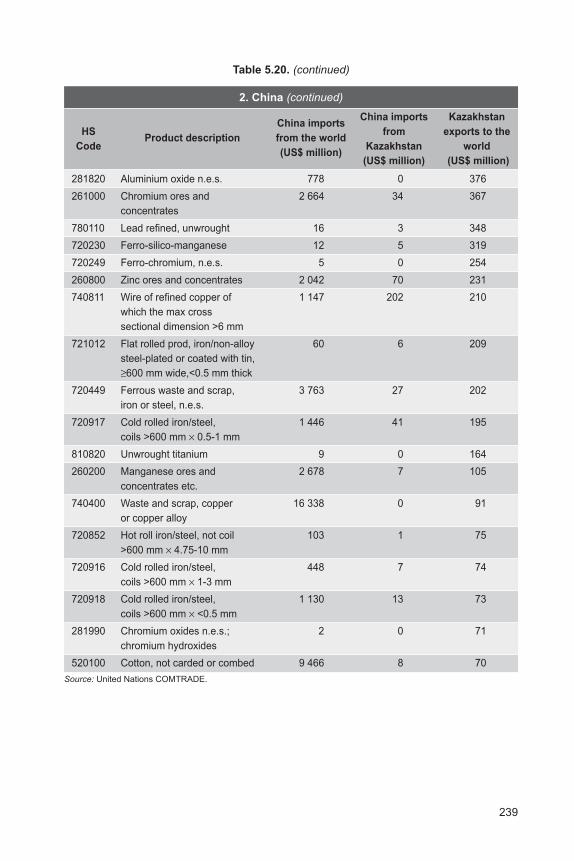
239
Table 5.20. (continued)
2. China (continued)
China importsChina imports Kazakhstan
HSProduct description from the world
from exports to the
Code(US$ million)
Kazakhstan world
(US$ million) (US$ million)
281820 Aluminium oxide n.e.s. 778 0 376
261000 Chromium ores and 2 664 34 367
concentrates
780110 Lead refined, unwrought 16 3 348
720230 Ferro-silico-manganese 12 5 319
720249 Ferro-chromium, n.e.s. 5 0 254
260800 Zinc ores and concentrates 2 042 70 231
740811 Wire of refined copper of 1 147 202 210
which the max cross
sectional dimension >6 mm
721012 Flat rolled prod, iron/non-alloy 60 6 209
steel-plated or coated with tin,
≥600 mm wide,<0.5 mm thick
720449 Ferrous waste and scrap, 3 763 27 202
iron or steel, n.e.s.
720917 Cold rolled iron/steel, 1 446 41 195
coils >600 mm × 0.5-1 mm
810820 Unwrought titanium 9 0 164
260200 Manganese ores and 2 678 7 105
concentrates etc.
740400 Waste and scrap, copper 16 338 0 91
or copper alloy
720852 Hot roll iron/steel, not coil 103 1 75
>600 mm × 4.75-10 mm
720916 Cold rolled iron/steel, 448 7 74
coils >600 mm × 1-3 mm
720918 Cold rolled iron/steel, 1 130 13 73
coils >600 mm × <0.5 mm
281990 Chromium oxides n.e.s.; 2 0 71
chromium hydroxides
520100 Cotton, not carded or combed 9 466 8 70
Source: United Nations COMTRADE.
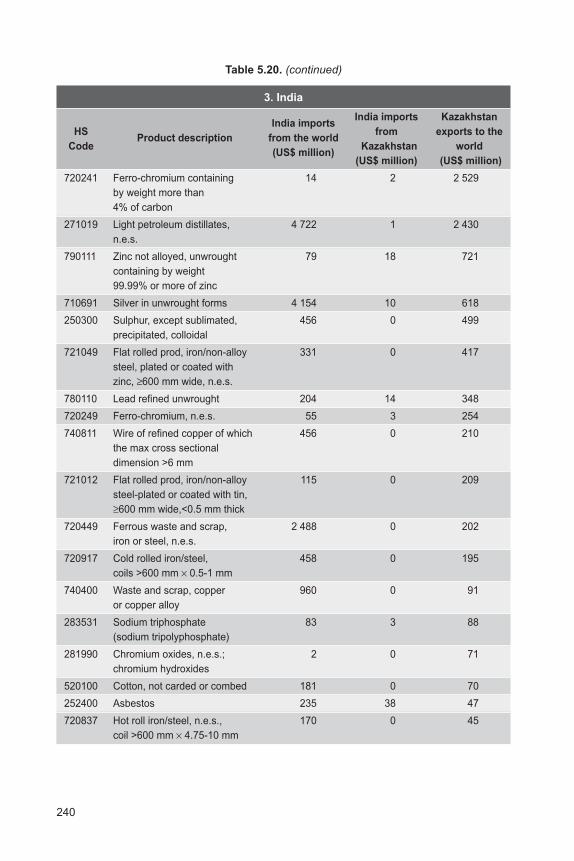
240
Table 5.20. (continued)
3. India
India importsIndia imports Kazakhstan
HSProduct description from the world
from exports to the
Code(US$ million)
Kazakhstan world
(US$ million) (US$ million)
720241 Ferro-chromium containing 14 2 2 529
by weight more than
4% of carbon
271019 Light petroleum distillates, 4 722 1 2 430
n.e.s.
790111 Zinc not alloyed, unwrought 79 18 721
containing by weight
99.99% or more of zinc
710691 Silver in unwrought forms 4 154 10 618
250300 Sulphur, except sublimated, 456 0 499
precipitated, colloidal
721049 Flat rolled prod, iron/non-alloy 331 0 417
steel, plated or coated with
zinc, ≥600 mm wide, n.e.s.
780110 Lead refined unwrought 204 14 348
720249 Ferro-chromium, n.e.s. 55 3 254
740811 Wire of refined copper of which 456 0 210
the max cross sectional
dimension >6 mm
721012 Flat rolled prod, iron/non-alloy 115 0 209
steel-plated or coated with tin,
≥600 mm wide,<0.5 mm thick
720449 Ferrous waste and scrap, 2 488 0 202
iron or steel, n.e.s.
720917 Cold rolled iron/steel, 458 0 195
coils >600 mm × 0.5-1 mm
740400 Waste and scrap, copper 960 0 91
or copper alloy
283531 Sodium triphosphate 83 3 88
(sodium tripolyphosphate)
281990 Chromium oxides, n.e.s.; 2 0 71
chromium hydroxides
520100 Cotton, not carded or combed 181 0 70
252400 Asbestos 235 38 47
720837 Hot roll iron/steel, n.e.s., 170 0 45
coil >600 mm × 4.75-10 mm
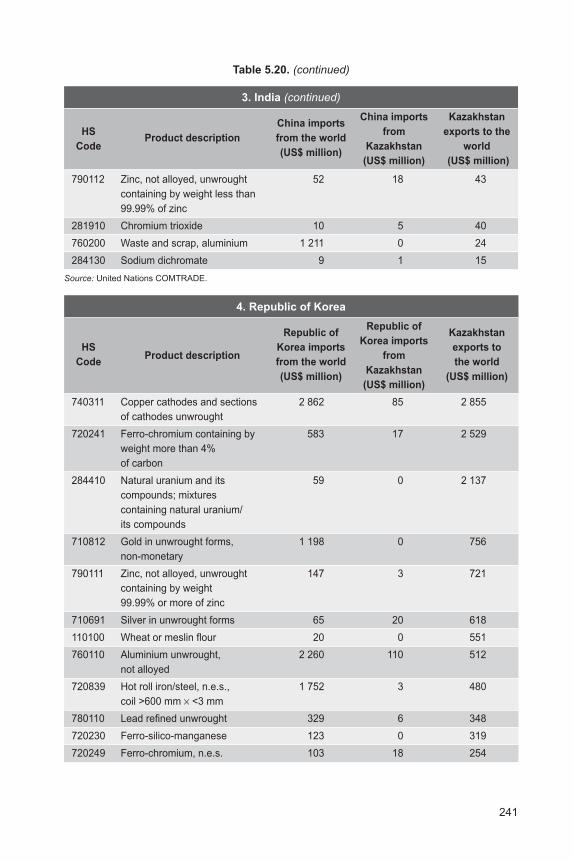
241
Table 5.20. (continued)
3. India (continued)
China importsChina imports Kazakhstan
HSProduct description from the world
from exports to the
Code(US$ million)
Kazakhstan world
(US$ million) (US$ million)
790112 Zinc, not alloyed, unwrought 52 18 43
containing by weight less than
99.99% of zinc
281910 Chromium trioxide 10 5 40
760200 Waste and scrap, aluminium 1 211 0 24
284130 Sodium dichromate 9 1 15
Source: United Nations COMTRADE.
4. Republic of Korea
Republic ofRepublic of
Kazakhstan
HS Korea importsKorea imports
exports to
CodeProduct description
from the worldfrom
the world
(US$ million)Kazakhstan
(US$ million)(US$ million)
740311 Copper cathodes and sections 2 862 85 2 855
of cathodes unwrought
720241 Ferro-chromium containing by 583 17 2 529
weight more than 4%
of carbon
284410 Natural uranium and its 59 0 2 137
compounds; mixtures
containing natural uranium/
its compounds
710812 Gold in unwrought forms, 1 198 0 756
non-monetary
790111 Zinc, not alloyed, unwrought 147 3 721
containing by weight
99.99% or more of zinc
710691 Silver in unwrought forms 65 20 618
110100 Wheat or meslin flour 20 0 551
760110 Aluminium unwrought, 2 260 110 512
not alloyed
720839 Hot roll iron/steel, n.e.s., 1 752 3 480
coil >600 mm × <3 mm
780110 Lead refined unwrought 329 6 348
720230 Ferro-silico-manganese 123 0 319
720249 Ferro-chromium, n.e.s. 103 18 254
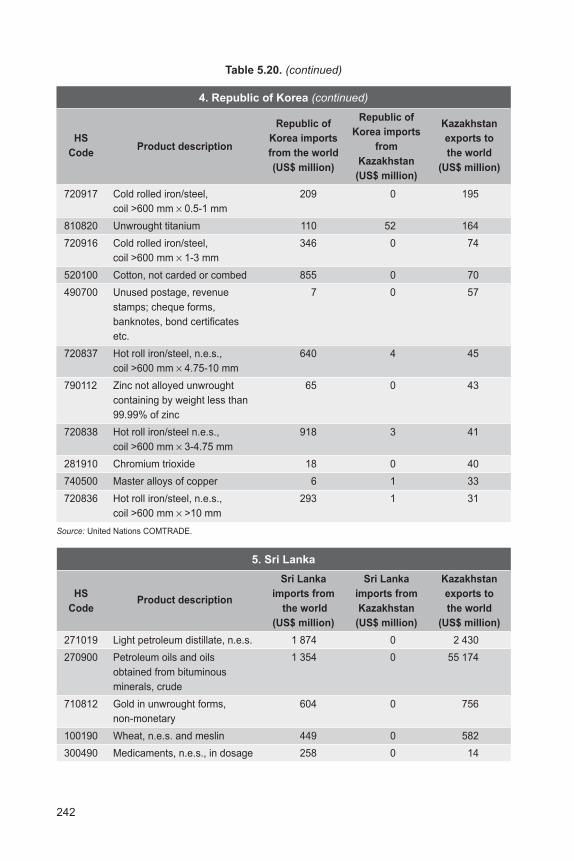
242
Table 5.20. (continued)
4. Republic of Korea (continued)
Republic ofRepublic of
Kazakhstan
HS Korea importsKorea imports
exports to
CodeProduct description
from the worldfrom
the world
(US$ million)Kazakhstan
(US$ million)(US$ million)
720917 Cold rolled iron/steel, 209 0 195
coil >600 mm × 0.5-1 mm
810820 Unwrought titanium 110 52 164
720916 Cold rolled iron/steel, 346 0 74
coil >600 mm × 1-3 mm
520100 Cotton, not carded or combed 855 0 70
490700 Unused postage, revenue 7 0 57
stamps; cheque forms,
banknotes, bond certificates
etc.
720837 Hot roll iron/steel, n.e.s., 640 4 45
coil >600 mm × 4.75-10 mm
790112 Zinc not alloyed unwrought 65 0 43
containing by weight less than
99.99% of zinc
720838 Hot roll iron/steel n.e.s., 918 3 41
coil >600 mm × 3-4.75 mm
281910 Chromium trioxide 18 0 40
740500 Master alloys of copper 6 1 33
720836 Hot roll iron/steel, n.e.s., 293 1 31
coil >600 mm × >10 mm
Source: United Nations COMTRADE.
5. Sri Lanka
Sri Lanka Sri Lanka Kazakhstan
HSProduct description
imports from imports from exports to
Code the world Kazakhstan the world
(US$ million) (US$ million) (US$ million)
271019 Light petroleum distillate, n.e.s. 1 874 0 2 430
270900 Petroleum oils and oils 1 354 0 55 174
obtained from bituminous
minerals, crude
710812 Gold in unwrought forms, 604 0 756
non-monetary
100190 Wheat, n.e.s. and meslin 449 0 582
300490 Medicaments, n.e.s., in dosage 258 0 14
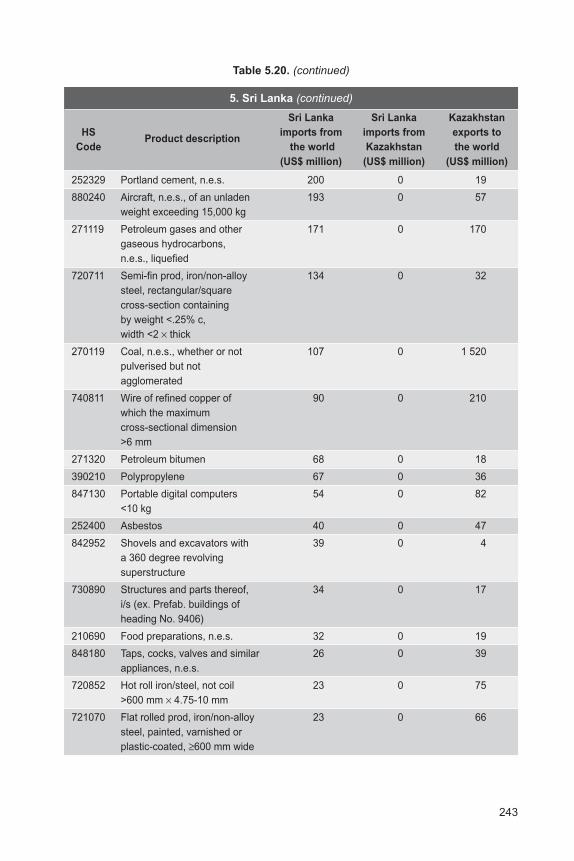
243
Table 5.20. (continued)
5. Sri Lanka (continued)
Sri Lanka Sri Lanka Kazakhstan
HSProduct description
imports from imports from exports to
Code the world Kazakhstan the world
(US$ million) (US$ million) (US$ million)
252329 Portland cement, n.e.s. 200 0 19
880240 Aircraft, n.e.s., of an unladen 193 0 57
weight exceeding 15,000 kg
271119 Petroleum gases and other 171 0 170
gaseous hydrocarbons,
n.e.s., liquefied
720711 Semi-fin prod, iron/non-alloy 134 0 32
steel, rectangular/square
cross-section containing
by weight <.25% c,
width <2 × thick
270119 Coal, n.e.s., whether or not 107 0 1 520
pulverised but not
agglomerated
740811 Wire of refined copper of 90 0 210
which the maximum
cross-sectional dimension
>6 mm
271320 Petroleum bitumen 68 0 18
390210 Polypropylene 67 0 36
847130 Portable digital computers 54 0 82
<10 kg
252400 Asbestos 40 0 47
842952 Shovels and excavators with 39 0 4
a 360 degree revolving
superstructure
730890 Structures and parts thereof, 34 0 17
i/s (ex. Prefab. buildings of
heading No. 9406)
210690 Food preparations, n.e.s. 32 0 19
848180 Taps, cocks, valves and similar 26 0 39
appliances, n.e.s.
720852 Hot roll iron/steel, not coil 23 0 75
>600 mm × 4.75-10 mm
721070 Flat rolled prod, iron/non-alloy 23 0 66
steel, painted, varnished or
plastic-coated, ≥600 mm wide
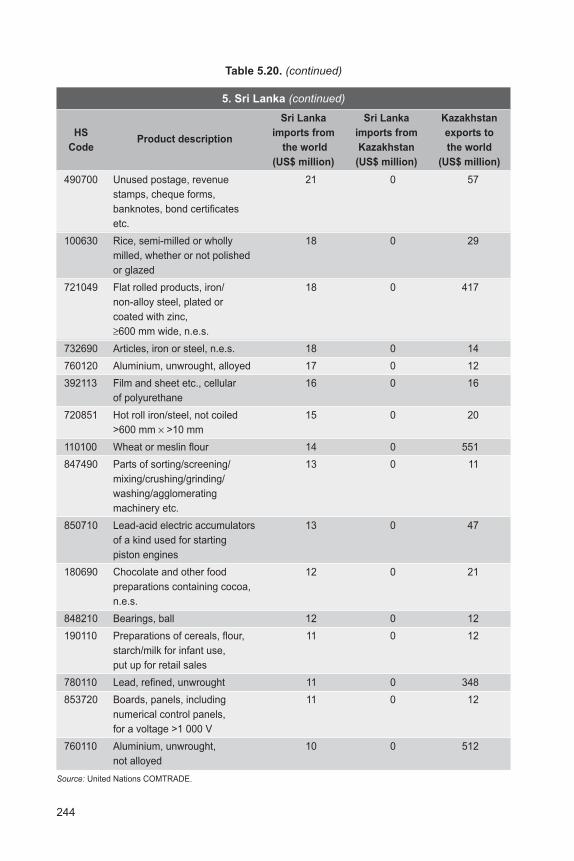
244
Table 5.20. (continued)
5. Sri Lanka (continued)
Sri Lanka Sri Lanka Kazakhstan
HSProduct description
imports from imports from exports to
Code the world Kazakhstan the world
(US$ million) (US$ million) (US$ million)
490700 Unused postage, revenue 21 0 57
stamps, cheque forms,
banknotes, bond certificates
etc.
100630 Rice, semi-milled or wholly 18 0 29
milled, whether or not polished
or glazed
721049 Flat rolled products, iron/ 18 0 417
non-alloy steel, plated or
coated with zinc,
≥600 mm wide, n.e.s.
732690 Articles, iron or steel, n.e.s. 18 0 14
760120 Aluminium, unwrought, alloyed 17 0 12
392113 Film and sheet etc., cellular 16 0 16
of polyurethane
720851 Hot roll iron/steel, not coiled 15 0 20
>600 mm × >10 mm
110100 Wheat or meslin flour 14 0 551
847490 Parts of sorting/screening/ 13 0 11
mixing/crushing/grinding/
washing/agglomerating
machinery etc.
850710 Lead-acid electric accumulators 13 0 47
of a kind used for starting
piston engines
180690 Chocolate and other food 12 0 21
preparations containing cocoa,
n.e.s.
848210 Bearings, ball 12 0 12
190110 Preparations of cereals, flour, 11 0 12
starch/milk for infant use,
put up for retail sales
780110 Lead, refined, unwrought 11 0 348
853720 Boards, panels, including 11 0 12
numerical control panels,
for a voltage >1 000 V
760110 Aluminium, unwrought, 10 0 512
not alloyed
Source: United Nations COMTRADE.
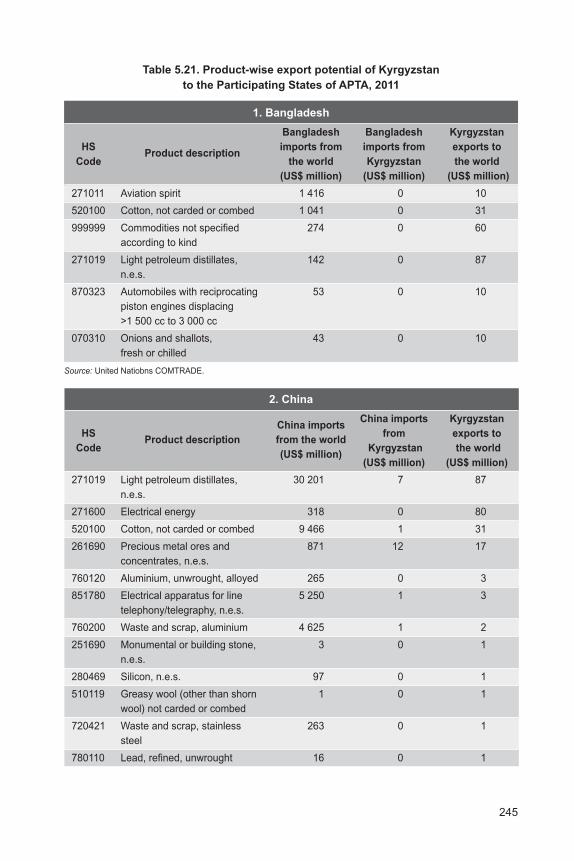
245
Table 5.21. Product-wise export potential of Kyrgyzstan
to the Participating States of APTA, 2011
1. Bangladesh
Bangladesh Bangladesh Kyrgyzstan
HSProduct description
imports from imports from exports to
Code the world Kyrgyzstan the world
(US$ million) (US$ million) (US$ million)
271011 Aviation spirit 1 416 0 10
520100 Cotton, not carded or combed 1 041 0 31
999999 Commodities not specified 274 0 60
according to kind
271019 Light petroleum distillates, 142 0 87
n.e.s.
870323 Automobiles with reciprocating 53 0 10
piston engines displacing
>1 500 cc to 3 000 cc
070310 Onions and shallots, 43 0 10
fresh or chilled
Source: United Natiobns COMTRADE.
2. China
China importsChina imports Kyrgyzstan
HSProduct description from the world
from exports to
Code(US$ million)
Kyrgyzstan the world
(US$ million) (US$ million)
271019 Light petroleum distillates, 30 201 7 87
n.e.s.
271600 Electrical energy 318 0 80
520100 Cotton, not carded or combed 9 466 1 31
261690 Precious metal ores and 871 12 17
concentrates, n.e.s.
760120 Aluminium, unwrought, alloyed 265 0 3
851780 Electrical apparatus for line 5 250 1 3
telephony/telegraphy, n.e.s.
760200 Waste and scrap, aluminium 4 625 1 2
251690 Monumental or building stone, 3 0 1
n.e.s.
280469 Silicon, n.e.s. 97 0 1
510119 Greasy wool (other than shorn 1 0 1
wool) not carded or combed
720421 Waste and scrap, stainless 263 0 1
steel
780110 Lead, refined, unwrought 16 0 1
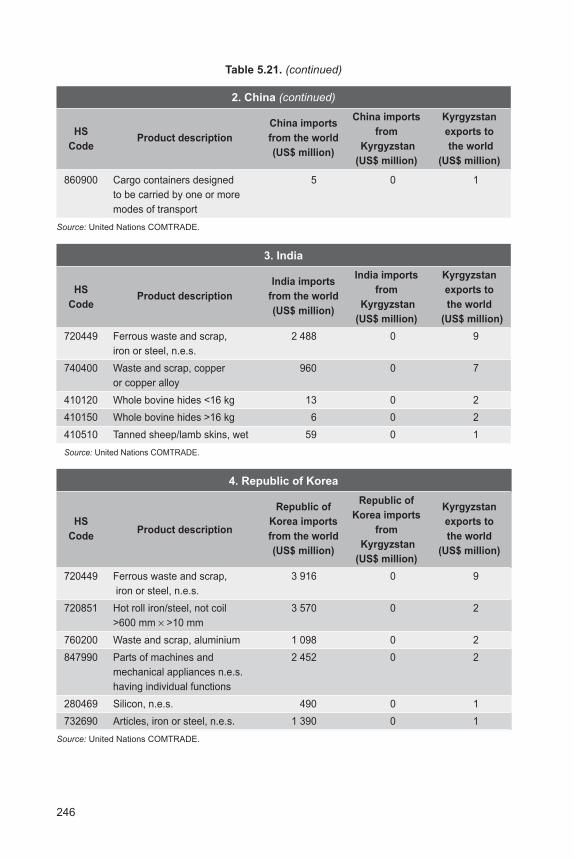
246
Table 5.21. (continued)
2. China (continued)
China importsChina imports Kyrgyzstan
HSProduct description from the world
from exports to
Code(US$ million)
Kyrgyzstan the world
(US$ million) (US$ million)
860900 Cargo containers designed 5 0 1
to be carried by one or more
modes of transport
Source: United Nations COMTRADE.
3. India
India importsIndia imports Kyrgyzstan
HSProduct description from the world
from exports to
Code(US$ million)
Kyrgyzstan the world
(US$ million) (US$ million)
720449 Ferrous waste and scrap, 2 488 0 9
iron or steel, n.e.s.
740400 Waste and scrap, copper 960 0 7
or copper alloy
410120 Whole bovine hides <16 kg 13 0 2
410150 Whole bovine hides >16 kg 6 0 2
410510 Tanned sheep/lamb skins, wet 59 0 1
Source: United Nations COMTRADE.
4. Republic of Korea
Republic ofRepublic of
Kyrgyzstan
HS Korea importsKorea imports
exports to
CodeProduct description
from the worldfrom
the world
(US$ million) Kyrgyzstan
(US$ million)(US$ million)
720449 Ferrous waste and scrap, 3 916 0 9
iron or steel, n.e.s.
720851 Hot roll iron/steel, not coil 3 570 0 2
>600 mm × >10 mm
760200 Waste and scrap, aluminium 1 098 0 2
847990 Parts of machines and 2 452 0 2
mechanical appliances n.e.s.
having individual functions
280469 Silicon, n.e.s. 490 0 1
732690 Articles, iron or steel, n.e.s. 1 390 0 1
Source: United Nations COMTRADE.
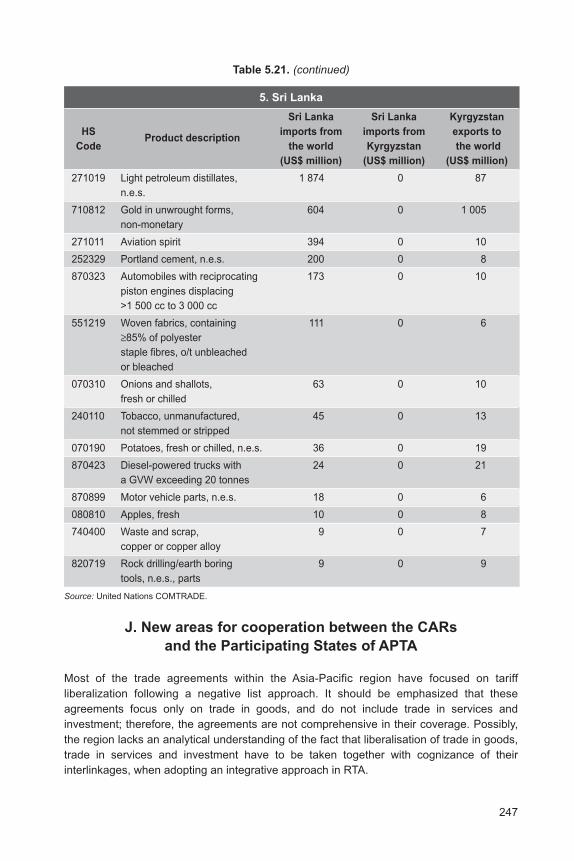
247
Table 5.21. (continued)
5. Sri Lanka
Sri Lanka Sri Lanka Kyrgyzstan
HSProduct description
imports from imports from exports to
Code the world Kyrgyzstan the world
(US$ million) (US$ million) (US$ million)
271019 Light petroleum distillates, 1 874 0 87
n.e.s.
710812 Gold in unwrought forms, 604 0 1 005
non-monetary
271011 Aviation spirit 394 0 10
252329 Portland cement, n.e.s. 200 0 8
870323 Automobiles with reciprocating 173 0 10
piston engines displacing
>1 500 cc to 3 000 cc
551219 Woven fabrics, containing 111 0 6
≥85% of polyester
staple fibres, o/t unbleached
or bleached
070310 Onions and shallots, 63 0 10
fresh or chilled
240110 Tobacco, unmanufactured, 45 0 13
not stemmed or stripped
070190 Potatoes, fresh or chilled, n.e.s. 36 0 19
870423 Diesel-powered trucks with 24 0 21
a GVW exceeding 20 tonnes
870899 Motor vehicle parts, n.e.s. 18 0 6
080810 Apples, fresh 10 0 8
740400 Waste and scrap, 9 0 7
copper or copper alloy
820719 Rock drilling/earth boring 9 0 9
tools, n.e.s., parts
Source: United Nations COMTRADE.
J. New areas for cooperation between the CARs
and the Participating States of APTA
Most of the trade agreements within the Asia-Pacific region have focused on tariff
liberalization following a negative list approach. It should be emphasized that these
agreements focus only on trade in goods, and do not include trade in services and
investment; therefore, the agreements are not comprehensive in their coverage. Possibly,
the region lacks an analytical understanding of the fact that liberalisation of trade in goods,
trade in services and investment have to be taken together with cognizance of their
interlinkages, when adopting an integrative approach in RTA.
248
On the other hand, within the realms of APTA, the Framework Agreement on Investment
and the Framework Agreement on Trade in Services, together with the Framework
Agreement on Trade Facilitation, once implemented through the liberalisation commitments
would help the CARs to integrate with the Participating States of APTA in these areas,
especially due to three reasons: (a) greater investment needs to achieve developmental
objectives such as employment generation; (b) a high share of services in their GDP; and
(c) high trade costs due to the landlockedness of the CARs. These together form an
important basis for CARs’ membership in APTA.
Against this backdrop, there are a few important areas in which the CARs and the
Participating States of APTA can cooperate. These are summarized below.
1. Investment cooperation: Horizontal specialization
and vertical integration
As pointed out in section J above, the strengthening of trade-investment linkages is
a prerequisite for achieving effective regional economic integration; however, this aspect is
neglected in several FTAs, more so in the context of the CARs. This type of linkage helps
to improve the export supply capabilities of the smaller countries.
The trade-investment linkages also run in both the directions. While an FTA can spur
investment flows in terms of efficiency-seeking regional restructuring, it is the trade-creating
joint ventures that ultimately have a decisive impact on regional trade flows. The
trade-creating joint ventures are in a position to take advantage of the regional freer trade
agreement. In this context, in a dynamic scenario, focus could be on vertical integration
and horizontal specialization with the help of cross-country investment flows that strengthen
trade-investment linkages. Essentially this may mean regional distribution of different stages
of production in a particular industry in an integrated manner, i.e., vertical integration and
specialization in the same stage of production with the help of product differentiation
across the region (horizontal specialization). This is the basis of the argument highlighting
the imperatives of investment cooperation within the ambit of the intra-Central Asia
investment integration as well as between the Central Asia and APTA economic integration
process.
Such processes have been largely confined to sectors such as food processing, cotton
and power generation. Based on the industrial structure and the service sector economies
in the CARs as well as the analysis pertaining to identification of sectors and products for
future trade integration, within CARs and with APTA member countries, it is easy to identify
potentials for FDI integration to scale up the initiative pertaining to vertical integration and
horizontal specialization. Some of the sectors amenable to such endeavours include the
dairy sector, sugar, fruit and vegetables, textiles and apparel, chemicals, automobiles and
electronics, among others.
Considering the trade-investment nexus, the economic integration of the CARs with the
Participating States of APTA could be stepped up by focusing on trade-creating joint
ventures; the reduction and elimination of investment regulation that may impede investment
flows; harmonization of investment regimes with all other members; and special focus on
249
the transfer of technology. Investment protection and facilitation would be crucial in the
area of energy production and trade through environment-friendly technologies. The above
would be consistent with the Framework Agreement on Investment of APTA member
countries.
2. Trade in services integration
Services are different in their characteristics compared with goods. These unique
characteristics also influence the way international transactions in services are conducted.
Services possess three main characteristics that make them very different from goods.
First, they are intangible, although often incorporated in tangible products. Second, they
are non-storable. Finally, they involve a simultaneous action between the service provider
and the service consumer. Moreover, unlike goods production, ownership of services is
often not transferred during the process of service provision. Hence, services cannot be
stored. Instead, the service supplier stores the capacity to provide service to be rendered
when there is a demand for that service. The inability to store means that services are
mostly produced and consumed simultaneously.
Due to the above characteristics, trade in services assumes a special character. The
simultaneous nature of service transaction has an impact on the modalities of international
transactions in services. Thus, issues related to trade in services need to be approached
differently from trade in goods. For services trade to occur, the means of transporting
services often have to be allowed to cross national boundaries. This makes international
transaction in services more complex conceptually than international transactions in goods.
As noted earlier in this study, the services sector accounts for a large share in GDP of the
CARs. Due to statistical constraints, it is not possible to identify the importance of trade in
services in the overall trade volumes of the Central Asian countries. However, recourse to
secondary material on the Central Asian economies reveals that some of the sectors that
could be considered for trade in services integration include: (a) telecommunications and
information technology (IT); (b) professional services; (c) construction and related engineering
services; (d) educational services; (e) environmental services; (f) health-related services;
(g) tourism and travel-related services; and (h) audio-visual services.
Given that the Framework Agreement on Trade in Services under APTA is already in place,
it would be important to harness trade in services prospects between the CARs and the
Participating States of APTA. This can be done in a framework of GATS-plus commitments.
Some of the areas amenable to cooperation include travel and tourism, transportation,
education, health, IT, banking and finance, recreational services, among others. To tap the
potential of trade in services in some of these new areas, cooperation in terms of Mutual
Recognition Agreements (MRAs) as well as the recognition of mutual standards and
qualifications will be crucial.
Having analysed the prospects for regional economic integration in the Central Asian
region and with the Participating States of APTA, it is imperative to identify certain relevant
constraints that have prevented the region from integration, both within and outside, in
a meaningful manner.
250
3. Trade facilitation
The basic prerequisite for trade integration between the CARs and the Participating States
of APTA is the establishment of an adequate trading facilitation infrastructure. In this
context, simplification and harmonization of trade procedures and practices will be crucial,
as mandated by the Framework Agreement on Trade Facilitation under APTA. Some of the
prime areas for cooperation may include: (a) notification of existing and new trade laws
and regulations, including amendments; (b) the harmonization of trade-related fees; (c) the
establishment of a Single Window for trade data and documentation requirements; (d) the
establishment of risk assessment and management procedures; and (e) the use of automatic
and information technology in customs procedures.
Central Asian countries have undergone some major reforms since independence and
have intensified their regional cooperation efforts; however, their integration into the global
economy remains limited. One reason could be unnecessary high trade costs, resulting
partly from the landlocked situation of these countries, which makes trade and transit
problems especially severe. Trade facilitation has an extremely important role to play in
Central Asian countries as it can lead to expansion in intraregional and interregional trade,
which is supposed to stimulate investment and economic growth in the long term. The
benefits from the removal of deficiencies and inefficiencies in cross-border trade are expected
to be much higher than the benefits realized from the removal of tariff barriers.
Trade facilitation is aimed at simplifying and harmonizing these procedures. The region
requires a shift in trade policy that includes more trade facilitation measures rather than
trade control measures.
International agreements on standardized forms can help in achieving this goal. The
Framework Agreement on Trade Facilitation under APTA is one such example. This
Framework Agreement addresses the areas of transparency and consistency, simplicity
and efficiency as well as harmonization, standardization and cooperation. It includes
additional provisions for institutional arrangements and assistance to LDC members. It
promotes trade facilitation as an important module of a comprehensive strategy for national
and regional development. It also focuses on strengthening regional cooperation in trade
and related technical assistance, and capacity-building in trade facilitation, including
paperless trade. The integration of CARs with APTA can help to gain benefits from such an
international agreement, and can also gain from technical and other forms of assistance
provided to member countries as part of this agreement.
Overall, the CARs would benefit from joining APTA due to the Framework Agreement on
Trade Facilitation, as some of these countries share borders with China and Mongolia.
4. Energy security
The Asia-Pacific region has become increasingly dependent on energy imports to meet its
energy requirements. Thus, addressing this challenge is an important issue for the
development of countries in the region, more so among the Participating States of APTA.
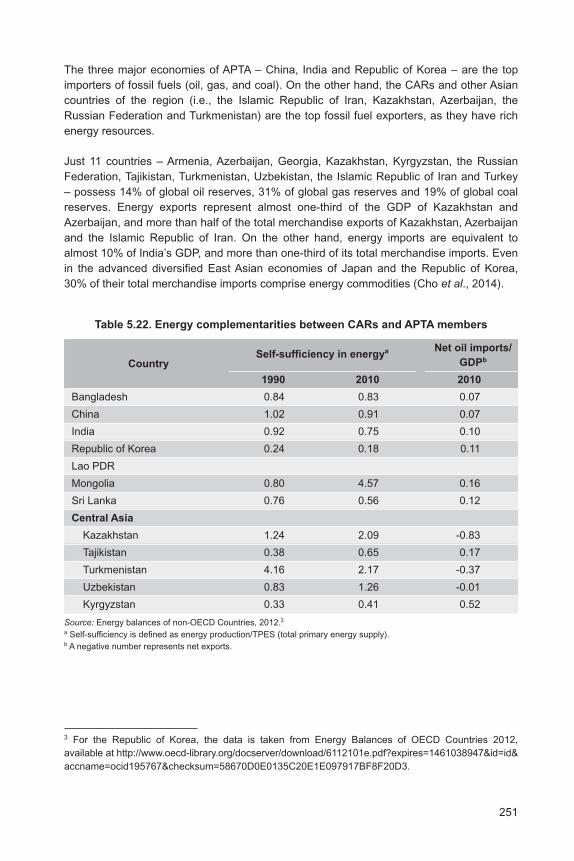
251
The three major economies of APTA – China, India and Republic of Korea – are the top
importers of fossil fuels (oil, gas, and coal). On the other hand, the CARs and other Asian
countries of the region (i.e., the Islamic Republic of Iran, Kazakhstan, Azerbaijan, the
Russian Federation and Turkmenistan) are the top fossil fuel exporters, as they have rich
energy resources.
Just 11 countries – Armenia, Azerbaijan, Georgia, Kazakhstan, Kyrgyzstan, the Russian
Federation, Tajikistan, Turkmenistan, Uzbekistan, the Islamic Republic of Iran and Turkey
– possess 14% of global oil reserves, 31% of global gas reserves and 19% of global coal
reserves. Energy exports represent almost one-third of the GDP of Kazakhstan and
Azerbaijan, and more than half of the total merchandise exports of Kazakhstan, Azerbaijan
and the Islamic Republic of Iran. On the other hand, energy imports are equivalent to
almost 10% of India’s GDP, and more than one-third of its total merchandise imports. Even
in the advanced diversified East Asian economies of Japan and the Republic of Korea,
30% of their total merchandise imports comprise energy commodities (Cho et al., 2014).
Table 5.22. Energy complementarities between CARs and APTA members
CountrySelf-sufficiency in energya Net oil imports/
GDPb
1990 2010 2010
Bangladesh 0.84 0.83 0.07
China 1.02 0.91 0.07
India 0.92 0.75 0.10
Republic of Korea 0.24 0.18 0.11
Lao PDR
Mongolia 0.80 4.57 0.16
Sri Lanka 0.76 0.56 0.12
Central Asia
Kazakhstan 1.24 2.09 -0.83
Tajikistan 0.38 0.65 0.17
Turkmenistan 4.16 2.17 -0.37
Uzbekistan 0.83 1.26 -0.01
Kyrgyzstan 0.33 0.41 0.52
Source: Energy balances of non-OECD Countries, 2012.3
a Self-sufficiency is defined as energy production/TPES (total primary energy supply).b A negative number represents net exports.
3 For the Republic of Korea, the data is taken from Energy Balances of OECD Countries 2012,
available at http://www.oecd-library.org/docserver/download/6112101e.pdf?expires=1461038947&id=id&
accname=ocid195767&checksum=58670D0E0135C20E1E097917BF8F20D3.
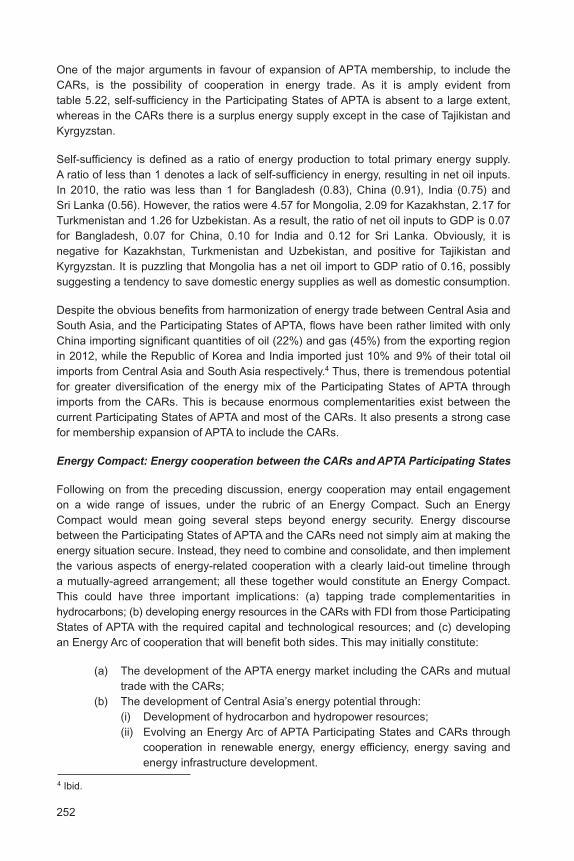
252
One of the major arguments in favour of expansion of APTA membership, to include the
CARs, is the possibility of cooperation in energy trade. As it is amply evident from
table 5.22, self-sufficiency in the Participating States of APTA is absent to a large extent,
whereas in the CARs there is a surplus energy supply except in the case of Tajikistan and
Kyrgyzstan.
Self-sufficiency is defined as a ratio of energy production to total primary energy supply.
A ratio of less than 1 denotes a lack of self-sufficiency in energy, resulting in net oil inputs.
In 2010, the ratio was less than 1 for Bangladesh (0.83), China (0.91), India (0.75) and
Sri Lanka (0.56). However, the ratios were 4.57 for Mongolia, 2.09 for Kazakhstan, 2.17 for
Turkmenistan and 1.26 for Uzbekistan. As a result, the ratio of net oil inputs to GDP is 0.07
for Bangladesh, 0.07 for China, 0.10 for India and 0.12 for Sri Lanka. Obviously, it is
negative for Kazakhstan, Turkmenistan and Uzbekistan, and positive for Tajikistan and
Kyrgyzstan. It is puzzling that Mongolia has a net oil import to GDP ratio of 0.16, possibly
suggesting a tendency to save domestic energy supplies as well as domestic consumption.
Despite the obvious benefits from harmonization of energy trade between Central Asia and
South Asia, and the Participating States of APTA, flows have been rather limited with only
China importing significant quantities of oil (22%) and gas (45%) from the exporting region
in 2012, while the Republic of Korea and India imported just 10% and 9% of their total oil
imports from Central Asia and South Asia respectively.4 Thus, there is tremendous potential
for greater diversification of the energy mix of the Participating States of APTA through
imports from the CARs. This is because enormous complementarities exist between the
current Participating States of APTA and most of the CARs. It also presents a strong case
for membership expansion of APTA to include the CARs.
Energy Compact: Energy cooperation between the CARs and APTA Participating States
Following on from the preceding discussion, energy cooperation may entail engagement
on a wide range of issues, under the rubric of an Energy Compact. Such an Energy
Compact would mean going several steps beyond energy security. Energy discourse
between the Participating States of APTA and the CARs need not simply aim at making the
energy situation secure. Instead, they need to combine and consolidate, and then implement
the various aspects of energy-related cooperation with a clearly laid-out timeline through
a mutually-agreed arrangement; all these together would constitute an Energy Compact.
This could have three important implications: (a) tapping trade complementarities in
hydrocarbons; (b) developing energy resources in the CARs with FDI from those Participating
States of APTA with the required capital and technological resources; and (c) developing
an Energy Arc of cooperation that will benefit both sides. This may initially constitute:
(a) The development of the APTA energy market including the CARs and mutual
trade with the CARs;
(b) The development of Central Asia’s energy potential through:
(i) Development of hydrocarbon and hydropower resources;
(ii) Evolving an Energy Arc of APTA Participating States and CARs through
cooperation in renewable energy, energy efficiency, energy saving and
energy infrastructure development.
4 Ibid.
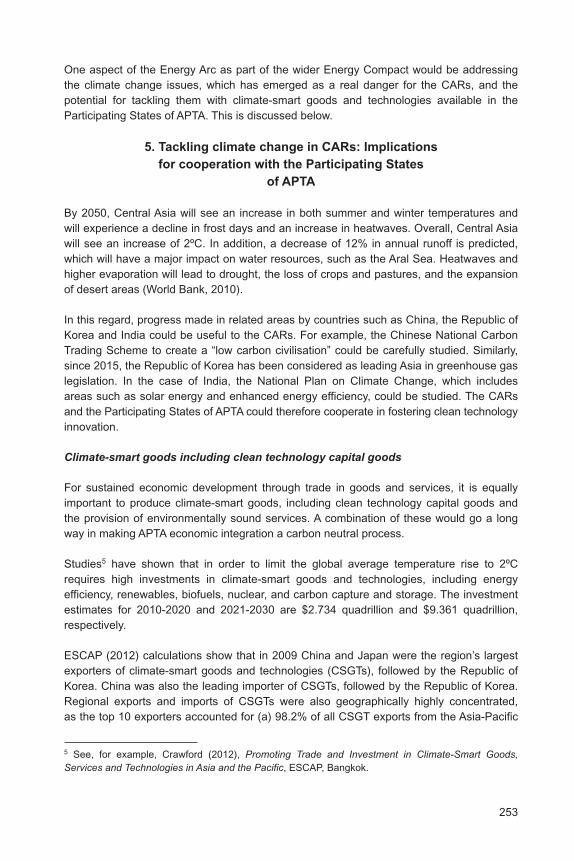
253
One aspect of the Energy Arc as part of the wider Energy Compact would be addressing
the climate change issues, which has emerged as a real danger for the CARs, and the
potential for tackling them with climate-smart goods and technologies available in the
Participating States of APTA. This is discussed below.
5. Tackling climate change in CARs: Implications
for cooperation with the Participating States
of APTA
By 2050, Central Asia will see an increase in both summer and winter temperatures and
will experience a decline in frost days and an increase in heatwaves. Overall, Central Asia
will see an increase of 2ºC. In addition, a decrease of 12% in annual runoff is predicted,
which will have a major impact on water resources, such as the Aral Sea. Heatwaves and
higher evaporation will lead to drought, the loss of crops and pastures, and the expansion
of desert areas (World Bank, 2010).
In this regard, progress made in related areas by countries such as China, the Republic of
Korea and India could be useful to the CARs. For example, the Chinese National Carbon
Trading Scheme to create a “low carbon civilisation” could be carefully studied. Similarly,
since 2015, the Republic of Korea has been considered as leading Asia in greenhouse gas
legislation. In the case of India, the National Plan on Climate Change, which includes
areas such as solar energy and enhanced energy efficiency, could be studied. The CARs
and the Participating States of APTA could therefore cooperate in fostering clean technology
innovation.
Climate-smart goods including clean technology capital goods
For sustained economic development through trade in goods and services, it is equally
important to produce climate-smart goods, including clean technology capital goods and
the provision of environmentally sound services. A combination of these would go a long
way in making APTA economic integration a carbon neutral process.
Studies5 have shown that in order to limit the global average temperature rise to 2ºC
requires high investments in climate-smart goods and technologies, including energy
efficiency, renewables, biofuels, nuclear, and carbon capture and storage. The investment
estimates for 2010-2020 and 2021-2030 are $2.734 quadrillion and $9.361 quadrillion,
respectively.
ESCAP (2012) calculations show that in 2009 China and Japan were the region’s largest
exporters of climate-smart goods and technologies (CSGTs), followed by the Republic of
Korea. China was also the leading importer of CSGTs, followed by the Republic of Korea.
Regional exports and imports of CSGTs were also geographically highly concentrated,
as the top 10 exporters accounted for (a) 98.2% of all CSGT exports from the Asia-Pacific
5 See, for example, Crawford (2012), Promoting Trade and Investment in Climate-Smart Goods,
Services and Technologies in Asia and the Pacific, ESCAP, Bangkok.
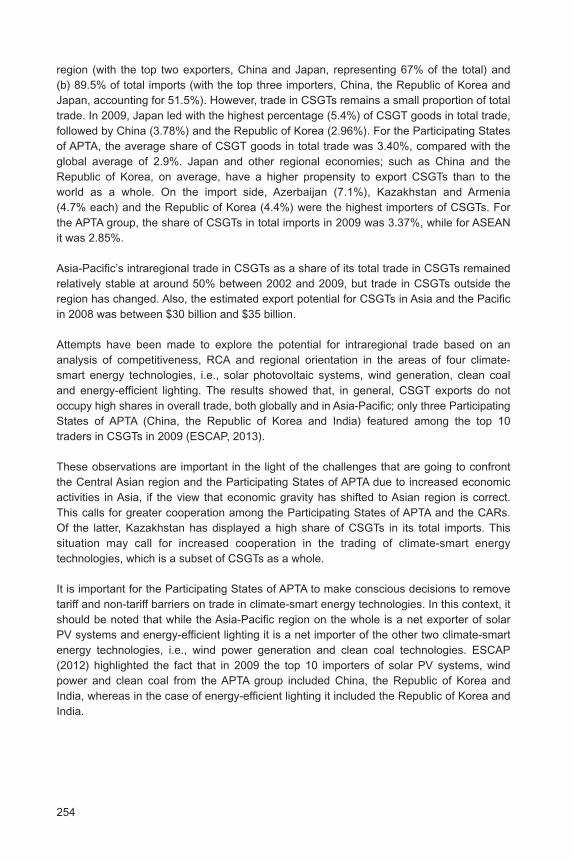
254
region (with the top two exporters, China and Japan, representing 67% of the total) and
(b) 89.5% of total imports (with the top three importers, China, the Republic of Korea and
Japan, accounting for 51.5%). However, trade in CSGTs remains a small proportion of total
trade. In 2009, Japan led with the highest percentage (5.4%) of CSGT goods in total trade,
followed by China (3.78%) and the Republic of Korea (2.96%). For the Participating States
of APTA, the average share of CSGT goods in total trade was 3.40%, compared with the
global average of 2.9%. Japan and other regional economies; such as China and the
Republic of Korea, on average, have a higher propensity to export CSGTs than to the
world as a whole. On the import side, Azerbaijan (7.1%), Kazakhstan and Armenia
(4.7% each) and the Republic of Korea (4.4%) were the highest importers of CSGTs. For
the APTA group, the share of CSGTs in total imports in 2009 was 3.37%, while for ASEAN
it was 2.85%.
Asia-Pacific’s intraregional trade in CSGTs as a share of its total trade in CSGTs remained
relatively stable at around 50% between 2002 and 2009, but trade in CSGTs outside the
region has changed. Also, the estimated export potential for CSGTs in Asia and the Pacific
in 2008 was between $30 billion and $35 billion.
Attempts have been made to explore the potential for intraregional trade based on an
analysis of competitiveness, RCA and regional orientation in the areas of four climate-
smart energy technologies, i.e., solar photovoltaic systems, wind generation, clean coal
and energy-efficient lighting. The results showed that, in general, CSGT exports do not
occupy high shares in overall trade, both globally and in Asia-Pacific; only three Participating
States of APTA (China, the Republic of Korea and India) featured among the top 10
traders in CSGTs in 2009 (ESCAP, 2013).
These observations are important in the light of the challenges that are going to confront
the Central Asian region and the Participating States of APTA due to increased economic
activities in Asia, if the view that economic gravity has shifted to Asian region is correct.
This calls for greater cooperation among the Participating States of APTA and the CARs.
Of the latter, Kazakhstan has displayed a high share of CSGTs in its total imports. This
situation may call for increased cooperation in the trading of climate-smart energy
technologies, which is a subset of CSGTs as a whole.
It is important for the Participating States of APTA to make conscious decisions to remove
tariff and non-tariff barriers on trade in climate-smart energy technologies. In this context, it
should be noted that while the Asia-Pacific region on the whole is a net exporter of solar
PV systems and energy-efficient lighting it is a net importer of the other two climate-smart
energy technologies, i.e., wind power generation and clean coal technologies. ESCAP
(2012) highlighted the fact that in 2009 the top 10 importers of solar PV systems, wind
power and clean coal from the APTA group included China, the Republic of Korea and
India, whereas in the case of energy-efficient lighting it included the Republic of Korea and
India.
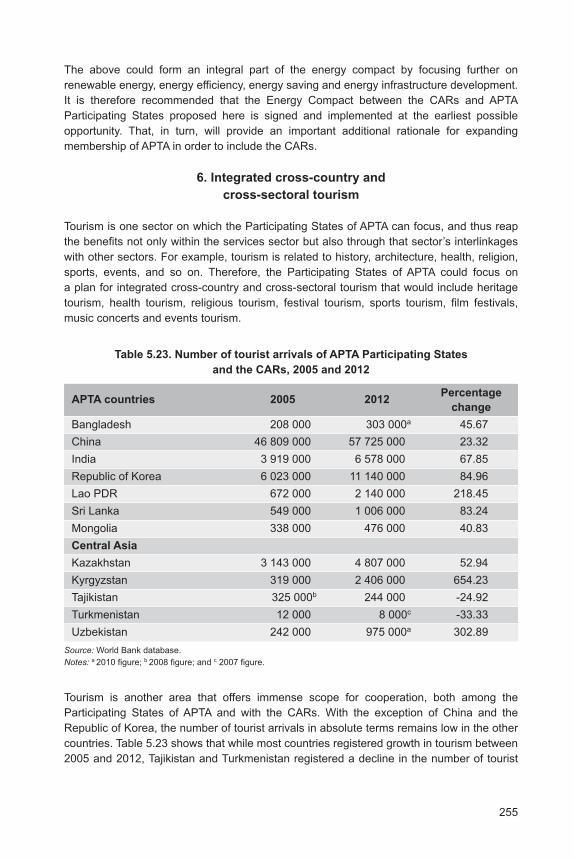
255
The above could form an integral part of the energy compact by focusing further on
renewable energy, energy efficiency, energy saving and energy infrastructure development.
It is therefore recommended that the Energy Compact between the CARs and APTA
Participating States proposed here is signed and implemented at the earliest possible
opportunity. That, in turn, will provide an important additional rationale for expanding
membership of APTA in order to include the CARs.
6. Integrated cross-country and
cross-sectoral tourism
Tourism is one sector on which the Participating States of APTA can focus, and thus reap
the benefits not only within the services sector but also through that sector’s interlinkages
with other sectors. For example, tourism is related to history, architecture, health, religion,
sports, events, and so on. Therefore, the Participating States of APTA could focus on
a plan for integrated cross-country and cross-sectoral tourism that would include heritage
tourism, health tourism, religious tourism, festival tourism, sports tourism, film festivals,
music concerts and events tourism.
Table 5.23. Number of tourist arrivals of APTA Participating States
and the CARs, 2005 and 2012
APTA countries 2005 2012Percentage
change
Bangladesh 208 000 303 000a 45.67
China 46 809 000 57 725 000 23.32
India 3 919 000 6 578 000 67.85
Republic of Korea 6 023 000 11 140 000 84.96
Lao PDR 672 000 2 140 000 218.45
Sri Lanka 549 000 1 006 000 83.24
Mongolia 338 000 476 000 40.83
Central Asia
Kazakhstan 3 143 000 4 807 000 52.94
Kyrgyzstan 319 000 2 406 000 654.23
Tajikistan 325 000b 244 000 -24.92
Turkmenistan 12 000 8 000c -33.33
Uzbekistan 242 000 975 000a 302.89
Source: World Bank database.
Notes: a 2010 figure; b 2008 figure; and c 2007 figure.
Tourism is another area that offers immense scope for cooperation, both among the
Participating States of APTA and with the CARs. With the exception of China and the
Republic of Korea, the number of tourist arrivals in absolute terms remains low in the other
countries. Table 5.23 shows that while most countries registered growth in tourism between
2005 and 2012, Tajikistan and Turkmenistan registered a decline in the number of tourist
256
arrivals. This suggests a need for cooperation within the Participating States of APTA and
the CARs to harness the commercial opportunities for trade and services in the various
areas of the tourism sector as people travel with different purposes in mind.
The tourism sector has the potential to create a major increase of economic activities in
trade in goods, trade in services and investment that cannot be overemphasized. Increased
tourist arrivals in the Participating States of APTA and its expanded membership of the
CARs could boost businesses related to construction, transportation, telecommunications,
health services, financial and insurance services, automobiles, restaurants and the
entertainment sectors.
K. Constraints to inclusion of the CARs
in APTA
Based on available secondary material and the existing literature on the subject, this
chapter has attempted to summarize the various constraints that may act against the
CARs’ inclusion in APTA. There are several studies which have observed the present of
significant barriers to trade and investment integration in the CARs pertaining to trade
policy, connectivity, banking infrastructure etc. (Pomfret, 2006; ADB, 2006; EC, 2007;
McGlinchey and Johnson, 2005; EIB, 2012; Das, 2013; Das et al., 2012). It is important to
deal with these issues in order to develop a policy strategy that will enable the CARs to
take full advantage of their membership of APTA. These issues include:
(a) Tariffs, export taxes and NTBs. The more significant trade barriers pertaining
to the CARs include:
(i) A complex tariff schedule and relatively high tariffs (Kazakhstan and
Uzbekistan);
(ii) Escalation of tariffs (all the CARs);
(iii) Frequent and unpredictable changes in the tariff schedule (Kazakhstan,
Tajikistan and Uzbekistan);
(iv) High implicit tariffs in the form of taxes that are levied on imported goods,
but not on domestically produced goods, or higher rates for imported
goods than for domestically produced goods (Kazakhstan, and
Uzbekistan);
(v) Explicit export taxes (Kazakhstan); and
(vi) Prohibition and licensing of exports and imports of certain commodities
(all the CARs). Uzbekistan appears to be continuing the application of
restrictions on access to foreign exchange in regulating imports as well
as the imposition of relatively tight restrictions on the cross-border
movement of people and transport equipment in an apparent effort to
restrict imports from neighbouring countries. These would have to be
tackled during tariff negotiations in APTA;
(b) Kazakhstan as a CU member. The average applied tariff in the CU is around
7%-8% which is at a similar level to the Participating States of APTA. As
a result, the scope for tariff liberalization based on MoP with regard to MFN
257
rates would be limited if the CARs need to be included in APTA. Therefore, it
is imperative that APTA moves from a mere PTA to FTA and an even more
comprehensive arrangement by evolving into a Comprehensive Economic
Cooperation Agreement of Asia-Pacific (CECAAP), as argued in the APTA
Roadmap (Pomfret, 2006; ADB, 2006; EC, 2007; McGlinchey and Johnson,
2005; EIB, 2012; Das, 2013; Das et al., 2012);
(c) Hard infrastructure. Other significant barriers to trade in Central Asia are high
transport costs, and long and unpredictable transport times for international
shipments to and from the CARs. This is not only because of the landlocked
and remote location of the CARs and their difficult topography, but also due to
deficiencies in their transport networks, high costs and low quality of
transportation and logistics services in the region, and difficulties with the
movement of goods and transport equipment across borders and through the
territories of the CARs and neighbouring countries. Air connectivity is yet
another area that constrains trade and investment linkages, thus restricting
business-to-business contacts, educational services, health services, tourism
linkages etc. This is particularly true of the linkages between Central Asia and
other Asian regions. Telecommunications linkages at times also act as
a constraint, especially in South Asia. Internet regulatory policy varies across
the CARs, thus acting as a major constraint to smooth electronic connectivity,
which is vital for effective intraregional and extraregional trade and investment
linkages;
(d) Soft infrastructure. Trade facilitating customs procedures and rules are at
differing levels of evolution in the CARs, and they lack harmonization across
countries, thus acting as a major bottleneck for intraregional and extraregional
trade linkages. This not only includes customs valuation and definitional issues
but also procedural delays, complex documentation and inefficient clearances.
Foreign direct investment and capacity-building programmes need to build on
the soft infrastructure;
(e) WTO accession. A lack of WTO membership for the non-member States,
except Kazakhstan, Kyrgyzstan and Tajikistan, is a big constraint to trade
flows, as WTO consistency in various rules makes trade regimes more
harmonized and streamlined. Even for the WTO members, the capacity to
deal with WTO issues remains rather limited;
(f) Banking systems. The Central Asian region has been making a transition from
the former Soviet Union era to a more market-based economic and banking
system. In the CARs, inadequate banking services in many areas is
constraining development of the private sector, especially in the case of small
and medium-sized enterprises; this has remained an area of concern for
augmenting trade and investment, both within and outside the region.
Managing credit quality, de-leveraging and developing a stable source of
funding are important challenges for banks in the region, together with structural
transformation and diversification in the banking sector. Several areas of trade
finance, credit guarantee and insurance facilities remain underdeveloped.
258
Overall, the lack of adequate financial intermediation is acting as a major
constraint to the trade-related and FDI-inducing trusted business environment,
which has deleterious implications for regional and interregional economic
integration;
(g) Investment regime. The investment climate remains unpredictable in most of
the CARs. It is characterized by confusing laws and regulations, often enforced
arbitrarily. Problems facing investment have been identified in the area of land
property rights, as they have not yet been fully established in most of the
CARs. Policy reforms focusing on privatization and restructuring of the larger
economic entities are far from completion. Moreover, registration and licensing
procedures are time-consuming and need rationalization;
(h) Language barriers. Inadequate knowledge of the English language, which is
one of the most important business languages, acts as a barrier in Central
Asia. This has important implications for the CARs’ extraregional trade and
investment linkages, especially when the focus is on Central Asia-APTA
integration. While a common language within the Central Asian region is an
advantage for intra-Central Asia integration, a lack of adequate knowledge of
the English language could still act as a barrier when intraregional integration
is viewed in terms of its linkages with the global economy. In other words,
intraregional integration should not to be considered as an endeavour which
is confined just to the region; it needs to be viewed alongside its business
linkages with other parts of the Asia-Pacific region and even the rest of the
world.
L. Conclusions and policy
recommendations
This chapter explores ways and means of making the relatively lesser-integrated Central
Asian region more integrated with APTA through the strengthening of trade and investment
linkages, and provides an assessment of its feasibility. On the other hand, it is important
for APTA to become a truly Pan-Asian economic grouping, which it currently is not and
therefore faces serious challenges from other mega-economic groupings, both within Asia
and outside the region. For this to happen, among the several existing constraints, APTA
must focus on the expansion of its membership in order to widen the scope and scale of its
economic complementarities.
1. Conclusions
The broad conclusions of the present study can be summarised as follows:
(a) The macroeconomic context of the CARs suggests that these economies are
quite amenable to regional economic integration with the Participating States
of APTA, which can in turn help in achieving their growth and developmental
objectives;
259
(b) The trade structures of the CARs are characterized by production-trade
mismatch – a less diversified manufacturing base and adverse terms of trade
due to the fact that exports mainly consist of primary products, whereas
imports largely comprise manufactured products;
(c) The CARs have launched various initiatives for regional economic integration.
However, there is a glaring absence of a region-wide FTA among the CARs.
In substantive terms, most of the trade agreements of the CARs have focused
on tariff liberalization subject to a negative list. These agreements lack clarity
on rules of origin, especially their developmental role and trade-augmenting
effects. These agreements also only focus on trade in goods and do not
include trade in services and investment; therefore, they are not comprehensive
in their coverage. Possibly, the region lacks an analytical understanding of the
fact that trade in goods, and trade in services and investment have to be
taken together in order to fully recognize their interlinkages when adopting an
integrative approach;
(d) Intra-Central Asia exports/imports as a proportion of total Central Asian exports/
imports to/from the world have been rather low. It appears that the absence of
a trade and economic cooperation agreement among the CARs has, among
other factors, constrained regional trade integration;
(e) The empirical estimations suggest the presence of trade complementarities
among the CARs. The prospects of cooperation between the CARs and the
APTA region have also been evaluated. There are substantive trade gains for
the CARs in acceding to APTA as well as gains for the Participating States.
The trade gains for the CARs would be approximately $142 billion. Similar
gains for the Participating States of APTA would be in the region of $28 billion.
Overall, trade gains for APTA from the inclusion of the CARs would be
$170 billion, which is approximately 49% increase in total aggregate trade
gains from current intra-APTA trade. For Tajikistan, Turkmenistan and
Uzbekistan, the analysis was carried out at the SITC 3-digit level due to data
unavailability in HS;
(f) APTA is potentially a more comprehensive regional arrangement as it includes
trade in goods and trade in services and investment together with trade
facilitation. The Framework Agreement on Investment, and the Framework
Agreement on Trade in Services, together with the Framework Agreement on
Trade Facilitation would help the CARs to integrate with existing Participating
States of APTA in these areas especially due to three reasons: (i) greater
investment needs to achieve developmental objectives such as employment
generation; (ii) a high share of services in their GDP; and (iii) reduction in high
trade costs due to landlockedness of the CARs. Together, these three facets
form an important basis for CARs’ accession to APTA. This is particularly
relevant, given the fact that the CARs have largely had trade in goods
agreements only, which are, limited in scope and comprehensiveness, except
in the case of the Belarus-Kazakhstan-Russian Federation Customs Union;
260
(g) Apart from trade, there are several other areas of cooperation that could be
mutually beneficial to both the APTA region and Central Asia. These are:
(i) Investment cooperation that focuses on trade-creating joint ventures; the
reduction and elimination of investment regulations that may impede
investment flows; harmonization of investment regimes; and special focus
on transfer of technology;
(ii) Trade in services integration. Some of the areas amenable to cooperation
include: travel and tourism; transportation; education; health; information
technology; banking and finance; and recreational services. To tap the
potential of trade in services in some of these areas, cooperation in terms
of Mutual Recognition Agreements (MRAs), and recognition of mutual
standards and qualifications will be crucial;
(iii) Trade facilitation. Some of the prime areas for cooperation could include:
notification of existing and new trade laws and regulations, including
amendments; harmonization of trade-related fees; establishment of single
window of trade data and documentation requirements, establishing risk
assessment and management procedures; and the use of automatic and
information technology in customs procedures;
(iv) Energy security. The beginning of this chapter highlights the fact that the
CARs have one of the largest energy reserves in the world, while most of
the current Participating States of APTA are net energy importers. Given
their future economic needs due to their high potential for higher economic
growth trajectories, it is imperative that APTA expands its membership in
such a manner that focuses on energy trade and energy security.
Expansion of APTA membership to include the CARs would help in the
development of an energy compact under APTA. This could have three
important implications:
a. The opportunity to tap trade complementarities in hydrocarbons;
b. Development of energy resources in CARs through FDI from some of
the other Participating States of APTA; and
c. Development of an Energy Arc of cooperation that will benefit both the
existing the Participating States of APTA and the CARs as well as
countries with capital and technological resources in APTA would be
crucial;
(v) Tackling climate change in the CARs. By 2050, Central Asia will see an
increase in both summer and winter temperatures and will experience
a decline in frost days and an increase in heatwaves. Overall, Central
Asia will see an increase of 2ºC. To limit these changes, progress made
in related areas by countries such as China, the Republic of Korea and
India could be useful for the CARs. The estimated export potential for
CSGTs in Asia and the Pacific in 2008 was $30 billion-$35 billion;
(vi) Integrated cross-country and cross-sectoral tourism. Tourism is one sector
on which the Participating States of APTA can focus and reap the benefits
not only within the services sector but also through interlinkages with
other sectors. The tourism sector has the potential to create a spate of
economic activities in trade in goods, trade in services and investment.
261
(h) Although gains can be made from trade and integration in new areas of
cooperation, significant barriers still exist to trade and investment integration
in Central Asia with regard to trade policy, connectivity, banking infrastructure.
This chapter concludes by recommending accession of the CARs to APTA due to the
potential for mutually advantageous gains by both sides from integration. That conclusion
is further strengthened due to APTA’s suitability to serve as an important mechanism for
achieving the objective of Pan-Asian economic integration. Both the analysis and the
quantification of potential positive mutual benefits of the CARs’ accession to APTA further
corroborate this point. While their economic and energy profiles match the needs of current
Participating States of APTA, the CARs face enormous challenges to regional integration.
To address this problem, a complementary process to their accession to APTA must be
initiated, which could include sensitization and capacity-building programmes and modules
on the economics of regional integration, among other aspects. Several newer areas need
to be focused on in order to make the potential economic partnership between the CARs
and APTA Participating States mutually beneficial and development-oriented.
2. Policy recommendations
To help the CARs gain accession to APTA, certain policy recommendations are made
below on three levels, i.e., strategy, institutional mechanisms for membership expansion
and negotiations on new areas.
(a) Strategy
There would have to be a two-pronged strategy for the CARs’ accession to APTA. One
would entail integrating Kazakhstan, since it is a member of a Customs Union together
with the Russian Federation and Belarus. It appears that this CU is heading towards,
including Armenia and Kyrgyzstan, in due course. The second strategy would be for the
other CARs’ integration with APTA, including Kyrgyzstan, until it becomes a full-fledged CU
member.
Strategy I: As a part of strategy I, Kazakhstan’s membership with APTA would, technically
speaking, include by default the inclusion of the Russian Federation and Belarus in APTA,
albeit indirectly. This is because these three countries are members of a CU with
a common external tariff. By implication, imports by Kazakhstan from the Participating
States of APTA can spill over to the Russian Federation and Belarusian markets. Similarly,
exports from Kazakhstan could well be exports from the Russian Federation and Belarus
to the Participating States of APTA.
One major implication of this would be a much more dynamic trade and investment profile
of APTA as a grouping due to a de facto inclusion of an important economic bloc. However,
the APTA rules of origin negotiated at the time of inclusion of Kazakhstan would be
applicable to Kazakhstan and the Participating States of APTA with the understanding that
those rules of origin would actually be for products originating in the CU, i.e., from the
Russian Federation and Belarus; and not just Kazakhstan.
262
An important inference of this exercise would, in terms of any offer by Kazakhstan of MoP
to the Participating States of APTA, be based on Kazakhstan’s consensus with the Russian
Federation and Belarus, as Kazakhstan’s tariff liberalization offer would mean lowering of
the Common External Tariff of the CU.
Adoption of a strategy of at least informal consultations by APTA with the Russian Federation
and Belarus is recommended when negotiating tariffs with Kazakhstan.
Since the three countries have now attained a SES involving freer flows of goods, capital,
labour etc., a Task Force could be set up to examine the scope and modalities of cooperation
between APTA member countries and Kazakhstan on trade in services, including emphasis
on Mode IV for the temporary movement of natural persons as well as FDI flows.
Strategy II: Negotiations in APTA with the other CARs could be conducted on the existing
modalities and as per those recommended in the APTA Roadmap.
(b) Institutional mechanisms for membership expansion
While the procedures for accession to APTA are clear, what is possibly required is placing
the CARs on a parallel track. This could include capacity-building programmes, business
language training, cultivation of research on economic integration issues, and FDI in soft
and hard infrastructure.
For this to happen, the APTA Secretariat could launch a formal Central Asia accession
process that would deliberate on the above-recommended two strategies as well as initiate
short modules on capacity-building programmes.
(c) Negotiations on new areas
Complementing the process of negotiations and the accession process, a Sensitisation
Programme could be launched to apprise the policy makers and politicians of the imperatives
for opening of trade in goods, trade in services and investment regimes. The economics of
regional integration must be imparted on these countries with well-designed time-bound
modules. In this regard, trade facilitation, trade in services, investment, energy security,
climate change and tourism are the areas that need attention in a collaborative setting, as
some of the important institutional mechanisms such as the APTA Framework Agreements
already exists. Towards this end, an Expert Group could be established with representation
from cross-cutting sectors and related areas of experience.
263
References
Asian Development Bank (ADB) (2006). Central Asia: Increasing gains from trade through
regional cooperation in trade policy, transport and customs transit, available at
http://www.adb.org/Documents/Reports/CA-Trade-Policy/ca-trade-policy.pdf.
_____ (2007). ADB Regional Technical Assistance Report 2007, Integrated Trade Facilitation
Support for Central Asia Regional Economic Cooperation, Manila, Asian Development
Bank.
_____ (2014a). Climate Change and Sustainable Water Management in Central Asia, May
Manila.
_____ (2014b). Connecting Central Asia with Economic Centres Interim Report, Asian
Development Bank Institute (ADBI), Tokyo, Japan.
CAREC (2012). Gap Analysis on Adaptation to Climate-Change in Central Asia, Institute
for Global Environmental Strategies, Kanagawa, Japan.
Cho, J.W., Ratna, R.S. and Leung, V. (2014). Prospects for energy security in Asia-Pacific
through regional trade, No. 7607; paper presented at the Second International
Conference on Energy, Regional Integration and Socio-Economic Development,
Baku, Azerbaijan.
Crawford, J. (2012). Promoting Trade and Investment in Climate-Smart Goods, Services
and Technologies in Asia and the Pacific, ESCAP, Bangkok.
Das, R.U. (2012). Regional economic integration in Central Asia; paper presented at 2012
SPECA Economic Forum on November 2012, ESCAP and UNECE, Bangkok.
_____ (2013). Economic integration in the Heart of Asia: South Asia-Central Asia linkages,
Development Papers 1305, New Delhi, South and South-West Asia Office (SSWA),
United Nations Economic and Social Commission for Asia and the Pacific.
_____ (2015). Asia-Pacific Trade Agreement (APTA): A future roadmap; study report for
ESCAP, Bangkok.
Das, R.U., Edirisuriya, P. and Swarup, A. (2012). Regional Trade and Economic Integration:
Analytical Insights and Policy Options. Singapore and New Jersey: World Scientific.
European Community (2007). Regional strategy paper for assistance to Central Asia for
the period 2007-2013, European Community.
European Investment Bank (EIB) (2012). Banking in the eastern neighbours and Central
Asia: Challenges and opportunities; paper prepared for the ENCA Banking Sector
Roundtable hosted by the European Investment Bank, Economics Department,
Luxembourg.
Farra, F., Burgio, C. and Cernov, M. (2011). The Competitiveness potential of Central Asia.
In: OECD and the World Economic Forum. Competitiveness and Private Sector
Development: Central Asia 2011: Competitiveness Outlook. Paris: OECD Publishing.
p. 17-30. Available at http://dx.doi.org/10.1787/9789264097285-en.
264
McGlinchey, E. and Johnson, E. (2005). Aiding the Internet in Central Asia; paper presented
at the Post-Soviet Securities Conference at the Mershon Centre, OhioState
University, October 6-8, 2005.
Pomfret, R. (2006). Trade barriers in Central Asia; paper prepared for the Asian Development
Bank.
Ratna, R.S. (2011). Benefits of Joining APTA: Case of Nepal, ESCAP, Bangkok.
UNCTAD (2012). World Investment Report 2012: Towards a New Generation of Investment
Policies.
United Nations Economic and Social Commission for Asia and the Pacific (ESCAP) (2012).
Trade in climate-smart goods and technologies, available at http://www.unescap.org.
_____ (2013), Factsheet of the Asia-Pacific Trade Agreement, The Asia-Pacific Trade
Agreement, Trade and Investment Division, available at http://www.unescap.org/tid/
apta.asp.
USAID (2014). Enhancing trade in services between Pakistan and Central Asia, Trade
Project, Office of Economic Growth and Agriculture, United States Agency for
International Development.
Wolfensohn Center for Development (2007). Integrating Central Asia into the World
Economy: The Role of Energy and Transport Infrastructure, Wolfensohn Center for
Development at the Brookings Institution and the Carnegie Endowment for
International Peace, Washington, D.C.
World Bank (2010). Disaster Risk Management and Climate Change Adaptation in Europe
and Central Asia, available at https://www.gfdrr.org/sites/gfdrr/files/publication/
GFDRR_DRM_and_CCA_ECA.pdf.
WTO (2015). Trade profiles 2015. Accessed on 16 May 2016, available at https://
www.wto.org/english/res_e/booksp_e/trade_profiles15_e.pdf.
Online databases
OECD Energy Balances, available at www.oecd-library.org.
United Nations Commodity Trade Statistics Database (COMTRADE), United Nations
Statistics Division, available at http://comtrade.un.org.
UNCTAD statistics, available at http://unctadstat.unctad.org.
World Bank, World Development Indicators (WDI), available at http://data.worldbank.org/
products/wdi
World Bank, World Integrated Trade Solution (WITS), available at http://wits.worldbank.org.