Embed Size (px)
Citation preview
2011 NWCA Field Operations Manual Chapter 5. Vegetation
5 - 1
Chapter 5. Vegetation
See also APPENDIX C. VEGETATION SUPPLEMENTARY MATERIAL – LISTS OF FLORISTIC RESOURCES
Introduction. . . . . . . . . . . . . . . . . . . . . . . . . . . . . . . . . . . . . . . . . . . . . . . . . . . . . . . . . . . . . . . . . . . . . . . . 5.1 SAMPLING PROCEDURES. . . . . . . . . . . . . . . . . . . . . . . . . . . . . . . . . . . . . . . . . . . . . . . . . . . . . . . 5.1.1 Placement of the Vegetation Plots. . . . . . . . . . . . . . . . . . . . . . . . . . . . . . . . . . . . . . . . . . . . . . . 5.1.1.1 Key Concepts For All Veg Plot Layout Configurations . . . . . . . . . . . . . . . . . . . . . . . . . . . . 5.1.1.2 Standard Veg Plot Layout. . . . . . . . . . . . . . . . . . . . . . . . . . . . . . . . . . . . . . . . . . . . . . . . . . 5.1.1.3 Wide Polygon AA Veg Plot Layout . . . . . . . . . . . . . . . . . . . . . . . . . . . . . . . . . . . . . . . . . . . . 5.1.1.4 Narrow Polygon AA Veg Plot Layout. . . . . . . . . . . . . . . . . . . . . . . . . . . . . . . . . . . . . . . . . . 5.1.1.5 Wetland Boundary AA Veg Plot Layout . . . . . . . . . . . . . . . . . . . . . . . . . . . . . . . . . . . . . . . . 5.1.1.6 Obstacle Veg Plot Layout. . . . . . . . . . . . . . . . . . . . . . . . . . . . . . . . . . . . . . . . . . . . . . . . . . . 5.1.2 Establishing the Vegetation Plots. . . . . . . . . . . . . . . . . . . . . . . . . . . . . . . . . . . . . . . . . . . . . . . . 5.1.3 Vegetation Data Collection. . . . . . . . . . . . . . . . . . . . . . . . . . . . . . . . . . . . . . . . . . . . . . . . . . . . . 5.1.3.1 Activities Key to Veg Data Collection . . . . . . . . . . . . . . . . . . . . . . . . . . . . . . . . . . . . . . . . . . 5.1.3.2 Collecting Vascular Plant Species Presence Data and Creating Species List . . . . . . . . . . . 5.1.3.3 General Cover Estimation Procedures . . . . . . . . . . . . . . . . . . . . . . . . . . . . . . . . . . . . . . . . . 5.1.3.4 Vascular Plant Species Height and Cover Data . . . . . . . . . . . . . . . . . . . . . . . . . . . . . . . . . . 5.1.3.5 Predominant Status and Trends Wetland Class . . . . . . . . . . . . . . . . . . . . . . . . . . . . . . . . . 5.1.3.6 Vertical Strata Data for Vascular Vegetation . . . . . . . . . . . . . . . . . . . . . . . . . . . . . . . . . . . . . 5.1.3.7 Non-Vascular Taxonomic Group Data . . . . . . . . . . . . . . . . . . . . . . . . . . . . . . . . . . . . . . . . .. 5.1.3.8 Ground Surface Attribute Data . . . . . . . . . . . . . . . . . . . . . . . . . . . . . . . . . . . . . . . . . . . . . . . 5.1.3.9 Snag Count and Tree Species Count and Cover Data . . . . . . . . . . . . . . . . . . . . . . . . 5.1.4 Field Day Wrap-Up Activities . . . . . . . . . . . . . . . . . . . . . . . . . . . . . . . . . . . . . . . . . . . . . . . . . . . 5.2 SAMPLE COLLECTION AND PROCESSING AND DATA HANDLING . . . . . . . . . . . . . . . . . . . . . 5.2.1 Collecting Plant Specimens . . . . . . . . . . . . . . . . . . . . . . . . . . . . . . . . . . . . . . . . . . . . . . . . . . . . 5.2.2 Pressing Plant Specimens. . . . . . . . . . . . . . . . . . . . . . . . . . . . . . . . . . . . . . . . . . . . . . . . . . . . . 5.2.3 Plant Sample Tag and Plant Specimen Label . . . . . . . . . . . . . . . . . . . . . . . . . . . . . . . . . . . . . . 5.2.4 Drying Plant Specimens . . . . . . . . . . . . . . . . . . . . . . . . . . . . . . . . . . . . . . . . . . . . . . . . . . . . . . 5.2.5 Shipping or Transporting Plant Specimens . . . . . . . . . . . . . . . . . . . . . . . . . . . . . . . . . . . . . . . . 5.2.6 Data Handling. . . . . . . . . . . . . . . . . . . . . . . . . . . . . . . . . . . . . . . . . . . . . . . . . . . . . .. . . . . . . . . 5.3 LITERATURE CITED . . . . . . . . . . . . . . . . . . . . . . . . . . . . . . . . . . . . . . . . . . . . . . . . . . . . . . . . . . . . 5.4 VEGETATION PROTOCOL CHECKLISTS AND REFERENCE CARDS . . . . . . . . . . . . . . . . . . . . Vegetation Protocol Task Checklist Reference Card V-1. Flow Chart of Vegetation Protocol Tasks Reference Card V-2, Side A. Key for Veg Plot Placement and Example Plot Layout Configurations Reference Card V-2, Side B. Veg Plot Layout Configuration Continued Reference Card V-3, Side A. Vegetation Plot Establishment Reference Card V-3, Side B. Veg Plot Configuration and Data Collection Summary Reference Card V-4, Side A. Cover Estimation Procedures. Reference Card V-4, Side B. Assigning Pseudonyms for Unknown Plant Species 5.5 EQUIPMENT LIST, DATA FORMS, SPECIMEN LABELS. . . . . . . . . . . . . . . . . . . . . . . . . . . . . . . . Vegetation Equipment and Supply Checklist Form V-1 (front and back): NWCA Vegetation Plot Establishment Form V-2a (front and back), Form V-2b (continued): NWCA Vascular Species Presence and Cover Form V-3 (front): NWCA Vegetation Types Form V-3 (back): NWCA Ground Surface Form V-4a (front and back), Form V-4b (continued): NWCA Snag and Tree Counts and Tree Cover Plant Sample Tags Plant Specimen Label Form T-2: NWCA Unknown Plant Sample Tracking Form T-3: NWCA QA Plant Sample Tracking
5-3 5-5 5-5 5-6 5-6 5-7
5-10 5-10 5-11 5-11 5-15 5-16 5-19 5-25 5-27 5-29 5-29 5-29 5-30 5-31 5-34 5-35 5-36 5-38 5-40 5-42 5-43
5-45 5-45 5-49
5-61

2011 NWCA Field Operations Manual Chapter 5. Vegetation
5 - 2
2011 NWCA Field Operations Manual Chapter 5. Vegetation
5 - 3
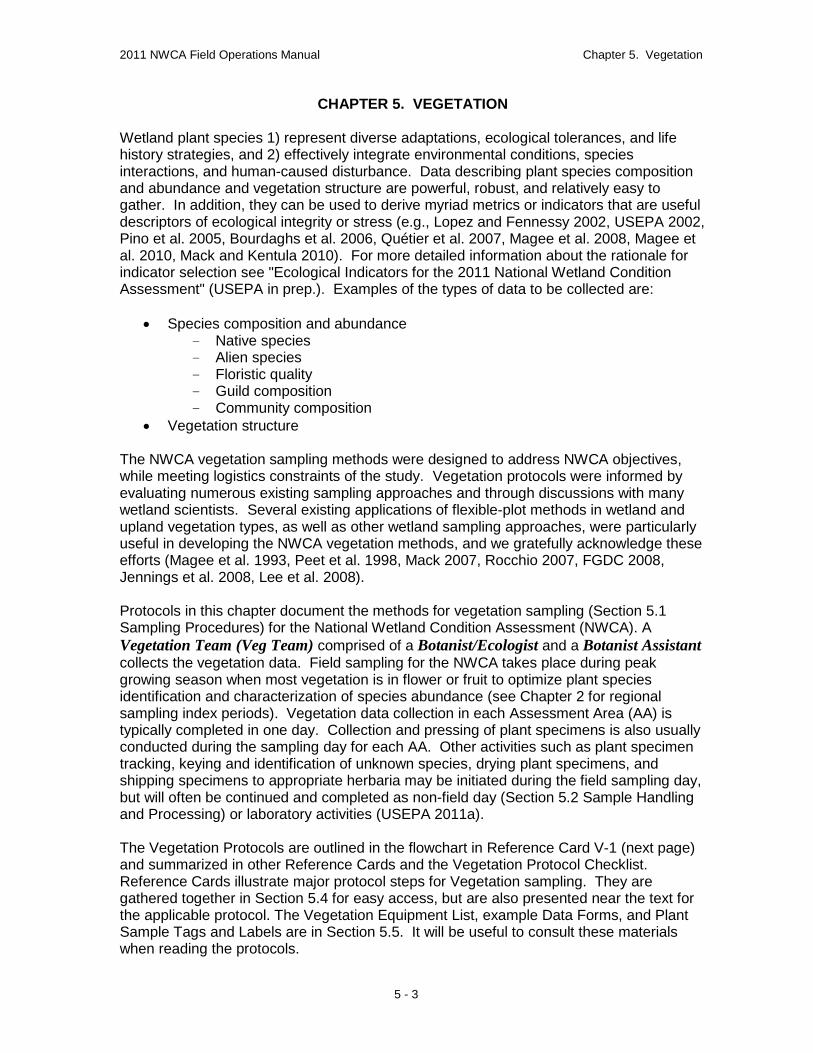
CHAPTER 5. VEGETATION
Wetland plant species 1) represent diverse adaptations, ecological tolerances, and life history strategies, and 2) effectively integrate environmental conditions, species interactions, and human-caused disturbance. Data describing plant species composition and abundance and vegetation structure are powerful, robust, and relatively easy to gather. In addition, they can be used to derive myriad metrics or indicators that are useful descriptors of ecological integrity or stress (e.g., Lopez and Fennessy 2002, USEPA 2002, Pino et al. 2005, Bourdaghs et al. 2006, Quétier et al. 2007, Magee et al. 2008, Magee et al. 2010, Mack and Kentula 2010). For more detailed information about the rationale for indicator selection see "Ecological Indicators for the 2011 National Wetland Condition Assessment" (USEPA in prep.). Examples of the types of data to be collected are:
• Species composition and abundance - Native species - Alien species - Floristic quality - Guild composition - Community composition
• Vegetation structure The NWCA vegetation sampling methods were designed to address NWCA objectives, while meeting logistics constraints of the study. Vegetation protocols were informed by evaluating numerous existing sampling approaches and through discussions with many wetland scientists. Several existing applications of flexible-plot methods in wetland and upland vegetation types, as well as other wetland sampling approaches, were particularly useful in developing the NWCA vegetation methods, and we gratefully acknowledge these efforts (Magee et al. 1993, Peet et al. 1998, Mack 2007, Rocchio 2007, FGDC 2008, Jennings et al. 2008, Lee et al. 2008). Protocols in this chapter document the methods for vegetation sampling (Section 5.1 Sampling Procedures) for the National Wetland Condition Assessment (NWCA). A Vegetation Team (Veg Team) comprised of a Botanist/Ecologist and a Botanist Assistant collects the vegetation data. Field sampling for the NWCA takes place during peak growing season when most vegetation is in flower or fruit to optimize plant species identification and characterization of species abundance (see Chapter 2 for regional sampling index periods). Vegetation data collection in each Assessment Area (AA) is typically completed in one day. Collection and pressing of plant specimens is also usually conducted during the sampling day for each AA. Other activities such as plant specimen tracking, keying and identification of unknown species, drying plant specimens, and shipping specimens to appropriate herbaria may be initiated during the field sampling day, but will often be continued and completed as non-field day (Section 5.2 Sample Handling and Processing) or laboratory activities (USEPA 2011a). The Vegetation Protocols are outlined in the flowchart in Reference Card V-1 (next page) and summarized in other Reference Cards and the Vegetation Protocol Checklist. Reference Cards illustrate major protocol steps for Vegetation sampling. They are gathered together in Section 5.4 for easy access, but are also presented near the text for the applicable protocol. The Vegetation Equipment List, example Data Forms, and Plant Sample Tags and Labels are in Section 5.5. It will be useful to consult these materials when reading the protocols.
2011 NWCA Field Operations Manual Chapter 5. Vegetation
5 - 4
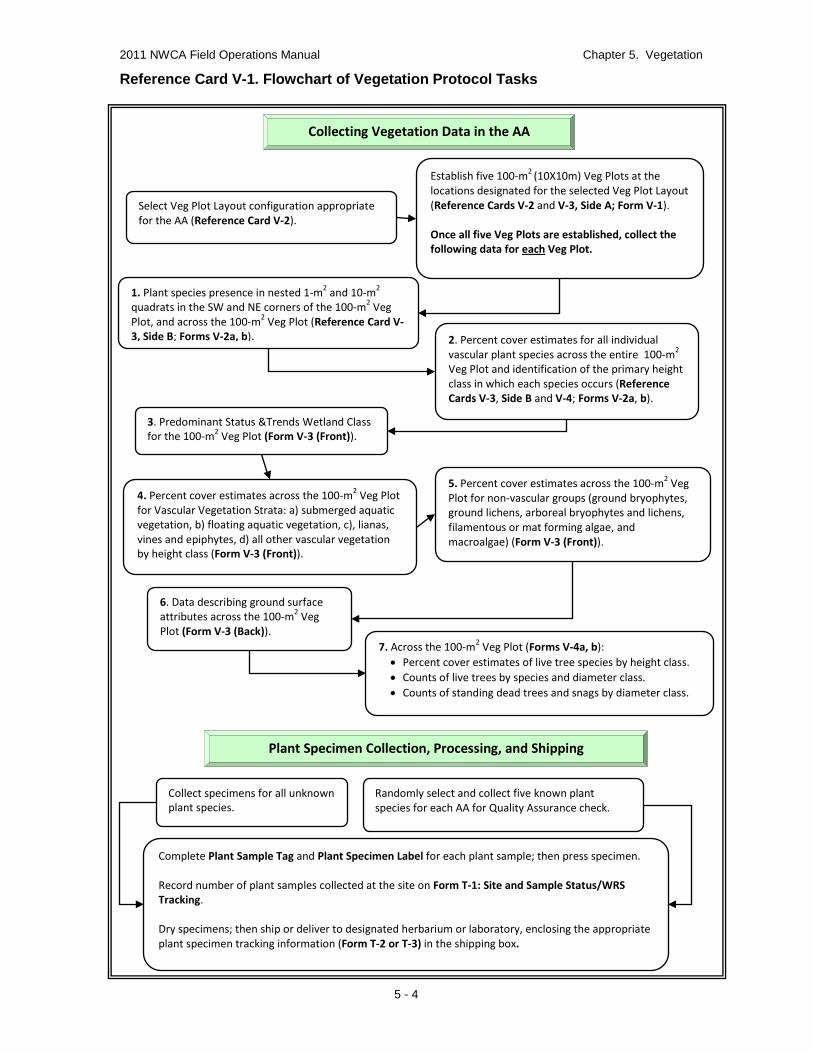
Reference Card V-1. Flowchart of Vegetation Protocol Tasks
Plant Specimen Collection, Processing, and Shipping
Collect specimens for all unknown plant species.
Randomly select and collect five known plant species for each AA for Quality Assurance check.
Complete Plant Sample Tag and Plant Specimen Label for each plant sample; then press specimen. Record number of plant samples collected at the site on Form T-1: Site and Sample Status/WRS Tracking. Dry specimens; then ship or deliver to designated herbarium or laboratory, enclosing the appropriate plant specimen tracking information (Form T-2 or T-3) in the shipping box.
Collecting Vegetation Data in the AA
3. Predominant Status &Trends Wetland Class for the 100-m2 Veg Plot (Form V-3 (Front)).
Select Veg Plot Layout configuration appropriate for the AA (Reference Card V-2).
Establish five 100-m2 (10X10m) Veg Plots at the locations designated for the selected Veg Plot Layout (Reference Cards V-2 and V-3, Side A; Form V-1). Once all five Veg Plots are established, collect the following data for each Veg Plot.
1. Plant species presence in nested 1-m2 and 10-m2 quadrats in the SW and NE corners of the 100-m2 Veg Plot, and across the 100-m2 Veg Plot (Reference Card V-3, Side B; Forms V-2a, b). 2. Percent cover estimates for all individual
vascular plant species across the entire 100-m2 Veg Plot and identification of the primary height class in which each species occurs (Reference Cards V-3, Side B and V-4; Forms V-2a, b).
4. Percent cover estimates across the 100-m2 Veg Plot for Vascular Vegetation Strata: a) submerged aquatic vegetation, b) floating aquatic vegetation, c), lianas, vines and epiphytes, d) all other vascular vegetation by height class (Form V-3 (Front)).
5. Percent cover estimates across the 100-m2 Veg Plot for non-vascular groups (ground bryophytes, ground lichens, arboreal bryophytes and lichens, filamentous or mat forming algae, and macroalgae) (Form V-3 (Front)).
6. Data describing ground surface attributes across the 100-m2 Veg Plot (Form V-3 (Back)).
7. Across the 100-m2 Veg Plot (Forms V-4a, b): • Percent cover estimates of live tree species by height class. • Counts of live trees by species and diameter class. • Counts of standing dead trees and snags by diameter class.
2011 NWCA Field Operations Manual Chapter 5. Vegetation
5 - 5
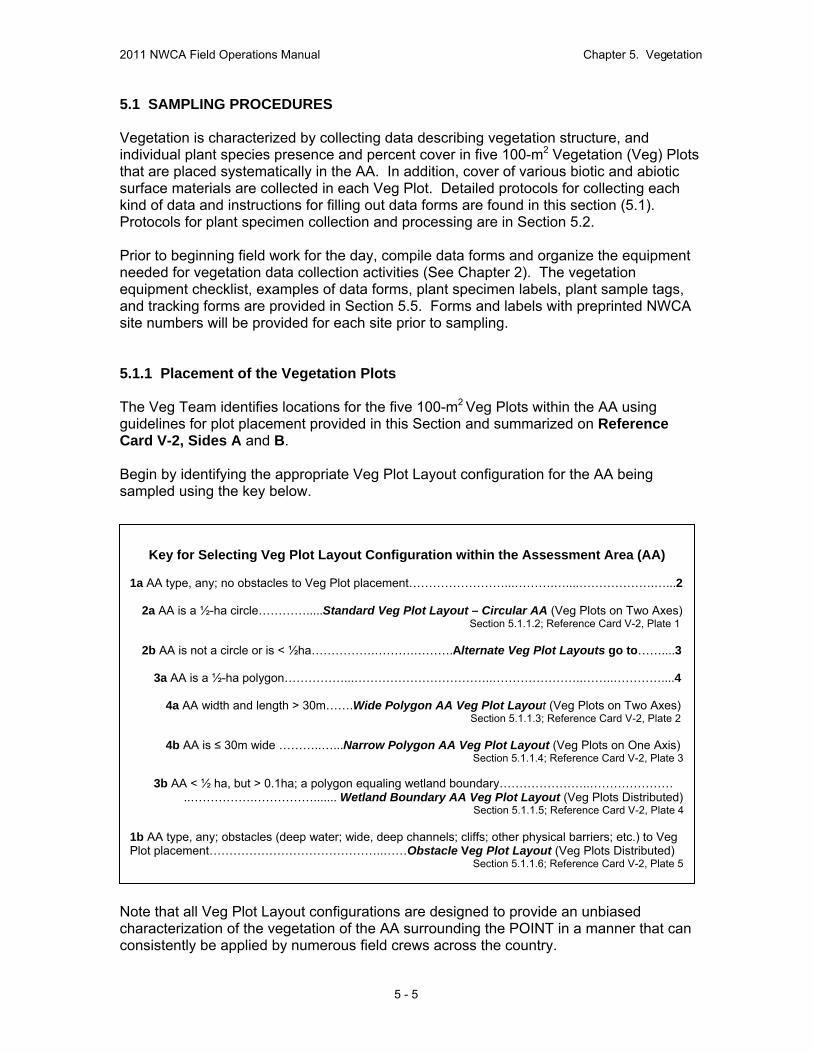
Key for Selecting Veg Plot Layout Configuration within the Assessment Area (AA)
1a AA type, any; no obstacles to Veg Plot placement……………………...……….…....……………….…...2
2a AA is a ½-ha circle………….....Standard Veg Plot Layout – Circular AA (Veg Plots on Two Axes) Section 5.1.1.2; Reference Card V-2, Plate 1 2b AA is not a circle or is < ½ha…………….……….……….Alternate Veg Plot Layouts go to……....3
3a AA is a ½-ha polygon……………...……………………………..…………………..……..…………....4
4a AA width and length > 30m…….Wide Polygon AA Veg Plot Layout (Veg Plots on Two Axes) Section 5.1.1.3; Reference Card V-2, Plate 2 4b AA is ≤ 30m wide ………..…...Narrow Polygon AA Veg Plot Layout (Veg Plots on One Axis) Section 5.1.1.4; Reference Card V-2, Plate 3
3b AA < ½ ha, but > 0.1ha; a polygon equaling wetland boundary…………………..………………… ..…………….……………....... Wetland Boundary AA Veg Plot Layout (Veg Plots Distributed) Section 5.1.1.5; Reference Card V-2, Plate 4
1b AA type, any; obstacles (deep water; wide, deep channels; cliffs; other physical barriers; etc.) to Veg Plot placement……………………………………..……Obstacle Veg Plot Layout (Veg Plots Distributed) Section 5.1.1.6; Reference Card V-2, Plate 5
5.1 SAMPLING PROCEDURES Vegetation is characterized by collecting data describing vegetation structure, and individual plant species presence and percent cover in five 100-m2 Vegetation (Veg) Plots that are placed systematically in the AA. In addition, cover of various biotic and abiotic surface materials are collected in each Veg Plot. Detailed protocols for collecting each kind of data and instructions for filling out data forms are found in this section (5.1). Protocols for plant specimen collection and processing are in Section 5.2. Prior to beginning field work for the day, compile data forms and organize the equipment needed for vegetation data collection activities (See Chapter 2). The vegetation equipment checklist, examples of data forms, plant specimen labels, plant sample tags, and tracking forms are provided in Section 5.5. Forms and labels with preprinted NWCA site numbers will be provided for each site prior to sampling. 5.1.1 Placement of the Vegetation Plots The Veg Team identifies locations for the five 100-m2 Veg Plots within the AA using guidelines for plot placement provided in this Section and summarized on Reference Card V-2, Sides A and B. Begin by identifying the appropriate Veg Plot Layout configuration for the AA being sampled using the key below.
Note that all Veg Plot Layout configurations are designed to provide an unbiased characterization of the vegetation of the AA surrounding the POINT in a manner that can consistently be applied by numerous field crews across the country.
2011 NWCA Field Operations Manual Chapter 5. Vegetation
5 - 6
• Locations of the Vegetation (Veg) Plots within circular 0.5-ha Standard AAs are
systematically determined using the Standard Veg Plot Layout. • Veg Plot locations for Alternate AA Layouts are identified using the Veg Plot Layout
key above to select the appropriate Alternate Veg Plot Layout configurations. Alternate Veg Plot Layouts are used only when the Standard Veg Layout will not fit into the AA.
• The Obstacle Veg Plot Layout is applied only when there are obstacles preventing the
placement of a Veg Plot in its designated location within any particular Veg Plot Layout type.
5.1.1.1 Key Concepts for All Veg Plot Layout Configurations Wetlands can be fragile ecosystems. Minimize foot traffic to limit crushing vegetation and compacting soils and to avoid trampling the AA prior to sampling. • Before beginning Veg Plot establishment, make a plan for limiting the number of
traverses across the AA as work is conducted. • The AA CENTER is a focal location for Veg Plot Layout so some trampling at the
CENTER is unavoidable; however, limit the disturbance radius as much as possible. • In most AAs, Veg Plots are placed at specified distances along plot placement lines
extending outward from the CENTER of the AA (see illustrations on Reference Card V-2). These plot placement lines are represented by imaginary lines extending from the CENTER of the AA outward.
• The plot placement lines will receive considerable foot traffic during Veg Plot set-up
and sampling. Veg Plots are typically placed immediately to the left side of plot placement lines (when facing the AA boundary from the CENTER) to avoid walking in the Veg Plots prior to sampling.
5.1.1.2 Standard Veg Plot Layout – Veg Plots on Two Axes in a ½-ha Circular AA In the Standard AA five 100-m2
Veg Plots are distributed as depicted in the Standard Veg Plot Layout (see Reference Card V-2, Plate 1). Position Veg Plots along the four cardinal (north, east, south, west) directions from the CENTER of the AA. Number the Veg Plots in clockwise order from Veg Plot 1 near the AA CENTER to Veg Plot 5 along the eastern plot placement line.
• To avoid the trampled area at the AA CENTER, place Veg Plot 1 approximately 2m from the AA CENTER as indicated in Reference Card V-2, Plate 1.
• Place Veg Plot 2 to the east side (e.g., to the left when facing outward from the AA
CENTER) of the south plot placement line with its northern edge 10m from the southern edge of Veg Plot 1.
2011 NWCA Field Operations Manual Chapter 5. Vegetation
5 - 7
• Place Veg Plot 3 to the south side of the west plot placement line 15m from the AA
CENTER. • Place Veg Plot 4 to the west side of the north plot placement line 15m from the AA
CENTER. • Place Veg Plot 5 to the north side of the east plot placement line 20m from the AA
CENTER. 5.1.1.3 Wide Polygon AA Veg Plot Layout – Veg Plots on Two Axes in ½-ha Polygon AA with Width and Length > 30m If the wetland in which the POINT occurs is greater than or equal to 0.5ha, but has dimensions < 80m in at least one direction, the AA will be configured as a polygon. Recall that the Polygon AA may be a rectangle, may have more than four sides, or may have sinuous edges paralleling the wetland boundary depending on conditions at the study site (see Chapter 3). If the Polygon AA is greater than 30m in width and length, use the Wide Polygon AA Veg Plot Layout to determine Veg Plot locations (see Reference Card V-2, Plate 2) along plot placement lines that are oriented on the compass bearings of the long and short axes of the AA and intersecting the AA CENTER. Polygon AA > 40m wide (see Reference Card V-2, Plate 2 - Example A) – • Place the Veg Plots in a configuration matching as closely as possible the Standard
Veg Plot Layout, while distributing plots evenly along plot placement lines. Note distances from the AA CENTER to each Veg Plot may have to be lengthened or contracted compared to the Standard Veg Plot Layout based on the distance from the AA CENTER to its edge.
• Locate each Veg Plot to the left side of the plot placement line when looking from the
AA center to the AA edge. Number Veg Plots in clockwise order with Veg Plot 1 nearest the AA center.
Polygon AA < 40m, but > 30m wide (see Reference Card V-2, Plate 2 - Example B) – • Place one Veg Plot along one of the plot placement lines making up the short axis of
the AA so that the plot is mid-way between the CENTER and the AA boundary. Locate the Veg Plot on the left side of the plot placement line, when looking from the AA CENTER to its edge.
• Evenly distribute the other four Veg Plots along the long axis of the AA, placing plots to
left side of the plot placement lines when looking from the AA CENTER to its edge. • Number Veg Plots consecutively from one end of the long axis of the AA to the other.
2011 NWCA Field Operations Manual Chapter 5. Vegetation
5 - 8
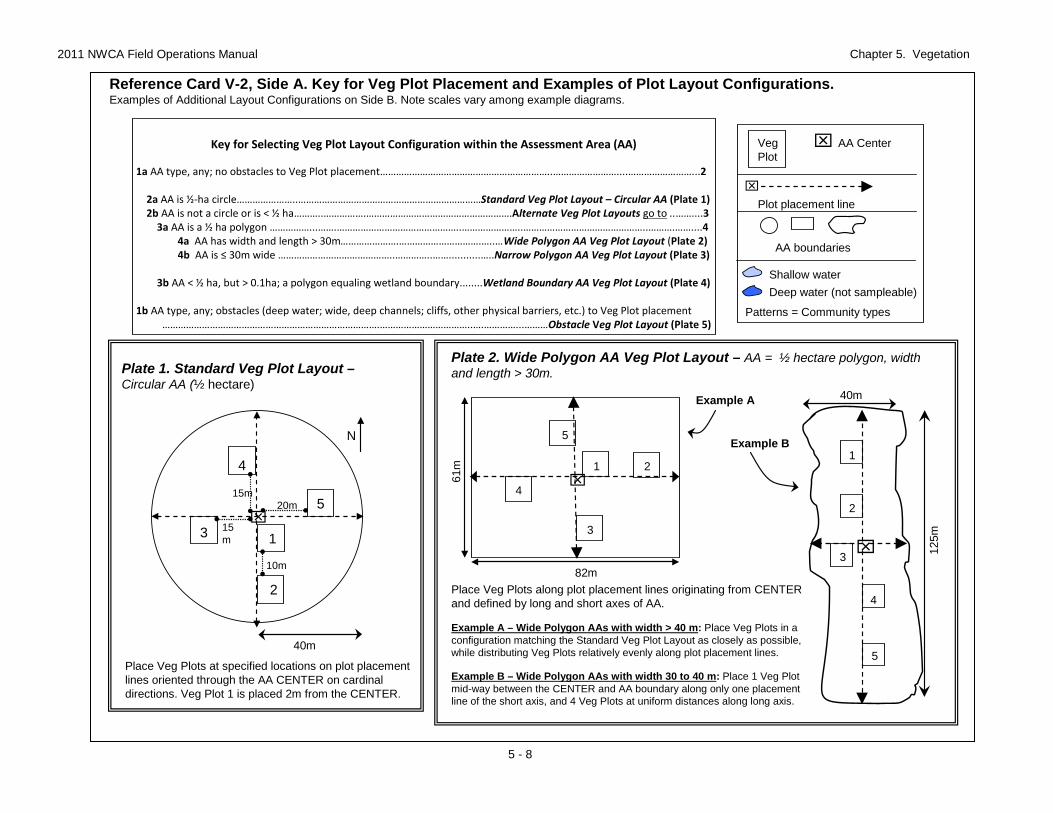
Reference Card V-2, Side A. Key for Veg Plot Placement and Examples of Plot Layout Configurations.Examples of Additional Layout Configurations on Side B. Note scales vary among example diagrams.
Plate 1. Standard Veg Plot Layout –Circular AA (½ hectare)
4
40m
N
3
2
1
515m
15m
20m
10m
Place Veg Plots at specified locations on plot placement lines oriented through the AA CENTER on cardinal directions. Veg Plot 1 is placed 2m from the CENTER.
Key for Selecting Veg Plot Layout Configuration within the Assessment Area (AA)
1a AA type, any; no obstacles to Veg Plot placement………………………………………………………..……………………....……………………...2
2a AA is ½-ha circle…………………..……………………………………………………………Standard Veg Plot Layout – Circular AA (Plate 1)2b AA is not a circle or is < ½ ha………..…………….……………………………………………….Alternate Veg Plot Layouts go to ..……....3
3a AA is a ½ ha polygon ……………...…….………………………………………..…………………..………………………………………..……….……....44a AA has width and length > 30m………………….………………………….…..…Wide Polygon AA Veg Plot Layout (Plate 2)4b AA is ≤ 30m wide ……………………………………..…………..……...........…..Narrow Polygon AA Veg Plot Layout (Plate 3)
3b AA < ½ ha, but > 0.1ha; a polygon equaling wetland boundary........Wetland Boundary AA Veg Plot Layout (Plate 4)
1b AA type, any; obstacles (deep water; wide, deep channels; cliffs, other physical barriers, etc.) to Veg Plot placement……………………………………………………………………….……………………………..….…………...………Obstacle Veg Plot Layout (Plate 5)
Plate 2. Wide Polygon AA Veg Plot Layout – AA = ½ hectare polygon, width and length > 30m.
Place Veg Plots along plot placement lines originating from CENTER and defined by long and short axes of AA.
Example A – Wide Polygon AAs with width > 40 m: Place Veg Plots in a configuration matching the Standard Veg Plot Layout as closely as possible, while distributing Veg Plots relatively evenly along plot placement lines.
Example B – Wide Polygon AAs with width 30 to 40 m: Place 1 Veg Plot mid-way between the CENTER and AA boundary along only one placement line of the short axis, and 4 Veg Plots at uniform distances along long axis.
61m
82m
2
4
3
1
5
40m
125m
1
3
2
4
5
Example A
Example B
Veg Plot
AA Center
AA boundaries
Plot placement line
Shallow waterDeep water (not sampleable)
Patterns = Community types
2011 NWCA Field Operations Manual Chapter 5. Vegetation
5 - 9
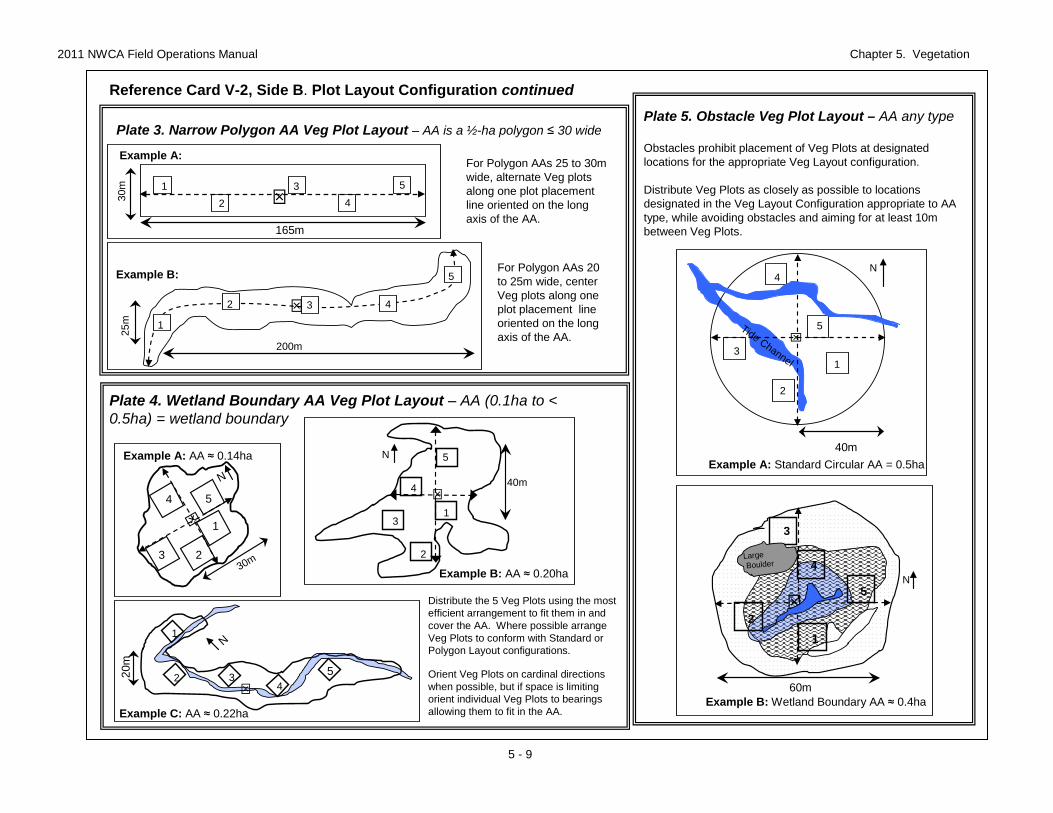
Reference Card V-2, Side B. Plot Layout Configuration continued
Plate 3. Narrow Polygon AA Veg Plot Layout – AA is a ½-ha polygon ≤ 30 wide
Plate 4. Wetland Boundary AA Veg Plot Layout – AA (0.1ha to < 0.5ha) = wetland boundary
Example A: AA ≈ 0.14ha
30m
N
1
4
23
5
Example C: AA ≈ 0.22ha
20m
N1
2 34
5
Example B: Wetland Boundary AA ≈ 0.4ha
N
60m
3
2
5
4
1
LargeBoulder
Plate 5. Obstacle Veg Plot Layout – AA any type
Obstacles prohibit placement of Veg Plots at designated locations for the appropriate Veg Layout configuration.
Distribute Veg Plots as closely as possible to locations designated in the Veg Layout Configuration appropriate to AA type, while avoiding obstacles and aiming for at least 10m between Veg Plots.
4
40m
3
2
Example A: Standard Circular AA = 0.5ha
N
Tide Channel 1
5
Example B: AA ≈ 0.20ha
40m
N
1
5
4
3
2
Distribute the 5 Veg Plots using the most efficient arrangement to fit them in and cover the AA. Where possible arrange Veg Plots to conform with Standard or Polygon Layout configurations.
Orient Veg Plots on cardinal directions when possible, but if space is limiting orient individual Veg Plots to bearings allowing them to fit in the AA.
165m
30m 1
2 43 5
Example A:
200m
25m
2
5
43
1
Example B:
For Polygon AAs 25 to 30m wide, alternate Veg plots along one plot placement line oriented on the long axis of the AA.
For Polygon AAs 20 to 25m wide, center Veg plots along one plot placement line oriented on the long axis of the AA.
2011 NWCA Field Operations Manual Chapter 5. Vegetation
5 - 10
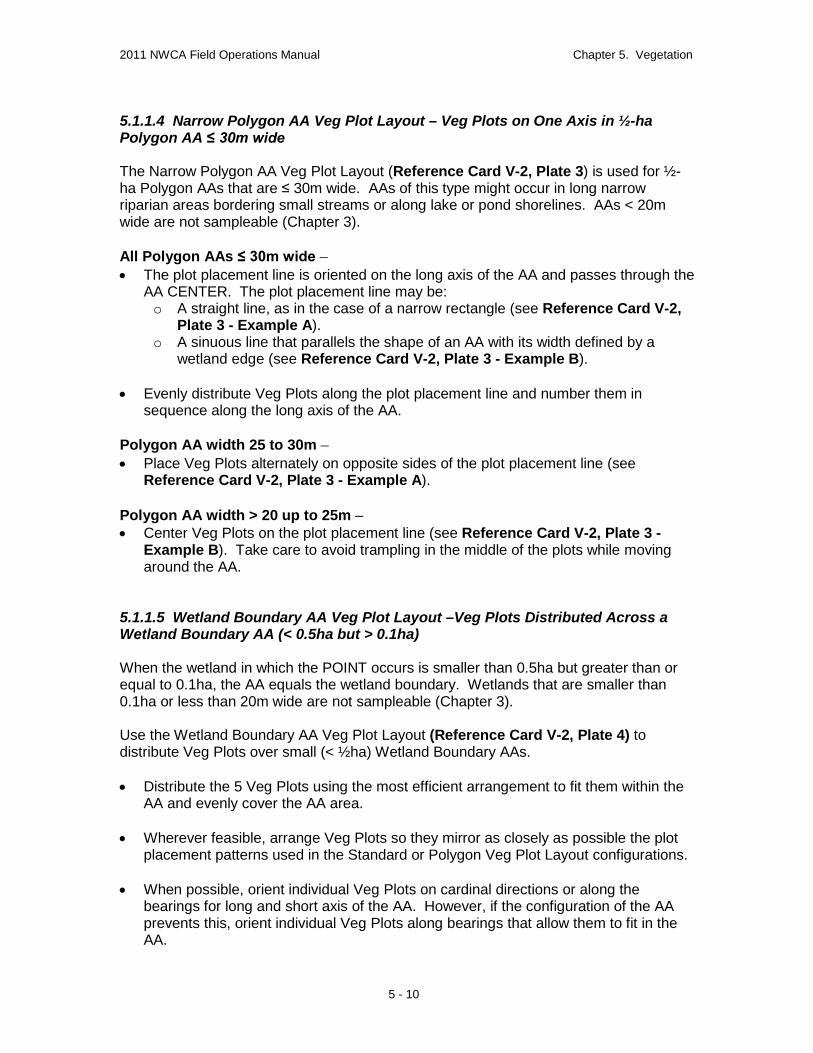
5.1.1.4 Narrow Polygon AA Veg Plot Layout – Veg Plots on One Axis in ½-ha Polygon AA ≤ 30m wide The Narrow Polygon AA Veg Plot Layout (Reference Card V-2, Plate 3) is used for ½-ha Polygon AAs that are ≤ 30m wide. AAs of this type might occur in long narrow riparian areas bordering small streams or along lake or pond shorelines. AAs < 20m wide are not sampleable (Chapter 3). All Polygon AAs ≤ 30m wide – • The plot placement line is oriented on the long axis of the AA and passes through the
AA CENTER. The plot placement line may be: o A straight line, as in the case of a narrow rectangle (see Reference Card V-2,
Plate 3 - Example A). o A sinuous line that parallels the shape of an AA with its width defined by a
wetland edge (see Reference Card V-2, Plate 3 - Example B).
• Evenly distribute Veg Plots along the plot placement line and number them in sequence along the long axis of the AA.
Polygon AA width 25 to 30m – • Place Veg Plots alternately on opposite sides of the plot placement line (see
Reference Card V-2, Plate 3 - Example A). Polygon AA width > 20 up to 25m – • Center Veg Plots on the plot placement line (see Reference Card V-2, Plate 3 -
Example B). Take care to avoid trampling in the middle of the plots while moving around the AA.
5.1.1.5 Wetland Boundary AA Veg Plot Layout –Veg Plots Distributed Across a Wetland Boundary AA (< 0.5ha but > 0.1ha)
When the wetland in which the POINT occurs is smaller than 0.5ha but greater than or equal to 0.1ha, the AA equals the wetland boundary. Wetlands that are smaller than 0.1ha or less than 20m wide are not sampleable (Chapter 3). Use the Wetland Boundary AA Veg Plot Layout (Reference Card V-2, Plate 4) to distribute Veg Plots over small (< ½ha) Wetland Boundary AAs. • Distribute the 5 Veg Plots using the most efficient arrangement to fit them within the
AA and evenly cover the AA area. • Wherever feasible, arrange Veg Plots so they mirror as closely as possible the plot
placement patterns used in the Standard or Polygon Veg Plot Layout configurations. • When possible, orient individual Veg Plots on cardinal directions or along the
bearings for long and short axis of the AA. However, if the configuration of the AA prevents this, orient individual Veg Plots along bearings that allow them to fit in the AA.
2011 NWCA Field Operations Manual Chapter 5. Vegetation
5 - 11
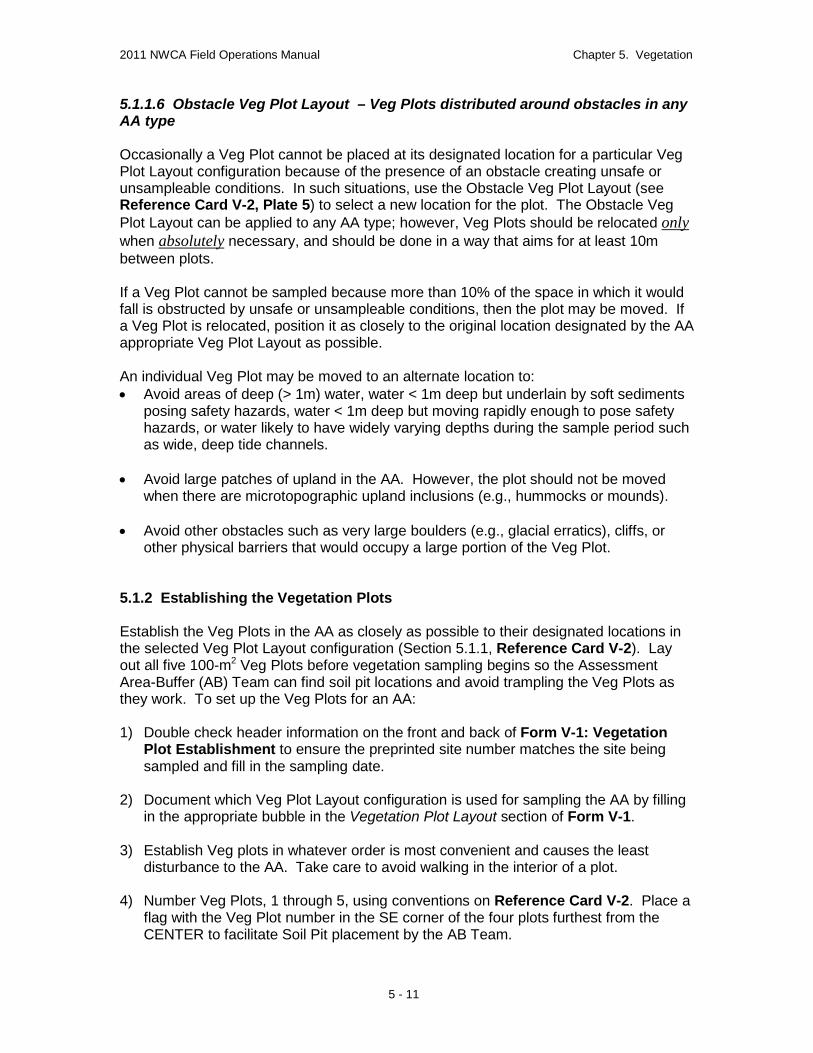
5.1.1.6 Obstacle Veg Plot Layout – Veg Plots distributed around obstacles in any AA type Occasionally a Veg Plot cannot be placed at its designated location for a particular Veg Plot Layout configuration because of the presence of an obstacle creating unsafe or unsampleable conditions. In such situations, use the Obstacle Veg Plot Layout (see Reference Card V-2, Plate 5) to select a new location for the plot. The Obstacle Veg Plot Layout can be applied to any AA type; however, Veg Plots should be relocated only when absolutely
necessary, and should be done in a way that aims for at least 10m between plots.
If a Veg Plot cannot be sampled because more than 10% of the space in which it would fall is obstructed by unsafe or unsampleable conditions, then the plot may be moved. If a Veg Plot is relocated, position it as closely to the original location designated by the AA appropriate Veg Plot Layout as possible. An individual Veg Plot may be moved to an alternate location to: • Avoid areas of deep (> 1m) water, water < 1m deep but underlain by soft sediments
posing safety hazards, water < 1m deep but moving rapidly enough to pose safety hazards, or water likely to have widely varying depths during the sample period such as wide, deep tide channels.
• Avoid large patches of upland in the AA. However, the plot should not be moved
when there are microtopographic upland inclusions (e.g., hummocks or mounds). • Avoid other obstacles such as very large boulders (e.g., glacial erratics), cliffs, or
other physical barriers that would occupy a large portion of the Veg Plot.
5.1.2 Establishing the Vegetation Plots Establish the Veg Plots in the AA as closely as possible to their designated locations in the selected Veg Plot Layout configuration (Section 5.1.1, Reference Card V-2). Lay out all five 100-m2
Veg Plots before vegetation sampling begins so the Assessment Area-Buffer (AB) Team can find soil pit locations and avoid trampling the Veg Plots as they work. To set up the Veg Plots for an AA:
1) Double check header information on the front and back of Form V-1: Vegetation Plot Establishment to ensure the preprinted site number matches the site being sampled and fill in the sampling date.
2) Document which Veg Plot Layout configuration is used for sampling the AA by filling
in the appropriate bubble in the Vegetation Plot Layout section of Form V-1. 3) Establish Veg plots in whatever order is most convenient and causes the least
disturbance to the AA. Take care to avoid walking in the interior of a plot. 4) Number Veg Plots, 1 through 5, using conventions on Reference Card V-2. Place a
flag with the Veg Plot number in the SE corner of the four plots furthest from the CENTER to facilitate Soil Pit placement by the AB Team.
2011 NWCA Field Operations Manual Chapter 5. Vegetation
5 - 12
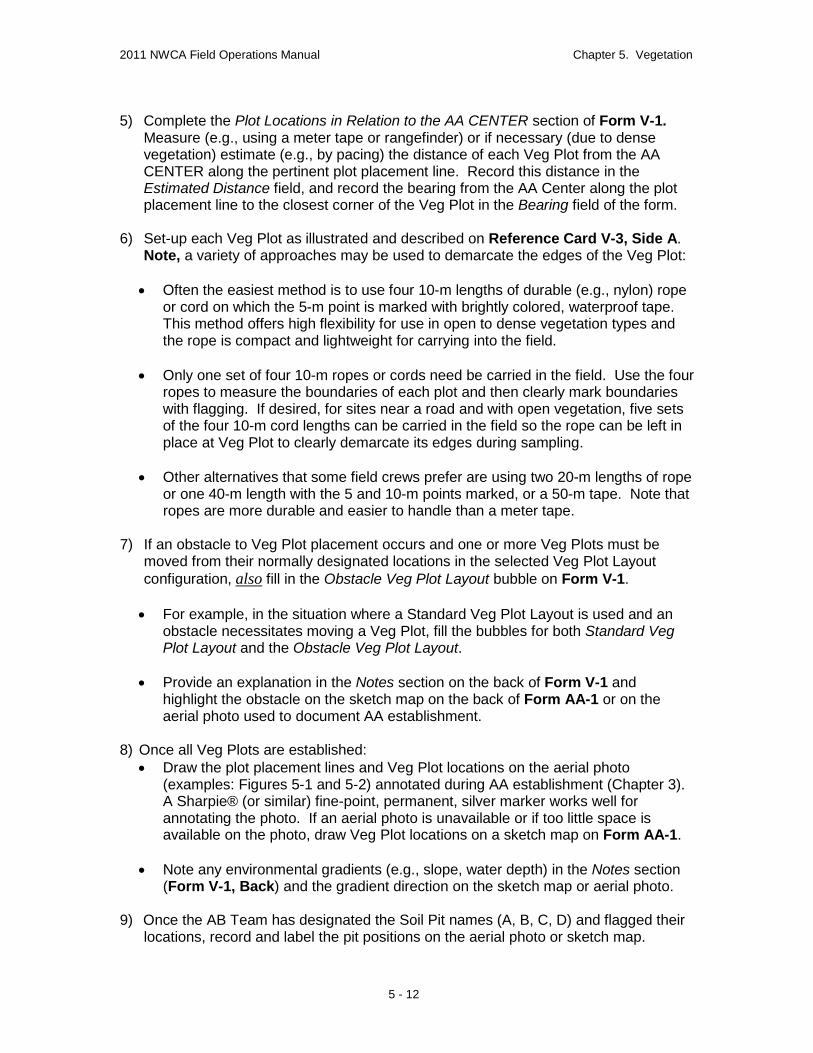
5) Complete the Plot Locations in Relation to the AA CENTER section of Form V-1.
Measure (e.g., using a meter tape or rangefinder) or if necessary (due to dense vegetation) estimate (e.g., by pacing) the distance of each Veg Plot from the AA CENTER along the pertinent plot placement line. Record this distance in the Estimated Distance field, and record the bearing from the AA Center along the plot placement line to the closest corner of the Veg Plot in the Bearing field of the form.
6) Set-up each Veg Plot as illustrated and described on Reference Card V-3, Side A.
Note, a variety of approaches may be used to demarcate the edges of the Veg Plot:
• Often the easiest method is to use four 10-m lengths of durable (e.g., nylon) rope or cord on which the 5-m point is marked with brightly colored, waterproof tape. This method offers high flexibility for use in open to dense vegetation types and the rope is compact and lightweight for carrying into the field.
• Only one set of four 10-m ropes or cords need be carried in the field. Use the four
ropes to measure the boundaries of each plot and then clearly mark boundaries with flagging. If desired, for sites near a road and with open vegetation, five sets of the four 10-m cord lengths can be carried in the field so the rope can be left in place at Veg Plot to clearly demarcate its edges during sampling.
• Other alternatives that some field crews prefer are using two 20-m lengths of rope
or one 40-m length with the 5 and 10-m points marked, or a 50-m tape. Note that ropes are more durable and easier to handle than a meter tape.
7) If an obstacle to Veg Plot placement occurs and one or more Veg Plots must be
moved from their normally designated locations in the selected Veg Plot Layout configuration, also
fill in the Obstacle Veg Plot Layout bubble on Form V-1.
• For example, in the situation where a Standard Veg Plot Layout is used and an obstacle necessitates moving a Veg Plot, fill the bubbles for both Standard Veg Plot Layout and the Obstacle Veg Plot Layout.
• Provide an explanation in the Notes section on the back of Form V-1 and
highlight the obstacle on the sketch map on the back of Form AA-1 or on the aerial photo used to document AA establishment.
8) Once all Veg Plots are established:
• Draw the plot placement lines and Veg Plot locations on the aerial photo (examples: Figures 5-1 and 5-2) annotated during AA establishment (Chapter 3). A Sharpie® (or similar) fine-point, permanent, silver marker works well for annotating the photo. If an aerial photo is unavailable or if too little space is available on the photo, draw Veg Plot locations on a sketch map on Form AA-1.
• Note any environmental gradients (e.g., slope, water depth) in the Notes section
(Form V-1, Back) and the gradient direction on the sketch map or aerial photo.
9) Once the AB Team has designated the Soil Pit names (A, B, C, D) and flagged their locations, record and label the pit positions on the aerial photo or sketch map.
2011 NWCA Field Operations Manual Chapter 5. Vegetation
5 - 13
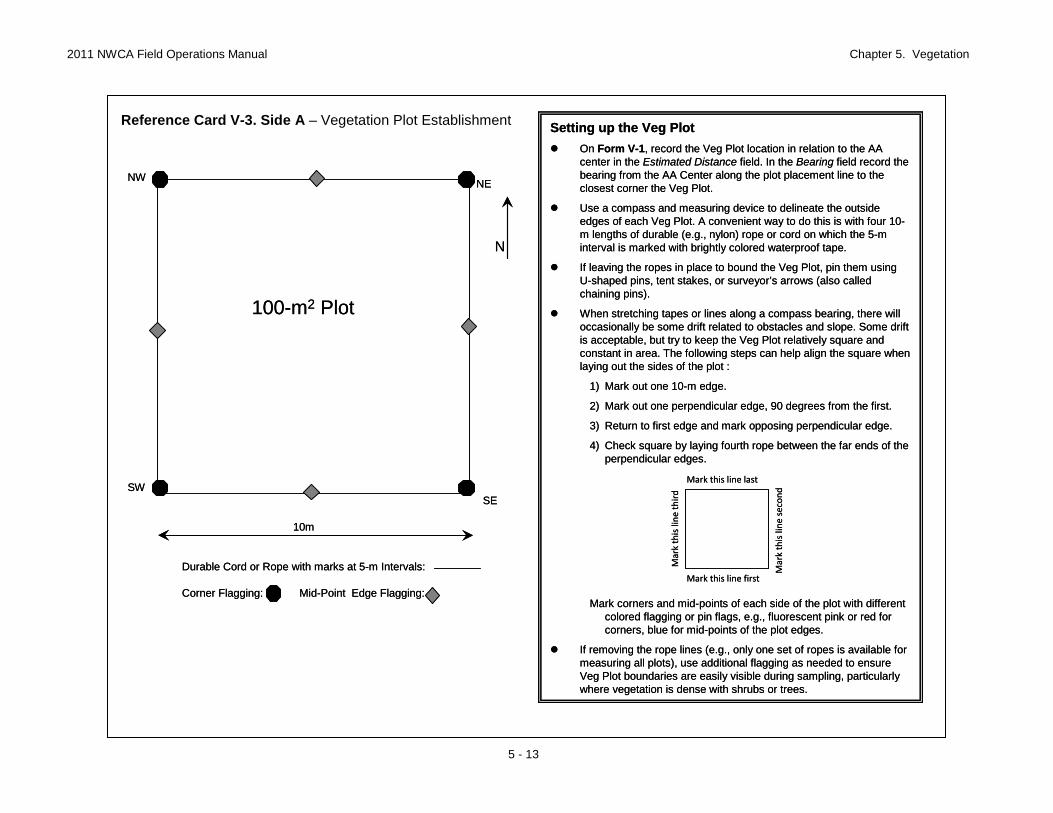
Reference Card V-3. Side A – Vegetation Plot Establishment
Durable Cord or Rope with marks at 5-m Intervals:
Corner Flagging: Mid-Point Edge Flagging:
N
SW
NW NE
SE
10m
100-m2 Plot
Setting up the Veg Plot On Form V-1, record the Veg Plot location in relation to the AA
center in the Estimated Distance field. In the Bearing field record the bearing from the AA Center along the plot placement line to the closest corner the Veg Plot.
Use a compass and measuring device to delineate the outside edges of each Veg Plot. A convenient way to do this is with four 10-m lengths of durable (e.g., nylon) rope or cord on which the 5-m interval is marked with brightly colored waterproof tape.
If leaving the ropes in place to bound the Veg Plot, pin them using U-shaped pins, tent stakes, or surveyor’s arrows (also called chaining pins).
When stretching tapes or lines along a compass bearing, there will occasionally be some drift related to obstacles and slope. Some drift is acceptable, but try to keep the Veg Plot relatively square and constant in area. The following steps can help align the square when laying out the sides of the plot :
1) Mark out one 10-m edge.
2) Mark out one perpendicular edge, 90 degrees from the first.
3) Return to first edge and mark opposing perpendicular edge.
4) Check square by laying fourth rope between the far ends of the perpendicular edges.
Mark corners and mid-points of each side of the plot with different colored flagging or pin flags, e.g., fluorescent pink or red forcorners, blue for mid-points of the plot edges.
If removing the rope lines (e.g., only one set of ropes is available for measuring all plots), use additional flagging as needed to ensure Veg Plot boundaries are easily visible during sampling, particularly where vegetation is dense with shrubs or trees.
Mark this line last
Mark this line first
Mar
k th
is li
ne th
ird
Mar
k th
is li
ne s
econ
d
2011 NWCA Field Operations Manual Chapter 5. Vegetation
5 - 14
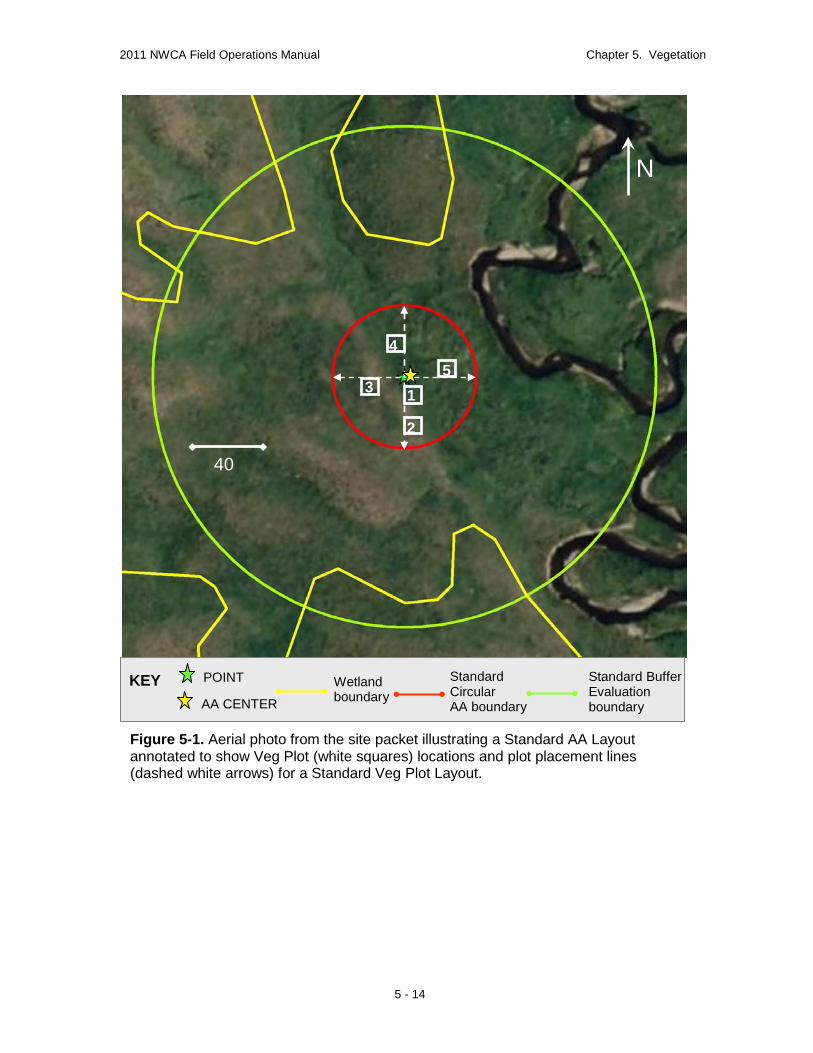
Figure 5-1. Aerial photo from the site packet illustrating a Standard AA Layout annotated to show Veg Plot (white squares) locations and plot placement lines (dashed white arrows) for a Standard Veg Plot Layout.
N
40
KEY
POINT Wetland boundary
Standard Buffer Evaluation boundary
Standard Circular AA boundary AA CENTER
1
4 5
3 2
2011 NWCA Field Operations Manual Chapter 5. Vegetation
5 - 15
5.1.3 Vegetation Data Collection Several kinds of data (e.g., presence, percent cover, or counts) describing vegetation (for individual vascular species, vascular vegetation strata, non-vascular groups, and predominant Status &Trends wetland class) and data describing ground surface attributes are collected over the 100-m2 area of each Veg Plot (Forms V-2 through V-4). Additional presence data by plant species are collected in nested quadrats located at the SW and NE most corners of each Veg Plot and established in each Veg Plot as it is sampled. Reference Cards V-3, Side B and V-4 illustrate the configuration of the 100-m2 Veg Plot and its nested quadrats and summarize vegetation data collection activities.
KEY: POINT Wetland boundary
Approximate Polygon AA boundary
Standard Circular AA boundary
AA CENTER
N
30
1
2
3 4
5
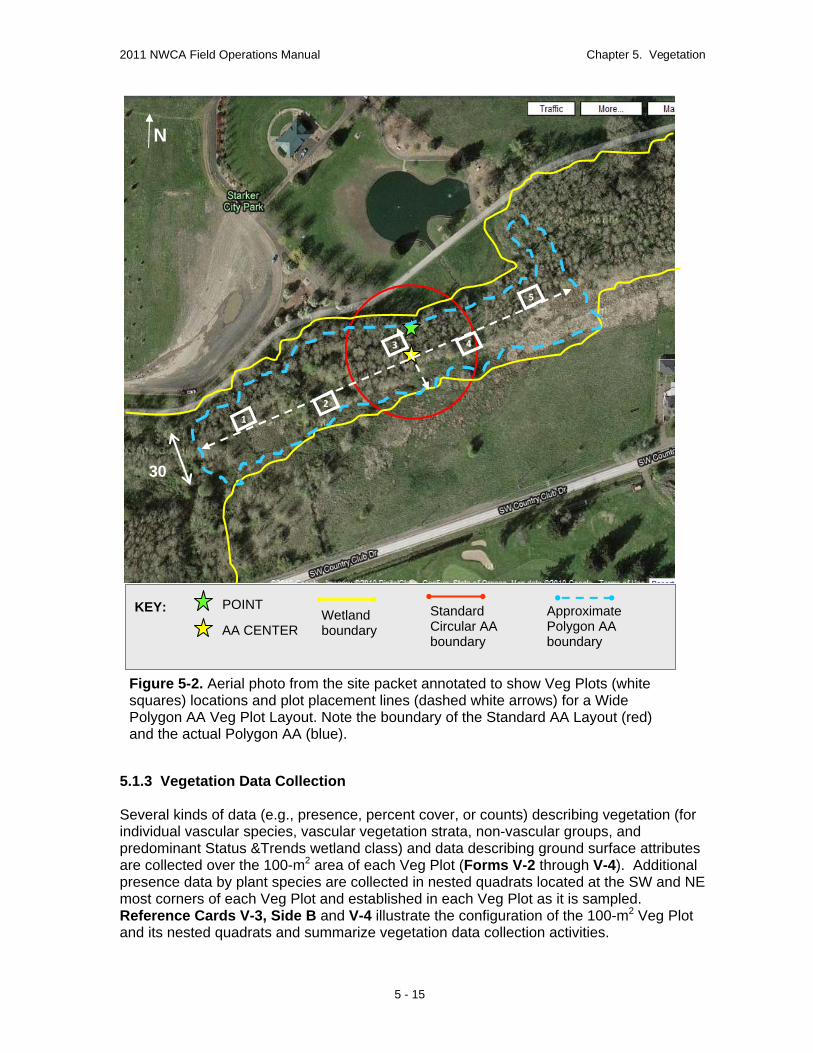
Figure 5-2. Aerial photo from the site packet annotated to show Veg Plots (white squares) locations and plot placement lines (dashed white arrows) for a Wide Polygon AA Veg Plot Layout. Note the boundary of the Standard AA Layout (red) and the actual Polygon AA (blue).
2011 NWCA Field Operations Manual Chapter 5. Vegetation
5 - 16
Often an efficient approach to collecting vegetation data is for the Botanist Assistant to record data as the Botanist/Ecologist makes observations. At other times, it will be more efficient for the Botanist/Ecologist and Botanist Assistant to collect different kinds of data. For example:
Botanist/Ecologist collects all data that require identification or cover estimation of individual plant species.
Botanist Assistant collects data on cover of vegetation strata, ground surface attributes, groups of non-vascular taxa, and count data for trees and snags.
5.1.3.1 Activities Key to Vegetation Data Collection Several kinds of data are recorded, sampling activities conducted, and resources are consulted throughout the sampling day, which are essential to data quality. Site Number, Date, and Page Numbers – Note that in most cases the Site Number is preprinted on the forms (e.g., see Figure 5-3a-c), plant sample tags and plant specimen labels, so ensure that you use the correct set of forms, tags, and labels for the site being sampled. Be sure to record the date sampling is initiated wherever it is requested. If using forms or labels without preprinted site numbers, be sure to fill in the correct site number. If this information is incorrect or omitted, it may be impossible to connect data or plant specimens to a particular site, resulting in data loss. For forms that have multiple pages (Forms V-2 and V-4) be sure to fill in the page number for each page and the total number of pages (Figure 5-3a-c). Note the back of Form V-2a is unnumbered. Form Instructions and Using Capital Letters – Carefully follow all instructions on each data form. Use capital letters to neatly record species names on forms (see Figure 5-3a). Confirmation Bubbles (appear near top of some data forms) – Several forms have bubbles to fill to confirm aspects of how data are recorded. Read these statements carefully and fill in the bubbles as requested to confirm what empty data fields or unfilled data bubbles on a particular form mean. For example: On forms where cover data or counts (Forms V-2, V-3, and V-4) are recorded, one
kind of confirmation bubble indicates that empty data cells equal zero. On forms where presence/absence data or categorical data (Forms V-2 and V-3) are
recorded, one kind of confirmation bubble indicates that filled bubbles denote presence and unfilled bubbles denote absence.
Data Flags and Comments – There is space on all Forms V-2, V-3, and V-4 to flag data for which additional information or explanation may be needed. Standard flag types are predefined at the bottom of each form (e.g., E = end of
species list, K = no measurement, U = suspect measurement). For predefined flags, write the code for the flag in the Flag column in the appropriate data row. If necessary provide more information about the reason for the flag in the Flag and Comments section at the bottom or on the back side of each data form.
Additional flag codes may need to be created to describe other situations. For each
unique situation, create a flag code (e.g., F1, F2, F3...) and define the code in the Flag
2011 NWCA Field Operations Manual Chapter 5. Vegetation
5 - 17
and Comments section on the form. Flag codes are numbered consecutively, beginning with F1, on each set of V-2, V-3, or V-4 forms for the site.
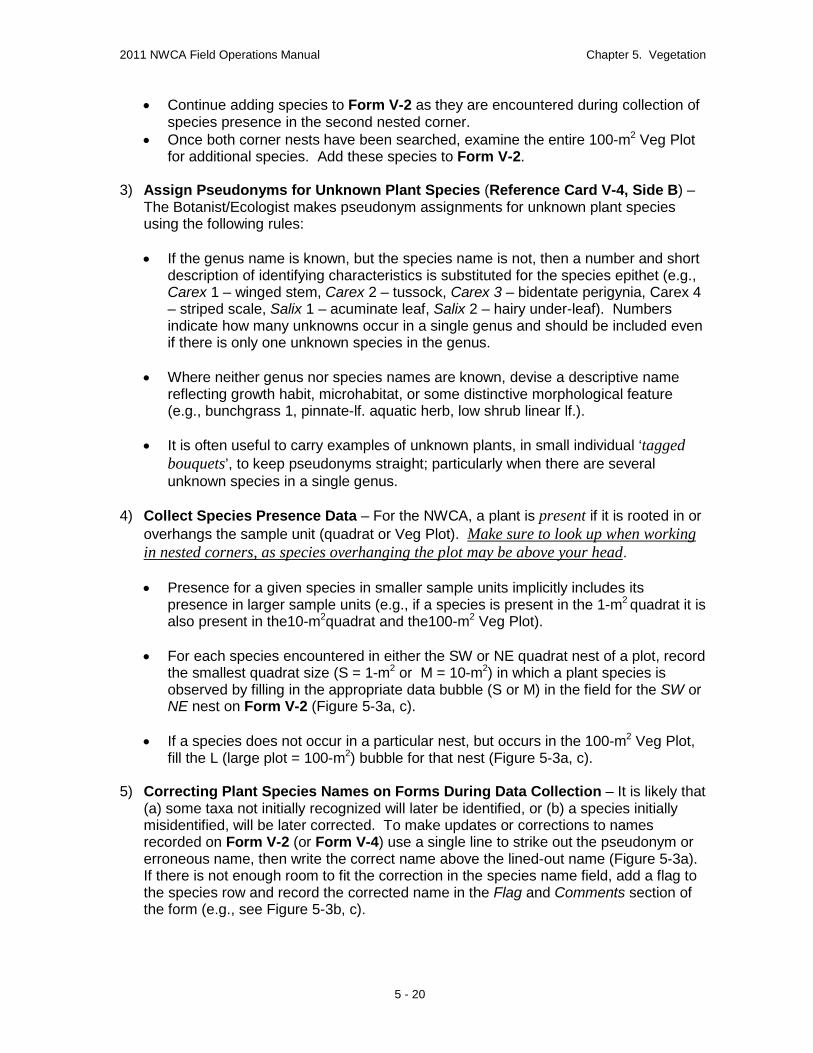
Examples of how to use vegetation data flags are illustrated in Figure 5-3a-c, which
depicts imaginary data for pages of a set of Form V-2 for one AA. V-2 Forms are used for illustration because they are the most complex of the vegetation forms. One set of Form V-2: Vascular Species Presence and Cover pages is used to record data for vascular species presence, height, and cover for each AA. Form V-2a includes data collection instructions and several rows for recording plant
species data on the front, and provides space on the back for defining flags that might be associated with data on front of the form, as well as overflow space, if needed, for defining flags from the continuing Form V-2b pages. Form V2-b provides space for both species data and defining flags associated with the data.
In Figure 5-3a, two species, Corydalis aquae-gelidae and Kalmiopsis fragrans,
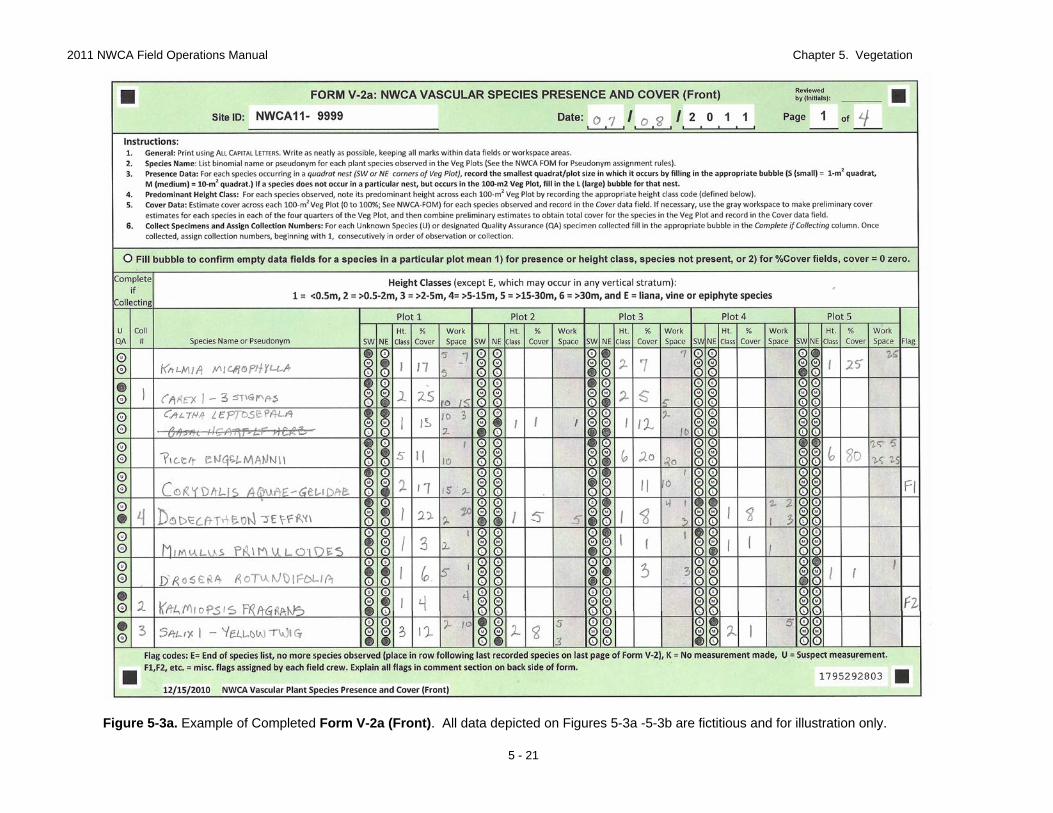
recorded on Form V-2a (front) are flagged (F1 and F2, respectively) to indicate there is additional information regarding these taxa. These flags are defined on the back of Form V-2a (Figure 5-3b). The explanation for the F2 flag for Kalmiopsis fragrans occupies two lines, so the flag code (F2) is repeated on both lines.
Note that flags defined on the Form V-2a (back) may refer to species data on Form
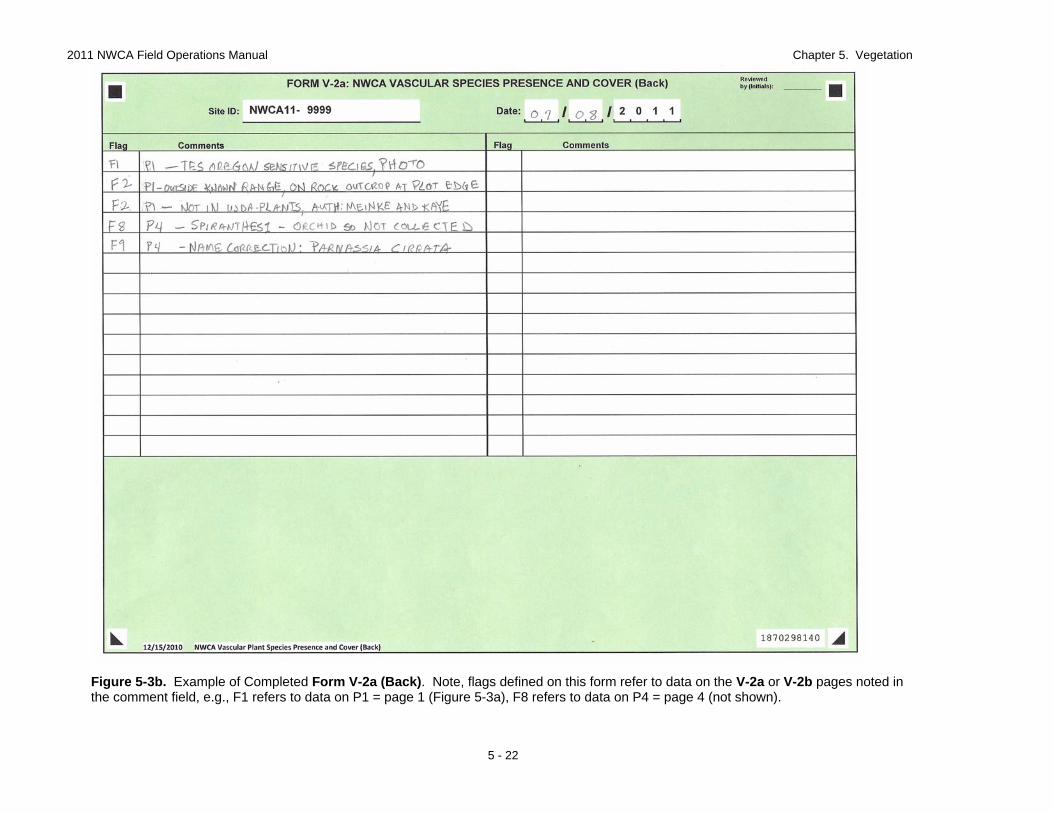
V-2a (front), page 1 of the V-2 set, or to flags from various pages of Form V-2b (continued). Consequently, flags on Form V-2a (back) should include, in the comment field, the page number (e.g., P1, P4 as illustrated in Figure 5-3b) to which the flag code refers. However, typically there should be enough room for most needed data flags at the bottom of each Form V-2b page (Figure 5-3c).
Nomenclatural Sources – Use the nomenclature in the USDA PLANTS database (USDA, NRCS 2010, http://plants.usda.gov/), hereafter PLANTS, when recording plant species names on Forms V-2: Vascular Species Presence and Cover and V-4: Snag and Tree Counts and Tree Cover. It is important to use the PLANTS nomenclature at each site so species names are based on a common taxonomic standard across all NWCA sites. In the Plant Species Nomenclature section of Form V-1: 1) Confirm that you have reconciled the names for the plant species observed at the site
to PLANTS nomenclature by filling in the USDA-PLANTS bubble.
2) Record the citations for the flora(s), field guides, or databases you used in identifying plant species at the site. Include author(s), publication date, title, and publisher. If the reference you are using is listed in the Regional Floras and Botanical Field Guides section of Appendix C (Supplementary Vegetation Material), you need only record the author(s) and publication date for the floristic source.
3) Occasionally a species might occur for which there is no name or synonym in
PLANTS; e.g., a recently described species or an occurrence of a newly introduced species. For a species with no synonym in PLANTS do one of the following:
a) Flag the data recorded for this species on Form V-2 or V-4 and record the
botanical authority for the species (e.g., Figure 5-3a, b, Kalmia fragrans Meinke & Kaye, sp. nov., (Meinke and Kaye 2007)).
2011 NWCA Field Operations Manual Chapter 5. Vegetation
5 - 18
b) Make a note next to the citation on Form V-1 for the flora, field guide, or database used to identify the species. Include a flag next to where the species is listed on Form V-2 or V-4, (e.g., F1 – species name is from source #1 listed on Form V-1).
Regional or Site Specific Species Lists – When identifying plant species, it can be helpful to consult existing plant species lists for similar habitats in the region of the AA you are sampling. If such lists are available, include them in the Site Packet for the AA (see Chapter 2) or carry them in the vehicle with your other floristic resources. Other Floristic Resources –A range of useful floristic resources are listed in Appendix C. Tree and Shrub Species Identification – The Botanist Assistant may often collect tree cover and count data in each Veg Plot (Section 5.1.3.9), so it will be useful to keep a list of the scientific names or pseudonyms for tree species observed in the Veg Plots on his or her clipboard. If needed, the Botanist/Ecologist can convey key distinguishing characteristics for tree species to the Botanist Assistant. Plant Specimen Collection –Specimens of all unknown plant species and a voucher specimen for one randomly selected species of known identity occurring in each Veg Plot is collected for later identification or taxonomic verification. Unknown plant specimens are typically collected over the entire sampling day as they are encountered. One randomly selected species of known identity is collected from each Veg Plot (i.e., 5 specimens/AA) for quality assurance checks. Section 5.2 details plant specimen collection and handling procedures. An overview is outlined here:
1) For each species that needs to be collected, fill in the appropriate bubble to designate
the sample as an unknown species or as a QA sample (see Section 5.2) under the Complete if Collecting section of Form V-2: Vascular Species Presence and Cover (Figure 5-3a, c). Once the plant sample is collected, assign it a collection number and record in the Collect # field of Form V-2. Collection numbers are assigned beginning with 1 and continued consecutively in order of observation or collection.
2) For each species collected, place enough fresh plant material for a complete specimen
(see Section 5.2) into a plastic bag (e.g., 1 gallon zipper-lock or larger bag, if necessary). Write the Site Number and the Collection Number for the specimen on the outside of the bag with a water proof marker or on a slip of water proof paper placed inside the bag. Bagging plants individually can help keep plant parts together and prevent mixing different species.
However, if it is easier, multiple species can be placed into larger bags. If more than one specimen is included in a single bag, be sure they can be easily distinguished from one another and related to their collection numbers from Form V-2. For example, tag individual species by bundling plant material by the stems with masking tape or a strip of flagging and labeling with the collection number.
3) Keep specimen collection bags out of the sun and cool during the sampling day.
4) Press plant specimens as soon as possible. When specimens are pressed (usually at the end of the sampling day, Sections 5.1.4 and 5.2.2) a completed Plant Specimen Label is included with each specimen inside its newsprint folder, and an adhesive Plant Sample ID Tag affixed to the outside of the newsprint (Section 5.2.3).
2011 NWCA Field Operations Manual Chapter 5. Vegetation
5 - 19
Sensitive Plant Species – Avoid collecting plant species that are listed as THREATENED, ENDANGERED, or SENSTIVE (TES), or are easily destroyed if collected (e.g., many orchid species). Become familiar with national and state TES species lists relevant to the state in which you are working and with wetland TES species in particular. Photograph TES species using the guidance in Appendix D: Photography. Add a flag to the data recorded for this species on Form V-2 or V-4 (e.g., F1 – Threatened in Oregon, photo taken; see example on Figure 5-3a,b). 5.1.3.2 Collecting Vascular Plant Species Presence Data and Creating Species List One set of Forms V-2: Vascular Species Presence and Cover (V-2a (Front) V-2a (Back), and V-2b (Continued)) is used to record data for vascular species presence (this section), height, and cover for each AA (Sections 5.1.3.3 – 5.1.3.4). On these forms, a row represents data for an individual plant species; columns represent data elements for each Veg Plot. Several V2-b pages may be required for each AA depending on how many species are present. Species presence data are collected from nested quadrats located in the SW and NE most corners of each 100-m2
Veg Plot (Reference Card V-3, Side B). Presence data are collected first to begin building the species list for the Veg Plot and to prevent trampling of the quadrats before the presence data is obtained.
Collect species presence data in both the 1-m2 and 10-m2
quadrats of one nest, then move to the other corner nest and repeat the procedure using the steps below.
1) Establish Quadrat Nests – Each nest is comprised of a 1-m2 and a 10-m2
quadrat and can be set-up in a variety of ways. For example:
• Outside edges of the 1-m2 and 10-m2 quadrats are formed by the edges of the 100-m2
Veg Plot demarcated by during plot establishment.
• Interior sides of the 1-m2
quadrat may be defined using (a) two 1m PVC poles, (b) two 1m long wooden slats, or (c) a 2m length of rope with the mid-point marked.
• The interiors of the 10-m2
quadrat can be set-up using (a) two 3.16m segmented PVC poles, or (b) a 6.32m length of rope with the mid-point marked.
• Any of the items used for the inside quadrat edges can be placed on the ground in open or herbaceous vegetation, or threaded through or over the top of shrubby vegetation. If obstacles prevent leaving these materials in place, measure the distance to the quadrat corners and mark quadrat edges with flagging.
2) Create the Plant Species List – As each species is observed during sampling (See 4,
below), enter its name in the Species Name or Pseudonym column on Form V-2 (Figure 5-3). • Initiate a species list for Form V-2 by recording the names of all species
encountered in the first nested corner sampled. • If the species identity is known, record the full binary genus and species name. • If the species identity is unknown, give it a descriptive pseudonym (See 3, next).
2011 NWCA Field Operations Manual Chapter 5. Vegetation
5 - 20
• Continue adding species to Form V-2 as they are encountered during collection of species presence in the second nested corner.
• Once both corner nests have been searched, examine the entire 100-m2
Veg Plot for additional species. Add these species to Form V-2.
3) Assign Pseudonyms for Unknown Plant Species (Reference Card V-4, Side B) – The Botanist/Ecologist makes pseudonym assignments for unknown plant species using the following rules:
• If the genus name is known, but the species name is not, then a number and short
description of identifying characteristics is substituted for the species epithet (e.g., Carex 1 – winged stem, Carex 2 – tussock, Carex 3 – bidentate perigynia, Carex 4 – striped scale, Salix 1 – acuminate leaf, Salix 2 – hairy under-leaf). Numbers indicate how many unknowns occur in a single genus and should be included even if there is only one unknown species in the genus.
• Where neither genus nor species names are known, devise a descriptive name
reflecting growth habit, microhabitat, or some distinctive morphological feature (e.g., bunchgrass 1, pinnate-lf. aquatic herb, low shrub linear lf.).
• It is often useful to carry examples of unknown plants, in small individual ‘tagged
bouquets’, to keep pseudonyms straight; particularly when there are several unknown species in a single genus.
4) Collect Species Presence Data – For the NWCA, a plant is present if it is rooted in or
overhangs the sample unit (quadrat or Veg Plot). Make sure to look up when working in nested corners, as species overhanging the plot may be above your head
.
• Presence for a given species in smaller sample units implicitly includes its presence in larger sample units (e.g., if a species is present in the 1-m2 quadrat it is also present in the10-m2quadrat and the100-m2
Veg Plot).
• For each species encountered in either the SW or NE quadrat nest of a plot, record the smallest quadrat size (S = 1-m2 or M = 10-m2
) in which a plant species is observed by filling in the appropriate data bubble (S or M) in the field for the SW or NE nest on Form V-2 (Figure 5-3a, c).
• If a species does not occur in a particular nest, but occurs in the 100-m2 Veg Plot, fill the L (large plot = 100-m2
) bubble for that nest (Figure 5-3a, c).
5) Correcting Plant Species Names on Forms During Data Collection – It is likely that (a) some taxa not initially recognized will later be identified, or (b) a species initially misidentified, will be later corrected. To make updates or corrections to names recorded on Form V-2 (or Form V-4) use a single line to strike out the pseudonym or erroneous name, then write the correct name above the lined-out name (Figure 5-3a). If there is not enough room to fit the correction in the species name field, add a flag to the species row and record the corrected name in the Flag and Comments section of the form (e.g., see Figure 5-3b, c).
2011 NWCA Field Operations Manual Chapter 5. Vegetation
5 - 21
Figure 5-3a. Example of Completed Form V-2a (Front). All data depicted on Figures 5-3a -5-3b are fictitious and for illustration only.
2011 NWCA Field Operations Manual Chapter 5. Vegetation
5 - 22
Figure 5-3b. Example of Completed Form V-2a (Back). Note, flags defined on this form refer to data on the V-2a or V-2b pages noted in the comment field, e.g., F1 refers to data on P1 = page 1 (Figure 5-3a), F8 refers to data on P4 = page 4 (not shown).
2011 NWCA Field Operations Manual Chapter 5. Vegetation
5 - 23
Figure 5-3c. Example of Completed Form V-2b (Continued). Note, the space for flags available at bottom of this form.
2011 NWCA Field Operations Manual Chapter 5. Vegetation
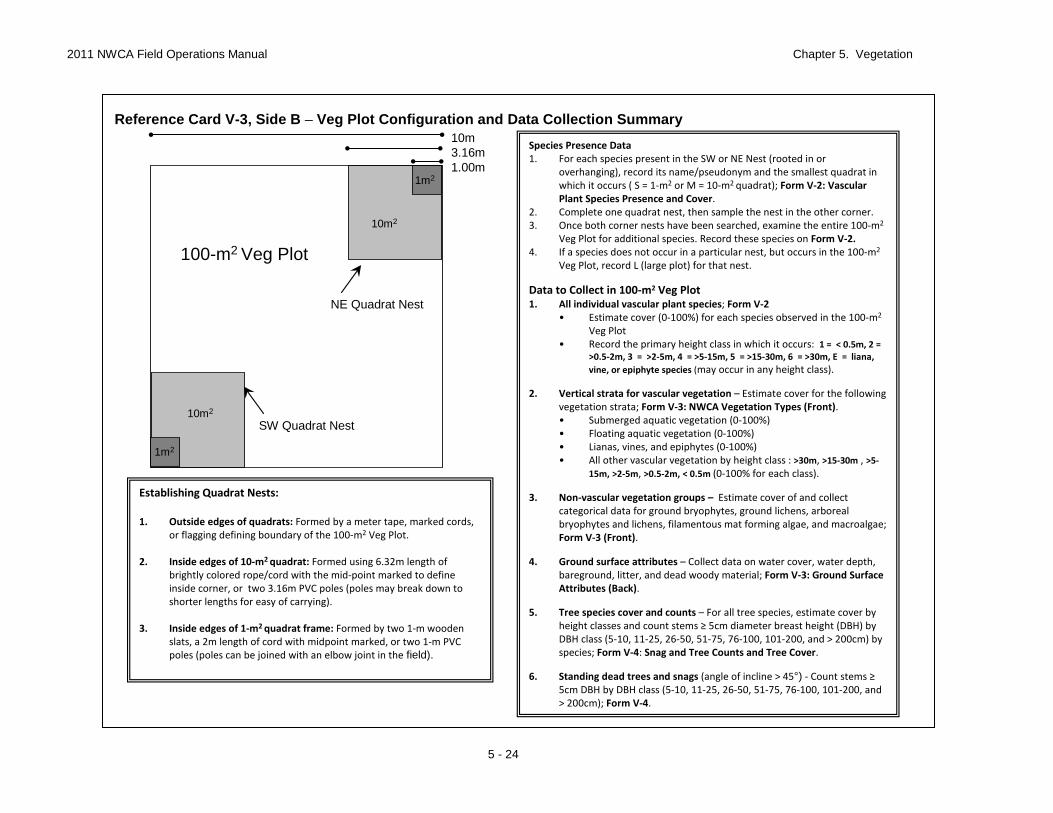
5 - 24
Species Presence Data1. For each species present in the SW or NE Nest (rooted in or
overhanging), record its name/pseudonym and the smallest quadrat in which it occurs ( S = 1-m2 or M = 10-m2 quadrat); Form V-2: Vascular Plant Species Presence and Cover.
2. Complete one quadrat nest, then sample the nest in the other corner.3. Once both corner nests have been searched, examine the entire 100-m2
Veg Plot for additional species. Record these species on Form V-2.4. If a species does not occur in a particular nest, but occurs in the 100-m2
Veg Plot, record L (large plot) for that nest.
Data to Collect in 100-m2 Veg Plot1. All individual vascular plant species; Form V-2
• Estimate cover (0-100%) for each species observed in the 100-m2
Veg Plot• Record the primary height class in which it occurs: 1 = < 0.5m, 2 =
>0.5-2m, 3 = >2-5m, 4 = >5-15m, 5 = >15-30m, 6 = >30m, E = liana, vine, or epiphyte species (may occur in any height class).
2. Vertical strata for vascular vegetation – Estimate cover for the following vegetation strata; Form V-3: NWCA Vegetation Types (Front).• Submerged aquatic vegetation (0-100%)• Floating aquatic vegetation (0-100%)• Lianas, vines, and epiphytes (0-100%)• All other vascular vegetation by height class : >30m, >15-30m , >5-
15m, >2-5m, >0.5-2m, < 0.5m (0-100% for each class).
3. Non-vascular vegetation groups – Estimate cover of and collect categorical data for ground bryophytes, ground lichens, arborealbryophytes and lichens, filamentous mat forming algae, and macroalgae; Form V-3 (Front).
4. Ground surface attributes – Collect data on water cover, water depth, bareground, litter, and dead woody material; Form V-3: Ground Surface Attributes (Back).
5. Tree species cover and counts – For all tree species, estimate cover by height classes and count stems ≥ 5cm diameter breast height (DBH) by DBH class (5-10, 11-25, 26-50, 51-75, 76-100, 101-200, and > 200cm) by species; Form V-4: Snag and Tree Counts and Tree Cover.
6. Standing dead trees and snags (angle of incline > 45°) - Count stems ≥5cm DBH by DBH class (5-10, 11-25, 26-50, 51-75, 76-100, 101-200, and > 200cm); Form V-4.
Establishing Quadrat Nests:
1. Outside edges of quadrats: Formed by a meter tape, marked cords, or flagging defining boundary of the 100-m2 Veg Plot.
2. Inside edges of 10-m2 quadrat: Formed using 6.32m length of brightly colored rope/cord with the mid-point marked to define inside corner, or two 3.16m PVC poles (poles may break down to shorter lengths for easy of carrying).
3. Inside edges of 1-m2 quadrat frame: Formed by two 1-m wooden slats, a 2m length of cord with midpoint marked, or two 1-m PVC poles (poles can be joined with an elbow joint in the field).
Reference Card V-3, Side B – Veg Plot Configuration and Data Collection Summary10m3.16m1.00m
100-m2 Veg Plot
NE Quadrat Nest
SW Quadrat Nest
10m2
1m2
10m2
10m2
1m2
2011 NWCA Field Operations Manual Chapter 5. Vegetation
5 - 25
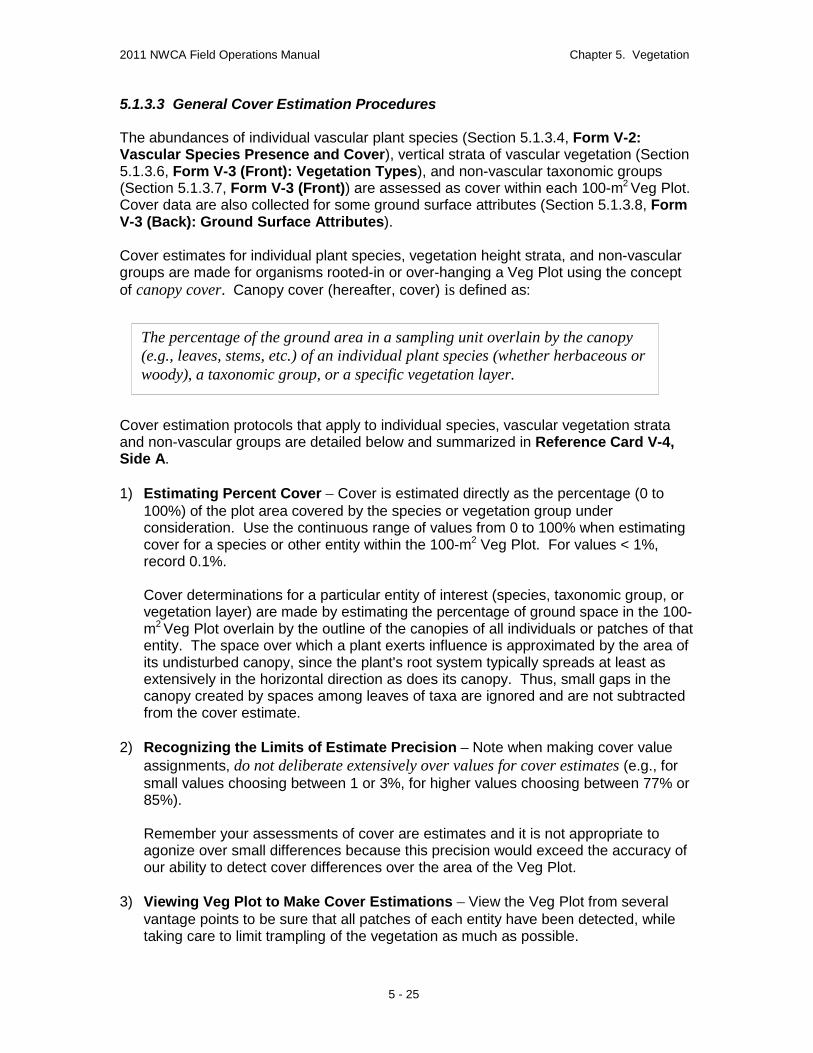
5.1.3.3 General Cover Estimation Procedures The abundances of individual vascular plant species (Section 5.1.3.4, Form V-2: Vascular Species Presence and Cover), vertical strata of vascular vegetation (Section 5.1.3.6, Form V-3 (Front): Vegetation Types), and non-vascular taxonomic groups (Section 5.1.3.7, Form V-3 (Front)) are assessed as cover within each 100-m2
Veg Plot. Cover data are also collected for some ground surface attributes (Section 5.1.3.8, Form V-3 (Back): Ground Surface Attributes).
Cover estimates for individual plant species, vegetation height strata, and non-vascular groups are made for organisms rooted-in or over-hanging a Veg Plot using the concept of canopy cover. Canopy cover (hereafter, cover) is defined as: Cover estimation protocols that apply to individual species, vascular vegetation strata and non-vascular groups are detailed below and summarized in Reference Card V-4, Side A. 1) Estimating Percent Cover – Cover is estimated directly as the percentage (0 to
100%) of the plot area covered by the species or vegetation group under consideration. Use the continuous range of values from 0 to 100% when estimating cover for a species or other entity within the 100-m2
Veg Plot. For values < 1%, record 0.1%.
Cover determinations for a particular entity of interest (species, taxonomic group, or vegetation layer) are made by estimating the percentage of ground space in the 100-m2
Veg Plot overlain by the outline of the canopies of all individuals or patches of that entity. The space over which a plant exerts influence is approximated by the area of its undisturbed canopy, since the plant's root system typically spreads at least as extensively in the horizontal direction as does its canopy. Thus, small gaps in the canopy created by spaces among leaves of taxa are ignored and are not subtracted from the cover estimate.
2) Recognizing the Limits of Estimate Precision – Note when making cover value assignments, do not deliberate extensively over values for cover estimates (e.g., for small values choosing between 1 or 3%, for higher values choosing between 77% or 85%).
Remember your assessments of cover are estimates and it is not appropriate to agonize over small differences because this precision would exceed the accuracy of our ability to detect cover differences over the area of the Veg Plot.
3) Viewing Veg Plot to Make Cover Estimations – View the Veg Plot from several
vantage points to be sure that all patches of each entity have been detected, while taking care to limit trampling of the vegetation as much as possible.
The percentage of the ground area in a sampling unit overlain by the canopy (e.g., leaves, stems, etc.) of an individual plant species (whether herbaceous or woody), a taxonomic group, or a specific vegetation layer.
2011 NWCA Field Operations Manual Chapter 5. Vegetation
5 - 26
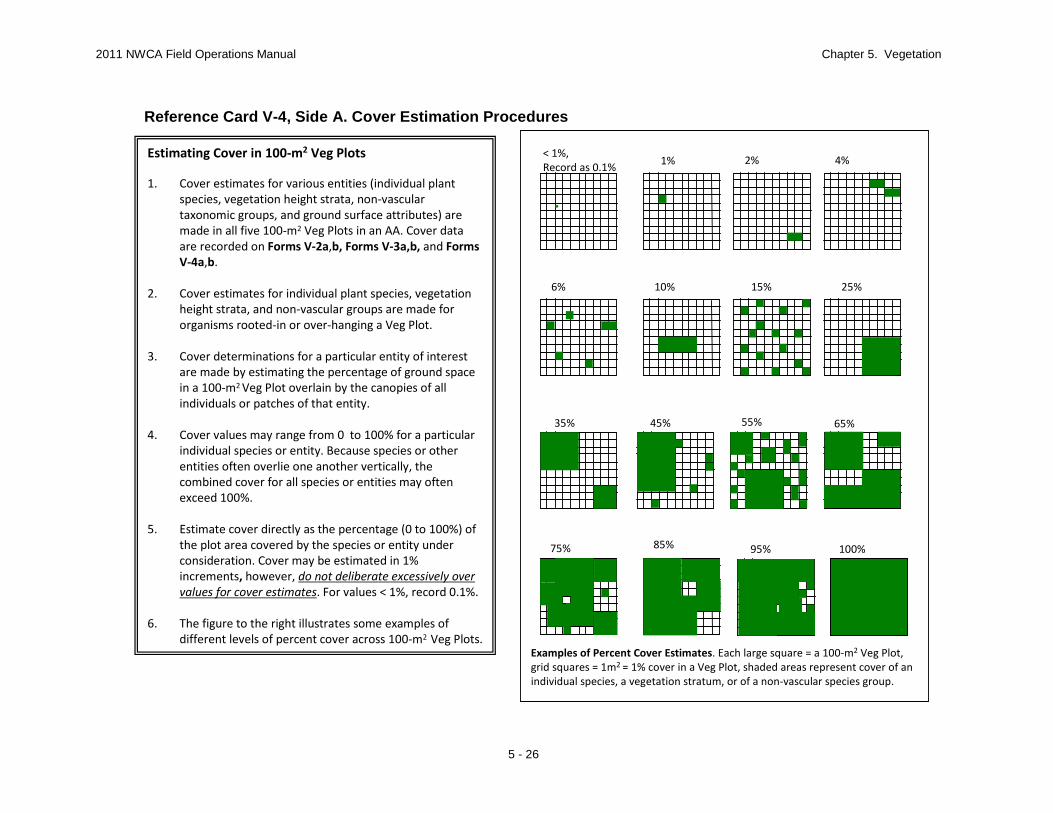
Estimating Cover in 100-m2 Veg Plots
1. Cover estimates for various entities (individual plant species, vegetation height strata, non-vascular taxonomic groups, and ground surface attributes) are made in all five 100-m2 Veg Plots in an AA. Cover data are recorded on Forms V-2a,b, Forms V-3a,b, and Forms V-4a,b.
2. Cover estimates for individual plant species, vegetation height strata, and non-vascular groups are made for organisms rooted-in or over-hanging a Veg Plot.
3. Cover determinations for a particular entity of interest are made by estimating the percentage of ground space in a 100-m2 Veg Plot overlain by the canopies of all individuals or patches of that entity.
4. Cover values may range from 0 to 100% for a particular individual species or entity. Because species or other entities often overlie one another vertically, the combined cover for all species or entities may often exceed 100%.
5. Estimate cover directly as the percentage (0 to 100%) of the plot area covered by the species or entity under consideration. Cover may be estimated in 1% increments, however, do not deliberate excessively over values for cover estimates. For values < 1%, record 0.1%.
6. The figure to the right illustrates some examples of different levels of percent cover across 100-m2 Veg Plots.
55%
95%
1%
25%15%
< 1%, Record as 0.1%
4%
35%
6% 10%
45%
2%
75% 100%
65%
85%
Examples of Percent Cover Estimates. Each large square = a 100-m2 Veg Plot, grid squares = 1m2 = 1% cover in a Veg Plot, shaded areas represent cover of an individual species, a vegetation stratum, or of a non-vascular species group.
Reference Card V-4, Side A. Cover Estimation Procedures
2011 NWCA Field Operations Manual Chapter 5. Vegetation
5 - 27
4) Noting Horizontal and Vertical Distribution of Cover Across Veg Plot – When estimating cover, remember the pattern of distribution of particular species or entity might be aggregated or dispersed across a 100-m2
Veg plot (Reference Card V-4, Side A). Take care to detect low cover, widely dispersed taxa. Similarly, plant species or vegetation strata vary in height, and it is common for the canopies of species or vegetation layers to be distributed vertically, but overlie the same horizontal space.
5) Assigning cover values – It is helpful to visualize percent cover in terms of spatial areas within the 100-m2 Veg Plot, and to use this information to guide cover estimations for a particular species or entity. In a 10×10m Veg Plot, 1m2 is equivalent to 1% cover, a 3x3m block equals 9% cover, and a 5x5m block represents 25% of the area of the Veg Plot. Reference Card V-4, Side A provides examples of cover estimates reflecting different distributions and abundances for an individual entity (e.g., a species, a vegetation layer, or a taxonomic group) within a 100-m2
Veg Plot.
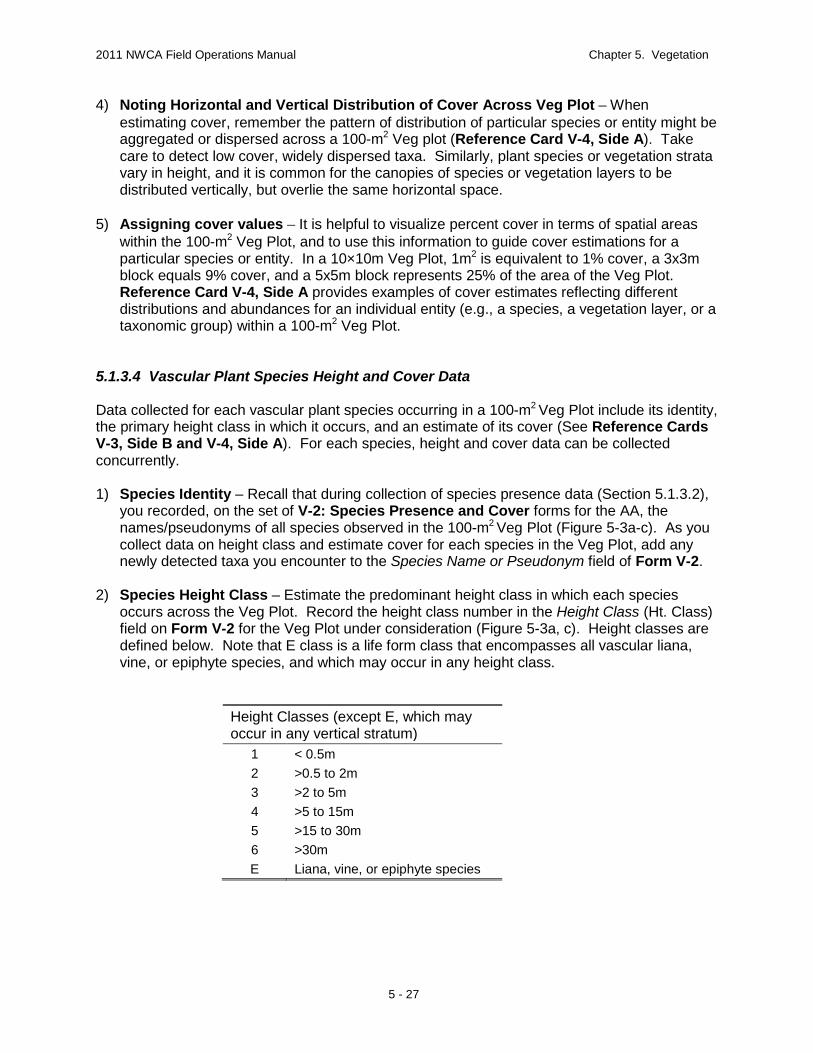
5.1.3.4 Vascular Plant Species Height and Cover Data Data collected for each vascular plant species occurring in a 100-m2
Veg Plot include its identity, the primary height class in which it occurs, and an estimate of its cover (See Reference Cards V-3, Side B and V-4, Side A). For each species, height and cover data can be collected concurrently.
1) Species Identity – Recall that during collection of species presence data (Section 5.1.3.2), you recorded, on the set of V-2: Species Presence and Cover forms for the AA, the names/pseudonyms of all species observed in the 100-m2
Veg Plot (Figure 5-3a-c). As you collect data on height class and estimate cover for each species in the Veg Plot, add any newly detected taxa you encounter to the Species Name or Pseudonym field of Form V-2.
2) Species Height Class – Estimate the predominant height class in which each species occurs across the Veg Plot. Record the height class number in the Height Class (Ht. Class) field on Form V-2 for the Veg Plot under consideration (Figure 5-3a, c). Height classes are defined below. Note that E class is a life form class that encompasses all vascular liana, vine, or epiphyte species, and which may occur in any height class.
Height Classes (except E, which may occur in any vertical stratum)
1 < 0.5m 2 >0.5 to 2m 3 >2 to 5m 4 >5 to 15m 5 >15 to 30m 6 >30m E Liana, vine, or epiphyte species
2011 NWCA Field Operations Manual Chapter 5. Vegetation
5 - 28
3) Species Cover – Estimate percent cover for each species observed in the Veg Plot and record this data in the % Cover field of the appropriate plot on Form V-2 (Figure 5-3a,c). Use the following general guidelines, based on the complexity of the vegetation, to estimate cover for the plant species occurring in the 100-m2
Veg Plot.
• Cover for any individual plant species observed in a Veg Plot can range from 0 to 100%. However, because of vertical stratification of plant species within communities, the sum of the covers of all observed species often substantially exceeds 100%.
• View and search the Veg Plot from several vantage points (e.g., from several points
outside the plot and from the plot center) to detect and make cover estimates for all species that are present.
• When estimating cover of tall species (i.e., tall shrubs and trees) care should be taken to
try to visually project the Veg Plot boundaries upwards to frame the vertical sample area and identify the edges of the Veg Plot.
• Where species diversity is high, vegetation is patchy, or species are widely distributed
across the Veg Plot, it will likely be helpful, to make preliminary estimates of cover for different patches of a particular species in different parts of the Veg Plot (e.g., Species 1 may occur in patches of the following sizes: 1m2 = 1%, 7m2 = 7%, 25m2
= 25%). To keep track of these preliminary estimates while moving around the Veg Plot, record them in the Work Space field associated with the species of interest on Form V-2 (Figure 5-3a,c). Once all patches of the species in the Veg Plot are observed, the preliminary estimates can be combined to obtain the total percent cover for the species (e.g., continuing with the example above, Species 1 = 33%), which is then recorded in the % Cover field.
• If a Veg Plot is particularly complex or diverse, necessitating preliminary cover estimates for many species in a plot, it may be useful to employ a systematic procedure to do this. A recommended approach follows:
o Visually divide the 100-m2 Veg Plot into four 25m2
quarters. In each quarter of the Veg Plot, search for all species occurring in that quarter.
o Estimate the approximate percent area of the Veg Plot (remember 1m2 = 1%) occupied by each plant species present in the quarter (25% if the entire quarter is covered by a particular species since 25m2 = 25% of the entire 100-m2
Veg Plot). Record the percent area of the Veg Plot covered by each species in each quarter in the Work Space field for that species (see examples in Figure 5-3a,c).
o Once preliminary cover estimates for all four quarters of the Veg Plot are completed, sum the preliminary estimates for each species to obtain the total percent cover of that species in the Veg Plot. This final percent cover value is then recorded in the % Cover field for the species.
2011 NWCA Field Operations Manual Chapter 5. Vegetation
5 - 29
5.1.3.5 Predominant Status and Trends Wetland Class On Form V-3: NWCA Vegetation Types (Front), record the predominant Status and Trends (S&T) Wetland Class comprising each Veg Plot. See Reference Card AA-3, Side A and Chapter 3 for S&T class definitions. 1) If the Veg Plot S&T class is Pf - Palustrine Farmed (not currently in production), fill in the Pf
bubble in the Predominant S&T Class section of Form V-3 (front). Then select and fill the bubble indicating the predominant S&T class of the Veg Plot if it were never cropped. Recall, currently cropped Pf wetlands are not sampleable (Chapter 3 and USEPA 2011c).
2) If the S&T class of the Veg Plot is not Pf (not currently farmed), leave the Pf bubble unfilled.
Indicate the predominant S&T class by filling the appropriate S&T class bubble for the plot. 5.1.3.6 Vertical Strata Data for Vascular Vegetation One of the ways the NWCA assesses the vertical structure of wetland vegetation is to estimate the cover of nine vertical vegetation strata, defined in part by life form type and in part by height classes (Form V-3: NWCA Vegetation Types (Front), Reference Card V-3, Side B). Cover of all the species making up a particular vegetation stratum are estimated collectively and the total cover for an individual stratum can range between 0 and 100 percent. Because vegetation strata may overlie one another the combined cover for all vegetation strata may substantially exceed 100 percent. Estimate cover for each of the following strata across each Veg Plot: 1) Submerged aquatic vegetation (cover 0-100%) – rooted in sediment, most plant cover
submerged or floating on water.
2) Floating aquatic vegetation (cover 0-100%) – not rooted in sediment, floating on water. 3) Cover of all lianas, vines, and epiphytes (cover 0-100%). 4) Cover of all other
a) > 30m tall (0-100%): e.g., very tall trees vascular vegetation by height class:
b) >15 to 30m tall (0-100%): e.g., tall trees c) > 5 to 15m tall (0-100%): e.g., very tall shrubs, short to mid-sized trees d) > 2 to 5m tall (0-100%): e.g., tall shrubs; tree saplings e) 0.5m to 2m (0-100%): e.g., medium height shrubs; tree seedlings and samplings; tall
emergent/terrestrial herbaceous species f) < 0.5 m tall (0-100%): e.g., low emergent/terrestrial herbaceous species; low shrubs,
tree seedlings Record cover estimates for each vegetation stratum in the appropriate Veg Plot column in the % Cover Vascular Vegetation Strata section of Form V-3: NWCA Vegetation Types (Front). 5.1.3.7 Non-Vascular Taxonomic Group Data Bryophytes (mosses and liverworts) growing on ground-level surfaces, ground lichens, arboreal epiphytic bryophytes and lichens, filamentous or mat forming algae, and macroalgae can be
2011 NWCA Field Operations Manual Chapter 5. Vegetation
5 - 30
important components of many wetlands. Data for non-vascular taxonomic groups are collected in each 100-m2
Veg Plot and recorded in the % Cover and Categorical Data for Non-Vascular Taxa section on Form V-3 (Front): Vegetation Types (see also Reference Card V-3, Side B). Cover for each of these groups can range from 0-100%.
Bryophytes – Estimate the collective cover of mosses, and leafy and thalloid liverworts that are growing on ground surfaces, logs, rocks, etc. If the bryophyte layer is dominated by Sphagnum or other peat forming mosses, fill in the peat mosses bubble under the Bryophyte data row. Ground Lichens – Estimate the collective cover of all lichens growing on the ground or other ground layer substrate (e.g., boulders, fallen logs). Do not include arboreal lichens that have fallen from trees in this estimate. Arboreal Epiphytic Bryophytes and Lichens – If arboreal (living on shrubs and trees) bryophytes and lichens are present, estimate the amount of branch, twig, stem, or trunk surface area of woody vegetation in the Veg Plot that this group occupies. Make this estimate rapidly as you scan the available arboreal surface area. It is intended to give a gross indication of the amount of arboreal bryophytes and lichens present. Filamentous Or Mat Forming Algae – Estimate the collective cover of all unicellular or small algae that form visible and often extensive filaments or mats. Macroalgae – Estimate the collective cover of macroalgae. Macroalgae are found in freshwater (e.g., Chara) or tidal settings (seaweeds), and may occur in a wetland both as living, attached material or as wrack (algae that is broken free and/or washed into the wetland). Where macroalgae is present, indicate whether it is wrack, living material, or is of unknown status by filling-in the appropriate data bubbles for each Veg Plot. 5.1.3.8 Ground Surface Attribute Data Data describing surface attributes (water, bare ground, vegetative litter, and woody debris) of each 100-m2
Veg Plot are collected by the Veg Team (see also Reference Card V-3, Side B). Metrics describing these indicators include percent of the plot area covered by an attribute, and where appropriate, the type and depth of the attribute.
Collect and record the following data on Form V-3 (Back): Ground Surface Attributes in the appropriate fields:
Water – Estimate the area of the Veg Plot covered by water and measure water depth. 1) Water Cover – Estimate total percent of the Veg Plot area covered by water, then estimate
cover for three categories of water. The sum of the covers for water categories (a-c) should equal total water cover (e.g., total water cover across Veg Plot = 50% = 30% of Veg Plot with water and floating/submerged aquatic vegetation + 20% of Veg Plot with water and emergent vegetation). Total Water Cover – percent of Veg Plot area with water. a) % Veg Plot area with water and no vegetation. b) % Veg Plot area with water and floating/submerged aquatic vegetation. c) % Veg Plot area with water and emergent vegetation.
2011 NWCA Field Operations Manual Chapter 5. Vegetation
5 - 31
Where floating/submerged and emergent vegetation occur together, classify water type based on vegetation type with greatest cover. If cover of vegetation types is equal, then classify as water and emergent vegetation.
2) Water Depth – Measure water depth from 3 locations that represent the range of water
levels observed (minimum, predominant, maximum). Make depth measurements within 10 minutes of one another. Record the time, using a 24 hour scale, in the Time of Day field in the Water Depth section of the Form V-3 (Back). Depths may be measured using a ruler, meter stick, or a 1-m PVC pole with decimeter marks.
Bare Ground – Estimate the percent of the Veg Plot area occupied by each of the following: 1) Exposed Soil/Sediment. 2) Exposed Gravel/Cobble (~ 2mm to 25cm in diameter). 3) Exposed Rock (>25cm in diameter). The sum of these three elements of bare ground should not exceed 100%. Vegetative Litter – Litter may be overlain by other vegetation layers, but does not typically overlap with water or bare ground. Collect the following data: 1) Total Cover of Vegetative Litter, which may range from 0 to 100%. 2) Identify Predominant Litter Type(s) (all types having ≥ 25% cover), or if total litter cover is <
25% indicate Primary Litter Type): T = thatch (dead graminoid (e.g., grass, sedge, rush) leaves, rhizomes, or other material) F = forb C = coniferous tree E = broadleaf evergreen tree D = deciduous tree N = none
3) Measure litter depth in the center of the 1-m2
quadrat at the NE and the SW Veg Plot corners and record measurements in the appropriate Litter Depth (cm) field.
Woody Debris – Downed woody debris occurs at an angle of incline ≤ 45°. Estimate the percent of the of Veg Plot area covered by: 1) Downed Coarse Woody Debris (> 5cm diameter) 2) Downed Fine Woody Debris (< 5 cm diameter) Woody debris may overlay other vegetation or ground surface layers, so dead woody material in either category may range from 0 to 100%. 5.1.3.9 Snag Count and Tree Species Count and Cover Data Several structural attributes of woody vegetation are evaluated in the NWCA (see also Reference Card V-3, Side B), including: Counts of standing dead trees or snags (angle of incline ≥ 45°) that are > 5cm diameter
breast height (DBH) by DBH classes. Counts of trees (> 5cm DBH) by species in estimated DBH classes. Cover for trees species by estimated height classes. Early in the field season or during training the Veg Team will be calibrated to estimate DBH classes by using a diameter tape to measure a series of trees of different sizes to develop a
2011 NWCA Field Operations Manual Chapter 5. Vegetation
5 - 32
1 2 3 4 10765 98
search image for each DBH class. Height class estimation will also be practiced during training. Once calibrated, the Veg Team will be able to rapidly visually estimate whether a tree belongs in a particular DBH or height class. This snag and tree data for all five Veg Plots is recorded on Form V-4: Snag and Tree Counts and Tree Cover pages. Form V-4a (Front) (see Figure 5-4 for filled out example) is the first page of the set of V-4 forms. If the number of tree species exceeds the space provided on Form V-4a (Front and Back), use as many Form 4-Vb (Continued) pages as needed. 1) Presence of Trees or Snags – If live trees or snags are absent from a Veg Plot, indicate by
filling in the appropriate box in the Trees or Snags Absence section of Form V-4a (Front). If live trees or
snags are present collect the required count and cover data for the Veg Plot.
2) Standing Dead Tree and Snags Counts – Count the number of dead trees/snags that have angle of incline ≥ 45° (≤ 45° = downed woody debris, see Section 5.1.3.8) by DBH class (5-10, 11-25, 26-50, 51-75, 76-100,101-200 and > 200 cm), and record the values in the appropriate DBH columns of the Standing Dead Tree/Snag section on Form V-4a. If needed, while counting dead trees and snags, a running tally* can be kept in the gray workspace for each diameter class. Record the total number for each DBH class in the white data field.
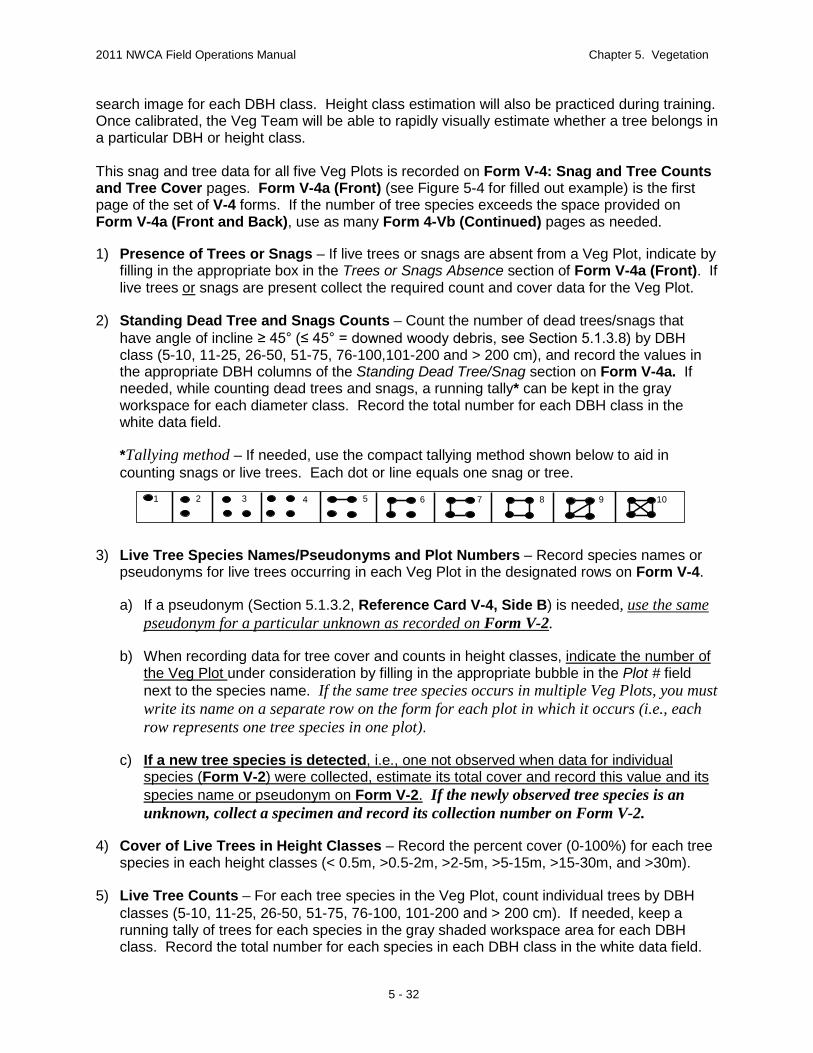
*Tallying method – If needed, use the compact tallying method shown below to aid in counting snags or live trees. Each dot or line equals one snag or tree.
3) Live Tree Species Names/Pseudonyms and Plot Numbers – Record species names or
pseudonyms for live trees occurring in each Veg Plot in the designated rows on Form V-4.
a) If a pseudonym (Section 5.1.3.2, Reference Card V-4, Side B) is needed, use the same pseudonym for a particular unknown as recorded on Form V-2
.
b) When recording data for tree cover and counts in height classes, indicate the number of the Veg Plot
under consideration by filling in the appropriate bubble in the Plot # field next to the species name. If the same tree species occurs in multiple Veg Plots, you must write its name on a separate row on the form for each plot in which it occurs (i.e., each row represents one tree species in one plot).
c) If a new tree species is detected, i.e., one not observed when data for individual species (Form V-2) were collected, estimate its total cover and record this value and its species name or pseudonym on Form V-2.
If the newly observed tree species is an unknown, collect a specimen and record its collection number on Form V-2.
4) Cover of Live Trees in Height Classes – Record the percent cover (0-100%) for each tree species in each height classes (< 0.5m, >0.5-2m, >2-5m, >5-15m, >15-30m, and >30m).
5) Live Tree Counts – For each tree species in the Veg Plot, count individual trees by DBH
classes (5-10, 11-25, 26-50, 51-75, 76-100, 101-200 and > 200 cm). If needed, keep a running tally of trees for each species in the gray shaded workspace area for each DBH class. Record the total number for each species in each DBH class in the white data field.
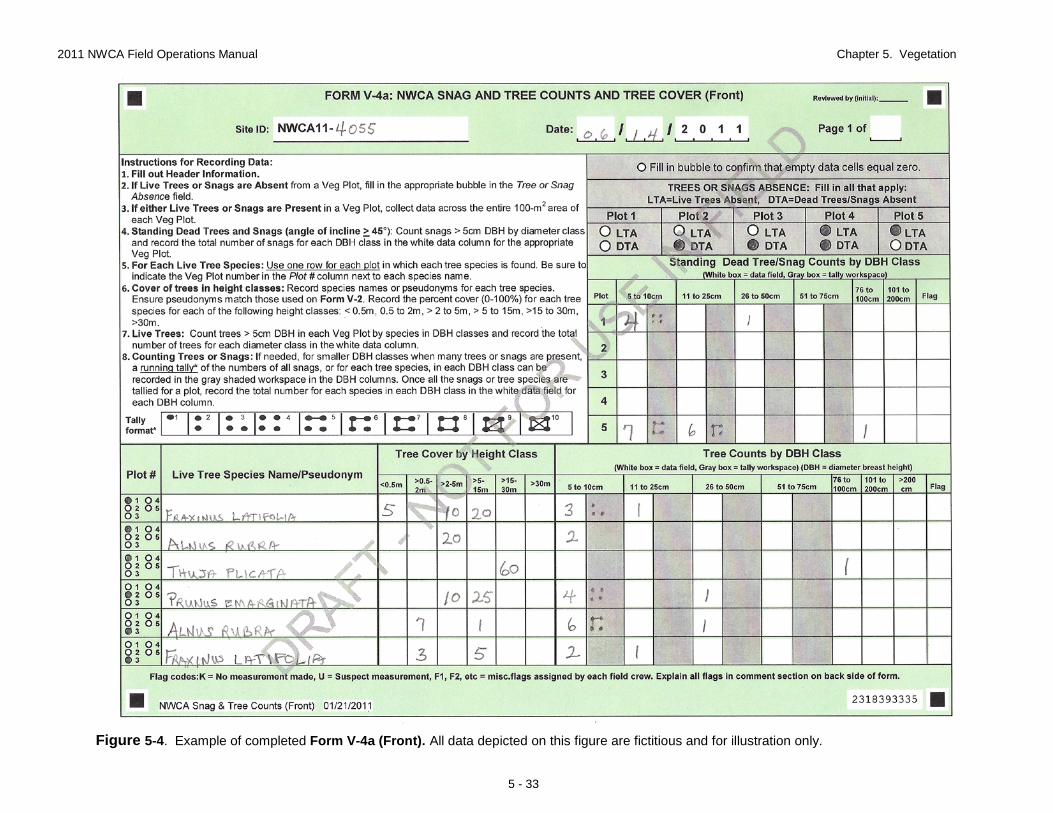
2011 NWCA Field Operations Manual Chapter 5. Vegetation
5 - 33
Figure 5-4. Example of completed Form V-4a (Front). All data depicted on this figure are fictitious and for illustration only.
2011 NWCA Field Operations Manual Chapter 5. Vegetation
5 - 34
5.1.4 Field Day Wrap-Up Activities After completing the sampling of the five Veg Plots (this chapter) and the AA portion (Metrics 4-12) of from the USA-RAM (USEPA in review), the Veg Team conducts field day wrap-up activities. At the AA: 1) Complete collection of unknown and QA voucher specimens (Section 5.2.1): 2) Review all Vegetation Data Forms:
Botanist/Ecologist – Review Forms V-2 and V-4 for errors in species names and missing data. Make any needed corrections.
Botanist Assistant – Review Forms V-1 and V-3 for missing data. Veg Team – If needed, return to Veg Plots and collect any missing information.
3) Time permitting, begin plant identification and specimen pressing:
Botanist/Ecologist use any time available after vegetation sampling and plant specimen collection are completed to key out unknown plant species. For unknowns confidently keyed to species, update pseudonyms to scientific names on Forms V-2 and V-4.
If a plant press is available at the AA, Veg Team presses plant specimens.
However, the AA will often be far enough from the vehicle to make carrying a press to the AA infeasible, so pressing plants will most often be conducted back at the vehicle (see the At the Vehicle heading below).
4) Collect and organize Veg equipment and samples for transport back to the vehicle. 5) Remove all flagging and markers, unless the site will receive a repeat sampling visit (for
quality assurance sampling, other researchers collecting data, etc). For repeat visit sites, labeled flagging should be left at the AA CENTER and POINT.
6) Once all Veg tasks at the AA are complete, assist the AB Team if they are still working.
Alternatively, if there are numerous plant specimens to process, return to the vehicle and begin pressing plants.
Before leaving the AA to return the vehicle make a final check to ensure no equipment,
data, or samples are left behind. If leaving for the vehicle prior to the AB Team, carry selected AB Team equipment and samples to the vehicle.
To prevent spread of potentially harmful organisms and invasive species between
research sites, employ ZERO TAXA TRANSPORT protocols (Chapter 2). Decontaminate equipment, shoes, clothing and person as thoroughly as possible before leaving the site.
At the Vehicle: 1) Press plant specimens (see Section 5.2.2):
Plant specimens are pressed at the vehicle whenever possible. If this is not feasible due to safety issues of parking location or weather, then plants may be pressed upon arrival at the field lodging location at the end of the day.
2011 NWCA Field Operations Manual Chapter 5. Vegetation
5 - 35
• Pressing specimens might be facilitated by forming an assembly line of all four Crew
members (Veg + AB Team). Be sure to affix a completed Plant Sample Tag to the newsprint for each specimen and include a completed Plant Specimen Label inside the newsprint folder with each specimen (see Sections 5.2.2 and 5.2.3). Normally one specimen is pressed for each unknown or QA species. If more than one specimen is collected for a particular species use the same collection number (from Form V-2) on the Plant Sample Tag and Plant Specimen Label for that species.
Note the field day is not finished until all the plants from an AA are pressed. If necessary, the entire Field Crew works together to complete this task.
• On Form T-1: Site and Sample Status/WRS Tracking (Chapter 2), fill the bubble in the
Sample Status section indicating Plant Vouchers & Unknowns were collected and record the total number of plant species collected for the AA (e.g., the highest collection number from the Collect # field on the set of Forms V-2) in the # of Plants Sampled field.
2) Arrange the completed vegetation data forms in order and place into the Data Packet for the
AA (see Chapter 2). 3) Repeat decontamination of equipment, shoes, clothing and person, if the vehicle is located a
long distance from the AA, to prevent spread of potentially harmful organisms and invasive species that may have been picked up between the AA and the vehicle. Employ ZERO TAXA TRANSPORT protocols (Chapter 2).
4) Return all vegetation equipment and supplies to their standard locations in the vehicle. 5.2 SAMPLE COLLECTION AND PROCESSING AND DATA HANDLING Several existing protocols for plant specimen collection, pressing, and handling (Magee et al. 1993, Mack 2007, WIPP 2008, University of Florida Herbarium 2009) and helpful reviews from several wetland ecologists were useful in developing the NWCA protocols for plant sample collection and processing presented in this section. Specimens of all unknown plant species and voucher specimens for five known taxa are collected across the five Veg Plots. Specimen collection, labeling, and plant pressing are completed during the field day (Sections 5.2.1 through 5.2.3). Activities for specimen preservation (drying) and shipping or delivering dried specimens to a designated office or herbarium carry over to subsequent field or travel days, or may sometimes be completed at the base location or lodging (Section 5.2.4 and 5.2.5). Other specimen management and identification tasks are conducted from the office or designated herbarium. Protocols for these tasks are outside the purview of this document and are detailed in the NWCA – Laboratory Operations Manual (NWCA-LOM) (USEPA 2011a), and include: identification of unknown pressed specimens, updating data forms or spreadsheets with scientific species names, and shipping QA specimens and a percentage of the unknowns after initial identification to regional botanical experts for verification.
2011 NWCA Field Operations Manual Chapter 5. Vegetation
5 - 36
5.2.1 Collecting Plant Specimens Plant specimen collection is typically conducted throughout the sampling day as unknown species are encountered. This is particularly important for less common unknown species as they may be difficult to find again if collection is delayed. A plant specimen is a pressed and dried plant sample. An integral part of each plant specimen is written data describing the location and date of collection and other information, which is recorded on the Plant Sample Tag and the Plant Specimen Label that accompany each specimen from pressing through identification (Section 5.2.3). The plant specimens collected in the NWCA are critical data, which are used: 1) to identify unknown plant species encountered in the Veg Plots and 2) for quality assurance (QA) assessment of the overall taxonomic accuracy of the vegetation data (see NWCA-QAPP; USEPA 2011b). Unknown Plant Specimens – Whenever the Botanist/Ecologist does not recognize or is uncertain of the identity of a plant species occurring in a Veg Plot, collect a specimen for later identification in the office or lab. QA Plant Specimens – Randomly select five known species that the Botanist/Ecologist has identified, one from each Veg Plot, to collect for QA verification. • Use a random numbers table or random numbers generator on a calculator to select one
species identified by the botanist from each plot. • Count the first known species listed on Form V-2: Vascular Species Presence and Cover
for a particular Veg Plot as number 1. • Do not count unknown species in the random selection process. • If a species has been selected as a QA specimen, it cannot be selected as a QA specimen
from another Veg Plot in the same AA. Do Not Collect Threatened, Endangered and Sensitive Species (TES) – If TES species are encountered document their presence by photographing them and recording data photo data as described in Appendix D. Collecting Material for Plant Specimens – 1) For each species to be collected, select one or more healthy plants typical of its population
within the Vegetation Plot. Collect enough plant material for species identification and to fill a standard herbarium sheet (29x42cm) when pressed.
2) Whenever possible, material for each specimen should consist of a stem with attached
leaves, flowers, fruits, and, if possible, roots. Flowers and fruit are particularly important as they are generally needed to determine species identity. • If the plant is small enough, collect the entire plant including the roots.
2011 NWCA Field Operations Manual Chapter 5. Vegetation
5 - 37
• If the plant is too large to fit in the plant press, collect 1) sufficient leaves and stems to illustrate leaf shape and size, opposite or alternate branching, and buds, 2) some of the root or rhizome, and 3) the inflorescence (flowering stem). In the case of trees, shrubs, or vines, material should be selected to illustrate the overall characteristics of the plant and the range of variation in flowers, leaves, and other structures.
• For grasses and grass-like plants, try to include roots or rhizomes. If possible, include
mature fruit for Carex (sedge) species, which are important for their identification.
• If the species has separate male plants and female plants (e.g., Salix sp. (willows)) or male and female flowers on the same plant, collect specimens from both sexes whenever possible.
• If the species is immature or senescent, collect a sample that illustrates as many key
diagnostic parts of the plant as possible.
3) Place the fresh plant material collected for each individual species into its own plastic bag (e.g., 1 species/ bag) to contain the specimen until it can be pressed. Using a permanent marker write the Plant Sample ID Number (NWCA site number-collection number) on the outside of the bag. • Gallon zipper-lock bags are appropriately sized for many species. • For species too large to fit into a gallon sized bag, e.g., shrubs, tall grasses or sedges, a
kitchen trash bag may be used to store the specimen.
• Use clear or white plastic bags as collection bags. Dark colored plastic bags will absorb too much heat during the day.
Alternatively, if it is more convenient multiple species can be placed into larger bags. If more than one specimen is included in the same bag, make sure they can be easily distinguished from one another and related to their collection numbers from Form V-2. For example, tag individual species by bundling plant material by the stems with masking tape or a strip of flagging labeled with the collection number from Form V-2.
Storing Plant Specimens During the Sampling Day – 1) Place the smaller plastic bags with one or more plant species into a large heavy-duty, light
colored plastic bag. Double bagging keeps specimens fresher in warm weather and keeps fragile plant parts together by species.
2) Plants will normally and ideally be pressed upon arriving back at the vehicle at the end of
the sample day. If weather or road conditions where the vehicle is parked make pressing at this location infeasible or unsafe, place the bags of collected plant material into an ice chest until the Crew has returned to field lodging, then press the plants immediately.
Ensuring All Unknown and QA Specimens Have Been Gathered – 1) Before leaving the site at the end of the day, double check the Complete if Collecting field of
Form V-2 (See Section 5.1.3.1) to make certain every species indicated for collection (i.e., the U = unknown species or the QA= quality assurance specimen bubble is filled) has been obtained.
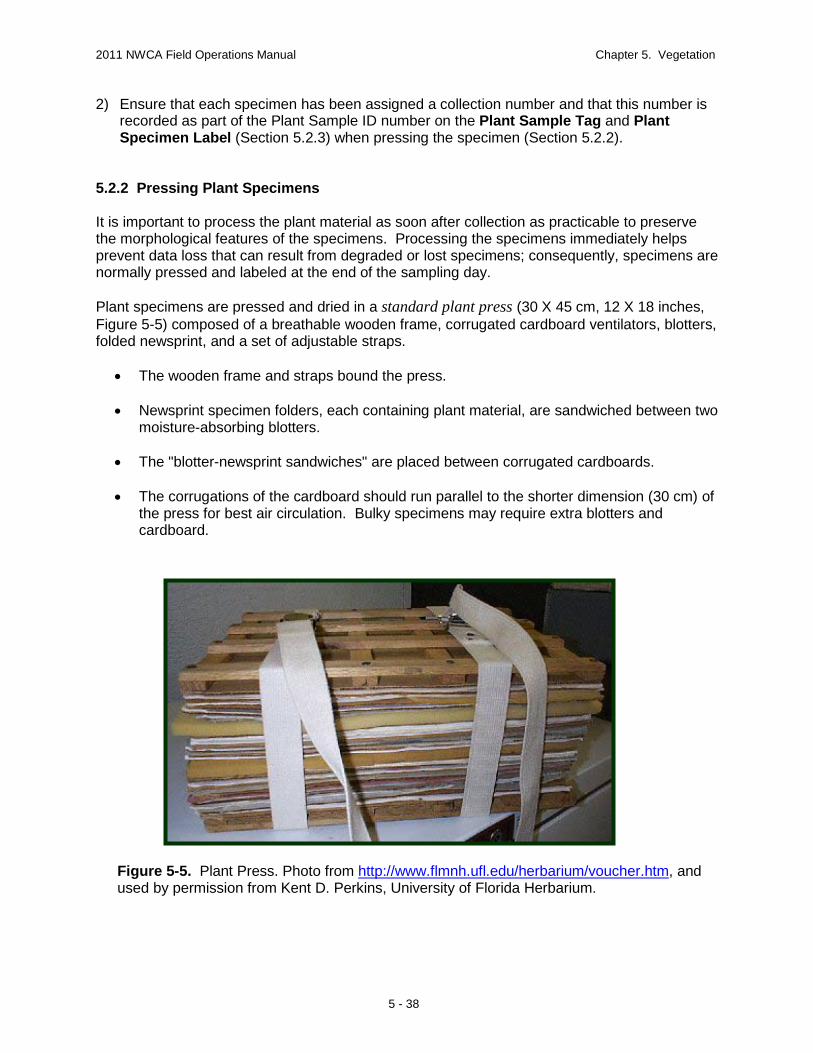
2011 NWCA Field Operations Manual Chapter 5. Vegetation
5 - 38
Figure 5-5. Plant Press. Photo from http://www.flmnh.ufl.edu/herbarium/voucher.htm, and used by permission from Kent D. Perkins, University of Florida Herbarium.
2) Ensure that each specimen has been assigned a collection number and that this number is recorded as part of the Plant Sample ID number on the Plant Sample Tag and Plant Specimen Label (Section 5.2.3) when pressing the specimen (Section 5.2.2).
5.2.2 Pressing Plant Specimens It is important to process the plant material as soon after collection as practicable to preserve the morphological features of the specimens. Processing the specimens immediately helps prevent data loss that can result from degraded or lost specimens; consequently, specimens are normally pressed and labeled at the end of the sampling day. Plant specimens are pressed and dried in a standard plant press (30 X 45 cm, 12 X 18 inches, Figure 5-5) composed of a breathable wooden frame, corrugated cardboard ventilators, blotters, folded newsprint, and a set of adjustable straps.
• The wooden frame and straps bound the press. • Newsprint specimen folders, each containing plant material, are sandwiched between two
moisture-absorbing blotters.
• The "blotter-newsprint sandwiches" are placed between corrugated cardboards.
• The corrugations of the cardboard should run parallel to the shorter dimension (30 cm) of the press for best air circulation. Bulky specimens may require extra blotters and cardboard.
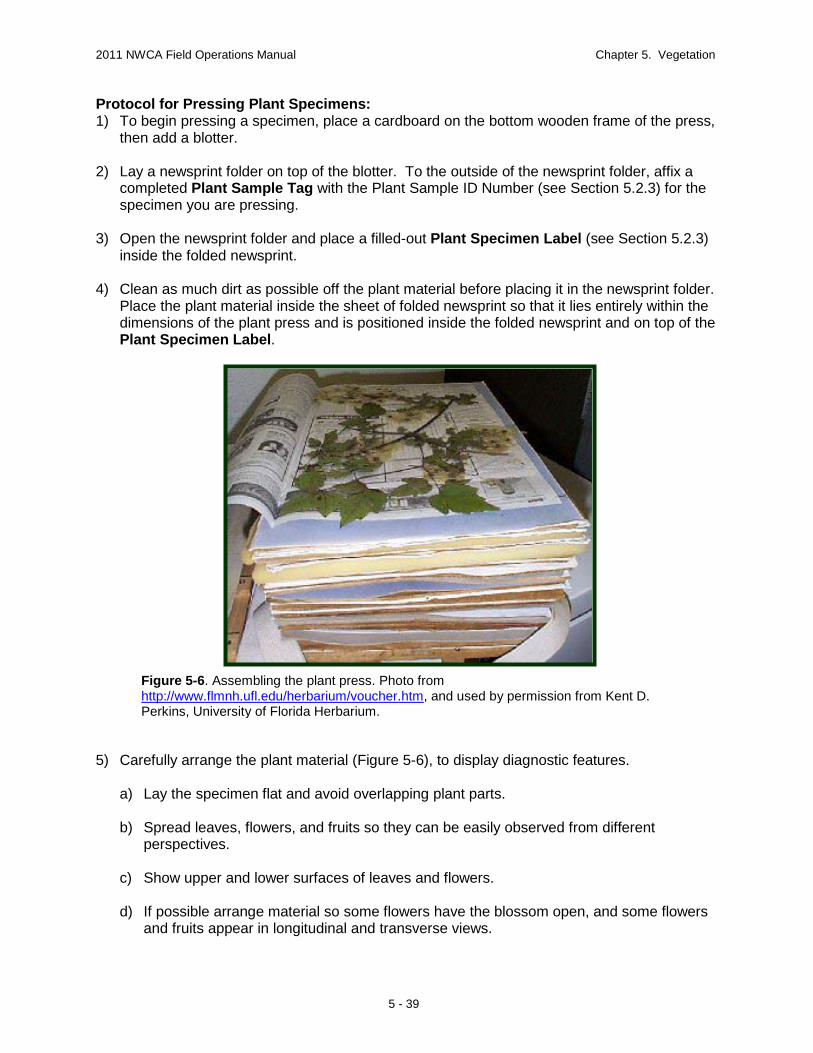
2011 NWCA Field Operations Manual Chapter 5. Vegetation
5 - 39
Figure 5-6. Assembling the plant press. Photo from http://www.flmnh.ufl.edu/herbarium/voucher.htm, and used by permission from Kent D. Perkins, University of Florida Herbarium.
Protocol for Pressing Plant Specimens: 1) To begin pressing a specimen, place a cardboard on the bottom wooden frame of the press,
then add a blotter. 2) Lay a newsprint folder on top of the blotter. To the outside of the newsprint folder, affix a
completed Plant Sample Tag with the Plant Sample ID Number (see Section 5.2.3) for the specimen you are pressing.
3) Open the newsprint folder and place a filled-out Plant Specimen Label (see Section 5.2.3)
inside the folded newsprint. 4) Clean as much dirt as possible off the plant material before placing it in the newsprint folder.
Place the plant material inside the sheet of folded newsprint so that it lies entirely within the dimensions of the plant press and is positioned inside the folded newsprint and on top of the Plant Specimen Label.
5) Carefully arrange the plant material (Figure 5-6), to display diagnostic features.
a) Lay the specimen flat and avoid overlapping plant parts.
b) Spread leaves, flowers, and fruits so they can be easily observed from different perspectives.
c) Show upper and lower surfaces of leaves and flowers.
d) If possible arrange material so some flowers have the blossom open, and some flowers
and fruits appear in longitudinal and transverse views.
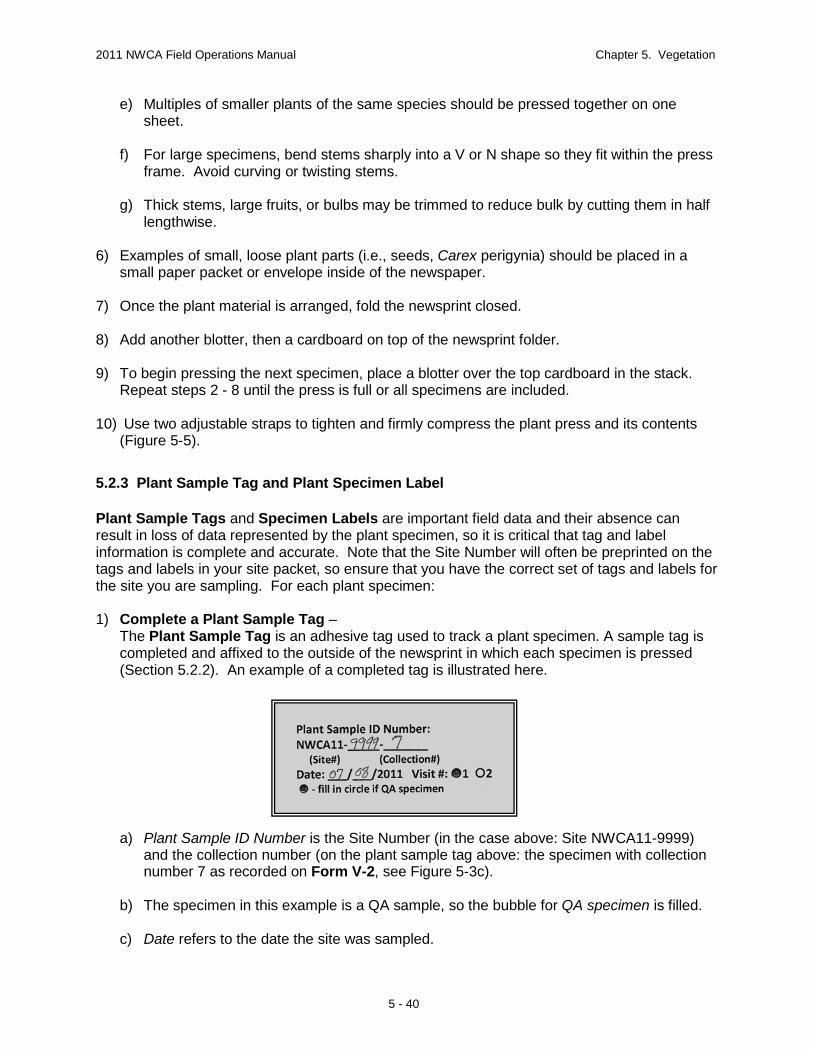
2011 NWCA Field Operations Manual Chapter 5. Vegetation
5 - 40
e) Multiples of smaller plants of the same species should be pressed together on one sheet.
f) For large specimens, bend stems sharply into a V or N shape so they fit within the press
frame. Avoid curving or twisting stems. g) Thick stems, large fruits, or bulbs may be trimmed to reduce bulk by cutting them in half
lengthwise.
6) Examples of small, loose plant parts (i.e., seeds, Carex perigynia) should be placed in a small paper packet or envelope inside of the newspaper.
7) Once the plant material is arranged, fold the newsprint closed. 8) Add another blotter, then a cardboard on top of the newsprint folder. 9) To begin pressing the next specimen, place a blotter over the top cardboard in the stack.
Repeat steps 2 - 8 until the press is full or all specimens are included. 10) Use two adjustable straps to tighten and firmly compress the plant press and its contents
(Figure 5-5).
5.2.3 Plant Sample Tag and Plant Specimen Label
Plant Sample Tags and Specimen Labels are important field data and their absence can result in loss of data represented by the plant specimen, so it is critical that tag and label information is complete and accurate. Note that the Site Number will often be preprinted on the tags and labels in your site packet, so ensure that you have the correct set of tags and labels for the site you are sampling. For each plant specimen: 1) Complete a Plant Sample Tag –
The Plant Sample Tag is an adhesive tag used to track a plant specimen. A sample tag is completed and affixed to the outside of the newsprint in which each specimen is pressed (Section 5.2.2). An example of a completed tag is illustrated here. a) Plant Sample ID Number is the Site Number (in the case above: Site NWCA11-9999)
and the collection number (on the plant sample tag above: the specimen with collection number 7 as recorded on Form V-2, see Figure 5-3c).
b) The specimen in this example is a QA sample, so the bubble for QA specimen is filled. c) Date refers to the date the site was sampled.
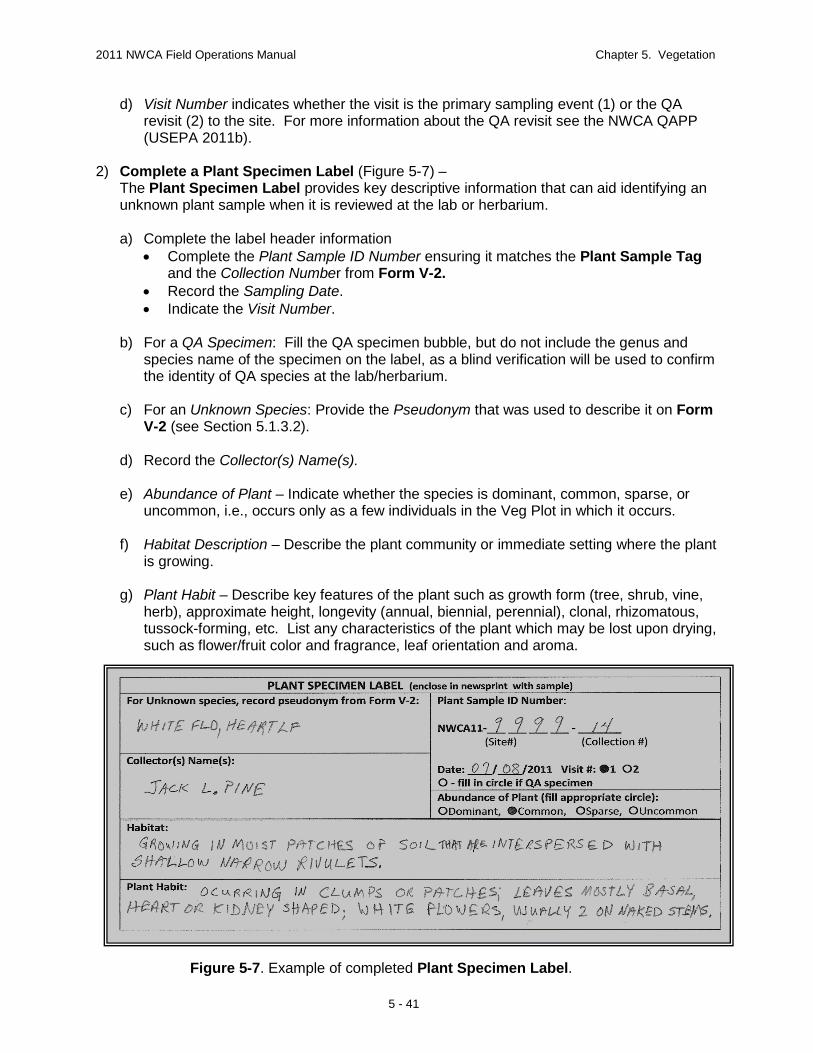
2011 NWCA Field Operations Manual Chapter 5. Vegetation
5 - 41
d) Visit Number indicates whether the visit is the primary sampling event (1) or the QA revisit (2) to the site. For more information about the QA revisit see the NWCA QAPP (USEPA 2011b).
2) Complete a Plant Specimen Label (Figure 5-7) –
The Plant Specimen Label provides key descriptive information that can aid identifying an unknown plant sample when it is reviewed at the lab or herbarium. a) Complete the label header information
• Complete the Plant Sample ID Number ensuring it matches the Plant Sample Tag and the Collection Number from Form V-2.
• Record the Sampling Date. • Indicate the Visit Number.
b) For a QA Specimen: Fill the QA specimen bubble, but do not include the genus and species name of the specimen on the label, as a blind verification will be used to confirm the identity of QA species at the lab/herbarium.
c) For an Unknown Species: Provide the Pseudonym that was used to describe it on Form
V-2 (see Section 5.1.3.2). d) Record the Collector(s) Name(s). e) Abundance of Plant – Indicate whether the species is dominant, common, sparse, or
uncommon, i.e., occurs only as a few individuals in the Veg Plot in which it occurs. f) Habitat Description – Describe the plant community or immediate setting where the plant
is growing.
g) Plant Habit – Describe key features of the plant such as growth form (tree, shrub, vine, herb), approximate height, longevity (annual, biennial, perennial), clonal, rhizomatous, tussock-forming, etc. List any characteristics of the plant which may be lost upon drying, such as flower/fruit color and fragrance, leaf orientation and aroma.
Figure 5-7. Example of completed Plant Specimen Label.
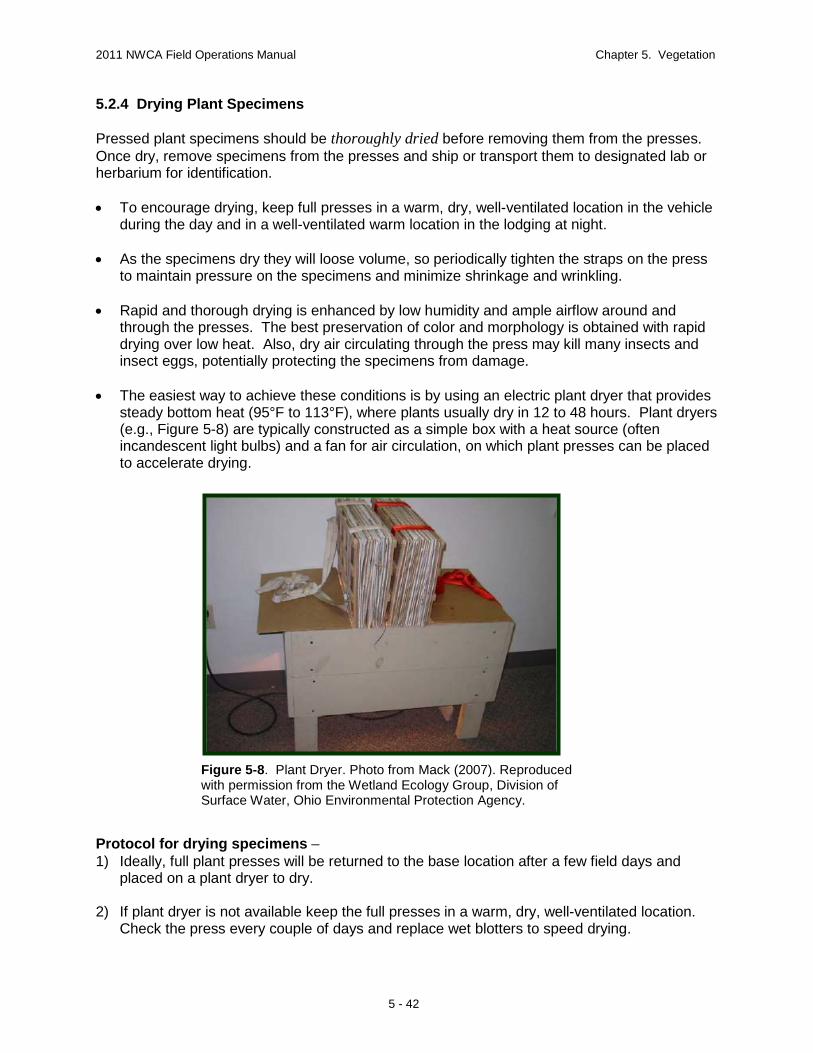
2011 NWCA Field Operations Manual Chapter 5. Vegetation
5 - 42
Figure 5-8. Plant Dryer. Photo from Mack (2007). Reproduced with permission from the Wetland Ecology Group, Division of Surface Water, Ohio Environmental Protection Agency.
5.2.4 Drying Plant Specimens Pressed plant specimens should be thoroughly dried before removing them from the presses. Once dry, remove specimens from the presses and ship or transport them to designated lab or herbarium for identification. • To encourage drying, keep full presses in a warm, dry, well-ventilated location in the vehicle
during the day and in a well-ventilated warm location in the lodging at night. • As the specimens dry they will loose volume, so periodically tighten the straps on the press
to maintain pressure on the specimens and minimize shrinkage and wrinkling. • Rapid and thorough drying is enhanced by low humidity and ample airflow around and
through the presses. The best preservation of color and morphology is obtained with rapid drying over low heat. Also, dry air circulating through the press may kill many insects and insect eggs, potentially protecting the specimens from damage.
• The easiest way to achieve these conditions is by using an electric plant dryer that provides
steady bottom heat (95°F to 113°F), where plants usually dry in 12 to 48 hours. Plant dryers (e.g., Figure 5-8) are typically constructed as a simple box with a heat source (often incandescent light bulbs) and a fan for air circulation, on which plant presses can be placed to accelerate drying.
Protocol for drying specimens – 1) Ideally, full plant presses will be returned to the base location after a few field days and
placed on a plant dryer to dry. 2) If plant dryer is not available keep the full presses in a warm, dry, well-ventilated location.
Check the press every couple of days and replace wet blotters to speed drying.
2011 NWCA Field Operations Manual Chapter 5. Vegetation
5 - 43
3) Periodically, tighten the straps on the press as the specimens dry and shrink to maintain pressure on the press.
4) Once plant specimens are dry, remove them from the presses with individual specimens
kept in their newsprint folders with their Plant Specimen Labels. 5) Organize the plant specimens for transport or shipping to the designated location for
identification or verification (Section 5.2.5, Chapter 2, Appendix A) 5.2.5 Shipping or Transporting Plant Specimens Careful management of the dried plant specimens and specimen tracking information, and prompt shipment or transport of specimens to the herbarium, lab, or office where they will be identified, is critical to data quality and timeliness of data acquisition. Develop a regular weekly schedule for completing these activities (See Chapter 2 and Appendix A). 1) Specimens from several sites may be batched together to ship or transport to the office, lab,
or herbarium for identification. Unknown specimens and QA plant samples may need to be packed in separate boxes as they may be shipped to different destinations (see Figure 5-9).
2) For each batch of unknown specimens shipped or transported, group the specimens by
NWCA Site, ordered by collection number, into herbarium folders labeled with the Site ID(s) written on the outside of the folders. Put only as many specimens into each herbarium folder as will comfortably fit. If needed, use separate folders for each site. If multiple folders are needed for one site, clearly mark this on the outside of the folder by recording: Site ID-folder 1, Site ID-folder 2, etc.
3) For each batch of QA specimens shipped or transported, group the QA specimens by NWCA Site, ordered by collection number, in herbarium folders labeled with the Site ID(s). Use photocopies of the site appropriate Form V-1 to separate the specimens from different sites, placing the V-1 form on top of the set of specimens for a particular site. Form V-1 lists the flora and field guides used in plant identification at the site and this information may be useful to the QA botanists. Make 2 copies of the completed Form V-1 for each site represented for which specimens are present. Include one copy with the QA specimens for the site, send the original to the Information Management Team with the completed site Data Packet, and retain one for your records (see Chapter 2).
4) Fill out a Form T-2: Unknown Plant Sample Tracking and/or a Form T-3: Form QA Plant
Sample Tracking for the specimens being shipped, transported, or stored for later identification. a) Fill out all contact, shipping, and custody information at the top of the form. b) For each row in the body of the form fill in the Site ID, Visit Number, and Collection Date
(Sample Date) for each site from which specimens originate, and then list the collection numbers for the specimens associated with each site.
c) Ensure that all information recorded on these forms corresponds to the information on
the Plant Specimen Tags and Plant Specimen Labels accompanying the specimens.
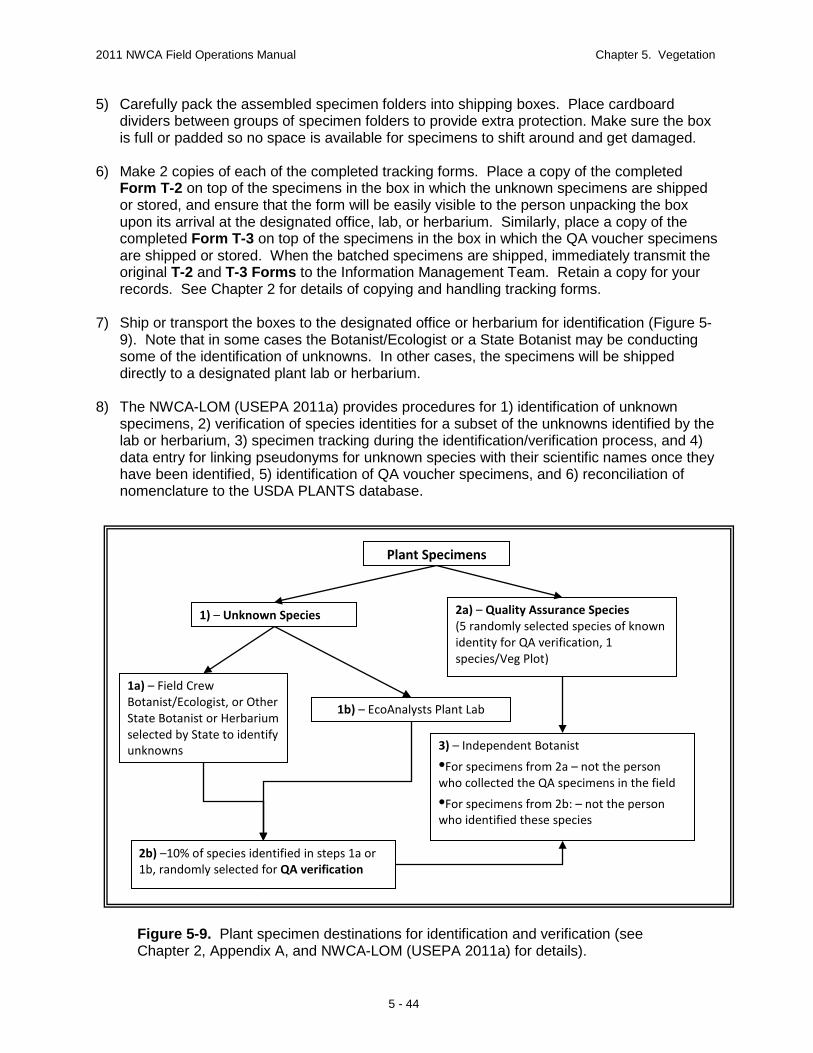
2011 NWCA Field Operations Manual Chapter 5. Vegetation
5 - 44
Figure 5-9. Plant specimen destinations for identification and verification (see Chapter 2, Appendix A, and NWCA-LOM (USEPA 2011a) for details).
Plant Specimens
1) – Unknown Species 2a) – Quality Assurance Species (5 randomly selected species of known identity for QA verification, 1 species/Veg Plot)
1a) – Field Crew Botanist/Ecologist, or Other State Botanist or Herbarium selected by State to identify unknowns
1b) – EcoAnalysts Plant Lab
3) – Independent Botanist
•For specimens from 2a – not the person who collected the QA specimens in the field
•For specimens from 2b: – not the person who identified these species
2b) –10% of species identified in steps 1a or 1b, randomly selected for QA verification
5) Carefully pack the assembled specimen folders into shipping boxes. Place cardboard dividers between groups of specimen folders to provide extra protection. Make sure the box is full or padded so no space is available for specimens to shift around and get damaged.
6) Make 2 copies of each of the completed tracking forms. Place a copy of the completed
Form T-2 on top of the specimens in the box in which the unknown specimens are shipped or stored, and ensure that the form will be easily visible to the person unpacking the box upon its arrival at the designated office, lab, or herbarium. Similarly, place a copy of the completed Form T-3 on top of the specimens in the box in which the QA voucher specimens are shipped or stored. When the batched specimens are shipped, immediately transmit the original T-2 and T-3 Forms to the Information Management Team. Retain a copy for your records. See Chapter 2 for details of copying and handling tracking forms.
7) Ship or transport the boxes to the designated office or herbarium for identification (Figure 5-
9). Note that in some cases the Botanist/Ecologist or a State Botanist may be conducting some of the identification of unknowns. In other cases, the specimens will be shipped directly to a designated plant lab or herbarium.
8) The NWCA-LOM (USEPA 2011a) provides procedures for 1) identification of unknown
specimens, 2) verification of species identities for a subset of the unknowns identified by the lab or herbarium, 3) specimen tracking during the identification/verification process, and 4) data entry for linking pseudonyms for unknown species with their scientific names once they have been identified, 5) identification of QA voucher specimens, and 6) reconciliation of nomenclature to the USDA PLANTS database.
2011 NWCA Field Operations Manual Chapter 5. Vegetation
5 - 45
5.2.6 Data Handling At the end of the sampling day, after you have reviewed the vegetation data forms arrange the completed forms in order and place them in the Data Packet for the AA. See Chapter 2 for protocols on copying and shipping the completed data forms to the Information Management Team and Appendix D for transmitting any photos of plants or vegetation that may have been taken. 5.3 LITERATURE CITED Bourdaghs, M., C.A. Johnston, and R.R. Regal. 2006. Properties and performance of the floristic quality index in Great Lakes coastal wetlands. Wetlands 26:718–735. FGDC (Federal Geographic Data Committee). 2008. National Vegetation Classification Standard, Version 2. FGDC-STD-005-2008. http://www.fgdc.gov/standards/projects/FGDC-standards-projects/vegetation/fgdc-endorse-NVCS-V2. Vegetation Subcommittee, Federal Geographic Data Committee. Jennings, M.D., D. Faber-Langendoen, R.K. Peet, O.L. Loucks, D.C. Glenn-Lewin, A. Damman, M.G. Barbour, R. Pfister, D. Grossman, D.H. Roberts, D. Tart, M. Walker, S.S. Talbot, J. Walker, G.S. Hartshorn, G. Waggoner, M.D. Abrams, A. Hill, and M. Rejmanek. 2008. Description, Documentation, and Evaluation of Associations and Alliances of The U.S. National Vegetation Classification. Version 5.2. (http://esa.org/vegweb/docFiles/ESA_Guidelines_Version_5.2.pdf, http://esa.org/vegweb/docFiles/ESA_Guidelines_Version_5.2_Appendices.pdf). Ecological Society of America Panel on Vegetation Classification. Lee, M.T., R.K. Peet, S.D. Roberts, and T.R. Wentworth. 2008. CVS-EEP Protocol for Recording Vegetation: All Levels of Plot Sampling. Version 2008. The Carolina Vegetation Survey (CVS, http://cvs.bio.unc.edu) and the North Carolina Ecosystem Enhancement Program (EEP, http://www.nceep.net). Lopez, R.D., and M.S. Fennessy. 2002. Testing the floristic quality assessment index as an indicator of wetland condition. Ecological Applications 12:487–497. Mack, J.J. 2007. Integrated Wetland Assessment Program. Part 9: Field Manual for the Vegetation Index of Biotic Integrity for Wetlands ver. 1.4. Ohio EPA Technical Report WET/2004-9. Ohio Environmental Protection Agency, Wetland Ecology Group, Division of Surface Water, Columbus, OH. Mack, J.J. and M.E. Kentula. 2010. Metric similarity in vegetation-based wetland assessment methods. EPA/600/R-10/140. U.S. Environmental Protection Agency, Office of Research and Development, Washington, DC. Magee, T.K., S.E. Gwin, R.G. Gibson, C.C. Holland, J.E. Honea, P.W. Shaffer, J.C. Sifneos, and M.E. Kentula. 1993. Research Plan and Methods Manual for the Oregon Wetlands Study. EPA/600/R-93/072. U.S. Environmental Protection Agency, Environmental Research Laboratory, Corvallis, OR.
2011 NWCA Field Operations Manual Chapter 5. Vegetation
5 - 46
Magee, T.K., P.L. Ringold, and M.A. Bollman. 2008. Alien species importance in native vegetation along wadeable streams, John Day River basin, Oregon, USA. Plant Ecology 195:287–307. Magee, T.K., P.L. Ringold, M.A. Bollman, and T.L. Ernst. 2010. Index of Alien Impact: A method for evaluating ecological impact of alien plant species. Environmental Management 45:75–778. Meinke, R.J. and T.N. Kaye. 2007. Kalmiopsis fragrans (Ericaceae), a new distylous species from the southern Cascade Mountains of Oregon. Journal of Botanical Research Institute of Texas 1:9-19. Peet, R.K., T.R. Wentworth, and P.S. White. 1998. A flexible, multipurpose method for recording vegetation composition and structure. Castena 63:262–274. Pino, J., X. Font, J. Carbó, M. Jové, and L. Pallarès. 2005. Large-scale correlates of alien plant invasion in Catalonia (NE of Spain). Biological Conservation 122:339–350. Quétier, F., S. Lavorel, W. Thuiller, and I. Davies. 2007. Plant-trait-based modeling assessment of ecosystem-service sensitivity to land-use change. Ecological Applications 17:2377–2386. Rocchio, J. 2007. Assessing ecological condition of headwater wetlands in the Southern Rocky Mountains using a vegetation index of biotic integrity (Version 1.0). Colorado State University, Colorado Natural Heritage Program, Fort Collins, Colorado. University of Florida Herbarium. 2009. Preparation of Plant Specimens for Deposit as Herbarium Vouchers. http://www.flmnh.ufl.edu/herbarium/voucher.htm, (http://www.flmnh.ufl.edu/herbarium/gifs/plantpress1.jpg, http://www.flmnh.ufl.edu/herbarium/gifs/PressedPlant1.jpg, Accessed June 12, 2009. USDA, NRCS (U.S. Department of Agriculture, Natural Resources Conservation Service). 2010. The PLANTS Database (http://plants.usda.gov, 27 December 2010). National Plant Data Center, Baton Rouge, LA 70874-4490 USA. USEPA (U.S. Environmental Protection Agency). 2002. Methods for Evaluating Wetland Condition: #10 Using Vegetation to Assess Environmental Conditions in Wetlands. EPA-822-R-02-020, Office of Water, U.S. Environmental Protection Agency, Washington, DC. USEPA (U.S. Environmental Protection Agency). 2011a. National Wetland Condition Assessment: Laboratory Operations Manual. EPA/843/R10/002. U.S. Environmental Protection Agency, Washington, DC. USEPA (U.S. Environmental Protection Agency). 2011b. National Wetland Condition Assessment: Quality Assurance Project Plan. EPA/843/R10/003. U.S. Environmental Protection Agency, Washington, DC. USEPA (U.S. Environmental Protection Agency). 2011c. National Wetland Condition Assesssment: Site Evaluation Guidelines EPA/843/R10/004. U.S. Environmental Protection Agency, Washington, D.C.

2011 NWCA Field Operations Manual Chapter 5. Vegetation
5 - 47
USEPA (U.S. Environmental Protection Agency). In Preparation. Ecological Indicators for the 2011 National Wetland Condition Assessment. EPA-XXX-YY-0000. U.S. Environmental Protection Agency, Washington, DC. USEPA (U.S. Environmental Protection Agency). In Review. National Wetland Condition Assessment: USA-RAM Field Operations Manual. EPA/XXX/R-XX/XXX. U.S. Environmental Protection Agency, Washington, DC.
WIPP (Wisconsin Invasive Plants Project). 2008. http://www.ipaw.org/mapping/voucherhandout.pdf. Accessed December 2008.

2011 NWCA Field Operations Manual Chapter 5. Vegetation
5 - 48
2011 NWCA Field Operations Manual Chapter 5. Vegetation
5 - 49
5.4 VEGETATION PROTOCOL CHECKLISTS AND REFERENCE CARDS Brief summaries of the major tasks to be completed for the Vegetation Sampling Protocols are provided in this section. Vegetation Protocol Checklist The Vegetation Protocol Task Checklist is for use during field sampling to aid in directing the order of work, to ensure all data and specimens have been collected, and all tasks are completed. Reference Cards Summarizing Vegetation Protocols These paired figures are intended to be printed, and laminated if desired, on the front (side A) and back (side B) of durable card stock, so that they can be carried for easy reference when conducting field work. Reference Card V-1: Flowchart of Vegetation Protocol Tasks Reference Card V-2, Side A and Side B: Key for Veg Plot Placement and Examples of Plot Layout Configurations Reference Card V-3, Side A: Vegetation Plot Establishment Reference Card V-3, Side B: Veg Plot Configuration and Data Collection Summary Reference Card V-4, Side A: Cover Estimation Procedures Reference Card V-4, Side B: Assigning Pseudonyms for Unknown Plant Species

2011 NWCA Field Operations Manual Chapter 5. Vegetation
5 - 50
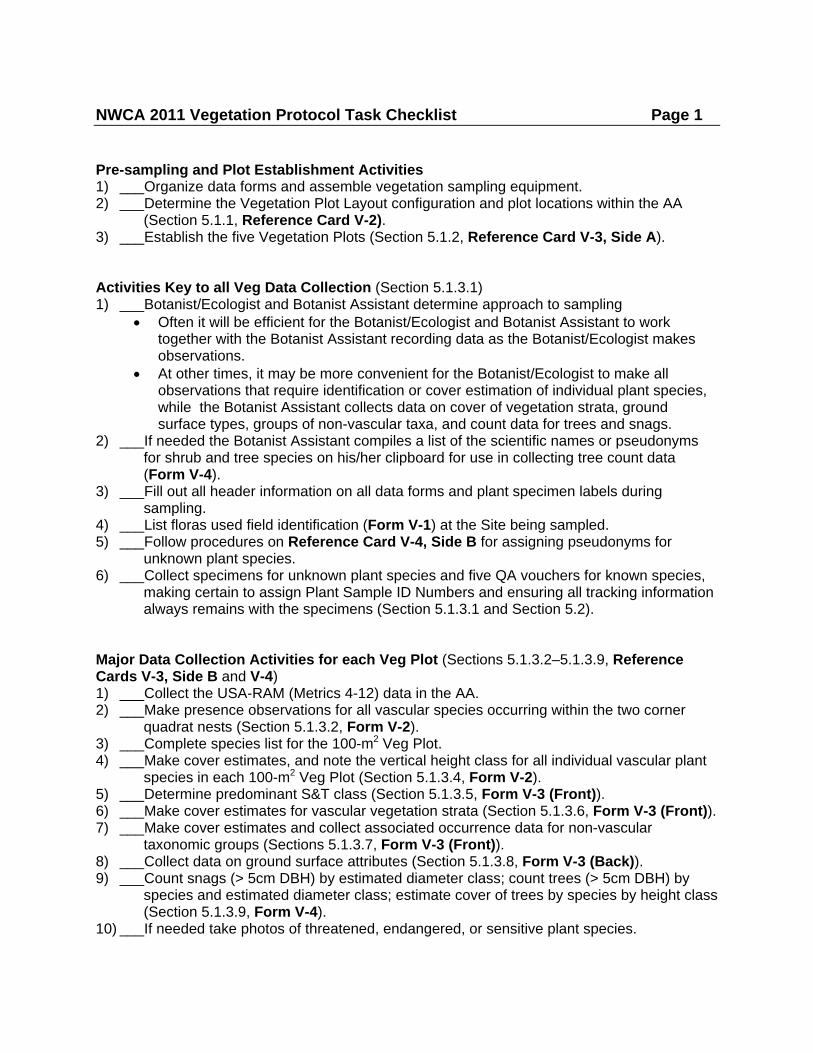
NWCA 2011 Vegetation Protocol Task Checklist Page 1 Pre-sampling and Plot Establishment Activities 1) ___Organize data forms and assemble vegetation sampling equipment. 2) ___Determine the Vegetation Plot Layout configuration and plot locations within the AA
(Section 5.1.1, Reference Card V-2). 3) ___Establish the five Vegetation Plots (Section 5.1.2, Reference Card V-3, Side A). Activities Key to all Veg Data Collection (Section 5.1.3.1) 1) ___Botanist/Ecologist and Botanist Assistant determine approach to sampling
Often it will be efficient for the Botanist/Ecologist and Botanist Assistant to work together with the Botanist Assistant recording data as the Botanist/Ecologist makes observations.
At other times, it may be more convenient for the Botanist/Ecologist to make all observations that require identification or cover estimation of individual plant species, while the Botanist Assistant collects data on cover of vegetation strata, ground surface types, groups of non-vascular taxa, and count data for trees and snags.
2) ___If needed the Botanist Assistant compiles a list of the scientific names or pseudonyms for shrub and tree species on his/her clipboard for use in collecting tree count data (Form V-4).
3) ___Fill out all header information on all data forms and plant specimen labels during sampling.
4) ___List floras used field identification (Form V-1) at the Site being sampled. 5) ___Follow procedures on Reference Card V-4, Side B for assigning pseudonyms for
unknown plant species. 6) ___Collect specimens for unknown plant species and five QA vouchers for known species,
making certain to assign Plant Sample ID Numbers and ensuring all tracking information always remains with the specimens (Section 5.1.3.1 and Section 5.2).
Major Data Collection Activities for each Veg Plot (Sections 5.1.3.2–5.1.3.9, Reference Cards V-3, Side B and V-4) 1) ___Collect the USA-RAM (Metrics 4-12) data in the AA. 2) ___Make presence observations for all vascular species occurring within the two corner
quadrat nests (Section 5.1.3.2, Form V-2). 3) ___Complete species list for the 100-m2 Veg Plot. 4) ___Make cover estimates, and note the vertical height class for all individual vascular plant
species in each 100-m2 Veg Plot (Section 5.1.3.4, Form V-2). 5) ___Determine predominant S&T class (Section 5.1.3.5, Form V-3 (Front)). 6) ___Make cover estimates for vascular vegetation strata (Section 5.1.3.6, Form V-3 (Front)). 7) ___Make cover estimates and collect associated occurrence data for non-vascular
taxonomic groups (Sections 5.1.3.7, Form V-3 (Front)). 8) ___Collect data on ground surface attributes (Section 5.1.3.8, Form V-3 (Back)). 9) ___Count snags (> 5cm DBH) by estimated diameter class; count trees (> 5cm DBH) by
species and estimated diameter class; estimate cover of trees by species by height class (Section 5.1.3.9, Form V-4).
10) ___If needed take photos of threatened, endangered, or sensitive plant species.
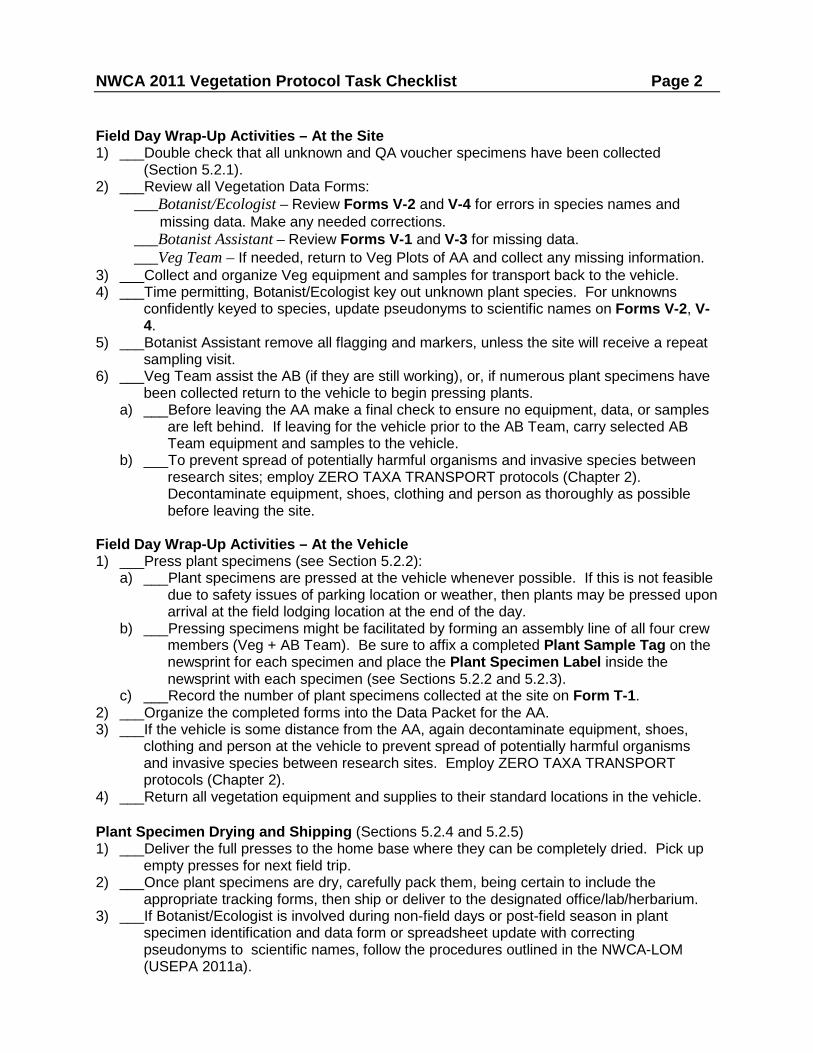
NWCA 2011 Vegetation Protocol Task Checklist Page 2 Field Day Wrap-Up Activities – At the Site 1) ___Double check that all unknown and QA voucher specimens have been collected
(Section 5.2.1). 2) ___Review all Vegetation Data Forms:
___Botanist/Ecologist – Review Forms V-2 and V-4 for errors in species names and missing data. Make any needed corrections.
___Botanist Assistant – Review Forms V-1 and V-3 for missing data. ___Veg Team – If needed, return to Veg Plots of AA and collect any missing information.
3) ___Collect and organize Veg equipment and samples for transport back to the vehicle. 4) ___Time permitting, Botanist/Ecologist key out unknown plant species. For unknowns
confidently keyed to species, update pseudonyms to scientific names on Forms V-2, V-4.
5) ___Botanist Assistant remove all flagging and markers, unless the site will receive a repeat sampling visit.
6) ___Veg Team assist the AB (if they are still working), or, if numerous plant specimens have been collected return to the vehicle to begin pressing plants.
a) ___Before leaving the AA make a final check to ensure no equipment, data, or samples are left behind. If leaving for the vehicle prior to the AB Team, carry selected AB Team equipment and samples to the vehicle.
b) ___To prevent spread of potentially harmful organisms and invasive species between research sites; employ ZERO TAXA TRANSPORT protocols (Chapter 2). Decontaminate equipment, shoes, clothing and person as thoroughly as possible before leaving the site.
Field Day Wrap-Up Activities – At the Vehicle 1) ___Press plant specimens (see Section 5.2.2):
a) ___Plant specimens are pressed at the vehicle whenever possible. If this is not feasible due to safety issues of parking location or weather, then plants may be pressed upon arrival at the field lodging location at the end of the day.
b) ___Pressing specimens might be facilitated by forming an assembly line of all four crew members (Veg + AB Team). Be sure to affix a completed Plant Sample Tag on the newsprint for each specimen and place the Plant Specimen Label inside the newsprint with each specimen (see Sections 5.2.2 and 5.2.3).
c) ___Record the number of plant specimens collected at the site on Form T-1. 2) ___Organize the completed forms into the Data Packet for the AA. 3) ___If the vehicle is some distance from the AA, again decontaminate equipment, shoes,
clothing and person at the vehicle to prevent spread of potentially harmful organisms and invasive species between research sites. Employ ZERO TAXA TRANSPORT protocols (Chapter 2).
4) ___Return all vegetation equipment and supplies to their standard locations in the vehicle. Plant Specimen Drying and Shipping (Sections 5.2.4 and 5.2.5) 1) ___Deliver the full presses to the home base where they can be completely dried. Pick up
empty presses for next field trip. 2) ___Once plant specimens are dry, carefully pack them, being certain to include the
appropriate tracking forms, then ship or deliver to the designated office/lab/herbarium. 3) ___If Botanist/Ecologist is involved during non-field days or post-field season in plant
specimen identification and data form or spreadsheet update with correcting pseudonyms to scientific names, follow the procedures outlined in the NWCA-LOM (USEPA 2011a).
Reference Card V-1. Flowchart of Vegetation Protocol Tasks
Refer to 2011 NWCA‐Field Operations Manual – Chapter 5 for detail on protocols summarized on this card.
Plant Specimen Collection, Processing, and Shipping
Collect specimens for all unknown plant species.
Randomly select and collect five known plant species for each AA for Quality Assurance check.
Complete Plant Sample Tag and Plant Specimen Label for each plant sample; then press specimen. Record number of plant samples collected at the site on Form T‐1: Site and Sample Status/WRS Tracking. Dry specimens; then ship or deliver to designated herbarium or laboratory, enclosing the appropriate plant specimen tracking information (Form T‐2 or T‐3) in the shipping box.
Collecting Vegetation Data in the AA
Establish five 100‐m2 (10X10m) Veg Plots at the locations designated for the selected Veg Plot Layout (Reference Cards V‐2 and V‐3, Side A; Form V‐1). Once all five Veg Plots are established, collect the following data for each
Select Veg Plot Layout configuration appropriate for the AA (Reference Card V‐2).
Veg Plot.
1. Plant species presence in nested 1‐m2 and 10‐m2 quadrats in the SW and NE corners of the 100‐m2 Veg Plot, and across the 100‐m2 Veg Plot (Reference Card V‐3
3. Predominant Status &Trends Wetland Class for the 100‐m2 Veg Plot (Form V‐3 (Front)).
, Side B; Forms V‐2a, b). 2. Percent cover estimates for all individual vascular plant species across the entire 100‐m2 Veg Plot and identification of the primary height class in which each species occurs (Reference Cards V‐3, Side B and V‐4; Forms V‐2a, b).
5. Percent cover estimates across the 100‐m2 Veg Plot for non‐vascular groups (ground bryophytes, ground lichens, arboreal bryophytes and lichens, filamentous or mat forming algae, and macroalgae) (Form V‐3 (Front)).
4. Percent cover estimates across the 100‐m2 Veg Plot for Vascular Vegetation Strata: a) submerged aquatic vegetation, b) floating aquatic vegetation, c), lianas, vines and epiphytes, d) all other vascular vegetation by height class (Form V‐3 (Front)).
6. Data describing ground surface attributes across the 100‐m2 Veg Plot (Form V‐3 (Back)).
7. Across the 100‐m2 Veg Plot (Forms V‐4a, b): Percent cover estimates of live tree species by height class. Counts of live trees by species and diameter class. Counts of standing dead trees and snags by diameter class.

Reference Card V-2, Side A. Key for Veg Plot Placement and Examples of Plot Layout Configurations.Examples of Additional Layout Configurations on Side B. Note scales vary among example diagrams.
Plate 1. Standard Veg Plot Layout – Circular AA (½ hectare)
4
40m
N
3
2
1
515m
15 m
20m
10m
Place Veg Plots at specified locations on plot placement lines oriented through the AA CENTER on cardinal directions. Veg Plot 1 is placed 2m from the CENTER.
Key for Selecting Veg Plot Layout Configuration within the Assessment Area (AA)
1a AA type, any; no obstacles to Veg Plot placement………………………………………………………..……………………....……………………...2
2a AA is ½‐ha circle…………………..……………………………………………………………Standard Veg Plot Layout – Circular AA (Plate 1)2b AA is not a circle or is < ½ ha………..…………….……………………………………………….Alternate Veg Plot Layouts go to ..……....33a AA is a ½ ha polygon ……………...…….………………………………………..…………………..………………………………………..……….……....4
4a AA has width and length > 30m………………….………………………….…..…Wide Polygon AA Veg Plot Layout (Plate 2)4b AA is ≤ 30m wide ……………………………………..…………..……...........…..Narrow Polygon AA Veg Plot Layout (Plate 3)
3b AA < ½ ha, but > 0.1ha; a polygon equaling wetland boundary........Wetland Boundary AA Veg Plot Layout (Plate 4)
1b AA type, any; obstacles (deep water; wide, deep channels; cliffs, other physical barriers, etc.) to Veg Plot placement……………………………………………………………………….……………………………..….…………...………Obstacle Veg Plot Layout (Plate 5)
Refer to 2011 NWCA‐Field Operations Manual (Chapter 5. Vegetation, Section 5.1.1 – Placement of the Vegetation Plots) for more detail on protocols summarized on this card.
Plate 2. Wide Polygon AA Veg Plot Layout – AA = ½ hectare polygon, width and length > 30m.
Place Veg Plots along plot placement lines originating from CENTER and defined by long and short axes of AA.
Example A – Wide Polygon AAs with width > 40 m: Place Veg Plots in a configuration matching the Standard Veg Plot Layout as closely as possible, while distributing Veg Plots relatively evenly along plot placement lines.
Example B – Wide Polygon AAs with width 30 to 40 m: Place 1 Veg Plot mid-way between the CENTER and AA boundary along only one placement line of the short axis, and 4 Veg Plots at uniform distances along long axis.
61m
82m
2
4
3
1
5
40m
125m
1
3
2
4
5
Example A
Example B
Veg Plot
AA Center
AA boundaries
Plot placement line
Shallow waterDeep water (not sampleable)
Patterns = Community types
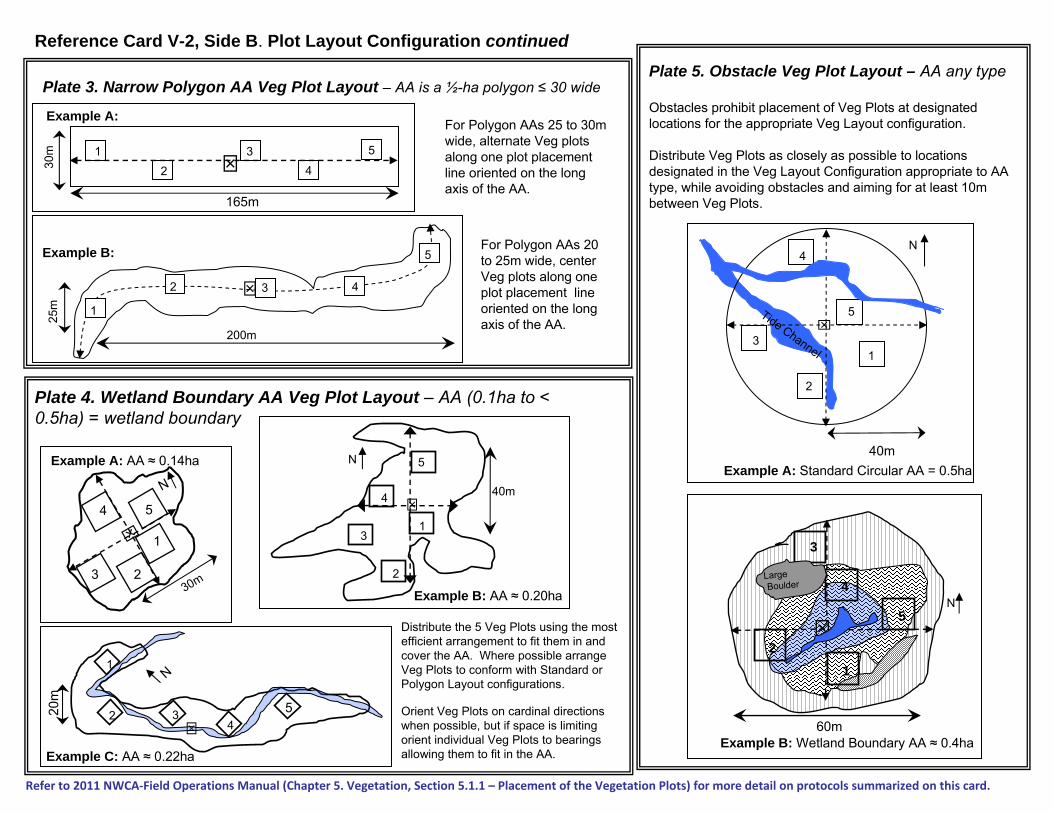
Reference Card V-2, Side B. Plot Layout Configuration continued
Plate 3. Narrow Polygon AA Veg Plot Layout – AA is a ½-ha polygon ≤ 30 wide
Plate 4. Wetland Boundary AA Veg Plot Layout – AA (0.1ha to < 0.5ha) = wetland boundary
Example A: AA ≈ 0.14ha
30m
N
1
4
23
5
Example C: AA ≈ 0.22ha
20m
N1
2 34
5
Example B: Wetland Boundary AA ≈ 0.4ha
N
60m
3
2
5
4
1
LargeBoulder
Plate 5. Obstacle Veg Plot Layout – AA any type
Obstacles prohibit placement of Veg Plots at designated locations for the appropriate Veg Layout configuration.
Distribute Veg Plots as closely as possible to locations designated in the Veg Layout Configuration appropriate to AA type, while avoiding obstacles and aiming for at least 10m between Veg Plots.
4
40m
3
2
Example A: Standard Circular AA = 0.5ha
N
Tide Channel 1
5
Example B: AA ≈ 0.20ha
40m
N
1
5
4
3
2
Distribute the 5 Veg Plots using the most efficient arrangement to fit them in and cover the AA. Where possible arrange Veg Plots to conform with Standard or Polygon Layout configurations.
Orient Veg Plots on cardinal directions when possible, but if space is limiting orient individual Veg Plots to bearings allowing them to fit in the AA.
165m
30m 1
2 43 5
Example A:
200m
25m
2
5
43
1
Example B:
For Polygon AAs 25 to 30m wide, alternate Veg plots along one plot placement line oriented on the long axis of the AA.
For Polygon AAs 20 to 25m wide, center Veg plots along one plot placement line oriented on the long axis of the AA.
Refer to 2011 NWCA‐Field Operations Manual (Chapter 5. Vegetation, Section 5.1.1 – Placement of the Vegetation Plots) for more detail on protocols summarized on this card.
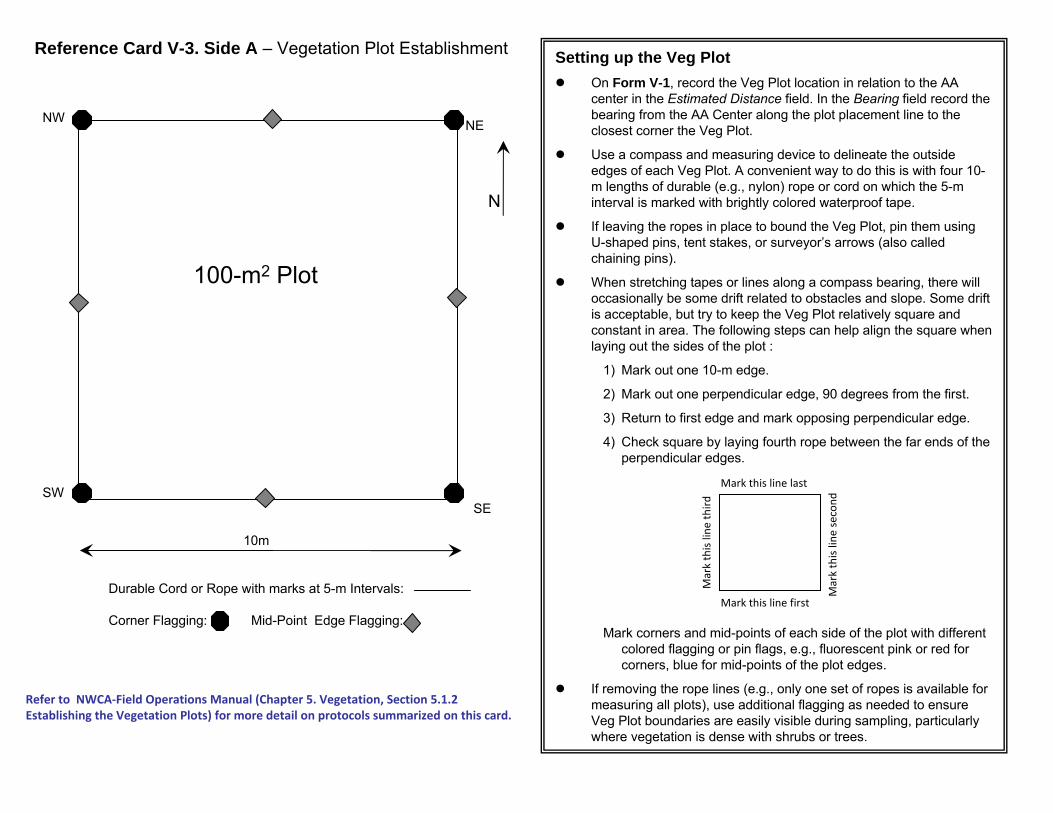
Reference Card V-3. Side A – Vegetation Plot Establishment
Durable Cord or Rope with marks at 5-m Intervals:
Corner Flagging: Mid-Point Edge Flagging:
N
SW
NW NE
SE
10m
100-m2 Plot
Refer to NWCA‐Field Operations Manual (Chapter 5. Vegetation, Section 5.1.2 Establishing the Vegetation Plots) for more detail on protocols summarized on this card.
Setting up the Veg Plot
On Form V-1, record the Veg Plot location in relation to the AA center in the Estimated Distance field. In the Bearing field record the bearing from the AA Center along the plot placement line to the closest corner the Veg Plot.
Use a compass and measuring device to delineate the outside edges of each Veg Plot. A convenient way to do this is with four 10- m lengths of durable (e.g., nylon) rope or cord on which the 5-m interval is marked with brightly colored waterproof tape.
If leaving the ropes in place to bound the Veg Plot, pin them using U-shaped pins, tent stakes, or surveyor’s arrows (also called chaining pins).
When stretching tapes or lines along a compass bearing, there will occasionally be some drift related to obstacles and slope. Some drift is acceptable, but try to keep the Veg Plot relatively square and constant in area. The following steps can help align the square when laying out the sides of the plot :
1 ) Mark out one 10-m edge.
2 ) Mark out one perpendicular edge, 90 degrees from the first.
3 ) Return to first edge and mark opposing perpendicular edge.
4 ) Check square by laying fourth rope between the far ends of the perpendicular edges.
Mark corners and mid-points of each side of the plot with different colored flagging or pin flags, e.g., fluorescent pink or red for corners, blue for mid-points of the plot edges.
If removing the rope lines (e.g., only one set of ropes is available for measuring all plots), use additional flagging as needed to ensure Veg Plot boundaries are easily visible during sampling, particularly where vegetation is dense with shrubs or trees.
Mark this line last
Mark this line first
Mark this line th
ird
Mark this line second
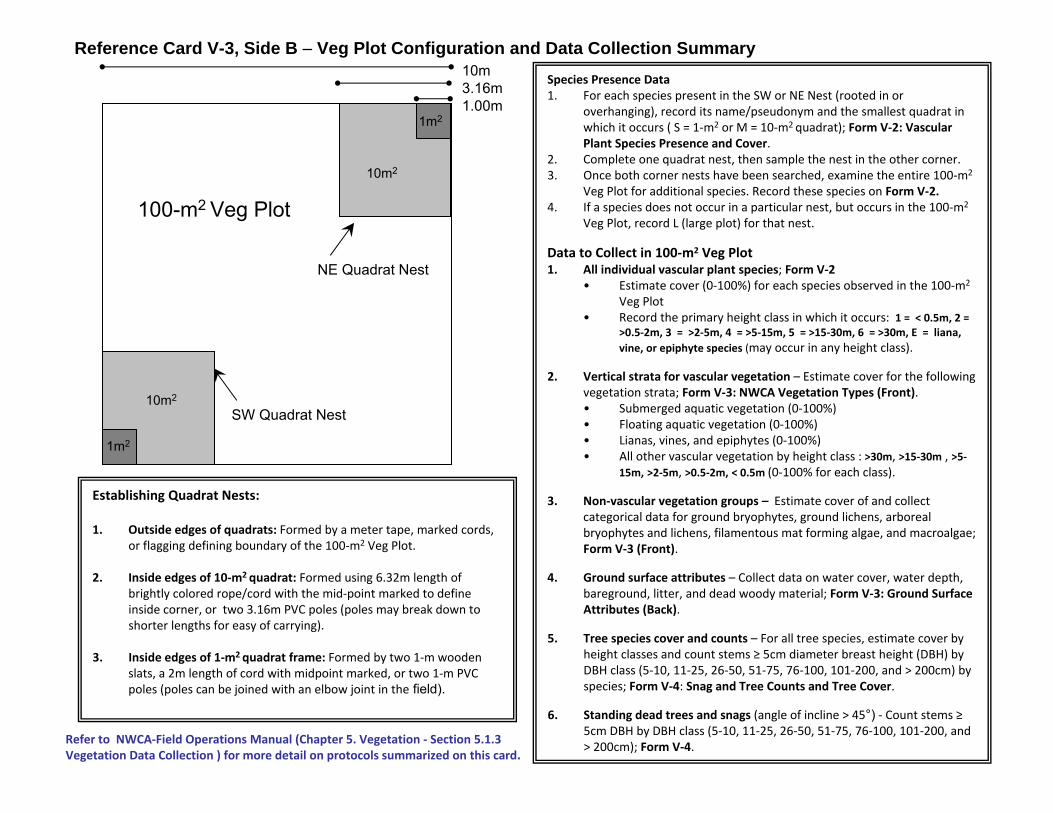
Reference Card V-3, Side B – Veg Plot Configuration and Data Collection Summary
Establishing Quadrat Nests:
1. Outside edges of quadrats: Formed by a meter tape, marked cords, or flagging defining boundary of the 100‐m2 Veg Plot.
2. Inside edges of 10‐m2 quadrat: Formed using 6.32m length of brightly colored rope/cord with the mid‐point marked to define inside corner, or two 3.16m PVC poles (poles may break down to shorter lengths for easy of carrying).
3. Inside edges of 1‐m2 quadrat frame: Formed by two 1‐m wooden slats, a 2m length of cord with midpoint marked, or two 1‐m PVC poles (poles can be joined with an elbow joint in the field).
10m3.16m1.00m
100-m2 Veg Plot
NE Quadrat Nest
SW Quadrat Nest
10m2
1m2
10m2
10m2
1m2
Refer to NWCA‐Field Operations Manual (Chapter 5. Vegetation ‐ Section 5.1.3 Vegetation Data Collection ) for more detail on protocols summarized on this card.
Species Presence Data1. For each species present in the SW or NE Nest (rooted in or
overhanging), record its name/pseudonym and the smallest quadrat in which it occurs ( S = 1‐m2 or M = 10‐m2 quadrat); Form V‐2: Vascular Plant Species Presence and Cover.
2. Complete one quadrat nest, then sample the nest in the other corner.3. Once both corner nests have been searched, examine the entire 100‐m2
Veg Plot for additional species. Record these species on Form V‐2.4. If a species does not occur in a particular nest, but occurs in the 100‐m2
Veg Plot, record L (large plot) for that nest.
Data to Collect in 100‐m2 Veg Plot1. All individual vascular plant species; Form V‐2
• Estimate cover (0‐100%) for each species observed in the 100‐m2
Veg Plot• Record the primary height class in which it occurs: 1 = < 0.5m, 2 =
>0.5‐2m, 3 = >2‐5m, 4 = >5‐15m, 5 = >15‐30m, 6 = >30m, E = liana, vine, or epiphyte species (may occur in any height class).
2. Vertical strata for vascular vegetation – Estimate cover for the following vegetation strata; Form V‐3: NWCA Vegetation Types (Front).• Submerged aquatic vegetation (0‐100%)• Floating aquatic vegetation (0‐100%)• Lianas, vines, and epiphytes (0‐100%)• All other vascular vegetation by height class : >30m, >15‐30m , >5‐
15m, >2‐5m, >0.5‐2m, < 0.5m (0‐100% for each class).
3. Non‐vascular vegetation groups – Estimate cover of and collect categorical data for ground bryophytes, ground lichens, arboreal bryophytes and lichens, filamentous mat forming algae, and macroalgae; Form V‐3 (Front).
4. Ground surface attributes – Collect data on water cover, water depth, bareground, litter, and dead woody material; Form V‐3: Ground Surface Attributes (Back).
5. Tree species cover and counts – For all tree species, estimate cover by height classes and count stems ≥ 5cm diameter breast height (DBH) by DBH class (5‐10, 11‐25, 26‐50, 51‐75, 76‐100, 101‐200, and > 200cm) by species; Form V‐4: Snag and Tree Counts and Tree Cover.
6. Standing dead trees and snags (angle of incline > 45°) ‐ Count stems ≥ 5cm DBH by DBH class (5‐10, 11‐25, 26‐50, 51‐75, 76‐100, 101‐200, and > 200cm); Form V‐4.
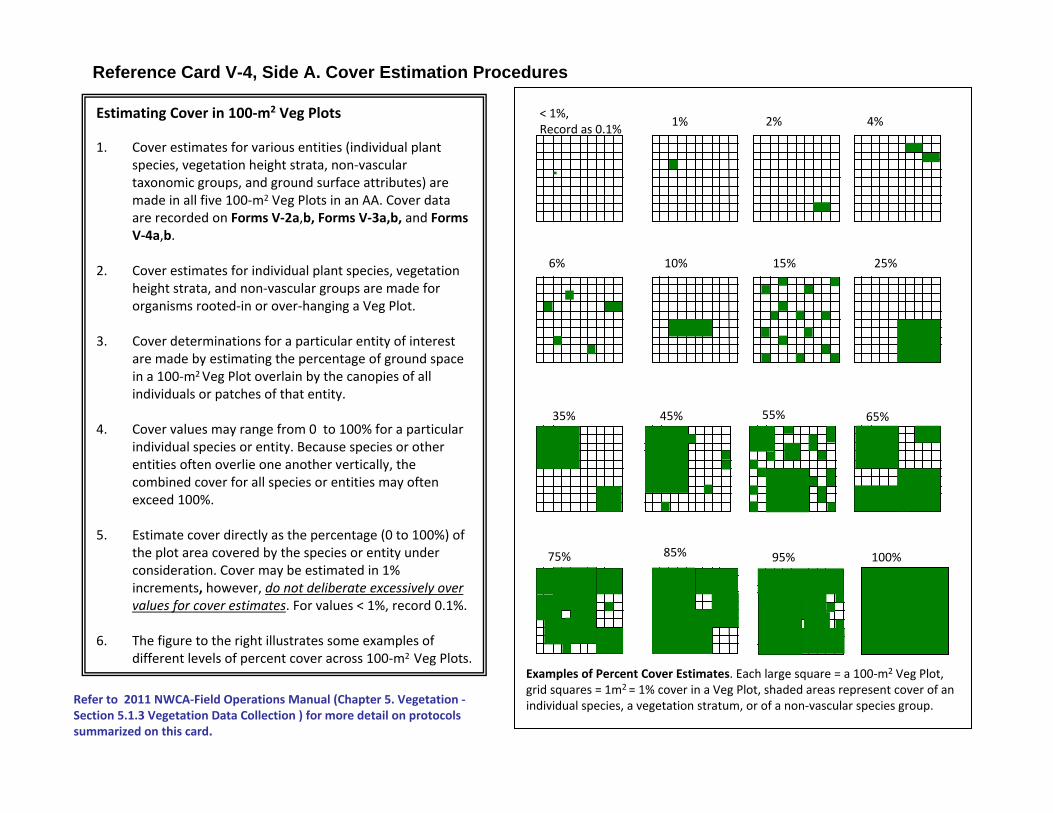
Estimating Cover in 100‐m2 Veg Plots
1. Cover estimates for various entities (individual plant species, vegetation height strata, non‐vascular taxonomic groups, and ground surface attributes) are made in all five 100‐m2 Veg Plots in an AA. Cover data are recorded on Forms V‐2a,b, Forms V‐3a,b, and Forms V‐4a,b.
2. Cover estimates for individual plant species, vegetation height strata, and non‐vascular groups are made for organisms rooted‐in or over‐hanging a Veg Plot.
3. Cover determinations for a particular entity of interest are made by estimating the percentage of ground space in a 100‐m2 Veg Plot overlain by the canopies of all individuals or patches of that entity.
4. Cover values may range from 0 to 100% for a particular individual species or entity. Because species or other entities often overlie one another vertically, the combined cover for all species or entities may often exceed 100%.
5. Estimate cover directly as the percentage (0 to 100%) of the plot area covered by the species or entity under consideration. Cover may be estimated in 1% increments, however, do not deliberate excessively over values for cover estimates. For values < 1%, record 0.1%.
6. The figure to the right illustrates some examples of different levels of percent cover across 100‐m2 Veg Plots.
55%
95%
1%
25%15%
< 1%, Record as 0.1%
4%
35%
6% 10%
45%
2%
75% 100%
65%
85%
Examples of Percent Cover Estimates. Each large square = a 100‐m2 Veg Plot, grid squares = 1m2 = 1% cover in a Veg Plot, shaded areas represent cover of an individual species, a vegetation stratum, or of a non‐vascular species group.
Reference Card V-4, Side A. Cover Estimation Procedures
Refer to 2011 NWCA‐Field Operations Manual (Chapter 5. Vegetation ‐ Section 5.1.3 Vegetation Data Collection ) for more detail on protocols summarized on this card.
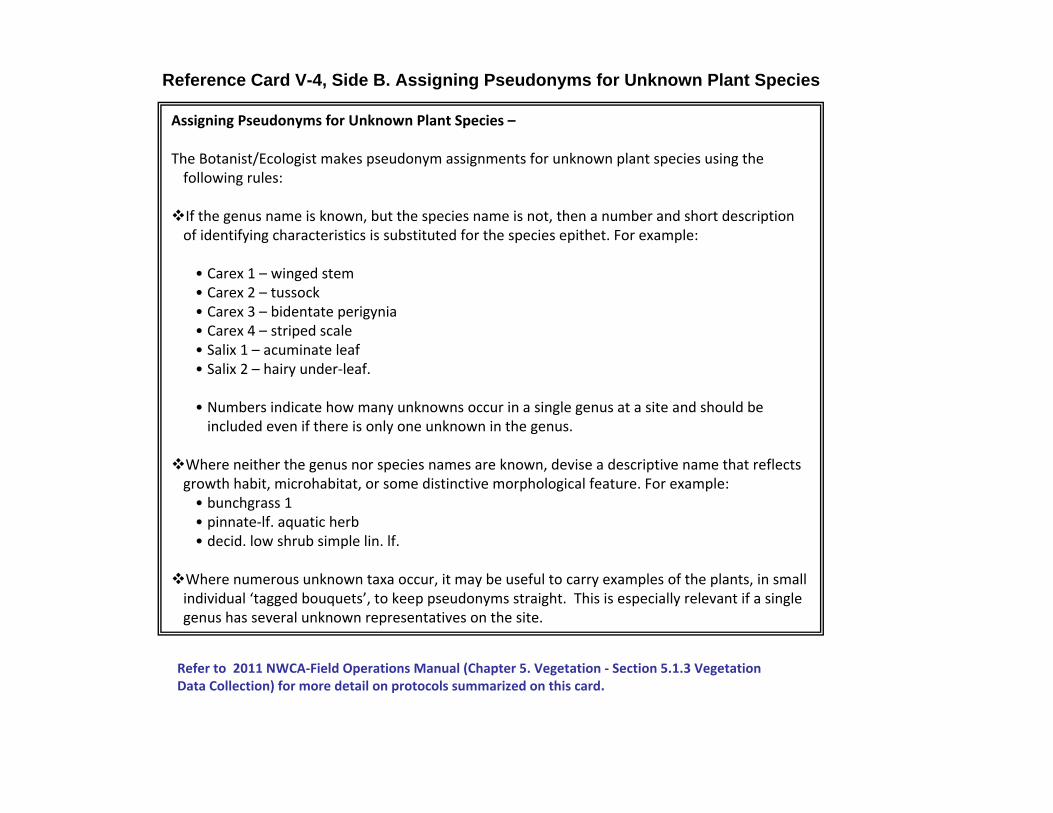
Reference Card V-4, Side B. Assigning Pseudonyms for Unknown Plant Species
Assigning Pseudonyms for Unknown Plant Species –
The Botanist/Ecologist makes pseudonym assignments for unknown plant species using the following rules:
If the genus name is known, but the species name is not, then a number and short description of identifying characteristics is substituted for the species epithet. For example:
• Carex 1 – winged stem• Carex 2 – tussock• Carex 3 – bidentate perigynia• Carex 4 – striped scale• Salix 1 – acuminate leaf• Salix 2 – hairy under‐leaf.
• Numbers indicate how many unknowns occur in a single genus at a site and should be included even if there is only one unknown in the genus.
Where neither the genus nor species names are known, devise a descriptive name that reflects growth habit, microhabitat, or some distinctive morphological feature. For example:• bunchgrass 1• pinnate‐lf. aquatic herb• decid. low shrub simple lin. lf.
Where numerous unknown taxa occur, it may be useful to carry examples of the plants, in small individual ‘tagged bouquets’, to keep pseudonyms straight. This is especially relevant if a single genus has several unknown representatives on the site.
Refer to 2011 NWCA‐Field Operations Manual (Chapter 5. Vegetation ‐ Section 5.1.3 Vegetation Data Collection) for more detail on protocols summarized on this card.
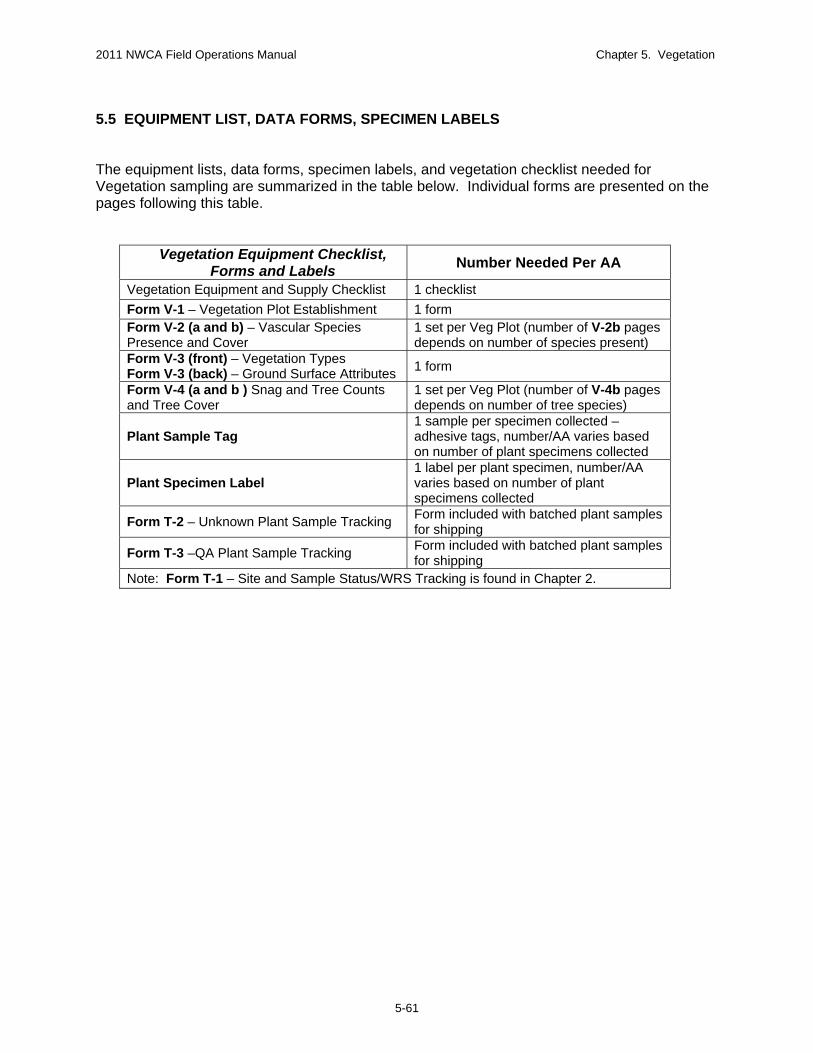
2011 NWCA Field Operations Manual Chapter 5. Vegetation
5.5 EQUIPMENT LIST, DATA FORMS, SPECIMEN LABELS The equipment lists, data forms, specimen labels, and vegetation checklist needed for Vegetation sampling are summarized in the table below. Individual forms are presented on the pages following this table.
Vegetation Equipment Checklist, Forms and Labels
Number Needed Per AA
Vegetation Equipment and Supply Checklist 1 checklist Form V-1 – Vegetation Plot Establishment 1 form Form V-2 (a and b) – Vascular Species Presence and Cover
1 set per Veg Plot (number of V-2b pages depends on number of species present)
Form V-3 (front) – Vegetation Types Form V-3 (back) – Ground Surface Attributes 1 form
Form V-4 (a and b ) Snag and Tree Counts and Tree Cover
1 set per Veg Plot (number of V-4b pages depends on number of tree species)
Plant Sample Tag 1 sample per specimen collected – adhesive tags, number/AA varies based on number of plant specimens collected
Plant Specimen Label 1 label per plant specimen, number/AA varies based on number of plant specimens collected
Form T-2 – Unknown Plant Sample Tracking Form included with batched plant samples for shipping
Form T-3 –QA Plant Sample Tracking Form included with batched plant samples for shipping
Note: Form T-1 – Site and Sample Status/WRS Tracking is found in Chapter 2.
5-61

2011 NWCA Field Operations Manual Chapter 5. Vegetation
5 - 62
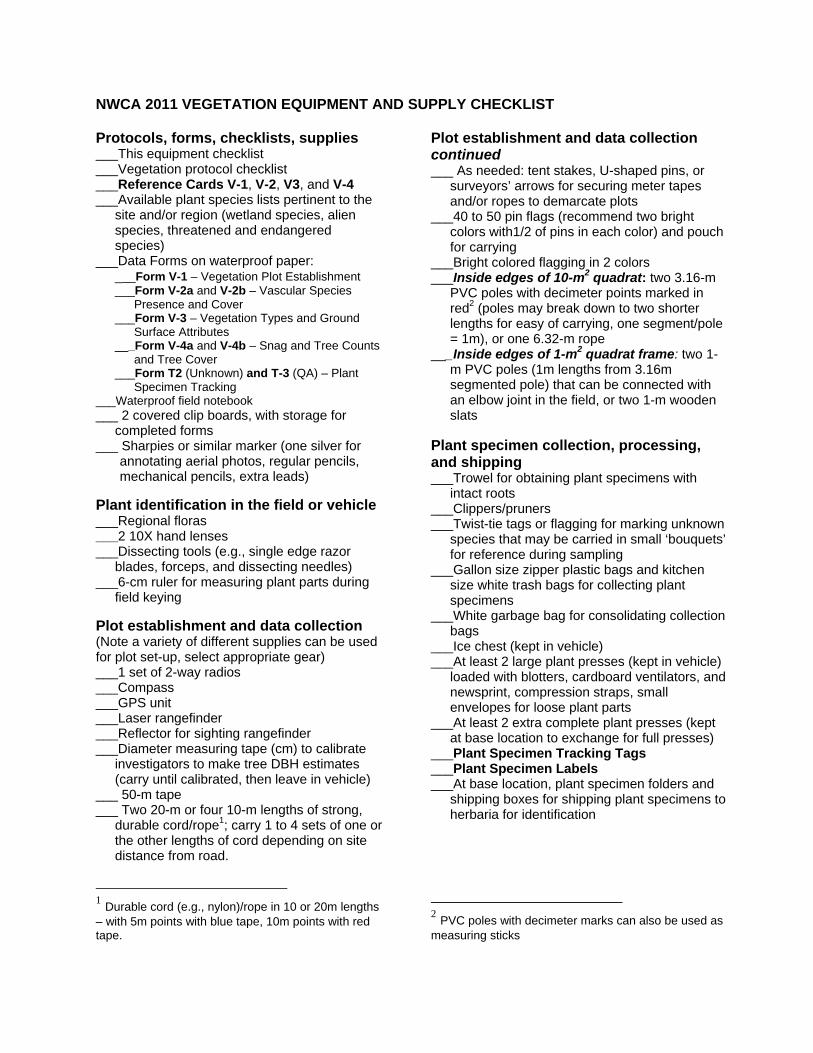
NWCA 2011 VEGETATION EQUIPMENT AND SUPPLY CHECKLIST Protocols, forms, checklists, supplies ___This equipment checklist ___Vegetation protocol checklist ___Reference Cards V-1, V-2, V3, and V-4 ___Available plant species lists pertinent to the
site and/or region (wetland species, alien species, threatened and endangered species)
___Data Forms on waterproof paper: ___Form V-1 – Vegetation Plot Establishment ___Form V-2a and V-2b – Vascular Species
Presence and Cover ___Form V-3 – Vegetation Types and Ground
Surface Attributes ___Form V-4a and V-4b – Snag and Tree Counts
and Tree Cover ___Form T2 (Unknown) and T-3 (QA) – Plant
Specimen Tracking ___Waterproof field notebook ___ 2 covered clip boards, with storage for
completed forms ___ Sharpies or similar marker (one silver for
annotating aerial photos, regular pencils, mechanical pencils, extra leads)
Plant identification in the field or vehicle ___Regional floras ___2 10X hand lenses ___Dissecting tools (e.g., single edge razor
blades, forceps, and dissecting needles) ___6-cm ruler for measuring plant parts during
field keying
Plot establishment and data collection (Note a variety of different supplies can be used for plot set-up, select appropriate gear) ___1 set of 2-way radios ___Compass ___GPS unit ___Laser rangefinder ___Reflector for sighting rangefinder ___Diameter measuring tape (cm) to calibrate
investigators to make tree DBH estimates (carry until calibrated, then leave in vehicle)
___ 50-m tape ___ Two 20-m or four 10-m lengths of strong,
durable cord/rope1; carry 1 to 4 sets of one or the other lengths of cord depending on site distance from road.
1 Durable cord (e.g., nylon)/rope in 10 or 20m lengths – with 5m points with blue tape, 10m points with red tape.
Plot establishment and data collection continued ___ As needed: tent stakes, U-shaped pins, or
surveyors’ arrows for securing meter tapes and/or ropes to demarcate plots
___40 to 50 pin flags (recommend two bright colors with1/2 of pins in each color) and pouch for carrying
___Bright colored flagging in 2 colors ___Inside edges of 10-m2 quadrat: two 3.16-m
PVC poles with decimeter points marked in red2 (poles may break down to two shorter lengths for easy of carrying, one segment/pole = 1m), or one 6.32-m rope
___Inside edges of 1-m2 quadrat frame: two 1-m PVC poles (1m lengths from 3.16m segmented pole) that can be connected with an elbow joint in the field, or two 1-m wooden slats
Plant specimen collection, processing, and shipping ___Trowel for obtaining plant specimens with
intact roots ___Clippers/pruners ___Twist-tie tags or flagging for marking unknown
species that may be carried in small ‘bouquets’ for reference during sampling
___Gallon size zipper plastic bags and kitchen size white trash bags for collecting plant specimens
___White garbage bag for consolidating collection bags
___Ice chest (kept in vehicle) ___At least 2 large plant presses (kept in vehicle)
loaded with blotters, cardboard ventilators, and newsprint, compression straps, small envelopes for loose plant parts
___At least 2 extra complete plant presses (kept at base location to exchange for full presses)
___Plant Specimen Tracking Tags ___Plant Specimen Labels ___At base location, plant specimen folders and
shipping boxes for shipping plant specimens to herbaria for identification
2 PVC poles with decimeter marks can also be used as measuring sticks

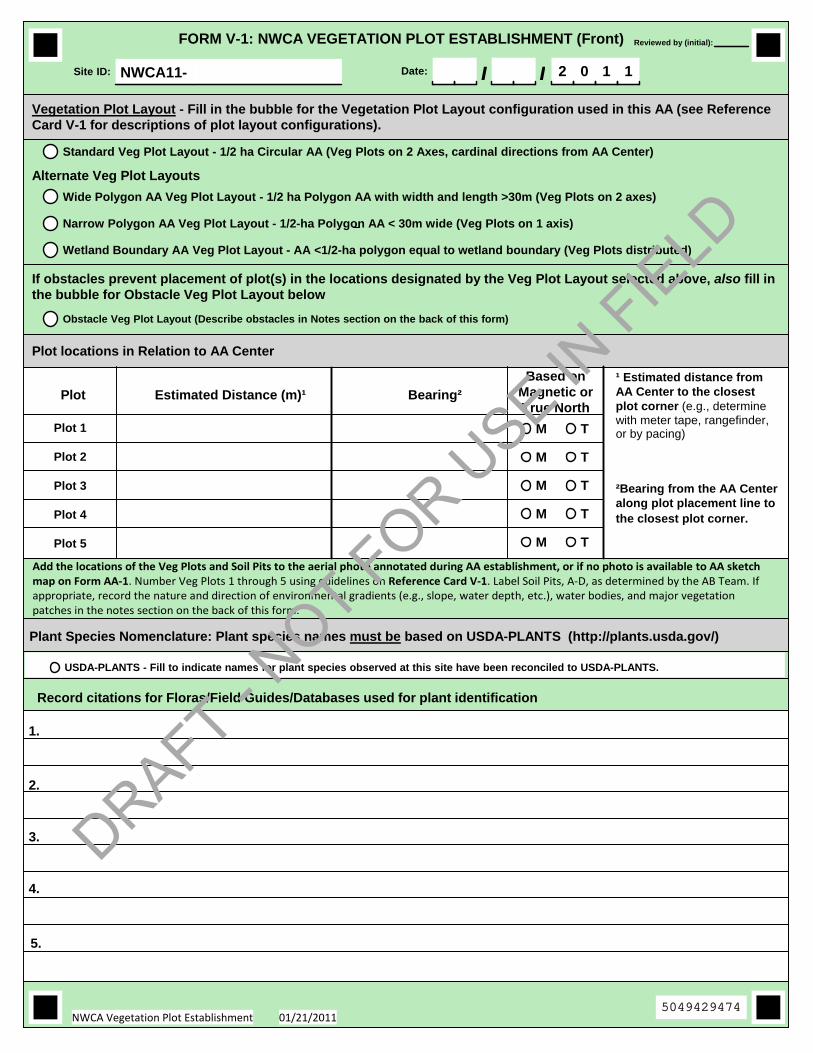
M T
M T
M T
M T
M T
FORM V-1: NWCA VEGETATION PLOT ESTABLISHMENT (Front)
Plot 1
Plot 2
Plot 3
Plot 4
Plot 5
Site ID: NWCA11- Date: 2 0 1 1//
Standard Veg Plot Layout - 1/2 ha Circular AA (Veg Plots on 2 Axes, cardinal directions from AA Center)
Wide Polygon AA Veg Plot Layout - 1/2 ha Polygon AA with width and length >30m (Veg Plots on 2 axes)
Narrow Polygon AA Veg Plot Layout - 1/2-ha Polygon AA < 30m wide (Veg Plots on 1 axis)
Wetland Boundary AA Veg Plot Layout - AA <1/2-ha polygon equal to wetland boundary (Veg Plots distributed)
Vegetation Plot Layout - Fill in the bubble for the Vegetation Plot Layout configuration used in this AA (see ReferenceCard V-1 for descriptions of plot layout configurations).
Record citations for Floras/Field Guides/Databases used for plant identification
01/21/2011NWCA Vegetation Plot Establishment
Alternate Veg Plot Layouts
Obstacle Veg Plot Layout (Describe obstacles in Notes section on the back of this form)
If obstacles prevent placement of plot(s) in the locations designated by the Veg Plot Layout selected above, also fill inthe bubble for Obstacle Veg Plot Layout below
Plot locations in Relation to AA Center
Plot Estimated Distance (m)¹ Bearing²
Based onMagnetic orTrue North
¹ Estimated distance fromAA Center to the closestplot corner (e.g., determinewith meter tape, rangefinder,or by pacing)
²Bearing from the AA Centeralong plot placement line tothe closest plot corner.
USDA-PLANTS - Fill to indicate names for plant species observed at this site have been reconciled to USDA-PLANTS.
Plant Species Nomenclature: Plant species names must be based on USDA-PLANTS (http://plants.usda.gov/)
1.
2.
3.
4.
5.
Reviewed by (initial):
Add the locations of the Veg Plots and Soil Pits to the aerial photo annotated during AA establishment, or if no photo is available to AA sketch map on Form AA‐1. Number Veg Plots 1 through 5 using guidelines on Reference Card V‐1. Label Soil Pits, A‐D, as determined by the AB Team. If appropriate, record the nature and direction of environmental gradients (e.g., slope, water depth, etc.), water bodies, and major vegetation patches in the notes section on the back of this form.
5049429474
DRAFT - NOT FOR U
SE IN FIE
LD

FORM V-1: NWCA VEGETATION PLOT ESTABLISHMENT (Back)
Date: 2 0 1 1/ /NOTES:
If needed elaborate on reasons for plot layout selection and make notes about unique features of vegetation or environment.
01/21/2011NWCA Vegetation Plot Establishment
Site ID: NWCA11-
Reviewed by (initial):
5400429475
DRAFT - NOT FOR U
SE IN FIE
LD
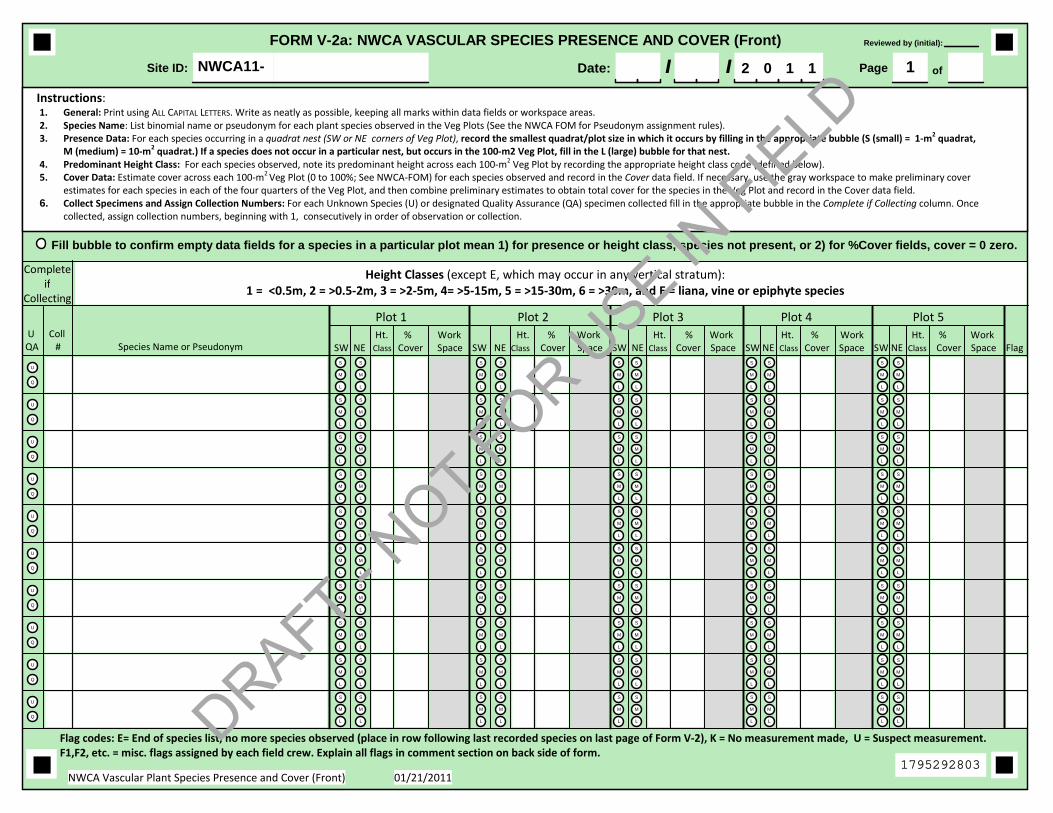
Ht. % Work Ht. % Work Ht. % Work Ht. % Work Ht. % WorkSW NE Class Cover Space SW NE Class Cover Space SW NE Class Cover Space SW NE Class Cover Space SW NE Class Cover Space Flag
Plot 1 Plot 2 Plot 3 Plot 4 Plot 5
U
Q
S
M
L
S
M
L
S
M
L
S
M
L
S
M
L
S
M
L
S
M
L
S
M
L
S
M
L
S
M
L
U
Q
S
M
L
S
M
L
S
M
L
S
M
L
S
M
L
S
M
L
S
M
L
S
M
L
S
M
L
S
M
L
U
Q
S
M
L
S
M
L
S
M
L
S
M
L
S
M
L
S
M
L
S
M
L
S
M
L
S
M
L
S
M
L
U
Q
S
M
L
S
M
L
S
M
L
S
M
L
S
M
L
S
M
L
S
M
L
S
M
L
S
M
L
S
M
L
U
Q
S
M
L
S
M
L
S
M
L
S
M
L
S
M
L
S
M
L
S
M
L
S
M
L
S
M
L
S
M
L
U
Q
S
M
L
S
M
L
S
M
L
S
M
L
S
M
L
S
M
L
S
M
L
S
M
L
S
M
L
S
M
L
U
Q
S
M
L
S
M
L
S
M
L
S
M
L
S
M
L
S
M
L
S
M
L
S
M
L
S
M
L
S
M
L
U
Q
S
M
L
S
M
L
S
M
L
S
M
L
S
M
L
S
M
L
S
M
L
S
M
L
S
M
L
S
M
L
U
Q
S
M
L
S
M
L
S
M
L
S
M
L
S
M
L
S
M
L
S
M
L
S
M
L
S
M
L
S
M
L
U
Q
S
M
L
S
M
L
S
M
L
S
M
L
S
M
L
S
M
L
S
M
L
S
M
L
S
M
L
S
M
L
Site ID: NWCA11- Date: 2 0 1 1
FORM V-2a: NWCA VASCULAR SPECIES PRESENCE AND COVER (Front)
/ /
Fill bubble to confirm empty data fields for a species in a particular plot mean 1) for presence or height class, species not present, or 2) for %Cover fields, cover = 0 zero.
Completeif
Collecting
NWCA Vascular Plant Species Presence and Cover (Front) 01/21/2011
Height Classes (except E, which may occur in any vertical stratum):1 = <0.5m, 2 = >0.5‐2m, 3 = >2‐5m, 4= >5‐15m, 5 = >15‐30m, 6 = >30m, and E = liana, vine or epiphyte species
Flag codes: E= End of species list, no more species observed (place in row following last recorded species on last page of Form V‐2), K = No measurement made, U = Suspect measurement.F1,F2, etc. = misc. flags assigned by each field crew. Explain all flags in comment section on back side of form.
Page 1 of
U CollQA # Species Name or Pseudonym
Instructions: 1. General: Print using ALL CAPITAL LETTERS. Write as neatly as possible, keeping all marks within data fields or workspace areas. 2. Species Name: List binomial name or pseudonym for each plant species observed in the Veg Plots (See the NWCA FOM for Pseudonym assignment rules). 3. Presence Data: For each species occurring in a quadrat nest (SW or NE corners of Veg Plot), record the smallest quadrat/plot size in which it occurs by filling in the appropriate bubble (S (small) = 1‐m2 quadrat,
M (medium) = 10‐m2 quadrat.) If a species does not occur in a particular nest, but occurs in the 100‐m2 Veg Plot, fill in the L (large) bubble for that nest. 4. Predominant Height Class: For each species observed, note its predominant height across each 100‐m2 Veg Plot by recording the appropriate height class code (defined below). 5. Cover Data: Estimate cover across each 100‐m2 Veg Plot (0 to 100%; See NWCA‐FOM) for each species observed and record in the Cover data field. If necessary, use the gray workspace to make preliminary cover
estimates for each species in each of the four quarters of the Veg Plot, and then combine preliminary estimates to obtain total cover for the species in the Veg Plot and record in the Cover data field. 6. Collect Specimens and Assign Collection Numbers: For each Unknown Species (U) or designated Quality Assurance (QA) specimen collected fill in the appropriate bubble in the Complete if Collecting column. Once
collected, assign collection numbers, beginning with 1, consecutively in order of observation or collection.
Reviewed by (initial):
1795292803
DRAFT - NOT FOR U
SE IN FIE
LD
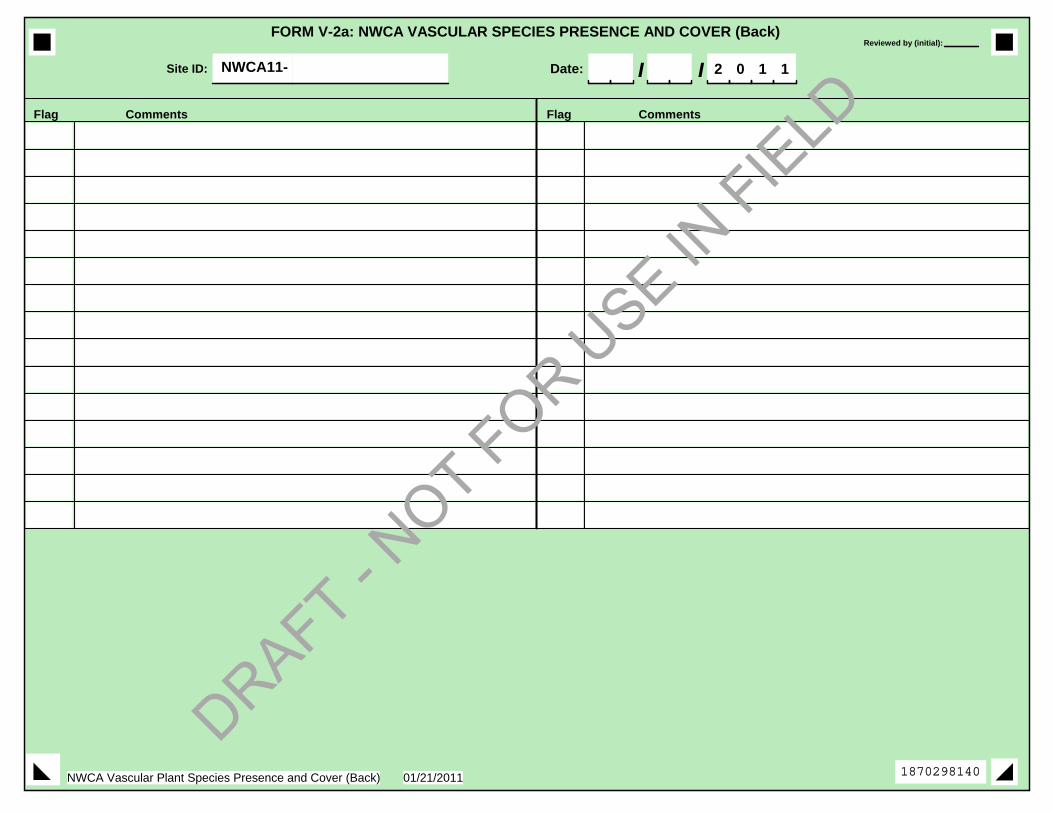
Flag Comments
Site ID: NWCA11- Date: 2 0 1 1
FORM V-2a: NWCA VASCULAR SPECIES PRESENCE AND COVER (Back)
/ /
Flag Comments
01/21/2011NWCA Vascular Plant Species Presence and Cover (Back)
Reviewed by (initial):
1870298140
DRAFT - NOT FOR U
SE IN FIE
LD
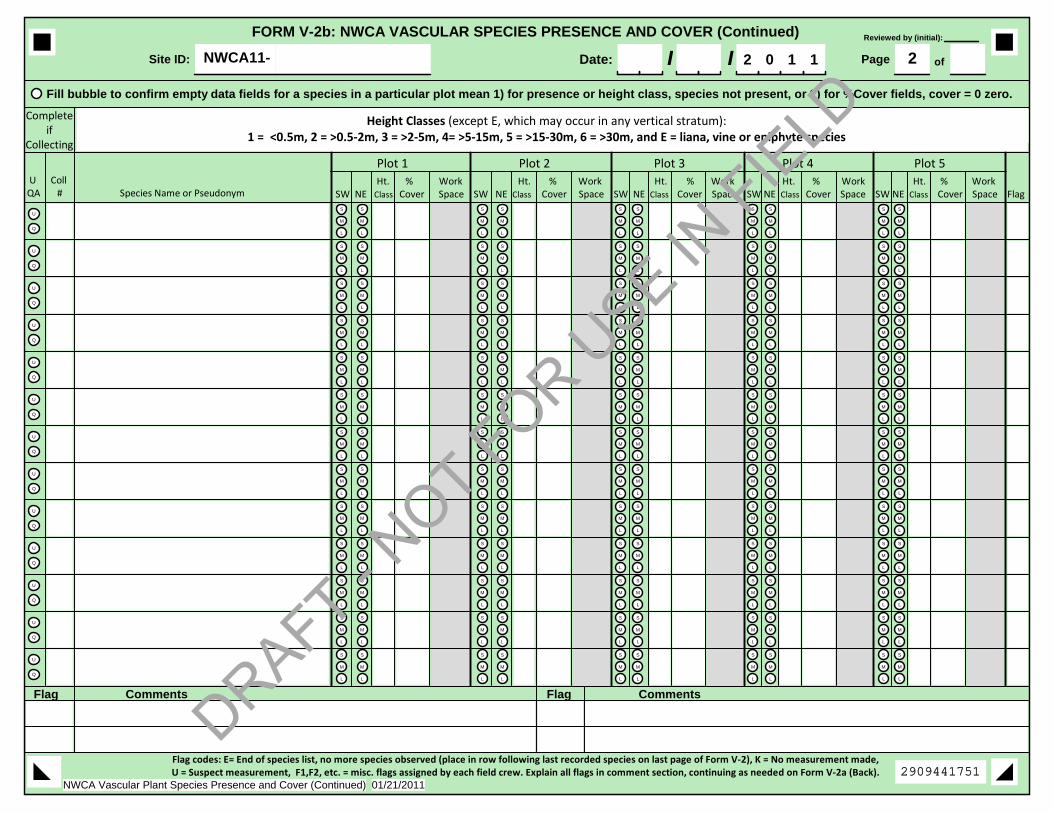
U
Q
S
M
L
S
M
L
S
M
L
S
M
L
S
M
L
S
M
L
S
M
L
S
M
L
S
M
L
S
M
L
U
Q
S
M
L
S
M
L
S
M
L
S
M
L
S
M
L
S
M
L
S
M
L
S
M
L
S
M
L
S
M
L
U
Q
S
M
L
S
M
L
S
M
L
S
M
L
S
M
L
S
M
L
S
M
L
S
M
L
S
M
L
S
M
L
U
Q
S
M
L
S
M
L
S
M
L
S
M
L
S
M
L
S
M
L
S
M
L
S
M
L
S
M
L
S
M
L
U
Q
S
M
L
S
M
L
S
M
L
S
M
L
S
M
L
S
M
L
S
M
L
S
M
L
S
M
L
S
M
L
U
Q
S
M
L
S
M
L
S
M
L
S
M
L
S
M
L
S
M
L
S
M
L
S
M
L
S
M
L
S
M
L
U
Q
S
M
L
S
M
L
S
M
L
S
M
L
S
M
L
S
M
L
S
M
L
S
M
L
S
M
L
S
M
L
U
Q
S
M
L
S
M
L
S
M
L
S
M
L
S
M
L
S
M
L
S
M
L
S
M
L
S
M
L
S
M
L
U
Q
S
M
L
S
M
L
S
M
L
S
M
L
S
M
L
S
M
L
S
M
L
S
M
L
S
M
L
S
M
L
U
Q
S
M
L
S
M
L
S
M
L
S
M
L
S
M
L
S
M
L
S
M
L
S
M
L
S
M
L
S
M
L
U
Q
S
M
L
S
M
L
S
M
L
S
M
L
S
M
L
S
M
L
S
M
L
S
M
L
S
M
L
S
M
L
U
Q
S
M
L
S
M
L
S
M
L
S
M
L
S
M
L
S
M
L
S
M
L
S
M
L
S
M
L
S
M
L
U
Q
S
M
L
S
M
L
S
M
L
S
M
L
S
M
L
S
M
L
S
M
L
S
M
L
S
M
L
S
M
L
Flag Comments
Site ID: NWCA11- Date: 2 0 1 1
FORM V-2b: NWCA VASCULAR SPECIES PRESENCE AND COVER (Continued)
/ /Fill bubble to confirm empty data fields for a species in a particular plot mean 1) for presence or height class, species not present, or 2) for %Cover fields, cover = 0 zero.
Flag Comments
Flag codes: E= End of species list, no more species observed (place in row following last recorded species on last page of Form V‐2), K = No measurement made,U = Suspect measurement, F1,F2, etc. = misc. flags assigned by each field crew. Explain all flags in comment section, continuing as needed on Form V‐2a (Back).
Page 2 of
01/21/2011NWCA Vascular Plant Species Presence and Cover (Continued)
Ht. % Work Ht. % Work Ht. % Work Ht. % Work Ht. % WorkSW NE Class Cover Space SW NE Class Cover Space SW NE Class Cover Space SW NE Class Cover Space SW NE Class Cover Space Flag
Plot 1 Plot 2 Plot 3 Plot 4 Plot 5
Completeif
Collecting
Height Classes (except E, which may occur in any vertical stratum):1 = <0.5m, 2 = >0.5‐2m, 3 = >2‐5m, 4= >5‐15m, 5 = >15‐30m, 6 = >30m, and E = liana, vine or epiphyte species
U CollQA # Species Name or Pseudonym
Reviewed by (initial):
2909441751
DRAFT - NOT FOR U
SE IN FIE
LD

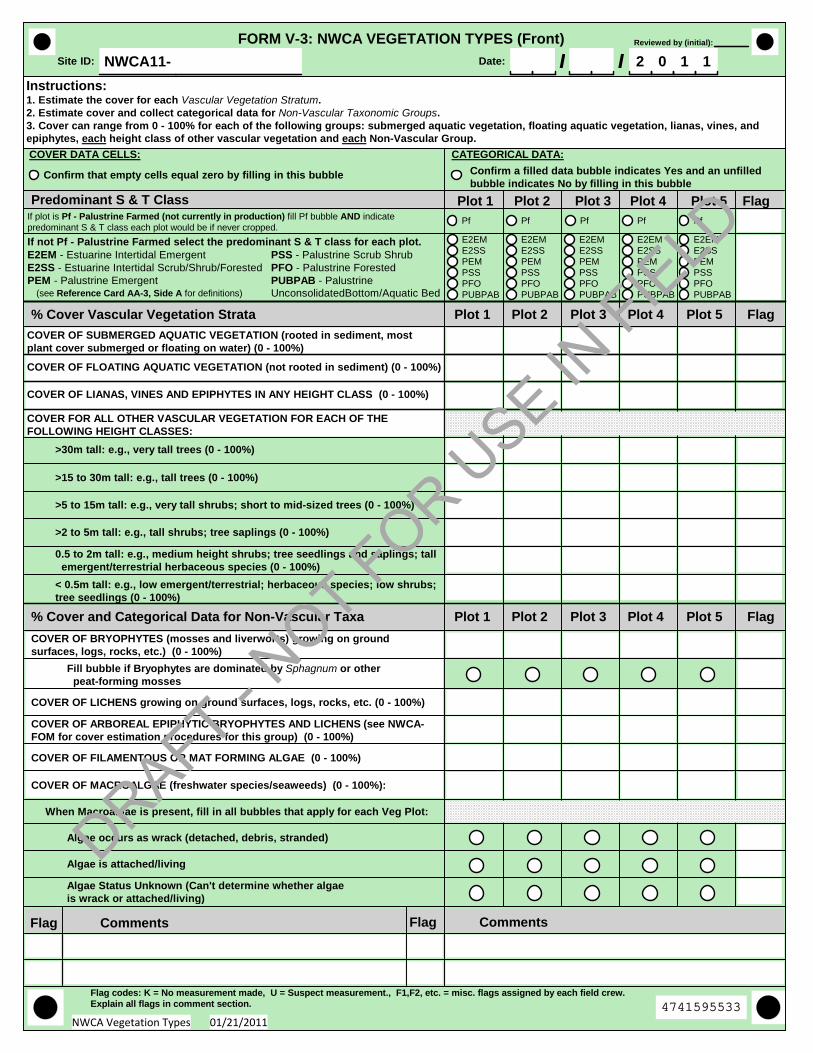
% Cover Vascular Vegetation Strata Plot 1 Plot 2 Plot 3 Plot 4 Plot 5 Flag
COVER OF FLOATING AQUATIC VEGETATION (not rooted in sediment) (0 - 100%)
Fill bubble if Bryophytes are dominated by Sphagnum or other peat-forming mosses
COVER FOR ALL OTHER VASCULAR VEGETATION FOR EACH OF THEFOLLOWING HEIGHT CLASSES:
>30m tall: e.g., very tall trees (0 - 100%)
FORM V-3: NWCA VEGETATION TYPES (Front)
Flag Comments
Flag codes: K = No measurement made, U = Suspect measurement., F1,F2, etc. = misc. flags assigned by each field crew.Explain all flags in comment section.
>15 to 30m tall: e.g., tall trees (0 - 100%)
>5 to 15m tall: e.g., very tall shrubs; short to mid-sized trees (0 - 100%)
>2 to 5m tall: e.g., tall shrubs; tree saplings (0 - 100%)
< 0.5m tall: e.g., low emergent/terrestrial; herbaceous species; low shrubs;tree seedlings (0 - 100%)
COVER OF LIANAS, VINES AND EPIPHYTES IN ANY HEIGHT CLASS (0 - 100%)
COVER OF FILAMENTOUS OR MAT FORMING ALGAE (0 - 100%)
COVER OF MACROALGAE (freshwater species/seaweeds) (0 - 100%):
Algae occurs as wrack (detached, debris, stranded)
When Macroalgae is present, fill in all bubbles that apply for each Veg Plot:
Algae is attached/living
Algae Status Unknown (Can't determine whether algaeis wrack or attached/living)
Date: 2 0 1 1//Instructions:1. Estimate the cover for each Vascular Vegetation Stratum.2. Estimate cover and collect categorical data for Non-Vascular Taxonomic Groups.3. Cover can range from 0 - 100% for each of the following groups: submerged aquatic vegetation, floating aquatic vegetation, lianas, vines, andepiphytes, each height class of other vascular vegetation and each Non-Vascular Group.
01/21/2011NWCA Vegetation Types
Site ID: NWCA11-
0.5 to 2m tall: e.g., medium height shrubs; tree seedlings and saplings; tall emergent/terrestrial herbaceous species (0 - 100%)
COVER OF ARBOREAL EPIPHYTIC BRYOPHYTES AND LICHENS (see NWCA-FOM for cover estimation procedures for this group) (0 - 100%)
COVER OF LICHENS growing on ground surfaces, logs, rocks, etc. (0 - 100%)
COVER OF BRYOPHYTES (mosses and liverworts) growing on groundsurfaces, logs, rocks, etc.) (0 - 100%)
COVER DATA CELLS:
Confirm that empty cells equal zero by filling in this bubble
CATEGORICAL DATA:
Confirm a filled data bubble indicates Yes and an unfilledbubble indicates No by filling in this bubble
% Cover and Categorical Data for Non-Vascular Taxa Plot 1 Plot 2 Plot 3 Plot 4 Plot 5 Flag
COVER OF SUBMERGED AQUATIC VEGETATION (rooted in sediment, mostplant cover submerged or floating on water) (0 - 100%)
Plot 1 Plot 2 Plot 3 Plot 4 Plot 5 Flag
E2EME2SSPEMPSSPFOPUBPAB
E2EM - Estuarine Intertidal Emergent PSS - Palustrine Scrub ShrubE2SS - Estuarine Intertidal Scrub/Shrub/Forested PFO - Palustrine ForestedPEM - Palustrine Emergent PUBPAB - Palustrine
UnconsolidatedBottom/Aquatic Bed
Predominant S & T Class
(see Reference Card AA-3, Side A for definitions)
Flag Comments
Pf
E2EME2SSPEMPSSPFOPUBPAB
E2EME2SSPEMPSSPFOPUBPAB
E2EME2SSPEMPSSPFOPUBPAB
E2EME2SSPEMPSSPFOPUBPAB
If plot is Pf - Palustrine Farmed (not currently in production) fill Pf bubble AND indicatepredominant S & T class each plot would be if never cropped.
Pf Pf Pf Pf
If not Pf - Palustrine Farmed select the predominant S & T class for each plot.
Reviewed by (initial):
4741595533
DRAFT - NOT FOR U
SE IN FIE
LD
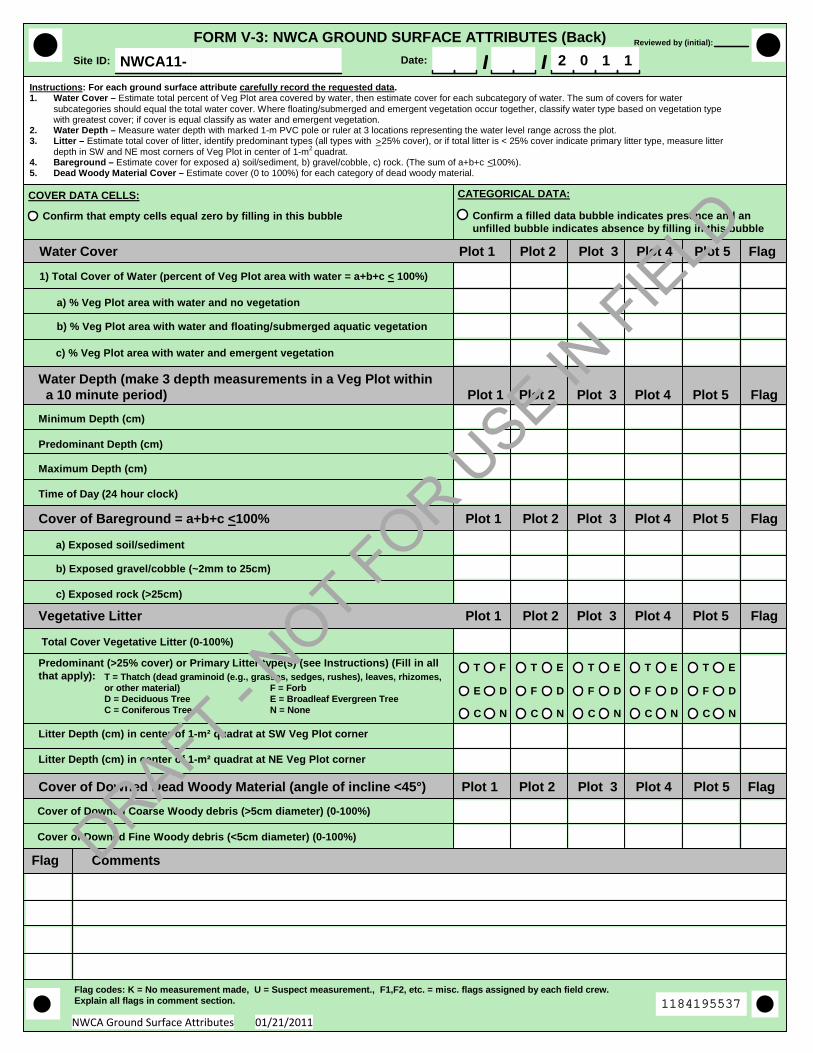
Predominant (>25% cover) or Primary Litter type(s) (see Instructions) (Fill in allthat apply):
Cover of Bareground = a+b+c <100% Plot 1 Plot 2 Plot 3 Plot 4 Plot 5 Flag
a) % Veg Plot area with water and no vegetation
FORM V-3: NWCA GROUND SURFACE ATTRIBUTES (Back)
Flag Comments
Flag codes: K = No measurement made, U = Suspect measurement., F1,F2, etc. = misc. flags assigned by each field crew.Explain all flags in comment section.
b) % Veg Plot area with water and floating/submerged aquatic vegetation
c) % Veg Plot area with water and emergent vegetation
Site ID: NWCA11- Date: 2 0 1 1//
Time of Day (24 hour clock)
Maximum Depth (cm)
Predominant Depth (cm)
c) Exposed rock (>25cm)
b) Exposed gravel/cobble (~2mm to 25cm)
a) Exposed soil/sediment
Litter Depth (cm) in center of 1-m² quadrat at NE Veg Plot corner
Total Cover Vegetative Litter (0-100%)
Litter Depth (cm) in center of 1-m² quadrat at SW Veg Plot corner
Cover of Downed Fine Woody debris (<5cm diameter) (0-100%)
01/21/2011NWCA Ground Surface Attributes
1) Total Cover of Water (percent of Veg Plot area with water = a+b+c < 100%)
Water Depth (make 3 depth measurements in a Veg Plot within a 10 minute period) Plot 1 Plot 2 Plot 3 Plot 4 Plot 5 Flag
Minimum Depth (cm)
Cover of Downed Dead Woody Material (angle of incline <45°) Plot 1 Plot 2 Plot 3 Plot 4 Plot 5 Flag
Cover of Downed Coarse Woody debris (>5cm diameter) (0-100%)
COVER DATA CELLS:
Confirm that empty cells equal zero by filling in this bubble Confirm a filled data bubble indicates presence and anunfilled bubble indicates absence by filling in this bubble
CATEGORICAL DATA:
C
F D
ET
NC
F D
ET
NC
F D
ET
NC
F D
ET
NC
F
DE
T
N
Water Cover Plot 1 Plot 2 Plot 3 Plot 4 Plot 5 Flag
Vegetative Litter Plot 1 Plot 2 Plot 3 Plot 4 Plot 5 Flag
>
T = Thatch (dead graminoid (e.g., grasses, sedges, rushes), leaves, rhizomes,or other material) F = Forb D = Deciduous Tree E = Broadleaf Evergreen TreeC = Coniferous Tree N = None
<
Reviewed by (initial):
Instructions: For each ground surface attribute carefully record the requested data. 1. Water Cover – Estimate total percent of Veg Plot area covered by water, then estimate cover for each subcategory of water. The sum of covers for water
subcategories should equal the total water cover. Where floating/submerged and emergent vegetation occur together, classify water type based on vegetation type with greatest cover; if cover is equal classify as water and emergent vegetation.
2. Water Depth – Measure water depth with marked 1-m PVC pole or ruler at 3 locations representing the water level range across the plot. 3. Litter – Estimate total cover of litter, identify predominant types (all types with 25% cover), or if total litter is < 25% cover indicate primary litter type, measure litter
depth in SW and NE most corners of Veg Plot in center of 1-m2 quadrat. 4. Bareground – Estimate cover for exposed a) soil/sediment, b) gravel/cobble, c) rock. (The sum of a+b+c 100%). 5. Dead Woody Material Cover – Estimate cover (0 to 100%) for each category of dead woody material.
1184195537
DRAFT - NOT FOR U
SE IN FIE
LD
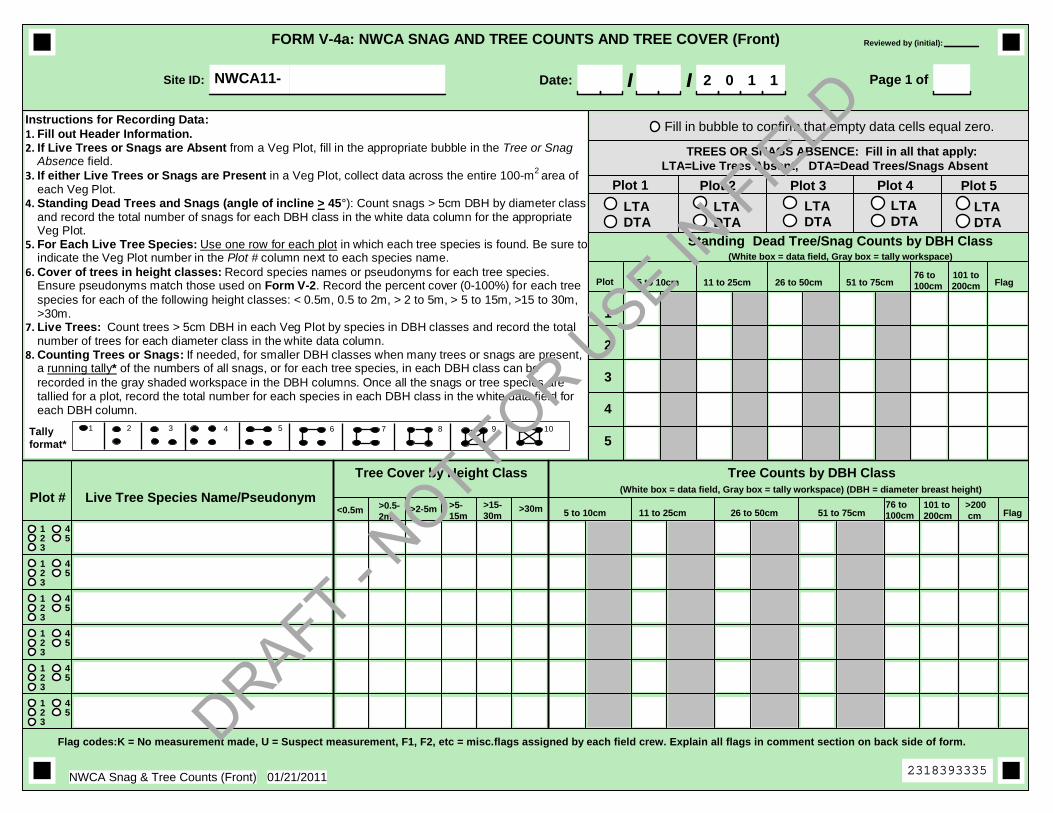
Instructions for Recording Data: 1. Fill out Header Information. 2. If Live Trees or Snags are Absent from a Veg Plot, fill in the appropriate bubble in the Tree or Snag
Absence field. 3. If either Live Trees or Snags are Present in a Veg Plot, collect data across the entire 100-m2 area of
each Veg Plot. 4. Standing Dead Trees and Snags (angle of incline > 45°): Count snags > 5cm DBH by diameter class
and record the total number of snags for each DBH class in the white data column for the appropriate Veg Plot.
5. For Each Live Tree Species: Use one row for each plot in which each tree species is found. Be sure to indicate the Veg Plot number in the Plot # column next to each species name.
6. Cover of trees in height classes: Record species names or pseudonyms for each tree species. Ensure pseudonyms match those used on Form V-2. Record the percent cover (0-100%) for each tree species for each of the following height classes: < 0.5m, 0.5 to 2m, > 2 to 5m, > 5 to 15m, >15 to 30m, >30m.
7. Live Trees: Count trees > 5cm DBH in each Veg Plot by species in DBH classes and record the total number of trees for each diameter class in the white data column.
8. Counting Trees or Snags: If needed, for smaller DBH classes when many trees or snags are present, a running tally* of the numbers of all snags, or for each tree species, in each DBH class can be recorded in the gray shaded workspace in the DBH columns. Once all the snags or tree species are tallied for a plot, record the total number for each species in each DBH class in the white data field for each DBH column.
FORM V-4a: NWCA SNAG AND TREE COUNTS AND TREE COVER (Front)
123
45
123
45
123
45
123
45
123
45
123
45
Page 1 of
TREES OR SNAGS ABSENCE: Fill in all that apply: LTA=Live Trees Absent, DTA=Dead Trees/Snags Absent
Plot 1 Plot 4Plot 3 Plot 5Plot 2
Plot # Live Tree Species Name/Pseudonym
Tree Cover by Height Class Tree Counts by DBH Class (White box = data field, Gray box = tally workspace) (DBH = diameter breast height)
Standing Dead Tree/Snag Counts by DBH Class (White box = data field, Gray box = tally workspace)
Plot
1
2
3
4
5
Flag5 to 10cm 11 to 25cm 26 to 50cm 51 to 75cm76 to100cm
101 to200cm
Flag codes:K = No measurement made, U = Suspect measurement, F1, F2, etc = misc.flags assigned by each field crew. Explain all flags in comment section on back side of form.
5 to 10cm Flag11 to 25cm 26 to 50cm 51 to 75cm76 to100cm
101 to200cm
>200cm
<0.5m >0.5-2m
>2-5m >5-15m
>15-30m
>30m
LTADTA
LTADTA
LTADTA
LTADTA
LTADTA
1 2 3 4 10765 98Tallyformat*
Site ID: NWCA11- Date: 2 0 1 1/ /
01/21/2011NWCA Snag & Tree Counts (Front)
Fill in bubble to confirm that empty data cells equal zero.
Reviewed by (initial):
2318393335
DRAFT - NOT FOR U
SE IN FIE
LD

123
45
123
45
123
45
123
45
123
45
123
45
123
45
123
45
123
45
123
45
123
45
123
45
123
45
123
45
123
45
FORM V-4a: NWCA SNAG AND TREE COUNTS AND TREE COVER (Back)
Date: 2 0 1 1/ / Tree Counts by DBH Class
(White box = data field, Gray box = tally workspace)
5 to 10cm 11 to 25cm 26 to 50cm 51 to 75cm76 to100cm
101 to200cm
>200cm Flag
Tree Cover by Height Class
>30m
Plot # Live Tree Species Name/Pseudonym
Flag Comment
<0.5m>0.5-2m >2-5m
>5-15m
>15-30m
Flag codes:K = No measurement made, U = Suspect measurement, F1, F2, etc = misc.flags assigned by each field crew. Explain all flags in comment section.01/21/2011NWCA Snag & Tree Counts (Back)
Site ID: NWCA11- Page of
Flag Comment
Reviewed by (initial):
6613382414
DRAFT - NOT FOR U
SE IN FIE
LD
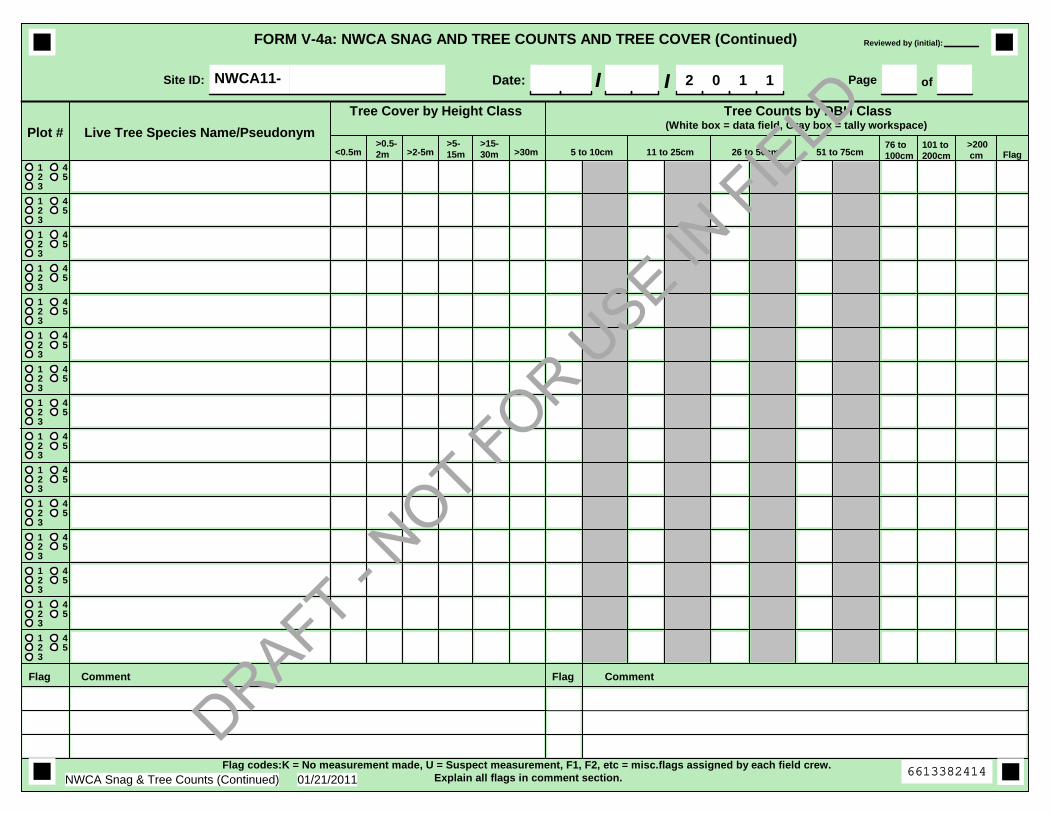
123
45
123
45
123
45
123
45
123
45
123
45
123
45
123
45
123
45
123
45
123
45
123
45
123
45
123
45
123
45
FORM V-4a: NWCA SNAG AND TREE COUNTS AND TREE COVER (Continued)
Date: 2 0 1 1/ / Tree Counts by DBH Class
(White box = data field, Gray box = tally workspace)
5 to 10cm 11 to 25cm 26 to 50cm 51 to 75cm76 to100cm
101 to200cm
>200cm Flag
Tree Cover by Height Class
>30m
Plot # Live Tree Species Name/Pseudonym
Flag Comment
<0.5m>0.5-2m >2-5m
>5-15m
>15-30m
Flag codes:K = No measurement made, U = Suspect measurement, F1, F2, etc = misc.flags assigned by each field crew. Explain all flags in comment section.01/21/2011NWCA Snag & Tree Counts (Continued)
Site ID: NWCA11- Page of
Flag Comment
Reviewed by (initial):
6613382414
DRAFT - NOT FOR U
SE IN FIE
LD

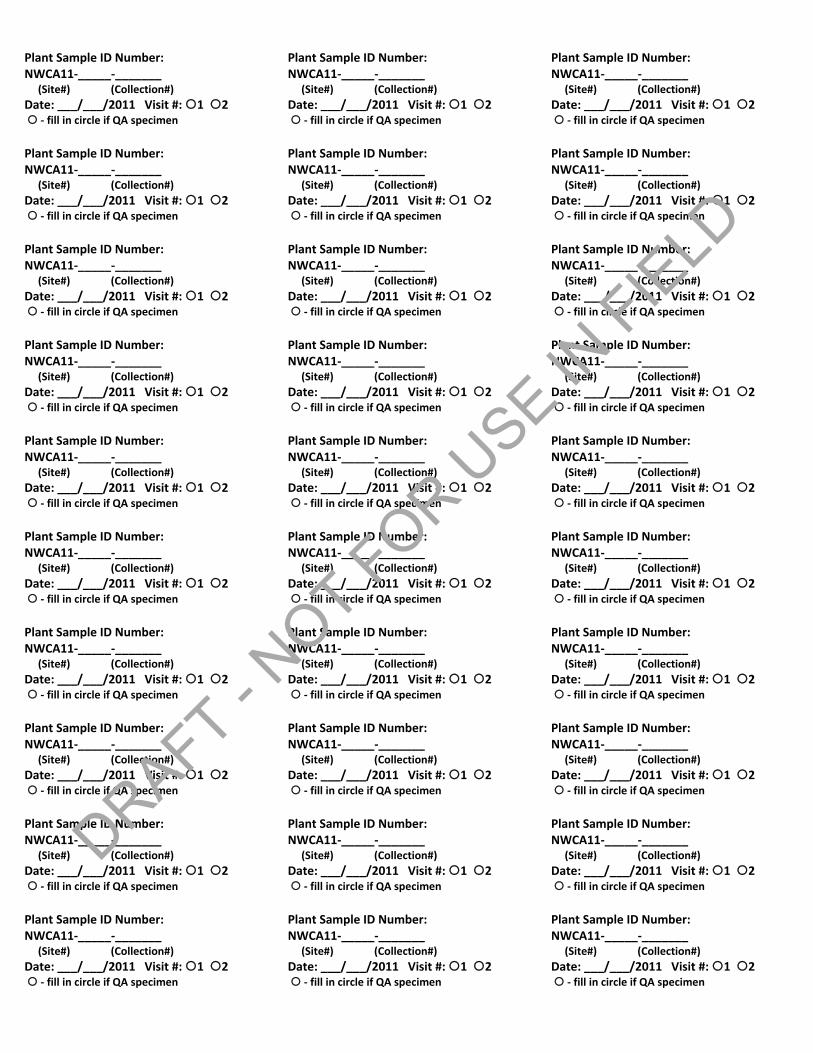
Plant Sample ID Number: NWCA11‐_____‐_______ (Site#) (Collection#)
Date: ___/___/2011 Visit #: 1 2 ‐ fill in circle if QA specimen
Plant Sample ID Number: NWCA11‐_____‐_______ (Site#) (Collection#)
Date: ___/___/2011 Visit #: 1 2 ‐ fill in circle if QA specimen
Plant Sample ID Number: NWCA11‐_____‐_______ (Site#) (Collection#)
Date: ___/___/2011 Visit #: 1 2 ‐ fill in circle if QA specimen
Plant Sample ID Number: NWCA11‐_____‐_______ (Site#) (Collection#)
Date: ___/___/2011 Visit #: 1 2 ‐ fill in circle if QA specimen
Plant Sample ID Number: NWCA11‐_____‐_______ (Site#) (Collection#)
Date: ___/___/2011 Visit #: 1 2 ‐ fill in circle if QA specimen
Plant Sample ID Number: NWCA11‐_____‐_______ (Site#) (Collection#)
Date: ___/___/2011 Visit #: 1 2 ‐ fill in circle if QA specimen
Plant Sample ID Number: NWCA11‐_____‐_______ (Site#) (Collection#)
Date: ___/___/2011 Visit #: 1 2 ‐ fill in circle if QA specimen
Plant Sample ID Number: NWCA11‐_____‐_______ (Site#) (Collection#)
Date: ___/___/2011 Visit #: 1 2 ‐ fill in circle if QA specimen
Plant Sample ID Number: NWCA11‐_____‐_______ (Site#) (Collection#)
Date: ___/___/2011 Visit #: 1 2 ‐ fill in circle if QA specimen
Plant Sample ID Number: NWCA11‐_____‐_______ (Site#) (Collection#)
Date: ___/___/2011 Visit #: 1 2 ‐ fill in circle if QA specimen
Plant Sample ID Number: NWCA11‐_____‐_______ (Site#) (Collection#)
Date: ___/___/2011 Visit #: 1 2 ‐ fill in circle if QA specimen
Plant Sample ID Number: NWCA11‐_____‐_______ (Site#) (Collection#)
Date: ___/___/2011 Visit #: 1 2 ‐ fill in circle if QA specimen
Plant Sample ID Number: NWCA11‐_____‐_______ (Site#) (Collection#)
Date: ___/___/2011 Visit #: 1 2 ‐ fill in circle if QA specimen
Plant Sample ID Number: NWCA11‐_____‐_______ (Site#) (Collection#)
Date: ___/___/2011 Visit #: 1 2 ‐ fill in circle if QA specimen
Plant Sample ID Number: NWCA11‐_____‐_______ (Site#) (Collection#)
Date: ___/___/2011 Visit #: 1 2 ‐ fill in circle if QA specimen
Plant Sample ID Number: NWCA11‐_____‐_______ (Site#) (Collection#)
Date: ___/___/2011 Visit #: 1 2 ‐ fill in circle if QA specimen
Plant Sample ID Number: NWCA11‐_____‐_______ (Site#) (Collection#)
Date: ___/___/2011 Visit #: 1 2 ‐ fill in circle if QA specimen
Plant Sample ID Number: NWCA11‐_____‐_______ (Site#) (Collection#)
Date: ___/___/2011 Visit #: 1 2 ‐ fill in circle if QA specimen
Plant Sample ID Number: NWCA11‐_____‐_______ (Site#) (Collection#)
Date: ___/___/2011 Visit #: 1 2 ‐ fill in circle if QA specimen
Plant Sample ID Number: NWCA11‐_____‐_______ (Site#) (Collection#)
Date: ___/___/2011 Visit #: 1 2 ‐ fill in circle if QA specimen
Plant Sample ID Number: NWCA11‐_____‐_______ (Site#) (Collection#)
Date: ___/___/2011 Visit #: 1 2 ‐ fill in circle if QA specimen
Plant Sample ID Number: NWCA11‐_____‐_______ (Site#) (Collection#)
Date: ___/___/2011 Visit #: 1 2 ‐ fill in circle if QA specimen
Plant Sample ID Number: NWCA11‐_____‐_______ (Site#) (Collection#)
Date: ___/___/2011 Visit #: 1 2 ‐ fill in circle if QA specimen
Plant Sample ID Number: NWCA11‐_____‐_______ (Site#) (Collection#)
Date: ___/___/2011 Visit #: 1 2 ‐ fill in circle if QA specimen
Plant Sample ID Number: NWCA11‐_____‐_______ (Site#) (Collection#)
Date: ___/___/2011 Visit #: 1 2 ‐ fill in circle if QA specimen
Plant Sample ID Number: NWCA11‐_____‐_______ (Site#) (Collection#)
Date: ___/___/2011 Visit #: 1 2 ‐ fill in circle if QA specimen
Plant Sample ID Number: NWCA11‐_____‐_______ (Site#) (Collection#)
Date: ___/___/2011 Visit #: 1 2 ‐ fill in circle if QA specimen
Plant Sample ID Number: NWCA11‐_____‐_______ (Site#) (Collection#)
Date: ___/___/2011 Visit #: 1 2 ‐ fill in circle if QA specimen
Plant Sample ID Number: NWCA11‐_____‐_______ (Site#) (Collection#)
Date: ___/___/2011 Visit #: 1 2 ‐ fill in circle if QA specimen
Plant Sample ID Number: NWCA11‐_____‐_______ (Site#) (Collection#)
Date: ___/___/2011 Visit #: 1 2 ‐ fill in circle if QA specimen
DRAFT - NOT FOR U
SE IN FIE
LD

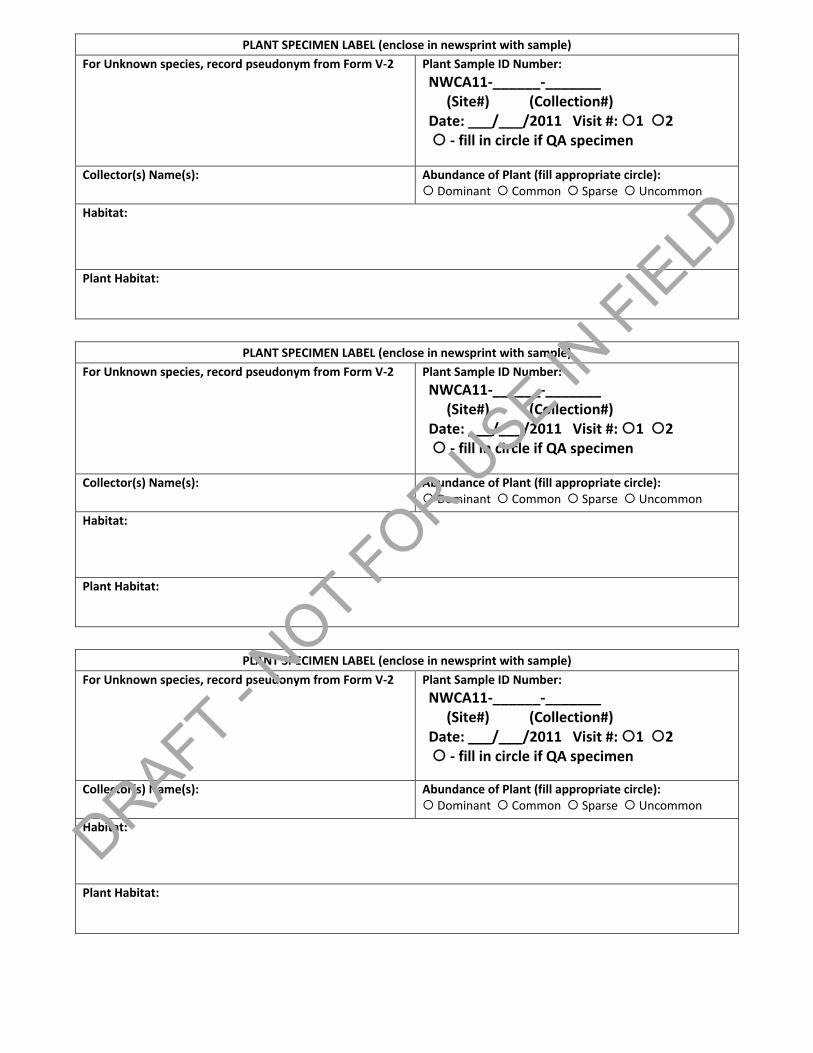
PLANT SPECIMEN LABEL (enclose in newsprint with sample) For Unknown species, record pseudonym from Form V‐2
Plant Sample ID Number:
NWCA11‐______‐_______ (Site#) (Collection#) Date: ___/___/2011 Visit #: 1 2 ‐ fill in circle if QA specimen
Collector(s) Name(s): Abundance of Plant (fill appropriate circle): Dominant Common Sparse Uncommon
Habitat:
Plant Habitat:
DRAFT - NOT FOR U
SE IN FIE
LD

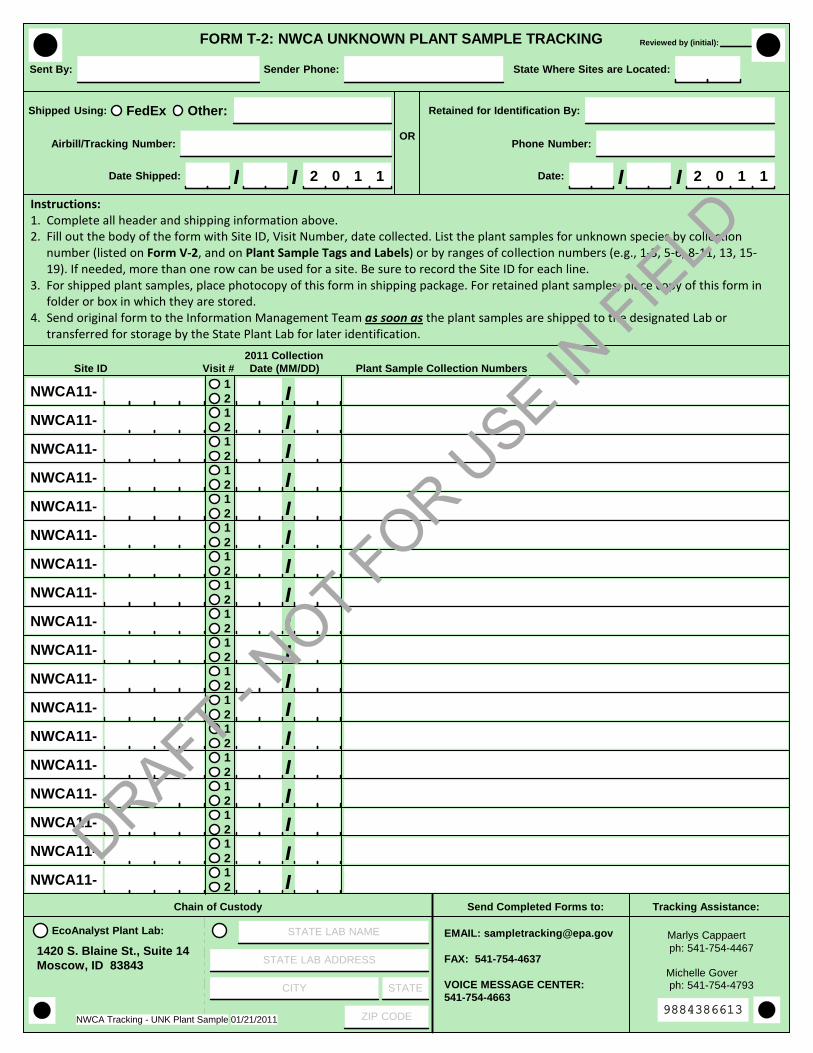
Chain of Custody Send Completed Forms to: Tracking Assistance:
2011 Collection Site ID Visit # Date (MM/DD) Plant Sample Collection Numbers
NWCA11-12 /
NWCA11-12 /
NWCA11-12 /
NWCA11-12 /
NWCA11-12 /
NWCA11-12 /
NWCA11-12 /
NWCA11-12 /
NWCA11-12 /
NWCA11-12 /
NWCA11-12 /
NWCA11-12 /
NWCA11-12 /
NWCA11-12 /
NWCA11-12 /
NWCA11-12 /
NWCA11-12 /
NWCA11-12 /
01/21/2011NWCA Tracking - UNK Plant Sample
FORM T-2: NWCA UNKNOWN PLANT SAMPLE TRACKING
Marlys Cappaert ph: 541-754-4467
Michelle Gover ph: 541-754-4793
Shipped Using: FedEx Other:
Sender Phone:Sent By:
Airbill/Tracking Number:
State Where Sites are Located:
Date Shipped: 2 0 1 1/ /
OR
Date: 2 0 1 1/ /
Phone Number:
Retained for Identification By:
EcoAnalyst Plant Lab:
Reviewed by (initial):
EMAIL: [email protected]
FAX: 541-754-4637
VOICE MESSAGE CENTER:541-754-4663
STATE LAB NAME
STATE LAB ADDRESS
CITY STATE
ZIP CODE
1420 S. Blaine St., Suite 14Moscow, ID 83843
Instructions: 1. Complete all header and shipping information above. 2. Fill out the body of the form with Site ID, Visit Number, date collected. List the plant samples for unknown species by collection
number (listed on Form V‐2, and on Plant Sample Tags and Labels) or by ranges of collection numbers (e.g., 1‐3, 5‐6, 8‐11, 13, 15‐19). If needed, more than one row can be used for a site. Be sure to record the Site ID for each line.
3. For shipped plant samples, place photocopy of this form in shipping package. For retained plant samples, place copy of this form in folder or box in which they are stored.
4. Send original form to the Information Management Team as soon as the plant samples are shipped to the designated Lab or transferred for storage by the State Plant Lab for later identification.
9884386613
DRAFT - NOT FOR U
SE IN FIE
LD
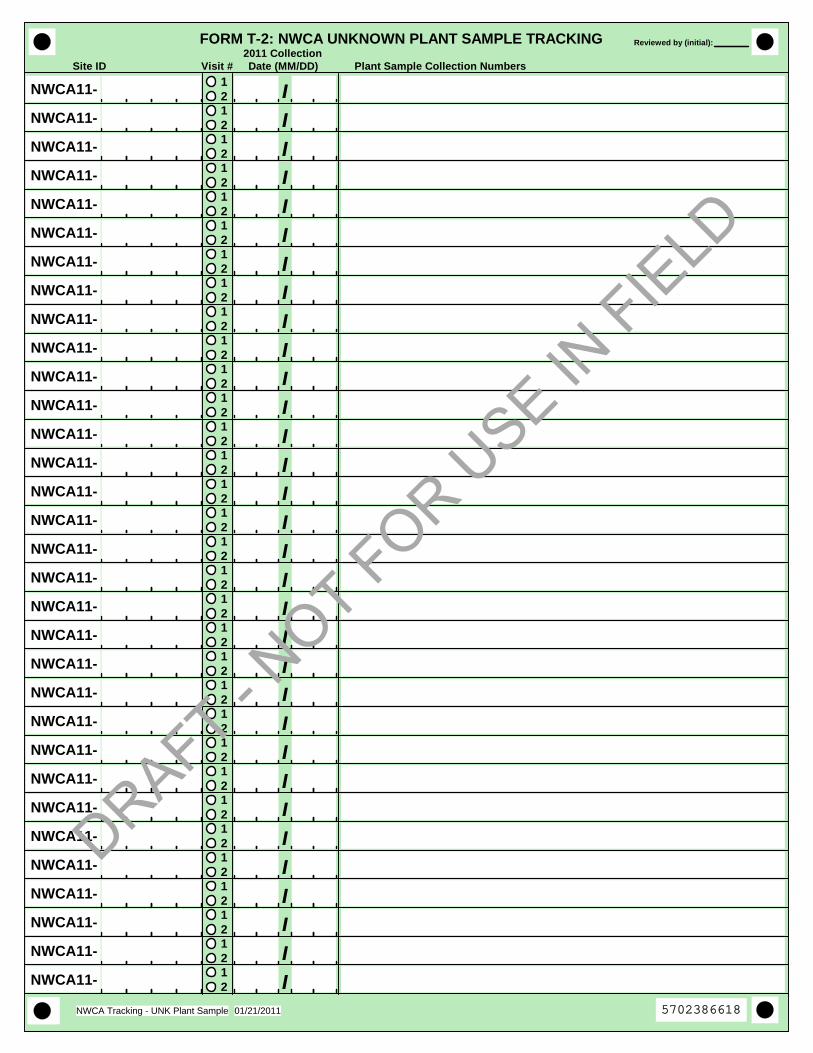
NWCA11-12 /
NWCA11-12 /
NWCA11-12 /
NWCA11-12 /
NWCA11-12 /
NWCA11-12 /
NWCA11-12 /
NWCA11-12 /
NWCA11-12 /
NWCA11-12 /
NWCA11-12 /
NWCA11-12 /
NWCA11-12 /
NWCA11-12 /
NWCA11-12 /
NWCA11-12 /
NWCA11-12 /
NWCA11-12 /
NWCA11-12 /
NWCA11-12 /
NWCA11-12 /
NWCA11-12 /
NWCA11-12 /
NWCA11-12 /
NWCA11-12 /
NWCA11-12 /
NWCA11-12 /
NWCA11-12 /
NWCA11-12 /
NWCA11-12 /
NWCA11-12 /
NWCA11-12 /
2011 Collection Site ID Visit # Date (MM/DD) Plant Sample Collection Numbers
01/21/2011NWCA Tracking - UNK Plant Sample
FORM T-2: NWCA UNKNOWN PLANT SAMPLE TRACKING Reviewed by (initial):
5702386618
DRAFT - NOT FOR U
SE IN FIE
LD
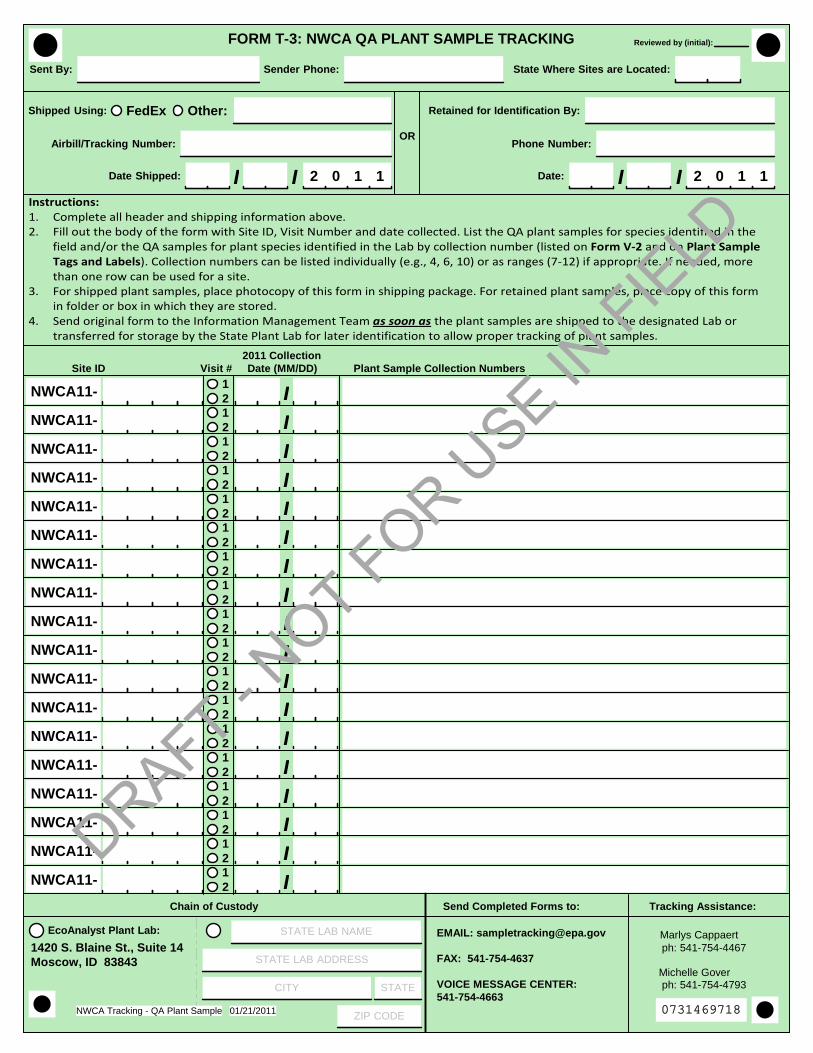
NWCA11-12 /
NWCA11-12 /
NWCA11-12 /
NWCA11-12 /
NWCA11-12 /
NWCA11-12 /
NWCA11-12 /
NWCA11-12 /
NWCA11-12 /
NWCA11-12 /
NWCA11-12 /
NWCA11-12 /
NWCA11-12 /
NWCA11-12 /
NWCA11-12 /
NWCA11-12 /
NWCA11-12 /
NWCA11-12 /
2011 Collection Site ID Visit # Date (MM/DD) Plant Sample Collection Numbers
01/21/2011NWCA Tracking - QA Plant Sample
FORM T-3: NWCA QA PLANT SAMPLE TRACKING
Shipped Using: FedEx Other:
Sender Phone:Sent By:
Airbill/Tracking Number:
State Where Sites are Located:
Date Shipped: 2 0 1 1/ /
OR
Date: 2 0 1 1/ /
Phone Number:
Retained for Identification By:
Reviewed by (initial):
Marlys Cappaert ph: 541-754-4467
Michelle Gover ph: 541-754-4793
Chain of Custody Send Completed Forms to: Tracking Assistance:
EMAIL: [email protected]
FAX: 541-754-4637
VOICE MESSAGE CENTER:541-754-4663
STATE LAB NAME
STATE LAB ADDRESS
CITY STATE
ZIP CODE
EcoAnalyst Plant Lab:
1420 S. Blaine St., Suite 14Moscow, ID 83843
Instructions: 1. Complete all header and shipping information above. 2. Fill out the body of the form with Site ID, Visit Number and date collected. List the QA plant samples for species identified in the
field and/or the QA samples for plant species identified in the Lab by collection number (listed on Form V‐2 and on Plant Sample Tags and Labels). Collection numbers can be listed individually (e.g., 4, 6, 10) or as ranges (7‐12) if appropriate. If needed, more than one row can be used for a site.
3. For shipped plant samples, place photocopy of this form in shipping package. For retained plant samples, place copy of this form in folder or box in which they are stored.
4. Send original form to the Information Management Team as soon as the plant samples are shipped to the designated Lab or transferred for storage by the State Plant Lab for later identification to allow proper tracking of plant samples.
0731469718
DRAFT - NOT FOR U
SE IN FIE
LD
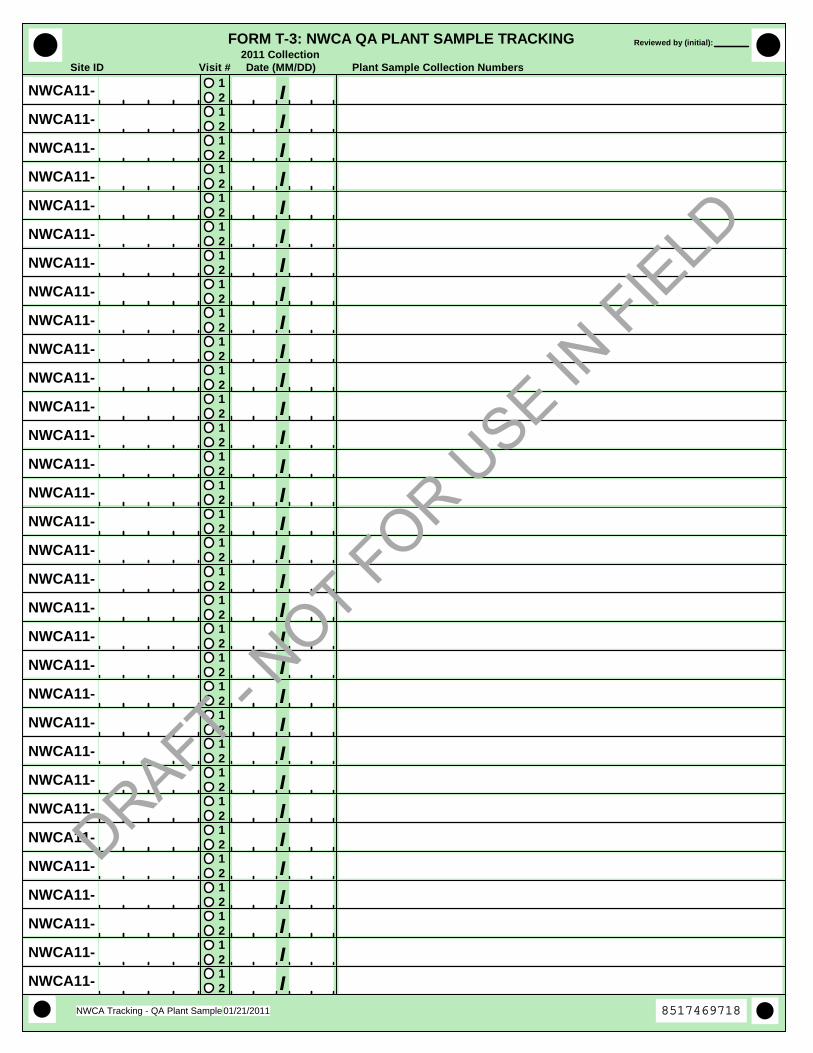
2011 Collection Site ID Visit # Date (MM/DD) Plant Sample Collection Numbers
01/21/2011NWCA Tracking - QA Plant Sample
FORM T-3: NWCA QA PLANT SAMPLE TRACKING
NWCA11-12 /
NWCA11-12 /
NWCA11-12 /
NWCA11-12 /
NWCA11-12 /
NWCA11-12 /
NWCA11-12 /
NWCA11-12 /
NWCA11-12 /
NWCA11-12 /
NWCA11-12 /
NWCA11-12 /
NWCA11-12 /
NWCA11-12 /
NWCA11-12 /
NWCA11-12 /
NWCA11-12 /
NWCA11-12 /
NWCA11-12 /
NWCA11-12 /
NWCA11-12 /
NWCA11-12 /
NWCA11-12 /
NWCA11-12 /
NWCA11-12 /
NWCA11-12 /
NWCA11-12 /
NWCA11-12 /
NWCA11-12 /
NWCA11-12 /
NWCA11-12 /
NWCA11-12 /
Reviewed by (initial):
8517469718
DRAFT - NOT FOR U
SE IN FIE
LD