Embed Size (px)
Citation preview

FDIC CommunIty BankIng StuDy ■ DeCemBer 2012 6–1
Chapter 6 - Capital Formation at Community Banks
OverviewThis chapter discusses the role of capital at community banks, with a focus on how community banks build their capital over time. First, the role of retained earnings as a source of capital is discussed and the rate of earnings retention is compared across various types of banks. Next is a discussion of capital raising from external sources. While this strategy for adding to capital is used less frequently than earnings retention, the discussion shows that community banks have been able to raise external capital when needed.
Long-Term Trends in Bank Capital RatiosCapital is generally measured relative to a bank’s assets and risk exposures. The most basic measure is the leverage ratio, which measures common equity, certain types of preferred equity and retained earnings as a percentage of total assets. Beyond this basic measure, perhaps the most frequently cited is the total risk-based capital ratio, which uses a broader regulatory definition of capital in the numerator and adjusts total assets in the denominator to reflect a range of on- and off-balance-sheet risk exposures.
Based on either the leverage ratio or total risk-based capi-tal, community banks consistently maintained higher capi-tal levels than noncommunity banks over the study period (Charts 6.1 and 6.2). Capital levels at both community and noncommunity banks increased sharply in the early 1990s as the industry recovered from the banking and thrift crisis that began in the 1980s and as banks conformed to new capital standards under the first Basel capital agree-ment and Prompt Corrective Action (PCA).1 Leverage capital ratios for both groups rose more gradually during the years between the banking crises that bookend the study period, as the industry posted record earnings. Aver-age leverage capital ratios fell—for noncommunity banks
1 Prompt Corrective Action, or PCA, refers to the provision of the Federal Deposit Insurance Corporation Improvement Act of 1991 that requires bank supervisors to take certain action in the event a bank falls below the definition of “well-capitalized” as defined by regulation. Under PCA, a bank is categorized as well-capitalized if it has a total risk-based capital ratio of 10 percent or greater; has a Tier 1 risk-based capital ratio of 6 percent or greater; and has a leverage ratio of 5 percent or greater. The bank also must not be subject to any written agreement, order, capital directive, or prompt corrective action direc-tive to meet and maintain a specific capital level for any capital measure. See Part 325 of the FDIC Rules and Regulations http://www.fdic.gov/regulations/laws/rules/2000-4500.html#fdic2000part325103.
in 2007 and 2008, and for community banks in 2008 and 2009—around the onset of the recent crisis before rising again as capital flowed in both from government programs and private sources.
By contrast, the average total risk-based capital ratio actu-ally declined steadily for community banks during the years between banking crises, as risk-weighted assets rose faster than equity capital. Still, the total risk-based capital ratio remained higher at community banks than at noncommunity banks throughout this period. The total risk-based capital ratio rose sharply for both groups in the wake of the recent financial crisis as the industry raised capital and shed higher-risk assets. By the end of 2011, the total risk-based capital ratios for both groups exceeded 15 percent and were approaching historic highs.
Sources of Capital for Community and Noncommunity Banks Capital formation at banks takes place through two main channels.2 The first is the internal generation of new capi-tal through retained earnings. Retained earnings are the amount of net income remaining after common and preferred dividends are paid. To the extent that most banks report positive earnings each year, they are usually in a position not only to pay dividends to their sharehold-ers, but also to add to their capital stock through retained
2 Although the term capital formation is frequently used in national income accounting to describe increases in the stock of physical capi-tal, it is used here to represent additions to equity capital by individual financial institutions.
Chart 6.1
0%
5%
10%
15%
20%
1985 1990 1995 2000 2005 2010
Community Banks
Noncommunity Banks
Source: FDIC.
Leverage Capital Ratio, Federally Insured Community and Noncommunity Banks, 1985-2011
Leverage Capital Ratio, Weighted Average for Group, at Year-End

FDIC CommunIty BankIng StuDy ■ DeCemBer 2012 6–2
earnings. The second channel through which capital formation takes place at banks is raising of capital from external sources.3
Table 6.1 and Charts 6.3 and 6.4 break down the total changes in equity capital from retained earnings and external capital at community and noncommunity banks during the study period. Community banks were much
3 It should be noted that banks report other changes to equity capital, some of which are relatively large, but they do not represent net capital formation and are not part of the analysis in this chapter.
One is “Changes Incident to Business Combinations,” which occurs when a bank purchases or combines with another bank or business or, if certain conditions are met, is purchased but retains its separate corporate existence. The total reported effect of these changes over the 27-year study period is over $1 trillion at noncommunity banks and about $46 million at community banks. At banks that have acquired another bank or business, changes incident to business combinations represent the fair value of stock issued to execute the purchase (or the historical cost of the acquired entity’s equity capital at the end of the prior year in transactions during the study period—generally before July 1, 2001—accounted for as poolings of interests). While these changes incident to business combinations represent an increase in the capital of the acquiring bank, the increase is largely offset by the elimi-nation of equity capital at the target institution. For banks that have been acquired in transactions in which push-down accounting is applied, changes incident to business combinations generally represent the net difference (positive or negative) between the acquired bank’s capital at the end of the prior year and its equity capital as restated to reflect the purchase price of the bank’s stock acquired in the transac-tion and the fair value of any of the bank’s stock not acquired.
Another is “Other Comprehensive Income,” which represents changes in equity that are not due to capital contributions from or distributions to owners and that are not captured in net income. At most community banks, the most important component of other comprehensive income is the change in net unrealized gains or losses in available for-sale securities. Under current regulatory standards, accumulated other comprehensive income is included in a bank’s total equity as required by generally accepted accounting principles, but it is not included in any definitions of regulatory capital. Over the study period, other comprehensive income has totaled negative $6.1 billion at noncommu-nity banks and $3.4 billion at community banks.
more dependent on retained earnings for capital formation than noncommunity banks during the study period. Community banks obtained almost 48 percent of their total capital formation through retained earnings, compared with 29 percent for noncommunity banks. As a share of prior period equity, community banks and noncommunity banks increased capital through retained earnings by about 3.6 percent and 3.5 percent per year, respectively. However, increases from external capital raises represented an average of 5 percent of prior year equity at noncommunity banks, compared with only 3.5 percent at community banks.
While both community and noncommunity banks have become more dependent on external capital over the past decade, community banks continued to be almost twice as reliant as noncommunity banks on retained earnings as a source of increase in equity capital. In the last ten years, retained earnings made up 41 percent of additions to
Chart 6.2
0%
5%
10%
15%
20%
1985 1990 1995 2000 2005 2010
Community Banks
Noncommunity Banks
Total Risk-Based Capital Ratio, Federally Insured Community and Noncommunity Banks, 1990-2011
Source: FDIC.
Total Risk-Based Capital Ratio, Weighted Average for Group at Year-End
Not available prior to 1990
Chart 6.3
-10
-5
0
5
10
15
20
1985 1987 1989 1991 1993 1995 1997 1999 2001 2003 2005 2007 2009 2011
Raised From External SourcesRetained Earnings
Contributions to Annual Changes in Equity CapitalAll Community Banks
Source: FDIC.
As Percent of Equity Capital on Hand at Beginning of Year
Chart 6.4
-10
-5
0
5
10
15
20
1985 1987 1989 1991 1993 1995 1997 1999 2001 2003 2005 2007 2009 2011
Raised From External SourcesRetained Earnings
Contributions to Annual Changes in Equity Capital All Noncommunity Banks
Source: FDIC.
As Percent of Equity Capital on Hand at Beginning of Year

FDIC CommunIty BankIng StuDy ■ DeCemBer 2012 6–3
equity capital at community banks, compared with 23 percent at noncommunity banks.
Because of the large financial losses incurred during the recent crisis, both community and noncommunity banks had to offset three years of negative retained earnings (2007-2009 for noncommunity banks, 2008-2010 for community banks) with large volumes of capital raised from external sources. By 2011, as industry earnings began to normalize, both groups had managed to re-establish a more normal mix of additions to capital through internal and external sources.
Capital Formation Through Retained Earnings Most federally insured banks and thrift institutions report positive annual net income in most years. Of the more than 332,000 year-end financial reports submitted by feder-ally insured banks and thrifts since 1985, more than 291,000, or 88 percent, showed positive earnings for the year, with the remainder reporting zero or negative net income (see Table 6.2). In all, the total annual net income reported by all federally insured banks and thrifts since 1985 has amounted to $1.67 trillion.
For the industry as a whole, most of this net income was paid out to common and preferred shareholders in the form of dividends. Of all federally insured banks and thrifts with stock charters that reported during the study period, 71 percent reported dividend payments. Banks organized as mutual institutions have no stockholders and typically do not pay dividends. (For a fuller discussion of bank ownership structures, see the inset box “Bank Ownership Structure and Access to External Capital.”) In total, banks and thrifts paid out almost $1.26 trillion in dividends over the study period, for an aggregate industry dividend payout rate of 75 percent. The average payout rate over the study period was 58 percent of net income for community banks, substantially lower than the 78 percent rate for noncommunity banks. More than 60 percent of the year-end financial reports filed by all federally insured stock institutions during the study period showed both positive retained earnings and dividends.
Banks face a balancing act between adding to their capital base through retained earnings and paying regular divi-dends. In the 80 percent of total year-end financial reports where net income was larger than dividends paid during the study period, total additions to equity capital through retained earnings amounted to $942 billion. By contrast, in the 20 percent of all year-end reports where dividends
Table 6.1 Total Additions to Equity Capital Through Retained Earnings and New Capital Raised From External Sources, 1985-2011
Group
Additions to Capital Through:
TotalRetained EarningsNew Capital Raised From
External Sources$ Billions % of Total $ Billions % of Total $ Billions
Community Banks $116 48% $127 52% $243Noncommunity Banks $303 29% $734 71% $1,037Total $419 33% $861 67% $1,280Source: FDIC.
Chart 6.5
-10%
0%
10%
20%
30%
40%
50%
60%
70%
80%
90%
1985 1987 1989 1991 1993 1995 1997 1999 2001 2003 2005 2007 2009 2011
Noncommunity Banks
Community Banks
Community Banks With Positive Net Income Consistently Retaina Higher Percent of Earnings Than Noncommunity Banks
Retained Earnings as Percent of Annual Net Income for Banks With Positive Net Income
Source: FDIC.
Bank Ownership Structure and Access to External Capital
Banks can be organized either as stock corporations or as mutual institutions. In a stock corporation, an owner’s interest in the company is represented by shares of stock.
There are two main forms of stock ownership, S corpo-rations and C corporations. Banks and thrifts were made eligible to choose the Subchapter S form of ownership in 1996. Subchapter S status allows qualify-ing organizations to enjoy the limited liability of corpo-rations while passing their tax liability directly to

FDIC CommunIty BankIng StuDy ■ DeCemBer 2012 6–4
shareholders.1 Because Subchapter S status includes restrictions on the number and type of shareholders, banks organized as S corporations may be limited in their ability to raise capital from new investors. Those stock corporations that have not chosen S corporation status are commonly referred to as C corporations. C corpora-tions are subject to taxation of earnings at the corporate level in addition to taxation of any dividends distributed to shareholders. However, because C corporations are not subject to the same legal limits on shareholders, they have more flexibility than S corporations in seeking capi-tal from new investors.
Under the mutual form of ownership, there are no share-holders; the bank is owned by its depositors and typically managed by trustees. Most mutual institutions are located in the northeastern United States, where mutual savings banks have a long history. Because mutual institutions do not issue stock, their options for increasing capital are generally limited to retained earnings.
The vast majority of community banks hold stock char-ters (Chart 6.6). C corporations represent the largest number of community banks, as they made up about 41 percent of community banks at year-end 2011. However, a significant number have chosen the Subchapter S form of ownership. The number of community banks organized as S corporations increased from 598 (6 percent of all community banks) in 1997 to 2,278 (34 percent) at the end of 2011. The share of community banks holding mutual charters has gradually declined over time, from 15 percent in 1984 to just under 7 percent in 2011.
Most banks operate within bank holding companies, which typically own all or most of the common stock of
1 The Small Business Job Protection Act of 1996 amended the Inter-nal Revenue Code to allow qualifying financial institutions to elect Subchapter S status for federal income tax purposes. To qualify as an “S corporation,” a bank or thrift must qualify as a “small business corporation” under section 1362(a) of Title 26. See 26 U.S.C. § 1361(a)(1). There are five requirements that must be met to qualify as a “small business operation.” They are: (i) the institution must not use the reserve method of accounting for bad debts described in 26 U.S.C. § 585; (ii) the institution must not have more than 100 shareholders; (iii) the institution must not have as a shareholder a person who is not an individual, except as permitted by 26 U.S.C. § 1361(c); (iv) the institu-tion must not have as a shareholder a nonresident alien; and (v) the institution must not have more than one class of stock. See 26 U.S.C. § 1361(b)(1)-(2). For purposes of determining how many shareholders a bank or thrift has, a husband and wife, and all members of a family, shall be treated as one shareholder. See 26 U.S.C. § 1361(c)(1). For purposes of determining how many classes of stock a bank or thrift has, “a corporation shall not be treated as having more than 1 class of stock solely because there are differences in voting rights among the shares of common stock.” 26 U.S.C. § 1361(c)(4).
one or more subsidiary banks.2 To the extent that outside capital is sought by a subsidiary bank, the holding company is almost always the vehicle for raising that capital from existing or new shareholders. Funds can then be “downstreamed” to subsidiary banks. In cases where a single bank holding company operates a number of indi-vidual banking subsidiaries, issuance by the holding company not only allows for the centralization of capital raising, but it may also confer the advantage of stock issu-ance by a larger entity with a greater presence in the capital markets. Before the relaxation of state branching restrictions and limits on interstate banking in the 1980s and 1990s, bank holding companies were often used to operate geographically dispersed banking franchises through multiple charters. However, as described in Chapter 2, the relaxation of these restrictions led to a wave or mergers and consolidations that greatly reduced the total number of federally insured bank and thrift charters.
Most noncommunity banks belong to organizations that are publicly traded. At year-end 2011, about 65 percent of noncommunity bank charters, representing 92 percent of
2 At year-end 2011, at least 333 community banks and 59 noncommu-nity banks were in thrift holding companies. Because complete data for thrift holding companies were not available, thrift holding compa-nies were not used to group organizations for purposes of this study. Thrift holding companies are diverse, ranging from noncomplex companies with limited activities to complex, multinational corpora-tions. Unlike bank holding companies, thrift holding companies are not yet subject to consolidated capital requirements.
Also, a small segment of the industry consists of mutual holding companies. There were over 150 mutual holding companies operating at the end of 2011. Mutual holding companies are formed to permit some stock ownership in a bank that was previously entirely mutually owned. Shareholders, who own a percentage of the holding company, elect part of the board, and depositors elect the remainder. In these structures, the subsidiary banks are stock banks that are wholly owned by the mutual holding company.
Chart 6.6
0
2,000
4,000
6,000
8,000
10,000
12,000
14,000
16,000
18,000
1984 1989 1994 1999 2004 2009
Mutual
S Corp
C Corp
Community Banks by Ownership Type, 1984-2011
Source: FDIC.
Number of Federally Insured Bank and Thrift Charters

FDIC CommunIty BankIng StuDy ■ DeCemBer 2012 6–5
Table 6.2 Federally Insured Banks and Thrifts Reporting Positive Net Income, Dividends and Retained Earnings by Ownership Type, 1985-2011
Community Banks
Ownership Type
Percent of Year-End Financial Reports With:
Net Income > 0
Retained Earnings > 0
Dividend > 0
Dividend and Retained Earnings
> 0
Dividend > 0 and Dividend >
Net IncomeStock 88% 80% 72% 62% 10%Mutual 88% 88% 0% 0% 0%Total 88% 81% 65% 56% 9%
Noncommunity Banks
Ownership Type
Percent of Year-End Financial Reports With:
Net Income > 0
Retained Earnings > 0
Dividend > 0
Dividend and Retained Earnings
> 0
Dividend > 0 and Dividend >
Net IncomeStock 87% 73% 67% 50% 17%Mutual 81% 80% 3% 2% 1%Total 87% 73% 66% 50% 17%Source: FDIC.Note: Mutuals may issue preferred stock and pay cash dividends in exceptional cases.
Chart 6.7
0%
10%
20%
30%
40%
50%
60%
70%
80%
1985 1987 1989 1991 1993 1995 1997 1999 2001 2003 2005 2007 2009 2011
C Corporations
S Corporations
Community Banks That Have Adopted S Corporation StatusRetain a Smaller Portion of Earnings Than C Corporations
Retained Earnings as Percent of Annual Net Income for Community Banks With Positive Net Income
Source: FDIC.
Banks were not eligible to elect S Corporation status prior to 1996.
Chart 6.8
0%
10%
20%
30%
40%
50%
60%
70%
80%
90%
1985 1987 1989 1991 1993 1995 1997 1999 2001 2003 2005 2007 2009 2011
Headquartered in Metro Counties
Headquartered in Nonmetro Counties
Community Banks Headquartered in Metro Counties Have Consistently Retained a Higher Percentage of Earnings Than
Nonmetro Banks Retained Earnings as Percent of Annual Net Income for Community Banks With Positive Net Income
Source: FDIC.
noncommunity bank assets, were publicly traded or were subsidiaries of publicly traded companies.3 As a result, the shares of these companies tend to be relatively liquid, and their banks have ready access to additional capital through issuance of new shares.
Compared with noncommunity banks, the shares of community banks are more likely to be privately owned and closely held. At year-end 2011, an estimated 84 percent of community banks were privately held. The remaining 16 percent, representing about 34 percent of
3 FDIC calculations based on data from SNL Financial. For purposes of this analysis, publicly traded institutions are considered to be compa-nies that are either traded on a major exchange or in over-the-counter trading. The vast majority of publicly traded noncommunity banking organizations are listed for trading on major exchanges. Privately held banks are considered to be part of institutions that are not traded on a major exchange or in over-the-counter trading.
community bank assets, were in organizations that were publicly traded—though typically not on major exchang-es.4 As a result, even the publicly traded shares of community banks tend to be less liquid than the shares of noncommunity banks.
4 Of those remaining 16 percent, only about one-third (5 percent of all community banks, representing 21 percent of community bank assets) belonged to organizations listed for trading on a major exchange. Source: FDIC calculations based on data from SNL Financial.
FDIC CommunIty BankIng StuDy ■ DeCemBer 2012 6–6
exceeded net income, the amount of negative retained earnings amounted to $525 billion. Thus, the net addition to total industry equity capital through retained earnings during the study period was $417 billion.
The Importance of Retained Earnings for Community Banks. There are important differences between commu-nity and noncommunity banks in the allocation of net income between dividends and retained earnings. These differences can be seen most clearly in the case of institu-tions reporting positive net income for the year. Chart 6.5 depicts how profitable community and noncommunity banks allocated net income to retained earnings in each year of the study period. It shows that profitable commu-nity banks consistently retained a higher percentage of current earnings than noncommunity institutions. On a weighted average basis for the entire study period, profit-able community banks retained 57 percent of net income, compared with just 34 percent for noncommunity institutions.
Chart 6.5 also illustrates that retained earnings as a percent of net income have generally trended downward over most of the study period. Retained earnings as a
percent of net income clearly fell during crisis episodes. However, looking at how different groups of community banks allocate net income between dividends and retained earnings also helps to explain this trend.
There are important differences in earnings retention between community banks organized as mutual organiza-tions, C corporations and S corporations. As noted earlier, mutual organizations by definition retain virtually 100 percent of net income as retained earnings. Both C corpo-
Table 6.3 Weighted Average Retained Earnings as a Percent of Annual Net Income for Community Banks With Positive Net Income by Lending Specialty Group, 1985-2011
All Community Banks
Lending Specialty Group
Time PeriodFive-Year Intervals
2011
All Years: 1985- 2011
1986-1990
1991- 1995
1996-2000
2001-2005
2006-2010
Mortgage Specialists 88.9% 78.7% 53.9% 57.6% 55.8% 65.4% 68.9%CRE Specialists 80.9% 72.2% 58.2% 58.8% 51.2% 66.7% 58.2%C&I Specialists 56.3% 63.5% 57.1% 47.9% 42.7% 72.3% 55.3%Consumer Specialists 51.0% 61.8% 39.6% 48.3% 47.2% 33.0% 51.0%Agricultural Specialists 52.3% 48.8% 37.0% 37.0% 39.9% 49.1% 41.9%Multi-Specialists 76.0% 65.3% 56.6% 56.5% 51.3% 55.8% 59.0%No Specialty 56.5% 58.0% 46.7% 44.2% 33.9% 52.8% 49.6%Total 69.0% 65.8% 51.2% 52.8% 46.8% 58.7% 56.8%
Community Banks Organized as C Corporations
Lending Specialty Group
Time PeriodFive-Year Intervals
2011
All Years: 1985- 2011
1986-1990
1991- 1995
1996-2000
2001-2005
2006-2010
CRE Specialists 78.3% 70.0% 60.6% 64.3% 57.4% 73.3% 63.2%C&I Specialists 56.3% 63.5% 61.7% 53.3% 49.3% 83.2% 58.7%Mortgage Specialists 73.0% 66.3% 38.8% 43.8% 43.5% 56.0% 52.9%Consumer Specialists 50.9% 61.7% 41.1% 50.8% 59.0% 35.5% 52.6%Agricultural Specialists 52.3% 48.8% 42.8% 47.6% 50.0% 64.0% 48.4%Multi-Specialists 70.4% 62.8% 59.0% 60.7% 56.8% 60.1% 61.5%No Specialty 55.3% 57.1% 48.4% 47.5% 37.1% 58.0% 51.6%Total 60.9% 60.5% 49.4% 54.9% 50.6% 63.6% 55.7%Source: FDIC.
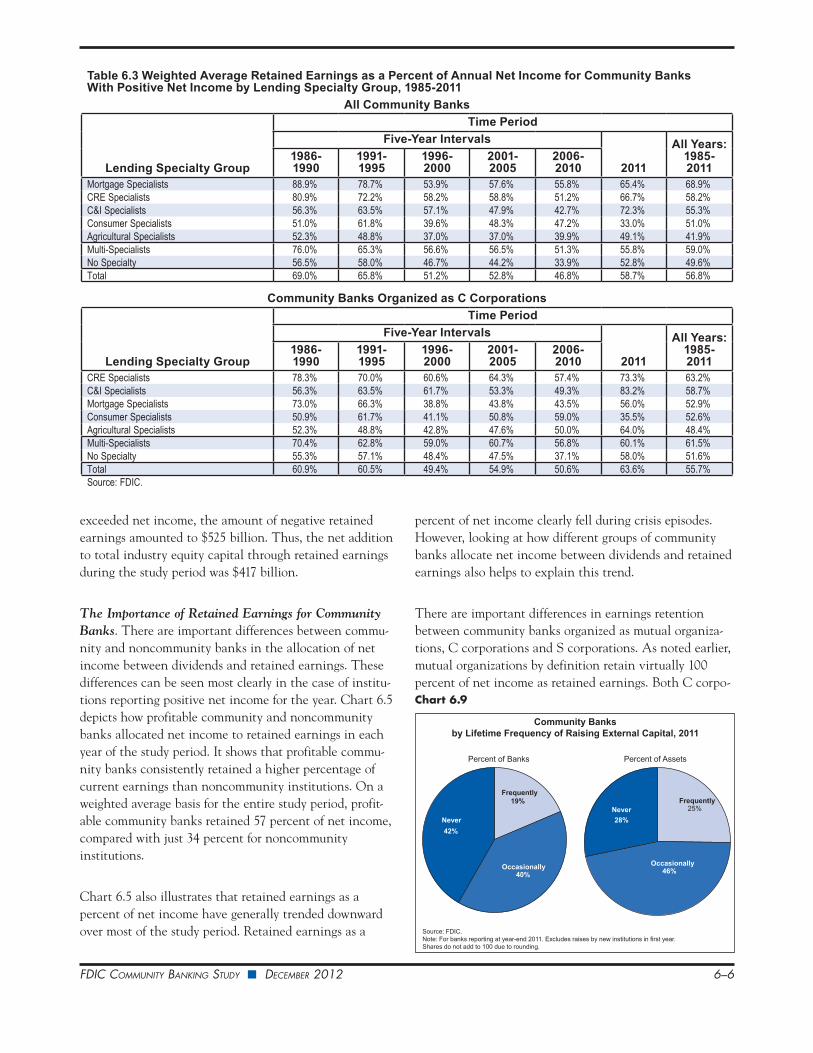
Chart 6.9
Community Banksby Lifetime Frequency of Raising External Capital, 2011
Percent of Banks Percent of Assets
Source: FDIC.Note: For banks reporting at year-end 2011. Excludes raises by new institutions in first year. Shares do not add to 100 due to rounding.
Never 28%
Occasionally46%
Frequently25%
Never 42%
Frequently19%
Occasionally40%

FDIC CommunIty BankIng StuDy ■ DeCemBer 2012 6–7
rations and S corporations may pay dividends, but retained earnings are generally substantially higher at C corpora-tions (Chart 6.7). One factor that contributes to this differ-ence is that the tax obligations of banks organized as S corporations are passed through to shareholders. A higher dividend payout rate, and a correspondingly smaller percentage of income retained, is a means by which a bank organized as an S corporation can provide shareholders with the cash needed to cover these tax obligations.
A smaller, yet still consistent, difference can be observed in the percentage of net income retained by community banks headquartered in metro and nonmetro counties (Chart 6.8). In every year, profitable community banks headquartered in metro counties retained a higher percent-age of net income than community banks headquartered in nonmetro counties. For the entire study period, the metro community banks with positive earnings retained 60 percent of their net income on a weighted average basis, compared with 48 percent for nonmetro community banks. Community banks operating in metro areas have a higher overall rate of asset growth and therefore have a greater incentive to add to capital through retained earnings. Over the study period, community banks headquartered in metro counties grew at a weighted average annual rate of 8.4 percent, versus 6.8 percent for community banks head-quartered in nonmetro counties.
Table 6.3 shows five-year annual averages for retained earnings as a percent of net income for profitable commu-nity banks by the lending specialty groups introduced in Chapter 5. The highest overall rates of retained earnings are found among mortgage specialists (69 percent for the entire study period), followed by CRE specialists and multi-specialists. Higher retained earnings for mortgage special-ists are largely explained by the fact that mutual institutions, which typically retain 100 percent of net income, are more prevalent among mortgage specialists than among community banks in general. In fact, mort-gage specialists with stock charters typically have lower retained earnings than community banks with other lend-ing specialties that have stock charters.
Meanwhile, the lowest percentages for retained earnings are found among agricultural specialists (42 percent of net income for the entire study period). An important factor driving this low rate of earnings retention is the preva-lence of S corporations, which made up 58 percent of agri-cultural lending specialists in 2011, compared with 34 percent of all community banks. For the remaining lend-
ing specialties, the split between dividends and retained earnings among profitable community banks was generally even.
Capital Formation by Accessing External Sources The second main source of capital for both community and noncommunity banks is from external sources. Exter-nal capital raises include both the issuance of new equity instruments to investors by a bank and, more commonly, the downstreaming of funds from a holding company to a bank subsidiary, which may or may not be associated with the issuance of equity or debt by the holding company. Just over 10 percent of the year-end financial reports filed by all banks during the study period showed material increases in equity capital from external sources.4 When community banks raise capital from external sources,
4 This study sought to isolate increases in bank capital that originated outside insured banks by identifying possible stock sales or funds downstreamed from a holding company. To do this, the study examined Call Report and Thrift Financial Report line items that report the sale, conversion, acquisition, or retirement of capital stock and other bank transactions with their parent holding companies. The study isolated increases in bank capital stock and surplus from these sources as capi-tal raises. However, many values reported in these items are very small and may not be appropriate to include in the definition of a capital raise. In fact, for one-third of community banks that reported positive values for these items in the years 1985 through 2011, the amount reported accounted for less than 0.25 percent of bank assets reported the year before the raise. To eliminate de minimis raises, this study considers a capital raise to be an increase in capital stock and surplus that exceeds 0.25 percent of the bank’s prior-year assets.
These data are reported in the Call Report on Schedule RI-A, Changes in Bank Equity Capital. They are found in the following line items:
“5. Sale, conversion, acquisition, or retirement of capital stock, net
6. Treasury stock transactions, net
11. Other transactions with parent holding company“
In addition to capital from investors, other transactions with parent holding company (line item 11) may include funds received from selling affiliate banks, selling branches, selling real estate to the holding company and other non stock transactions.
These data are reported in the Thrift Financial Report in the following schedules and line items:
Schedule SI, Supplemental Information, reported 1996 through 2011: Stock issued (SI640) - Stock Retired (SI650).
Schedule CA, Capital, reported 1990 through 1995: Perpetual Preferred Stock Issued (CA120) - Perpetual Preferred Stock Retired (CA130) - Common Stock Issued (CA220) - Common Stock Retired (CA230) - Treasury Stock Acquired (CA240) + Other Adjustments (CA250).
Schedule SI, Supplemental Information, reported 2004 through 2011: Capital Contributions (SI655).
The definition also includes the beginning capital reported by new entrants, defined as total equity less any reported retained earnings.

FDIC CommunIty BankIng StuDy ■ DeCemBer 2012 6–8
many do so through private placements that are subscribed by the current owners and directors of the bank or other local investors who have unique knowledge of and interest in the institution.
A 2012 report by the Government Accountability Office (GAO) analyzed sources of capital for small banks.5 The GAO found that a majority of banks they surveyed expressed confidence that they could raise new capital from their board members or members of their communi-ty.6 Far smaller percentages expressed confidence that they could successfully raise capital by issuing common stock through either a public offering or a private placement. According to estimates by the GAO for its report, 27 percent of banks surveyed thought they could raise capital through a public common stock offering while 46 percent thought they could raise capital through a private place-ment.7 However, the survey found that most community
5 Hybrid Capital Instruments and Small Institution Access to Capital, Government Accountability Office, January 2012, p. 57 and 67. The GAO sampled 794 stand-alone banks and thrifts (those with no holding company) and top-level bank holding companies and thrift holding companies with total assets of less than $10 billion out of a universe of 6,733 institutions. The survey was conducted from June 15, 2011, to August 15, 2011. The GAO reports that it received valid responses from 510 (64 percent) out of the 794 sampled institutions. For more informa-tion about the GAO’s methodology for designing and distributing the survey, see Appendix I of the GAO Report. 6 Ibid, Table 10: p. 67. The combined total of “Very likely” and “Some-what likely” (70 percent). 7 Ibid, Table 10: p. 67. The combined total of “Very likely” and “Some-what likely” for public offering (27 percent) and private placement (46 percent).
banks have been able to raise external capital when it has been necessary to do so.8
Raising of External Capital by New Charters. Newly chartered institutions require an adequate level of starting capital to commence operations. During the study period, a total of 3,649 new community banks were chartered.9 In total, these new community banks reported $25.5 billion in total equity capital at the end of their first year of oper-ation, along with negative retained earnings of $3.2 billion. Netting out these two figures results in an estimated $28.7 billion in equity capital that was presumably raised from external sources. The weighted average year-end leverage ratio for these new community banks was 22.2 percent, much higher than the industry averages depicted in Chart 6.1.10
Raising of External Capital by Existing Institutions. After banks have advanced past their first year of opera-tions, they may choose to raise additional capital from external sources. These “existing” community banks may
8 Ibid, p. 48. A Majority of Smaller Institutions Report No Unmet Capital Need
“Most smaller institutions have not raised capital since January 1, 2008, and the majority of those reported no need for or interest in addi-tional capital (see fig. 10). Specifically, we estimate that 65 percent of smaller institutions have not raised capital since January 1, 2008, and 88 percent of those did not need or want to raise more regulatory capi-tal. Only 3 percent of smaller institutions that had not raised capital since January 1, 2008, attempted to raise capital but were unable to do so.”9 This figure includes only new charters that did not exist in any other form (such as uninsured status) prior to becoming a federally insured bank or thrift.10 Newly chartered institutions are frequently required to carry higher levels of capital at inception than regulatory minimums because it often takes several years for them to become profitable.
Chart 6.10
0%
10%
20%
30%
40%
50%
1985 1987 1989 1991 1993 1995 1997 1999 2001 2003 2005 2007 2009 2011
Occasional
Frequent
A Relatively Small Percentage of Community Banks Raises Capital From External Sources in Any Given Year
Source: FDIC. Note: Excludes institutions in their first year of existence.
Community Banks Raising Capital as a Percent of Existing Community Banks
By Lifetime Frequency of Capital Raising:
Chart 6.11
0%
10%
20%
30%
40%
50%
1985 1987 1989 1991 1993 1995 1997 1999 2001 2003 2005 2007 2009 2011
Occasional
Frequent
Noncommunity Banks Have Raised External Capital With Greater Frequency Than Community Banks
Source: FDIC. Note: Excludes institutions in their first year of existence.
Noncommunity Banks Raising Capital as a Percent of Existing Noncommunity Banks
By Lifetime Frequency of Capital Raising:

FDIC CommunIty BankIng StuDy ■ DeCemBer 2012 6–9
be categorized into three groups according to the frequency with which they raised capital from external sources during the study period. The first such category includes community banks that never raised material amounts of capital from external sources. Community banks that have raised capital from external sources can be further divided into two additional groups: those that raised capital occasionally and those that did so frequently. The “frequent raisers” are defined as those that raised external capital more than one time and did so in more than 20 percent of the years they operated during the study period. “Occasional raisers” are defined as those banks that raised external capital at least once but in no more than 20 percent of the years they operated.
Chart 6.9 shows the percent of community banks and their total assets that fall into each of these three capital raising categories in 2011. It shows that 42 percent of community banks, with 28 percent of community bank assets, have never raised material amounts of capital from external sources after their first year of operation. Another 40 percent of community banks, with 46 percent of community bank assets, can be considered occasional rais-ers, while another 19 percent of community bank charters with 25 percent of total assets can be considered frequent raisers. This breakdown shows that a relatively small proportion of community banks count on the ability to add to their capital by accessing external sources on a regular basis.
Charts 6.10 and 6.11 track the percent of existing commu-nity and noncommunity banks, respectively, that raised capital from external sources each year, and indicates whether they were frequent or occasional raisers. Chart
6.10 shows that in the early years of the study period, the percentage of all community banks that raised external capital each year remained relatively small, never exceed-ing 10 percent until 2002. However, this percentage increased somewhat after 2000, and then rose further after the onset of the financial crisis in 2008. In all, 61 percent of the instances of community banks raising external capi-tal during the study period involved frequent raisers, the group that also made up more than half of raisers in every year after 1986.
A similar time path of capital raising can be observed for noncommunity banks in Chart 6.11. Noncommunity banks raised external capital more frequently than community banks in every year, and nearly twice as frequently on a weighted average basis over the entire study period. Capital raises by noncommunity banks were also dominated by frequent raisers, which made up 65 percent of the instances of capital raising by noncommu-nity banks during the study period.
Charts 6.12 and 6.13 track the volumes of external capital raised by community and noncommunity banks by year relative to their equity capital at the end of the prior year. Over the entire study period, community banks raised an average of 3.5 percent of their prior-year equity, while noncommunity banks raised an average of 5 percent. The volumes raised by community banks relative to equity rose at community banks in the middle 2000s, while both community and noncommunity banks raised substantial volumes after the onset of the financial crisis in 2008.
Raising Capital Through Trust Preferred Securities. Much of the increase in capital raised by community and
Chart 6.12
0
5
10
15
1985 1987 1989 1991 1993 1995 1997 1999 2001 2003 2005 2007 2009 2011
Annual Volume of External Capital Raised All Community Banks
Source: FDIC.
Percent of Equity Capital on Hand at Beginning of Year
Average: 3.5 Percent
Chart 6.13
0
5
10
15
1985 1987 1989 1991 1993 1995 1997 1999 2001 2003 2005 2007 2009 2011
Annual Volume of External Capital Raised All Noncommunity Banks
Source: FDIC.
Percent of Equity Capital on Hand at Beginning of Year
Average: 5.0 Percent

FDIC CommunIty BankIng StuDy ■ DeCemBer 2012 6–10
noncommunity banks between 2000 and 2007 was driven by the increased issuance of Trust Preferred Securities (TruPS). First issued in the early 1990s, TruPS are debt-like instruments issued by bank holding companies to raise funds that may then be downstreamed to bank subsidiaries as equity capital. Payments to TruPS investors were tax deductible for the holding companies that issued them, and the issuances were not dilutive to existing common shareholders. TruPS began to be more widely issued after a 1996 ruling by the Federal Reserve Board allowing them to be counted as Tier 1 capital at the holding company level.11
While the holding companies of noncommunity banks issued them in much higher volumes, TruPS also became an important vehicle for raising capital at community banks. Between 2000 and 2007, TruPS made up almost half of the total volume of public equity issuance for community banks, and about three-quarters of issuance for noncommunity banks.12 Although many community bank holding companies were too small to issue their own TruPS in public markets, by the early 2000s investment banks were increasingly securitizing small TruPS into collateralized debt obligations (CDOs). Noncommunity banks continued to issue large volumes of TruPS through 2009. Public issuance of TruPS by community bank hold-ing companies peaked in 2003 at $2.1 billion, but remained over $1 billion annually through 2007 before declining sharply.13
11 Federal Reserve press release, October 21, 1996, http://www.federal-reserve.gov/boarddocs/press/bcreg/1996/19961021/default.htm.12 Source: SNL Financial.13 Source: SNL Financial.
By October 2010, about one-third of the dollar volume of TruPS used to collateralize CDOs had either defaulted or deferred dividend payments.14 The deteriorating perfor-mance of many community bank TruPS and declining investor confidence in CDOs made community bank TruPS difficult to issue in highly risk-averse capital markets. Subsequent regulatory changes have further discouraged the issuance of TruPS. The Wall Street Reform and Consumer Protection Act of 2010 (Dodd-Frank Act) required that regulators take steps to exclude TruPS from the definition of Tier 1 capital for many bank holding companies.15
Federal Programs to Facilitate Capital Raising. The financial losses associated with the crisis led both commu-nity and noncommunity banks to seek external capital more frequently and in greater amounts. As depicted in Charts 6.12 through 6.15, the annual frequency and volume of capital raising increased markedly during the crisis for both community and noncommunity banks. Overall, 2,712 existing community banks raised external capital at least once between 2008 and 2010, adding $27.4 billion to their equity capital. During that same interval, some 535 noncommunity banks raised a total of $277.5 billion. Overall, the volume of external capital raised by community and noncommunity banks between 2008 and
14 “Fitch Bank TruPS CDO Default and Deferral Index,” Structured Credit Special Report, FitchRatings, November 2010.15 The Dodd-Frank Act required banking organizations with assets over $15 billion to phase out TruPS as a form of Tier 1 capital. For banking organizations with total assets between $500 million and $15 billion as of December 31, 2009, TruPS issued before May 19, 2010, may still be accepted as a form of Tier 1 capital. At the time of this study, bank hold-ing companies under $500 million may continue to count TruPS toward Tier 1 capital under existing capital rules.
Chart 6.14
0%
10%
20%
30%
40%
50%
2002 2003 2004 2005 2006 2007 2008 2009 2010 2011
All Community Banks Raising External Capital
In Organizations with TruPS Outstanding
In Organizations That Participated in the TARP / SBLF Programs
Community Banks in Organizations That Issued TruPS or That Participated in the TARP and SBLF Programs Made Up a Substantial Portion of Capital
Raises Over the Past Decade
Source: FDIC. Note: Excludes institutions in their first year of existence.
Community Banks Raising Capital as a Percent of Existing Community Banks
Chart 6.15
0%
10%
20%
30%
40%
50%
2002 2003 2004 2005 2006 2007 2008 2009 2010 2011
All Noncommunity Banks Raising External CapitalIn Organizations with TruPS OutstandingIn Organizations That Participated in the TARP / SBLF Programs
TruPS and the TARP / SBLF Programs Were More Frequent Sources of Capital to Noncommunity Banks Over the Past Decade
Than to Community Banks
Source: FDIC. Note: Excludes institutions in their first year of existence.
Noncommunity Banks Raising Capital as a Percent of Existing Noncommunity Banks

FDIC CommunIty BankIng StuDy ■ DeCemBer 2012 6–11
2010 exceeded the amount that they had collectively raised in the previous six years combined.
The substantial increase in external capital raising after 2007 was largely made possible by two federal programs designed to facilitate bank access to capital during period of financial market instability. First, the Troubled Asset Relief Program (TARP) was authorized in October 2008.16 The Treasury Department created the Capital Purchase Program (CPP) under TARP to stabilize the financial system by directly providing capital to financial institu-tions. In 2008 and 2009, Treasury invested approximately $205 billion under the CPP by purchasing preferred stock or subordinated debentures in 707 financial institutions.17 Second, the Small Business Lending Fund (SBLF) was created in 2010. The SBLF was authorized as a $30 billion fund from which Treasury could make capital investments in qualified banks and community development loan funds with assets of less than $10 billion in order to increase the
16 Emergency Economic Stabilization Act of 2008, P.L. 110-343, 10/3/2008, p. 2. 17 “Treasury, Capital Purchase Program, Program Purpose and Over-view” http://www.treasury.gov/initiatives/financial-stability/TARP-Programs/bank-investment-programs/cap/Pages/default.aspx, and SIGTARP, Office of the Special Inspector General for the Troubled Asset Relief Program. Quarterly Report to Congress, April 25, 2012, Page 37 http://www.sigtarp.gov/Quarterly%20Reports/April_25_2012_Report_to_Congress.pdf.
Two other TARP programs provided capital to FDIC-insured banks. The Community Development Capital Initiative (CDCI) in early 2010 provided capital to viable certified Community Development Financial Institu-tions. Thirty-six banks received capital through the CDCI; 28 of these used the funds to convert existing CPP investments. Total outlays under the CDCI were $570 million. Also, under a program known as the Targeted Investment Program, Treasury provided to Citigroup and Bank of America Corporation $20 billion each in addition to earlier CPP investments.
availability of credit for small business.18 Treasury invested $4 billion of SBLF funds into 307 banks in 2011; 137 of these banks used SBLF funds to repay CPP capital.19
The combined influence of TruPS and the TARP and SBLF can be seen in Charts 6.14 and 6.15, which depict the total frequency of capital raising for community and noncommunity banks, respectively, since 2002, as well as the frequency of capital raising for banks in organizations that had issued TruPS and those that participated in the TARP or SBLF programs.20 The charts show that between 2002 and 2011, community banks in holding companies that had TruPS outstanding represented one-third of all community banks that raised external capital and 40 percent of the total volume of capital raised. For noncom-munity banks, the numbers were even higher, with banks in organizations with TruPS outstanding representing 55 percent of the number of noncommunity banks raising capital as well as the total volume of capital raised. It should be noted that while the ability to issue new TruPS declined rather precipitously during the crisis, the number
18 Small Business Jobs Act, Public Law 111-240, September 27, 2010, p.1. http://www.gpo.gov/fdsys/pkg/BILLS-111hr5297enr/pdf/BILLS-111hr5297enr.pdf. 19 “Treasury, Resource Center, Small Business Lending Fund” http://www.treasury.gov/resource-center/sb-programs/Pages/Small-Busi-ness-Lending-Fund.aspx and Treasury, SBLF Transactions Report, 9/28/2011 http://www.treasury.gov/resource-center/sb-programs/DocumentsSBLFTransactions/SBLF_Bi-Weekly_Transactions_Report_THRU_09272011.pdf.20 Access to TruPS was determined by identifying bank or thrift holding companies with outstanding balances of TruPS at year end. Access to the TARP and SBLF programs was determined according to lists published by the U.S. Department of Treasury. Because it was not possible to distinguish capital raised under these programs from other capital raised, the totals discussed in this section include all capital raised by institutions with access to TruPS and all capital raised by institutions with access to the TARP or SBLF programs. The categories are not mutually exclusive, and a bank may appear on both lists.
Chart 6.16
0
10
20
30
40
50
60
70
80
90
100
1985 1987 1989 1991 1993 1995 1997 1999 2001 2003 2005 2007 2009 2011
OccasionalFrequent
During Periods of Distress, Half or More of Community Bank Capital Raises Are Undertaken by Institutions That Have Been Rated 3, 4 or 5
Source: FDIC. Note: Excludes institutions in their first year of existence.
Community Banks That Have Been Rated 3, 4 or 5 Within the Past Eight Quarters, as a Percent of All Community Banks Raising Capital
By Lifetime Frequency of Capital Raising:
Chart 6.17
0
10
20
30
40
50
60
70
80
90
100
1985 1987 1989 1991 1993 1995 1997 1999 2001 2003 2005 2007 2009 2011
FrequentOccasional
Capital Raises by Troubled Noncommunity Banks Also Increase in Crisis Periods, but to a Lesser Extent Than at Community Banks
Source: FDIC. Note: Excludes institutions in their first year of existence.
By Lifetime Frequency of Capital Raising:
Noncommunity Banks That Have Been Rated 3, 4 or 5 Within the Past Eight Quarters, as a Percent of All Noncommunity Banks Raising Capital

FDIC CommunIty BankIng StuDy ■ DeCemBer 2012 6–12
of banks with TruPS outstanding at the holding company level has declined more slowly.
Between 2008 and 2011, years that encompass the finan-cial crisis and its aftermath, the TARP and SBLF provided significant amounts of capital to both community banks and noncommunity banks. While the total proportion community banks raising capital during that period rose to a historic high of 17.5 percent, one-fifth of the community banks that did so were participants in the TARP or SBLF programs. Some 40 percent of the total capital raised by community banks between 2008 and 2011 was raised by TARP or SBLF participants. While one-third of noncom-munity banks raised external capital during this period, 44 percent of those that did so were part of the TARP or SBLF programs. These institutions accounted for 75 percent of the total capital raised by noncommunity banks during this period.
Access to external capital during the crisis years was not exclusively limited to institutions that issued TruPS or participated in the TARP and SBLF programs. Between 2008 and 2011, 1,882 community banks that did not belong to organizations that issued TruPS and did not participate in the government programs raised $16 billion in external capital, while 206 noncommunity banks that did not use these two sources raised a total of $66 billion.
Reasons for Capital Raising. While most community banks never raised capital from external sources, or did so only infrequently, it is important to understand some of the circumstances surrounding the external capital raises that did take place. Two of the most common situations are when community banks become troubled and when
they acquire other banks or grow rapidly. Together, these two situations account for a large percentage of institutions that raised external capital during the study period.
Charts 6.16 and 6.17 depict the share of capital raises by troubled banks with supervisory ratings of 3, 4 or 5 some-time in the two years preceding the year of the capital raising. The share of capital raises for troubled community banks and noncommunity banks was very low during the non-crisis years between the mid-1990s and the mid-2000s. However, during the crisis years of the late 1980s and early 1990s, as well as the period since 2008, troubled institu-tions represent a much higher proportion of capital raisers. Across the entire study period, troubled institutions accounted for 33 percent of all capital raises and 25 percent of the volume of capital raised at community banks, while they accounted for 28 percent of capital raises and 36 percent of the volume of capital raised at noncom-munity banks. The higher proportion of troubled institu-tions among capital raisers during crisis periods reflects their greater prevalence as a proportion of all community banks in those periods, but it also indicates that many troubled institutions are able to access external sources of capital.
Another reason a bank may want to raise capital is to strengthen its balance sheet to prepare for a period of growth or to acquire another institution. Charts 6.18 and 6.19 depict the percent of capital raises carried out by community and noncommunity banks that either made acquisitions or experienced asset growth of more than 25 percent in the two years following the year of the capital raise. Chart 6.18 shows that the share of capital raises by community banks that are related to growth or acquisition
Chart 6.18
0102030405060708090
100
1985 1987 1989 1991 1993 1995 1997 1999 2001 2003 2005 2007 2009
Occasional
Frequent
During Non-Crisis Periods, More Than Half of Community Bank Capital Raises Are Undertaken by Banks Set Up to
Grow Rapidly or Make Acquisitions
Source: FDIC. Note: Excludes institutions in their first year of existence.
Community Banks That Will Acquire Another Bank or Grow More Than 25 Percent Over the Subsequent Two Years, as a Percent of All Community Banks Raising Capital
By Lifetime Frequency of Capital Raising:
Chart 6.19
0102030405060708090
100
1985 1987 1989 1991 1993 1995 1997 1999 2001 2003 2005 2007 2009
Occasional
Frequent
Prior to the Recent Crisis, a Steadily Rising Share of Noncommunity Bank Capital Raises Were Made by Institutions Set
to Grow or Make Acquisitions
Source: FDIC. Note: Excludes institutions in their first year of existence.
Noncommunity Banks That Will Acquire Another Bank or Grow More Than 25 Percent Over the Subsequent Two Years, as a Percent of All Noncommunity Banks Raising Capital
By Lifetime Frequency of Capital Raising:

FDIC CommunIty BankIng StuDy ■ DeCemBer 2012 6–13
rose somewhat in the non-crisis years from the mid-1990s through the mid-2000s compared with the crisis years.21 This pattern is in some respects the mirror image of the share of capital raises by troubled community banks, which were the highest in the crisis years. Still, in most years, more than one-quarter of community bank capital raises preceded a period of significant growth or an acquisition.
Noncommunity banks directly acquired 2,401 institutions during the study period, and access to external capital was in many cases part of the balance sheet strategy associated with acquisition. In all, 34 percent of capital raises by noncommunity banks preceded a period of rapid growth or an acquisition, with the percentage stedily increasing between the mid-1980s and the mid-2000s. Most of these capital raises were made by frequent raisers of capital, which also accounted for 86 percent of the dollar volume of raises that preceded growth or acquisition by noncom-munity banks.
For both community and noncommunity banks, growth and acquisition became a much less important factor in motivating capital raises after the mid-2000s, mainly because growth and acquisitions became much less preva-lent toward the end of the decade. While the total assets of community banks grew by 19.5 percent between 2004 and 2007, their asset growth slowed to just 2.5 percent in the next four-year period, from 2008 through 2011. The slowdown was even more pronounced for noncommunity banks, from asset growth of 40.3 percent between 2004 and 2007 to growth of just 0.03 percent after 2008.
While troubled banks and those preparing for growth or acquisition represented large percentages of capital raises for both community and noncommunity banks during the study period, a substantial number of capital raises took place where neither situation appeared to be a factor. Across the entire study period through 2009, there were a total of 10,835 capital raises (40 percent of the total) by community banks where the bank was neither troubled before the raise nor an acquirer or fast grower after the raise. Just over 5,700 of these raises by community banks were carried out by frequent raisers. For noncommunity banks, there were a total of 2,953 capital raises (44 percent of the total) where the bank was neither troubled before
21 In order to observe two full years of growth and acquisitions, the time series stops with capital raises made in 2009.
the raise nor an acquirer or fast grower after the raise. Just over 1,700 of these raises by noncommunity banks were carried out by frequent raisers. These comparisons show that while a small portion of community banks have raised capital from outside sources in the normal course of their business, this practice is somewhat more prevalent among noncommunity banks.
SummaryBoth community and noncommunity banks rely on a mix of retained earnings and outside capital to add to their capital stock over time. Community banks set aside 57 percent of their net income during the study period as retained earnings, and retained earnings accounted for 59 percent of all additions to equity capital from internal and external sources, percentages that were in both cases substantially higher than for noncommunity banks. During periods when assets and earnings are growing at roughly the same rates, community banks can generate most of the capital they need from internal sources. Accordingly, the most important factor in ensuring that capital is made available to facilitate the growth of community banks is a steady stream of earnings from which to generate new capital.
Community banks became somewhat less dependent on internally generated capital over the last decade of the study period, when retained earnings made up just 41 percent of additions to their equity capital. Community banks have retained a smaller portion of their net income as retained earnings over time, as fewer of them came to be organized as mutual institutions and more of them adopted Subchapter S status. TruPS became a fairly common vehicle for community and noncommunity bank-ing organizations to raise external capital in the years leading up to the recent financial crisis. As TruPS issuance rapidly diminished after the onset of this crisis, and as financial losses made it necessary for more institutions to raise external capital, federal programs made capital avail-able to community and, especially, noncommunity banks.

FDIC CommunIty BankIng StuDy ■ DeCemBer 2012 6–14
As the effects of the financial crisis recede, both commu-nity and noncommunity banks are beginning to re-estab-lish a more normal pattern of adding to their equity capital through both internal and external sources. As retained earnings once again become the most important vehicle for capital formation at community banks, it is worth noting that community banks have long demonstrated the ability to raise external capital in a variety of situations where they have needed to in starting new banks, in trou-bled bank situations, in preparation for growth and acqui-sition, and for reasons other than these.