Embed Size (px)
Citation preview
Chapter 6Open EconomyOpen EconomyOpen EconomyOpen EconomyOpen Economy
MacroeconomicsMacroeconomicsMacroeconomicsMacroeconomicsMacroeconomics
We have so far assumed that the economy was closed—that it didnot interact with the rest of the world. This was done to keep themodel simple and explain the basic macroeconomic mechanisms.
In reality, most modern economies are open. Interaction with othereconomies of the world widens choice in three broad ways(i) Consumers and firms have the opportunity to choose between
domestic and foreign goods. This is the product market linkagewhich occurs through international trade.
(ii) Investors have the opportunity to choose between domestic andforeign assets. This constitutes the financial market linkage.
(iii) Firms can choose where to locate production and workers tochoose where to work. This is the factor market linkage. Labourmarket linkages have been relatively less due to various
restrictions on the movement of people through immigrationlaws. Movement of goods has traditionally been seen as asubstitute for the movement of labour. We focus here on the firsttwo linkages.An open economy is one that trades with other nations in
goods and services and, most often, also in financial assets. Indians,for instance, enjoy using products produced around the worldand some of our production is exported to foreign countries.Foreign trade, therefore, influences Indian aggregate demand in
two ways. First, when Indians buy foreign goods, this spendingescapes as a leakage from the circular flow of income decreasingaggregate demand. Second, our exports to foreigners enter as aninjection into the circular flow, increasing aggregate demand fordomestically produced goods. Total foreign trade (exports +imports) as a proportion of GDP is a common measure of the degreeof openness of an economy. In 2013-14, this was 44.1 per centfor the Indian Economy. There are several countries whose foreigntrade proportions are above 50 per cent of GDP.
Now, when goods move across national borders, money must
move in the opposite direction. At the international level, there is nosingle currency that is issued by a central authority. Foreign economicagents will accept a national currency only if they are convinced thatthe currency will maintain a stable purchasing power. Without thisconfidence, a currency will not be used as an international medium
2015-16(21/01/2015)
of exchange and unit of account since there is no international authority with thepower to force the use of a particular currency in international transactions.Governments have tried to gain confidence of potential users by announcing thatthe national currency will be freely convertible at a fixed price into another asset,over whose value the issuing authority has no control. This other asset most oftenhas been gold, or other national currencies. There are two aspects of this commitmentthat has affected its credibility – the ability to convert freely in unlimited amountsand the price at which conversion takes place. The international monetary systemhas been set up to handle these issues and ensure stability in internationaltransactions. A nation’s commitment regarding the above two issues will affect itstrade and financial interactions with the rest of the world.
We begin section 6.1 with the accounting of international trade and financialflows. The next section examines the determination of price at which national currenciesare exchanged for each other. In section 6.3, the closed economy income-expendituremodel is amended to include international effects. Section 6.4 deals with the linkagebetween the trade deficit, budget deficit and the savings - investment gap briefly.
6.1 THE BALANCE OF PAYMENTS
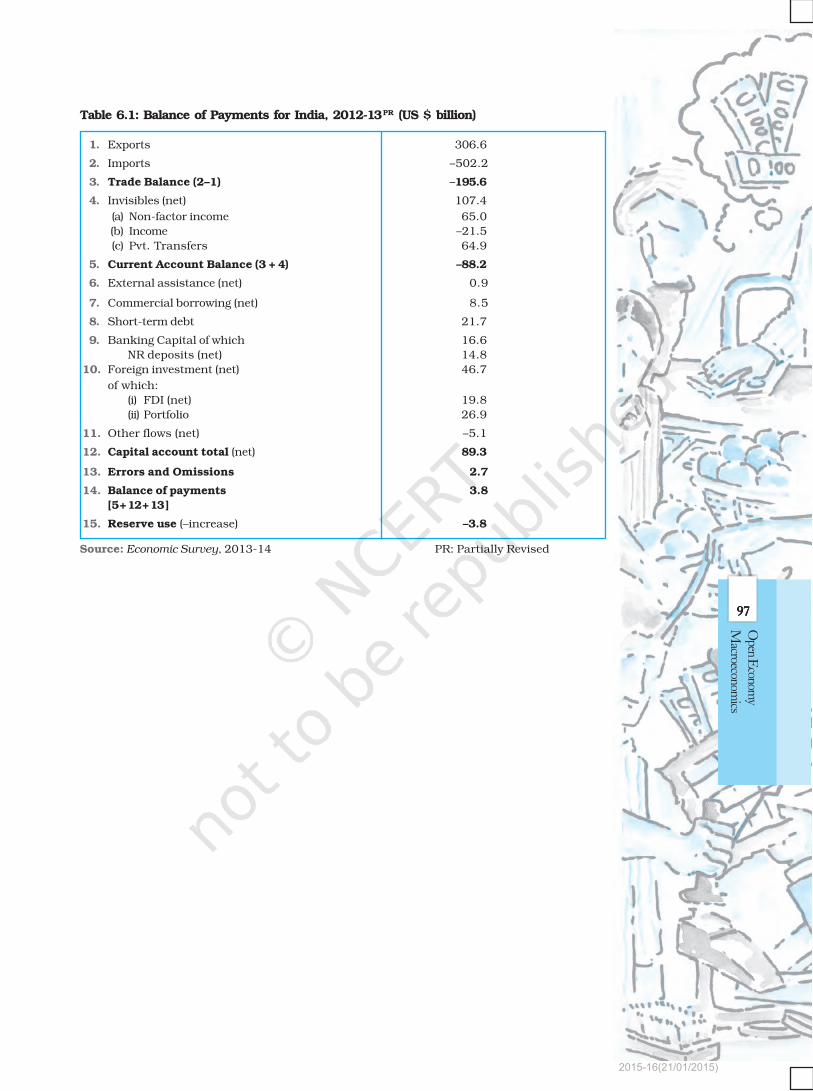
The balance of payments (BoP) record the transactions in goods, services andassets between residents of a country with the rest of the world for a specifiedtime period typically a year. Table 6.1 gives the balance of payments summaryfor the Indian Economy for the year 2012-13. There are two main accounts inthe BoP – the current account and the capital account.
The current account records exports and imports in goods and services andtransfer payments. The first two items in Table 6.1 record exports and imports ofgoods. The third item gives the trade balance which is obtained by subtractingimports of goods from the exports of goods. When exports exceed imports, there isa trade surplus and when imports exceed exports there is a trade deficit. In2012-13, imports exceeded exports leading to a huge trade deficit in India ofUS $ 195.6 billion. Trade in services denoted as invisible trade (because they arenot seen to cross national borders) includes both factor income (net income fromcompensation of employees and net investment income, the latter equals, the interest,profits and dividends on our assets abroad minus the income foreigners earn onassets they own in India) and net non-factor income (shipping, banking, insurance,tourism, software services, etc.). Transfer payments are receipts which the residentsof a country receive ‘for free’, without having to make any present or future paymentsin return. They consist of remittances, gifts and grants. They could be official orprivate. The balance of exports and imports of goods is referred to as the tradebalance. Adding trade in services and net transfers to the trade balance, we get thecurrent account balance shown in item 5 of Table 6.1. This figure means thattransactions from the current account component caused –88.2 billion more dollarsto flow out as payment than the receipts that flowed in. This is referred to as acurrent account deficit for 2012-13 works out to 4.7 per cent of GDP. If thisfigure had been a positive number, there would have been a current accountsurplus. The capital account records all international purchases and sales of assetssuch as money, stocks, bonds, etc. We note that any transaction resulting in apayment to foreigners is entered as a debit and is given a negative sign. Anytransaction resulting in a receipt from foreigners is entered as a credit and is givena positive sign.
EXAMPLE 6.1
Can a country have a trade deficit and a current account surplus simultaneously?
7 77 77 77 77 7
Open E
conomy
Macroeconom
ics
2015-16(21/01/2015)
7878787878
Intr
oduc
tory
Mac
roec
onom
ics
Yes, in India, although trade deficit is a recurrent feature every year, for threeconsecutive years from 2001-02, 2002-03 to 2003-04, there was a surplus on thecurrent account, to the tune of 0.7, 1.3 and 2.3 per cents of GDP respectively. Thisis because that earnings from services and private transfers outweighed the tradedeficit.
6.1.1 BoP Surplus and DeficitThe essence of international payments is that just like an individual who spendsmore than her income must finance the difference by selling assets or byborrowing, a country that has a deficit in its current account (spending moreabroad than it receives from sales to the rest of the world) must finance it byselling assets or by borrowing abroad. Thus, any current account deficit is ofnecessity financed by a net capital inflow.
Alternatively, the country could engage in official reserve transactions,running down its reserves of foreign exchange, in the case of a deficit by sellingforeign currency in the foreign exchange market. The decrease (increase) in officialreserves is called the overall balance of payments deficit (surplus). The basicpremise is that the monetary authorities are the ultimate financiers of any deficitin the balance of payments (or the recipients of any surplus). The balance ofpayments deficit or surplus is obtained after adding the current and capitalaccount balances. In 2012-13, there was a balance of payments surplus of US$3.8 billion in item 14 of Table 6.1. This was the amount of addition to officialreserves. A country is said to be in balance of payments equilibrium when thesum of its current account and its non-reserve capital account equals zero, sothat the current account balance is financed entirely by international lendingwithout reserve movements. We note that the official reserve transactions aremore relevant under a regime of pegged exchange rates than when exchangerates are floating. (See section 6.2.3)
Autonomous and Accommodating Transactions: International economictransactions are called autonomous when transactions are made independentlyof the state of the BoP (for instance due to profit motive). These items are called‘above the line’ items in the BoP. The balance of payments is said to be in surplus(deficit) if autonomous receipts are greater (less) than autonomous payments.Accommodating transactions (termed ‘below the line’ items), on the other hand,are determined by the net consequences of the autonomous items, that is, whetherthe BoP is in surplus or deficit. The official reserve transactions are seen as theaccommodating item in the BoP (all others being autonomous).
Errors and Omissions constitute the third element in the BoP (apart fromthe current and capital accounts) which is the ‘balancing item’ reflecting ourinability to record all international transactions accurately.
6.2 THE FOREIGN EXCHANGE MARKET
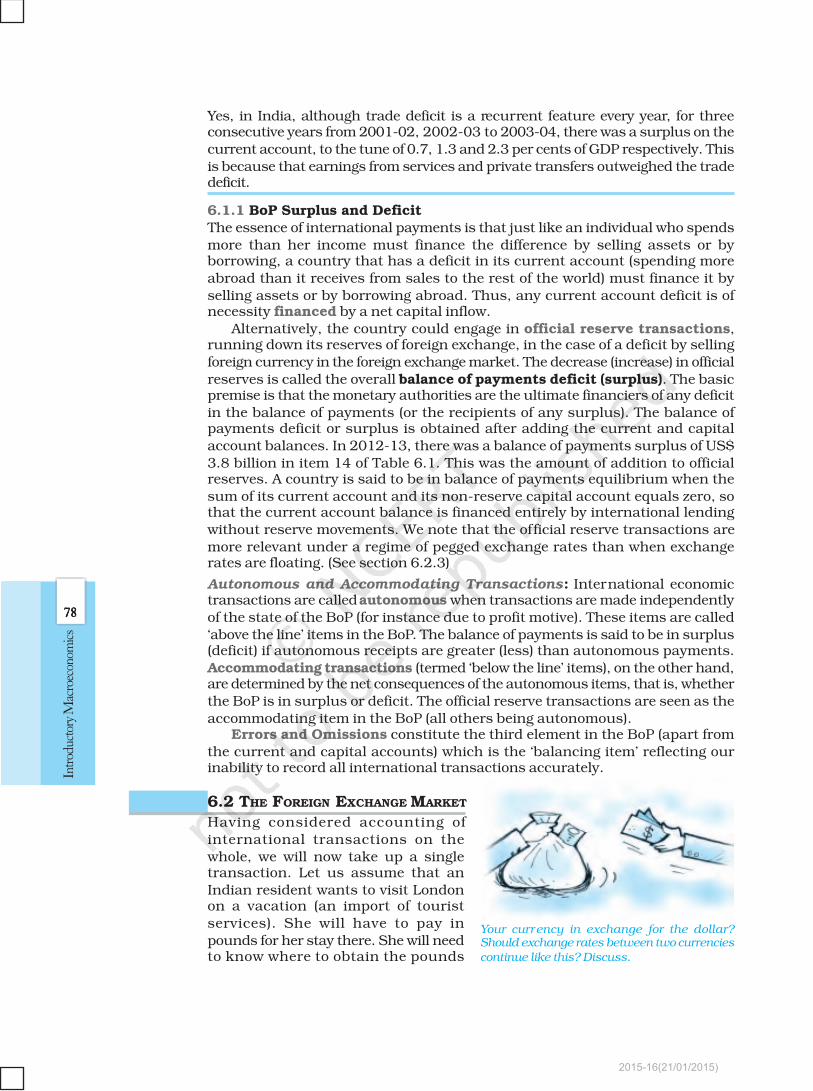
Having considered accounting ofinternational transactions on thewhole, we will now take up a singletransaction. Let us assume that anIndian resident wants to visit Londonon a vacation (an import of touristservices). She will have to pay inpounds for her stay there. She will needto know where to obtain the pounds
Your currency in exchange for the dollar?Should exchange rates between two currencies
continue like this? Discuss.
2015-16(21/01/2015)
7979797979
Open E
conomy
Macroeconom
ics
and at what price. Her demand for pounds would constitute a demand for foreignexchange which would be supplied in the foreign exchange market – the marketin which national currencies are traded for one another. The major participantsin this market are commercial banks, foreign exchange brokers and otherauthorised dealers and the monetary authorities. It is important to note that,although the participants themselves may have their own trading centres, themarket itself is world-wide. There is close and continuous contact between thetrading centres and the participants deal in more than one market.
The price of one currency in terms of the other is known as the exchangerate. Since there is a symmetry between the two currencies, the exchange ratemay be defined in one of the two ways. First, as the amount of domestic currencyrequired to buy one unit of foreign currency, i.e. a rupee-dollar exchange rate ofRs 50 means that it costs Rs 50 to buy one dollar, and second, as the cost inforeign currency of purchasing one unit of domestic currency. In the above case,we would say that it costs 2 cents to buy a rupee. The practice in economicliterature, however, is to use the former definition – as the price of foreign currencyin terms of domestic currency. This is the bilateral nominal exchange rate –bilateral in the sense that they are exchange rates for one currency againstanother and they are nominal because they quote the exchange rate in moneyterms, i.e. so many rupees per dollar or per pound.
However, returning to our example, if one wants to plan a trip to London,she needs to know how expensive British goods are relative to goods at home.The measure that captures this is the real exchange rate – the ratio of foreignto domestic prices, measured in the same currency. It is defined as
Real exchange rate = feP
P(6.1)
where P and Pf are the price levels here and abroad, respectively, and e is
the rupee price of foreign exchange (the nominal exchange rate). The numeratorexpresses prices abroad measured in rupees, the denominator gives thedomestic price level measured in rupees, so the real exchange rate measuresprices abroad relative to those at home. If the real exchange rate is equal toone, currencies are at purchasing power parity. This means that goods costthe same in two countries when measured in the same currency. For instance,if a pen costs $4 in the US and the nominal exchange rate is Rs 50 per USdollar, then with a real exchange rate of 1, it should cost Rs 200 (eP
f = 50 × 4)
in India. If the real exchange rises above one, this means that goods abroadhave become more expensive than goods at home. The real exchange rate isoften taken as a measure of a country’s international competitiveness.
Since a country interacts with many countries, we may want to see themovement of the domestic currency relative to all other currencies in a singlenumber rather than by looking at bilateral rates. That is, we would want anindex for the exchange rate against other currencies, just as we use a priceindex to show how the prices of goods in general have changed. This is calculatedas the Nominal Effective Exchange Rate (NEER) which is a multilateral raterepresenting the price of a representative basket of foreign currencies, eachweighted by its importance to the domestic country in international trade (theaverage of export and import shares is taken as an indicator of this). The RealEffective Exchange Rate (REER) is calculated as the weighted average of thereal exchange rates of all its trade partners, the weights being the shares of therespective countries in its foreign trade. It is interpreted as the quantity ofdomestic goods required to purchase one unit of a given basket of foreign goods.
2015-16(21/01/2015)
8080808080
Intr
oduc
tory
Mac
roec
onom
ics
6.2.1 Determination of the Exchange Rate
The question arises as to why the foreign exchange rate1 is at this level and whatcauses its movements? To understand the economic principles that lie behindexchange rate determination, we study the major exchange rate regimes2 thathave characterised the international monetary system. There has been a movefrom a regime of commitment of fixed-price convertibility to one withoutcommitments where residents enjoy greater freedom to convert domestic currencyinto foreign currencies but do not enjoy a price guarantee.
6.2.2 Flexible Exchange Rates
In a system of flexible exchange rates (also known as floating exchangerates), the exchange rate is determined by the forces of market demand andsupply. In a completely flexible system, the central banks follow a simple set ofrules – they do nothing to directly affect the level of the exchange rate, in otherwords they do not intervene in the foreign exchange market (and therefore, thereare no official reserve transactions). The link between the balance of paymentsaccounts and the transactions in the foreign exchange market is evident whenwe recognise that all expenditures by domestic residents on foreign goods,services and assets and all foreign transfer payments (debits in the BoP accounts)also represent demand for foreign exchange. The Indian resident buying aJapanese car pays for it in rupees but the Japanese exporter will expect to bepaid in yen. So rupees must be exchanged for yen in the foreign exchange market.Conversely, all exports by domestic residents reflect equal earnings of foreignexchange. For instance, Indian exporters will expect to be paid in rupees and, tobuy our goods, foreigners must sell their currency and buy rupees. Total creditsin the BoP accounts are then equal to the supply of foreign exchange. Anotherreason for the demand for foreign exchange is for speculative purposes.
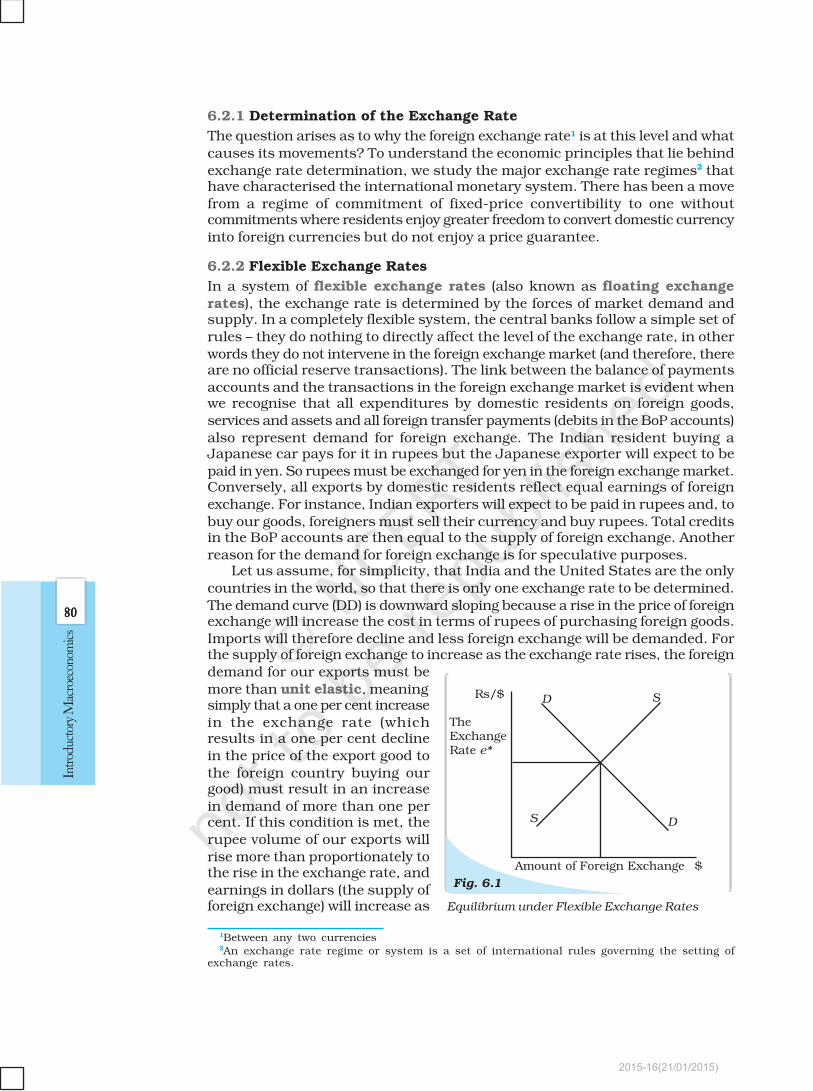
Let us assume, for simplicity, that India and the United States are the onlycountries in the world, so that there is only one exchange rate to be determined.The demand curve (DD) is downward sloping because a rise in the price of foreignexchange will increase the cost in terms of rupees of purchasing foreign goods.Imports will therefore decline and less foreign exchange will be demanded. Forthe supply of foreign exchange to increase as the exchange rate rises, the foreigndemand for our exports must bemore than unit elastic, meaningsimply that a one per cent increasein the exchange rate (whichresults in a one per cent declinein the price of the export good tothe foreign country buying ourgood) must result in an increasein demand of more than one percent. If this condition is met, therupee volume of our exports willrise more than proportionately tothe rise in the exchange rate, andearnings in dollars (the supply offoreign exchange) will increase as Equilibrium under Flexible Exchange Rates
1Between any two currencies2An exchange rate regime or system is a set of international rules governing the setting of
exchange rates.
2015-16(21/01/2015)
8181818181
Open E
conomy
Macroeconom
ics
the exchange rate rises. However,a vertical supply curve (with a unitelastic foreign demand for Indianexports) would not change theanalysis. We note that here we areholding all prices other than theexchange rate constant.
In this case of flexible exchangerates without central bankintervention, the exchange ratemoves to clear the market, toequate the demand for and supplyof foreign exchange. In Fig.6.1, theequilibrium exchange rate is e*.
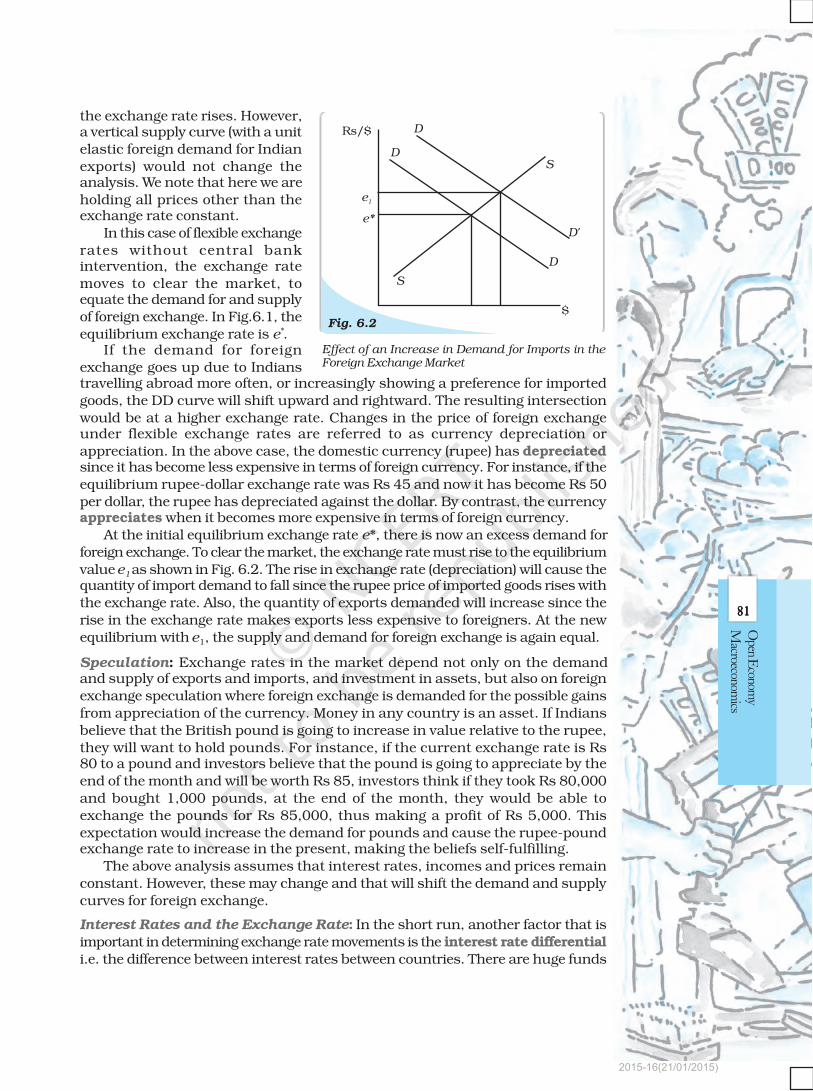
If the demand for foreignexchange goes up due to Indianstravelling abroad more often, or increasingly showing a preference for importedgoods, the DD curve will shift upward and rightward. The resulting intersectionwould be at a higher exchange rate. Changes in the price of foreign exchangeunder flexible exchange rates are referred to as currency depreciation orappreciation. In the above case, the domestic currency (rupee) has depreciatedsince it has become less expensive in terms of foreign currency. For instance, if theequilibrium rupee-dollar exchange rate was Rs 45 and now it has become Rs 50per dollar, the rupee has depreciated against the dollar. By contrast, the currencyappreciates when it becomes more expensive in terms of foreign currency.
At the initial equilibrium exchange rate e*, there is now an excess demand forforeign exchange. To clear the market, the exchange rate must rise to the equilibriumvalue e1 as shown in Fig. 6.2. The rise in exchange rate (depreciation) will cause thequantity of import demand to fall since the rupee price of imported goods rises withthe exchange rate. Also, the quantity of exports demanded will increase since therise in the exchange rate makes exports less expensive to foreigners. At the newequilibrium with e1, the supply and demand for foreign exchange is again equal.
Speculation: Exchange rates in the market depend not only on the demandand supply of exports and imports, and investment in assets, but also on foreignexchange speculation where foreign exchange is demanded for the possible gainsfrom appreciation of the currency. Money in any country is an asset. If Indiansbelieve that the British pound is going to increase in value relative to the rupee,they will want to hold pounds. For instance, if the current exchange rate is Rs80 to a pound and investors believe that the pound is going to appreciate by theend of the month and will be worth Rs 85, investors think if they took Rs 80,000and bought 1,000 pounds, at the end of the month, they would be able toexchange the pounds for Rs 85,000, thus making a profit of Rs 5,000. Thisexpectation would increase the demand for pounds and cause the rupee-poundexchange rate to increase in the present, making the beliefs self-fulfilling.
The above analysis assumes that interest rates, incomes and prices remainconstant. However, these may change and that will shift the demand and supplycurves for foreign exchange.
Interest Rates and the Exchange Rate: In the short run, another factor that isimportant in determining exchange rate movements is the interest rate differentiali.e. the difference between interest rates between countries. There are huge funds
Fig. 6.2
D
D
D
D'
S
S
Rs/$
e1
e*
$
Effect of an Increase in Demand for Imports in theForeign Exchange Market
2015-16(21/01/2015)
8282828282
Intr
oduc
tory
Mac
roec
onom
ics
owned by banks, multinational corporations and wealthy individuals which movearound the world in search of the highest interest rates. If we assume that governmentbonds in country A pay 8 per cent rate of interest whereas equally safe bonds incountry B yield 10 per cent, the interest rate diferential is 2 per cent. Investors fromcountry A will be attracted by the high interest rates in country B and will buy thecurrency of country B selling their own currency. At the same time investors incountry B will also find investing in their own country more attractive and willtherefore demand less of country A’s currency. This means that the demand curvefor country A’s currency will shift to the left and the supply curve will shift to theright causing a depreciation of country A’s currency and an appreciation of countryB’s currency. Thus, a rise in the interest rates at home often leads to an appreciationof the domestic currency. Here, the implicit assumption is that no restrictions existin buying bonds issued by foreign governments.
Income and the Exchange Rate: When income increases, consumer spendingincreases. Spending on imported goods is also likely to increase. When importsincrease, the demand curve for foreign exchange shifts to the right. There is adepreciation of the domestic currency. If there is an increase in income abroadas well, domestic exports will rise and the supply curve of foreign exchangeshifts outward. On balance, the domestic currency may or may not depreciate.What happens will depend on whether exports are growing faster than imports.In general, other things remaining equal, a country whose aggregate demandgrows faster than the rest of the world’s normally finds its currency depreciatingbecause its imports grow faster than its exports. Its demand curve for foreigncurrency shifts faster than its supply curve.
Exchange Rates in the Long Run: The Purchasing Power Parity (PPP) theory isused to make long-run predictions about exchange rates in a flexible exchangerate system. According to the theory, as long as there are no barriers to trade liketariffs (taxes on trade) and quotas (quantitative limits on imports), exchange ratesshould eventually adjust so that the same product costs the same whether measuredin rupees in India, or dollars in the US, yen in Japan and so on, except for differencesin transportation. Over the long run, therefore, exchange rates between any twonational currencies adjust to reflect differences in the price levels in the two countries.
EXAMPLE 6.2
If a shirt costs $8 in the US and Rs 400 in India, the rupee-dollar exchange rate
should be Rs 50. To see why, at any rate higher than Rs 50, say Rs 60, it costs
Rs 480 per shirt in the US but only Rs 400 in India. In that case, all foreign
customers would buy shirts from India. Similarly, any exchange rate below
Rs 50 per dollar will send all the shirt business to the US. Next, we suppose that
prices in India rise by 20 per cent while prices in the US rise by 50 per cent.
Indian shirts would now cost Rs 480 per shirt while American shirts cost $12
per shirt. For these two prices to be equivalent, $12 must be worth Rs 480, or
one dollar must be worth Rs 40. The dollar, therefore, has depreciated.
According to the PPP theory, differences in the domestic inflation and foreigninflation are a major cause of adjustment in exchange rates. If one country hashigher inflation than another, its exchange rate should be depreciating.
However, we note that if American prices rise faster than Indian prices and,at the same time, countries erect tariff barriers to keep Indian shirts out (but not
2015-16(21/01/2015)
8383838383
Open E
conomy
Macroeconom
ics
American ones), the dollar may not depreciate. Also, there are many goods thatare not tradeable and inflation rates for them will not matter. Further, few goodsthat different countries produce and trade are uniform or identical. Mosteconomists contend that other factors are more important than relative pricesfor exchange rate determination in the short run. However, in the long run,purchasing power parity plays an important role.
6.2.3 Fixed Exchange Rates
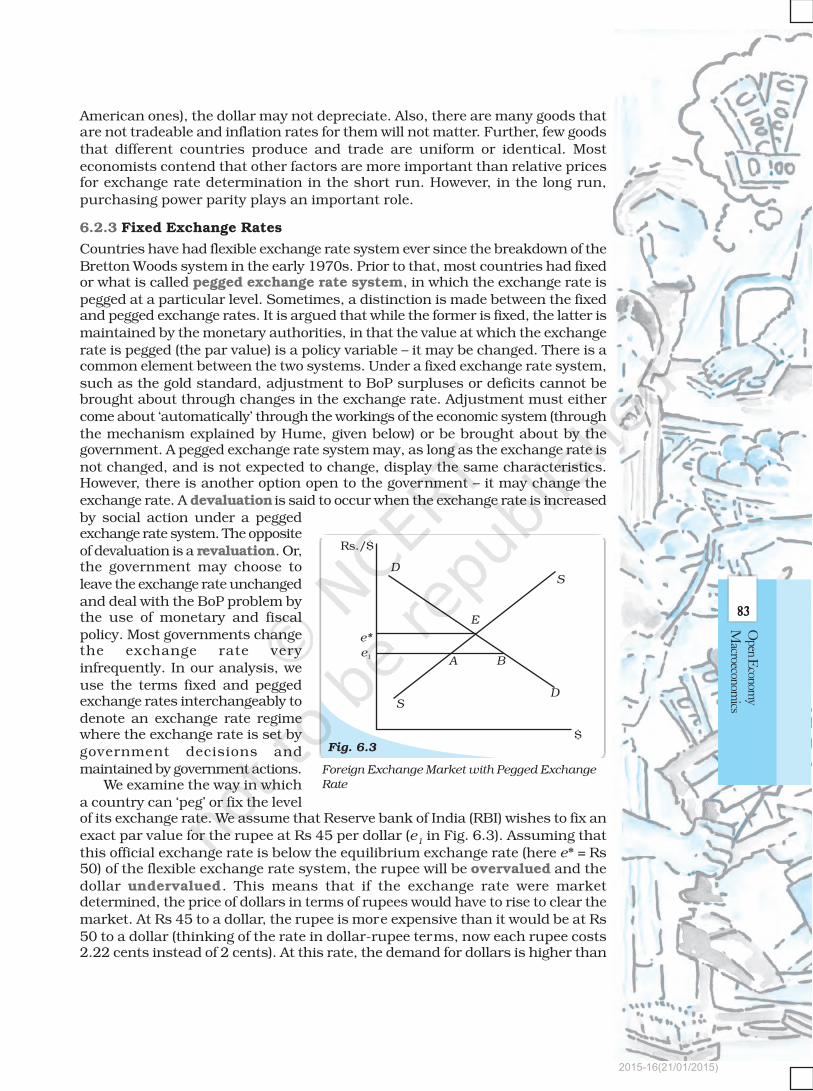
Countries have had flexible exchange rate system ever since the breakdown of theBretton Woods system in the early 1970s. Prior to that, most countries had fixedor what is called pegged exchange rate system, in which the exchange rate ispegged at a particular level. Sometimes, a distinction is made between the fixedand pegged exchange rates. It is argued that while the former is fixed, the latter ismaintained by the monetary authorities, in that the value at which the exchangerate is pegged (the par value) is a policy variable – it may be changed. There is acommon element between the two systems. Under a fixed exchange rate system,such as the gold standard, adjustment to BoP surpluses or deficits cannot bebrought about through changes in the exchange rate. Adjustment must eithercome about ‘automatically’ through the workings of the economic system (throughthe mechanism explained by Hume, given below) or be brought about by thegovernment. A pegged exchange rate system may, as long as the exchange rate isnot changed, and is not expected to change, display the same characteristics.However, there is another option open to the government – it may change theexchange rate. A devaluation is said to occur when the exchange rate is increasedby social action under a peggedexchange rate system. The oppositeof devaluation is a revaluation. Or,the government may choose toleave the exchange rate unchangedand deal with the BoP problem bythe use of monetary and fiscalpolicy. Most governments changethe exchange rate veryinfrequently. In our analysis, weuse the terms fixed and peggedexchange rates interchangeably todenote an exchange rate regimewhere the exchange rate is set bygovernment decisions andmaintained by government actions.
We examine the way in whicha country can ‘peg’ or fix the levelof its exchange rate. We assume that Reserve bank of India (RBI) wishes to fix anexact par value for the rupee at Rs 45 per dollar (e
1 in Fig. 6.3). Assuming that
this official exchange rate is below the equilibrium exchange rate (here e* = Rs50) of the flexible exchange rate system, the rupee will be overvalued and thedollar undervalued. This means that if the exchange rate were marketdetermined, the price of dollars in terms of rupees would have to rise to clear themarket. At Rs 45 to a dollar, the rupee is more expensive than it would be at Rs50 to a dollar (thinking of the rate in dollar-rupee terms, now each rupee costs2.22 cents instead of 2 cents). At this rate, the demand for dollars is higher than
Foreign Exchange Market with Pegged Exchange
Rate
Fig. 6.3
Rs./$
D
D
S
A B
E
e*
$
S
e1
2015-16(21/01/2015)
8484848484
Intr
oduc
tory
Mac
roec
onom
ics
the supply of dollars. Since the demand and supply schedules were constructedfrom the BoP accounts (measuring only autonomous transactions), this excessdemand implies a deficit in the BoP. The deficit is bridged by central bankintervention. In this case, the RBI would sell dollars for rupees in the foreignexchange market to meet this excess demand AB, thus neutralising the upwardpressure on the exchange rate. The RBI stands ready to buy and sell dollars atthat rate to prevent the exchange rate from rising (since no one would buy atmore) or falling (since no one would sell for less).
Now the RBI might decide to fix the exchange rate at a higher level – Rs 47per dollar – to bridge part of the deficit in BoP. This devaluation of the domesticcurrency would make imports expensive and our exports cheaper, leading to anarrowing of the trade deficit. It is important to note that repeated central bankintervention to finance deficits and keep the exchange rate fixed will eventuallyexhaust the official reserves. This is the main flaw in the system of fixed exchangerates. Once speculators believe that the exchange rate cannot be held for longthey would buy foreign exchange (say, dollars) in massive amounts. The demandfor dollars will rise sharply causing a BoP deficit. Without sufficient reserves,the central bank will have to allow the exchange rate to reach its equilibriumlevel. This might amount to an even larger devaluation than would have beenrequired before the speculative ‘attack’ on the domestic currency began.
International experience shows that it is precisely this that has led manycountries to abandon the system of fixed exchange rates. Fear of such an attackinduced the US to let its currency float in 1971, one of the major events whichprecipitated the breakdown of the Bretton Woods system.
6.2.4 Managed Floating
Without any formal international agreement, the world has moved on to whatcan be best described as a managed floating exchange rate system. It is amixture of a flexible exchange rate system (the float part) and a fixed rate system(the managed part). Under this system, also called dirty floating, central banksintervene to buy and sell foreign currencies in an attempt to moderate exchangerate movements whenever they feel that such actions are appropriate. Officialreserve transactions are, therefore, not equal to zero.
Box 6.1 Exchange Rate Management: The International Experience
The Gold Standard: From around 1870 to the outbreak of the First WorldWar in 1914, the prevailing system was the gold standard which was theepitome of the fixed exchange rate system. All currencies were defined interms of gold; indeed some were actually made of gold. Each participantcountry committed to guarantee the free convertibility of its currency intogold at a fixed price. This meant that residents had, at their disposal, adomestic currency which was freely convertible at a fixed price into anotherasset (gold) acceptable in international payments. This also made it possiblefor each currency to be convertible into all others at a fixed price. Exchangerates were determined by its worth in terms of gold (where the currencywas made of gold, its actual gold content). For example, if one unit of saycurrency A was worth one gram of gold, one unit of currency B was worthtwo grams of gold, currency B would be worth twice as much as currency A.Economic agents could directly convert one unit of currency B into twounits of currency A, without having to first buy gold and then sell it. Therates would fluctuate between an upper and a lower limit, these limits being
2015-16(21/01/2015)
8585858585
Open E
conomy
Macroeconom
ics
set by the costs of melting, shipping and recoining between the twoCurrencies3. To maintain the official parity each country needed an adequatestock of gold reserves. All countries on the gold standard had stable exchangerates.
The question arose – would not a country lose all its stock of gold if itimported too much (and had a BoP deficit)? The mercantilist4 explanationwas that unless the state intervened, through tariffs or quotas or subsidies,on exports, a country would lose its gold and that was considered one of theworst tragedies. David Hume, a noted philosopher writing in 1752, refutedthis view and pointed out that if the stock of gold went down, all prices andcosts would fall commensurately and no one in the country would be worseoff. Also, with cheaper goods at home, imports would fall and exports rise (itis the real exchange rate which will determine competitiveness). The countryfrom which we were importing and making payments in gold would face anincrease in prices and costs, so their now expensive exports would fall andtheir imports of the first country’s now cheap goods would go up. The resultof this price-specie-flow (precious metals were referred to as ‘specie’ in theeighteenth century) mechanism is normally to improve the BoP of thecountry losing gold, and worsen that of the country with the favourabletrade balance, until equilibrium in international trade is re-established atrelative prices that keep imports and exports in balance with no furthernet gold flow. The equilibrium is stable and self-correcting, requiring notariffs and state action. Thus, fixed exchange rates were maintained by anautomatic equilibrating mechanism.
Several crises caused the gold standard to break down periodically.Moreover, world price levels were at the mercy of gold discoveries. This canbe explained by looking at the crude Quantity Theory of Money, M = kPY,according to which, if output (GNP) increased at the rate of 4 per cent peryear, the gold supply would have to increase by 4 per cent per year to keepprices stable. With mines not producing this much gold, price levels werefalling all over the world in the late nineteenth century, giving rise to socialunrest. For a period, silver supplemented gold introducing ‘bimetallism’. Also,fractional reserve banking helped to economise on gold. Paper currencywas not entirely backed by gold; typically countries held one-fourth goldagainst its paper currency. Another way of economising on gold was the goldexchange standard which was adopted by many countries which kept theirmoney exchangeable at fixed prices with respect to gold but held little or nogold. Instead of gold, they held the currency of some large country (the UnitedStates or the United Kingdom) which was on the gold standard. All these andthe discovery of gold in Klondike and South Africa helped keep deflation atbay till 1929. Some economic historians attribute the Great Depression tothis shortage of liquidity. During 1914-45, there was no maintained universalsystem but this period saw both a brief return to the gold standard and aperiod of flexible exchange rates.
The Bretton Woods System: The Bretton Woods Conference held in 1944set up the International Monetary Fund (IMF) and the World Bank andreestablished a system of fixed exchange rates. This was different from theinternational gold standard in the choice of the asset in which nationalcurrencies would be convertible. A two-tier system of convertibility wasestablished at the centre of which was the dollar. The US monetary
3If the difference in the rates were more than those transaction costs, profits could be madethrough arbitrage, the process of buying a currency cheap and selling it dear.
4Mercantilist thought was associated with the rise of the nation-state in Europe during thesixteenth and seventeenth centuries.
2015-16(21/01/2015)
8686868686
Intr
oduc
tory
Mac
roec
onom
ics
authorities guaranteed the convertibility of the dollar into gold at the fixedprice of $35 per ounce of gold. The second-tier of the system was thecommitment of monetary authority of each IMF member participating inthe system to convert their currency into dollars at a fixed price. The latterwas called the official exchange rate. For instance, if French francs couldbe exchanged for dollars at roughly 5 francs per dollar, the dollars couldthen be exchanged for gold at $35 per ounce, which fixed the value of thefranc at 175 francs per ounce of gold (5 francs per dollar times 35 dollarsper ounce). A change in exchange rates was to be permitted only in case ofa ‘fundamental disequilibrium’ in a nation’s BoP – which came to mean achronic deficit in the BoP of sizeable proportions.
Such an elaborate system of convertibility was necessary because thedistribution of gold reserves across countries was uneven with the US havingalmost 70 per cent of the official world gold reserves. Thus, a credible goldconvertibility of the other currencies would have required a massiveredistribution of the gold stock. Further, it was believed that the existinggold stock would be insufficient to sustain the growing demand forinternational liquidity. One way to save on gold, then, was a two-tierconvertible system, where the key currency would be convertible into goldand the other currencies into the key currency.
In the post-World War II scenario, countries devastated by the warneeded enormous resources for reconstruction. Imports went up and theirdeficits were financed by drawing down their reserves. At that time, the USdollar was the main component in the currency reserves of the rest of theworld, and those reserves had been expanding as a consequence of the USrunning a continued balance of payments deficit (other countries werewilling to hold those dollars as a reserve asset because they were committedto maintain convertibility between their currency and the dollar).
The problem was that if the short-run dollar liabilities of the US continuedto increase in relation to its holdings of gold, then the belief in the credibilityof the US commitment to convert dollars into gold at the fixed price would beeroded. The central banks would thus have an overwhelming incentive toconvert the existing dollar holdings into gold, and that would, in turn, forcethe US to give up its commitment. This was the Triffin Dilemma after RobertTrif fin, the main critic of the Bretton Woods system. Triffin suggested thatthe IMF should be turned into a ‘deposit bank’ for central banks and a new‘reserve asset’ be created under the control of the IMF. In 1967, gold wasdisplaced by creating the Special Drawing Rights (SDRs), also known as‘paper gold’, in the IMF with the intention of increasing the stock ofinternational reserves. Originally defined in terms of gold, with 35 SDRs beingequal to one ounce of gold (the dollar-gold rate of the Bretton Woods system),it has been redefined several times since 1974. At present, it is calculateddaily as the weighted sum of the values in dollars of four currencies (euro,dollar, Japanese yen, pound sterling) of the five countries (France, Germany,Japan, the UK and the US). It derives its strength from IMF members beingwilling to use it as a reserve currency and use it as a means of paymentbetween central banks to exchange for national currencies. The originalinstallments of SDRs were distributed to member countries according to theirquota in the Fund (the quota was broadly related to the country’s economicimportance as indicated by the value of its international trade).
The breakdown of the Bretton Woods system was preceded by manyevents, such as the devaluation of the pound in 1967, flight from dollars togold in 1968 leading to the creation of a two-tiered gold market (with theofficial rate at $35 per ounce and the private rate market determined), and
2015-16(21/01/2015)
8787878787
Open E
conomy
Macroeconom
ics
finally in August 1971, the British demand that US guarantee the goldvalue of its dollar holdings. This led to the US decision to give up the linkbetween the dollar and gold.
The ‘Smithsonian Agreement’ in 1971, which widened the permissible bandof movements of the exchange rates to 2.5 per cent above or below the new‘central rates’ with the hope of reducing pressure on deficit countries, lastedonly 14 months. The developed market economies, led by the United Kingdomand soon followed by Switzerland and then Japan, began to adopt floatingexchange rates in the early 1970s. In 1976, revision of IMF Articles allowedcountries to choose whether to float their currencies or to peg them (to a singlecurrency, a basket of currencies, or to the SDR). There are no rules governingpegged rates and no de facto supervision of floating exchange rates.
The Current Scenario: Many countries currently have fixed exchange rates.Some countries peg their currency to the dollar. The creation of the EuropeanMonetary Union in January, 1999, involved permanently fixing the exchangerates between the currencies of the members of the Union and theintroduction of a new common currency, the Euro, under the managementof the European Central Bank. From January, 2002, actual notes and coinswere introduced. So far, 12 of the 25 members of the European Union haveadopted the euro. Some countries pegged their currency to the French franc;most of these are former French colonies in Africa. Others peg to a basketof currencies, with the weights reflecting the composition of their trade.Often smaller countries also decide to fix their exchange rates relative toan important trading partner. Argentina, for example, adopted the currencyboard system in 1991. Under this, the exchange rate between the localcurrency (the peso) and the dollar was fixed by law. The central bank heldenough foreign currency to back all the domestic currency and reserves ithad issued. In such an arrangement, the country cannot expand the moneysupply at will. Also, if there is a domestic banking crisis (when banks needto borrow domestic currency) the central bank can no longer act as a lenderof last resort. However, following a crisis, Argentina abandoned the currencyboard and let its currency float in January 2002.
Another arrangement adopted by Equador in 2000 was dollarisation whenit abandoned the domestic currency and adopted the US dollar. All prices arequoted in dollar terms and the local currency is no longer used in transactions.Although uncertainty and risk can be avoided, Equador has given the controlover its money supply to the Central Bank of the US – the Federal Reserve –which will now be based on economic conditions in the US.
On the whole, the international system is now characterised by amultiple of regimes. Most exchange rates change slightly on a day-to-daybasis, and market forces generally determine the basic trends. Even thoseadvocating greater fixity in exchange rates generally propose certain rangeswithin which governments should keep rates, rather than literally fix them.Also, there has been a virtual elimination of the role for gold. Instead, thereis a free market in gold in which the price of gold is determined by itsdemand and supply coming mainly from jewellers, industrial users, dentists,speculators and ordinary citizens who view gold as a good store of value.
6.3 THE DETERMINATION OF INCOME IN AN OPEN ECONOMY
With consumers and firms having an option to buy goods produced at homeand abroad, we now need to distinguish between domestic demand for goodsand the demand for domestic goods.
2015-16(21/01/2015)
8888888888
Intr
oduc
tory
Mac
roec
onom
ics
6.3.1 National Income Identity for an Open Economy
In a closed economy, there are three sources of demand for domestic goods –Consumption (C ), government spending (G ), and domestic investment (I ).We can write
Y = C + I + G (6.2)
In an open economy, exports (X ) constitute an additional source of demandfor domestic goods and services that comes from abroad and therefore must beadded to aggregate demand. Imports (M ) supplement supplies in domesticmarkets and constitute that part of domestic demand that falls on foreign goodsand services. Therefore, the national income identity for an open economy is
Y + M = C + I + G + X (6.3)
Rearranging, we get
Y = C + I + G + X – M (6.4)
or
Y = C + I + G + NX (6.5)
where, NX is net exports (exports – imports). A positive NX (with exportsgreater than imports) implies a trade surplus and a negative NX (with importsexceeding exports) implies a trade deficit.
To examine the roles of imports and exports in determining equilibriumincome in an open economy, we follow the same procedure as we did for theclosed economy case – we take investment and government spending asautonomous. In addition, we need to specify the determinants of imports andexports. The demand for imports depends on domestic income (Y) and the realexchange rate (R ). Higher income leads to higher imports. Recall that the realexchange rate is defined as the relative price of foreign goods in terms of domesticgoods. A higher R makes foreign goods relatively more expensive, thereby leadingto a decrease in the quantity of imports. Thus, imports depend positively on Yand negatively on R. The export of one country is, by definition, the import ofanother. Thus, our exports would constitute foreign imports. It would dependon foreign income, Y
f , and on R. A rise in Y
f will increase foreign demand for our
goods, thus leading to higher exports. An increase in R, which makes domesticgoods cheaper, will increase our exports. Exports depend positively on foreignincome and the real exchange rate. Thus, exports and imports depend ondomestic income, foreign income and the real exchange rate. We assume pricelevels and the nominal exchange rate to be constant, hence R will be fixed. Fromthe point of view of our country, foreign income, and therefore exports, areconsidered exogenous (X = X ).
The demand for imports is thus assumed to depend on income and have anautonomous component
M = M + mY, where M > 0 is the autonomous component, 0 < m < 1. (6.6)
Here m is the marginal propensity to import, the fraction of an extrarupee of income spent on imports, a concept analogous to the marginalpropensity to consume.
The equilibrium income would be
Y = C + c(Y – T ) + I + G + X – M – mY (6.7)
Taking all the autonomous components together as A , we get
Y = A + cY – mY (6.8)
2015-16(21/01/2015)
8989898989
Open E
conomy
Macroeconom
ics
or, (1 – c + m)Y = A (6.9)
or, Y * = 1
1–A
c m+(6.10)
In order to examine the effects of allowing for foreign trade in the income-expenditure framework, we need to compare equation (6.10) with the equivalentexpression for the equilibrium income in a closed economy model. In bothequations, equilibrium income is expressed as a product of two terms, theautonomous expenditure multiplier and the level of autonomous expenditures.We consider how each of these change in the open economy context.
Since m, the marginal propensity to import, is greater than zero, we get asmaller multiplier in an open economy. It is given by
The open economy multiplier = Y
A
∆
∆ = +
11 – c m (6.11)
EXAMPLE 6.3
If c = 0.8 and m = 0.3, we would have the open and closed economy multiplierrespectively as
11 – c
= 1
1– 0.8 =
10.2
= 5 (6.12)
and
+
11 – c m = +
11 – 0.8 0.3 =
10.5
= 2 (6.13)
If domestic autonomous demand increases by 100, in a closed economy outputincreases by 500 whereas it increases by only 200 in an open economy.
The fall in the value of the autonomous expenditure multiplier with theopening up of the economy can be explained with reference to our previousdiscussion of the multiplier process (Chapter 4). A change in autonomousexpenditures, for instance a change in government spending, will have a directeffect on income and an induced effect on consumption with a further effect onincome. With an mpc greater than zero, a proportion of the induced effect onconsumption will be a demand for foreign, not domestic goods. Therefore, theinduced effect on demand for domestic goods, and hence on domestic income,will be smaller. The increase in imports per unit of income constitutes an additionalleakage from the circular flow of domestic income at each round of the multiplierprocess and reduces the value of the autonomous expenditure multiplier.
The second term in equation (6.10) shows that, in addition to the elementsfor a closed economy, autonomous expenditure for an open economy includesthe level of exports and the autonomous component of imports. Thus, the changesin their levels are additional shocks that will change equilibrium income. From
equation (6.10) we can compute the multiplier effects of changes in X and M .
*Y
X
∆
∆ =
+
11 – c m
(6.14)
*Y
M
∆
∆ = +
–11– c m (6.15)
An increase in demand for our exports is an increase in aggregate demandfor domestically produced output and will increase demand just as would an
2015-16(21/01/2015)
9090909090
Intr
oduc
tory
Mac
roec
onom
ics
increase in government spending or an autonomous increase in investment. Incontrast, an autonomous rise in import demand is seen to cause a fall in demandfor domestic output and causes equilibrium income to decline.
6.3.2 Equilibrium Output and the Trade Balance
We shall provide a diagrammatic explanation of the above mechanisms and, inaddition, their impact on the trade balance. Net exports, (NX = X – M), as we sawearlier, depend on Y, Y
f and R. A rise in Y raises import spending and leads to
trade deficit (if initially we had trade balance, NX = 0). A rise in Yf , other thingsbeing equal, raises our exports, creates a trade surplus and raises aggregateincome. A real depreciation would raise exports and reduce imports, thusincreasing our net exports.
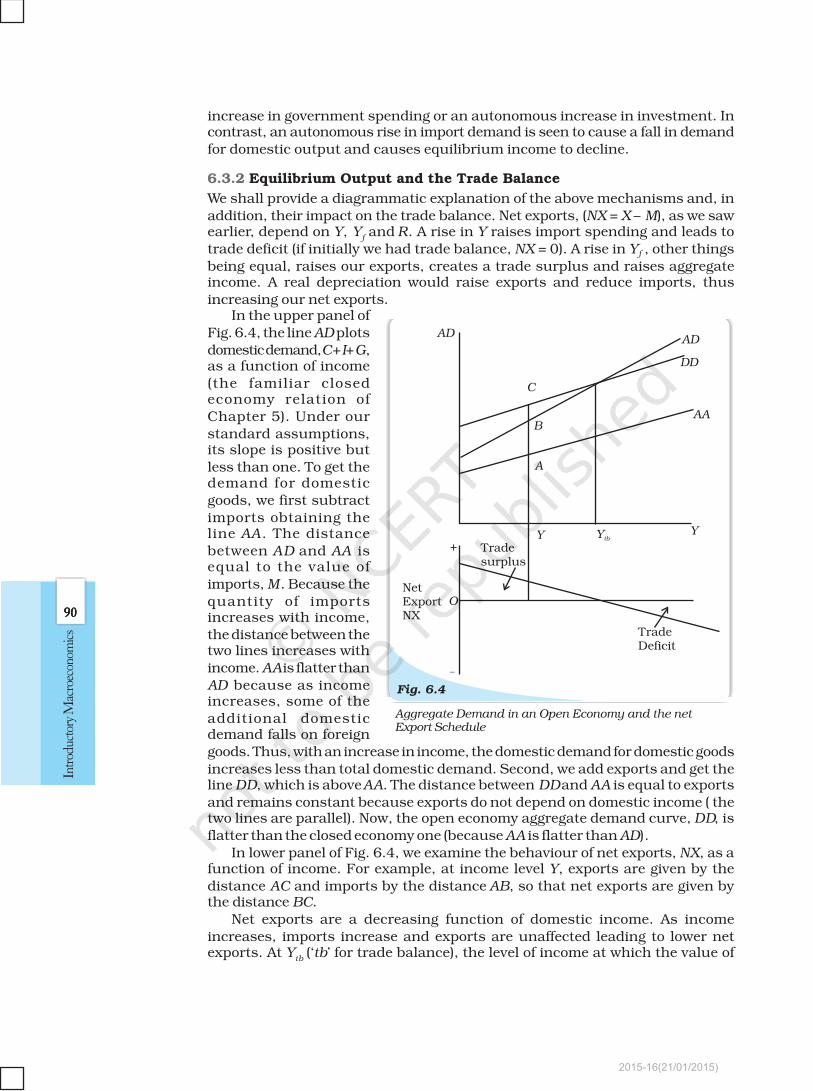
In the upper panel ofFig. 6.4, the line AD plotsdomestic demand, C+I+G,as a function of income(the familiar closedeconomy relation ofChapter 5). Under ourstandard assumptions,its slope is positive butless than one. To get thedemand for domesticgoods, we first subtractimports obtaining theline AA. The distancebetween AD and AA isequal to the value ofimports, M. Because thequantity of importsincreases with income,the distance between thetwo lines increases withincome. AA is flatter thanAD because as incomeincreases, some of theadditional domesticdemand falls on foreigngoods. Thus, with an increase in income, the domestic demand for domestic goodsincreases less than total domestic demand. Second, we add exports and get theline DD, which is above AA. The distance between DD and AA is equal to exportsand remains constant because exports do not depend on domestic income ( thetwo lines are parallel). Now, the open economy aggregate demand curve, DD, isflatter than the closed economy one (because AA is flatter than AD).
In lower panel of Fig. 6.4, we examine the behaviour of net exports, NX, as afunction of income. For example, at income level Y, exports are given by thedistance AC and imports by the distance AB, so that net exports are given bythe distance BC.
Net exports are a decreasing function of domestic income. As incomeincreases, imports increase and exports are unaffected leading to lower netexports. At Y
tb (‘tb’ for trade balance), the level of income at which the value of
Fig. 6.4
ADAD
DD
AA
YYtbY
A
B
C
Tradesurplus
TradeDeficit
NetExportNX
+
–
O
Aggregate Demand in an Open Economy and the netExport Schedule
2015-16(21/01/2015)
9191919191
Open E
conomy
Macroeconom
ics
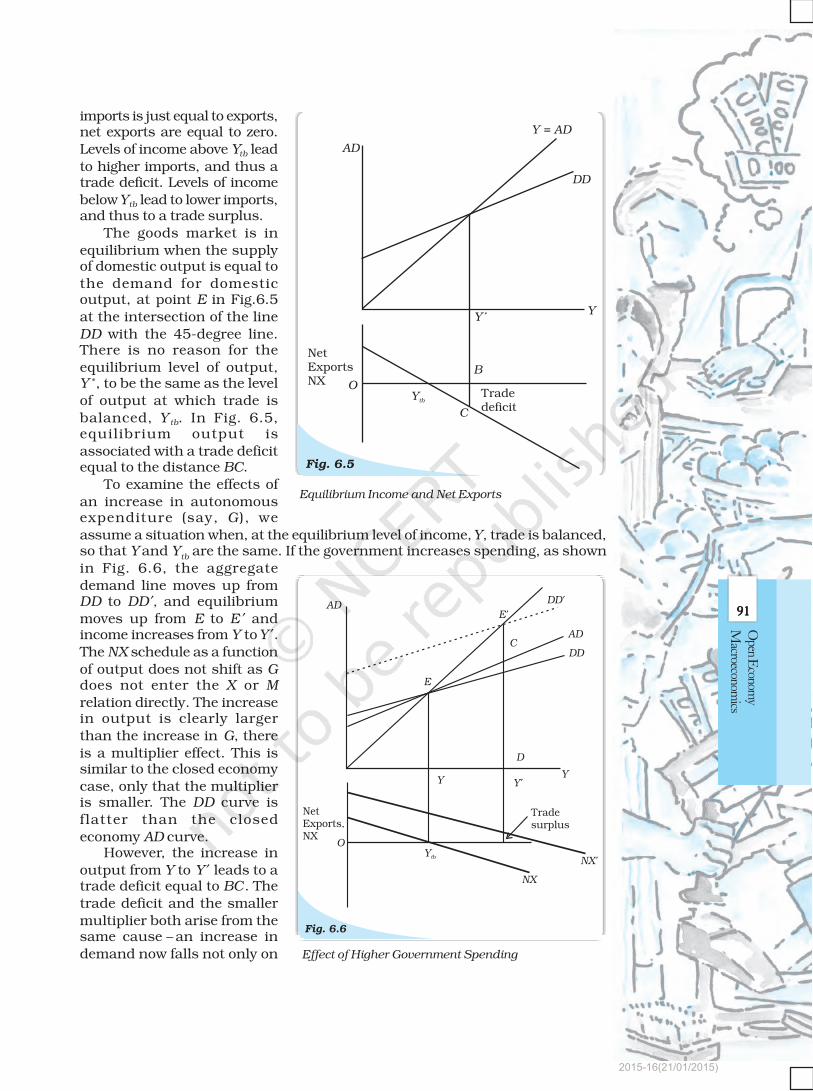
imports is just equal to exports,net exports are equal to zero.Levels of income above Ytb leadto higher imports, and thus atrade deficit. Levels of incomebelow Ytb lead to lower imports,and thus to a trade surplus.
The goods market is inequilibrium when the supplyof domestic output is equal tothe demand for domesticoutput, at point E in Fig.6.5at the intersection of the lineDD with the 45-degree line.There is no reason for theequilibrium level of output,Y *, to be the same as the levelof output at which trade isbalanced, Y tb. In Fig. 6.5,equilibrium output isassociated with a trade deficitequal to the distance BC.
To examine the effects ofan increase in autonomousexpenditure (say, G ), weassume a situation when, at the equilibrium level of income, Y, trade is balanced,so that Y and Y
tb are the same. If the government increases spending, as shown
in Fig. 6.6, the aggregatedemand line moves up fromDD to DD ′, and equilibriummoves up from E to E ′ andincome increases from Y to Y ′.The NX schedule as a functionof output does not shift as Gdoes not enter the X or M
relation directly. The increasein output is clearly largerthan the increase in G, thereis a multiplier effect. This issimilar to the closed economycase, only that the multiplieris smaller. The DD curve isflatter than the closedeconomy AD curve.
However, the increase inoutput from Y to Y ′ leads to atrade deficit equal to BC. Thetrade deficit and the smallermultiplier both arise from thesame cause – an increase indemand now falls not only on
Fig. 6.5
AD
Y = AD
DD
YY *
B
C
Tradedeficit
Ytb
NetExportsNX O
Equilibrium Income and Net Exports
Effect of Higher Government Spending
2015-16(21/01/2015)
9292929292
Intr
oduc
tory
Mac
roec
onom
ics
domestic goods but also on foreign goods. This, as explained earlier, leads to asmaller multiplier. And because some of the increase falls on imports and exportsremain unchanged, the result is a trade deficit.
These two implications are important. The more open the economy, the smallerthe effect on income and the larger the adverse effect on the trade balance. Forexample, suppose a country has a ratio of imports to GDP of around 70 per cent.This implies that when demand increases, roughly 70 per cent of this increaseddemand goes to higher imports and only 30 per cent to an increase in demandfor domestic goods. An increase in G is thus likely to result in a large increase inthe country’s trade deficit and a small increase in output and income, makingdomestic demand expansion an unattractive policy for the country.
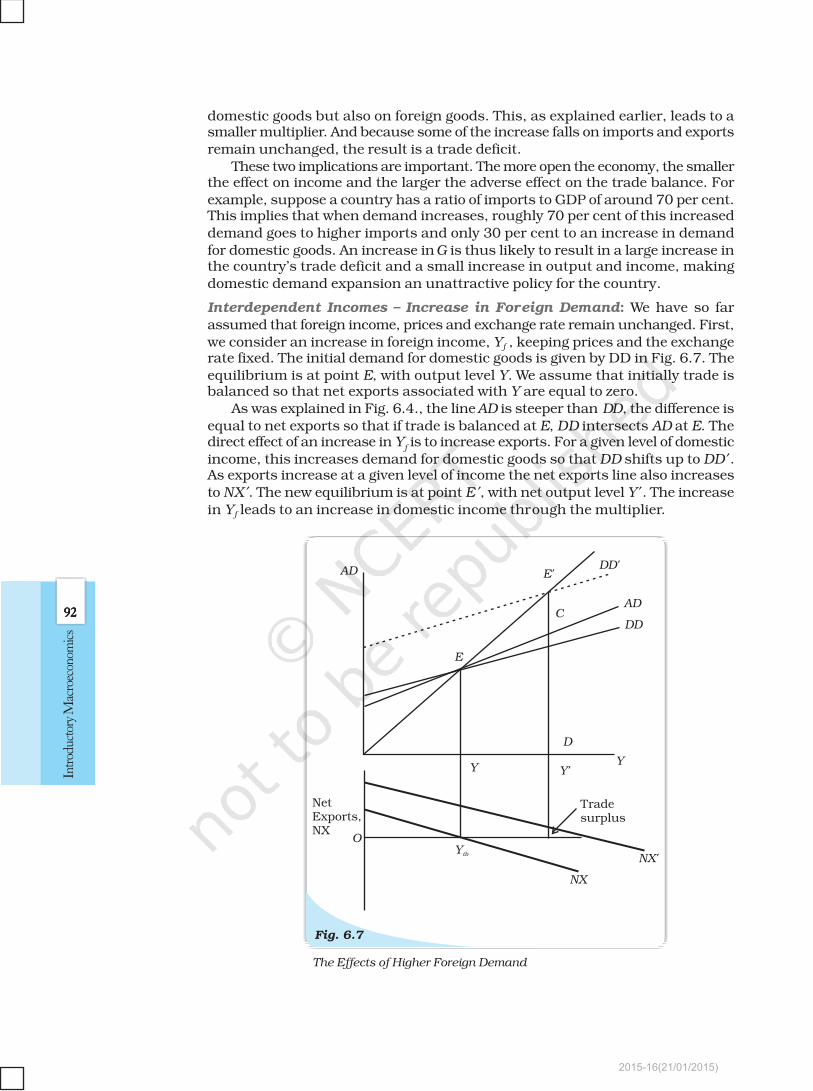
Interdependent Incomes – Increase in Foreign Demand: We have so farassumed that foreign income, prices and exchange rate remain unchanged. First,we consider an increase in foreign income, Yf , keeping prices and the exchangerate fixed. The initial demand for domestic goods is given by DD in Fig. 6.7. Theequilibrium is at point E, with output level Y. We assume that initially trade isbalanced so that net exports associated with Y are equal to zero.
As was explained in Fig. 6.4., the line AD is steeper than DD, the difference isequal to net exports so that if trade is balanced at E, DD intersects AD at E. Thedirect effect of an increase in Y
f is to increase exports. For a given level of domestic
income, this increases demand for domestic goods so that DD shifts up to DD ′.As exports increase at a given level of income the net exports line also increasesto NX ′. The new equilibrium is at point E ′, with net output level Y ′. The increasein Yf leads to an increase in domestic income through the multiplier.
Fig. 6.7
AD E'DD'
AD
DDC
E
D
YY
Y'
Tradesurplus
NetExports,NX
OYtb
NX
NX'
The Effects of Higher Foreign Demand
2015-16(21/01/2015)
9393939393
Open E
conomy
Macroeconom
ics
What happens to the trade balance? If the increase in Y leads to a largeincrease in imports, the trade balance could deteriorate. But it does not. At thenew level of income, domestic demand is given by DE ′. Net exports are thusgiven by CE ′ – which, because AD is necessarily below DD ′, is necessarily positive.Thus, while imports increase, they do not offset the increase in exports, andthere is a trade surplus. Coversely, a recession abroad would reduce domesticexports and cause a trade deficit. Thus, booms and recessions in one countrytend to be transmitted to other countries through international trade in goodsand services.
Change in Prices: Next we consider the effects of changes in prices, assumingthe exchange rate to be fixed. If prices of domestic products fall, while say foreignprices remain constant, domestic exports will rise, adding to aggregate demand,and hence will raise our output and income. Analogously, a rise in prices of acountry’s exports will decrease that country’s net exports and output andincome. Similarly, a price increase abroad will make foreign products moreexpensive and hence again raise net exports and domestic output and income.Price decreases abroad have the opposite effects.
Exchange Rate Changes: Changes in nominal exchange rates would changethe real exchange rate and hence international relative prices. A depreciationof the rupee will raise the cost of buying foreign goods and make domesticgoods less costly. This will raise net exports and therefore increase aggregatedemand. Conversely, a currency appreciation would reduce net exports and,therefore, decrease aggregate demand. However, we must note thatinternational trade patterns take time to respond to changes in exchangerates. A considerable period of time may elapse before any improvement innet exports is apparent.
6.4 TRADE DEFICITS, SAVINGS AND INVESTMENT
The question arises – are trade deficits a cause for alarm? We note that an essentialdifference between a closed economy and an open economy is that while in aclosed economy saving and investment must always be equal, in an openeconomy, they can differ. From equation (6.5) we get
Y – C – G = I + NX (6.16)
or
S = I + NX (6.17)
We distinguish between private saving, S P, (that part of disposable incomethat is saved rather than consumed — Y – T – C ) and government saving, S g,(government’s ‘income’, its net tax revenue minus its ‘consumption’, governmentpurchases, T – G). The two together add up to national saving
S = Y – C – G = (Y – T – C ) + (T – G ) = Sp + S
g(6.18)
Thus, from (6.16) and (6.17), we get
S = Sp + S
g = I + NX
or
NX = (S p – I ) + Sg = (Sp – I ) + (T – G ) (6.19)
2015-16(21/01/2015)
9494949494
Intr
oduc
tory
Mac
roec
onom
ics
1. Openness in product and financial markets allows a choice between domesticand foreign goods and between domestic and foreign assets.
2. The BoP records a country’s transactions with the rest of the world.3. The current account balance is the sum of the balance of merchandise trade,
services and net transfers received from the rest of the world. The capitalaccount balance is equal to capital flows from the rest of the world, minuscapital flows to the rest of the world.
4. A current account deficit is financed by net capital flows from the rest of theworld, thus by a capital account surplus.
5. The nominal exchange rate is the price of one unit of foreign currency in termsof domestic currency.
6. The real exchange rate is the relative price of foreign goods in terms of domesticgoods. It is equal to the nominal exchange rate times the foreign price leveldivided by the domestic price level. It measures the internationalcompetitiveness of a country in international trade. When the real exchangerate is equal to one, the two countries are said to be in purchasing powerparity.
7. The epitome of the fixed exchange rate system was the gold standard in whicheach participant country committed itself to convert freely its currency intogold at a fixed price. The pegged exchange rate is a policy variable and may bechanged by official action (devaluation).
8. Under clean floating, the exchange rate is market-determined without anycentral bank intervention. In case of managed floating, central banks interveneto reduce fluctuations in the exchange rate.
9. In an open economy, the demand for domestic goods is equal to the domesticdemand for goods (consumption, investment and government spending) plusexports minus imports.
10. The open economy multiplier is smaller than that in a closed economy becausea part of domestic demand falls on foreign goods. An increase in autonomousdemand thus leads to a smaller increase in output compared to a closedeconomy. It also results in a deterioration of the trade balance.
11. An increase in foreign income leads to increased exports and increases domesticoutput. It also improves the trade balance.
12. Trade deficits need not be alarming if the country invests the borrowed fundsyielding a rate of growth higher than the interest rate.
Su
mm
ary
Su
mm
ary
Su
mm
ary
Su
mm
ary
Su
mm
ary
When a country runs a trade deficit5, it is important to look at the rightside of equation (6.18) to see whether there has been a decrease in saving,increase in investment, or an increase in the budget deficit. There is reason toworry about a country’s long-run prospects if the trade deficit reflects smallersaving or a larger budget deficit (when the economy has both trade deficit andbudget deficit, it is said to be facing twin deficits). The deficit could reflecthigher private or government consumption. In such cases, the country’s capitalstock will not rise rapidly enough to yield enough growth (called the ‘growthdividend’) it needs to repay its debt. There is less cause to worry if the tradedeficit reflects a rise in investment, which will build the capital stock morequickly and increase future output. However, we must note that since privatesaving, investment and the trade deficit are jointly determined, other factorstoo must be taken into account.
5Here,to simplify the analysis, we take trade balance to be synonymous with the current accountbalance, ignoring invisibles and transfer payments. As Table 6.1 shows, invisibles can help bridgethe trade deficit in an important way.
2015-16(21/01/2015)
9595959595
Open E
conomy
Macroeconom
ics
Box 6.2: Exchange Rate Management: The Indian Experience
India’s exchange rate policy has evolved in line with international anddomestic developments. Post-independence, in view of the prevailingBretton Woods system, the Indian rupee was pegged to the pound sterlingdue to its historic links with Britain. A major development was thedevaluation of the rupee by 36.5 per cent in June, 1966. With thebreakdown of the Bretton Woods system, and also the declining shareof UK in India’s trade, the rupee was delinked from the pound sterlingin September 1975. During the period between 1975 to 1992, theexchange rate of the rupee was officially determined by the ReserveBank within a nominal band of plus or minus 5 per cent of the weightedbasket of currencies of India’s major trading partners. The Reserve Bankintervened on a day-to-day basis which resulted in wide changes in thesize of reserves. The exchange rate regime of this period can be describedas an adjustable nominal peg with a band.
The beginning of 1990s saw significant rise in oil prices andsuspension of remittances from the Gulf region in the wake of the Gulfcrisis. This, and other domestic and international developments, led tosevere balance of payments problems in India. The drying up of accessto commercial banks and short-term credit made financing the currentaccount deficit difficult. India’s foreign currency reserves fell rapidlyfrom US $ 3.1 billion in August to US $ 975 million on July 12, 1991 (wemay contrast this with the present; as of January 27, 2006, India’sforeign exchange reserves stand at US $ 139.2 billion). Apart frommeasures like sending gold abroad, curtailing non-essential imports,approaching the IMF and multilateral and bilateral sources, introducingstabilisation and structural reforms, there was a two-step devaluationof 18–19 per cent of the rupee on July 1 and 3, 1991. In march 1992,the Liberalised Exchange Rate Management System (LERMS) involvingdual exchange rates was introduced. Under this system, 40 per cent ofexchange earnings had to be surrendered at an official rate determinedby the Reserve Bank and 60 per cent was to be converted at the market-determined rates.The dual rates were converged into one from March1, 1993; this was an important step towards current accountconvertibility, which was finally achieved in August 1994 by acceptingArticle VIII of the Articles of Agreement of the IMF. The exchange rate ofthe rupee thus became market determined, with the Reserve Bankensuring orderly conditions in the foreign exchange market through itssales and purchases.
KKKK Key
Con
cep
tsey
Con
cep
tsey
Con
cep
tsey
Con
cep
tsey
Con
cep
ts Open economy Balance of payments
Current account deficit Official reserve transactions
Autonomous and accommodating Nominal and real exchange ratetransactions
Purchasing power parity Flexible exchange rate
Depreciation Interest rate differential
Fixed exchange rate Devaluation
Managed floating Demand for domestic goods
Marginal propensity to import Net exports
Open economy multiplier
2015-16(21/01/2015)
9696969696
Intr
oduc
tory
Mac
roec
onom
ics
1. Differentiate between balance of trade and current account balance.
2. What are official reserve transactions? Explain their importance in the balanceof payments.
3. Distinguish between the nominal exchange rate and the real exchange rate. Ifyou were to decide whether to buy domestic goods or foreign goods, which ratewould be more relevant? Explain.
4. Suppose it takes 1.25 yen to buy a rupee, and the price level in Japan is 3 andthe price level in India is 1.2. Calculate the real exchange rate between Indiaand Japan (the price of Japanese goods in terms of Indian goods). (Hint: Firstfind out the nominal exchange rate as a price of yen in rupees).
5. Explain the automatic mechanism by which BoP equilibrium was achievedunder the gold standard.
6. How is the exchange rate determined under a flexible exchange rate regime?
7. Differentiate between devaluation and depreciation.
8. Would the central bank need to intervene in a managed floating system? Explainwhy.
9. Are the concepts of demand for domestic goods and domestic demand for goodsthe same?
10. What is the marginal propensity to import when M = 60 + 0.06Y? What is therelationship between the marginal propensity to import and the aggregatedemand function?
11. Why is the open economy autonomous expenditure multiplier smaller thanthe closed economy one?
12. Calculate the open economy multiplier with proportional taxes, T = tY , insteadof lump-sum taxes as assumed in the text.
13. Suppose C = 40 + 0.8Y D, T = 50, I = 60, G = 40, X = 90, M = 50 + 0.05Y (a) Findequilibrium income. (b) Find the net export balance at equilibrium income(c) What happens to equilibrium income and the net export balance when thegovernment purchases increase from 40 and 50?
14. In the above example, if exports change to X = 100, find the change inequilibrium income and the net export balance.
15. Explain why G – T = (Sg – I) – (X – M).
16. If inflation is higher in country A than in Country B, and the exchange ratebetween the two countries is fixed, what is likely to happen to the trade balancebetween the two countries?
17. Should a current account deficit be a cause for alarm? Explain.
18. Suppose C = 100 + 0.75Y D, I = 500, G = 750, taxes are 20 per cent of income,X = 150, M = 100 + 0.2Y . Calculate equilibrium income, the budget deficit orsurplus and the trade deficit or surplus.
19. Discuss some of the exchange rate arrangements that countries have enteredinto to bring about stability in their external accounts.
Suggested Readings
1. Dornbusch, R. and S. Fischer, 1994. Macroeconomics , sixth edition,McGraw-Hill, Paris.
2. Economic Survey, Government of India, 2006-07.
3. Krugman, P.R. and M. Obstfeld, 2000. International Economics, Theory and Policy,fifth edition, Pearson Education.
?
?
Exer
cise
sE
xer
cise
sE
xer
cise
sE
xer
cise
sE
xer
cise
s
?
?
2015-16(21/01/2015)
9797979797
Open E
conomy
Macroeconom
ics
Table 6.1: Balance of Payments for India, 2012-13PR (US $ billion)
1. Exports 306.6
2. Imports –502.2
3. Trade Balance (2–1) –195.6
4. Invisibles (net) 107.4
(a) Non-factor income 65.0(b) Income –21.5(c) Pvt. Transfers 64.9
5. Current Account Balance (3 + 4) –88.2
6. External assistance (net) 0.9
7. Commercial borrowing (net) 8.5
8. Short-term debt 21.7
9. Banking Capital of which 16.6NR deposits (net) 14.8
10. Foreign investment (net) 46.7
of which:(i) FDI (net) 19.8(ii) Portfolio 26.9
11. Other flows (net) –5.1
12. Capital account total (net) 89.3
13. Errors and Omissions 2.7
14. Balance of payments 3.8[5+12+13]
15. Reserve use (–increase) –3.8
Source: Economic Survey, 2013-14 PR: Partially Revised
2015-16(21/01/2015)