Embed Size (px)
Citation preview
Chapter 6
Coastal Tourism in Kerala-An Analysis6.1. Introduction
In the preceding three chapters, the profile of tourism in terms of tourist
arrivals and tourism receipts were discussed at the global, national and state level.
Various elements of tourism, including the policies and strategies of the central and
state govemments were also highlighted. The stage is now set to discuss the most
important element of the tourism activity in the state, i.e., coastal tourism. This
chapter starts with a description (definition) of coastal tourism in Kerala. A detailed
analysis of beach tourism and backwater tourism, the two major components of
coastal tourism, are discussed in the next two sections. Following this, the findings of
the survey conducted among the tourists to understand their place of origin, economic
and social profile, demographic and visitation pattern, etc. were presented. The last
section gives a summary of this chapter.
6.2. Coastal tourism in Kerala
Tourism is a process involving tourists, places they visit and activities they
involve into. Coastal tourism, therefore, is tourism brought to bear on the coastal
environment and its natural and cultural resources. It takes place along the shore and
in the water immediately adjacent to the shorelines. In this study, the term coastal
region encompasses not only the region lying close to the sea, but also its extensions
through the large system of estuaries and backwaters far into the inland of Kerala.
Hence, this study defines coastal tourism of Kerala as the composite ofbeach tourism
and backwater tourism.
146
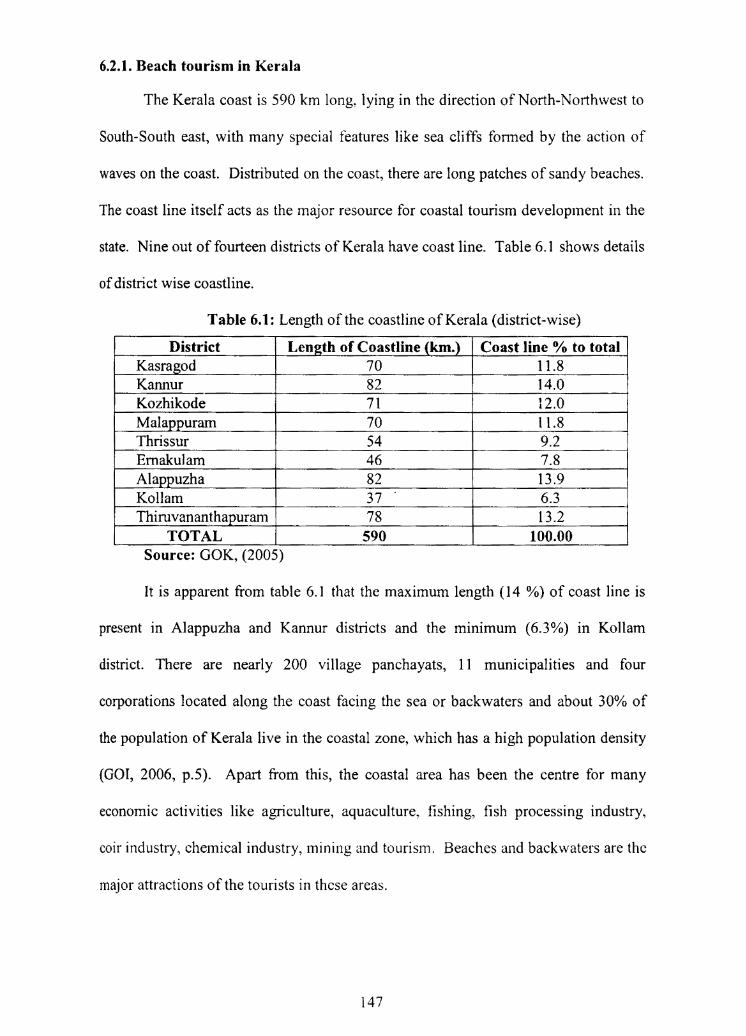
According to the Department of Tourism, there are five major beaches in
Kerala, namely, Kovalam, Varkala, Fort Kochi, Kappad and Bekal (GOK, 2003, p.2).
The spot wise description of major beaches is given below.
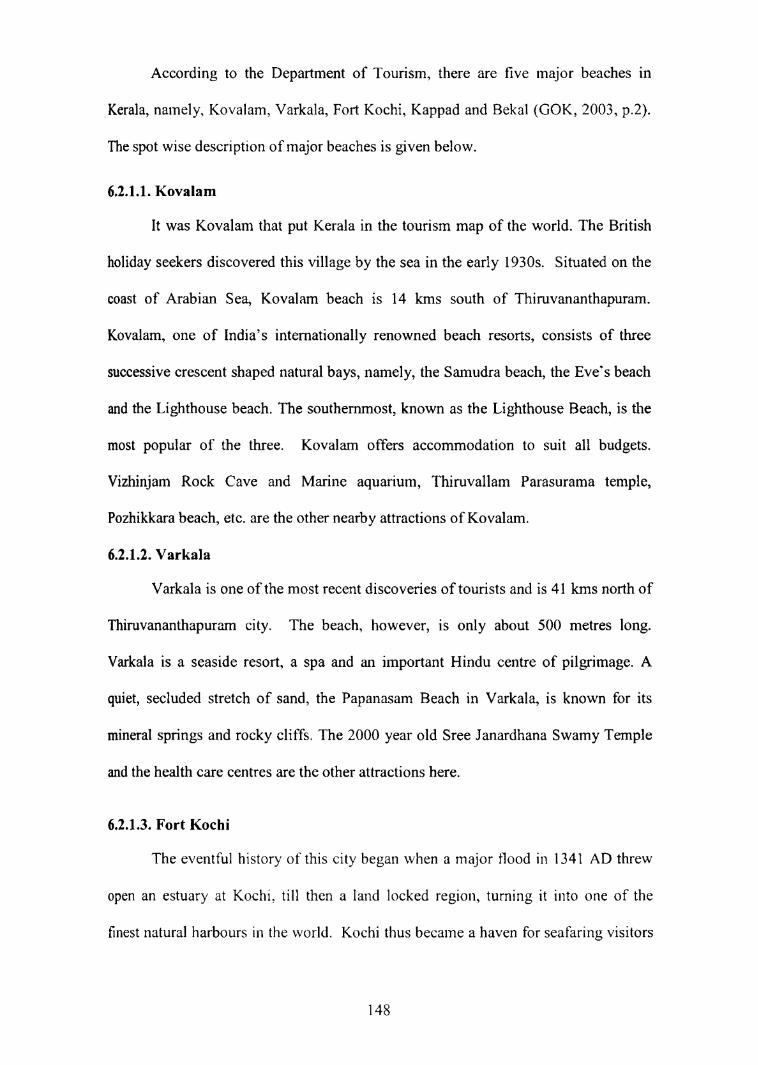
6.2.1.1. Kovalam
It was Kovalam that put Kerala in the tourism map of the world. The British
holiday seekers discovered this village by the sea in the early 1930s. Situated on the
coast of Arabian Sea, Kovalam beach is 14 kins south of Thiruvananthapuram.
Kovalam, one of India’s internationally renowned beach resorts, consists of three
successive crescent shaped natural bays, namely, the Samudra beach, the Eve’s beach
and the Lighthouse beach. The southernmost, known as the Lighthouse Beach, is the
most popular of the three. Kovalam offers accommodation to suit all budgets.
Vizhinjam Rock Cave and Marine aquarium, Thiruvallam Parasurama temple,
Pozhikkara beach, etc. are the other nearby attractions of Kovalam.
6.2.1.2. Varkala
Varkala is one of the most recent discoveries of tourists and is 41 kms north of
Thiiuvananthapuram city. The beach, however, is only about 500 metres long.
Varkala is a seaside resort, a spa and an important Hindu centre of pilgrimage. A
quiet, secluded stretch of sand, the Papanasam Beach in Varkala, is known for its
mineral springs and rocky cliffs. The 2000 year old Sree J anardhana Swamy Temple
and the health care centres are the other attractions here.
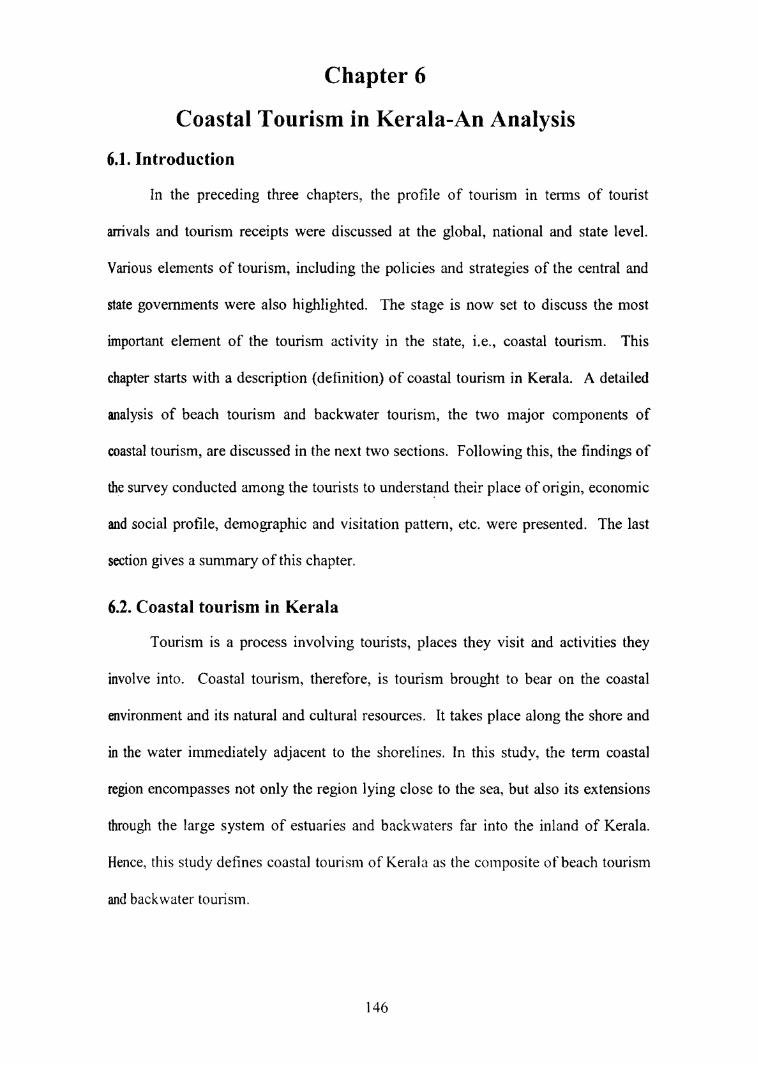
6.2.1.3. Fort Kochi
The eventful history of this city began when a major flood in 1341 AD threw
open an estuary at Kochi, till then a land locked region, turning it into one of the
finest natural harbours in the world. Kochi thus became a haven for seafaring visitors
148

fi'om all over the world and became the first European township in India where the
Portuguese settled in the l5th century. The Dutch wrested Fort Kochi from the
Portuguese in 1663 AD and later the British took over the town in 1795. During
1660s, Fort Kochi peaked in stature as a prime commercial centre and its fame spread
far and wide - variously as a rich trade centre, a major military base, a vibrant cultural
hub, a great ship building centre, a centre for Christianity, and so on. The result of
these cultural influences is seen in the many examples of Indo-European architecture
that still exist here. Today, centuries later, the city is home to nearly thirteen
communities.
The tourist attractions of Fort Kochi are the Vasco Da Gama Square, Santa
Cruz Basilica, St.Francis Church and Bastion Bungalow. The Santa Cruz Basilica, a
church built originally by the Portuguese and elevated to a Cathedral by Pope Paul 1V
in 1558, was spared by the Dutch conquerors who destroyed many Catholic
buildings. Later the British demolished the structure and Bishop Dom Gomez
Vereira commissioned a new building in 1887. Consecrated in 1905, Santa Cruz was
proclaimed a Basilica by the Pope John Paul II in 1984. Fort Kochi is also the
home to one of India's oldest churches, the St.Francis Church. Another important fact
about the church is that Vasco Da Gama, who died in 1524, was buried here before
his mortal remains were returned to Portugal 14 years later.
Apart from these architectural splendours, the Chinese fishing nets and an
array of restaurants serving fresh seafood are popular among the tourists. Records
say that the Chinese fishing nets were first set up between 1350 AD and 1450 AD.
Vasco Da Gama Square, the narrow promenade that parallels the beach, is the best
place to watch the nets being lowered and pulled out of the sea mouth.
149

6.2.1.4. Kappad
This is a historic beach, l6 kms north of Kozhikode, where Vasco Da Gama
landed in 1498, with 170 men in three vessels. A monument on the beach
commemorates this historic event. The rock studded beach is locally known as
Kappakadavu. An interesting feature of the landscape is the sprawling rock that
protrudes into the sea. The temple on the rock is believed to be 800 years old.
6.2.1.5. Bekal
Bekal is at Kasragod, the northem district of Kerala. The beach is also famous
for its Portuguese Fort. Bekal was planned to be developed into an intemational
tourist resort by the year 2000. The developmental activities are yet to be completed.
Among the beaches mentioned above, only Kovalam and Varkala are
developed into full-fledged tourist spots of the state. The number of tourists who
prefer to stay at Fort Kochi is less due to the lack of infrastructure facilities.
Moreover, this beach is not as clean as Varkala or Kovalam. Kappad also is
recognised, but the presence of tourists is negligible. Bekal has already been
recognised, but development is at a slow pace.
Apart from these, there are many minor/potential beaches through out the
state. Among these, Sankumukham and Veli beaches in Thiruvananthapuram,
Mararikkulam beach in Alappuzha, Cherai beach in Emakulam, Kozhikode beach in
Kozhikode, Muzhappilangad beach in Kannur and Valiyaparamba beach in Kasragod
districts, already attract many tourists. Muzhappilangad, the only drive in beach in
Kerala, was featured in many Malayalam and Tamil movies, further increasing the
curiosity of the tourists. Table 6.2 shows the list of potential beaches of Kerala.
0150

Table 6.2: Potential beaches for tourism development in Kerala
District My “Beach es
Thtruvananthapuram
Poovar South
Pulinkudip Rocky cliff, extensive stable beachPozhikkara P Beach, where backwater meets the sea
ssflnkulnuslwltis Beach,archaeolog1cal sites, palace, park
Veli Tourist village, backwater, beach tourism,:_PaTk
Papanasam Cliff, beach, mineral spnng, temple
Kollam
EdavaBarrier beach and backwater at close
Lproximity, coconut groves A
KappilBarrier beach, extensive backwatercoastal road
Paravur PozkikkaMundakkal Park, extensive stable beach
Thirumullavaram Bay beaches, coconut groves, temple
'Pozhi,te1nple, coconut groves
mend o _Palliyamthuruth
Uninhabited island (inlet) with beaut1fulbackwater surroundings
AlappuzhaAlappuzha
Extensive stable beach pier suitable forrecreational fishing
Mararikkulam _ Wide beach so WErnakulam
J
I vCherai Extensive beach backwater, frontage park
ThrissurThalikkulam Wide beachChavakkad Wide beach
Malappuram U _ Vallikkunnu Wide beachKozhikode M Kozhikode W l _Wide beach M
Kannur
MuzhappilangadMeenkunnuPayyambalam
Extensive beach
Ezhimala Promontory and_pocket beaches _ _Vpaliyapairamba if Widebeach with sea_and backwater _
Kasragod i Pallikkara 1 Fort on cliff, wide beaches around,backwater at the vicinity
K _ Kottikkulam p Promontory and pocket beaches around
A nearby place of Muzhappilangad, Dharmadam rhuruthu (a small lsland in
Source: Compiled by the investigator (20
potential place for coastal tourism development
08) from district tourism brochures
the sea, at a walk-able distance from the land at the time of low tide) also IS a
Features _Wide beach, backwater
Wide beach, cliffs _
6.2.2. Backwater tourism in Kerala
A major feature of the coastal region of Kerala is the presence of a large
number of backwaters and canals. These water bodies are locally known as kayals.
There are three major kayals in the southem part of the state, the Vembanad Kayal,
the Ashtamudi Kayal, and the Chetuva Kayal. They have access to the Arabian Sea
through bar mouths and are, therefore, also called the "backwaters". These
backwaters, stretching irregularly along the coastline, support a wealth of marine and
freshwater life due to tidal incursion and excursion containing rich nutrients from the
Arabian Sea. They have ecological significance as they connect the river system with
the sea, act as ecological buffer zone, and support excellent fish fauna as well as other
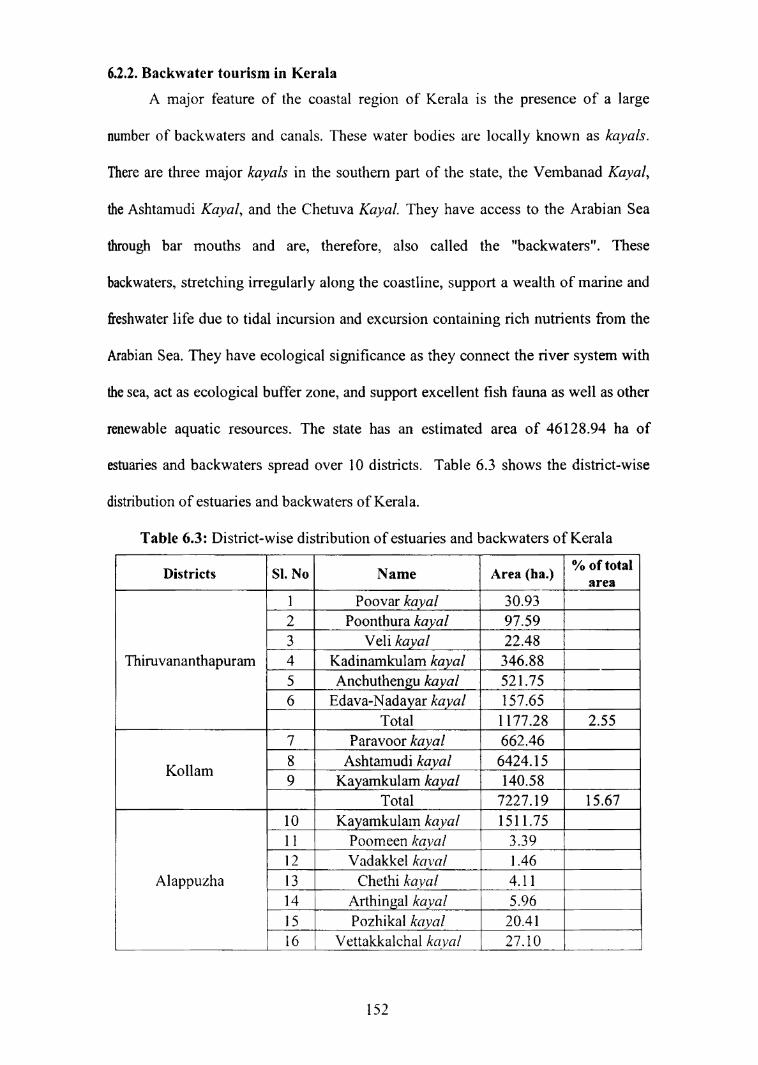
renewable aquatic resources. The state has an estimated area of 46128.94 ha of
estuaries and backwaters spread over 10 districts. Table 6.3 shows the district-wise
distribution of estuaries and backwaters of Kerala.
Table 6.3: District-wise distribution of estuaries and backwaters of Kerala7- . . _ ——,- ——~—— — _____ _ 7*-'—-' '- _' ___ __ __ .2? __ V .I ll l p QDistricts SI. No Name I Area (ha.) % gietztal
Pooyagrwlgayal 30.93
O\k/1-$§~U~Jl\)'—‘
Poonthura kayal 1g_g_97“.p59 H" ' ' 1y Velikagyglg 22.48
Thiruvananthapuram §__,_, Kadinamkulam kayal [_ 346.88 ;. --An¢h“th¢ngu kayal _ . -521-75 r_ g g Edava-Nadayar kaypalg 157.651 p _ Total, ' 1177.28 2.55
pParavoor kaygl 2? H 662.46Konam 5 } Ashtamudikqyal 96424.15
,9 Kayanikulamkayal } 140.58 V ,_,W_,mg Total ,p,7gg7.19 15.67
10 K?Yaml<[email protected] 15.11-751 lg Poomeen kaval 3.39 l7‘? "-4 ,,_, l- I _ _...__>___ 7; 12 _ Vadakkelka _ 1.46 T
Alappuzha 13_ Chethikayal ,_,_ 4.11l 4 14 W .A1Thiflgfl1k“J??*l-. 5-_9.6. - lI 1 l5_Mg Pozhikalkayalpp 20.41
l6 Vettakkalchalkayai M Z7.l0___ ,
152

4 ~—- ._ _117 éVembana(_1kayal 106_6_l .23
Total 12235.39 26.52
Kottaymggw { j 18 %7Ve111ba11ad /~:aya1 2926.77 % 6.3 4
Emakulam19 Vcmbanad kayal 2257.89
%20_ " 4 3 K0chi%%/<¢c%z_val 7.59.3-39
A N Total 9761.69 21.16I
1
Thrissur
21 __% Azhikode kayal !. 82.02<
22 Koclylgalloor kayal 613.8123 Chettuvakayal 713.87Total 1409.70 3.05[ _
‘1
Mal appuram
Kozhikode
24 Puthfipgnnani % 150.831 25 HA P0nna11ifl_c6zyal 757.19i .
1
1
I Z6. PQQT3P"Zha 562.9827 Kadaluntji kayal 323.56
28To 1_ta ?
%%Kada1undi kayal 83.85%“
1294.56 2.81
29 B9:/99.19 ./W91 783.7430 Kallai Puzhaw 160.1331 Z Korapuzha L 1038.08 11
1
1
1 32 _ i Payyolipuzha _ 26-7.0l
33 Kottapuzha { 584.1234 New M21110 puzha 9 88.28
_? Total 2764.90 5.99
Kannur
35 M _ Mahe N 91.89-36 Dhannatlam kaygl 359.0637 V_a1apattanam_% % 4 3077.64 _%
-38 Palakkpde 598 21
1
1:
.1
1
I
1
I __
l
39 f wCheru\(athur3 %_. 5
30.58L
{ Total 4157.42 9.01 "1
1
A Kasra god
40 Cheruvathyrv 1123.1241 _Ni1eswarairn( { 824.6942 Chitta1j% kayal 89.33
'1
43 Be1(a1j{ayal 43.37 1
[_____
44 Kagpil Pozhi% 2.-.22
45 Neebil kgyal 22.47 {46 A j Chandragiri 575.81
47 M98191 puthvr 7 89.7448 Kumbala H 221.54.
1 249 Suvamagiri 6.2250 A Manj eswaram 158.4151 Thalagpadly 17.12
T9191
Total Kcrala3174.04 6.88
46128.94 .H100.00
1
I
a
Source: GOK,( 1993), p.21 M
153
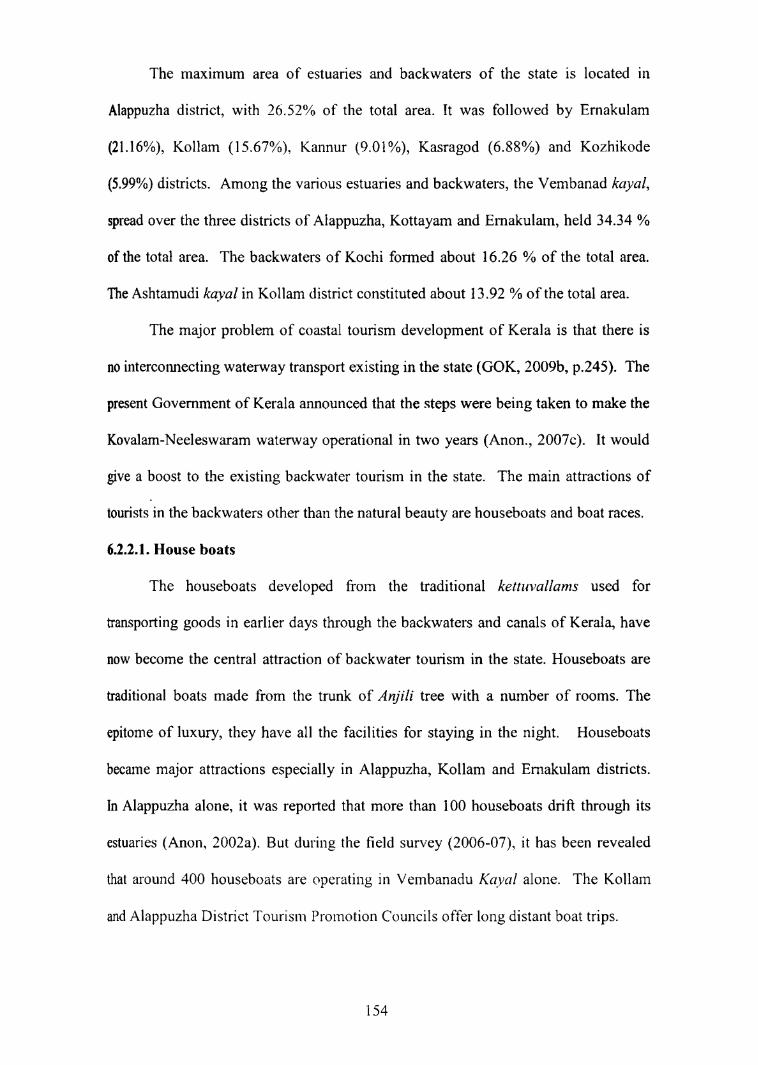
The maximum area of estuaries and backwaters of the state is located in
Alappuzha district, with 26.52% of the total area. It was followed by Ernakulam
(2l.l6%), Kollam (l5.67%), Kannur (9.01%), Kasragod (6.88%) and Kozhikode
(5.99%) districts. Among the various estuaries and backwaters, the Vembanad kayal,
spread over the three districts of Alappuzha, Kottayam and Emakulam, held 34.34 %
of the total area. The backwaters of Kochi formed about 16.26 % of the total area.
The Ashtamudi kayal in Kollam district constituted about l3.92 % of the total area.
The major problem of coastal tourism development of Kerala is that there is
no interconnecting waterway transport existing in the state (GOK, 2009b, p.245). The
present Government of Kerala announced that the steps were being taken to make the
Kovalam-Neeleswaram waterway operational in two years (Anon., 2007c). It would
give a boost to the existing backwater tourism in the state. The main attractions of
tourists-in the backwaters other than the natural beauty are houseboats and boat races.
6.2.2.1. House boats
The houseboats developed from the traditional kettuvallams used for
transporting goods in earlier days through the backwaters and canals of Kerala, have
now become the central attraction of backwater tourism in the state. Houseboats are
traditional boats made from the trunk of Anjili tree with a number of rooms. The
epitome of luxury, they have all the facilities for staying in the night. Houseboats
became major attractions especially in Alappuzha, Kollam and Ernakulam districts.
In Alappuzha alone, it was reported that more than 100 houseboats drifi through its
estuaries (Anon, 2002a). But during the field survey (2006-07), it has been revealed
that around 400 houseboats are operating in Vembanadu Kayal alone. The Kollam
and Alappuzha District Tourism Promotion Councils offer long distant boat trips.
154
The Tourism Department launched a Green Palm Certification scheme in 2002
for houseboats in order to maintain the environmental quality of the surroundings. To
get the Green Palm certification, the house boats should meet the standards set by
Tourism Department (Anon, 2002b). They should provide scientifically designed
septic tanks and bio-chemical tanks to discharge solid wastes and sewage. Energy
sources like solar power should be used for altemative ligating.
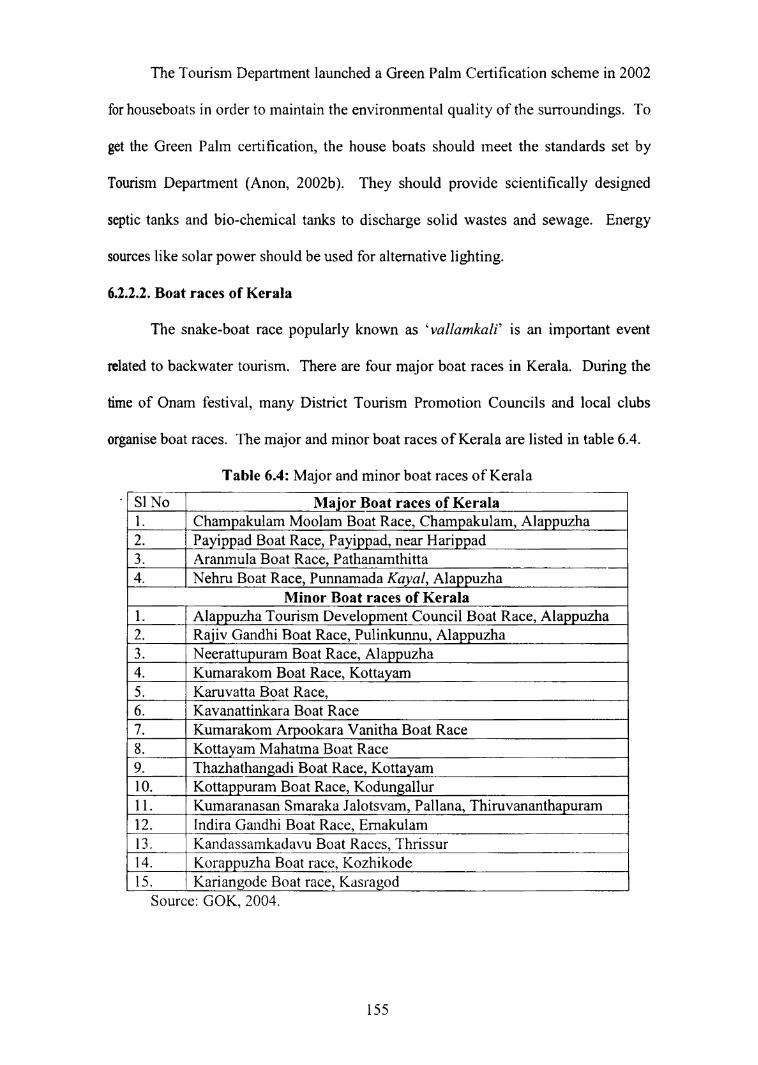
6.2.2.2. Boat races of Kerala
The snake-boat race popularly known as ‘vallamkali’ is an important event
related to backwater tourism. There are four major boat races in Kerala. During the
time of Onam festival, many District Tourism Promotion Councils and local clubs
organise boat races. The major and minor boat races of Kerala are listed in table 6.4.
Table 6.4: Major and minor boat races of Kerala
' Nod? 7 Mi p 2 Major Boatraces of Kerala: 2 2 if1; g Champak_ulampMo0lam Boat Race, Champaku1am,_Alappu,zhag
‘ 2. ljayippad Boat Race, Payippad, near Harippad 7Aranmula BoatRace, Pathan_amthi_tta __ ,_ M g _
, t t N¢hw_B0aI Race, Punnamada Kayak Alaapuzhflt to M t ttp Ni Min0rpB_0at races o_f,Kera]a My g
1 . Alappuzha Tourism Development,Council Boat Race, Alappuzha
P3?“u1,:t>.u.>r\.>»
- i Raiiv§3fln<1hiB<>at Ra¢@.Pu1inkumw, Alflizpuzhatms t t. Ne_erattupuramBoat Race, Alappguzhap g W _M,,
Kumarakom Boat Race, Kottayam ,_ A MppKaruvatta Boat Race, H H _
T . l Kavanattinkara Boat Race
OO\1O\
. Kumarakom ArpookaraYanitha Boat Race, W pi_p . Kottayam Mahatma Boat Race _9. _ Thazhathangadi BoatRace, Kottayam, g10._ KottappuramBoatRace,Kodungallur W Tll.“ plflumaranasan Smaraka J al_ot_svam, Pallana, Thiruvananthapuram p
"12 tindimttcaiidhi B@arRa¢@.Emaku1am--. st t Jit 13., Kandassamkadavu Boat Races, Thrissur14. Korappuzha Boat race, Kozhikodep _, p
15. p T Kariangode Boat race, Kasragod H_ _Source: GOK, 2004.
155
The natural and cultural resources of the coast of Kerala are vast. As the
geographical width of the state is only around 120 kms and considering beach tourism
and backwater tourism as the focal area of tourism development in the state, it can
further develop coastal tourism by using the other resources like rivers, blue- green
mountain ranges, wild life sanctuaries, historical monuments, temples, churches and
mosques, etc. The pleasant climate, with no extremities of weather conditions, also
favours tourism development. Most of the days are sunny and the sky will be clear
except for the rainy days during June to September.
Kerala coast, with a rich endowment of natural attractions of varying
importance, can definitely claim economic benefits in terms of income and
employment through the sustainable development of tourism activity in the state.
Having understood the enonnous potential for coastal tourism development, it is
important to make an analysis of demographic and visitation profile of tourists to
understand the emerging trends in demand for coastal tourism of the state.
6.3. Demographic and visitation profile of tourists
6.3.1. Objectives of the survey
The objectives of the survey were:
i. to understand the demographic profile and the visitation profile of the
domestic and foreign tourists of coastal tourism spots
ii. to study the expenditure pattem of domestic and foreign tourists in coastal
tourism spots, and
iii. to study the level of satisfaction of tourists with regard to the tourist
facilities in the state.
l56

6.3.2. Methodology
In accordance with the objectives of the study, four important coastal tourism
spots of Kerala, namely Kovalam, Varkala, Alappuzha and Fort Kochi were selected
for the study. Thirty foreign tourists and thirty domestic tourists (from outside
Kerala) from each spot were interviewed at random over a period of six months from
October 2006 to March 2007, coinciding with the peak tourist season in coastal
tourism spots. A structured and validated questiomiaire was used to interview the
tourists (appendix 6.1). The investigator himself interviewed the tourists by visiting
each spot once in every month. Children below the age of 15 were excluded from the
interview.
The following section presents the demographic and visitation profiles of the
tourists.
6.3.3. Survey results
The tourist survey results are presented under various headings to cover
variety of information ranging from nationality, age, education, occupation, etc. to
income, mode of transport, entry points, frequency of visit, motivations for the tour
and so on.
6.3.3.1. Distribution of tourists by country/state of origin
Table 6.5 shows the distribution of intemational/ foreign tourists by country of
origin and domestic tourists by the state of origin. Most of the foreign tourists to
Kerala coast arrived ficm UK (25%) followed by Germany (15%). Spain, France
and USA contributed 7.6 % each. Australia (5.6%) Singapore (5.6%) and New
Zealand (5.0%) were next in order.
157

Table 6.5: Origin of foreign and domestic tourist arrivals to the coastal tourism spotsof Kerala (2006-07)
W____ Foreiglillourists Domestic Tourists_, Countrygofggorigin ppm”/0 Stateoforiginq ; “/0,UK g 25.0 gg_. Tamil Nadug i,g___15.8ti g _ Qe_nnany 1 15.0 pi g__Maharashtra j 13.3W K Qaain _ 7.6 "_ Andhra Pradesh 11.71 USA 7.0 Kamataka 9.2France, 7.6 Goa K 7.5 iiAustralia 5.6 West Bengal g 7.5 6-1. Sinsapsre 5-6 M -- Punjabl _ NewgZea1and ; 5.0 fly“, __ Delhi (6.7,I Canada 5 . AssamJ 3 4 5 8Others 17.6 g %%%% if Other states _w__g15.0 LT0;§,i,_, 100.0 Total 1 100.0 1Source: Field Survey (2006-07) T WM
The major contributors to “others” are the Asian countries of Maldives,
Malaysia and Singapore. Tourists from Africa, Middle East and North Pacific regions
(Japan, Korea and China) were not met with. The above observations compare well
with the data compiled by the Department of Tourism, Government of Kerala, which
was presented in table 5.4.
Among the domestic tourists, maximum number of tourists was from Tamil
Nadu (15.8%). The neighbouring state of Kamataka contributed 9.2% of tourists.
The tourists from next near neighbouring states of Maharashtra (13.3%), Andhra
Pradesh (11.7%) and Goa (7.5%) were also of sizeable numbers. Delhi contributed
6.7%. West Bengal and Punjab excelled the performance of Delhi by contributing
7.5% each. About 5.8% tourists were from Assam. The trend observed is similar to
the findings of Government of Kerala, reproduced in table 5.10.
6.3.3.2. Distribution by age
The age-wise distribution of foreign and domestic tourists in Kerala coast is
fumished in table 6.6. About 88.3% of foreign tourists and 89.2% of domestic tourists
158

belonged to the age group of 18-60. The age group of 18 to 50 covered 72.5% foreign
tourists and 73.4% of domestic tourists. The respondents ranged in age from 17 to 68,
but the number of tourists below the age of 18 and above the age of 60 was small in
both categories.
Table 6.6: Distribution of age of foreign and domestic tourists of coastal tourismspots of Kerala (2006-07)
S A e S % of tourists lg g Foreign DomesticBelow 18 A 4.2) g 2.5_
18-30 7 _ 31.7 _ 36.70031-50 40.8 _36.v T9 51160 15.8 ((15.8Ab<>v¢6<> 1. 15 831 Total 100.0 , “100.0Source: Field Survey (2006-07)
6.3.3.3. Educational qualification of foreign and domestic tourists of coastaltourists spots of Kerala
Data on educational status of tourists visiting Kerala coast, presented in table
6.7 show that the majority of foreign (82.2%) and domestic (71.9%) tourists were
graduates or of still higher qualification. Only 7.6% of foreign tourists and 9.4%~of
domestic tourists had an education below the Pre-Degree level.
Table 6.7: Educational qualification of foreign and domestic tourists of coastaltourism spots of Kerala (2006-07)
if iEducational if S % oftourists g UH Qualifications _ Foreign) 1 Domestic
94i Schooling_ 7.6 W pMPre-De_greeg pg _10.2 (1% 18.8Graduation 45.8 36.8i Post graduation 25.4 29.1if PG and above 11.0 6.0 1‘ ___ ~~ _ ~ ' ><{ _5 Total " 100.0 4 100.0
Source: Field Survey (2006-O7)
6.3.3.4. Occupation of tourists
Data on occupation of tourists visiting coastal tourism spots of Kerala are
presented in table 6.8.
159
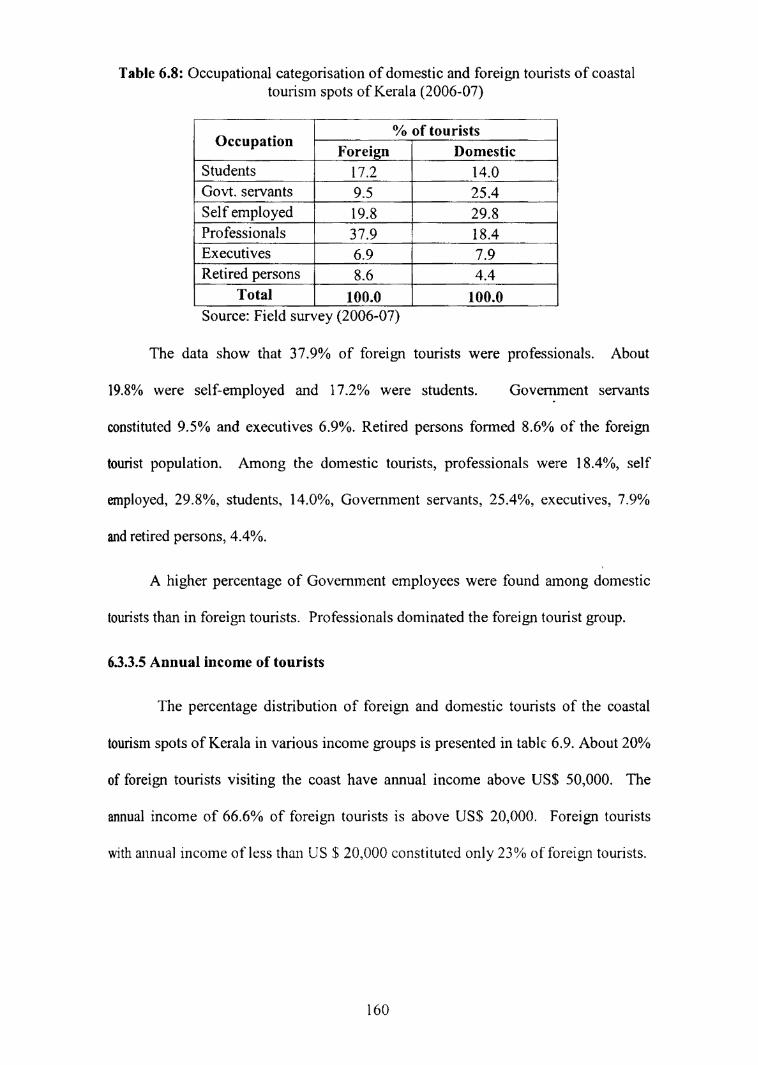
Table 6.8: Occupational categorisation of domestic and foreign tourists of coastaltourism spots of Kerala (2006-07)
, _ % of touristsi Occupation W" , so ~ be , 0_ Foreign W Domestic..__ . 2 an \Students A 17 ,2 Z pg _,14,() i, Govt. servants 9_5 25_4 ig Selfemployed , 19.8 29.8,igProfessionals 737,9 i N 18,4 __,Executives 6,9 g 7,9Retired persons A 8_6 4,4
Total , 100.0 , 100.0Source: Field survey (2006-07)
The data show that 37.9% of foreign tourists were professionals. About
19.8% were self-employed and 17.2% were students. Government servants
constituted 9.5% and executives 6.9%. Retired persons formed 8.6% of the foreign
tourist population. Among the domestic tourists, professionals were 18.4%, self
employed, 29.8%, students, 14.0%, Govemment servants, 25.4%, executives, 7.9%
and retired persons, 4.4%.
A higher percentage of Govemment employees were found among domestic
tourists than in foreign tourists. Professionals dominated the foreign tourist group.
6.3.3.5 Annual income of tourists
The percentage distribution of foreign and domestic tourists of the coastal
tourism spots of Kerala in various income groups is presented in table 6.9. About 20%
of foreign tourists visiting the coast have annual income above US$ 50,000. The
annual income of 66.6% of foreign tourists is above US$ 20,000. Foreign tourists
with annual income of less than US $ 20,000 constituted only 23% of foreign tourists.
160

It may be noted from table 6.8, that 17% of foreign tourists were students and
this may be contributing to the relatively high occurrence of tourists of below US $
10000 annual income among the foreign tourists.
Table 6.9: Income class of tourists visiting coastal tourism spots of Kerala (2006-07)
Foreign tourists Domestic tourists" r -- - 1; 1 ~ ‘ ~— I 3 ‘ "— ‘|Incomelevel ~ 1 Income level ‘ II g(Us$) I % (Rs.) 9/”Below10000 9.2 I Below 100000 l 6.6_ —' ._ ' 7 _'_ _ . _ |
I10001-20000 I 14.2 I 100001-200000 ; 19.1 I20001-30000 10.8 I 200001-300000 if 1124.2
30001-40000 13.3 I 300001-400000 17.5l 40001-520000 I 22.5 gt 400001-5000004 22.35000] and above 7 y_g 7 20.0 Above 500000 10.1 ‘Source: Field Survey (2006~07)
About 10% of the domestic tourists had annual income above Rs.5,00,000.
Nearly 74% of them had annual income above Rs.2,00,000. Only 6.6% of the
domestic tourists had annual income below Rs. 1 ,00,000.
6.3.3.6. Source of information for tourists about Kerala
Data on source of information for tourists visiting coastal tourism spots of
Kerala are presented in table 6.10.
Table 6.10: Source of information for tourists about Kerala (2006-07)
I I fl °/0 Of t0lll‘iStS 1Sources '1 3 . 3* IL g g _ Foreign L gDgmest1gc_Internet g 36“ _g 13%lTe1evision _ 2 _g 3I Books and Journals 1 16 M 7 g g ‘VFriends &Relatives 1 13 1 48 _lL Tour Guides I 27 I 21 gInformation frompreviousvisits g M6 pg _ W g8 MlTotal pg g 100 0 I00 WSource: Field Survey (2006-07)
161

Data presented in table 6.10 indicate that for foreign tourists, the internet was
the most important source (3 6%) of information about Kerala. They also made use of
the tour guides (27%). Books and joumals (16%) and friends and relatives (13%) also
contributed to their knowledge about Kerala. About 6% of tourists collected
information about Kerala during their previous visits to India. However, for the
domestic tourists, the major source of information was friends (48%). Internet,
television, travel guides, etc. provided information to the remaining percentage of
touiists.
6.3.3.7. Mode of transport to Kerala
The particulars regarding the mode of travel used by foreign and domestic
tourists to reach coastal tourism spots of Kerala are fumished in table 6.11.
Table 6.11: Mode of transport used by tourists visiting coastal tourism spots in Kerala(2006-07)
Mode of ForeignTourists pg . 2 DomesticTouriststransport 1 Number % 1* Number of %
; of tourists l__ ¢0l1,.l’i§.t§ if 2): 1iR.ai1.-_ _-- 27 22.50 _73 00.83Air 48.33 ,i26 7‘ 21.6?
l Bus 14.17 . 5. .. 4.17Ship 2.50 0.001 ~ " --i rm rTagci _ 0 137” 10.83 12 1 10.00_Others l 2 l 1.67 4 0 3.33“,, . - 1Totalg_ 120 0 100.00 1 N 120%, H; 100.00Source: Field Survey (2006-07)
The mode of travel used by foreign tourists to reach Kerala included air
(48.3%), rail (22.5%), bus (14.2%), taxi (10.8%) and ship (2.5%). For domestic
travellers rail (60.8%) and air (21.7%) were the main mode of travel to Kerala. Taxi
and bus transport accounted for l4.2%. The relatively high percentage in the use of
train and road by foreign tourists indicates that they are reaching the air terminals
outside the state and from there come to Kerala by train/taxi/'bus.
l62
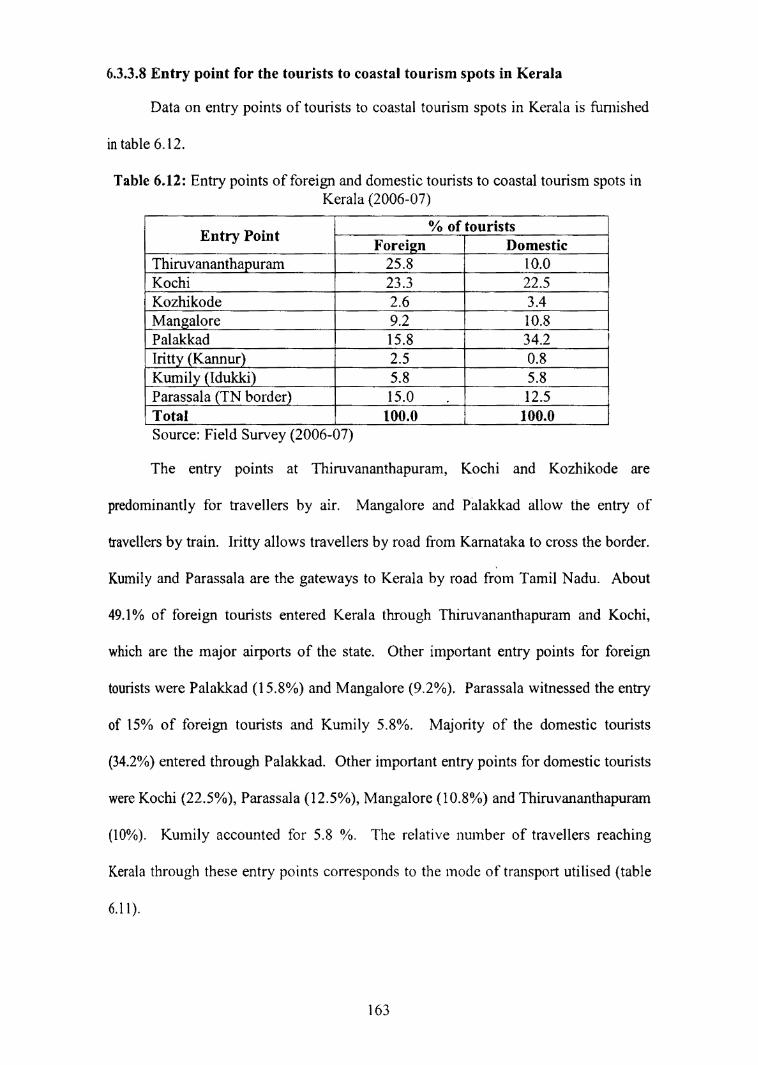
6.3.3.8 Entry point for the tourists to coastal tourism spots in Kerala
Data on entry points of tourists to coastal tourism spots in Kerala is furnished
in table 6.12.
Table 6.12: Entry points of foreign and domestic tourists to coastal tourism spots inKerala (2006-07)
8 0 . 0 it % of tourists 8_ _ Entry Pomt Foreign _g g i “Domestic l
Thirixvananthapuram _ 25.8 W 1 10.0f1<0¢111 23.3“ 22.5 1» *0 e~ ‘ 11 1<¢>zhi1<<><1@ , 2.6 ' 3.4 1g_Mangalore 9.2 g 7 10.8Palakkad g 15.8 , 34.2 1_ln'tty (_Kannur)T g 2.51% _ 0.8g_Kumily (Idukki) g _g A E 5.8 _g 5.8Parassala (TNborder)g i K 15.0 W . U 12.5 ._i]’Total_ _ _g 1 1 100.0 100.0Source: Field Survey (2006-07)
The entry points at Thiruvananthapuram, Kochi and Kozhikode are
predominantly for travellers by air. Mangalore and Palakkad allow the entry of
travellers by train. Iritty allows travellers by road from Karnataka to cross the border.
Kumily and Parassala are the gateways to Kerala by road from Tamil Nadu. About
49.1% of foreign tourists entered Kerala through Thiruvananthapuram and Kochi,
which are the major airports of the state. Other important entry points for foreign
tourists were Palakkad (15.8%) and Mangalore (9.2%). Parassala witnessed the entry
of 15% of foreign tourists and Kumily 5.8%. Majority of the domestic tourists
(34.2%) entered through Palakkad. Other important entry points for domestic tourists
were Kochi (22.5%), Parassala (12.5%), Mangalore (10.8%) and Thimvananthapuram
(10%). Kumily accounted for 5.8 %. The relative number of travellers reaching
Kerala through these entry points corresponds to the mode of transport utilised (table
6.11).
163
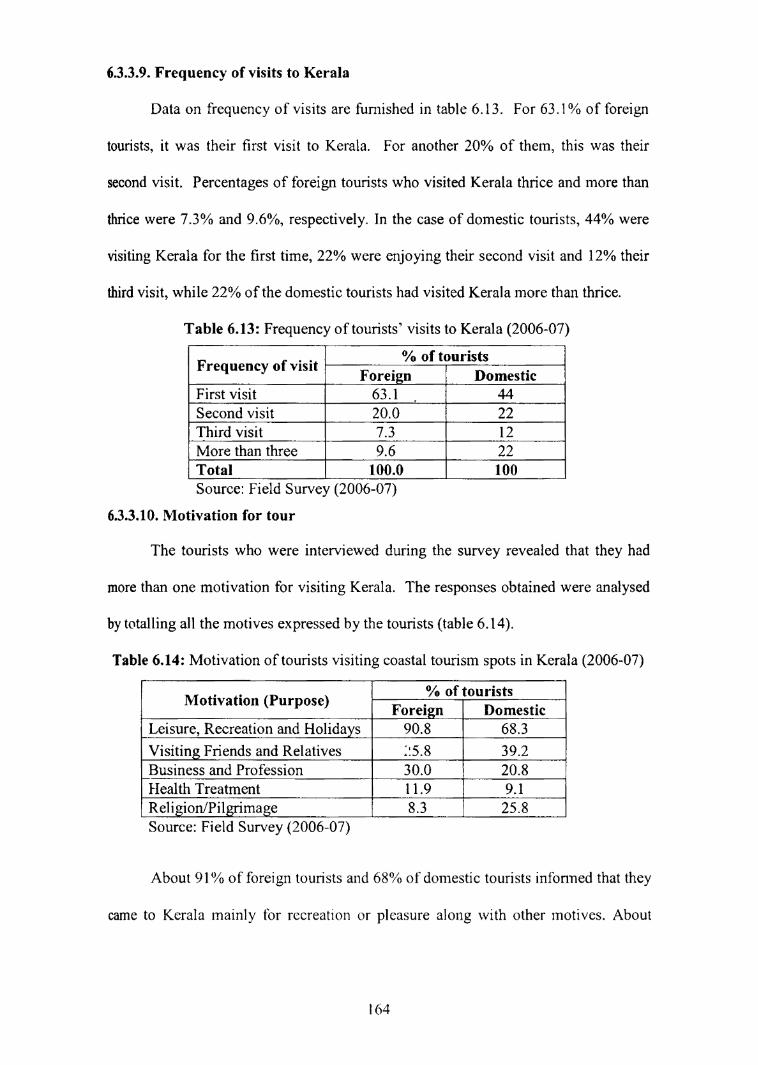
6.3.3.9. Frequency of visits to Kerala
Data on frequency of visits are furnished in table 6.13. For 63.1% of foreign
tourists, it was their first visit to Kerala. For another 20% of them, this was their
second visit. Percentages of foreign tourists who visited Kerala thrice and more than
thrice were 7.3% and 9.6%, respectively. In the case of domestic tourists, 44% were
visiting Kerala for the first time, 22% were enjoying their second visit and 12% their
third visit, while 22% of the domestic tourists had visited Kerala more than thrice.
Table 6.13: Frequency of tourists’ visits to Kerala (2006-07)
i Fre uenc ofvisit 8 if % ofiioiilrists ifq y 6 g Foreign DomesticI:‘.irS¥-.‘iSiI 63-1 44.Secondvisit (129.0 22 "i Third visit 7.3 12(‘More thanthree 9.6 _ M22 71 Total 100.0 100
Source: Field Survey (2006-07)
6.3.3.10. Motivation for tour
The tourists who were interviewed during the survey revealed that they had
more than one motivation for visiting Kerala. The responses obtained were analysed
by totalling all the motives expressed by the tourists (table 6.14).
Table 6.14: Motivation of tourists visiting coastal tourism spots in Kerala (2006-07)I-0‘ ” 7"“ ii 5”” U ” __. , 0 '‘ Motivation (Purpose) ‘ of tourists beH _g Foreign Domestic(Leisure, Recreation and_Holidays 90.8 68.3Visiting Friendsand Relatives" 115.8 g__, 39:2
_Bu_siness and Profession g 30.0 20.8 Tliealth Treatment N g p __Hll.9 Kg _W9.ll Reli_gion/Pilgrimage W 8.3 gggg pg pg 25.8_MgSource: Field Survey (2006-07)
About 91% of foreign tourists and 68% of domestic tourists informed that they
came to Kerala mainly for recreation or pleasure along with other motives. About
l 64
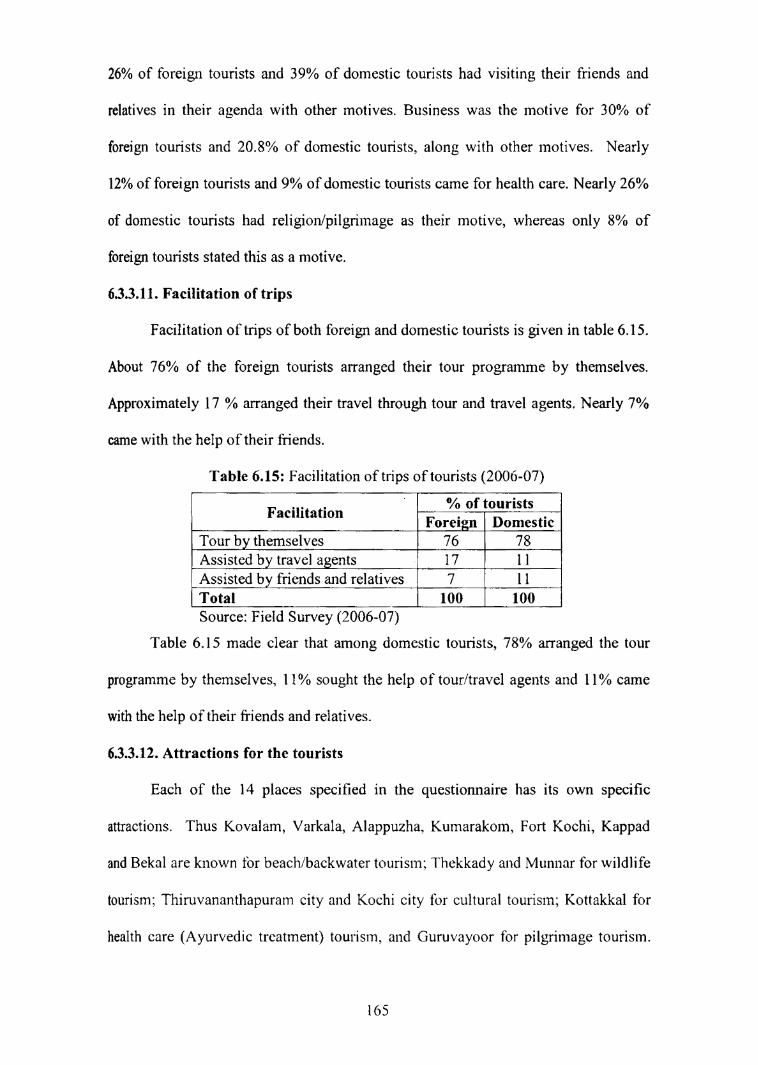
26% of foreign tourists and 39% of domestic tourists had visiting their friends and
relatives in their agenda with other motives. Business was the motive for 30% of
foreign tourists and 20.8% of domestic tourists, along with other motives. Nearly
12% of foreign tourists and 9% of domestic tourists came for health care. Nearly 26%
of domestic tourists had religion/pilgrimage as their motive, whereas only 8% of
foreign tourists stated this as a motive.
6.3.3.11. Facilitation of trips
Facilitation of trips of both foreign and domestic tourists is given in table 6.15.
About 76% of the foreign tourists arranged their tour programme by themselves.
Approximately 17 % arranged their travel through tour and travel agents. Nearly 7%
came with the help of their friends.
Table 6.15: Facilitation of trips of tourists (2006-O7)
1 7 1.. . 7 ‘ % of tourists l¢ Facilitation . err . ‘tr- ,_ 1. -F0f¢lgl1 Domes“.pTour by themselves MW y 76 78, pg_,Assisted by travel agents, _ l7 p ll_Assisted by friends andrelatives 7;“ 7__ pm llTotal __ 100 0100 iSource: Field Sun/ey (2006-07) 7
Table 6.15 made clear that among domestic tourists, 78% arranged the tour
programme by themselves, 11% sought the help of tour/travel agents and 11% came
with the help of their friends and relatives.
6.3.3.12. Attractions for the tourists
Each of the 14 places specified in the questionnaire has its own specific
attractions. Thus Kovalam, Varkala, Alappuzha, Kumarakom, Fort Kochi, Kappad
and Bekal are known for beach/backwater tourism; Thekkady and Muniiar for wildlife
tourism; Thiruvananthapuram city and Kochi city for cultural tourism; Kottakkal for
health care (Ayurvedic treatment) tourism, and Guruvayoor for pilgrimage tourism.
l65
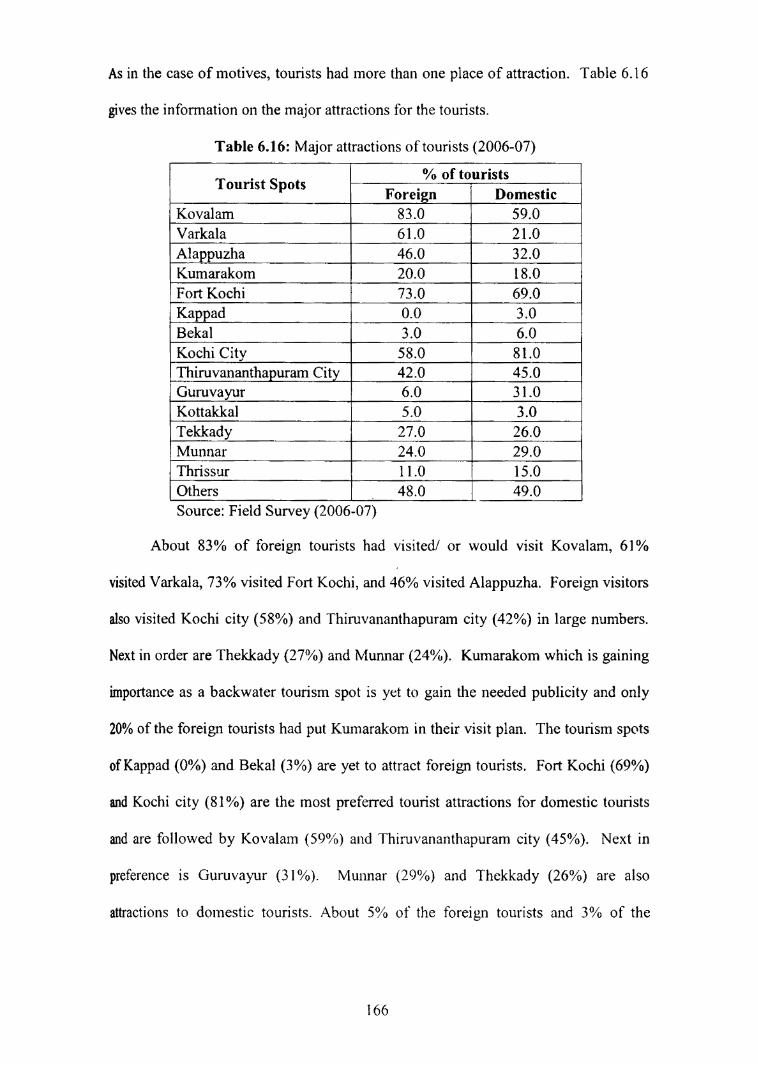
As in the case of motives, tourists had more than one place of attraction. Table 6.16
gives the information on the major attractions for the tourists.
Table 6.16: Major attractions of tourists (2006-07)
j P I _ W Foreign Domestic 1gKovalam 83.0 1 59.0. _ _ _ _ Hi.‘ _Varkala 61.0 21.01
l_ _.. _ __ _ I7lAlappuzha g_ _ 46.0 H * 32.0Kumarakom l 20.0 18.0 1
lFo1tKochig g 73.0 5 _69.0Kappad g_g Lg H 0.0 g g 3.0 lBekal 3.0 6.0 1KochigCity _ (58.0 l 81.0
T_T_'hiruvananthapurarngCity 4210 72 45.0I Guruvaypr g I 6.0 31.0g Kottakkal 5.0 3.0Tekirady g 1 (27.0 26.01 . .._J .._ _ _.%Munnar g _ g 24.0 29.01 Thzissur l 11.0 1 15.0.. . V _ __ _ _ __ ZOthers _ _48.0 g _ 49.0Source: Field Survey (2006-07)
About 83% of foreign tourists had visitedl or would visit Kovalam, 61%
visited Varkala, 73% visited F on Kochi, and 46% visited Alappuzha. Foreign visitors
also visited Kochi city (58%) and Thiruvananthapuram city (42%) in large numbers.
Next in order are Thekkady (27%) and Munnar (24%). Kumarakom which is gaining
importance as a backwater tourism spot is yet to gain the needed publicity and only
20% of the foreign tourists had put Kumarakom in their visit plan. The tourism spots
of Kappad (0%) and Bekal (3%) are yet to attract foreign tourists. Fort Kochi (69%)
and Kochi city (81%) are the most preferred tourist attractions for domestic tourists
and are followed by Kovalam (59%) a11d Thiiuvananthapuram city (45%). Next in
preference is Guruvayur (31%). Munnar (29%) and Thekkady (26%) are also
attractions to domestic tourists. About 5% of the foreign tourists and 3% of the
I66

domestic tourists had plans to visit Kottakkal for Ayurvedic treatment. It may be
noted that the respondents were primarily oriented towards the recreational/pleasure
centres of tourism as the survey was confined to the coastal tourism spots of Kerala.
6.3.3.13. Demand for accommodation units
The percentage distribution of tourists in various classes of accommodation
units is furnished in table 6.17.
Table 6.17: Demand for accommodation units (2006-07)
Classification of" U _ % of touristspp 1H accommodations Foreigilm mg]g)9mestic5 and 4 Star 13.3 l 15.0. 3 Starg 22.5 25/.5 pg1 2 Star 10.0 8.3l 1 Star H H pp pl2.§__ 6.7_ Home Stay _ Z 18.3 _ ‘ pp pppp 1.5Friends and Regtives g 4L2 19.3
l_____gug Others 19.2 21.72Total p l 100.0 (100.0Source: Field Survey (2006-O7)
About 13.3% of foreign tourists and 15% of domestic tourists preferred 5 and
' l
4 star category accommodation. Bulk of the tourists preferred other category (1, 2
and 3 star) of accommodations; approximately 45% of foreign tourists 42.5% of
domestic tourists stayed in such accommodations. Home stays were preferred only by
foreign tourists (18.3%). A higher percentage of domestic tourists (19.3%) found
accommodation with friends and relatives.
6.3.3.14. Expenditure of Tourists
The ultimate objective of all tourism promotion is to encourage the
expenditure of tourists in many ways. The per day expenditure in Kerala was
estimated at Rs.682/- for domestic tourists and Rs.l,764/- for foreign tourists by the
Tourism Department (TCS, 2000). Table 6.18 presents the data obtained from the
present field survey.
167
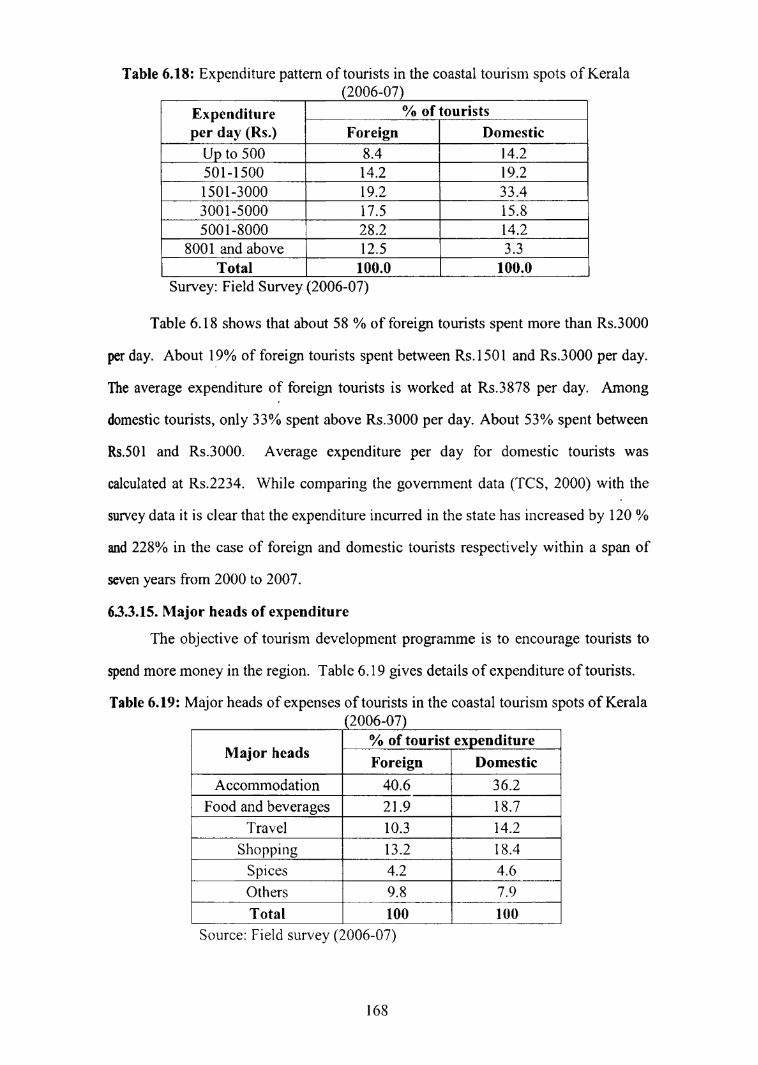
Table 6.18: Expenditure pattem of tourists in the coastal tourism spots of Kerala7 g g (2006-07) Wg_g_1 Expenditure 1 . ....._...‘.’/9. 9ft.9!1.'.l.$.t5.... ..
per day (Rs.) Foreign Domestic“uptssoo "7011 T T 1 T 914.2 1501 -1500 . 14.2 5 19.2 f- - i..s01¢.3000 A 19-2$73001-57000 A 17.5 15.8 é
5001-8000 28.2 g_g_15t.21 s00_1a1<1 above 1 12.5 ‘A 3.3L_ Total l00.0___g_ H _g g_gggggg100,0 7
Survey: Field Survey (2006-07)
Table 6.18 shows that about 58 % of foreign tourists spent more than Rs.3000
per day. About 19% of foreign tourists spent between Rs.1501 and Rs.3000 per day.
The average expenditure of foreign tourists is worked at Rs.3 878 per day. Among
domestic tourists, only 33% spent above Rs.3000 per day. About 53% spent between
Rs.501 and Rs.3000. Average expenditure per day for domestic tourists was
calculated at Rs.2234. While comparing the government data (TCS, 2000) with the
survey data it is clear that the expenditure incurred in the state has increased by 120 %
and 228% in the case of foreign and domestic tourists respectively within a span of
seven years from 2000 to 2007.
6.3.3.15. Major heads of expenditure
The objective of tourism development programme is to encourage tourists to
spend more money in the region. Table 6.19 gives details of expenditure of tourists.
Table 6.19: Major heads of expenses of tourists in the coastal tourism spots of Kerala_ _._(ZQ06-07) .
. _ g % tourist expenditureMQJOT ll€3dS ‘-7 .5 M777” 7” ifF<"<=1gn.- -. - Demestlc 1
Accommodation 40.6 3 6.22 Food and beverages 21.9 18.7Travel 14.2
Shopping 13.2 1 18.41
I__ ._ __ 1______ . . . . . .E 1g Spices 1 4.2 4.6
1-1
E3U-J
Others 9.8 7.9Total 100 H gSource: Field survey (2006-07)
168

r
> Table 6.19 makes clear that nearly 41% of the foreign tourist’s expenditure
was on accommodation, and another 22% on food and beverages. For domestic
tourists also these were major items of expenditure; 36% on accommodation and 19%
on food and beverages.
6.3.3.16. Visitation profile of tourists
According to the Government of Kerala, a foreign tourist would like to spend
16.74 days and domestic tourist 8.55 days in Kerala (TCS, 2000). Visitation profile
of tourists from the present study is given in table 6.20. From the table 6.20 it is clear
that while considering the mean value of tourist’s stay at various destinations,
Kovalam stood first with a mean of 4.2 (foreign: 5.2 and domestic: 2.4), followed by
Kochi city with 4.1 .(foreign: 4.0 and domestic: 4.2). If the median score is
considered, Kochi stood first with 3, and the rest of the places like Kovalam,
Alappuzha, Varkala, Kumarakom, Fort Kochi, Munnar and Thrissur fall in the
favourite list with a median of 2.
7 Table 6.20:Visitation profile (dmays of stay) of tourists (2006307) _
-- pi 1. 1‘ E9r9i:§n D.9.m<=$.ti¢ii Total F9r9ign Dvmestiéi1‘ - .. M. .2; .Tourists s ot /lean em?"
Kovalam 1 5.2 2.4 1 4.2 4.0 2.0 11. ___ _ ____— ~ '~ 7*’ —'— ~-——— ; --~ ‘ -1Varkalamhg 2.9 1.6 12.5 2.0 . 1.0 2.0nlappuzha 2.5 2.0 2.3 1 2.0 1 1.0 1. . 2.0Qnnarakom g pg g g 3.0 2.1 2.6 f 3.0 L 2.0 2.0Fort Kochi 1 ._..__, ._.2.51 1.8 (2.2 2.0 1 2.0Kappad 1 1.0 1 0.0 1.0 1.0 0.01' 1"_"' ""‘ 7 ""2.0
Bekkal
1.01.1 1.2 1.2 1.0 1.0 T 1.0gochicny 4.0 4.2 g 4.1 2.0 1 3.0 3.0Ihiiuvananthapuram City _ 2.0 1.7 1.9 2.0 1 1.5 2.0Gpruvayoor _g g I 1.0 1.4 1.3 1.0 5 pg 1.0 1.0Kottakkal ,1 2_6.5 141721.4 ; 30.0 20.02 20.0Tcldtady 1.9 1 1.2 1.5 < 1.0Munnar
. 2.0 1.02.3 2 1.8 2.01 2.0 1 2.0 2.0
Thrissur 1.9 1 1.6 * 1.8} 2.0 2.0 12.0Qthers : 2.83.1 2.5.____ Y _ _ ———— —2.0 , 2.0 2.0
Source: Field Survey (2006-07)
169
Total

Mean and median score of Kottakkal, was too high i.e., 21.4 and 20, but this
does not mean that Kottakkal is the most favourite destination. It is because the stay
of the tourist is mainly for Ayurvedic treatment (and as far as the results obtained in
this study, the number of tourists visiting Kottakkal is much less compared to other
tourist spots of Kerala).
6.3.3.17. Occupation, educational qualification and tourist expenditure
Here an attempt is made to find out the association of expenditure pattem of
tourists with their educational qualification and occupation. Analysis of Variance
(ANOVA) is used to explain the variation in per capita expenditure by tourists. The
factors considered are country, education, occupation and their interaction effects.
Table 6.21 explains the ANOVA tests. Since the P value is less than the significance
level, one can conclude that according to this model, occupation, country and
education, education and occupation and country, education and occupation have
significant effect on per capita expenditure.
fiTa,ble6.21: ANOVA test on ed_ucation, occupation and tourist expenditure g __
S e Type III Sum df ' Mean F Siourc g.Ofsquares Squares - -2Corrected Model 1s1.900(0) , 51 , 2.980 1.910 10.001Intercept 3805.418 0
hi
3865.4i8 2477.287 0.000(CountryEducation t 7-91°
25.992
LI|I—*
7.9105.198
5.069
3.332
0-Q360.007
Occupation 7 it 17.8594‘
O\
2.970 1.907 0.0827Country * Education 2.010
-I;
0.502 0.322 0.863
Country * Occupation 6. 179
O\
1.030 0.660 0.082Education * Occupation , 371595
'\O
1.-277 1.267 0.210
Country * Education*Occupation
24.901 10 2.490 1.596 0.111
Total,‘ 5 12280408 237 1
_C0rrected Total 1 440.630 236 ‘(a) R Squared, Significant at
0.05 significance level,
1
9 1
(Sig. value is also termed as P (probability) value).Source: Field Survey (2006-07)
170

6.3.3.17.l. Box plot diagram
The relationship between occupation and expenditure of the tourists can be
indicated with the help of Box Plot‘ diagram. It is given in figure 6.1.
Fig. 6.1: Box Plot diagram of occupation and per capita expenditure
40000.00 "
21 1209 ** 5 *30000.00 "
p ta Expend ture
>(
8
47-— $712083
*4aoooo.oo— * 226 *1 62
Perca
38
78* 15 240136 * *1oooo.o0- 1010207
oas
aid é a e at .33
O
._ 24~k
I I I I I I IStudent Govt. Servant Self Employed Professionals Executives Retired Unemployed
Occupation
Source: Field Survey (2006-O7)
' In descriptive statistics, a box plot is a convenient way of graphically depicting the fivenumber summary, which consists of the smallest observation, lower quartile (Q1), median,
upper quartile (Q3) and the largest observation; in additional the box plot indicates whichobservations, if any, are considered unusual, or outliers.
Interpreting a Box Plot diagraml. The box itself contains the middle 50% of the data. The upper edge of box indicates the75'“ percentile of the data set, and lower hinge indicates the 25"‘ percentile. The range of themiddle two quartiles is known as the inter-quartile range.2. The line in the box indicates the median value of the data.3. If the median line within the box is not equidistant from the hinges, then the data is skewed.4. The ends of the vertical lines or ‘whiskers’ indicate the minimum and maximum datavalues, unless outliers are present in which case the whiskers extend to a maximum of l.5times the inter-quartile range (Netmba, 2007)
l7l
The diagram shows that there is no relationship in the per capita expenditure
of the tourists with their occupation. In almost all categories like students,
Government servants, self-employed, professionals and executives, there are people
who spend more amount of money. The extreme values in the diagram represent
those people who spend more amount of money. The numbers in the diagram are the
identification number (data entry number) of the tourists who incurred the
expenditure.
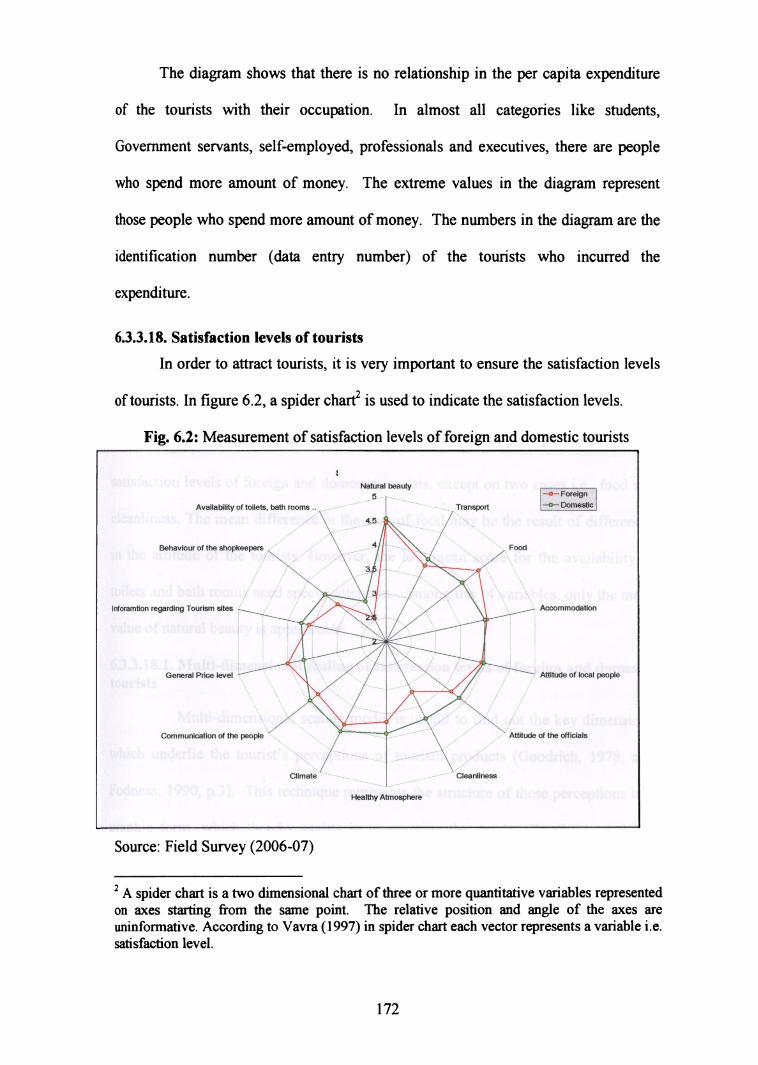
6.3.3.18. Satisfaction levels of tourists
In order to attract tourists, it is very important to ensure the satisfaction levels
of tourists. In figure 6.2, a spider chart: is used to indicate the satisfaction levels.
Fig. 6.2: Measurement of satisfaction levels of foreign and domestic tourists
l
Natural beauty p_w__m__:5 ;—-O-— Foreign }Availability of toilets, bath rooms 1 _ Transport l_‘_'°___ " D°m°$fi° l
4 5
4 iBehaviour of the shopkeepers , ll J, _ Food. V V I, __/3. i ; “‘\+XI ‘ll ‘.. I J_.lnforamtion regarding Tourism sites -______‘_ I __,___-_~ Accommodation.> , (»
- ‘"__—'. lGeneral Price level r’ i Attitude of local people
Communication of the people ' I " Attitude of the officialsIClimate ‘ Clea nllness
Healthy Atmosphere
Source: Field Stuvey (2006-O7)
2 A spider chart is a two dimensional chart of three or more quantitative variables representedon axes starting from the same point. The relative position and angle of the axes areuninformative. According to Vavra (1997) in spider chart each vector represents a variable i.e.satisfaction level.
172
In this study 14 variables, namely natural beauty, transport, food,
accommodation, attitude of local people, attitude of the officials, cleanliness, healthy
atmosphere, climate, communication of the people, general price level, information
regarding tourism sites, behaviour of shop keepers and availability of toilets and bath
rooms were considered. The satisfaction levels with respect to each variable were
measured and presented. Each axis in this spider chart represents one variable. The
mean scores of satisfaction levels of both foreign and domestic tourists are plotted on
the axis. The mean scores obtained and marked in the vectors were then joined
together to form ellipsoids to understand the differences in the satisfaction levels of
foreign and domestic tourist’s visits to Kerala.
Figure 6.2 shows that there is not much of a difference between the
satisfaction levels of foreign and domestic tourists, except on two cases i.e., food and
cleanliness. The mean difference in the case of food may be the result of differences
in the attitude of the tourists. However, the low mean score for the availability of
toilets and bath rooms need special attention. Among the 14 variables, only the mean
value of natural beauty is appreciable.
6.3.3.l8.1. Multi-dimensional scaling of satisfaction levels of foreign and domestictourists
Multi-dimensional scaling model is useful to find out the key dimensions
which underlie the tourist’s perceptions of tourism products (Goodrich, 1978, and
Fodness, 1990, p.3). This technique represents the structure of these perceptions in a
graphic form, which thereby assists in interpreting the results (Knlskal and Wish,
1978). ln the questionnaire, respondents were asked to rate on a five point scale on the
fourteen variables (section 6.4.3.18). Mean deviation of satisfaction levels of tourists
are given in table 6.22.

Table 6.22: Mean deviations of satisfaction levels of tourists (2006-O7)
Attributes ‘ heNature People NaturForeign tourists “T, Domestic tourists .
e 1 P Pl 1__Q0 6 i
Naturalbeauty fly _ 2.0l49 0.0700 2.11779 -0.0771 if
Transport 0.23 s3 0.3263 0.4605 0.25931 1
Food 1.4929 -0.2078 0.0008 1.ss41__Accommodation Z g 1 0,8436 0.2041
T0.5004 0.7054
nttitude of local people _ 7 0.6259 0.4560 0.6760 0.1342,‘Attitude of the officials -0.3713 -0.4978 L 0.0456 _-0.2909
Cleanliness _ _ <r5s3a -1.2586 0.0116 -0.7085 1
Healthy atmosphere g -0.2408i
l -0.6859 0.5160 -1.1144 iiClimate _ 0.7605 -0.1469 0.7319 -1.03540Communication of the people i 0.0075 ~0.75 84
J _1
I
P 0.0231 0.4146
Qeneralprice level U mg 0-3273 0.5324 -0.7920 0-3708 0lnfomiation regarding tourism sites m -0.2197 0.2909 -0.03 93 -0.0674
Behaviour of the shopkeepgersg g -1.3164 1.1874 -0.7390
évailability of toilets, bath rooms 4 -3.0794 1
1 0.4879 -3.6033 -0.1246 1Source: Filed Survey (2006-07)
Here, the dimensions ‘nature’ represents natural attractions, and ‘people’
represents man-made attributes of tourism development. From table 6.22 it can be
seen that both the foreign and domestic tourists assigned a high value to natural
beauty of the state, which indicates the importance of protecting the natural
environment of Kerala for sustaining the tourism sector of the state. The response of
foreign and domestic tourists regarding the availability of toilets in the state is poor.
As regards the cleanliness of the state, the foreign and domestic tourists differed in
their opinion, with the fonner considering it as a major concern and latter not so
serious. The domestic tourists reported adversely about the general price level, the
behaviour of shop keepers and the information regarding tourism sites.
For a visual understanding of the perceptions, the data are reproduced in figure
6.3 for foreign tourists and in figure 6.4 for domestic tourists. The figures give a
174

spatial display of fourteen attributes in the study in two dimensions as obtained from
the Multi-dimensional scale (MDS) model.
Fig. 6.3: Multi-dimensional scalingyfor satisfaction levels of foreigp tourists__WM
1
0
l -1.
.5
People
P
i -0.
1 51‘
.0*~.
l
O__l-_
5*,
04
IBehaviour of the shopkeepers
. _ Q General Price levelAttitude oflocalpeople OAvailability of toilets, bath rooms .. . Qnansport
Inforamtion regarding Tourism sites gccommodau-on .Climate Natural beauty' 0
Food
O Attitude of the officials
Healthy Atmosphere . .Communication of the people
CleanlinessOZ l i‘ i * 0‘ I l ""-3 -2 -1 0 1 2
Nature
Source: Field Survey (2006-07)
y Fig. 6.4: Multi-djinensionalscaling for satisfactionlevels of domestic t0un'sts
4
l
I
People
-0.5
l: -1.0
1.5
1.0-+
0.5
0.0
i-u
l
I 0. I_ Availability oftoilets, bath rooms .. Amtude °f‘°“' °e°°'° . l
i 2.0% “ " i s " =O
Food
Accommodation
Comm 'ation ofthe eo Ie iGeneral Price level . . .uTr;laCnSport p p i
Natural beauty ?
Q Inforamtion regarding Tourism sites .O " - iBehaviour of the shopkeepers O Amtude of me omoals i
Cleanliness
O CI' tHealthy Atmosphere O ‘ma em l i l "*~4 -3 -2 -1 0 1 2 L‘ ls ' F0” l Tl "i "0
Nature
Source: Field Survey (2006-07)
"175

With regard to satisfaction levels, Wilson observes that the foreign tourists
visiting India are well aware of the litter and garbage problems in public places, poor
standards of hygiene in many of the restaurants, primitive toilet facilities in the
wayside refreshment shops and abuse of sanitation. However, they visit India because
of the persuasion of their friends who visited India earlier. The powerful attractions
and incentives to tourists include the near perfect climate, cloudless skies, cheap
accommodation, variety of food and drinks, enjoyable beaches, friendly local people
and a general lack of harassment (Wilson, 1997). Visitors anticipate that services and
facilities will be bad. Afier all, dirt, poverty, time-consuming bureaucracy and
general chaos are all part of common foreign perception of daily life of India. So they
get a better treatment than expected unlike the experiences from other destinations
like Caribbean, where ‘paradise imagery’ is the prime marketing strategy, but the
tourists are harassed on the beaches and roads (Wilson, 1997).
6.3.3.19. Difficulties faced by tourists
The public response towards strikes/hartals is quite negative in Kerala, as it
leads to much economic loss to the state. About 21.7% of the foreign tourists and
18.3% of the domestic tourists complained that they were affected by different types
of strikes in Kerala. It was also found that 14.2 % of foreign tourists and 8.3% of
domestic tourists were affected because of holidays. Most of the museums were
reported closed on Mondays/Tuesdays. From local to state levels, strikes were
common in Kerala. According to Mathrubhumi News Paper (Anon., 2007d) there
were six state—wide harrals and 200 regional hartals in Kerala during the period 2000
to 2007.
I76

6.4. Summary
The underlying assumption of the study was that coastal tourism acts as the
backbone of Kerala tourism, and keeping this in mind, a detailed review of the two
components of coastal tourism of the state i.e., beach tourism and backwater tourism
was made in this chapter. An analysis of the coastal tourism resources of the state
identified the presence of major and minor beaches for development of beach tourism
and the presence of backwater resources; house boats, boat races (vallam kali), etc. for
the development of backwater tourism. This section also observed one of the major
short comings of backwater tourism development in Kerala, i.e., the lack of
interconnectivity of water transport in the state.
This chapter further gave a lengthy analysis of the demographic and visitation
profile of tourists to understand the emerging trends in coastal tourism demand in the
state. The major coastal tourism generating countries for the state are UK, Germany,
Spain, USA and France. A study of the demographic profile of coastal tourists
showed that the majority of both foreign and domestic tourists were middle aged (31
50 years), highly educated (graduation and above) and well placed (professionals,
govemment servants). The annual income of majority of foreign tourists was above
US$ 20,000 and that of domestic tourists above Rs.2,00,000. For foreign tourists,
internet was found to be the main source of information about Kerala. For domestic
tourists, the main source of infonnation was friends and relatives. The majority of
foreign tourists were found to reach Kerala by air and domestic tourists by rail.
Thiruvananthapuram and Kochi were the main entry points for the foreign tourists,
whereas Palakkad and Kochi were the main entry points for domestic tourists. A
small percentage of tourists made more than two visits to Kerala. ‘Leisure and
177

recreation’ was the main motive for travel for both the foreign and domestic tourists
and their most favourite locations are the coastal tourism spots. A study of the
expenditure pattern of domestic and foreign tourists showed that there was significant
difference in the expenditure by the two categories. The per capita daily expenditure
calculated was Rs.3878 for foreign tourists and Rs.2234 for domestic tourists. The
major items of expenditure for both foreign and domestic tourists were
accommodation, food and beverages.
The demand for home stay was found to be high among foreign tourists and
friends and relatives providing accommodation to a good percentage of domestic
tourists. Strikes, hartals and unexpected holidays in Kerala were reported to have
affected many of the tourists during their trips.
The analysis of the satisfaction levels revealed that both foreign and domestic
tourists attributed their satisfaction to the natural beauty of the state, which indicated
the importance of protecting the natural environment of Kerala for sustaining tourism
development of the state. The next chapter is an attempt to assess the economic
impacts of coastal tourism development in Kerala.
l78