Embed Size (px)
Citation preview
Ph.D Thesis 2014
Chapter 6 Page 202
Chapter 66 Compatibility of Electrolyte and Electrode Materials with LTCC
6. Compatibility of Electrolyte and Electrode
Materials with LTCC
The earlier Chapters of this Thesis have given detailed description
about synthesis of nano-crystalline electrolyte and electrode materials
for Solid Oxide Fuel Cells (SOFC). We have seen optimization of
synthesis parameters for oxygen ion conductor (Gadolinium doped
Ceria), with respect to its structural, morphological and electrical
characterization in Chapter 3. Synthesis and characterization of two
proton ion conductors viz. Yttrium and Ytterbium doped Barium
Zirconate (BZYYbO) and Yttrium doped Barium Cerate is discussed in
Chapter 4. The experimental results for the preparation and
characterization of anode and cathode materials, viz. Copper Zinc oxide
(CuZnO) and Samarium and Strontium doped Cobaltite (SSC) is
presented in Chapter 5. The present Chapter is an important part of
this Thesis as it presents a detailed study on compatibility of the above
mentioned materials with standard LTCC materials, leading to device
fabrication.
6.1 Need for compatibility
Electrolyte and electrodes are important components of solid
oxide fuel cells. All these components in SOFC are made up of ceramic
(oxide) materials. As we have seen before, these materials require high
sintering temperature, which is usually above 1200°C. Their physical
properties, such as, shrinkage, temperature Co-efficient of Expansion
(TCE), thermal conductivities are dependent on constituent materials.
Especially, being a ceramic material they have high TCE values and low
thermal conductivity. On the hand, LTCC is a glass ceramic technology

Ph.D Thesis 2014
Chapter 6 Page 203
which has low sintering temperature, low TCE valuable 6.1 presents a
comparison of important properties of SOFC and LTCC materials.
Physical Properties SOFC materials LTCC materials (DuPont 951)
Materials type Ceramics Glass-ceramics
Sintering temperature (oC) >1200 875
Operating temperature (oC) 800-1000 600
Temperature Co-efficient of expansion (ppm/oC)
>12 5.8
Thermal conductivity (W/mK) 1-2 3.0
Density (gms.cm-3) >6 3.1
Shrinkage (%) 14% @1350°C 12.9% @ 875°C
Table 6.1: Overview of present status of physical properties of materials
used in SOFC and LTCC
It is clearly seen from Table 6.1 that the physical properties
of materials used in SOFC are quite different from that for LTCC. Their
chemical properties are also dissimilar. Electrodes of SOFC are
chemically active and are involved in catalytic reactions during SOFC
operation. On the contrary, LTCC materials are highly inactive in
sintered state. The electrical properties of SOFC and LTCC are also very
different from each other. The SOFC electrodes are mixed conductors,
the electrolytes are charge conductor at high temperature, while the
LTCC materials are essentially used as dielectric material having low
dielectric constant and low dielectric loss. It is clearly seen that most
physical, chemical and electrical properties of SOFC and LTCC
materials are in conflict with each other. Nevertheless, we have
undertaken the task of integrating these materials in view of enormous
advantage offered by the integrated and low temperature SOFC. This
Chapter presents details of our efforts to make these two different
materials technologies compatible with each other.
In order to overcome these dissimilarities in various properties of
SOFC and LTCC materials, there is a need to first tune up the physical
properties of SOFC materials by formulating new combinations of
materials or by adding some additional materials as sintering aid to
reduce sintering temperature, matching shrinkage and other physical
Ph.D Thesis 2014
Chapter 6 Page 204
properties. Tuning of the rest properties would follow. Note that the
sintering temperature of an electrolyte is very high (1350°C) compared
to anode and cathode materials (900-1100°), Further, the density of
electrolyte (must be >96%) is very important factor in ionic conductivity
properties. Therefore, study of electrolyte material becomes more
important than the electrode materials. Clearly there is a need of an
appropriate sintering aid that can lower the sintering temperature of
SOFC ceramic electrolyte to the range of LTCC firing temperatures,
while simultaneously achieving the required sintering density. A
carefully selected sintering aid, either in crystalline or in the form of
glass, may help in lowering sintering temperature of SOFC electrolyte
without compromising its ionic conductivity properties. The following
Section describes the detailed study about effect of chosen sintering
aids on physical, chemical and electrical properties of SOFC electrolytes
GDC and BCYO.
6.2 Effect of sintering aids on Gadolinium doped Ceria
To study effect of sintering aids on Gadolinium doped ceria, first
Bismuth oxide (Bi2O3) was selected as sintering aid in GDC. This is
because Bi2O3 is a well known high temperature oxygen ion conductor
in its δ-FCC phase below 825°C (727–824°C) and its crystal structure
matches well with GDC. It has high polarizability in cataion network
due to highly disordered anion structure. About 25% intrinsic vacancies
are present in Bi2O3, Bi2+ ions have good ability to accommodate
asymmetry present in lattice structure. Bi2O3 has low melting
temperature close to 850°C, and enormous densification properties due
liquid phase sintering capabilities (1). Due to these favourable
properties, Bi2O3 is good candidate as sintering aid for GDC, and was
chosen for experiments (2) (3). The experimental procedure and results
are described in following Sub-section.
6.2.1 Bi2O3 as sintering aid
The experiments were carried out by adding different weight
proportion of Bi2O3 (99.8% nanocrystalline Sigma Aldrich) in GDC nano
Ph.D Thesis 2014
Chapter 6 Page 205
powder synthesized using the optimized preparation condition given in
Chapter 3. These weight proportions are 1, 2, 5, 8 and 10% respectively.
These powders were first wet ground in agate pestle mortar for 1 hr. A
25% PVA solution prepared in DI water was then added as binder and
was mixed thoroughly. Pellets of this mixture were pressed by applying
280 MPa pressure for 10 min. These pellets were fired at 850°C for
2hrs. This temperature was chosen in view of the melting temperature
of Bi2O3. Density of fired pellets was measured by weight-volume
method. Platinum paste (Heraeus CL-11 7589, USA) was applied on
both surface and fired again at 800°C for 2hrs. Electrical
characterization was done impedance analysis using AUTOLAB PGSTAT
100 Potenstiostat/Galvanostat in the temperature range of 400-600°C
and in frequency perturbation of 1Hz-1MHz.
Bi2O3-GDC pellets fired at 850°C have shown shrinkage in the
range of 3-5%, which increases with Bi2O3 content. The density of these
pellets was above 80% and it was highest (~95%) for 2% Bi2O3.
Interestingly, the ionic conductivity of these pellets was found to be
higher than that recorded for GDC at 600°C. Table 6.2 presents
measured shrinkage, density and ionic conductivity of Bi2O3 added GDC
pellets.
Weight % of
Bi2O3
Shrinkage when
fired at 850°C
Density (%) Ionic conductivity at
600°C (× 10-3 S.cm-1)
1 2.2 81 6
2 5.3 95 11
5 4.6 94 6
8 3.4 93 3
10 3.1 87 2
Table 6.2: Effect of Bi2O3 added to GDC in different proportions along
with the shrinkage, density and ionic conductivity, for pellets fired at
850°C
Table 6.2 indicates that with increasing Bi2O3 content, the
properties of GDC pass through a peak. The shrinkage, density and
ionic conductivity properties were found to be highest at 2% Bi2O3
content and reduced as the Bi2O3 content increased further. Clearly,
higher weight percent of Bi2O3 found inappropriate in all respect. The
Ph.D Thesis 2014
Chapter 6 Page 206
highest conductivity at 2% Bi2O3 was recorded as 0.011 S.cm-1 at
600°C. In contrast, ionic conductivity of pure GDC sintered at 1350°C is
reported to be 0.014S.cm-1. Decrease in shrinkage, density and ionic
conductivity in case of 5-10% doped Bi2O3 may be attributed to longer
sintering dwell times and evaporation of Bi2O3. Hence, it can be
concluded that Bi2O3 may be useful with GDC as sintering aid and 2
wt%. Similar results 0.022S.cm-1 has been reported in literature;
however, sintering temperature was 1400°C (2). Present work improved
these results by achieving density and conductivity better than that
reported in literature (2).
Even though, Bi2O3 improved the results in terms of lower
sintering temperature, high density and improved ionic conductivity at
lower (600°C) operating temperature it is not a perfect choice as
sintering aid for LTCC applications, as maximum shrinkage obtained
was just 3.1%, which is far lower than 13-15% reported for LTCC. Even
an increase in sintering temperature to 1000°C for GDC+2%Bi2O3
pellets showed shrinkage of 5.4% which was low compared to LTCC.
This shrinkage mismatch would induce stresses during cooling part of
the firing cycle, causing warpage and even cracks in the LTCC
structures. In order to achieve LTCC equivalent shrinkage values, the
sintering aid must be in the form of glass as glass addition is expected
to increase shrinkage (4), (5). Low temperature melting recrystallized
glasses offer higher shrinkage values due to their higher agglomeration
mechanism (6). Hence, some low temperature melting glasses were
prepared by conventional solid state reaction and water quenching
method. Effect of different glasses on the ionic conductivity of GDC
pellets is discussed in the following Sub-section.
6.2.2 Glasses as sintering aid in case of GDC
Low temperature melting borate and phosphate glasses based on
Bismuth oxide are prepared to use as sintering aid in GDC electrolytes.
Boron oxide (B2O3) and Phosphorous Pentaoxide (P2O5) are low melting
temperature oxides having melting points 450°C and 360°C
Ph.D Thesis 2014
Chapter 6 Page 207
respectively. Also it is reported that P2O5 glasses are very good protonic
conductors (7), (8). Bi2O3 and V2O5 also have melting points around
817°C and 690°C respectively. These two oxides together form oxygen
ion conducting phases commonly known as BIMEVOX. BiVO4, Bi4V2O11,
Bi3.5V1.2O8.25, Bi23V2O44.5 and Bi8V2O17 are some of the oxygen ion
conducting phases of Bi2O3 and V2O5 (9). These phases are oxygen ion
conductors at high temperature (400-600°C). It is also reported that
Bi2O3-P2O5 glasses are exhibit phonon-assisted hopping conduction at
high temperatures (200-400°C) (10). Hence, by considering ionic
conductivity and low melting temperature of these oxides, B2O3, P2O5,
Bi2O3 and V2O5 were selected for synthesis of these glasses. The glasses
are synthesized by solid state reaction method. Four different
compositions were tried with GDC as reported in the following.
6.2.2.1 Synthesis of glasses
Row materials in the form of oxides were selected for synthesis of
glasses. Bismuth oxide (Bi2O3; 99.9% Sigma Aldrich), Vanadium
Pentaoxide (V2O5; >99.6% Sigma Aldrich), Boron oxide (B2O3; 99.9%
Sigma Aldrich) and Ammonium Phosphate (NH4H2PO4; >98% Sigma
Aldrich) were mixed together in different molar proportions as given in
Table 6.3.
Glass Name (Glass code)
Mole % Bi2O3
Mole % of V2O5
Mole % of B2O3
Mole % of NH4H2PO4
BBVP 63 7 15 15
BVP 40 40 0 20
BVO 66 33 0 0
Table 6.3: Composition of different glasses synthesized by conventional
mixing, melting and water quenching process.
Acetone (HPLC grade; Merck make) was added to mixture and
milled on three roll mill for 96 hrs using Zirconia balls in polythene
container. This oxide mixture was then dried and loaded in a 99%
Alumina crucible. This mixture was calcined at 900°C for 2hrs, at ramp
rate of 5°C/min and molten mass was poured into DI water. A yellow
colored glass frit was obtained in all cases. This glass frit was ground
again in an agate pestle-mortar to fine powder. Pellets were pressed of a
Ph.D Thesis 2014
Chapter 6 Page 208
mixture of GDC added with 10 wt% of each glass. These pellets were
fired at 1000°C for 40 min. The shrinkage was calculated by comparing
dimensions before and after firing and its density was measured by
weight-volume method. Platinum paste (Heraeus CL-11 7589, USA) was
applied on both surface and pellets were fired again at 850°C. These
pellets were used to measure ionic conductivity using impedance
analysis (AUTOLAB PGSTAT 100 otentiostat/Galvanostat) by employing
frequency perturbation in 1Hz to 1 MHz frequency range and at
different temperatures between 400°C-600°C. The selection of best glass
composition was done on the basis of sintering properties and ionic
conductivity measurements.
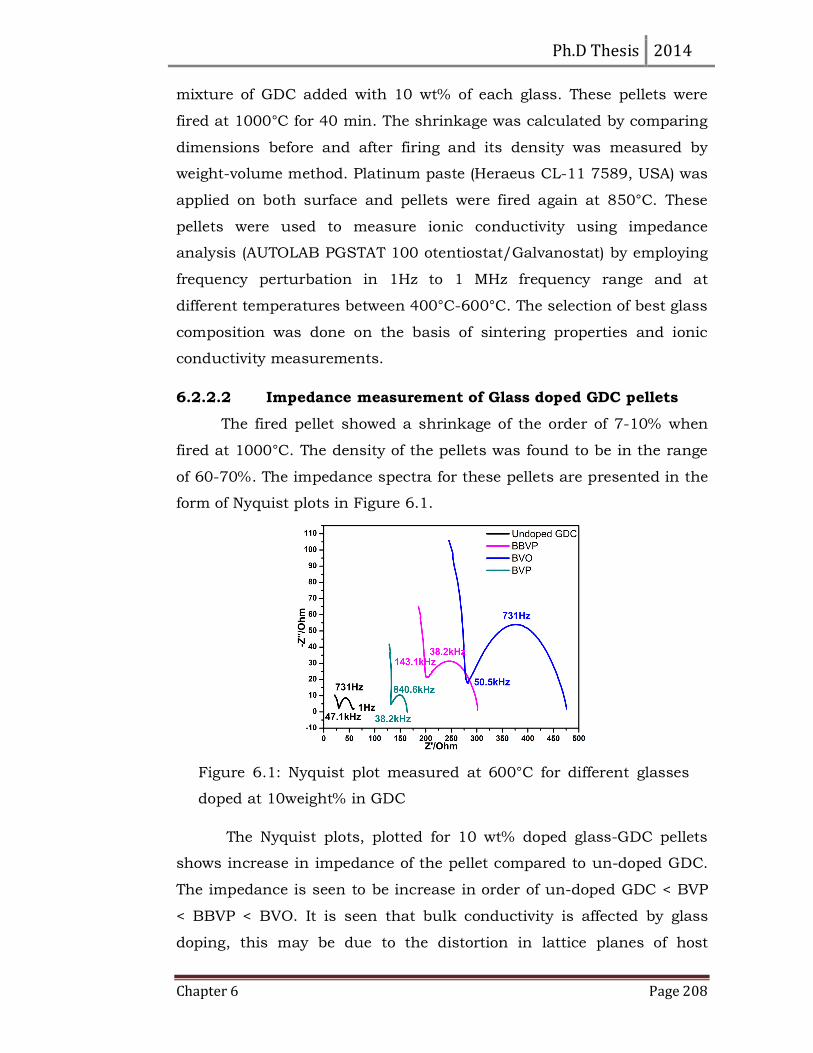
6.2.2.2 Impedance measurement of Glass doped GDC pellets
The fired pellet showed a shrinkage of the order of 7-10% when
fired at 1000°C. The density of the pellets was found to be in the range
of 60-70%. The impedance spectra for these pellets are presented in the
form of Nyquist plots in Figure 6.1.
The Nyquist plots, plotted for 10 wt% doped glass-GDC pellets
shows increase in impedance of the pellet compared to un-doped GDC.
The impedance is seen to be increase in order of un-doped GDC < BVP
< BBVP < BVO. It is seen that bulk conductivity is affected by glass
doping, this may be due to the distortion in lattice planes of host
Figure 6.1: Nyquist plot measured at 600°C for different glasses
doped at 10weight% in GDC
Ph.D Thesis 2014
Chapter 6 Page 209
material due to crystallization of glass. The addition of glass at 10wt% is
not only located at grain boundaries but also can diffuses in grains of
GDC and deteriorates the lattice structure of GDC. Grain boundary
impedance is also seen increased indicating poor grain boundary
structure due to presence of glasses. The grain boundary impedance is
found to be relatively lower for the pellets with BVP glass. Comparing
with the impedance of BVO glass it can be concluded that P2O5 in the
glass structure may be aiding ionic conduction across grain boundaries
(10). Higher impedance in case of BBVP glass is due to presence of
higher wt% of B2O3 in glass, addition of B2O3 above 0.4wt% and
sintering temperature above 850°C lower ionic conductivity is reported
in literature (11). The effect of glass doping on GDC in terms of
shrinkage, density and ionic conductivity is tabulated in Table 6.4.
Glass added
in GDC
Shrinkage at
1000°C (%) Density (%)
Total ionic conductivity at
600°C (x10-3 S.cm-1)
BBVP 10.22 69.5 4.0
BVP 7.22 63.4 2.9
BVO 10.44 68.7 0.2
Table 6.4: Shrinkage, density and total ionic conductivity measured for
10 wt% glass doped GDC pellets fired at 1000°C
From the results presented in Table 6.4 one can conclude that
using glass as sintering aid is much helpful with respect to the
shrinkage, especially in comparison with Bi2O3. However, the ionic
conductivity deteriorates. Clearly, the presently used glasses would not
be useful, and a different glass composition may be required.
One of the noticeable outcomes of the above experiments
conducted with glasses was the observation of lower grain boundary
impedance for BVP glass, although this glass composition showed
lowest shrinkage, density and ionic conductivity. It was, therefore,
decided to use this glass with the addition of some alkali oxide, since
alkali oxides are known ionic conductors. For example, Lithium and
Ph.D Thesis 2014
Chapter 6 Page 210
Sodium are well know alkali oxide used in batteries (12). Potassium
oxide (K2O) is an alkali oxide having anti-fluorite crystal structure, large
atomic radii of Potassium comparative with Phosphorous and
Vanadium. Hence it was decided to add K2O in Bi2O3-V2O5-P2O5 glass. A
glass composition used to study was x(Bi2O3-K2O)-y(V2O5-P2O5), wherein
both x and y vary from 0 to 0.51.
x(Bi2O3-K2O)-y(V2O5-P2O5) (abbreviated as BKVP) was synthesized
using conventional solid state reaction, melting and water quenching
method. Initially 10 wt% glass was added in GDC and pellets were
pressed and fired at 1000°C for 40 min. The platinum paste was applied
on both surfaces and fired again at 850°C for 40min. The ionic was
conductivity measured using impedance analysis as stated above.
The sintered pellet showed shrinkage of 12.78% and density
measured was found to be 6.49gms.cm-1, which is 92% of the
theoretical density. The increase in shrinkage and density was
attributed to lowered glass transition temperature of BKVP glass
compared to BVP glass. The glass transition temperature of BKVP was
found to be 650°C compared to BVP glass 730°C. This improvement
also brought about improvement in the electrical properties. The ionic
conductivity results indicated improvement in the conductivity due to
addition of K2O in glass. Figure 6.2 presents comparison of Nyquist
plots measured for all the glasses added to GDC at 10 wt%, the 2 wt%
Bi2O3 in GDC and undoped GDC measured at 600°C.
1 Exact glass composition is under patenting process.
Ph.D Thesis 2014
Chapter 6 Page 211
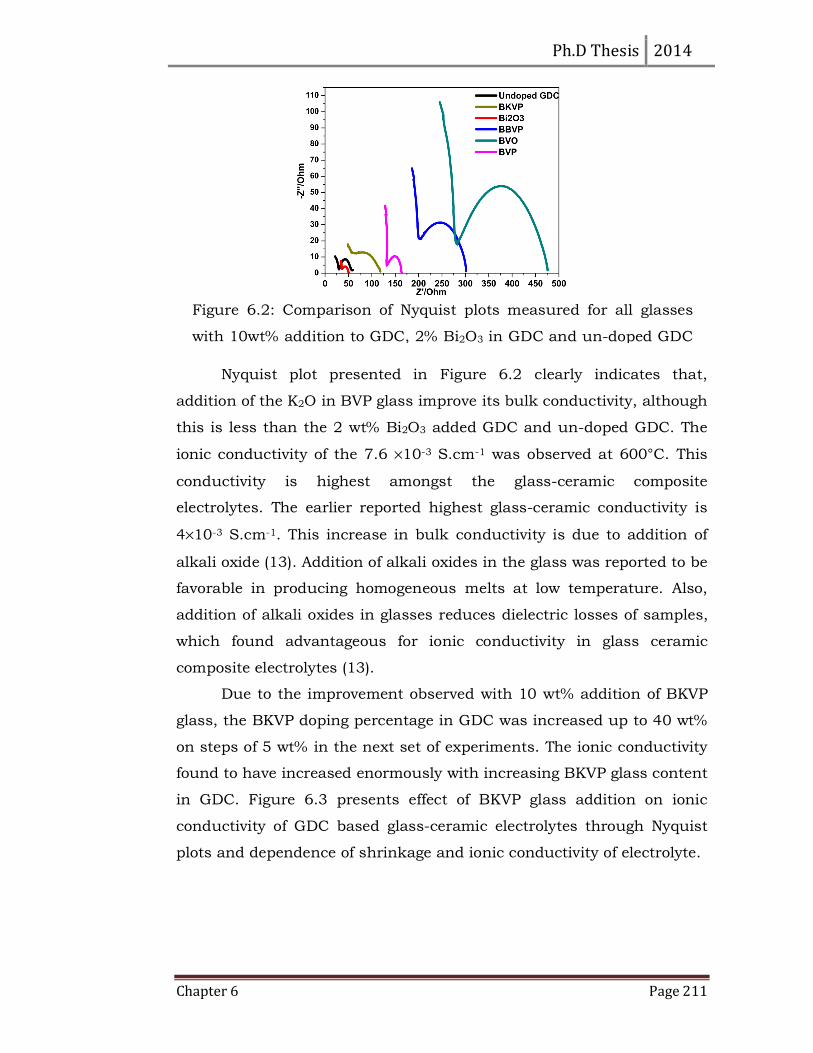
Nyquist plot presented in Figure 6.2 clearly indicates that,
addition of the K2O in BVP glass improve its bulk conductivity, although
this is less than the 2 wt% Bi2O3 added GDC and un-doped GDC. The
ionic conductivity of the 7.6 ×10⁻³ S.cm-1 was observed at 600°C. This
conductivity is highest amongst the glass-ceramic composite
electrolytes. The earlier reported highest glass-ceramic conductivity is
4×10⁻³ S.cm-1. This increase in bulk conductivity is due to addition of
alkali oxide (13). Addition of alkali oxides in the glass was reported to be
favorable in producing homogeneous melts at low temperature. Also,
addition of alkali oxides in glasses reduces dielectric losses of samples,
which found advantageous for ionic conductivity in glass ceramic
composite electrolytes (13).
Due to the improvement observed with 10 wt% addition of BKVP
glass, the BKVP doping percentage in GDC was increased up to 40 wt%
on steps of 5 wt% in the next set of experiments. The ionic conductivity
found to have increased enormously with increasing BKVP glass content
in GDC. Figure 6.3 presents effect of BKVP glass addition on ionic
conductivity of GDC based glass-ceramic electrolytes through Nyquist
plots and dependence of shrinkage and ionic conductivity of electrolyte.
Figure 6.2: Comparison of Nyquist plots measured for all glasses
with 10wt% addition to GDC, 2% Bi2O3 in GDC and un-doped GDC
Ph.D Thesis 2014
Chapter 6 Page 212
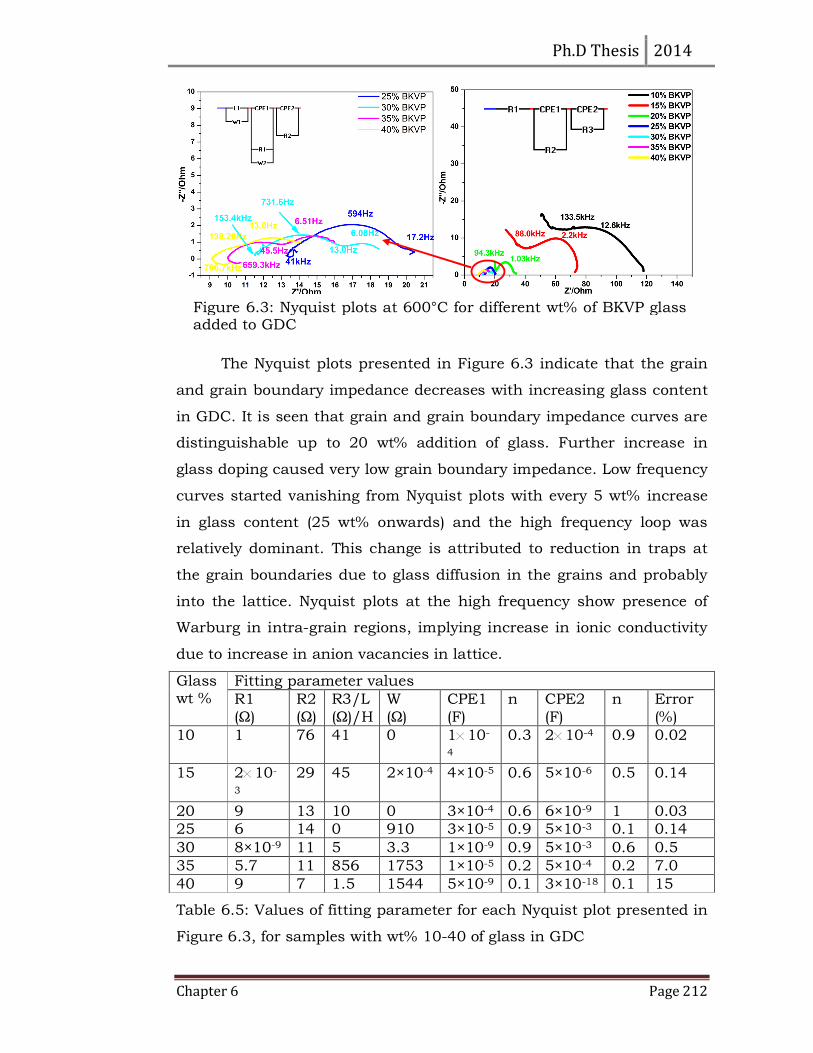
The Nyquist plots presented in Figure 6.3 indicate that the grain
and grain boundary impedance decreases with increasing glass content
in GDC. It is seen that grain and grain boundary impedance curves are
distinguishable up to 20 wt% addition of glass. Further increase in
glass doping caused very low grain boundary impedance. Low frequency
curves started vanishing from Nyquist plots with every 5 wt% increase
in glass content (25 wt% onwards) and the high frequency loop was
relatively dominant. This change is attributed to reduction in traps at
the grain boundaries due to glass diffusion in the grains and probably
into the lattice. Nyquist plots at the high frequency show presence of
Warburg in intra-grain regions, implying increase in ionic conductivity
due to increase in anion vacancies in lattice.
Glass wt %
Fitting parameter values
R1
(Ω)
R2
(Ω)
R3/L
(Ω)/H
W
(Ω)
CPE1
(F)
n CPE2
(F)
n Error
(%)
10 1 76 41 0 1×10-
4
0.3 2×10⁻⁴ 0.9 0.02
15 2×10-
3
29 45 2×10⁻⁴ 4×10⁻⁵ 0.6 5×10⁻⁶ 0.5 0.14
20 9 13 10 0 3×10⁻⁴ 0.6 6×10⁻⁹ 1 0.03
25 6 14 0 910 3×10⁻⁵ 0.9 5×10⁻³ 0.1 0.14
30 8×10⁻⁹ 11 5 3.3 1×10⁻⁹ 0.9 5×10⁻³ 0.6 0.5
35 5.7 11 856 1753 1×10⁻⁵ 0.2 5×10⁻⁴ 0.2 7.0
40 9 7 1.5 1544 5×10⁻⁹ 0.1 3×10-18 0.1 15
Table 6.5: Values of fitting parameter for each Nyquist plot presented in
Figure 6.3, for samples with wt% 10-40 of glass in GDC
Figure 6.3: Nyquist plots at 600°C for different wt% of BKVP glass added to GDC
Ph.D Thesis 2014
Chapter 6 Page 213
It is seen from the Table that, grain and grain boundary
contribution to ionic conductivity increases with increase in glass
weight addition. The fitting values of R2 lowered with increase in glass
addition. The R3 resistance is corresponding to grain boundary
resistance replaced by inductance. This implies very high ionic diffusion
across grain boundaries.
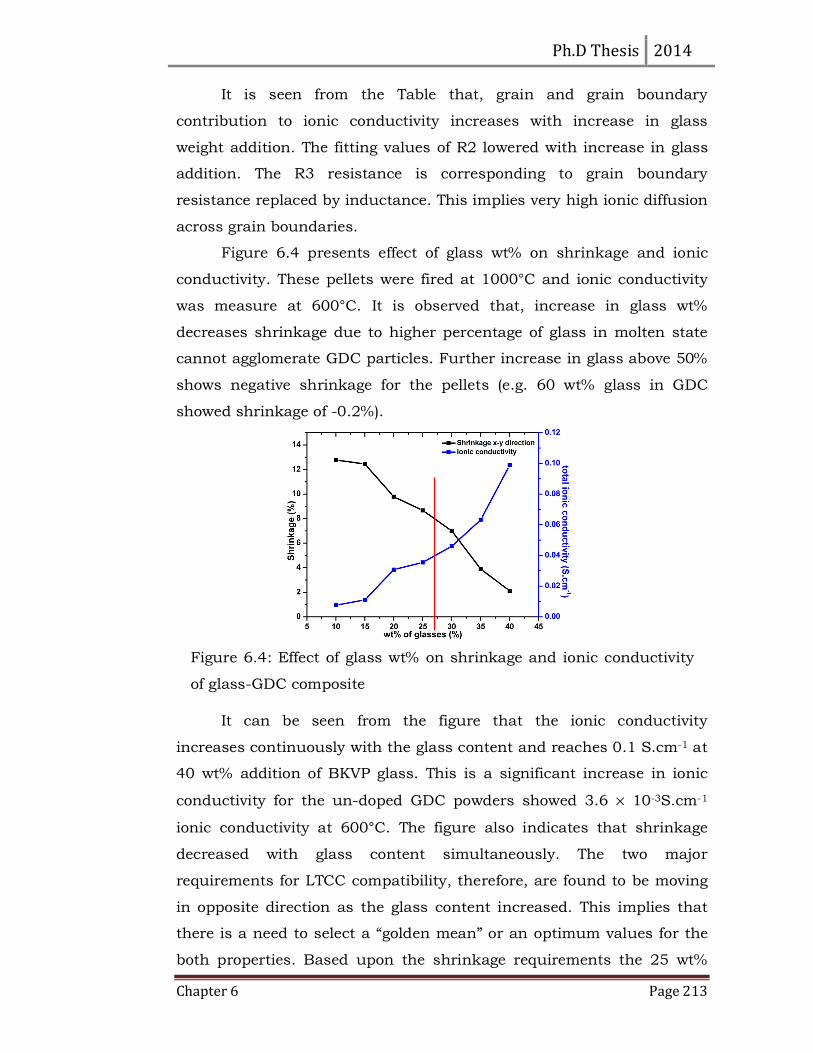
Figure 6.4 presents effect of glass wt% on shrinkage and ionic
conductivity. These pellets were fired at 1000°C and ionic conductivity
was measure at 600°C. It is observed that, increase in glass wt%
decreases shrinkage due to higher percentage of glass in molten state
cannot agglomerate GDC particles. Further increase in glass above 50%
shows negative shrinkage for the pellets (e.g. 60 wt% glass in GDC
showed shrinkage of -0.2%).
It can be seen from the figure that the ionic conductivity
increases continuously with the glass content and reaches 0.1 S.cm-1 at
40 wt% addition of BKVP glass. This is a significant increase in ionic
conductivity for the un-doped GDC powders showed 3.6 × 10⁻³S.cm-1
ionic conductivity at 600°C. The figure also indicates that shrinkage
decreased with glass content simultaneously. The two major
requirements for LTCC compatibility, therefore, are found to be moving
in opposite direction as the glass content increased. This implies that
there is a need to select a “golden mean” or an optimum values for the
both properties. Based upon the shrinkage requirements the 25 wt%
Figure 6.4: Effect of glass wt% on shrinkage and ionic conductivity
of glass-GDC composite
Ph.D Thesis 2014
Chapter 6 Page 214
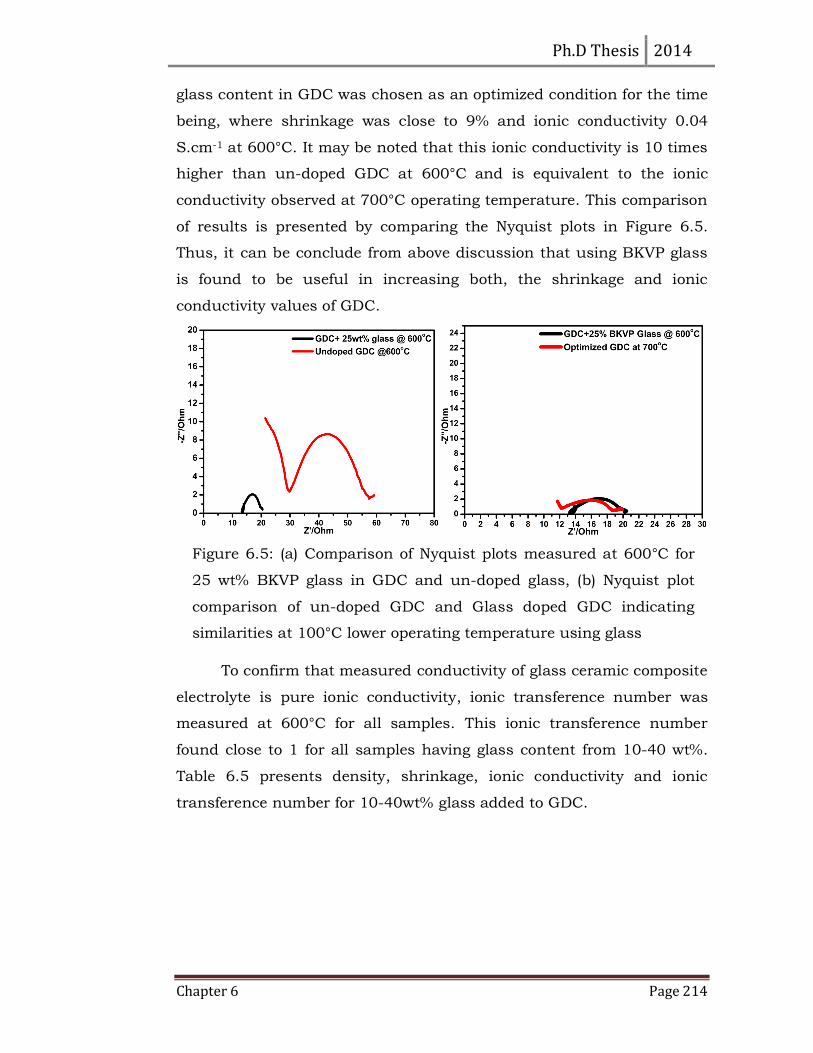
glass content in GDC was chosen as an optimized condition for the time
being, where shrinkage was close to 9% and ionic conductivity 0.04
S.cm-1 at 600°C. It may be noted that this ionic conductivity is 10 times
higher than un-doped GDC at 600°C and is equivalent to the ionic
conductivity observed at 700°C operating temperature. This comparison
of results is presented by comparing the Nyquist plots in Figure 6.5.
Thus, it can be conclude from above discussion that using BKVP glass
is found to be useful in increasing both, the shrinkage and ionic
conductivity values of GDC.
To confirm that measured conductivity of glass ceramic composite
electrolyte is pure ionic conductivity, ionic transference number was
measured at 600°C for all samples. This ionic transference number
found close to 1 for all samples having glass content from 10-40 wt%.
Table 6.5 presents density, shrinkage, ionic conductivity and ionic
transference number for 10-40wt% glass added to GDC.
Figure 6.5: (a) Comparison of Nyquist plots measured at 600°C for
25 wt% BKVP glass in GDC and un-doped glass, (b) Nyquist plot
comparison of un-doped GDC and Glass doped GDC indicating
similarities at 100°C lower operating temperature using glass
Ph.D Thesis 2014
Chapter 6 Page 215
Weight% glass added
in GDC
Shrinkage (%)
Density of pellets
(gm.cm-3)
Ionic conductivity at 600°C
(×10-3 S.cm-1)
Ionic transference
number
10 12.78 5.25 7.6 0.99
15 12.44 6.20 11.0 0.99
20 9.78 5.90 30.7 0.99
25 8.67 5.82 35.4 0.99
30 7.00 5.74 40.6 0.99
35 3.89 5.32 63.3 0.98
40 2.11 5.30 98.8 0.98
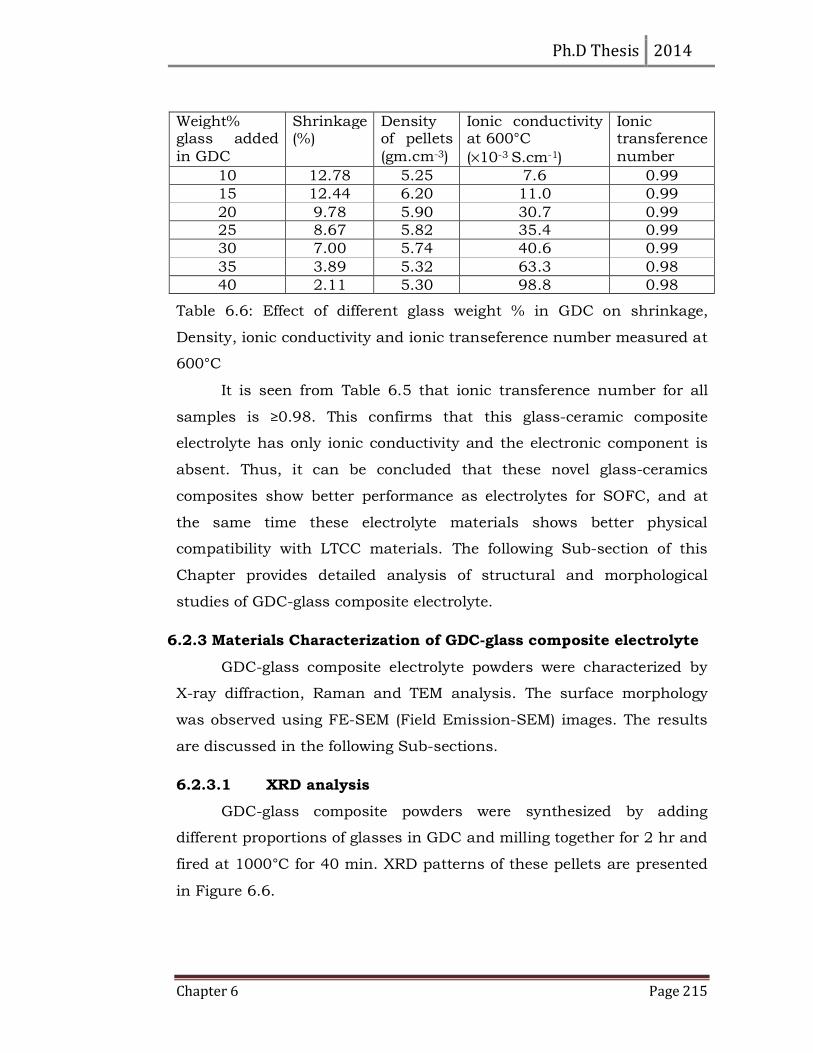
Table 6.6: Effect of different glass weight % in GDC on shrinkage,
Density, ionic conductivity and ionic transeference number measured at
600°C
It is seen from Table 6.5 that ionic transference number for all
samples is ≥0.98. This confirms that this glass-ceramic composite
electrolyte has only ionic conductivity and the electronic component is
absent. Thus, it can be concluded that these novel glass-ceramics
composites show better performance as electrolytes for SOFC, and at
the same time these electrolyte materials shows better physical
compatibility with LTCC materials. The following Sub-section of this
Chapter provides detailed analysis of structural and morphological
studies of GDC-glass composite electrolyte.
6.2.3 Materials Characterization of GDC-glass composite electrolyte
GDC-glass composite electrolyte powders were characterized by
X-ray diffraction, Raman and TEM analysis. The surface morphology
was observed using FE-SEM (Field Emission-SEM) images. The results
are discussed in the following Sub-sections.
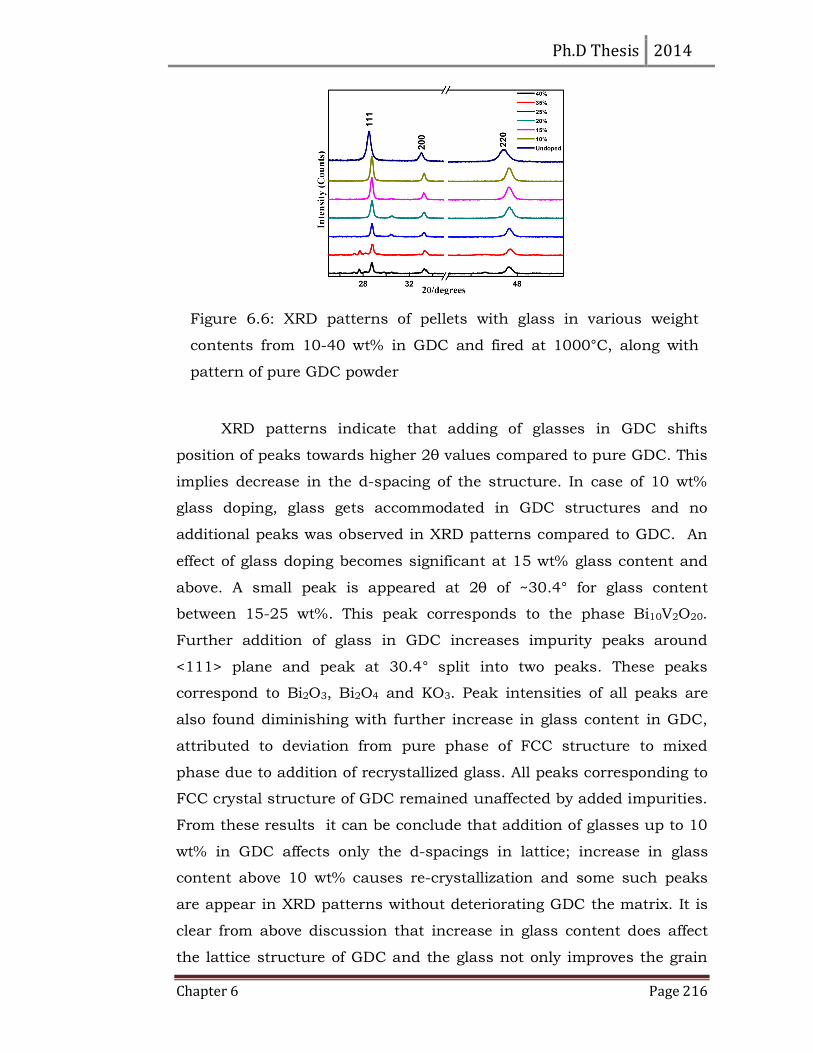
6.2.3.1 XRD analysis
GDC-glass composite powders were synthesized by adding
different proportions of glasses in GDC and milling together for 2 hr and
fired at 1000°C for 40 min. XRD patterns of these pellets are presented
in Figure 6.6.
Ph.D Thesis 2014
Chapter 6 Page 216
XRD patterns indicate that adding of glasses in GDC shifts
position of peaks towards higher 2θ values compared to pure GDC. This
implies decrease in the d-spacing of the structure. In case of 10 wt%
glass doping, glass gets accommodated in GDC structures and no
additional peaks was observed in XRD patterns compared to GDC. An
effect of glass doping becomes significant at 15 wt% glass content and
above. A small peak is appeared at 2θ of ~30.4° for glass content
between 15-25 wt%. This peak corresponds to the phase Bi10V2O20.
Further addition of glass in GDC increases impurity peaks around
<111> plane and peak at 30.4° split into two peaks. These peaks
correspond to Bi2O3, Bi2O4 and KO3. Peak intensities of all peaks are
also found diminishing with further increase in glass content in GDC,
attributed to deviation from pure phase of FCC structure to mixed
phase due to addition of recrystallized glass. All peaks corresponding to
FCC crystal structure of GDC remained unaffected by added impurities.
From these results it can be conclude that addition of glasses up to 10
wt% in GDC affects only the d-spacings in lattice; increase in glass
content above 10 wt% causes re-crystallization and some such peaks
are appear in XRD patterns without deteriorating GDC the matrix. It is
clear from above discussion that increase in glass content does affect
the lattice structure of GDC and the glass not only improves the grain
Figure 6.6: XRD patterns of pellets with glass in various weight
contents from 10-40 wt% in GDC and fired at 1000°C, along with
pattern of pure GDC powder
Ph.D Thesis 2014
Chapter 6 Page 217
boundary regions but may also be diffusing into lattice of GDC and
increase vacancies. This effect is already seen in the Nyquist plot where
intra-grain ionic conductivity also showed significant enhancement.
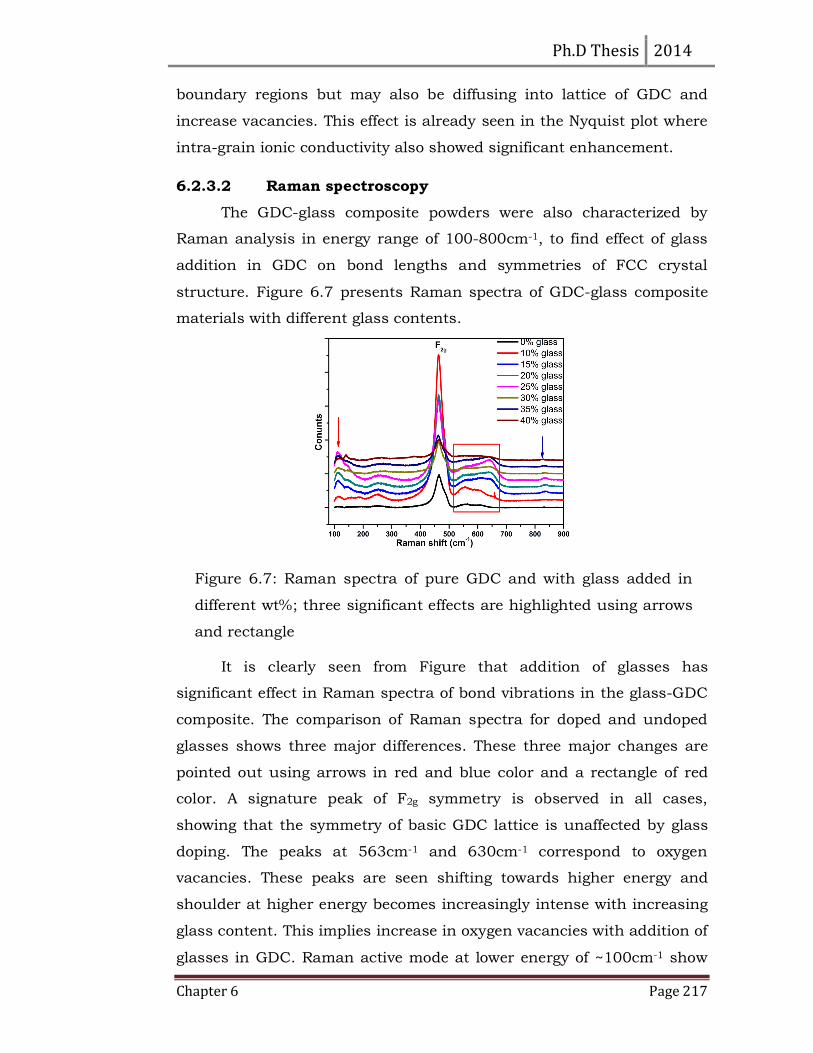
6.2.3.2 Raman spectroscopy
The GDC-glass composite powders were also characterized by
Raman analysis in energy range of 100-800cm-1, to find effect of glass
addition in GDC on bond lengths and symmetries of FCC crystal
structure. Figure 6.7 presents Raman spectra of GDC-glass composite
materials with different glass contents.
It is clearly seen from Figure that addition of glasses has
significant effect in Raman spectra of bond vibrations in the glass-GDC
composite. The comparison of Raman spectra for doped and undoped
glasses shows three major differences. These three major changes are
pointed out using arrows in red and blue color and a rectangle of red
color. A signature peak of F2g symmetry is observed in all cases,
showing that the symmetry of basic GDC lattice is unaffected by glass
doping. The peaks at 563cm-1 and 630cm-1 correspond to oxygen
vacancies. These peaks are seen shifting towards higher energy and
shoulder at higher energy becomes increasingly intense with increasing
glass content. This implies increase in oxygen vacancies with addition of
glasses in GDC. Raman active mode at lower energy of ~100cm-1 show
Figure 6.7: Raman spectra of pure GDC and with glass added in
different wt%; three significant effects are highlighted using arrows
and rectangle
Ph.D Thesis 2014
Chapter 6 Page 218
vibrational interactions between glass and GDC lattice due high glass
content. Intensity of F2g symmetry peak decreases due to polarizability
and lowering in concentration of Raman active groups. Peak at 120cm-1
to shifted at higher Raman frequency at 150cm-1 in case of 40 wt%
glass added in GDC shows incorporation of glass in GDC lattice
structure, and hence changing lattice parameters. This incorporation is
clearly seen in TEM images in next section.
It is clear from the Raman spectra that addition of glass in GDC
sets-in close lattice interactions between them. The increase in glass
doping does not affect symmetry of GDC, but it increases oxygen
vacancies in lattice.
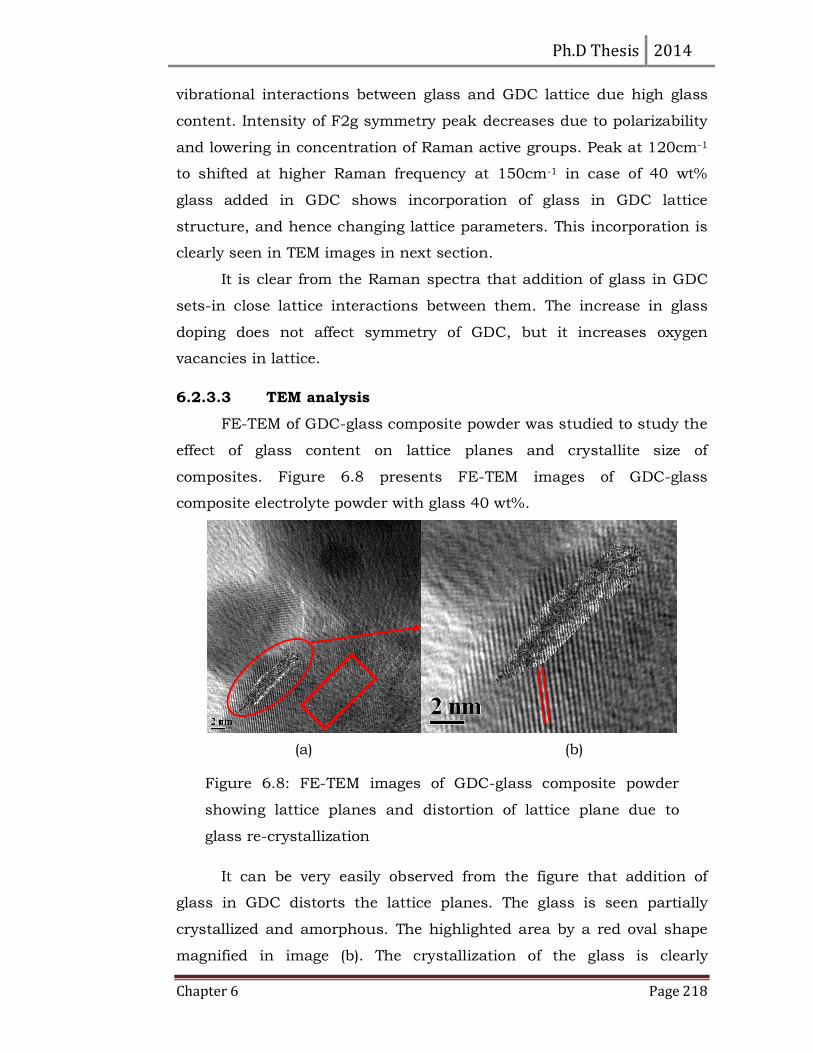
6.2.3.3 TEM analysis
FE-TEM of GDC-glass composite powder was studied to study the
effect of glass content on lattice planes and crystallite size of
composites. Figure 6.8 presents FE-TEM images of GDC-glass
composite electrolyte powder with glass 40 wt%.
It can be very easily observed from the figure that addition of
glass in GDC distorts the lattice planes. The glass is seen partially
crystallized and amorphous. The highlighted area by a red oval shape
magnified in image (b). The crystallization of the glass is clearly
(a) (b)
Figure 6.8: FE-TEM images of GDC-glass composite powder
showing lattice planes and distortion of lattice plane due to
glass re-crystallization
Ph.D Thesis 2014
Chapter 6 Page 219
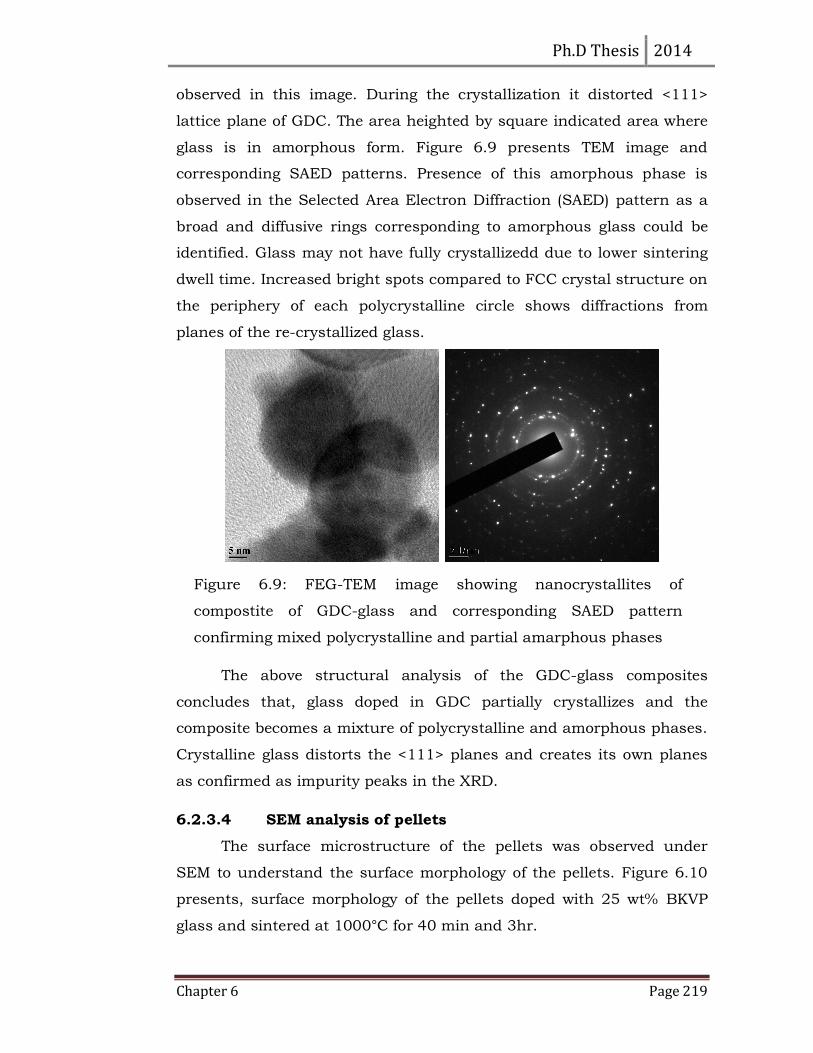
observed in this image. During the crystallization it distorted <111>
lattice plane of GDC. The area heighted by square indicated area where
glass is in amorphous form. Figure 6.9 presents TEM image and
corresponding SAED patterns. Presence of this amorphous phase is
observed in the Selected Area Electron Diffraction (SAED) pattern as a
broad and diffusive rings corresponding to amorphous glass could be
identified. Glass may not have fully crystallizedd due to lower sintering
dwell time. Increased bright spots compared to FCC crystal structure on
the periphery of each polycrystalline circle shows diffractions from
planes of the re-crystallized glass.
The above structural analysis of the GDC-glass composites
concludes that, glass doped in GDC partially crystallizes and the
composite becomes a mixture of polycrystalline and amorphous phases.
Crystalline glass distorts the <111> planes and creates its own planes
as confirmed as impurity peaks in the XRD.
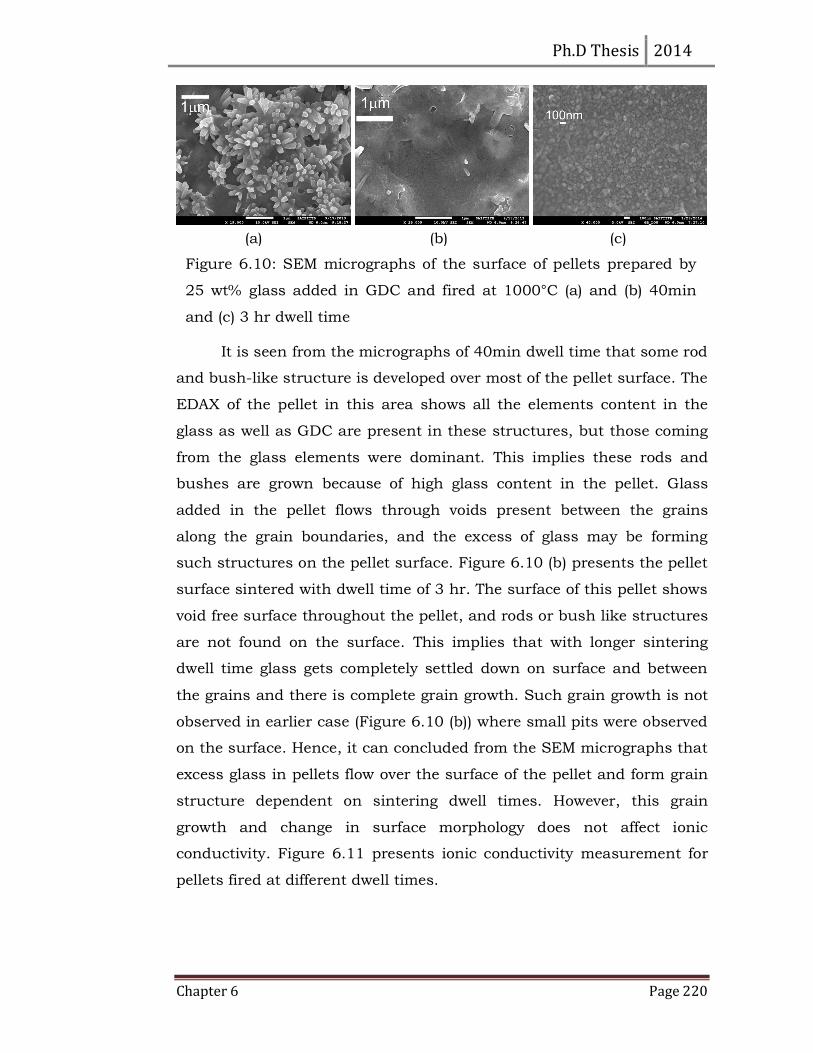
6.2.3.4 SEM analysis of pellets
The surface microstructure of the pellets was observed under
SEM to understand the surface morphology of the pellets. Figure 6.10
presents, surface morphology of the pellets doped with 25 wt% BKVP
glass and sintered at 1000°C for 40 min and 3hr.
Figure 6.9: FEG-TEM image showing nanocrystallites of
compostite of GDC-glass and corresponding SAED pattern
confirming mixed polycrystalline and partial amarphous phases
Ph.D Thesis 2014
Chapter 6 Page 220
It is seen from the micrographs of 40min dwell time that some rod
and bush-like structure is developed over most of the pellet surface. The
EDAX of the pellet in this area shows all the elements content in the
glass as well as GDC are present in these structures, but those coming
from the glass elements were dominant. This implies these rods and
bushes are grown because of high glass content in the pellet. Glass
added in the pellet flows through voids present between the grains
along the grain boundaries, and the excess of glass may be forming
such structures on the pellet surface. Figure 6.10 (b) presents the pellet
surface sintered with dwell time of 3 hr. The surface of this pellet shows
void free surface throughout the pellet, and rods or bush like structures
are not found on the surface. This implies that with longer sintering
dwell time glass gets completely settled down on surface and between
the grains and there is complete grain growth. Such grain growth is not
observed in earlier case (Figure 6.10 (b)) where small pits were observed
on the surface. Hence, it can concluded from the SEM micrographs that
excess glass in pellets flow over the surface of the pellet and form grain
structure dependent on sintering dwell times. However, this grain
growth and change in surface morphology does not affect ionic
conductivity. Figure 6.11 presents ionic conductivity measurement for
pellets fired at different dwell times.
(a) (b) (c)
Figure 6.10: SEM micrographs of the surface of pellets prepared by
25 wt% glass added in GDC and fired at 1000°C (a) and (b) 40min
and (c) 3 hr dwell time
Ph.D Thesis 2014
Chapter 6 Page 221
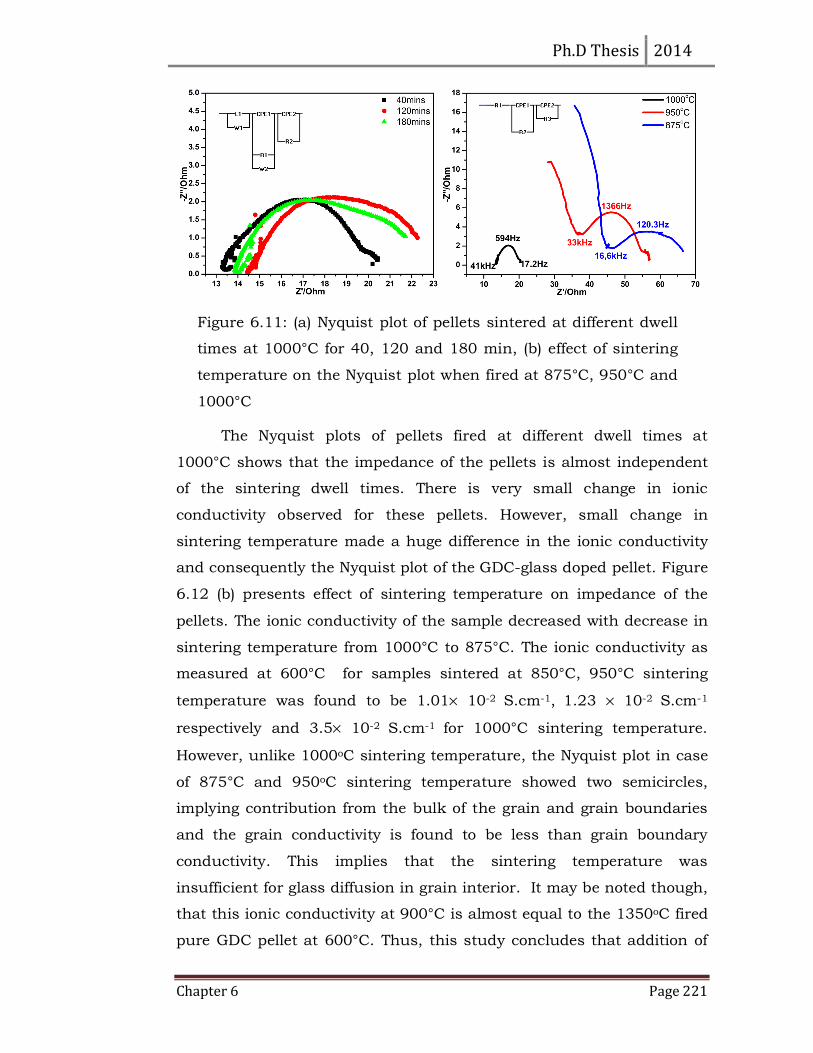
The Nyquist plots of pellets fired at different dwell times at
1000°C shows that the impedance of the pellets is almost independent
of the sintering dwell times. There is very small change in ionic
conductivity observed for these pellets. However, small change in
sintering temperature made a huge difference in the ionic conductivity
and consequently the Nyquist plot of the GDC-glass doped pellet. Figure
6.12 (b) presents effect of sintering temperature on impedance of the
pellets. The ionic conductivity of the sample decreased with decrease in
sintering temperature from 1000°C to 875°C. The ionic conductivity as
measured at 600°C for samples sintered at 850°C, 950°C sintering
temperature was found to be 1.01× 10⁻² S.cm-1, 1.23 × 10⁻² S.cm-1
respectively and 3.5× 10⁻² S.cm-1 for 1000°C sintering temperature.
However, unlike 1000oC sintering temperature, the Nyquist plot in case
of 875°C and 950oC sintering temperature showed two semicircles,
implying contribution from the bulk of the grain and grain boundaries
and the grain conductivity is found to be less than grain boundary
conductivity. This implies that the sintering temperature was
insufficient for glass diffusion in grain interior. It may be noted though,
that this ionic conductivity at 900°C is almost equal to the 1350oC fired
pure GDC pellet at 600°C. Thus, this study concludes that addition of
Figure 6.11: (a) Nyquist plot of pellets sintered at different dwell
times at 1000°C for 40, 120 and 180 min, (b) effect of sintering
temperature on the Nyquist plot when fired at 875°C, 950°C and
1000°C
Ph.D Thesis 2014
Chapter 6 Page 222
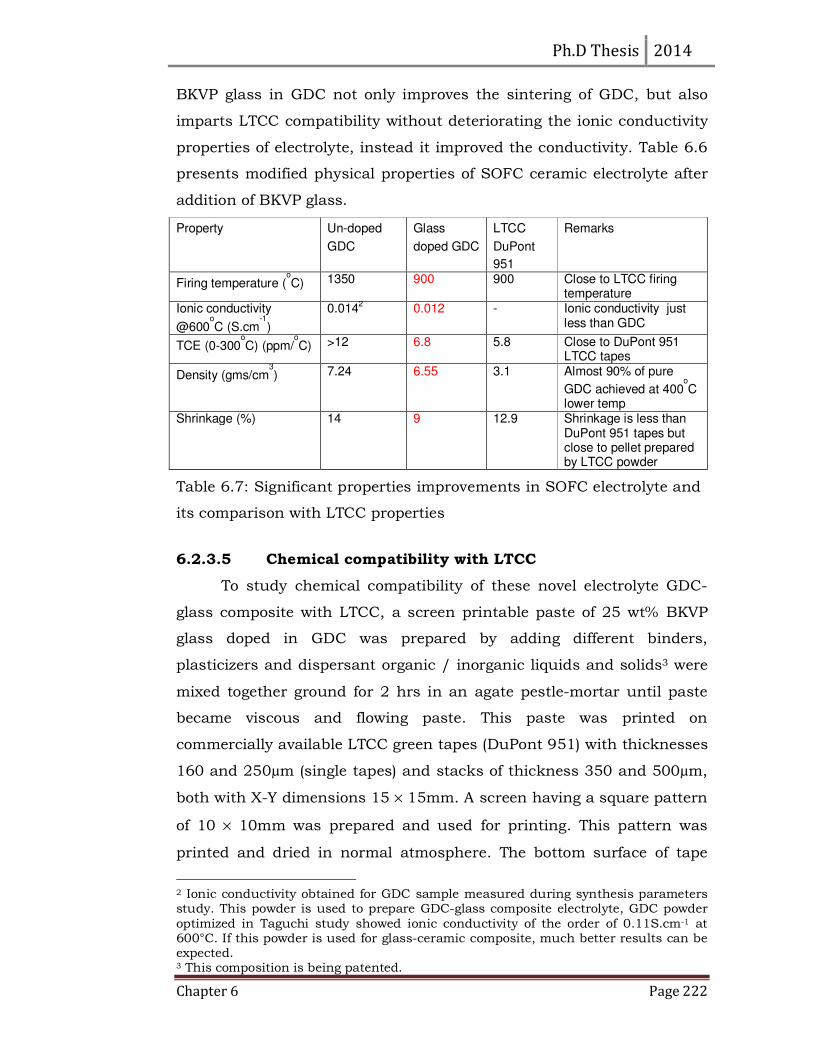
BKVP glass in GDC not only improves the sintering of GDC, but also
imparts LTCC compatibility without deteriorating the ionic conductivity
properties of electrolyte, instead it improved the conductivity. Table 6.6
presents modified physical properties of SOFC ceramic electrolyte after
addition of BKVP glass.
Property Un-doped
GDC Glass
doped GDC LTCC
DuPont
951
Remarks
Firing temperature (o
C) 1350 900 900 Close to LTCC firing temperature
Ionic conductivity
@600o
C (S.cm-1
) 0.014
2 0.012 - Ionic conductivity just
less than GDC TCE (0-300
o
C) (ppm/o
C) >12 6.8 5.8 Close to DuPont 951 LTCC tapes
Density (gms/cm3
) 7.24 6.55 3.1 Almost 90% of pure
GDC achieved at 400o
C lower temp
Shrinkage (%) 14 9 12.9 Shrinkage is less than DuPont 951 tapes but close to pellet prepared by LTCC powder
Table 6.7: Significant properties improvements in SOFC electrolyte and
its comparison with LTCC properties
6.2.3.5 Chemical compatibility with LTCC
To study chemical compatibility of these novel electrolyte GDC-
glass composite with LTCC, a screen printable paste of 25 wt% BKVP
glass doped in GDC was prepared by adding different binders,
plasticizers and dispersant organic / inorganic liquids and solids3 were
mixed together ground for 2 hrs in an agate pestle-mortar until paste
became viscous and flowing paste. This paste was printed on
commercially available LTCC green tapes (DuPont 951) with thicknesses
160 and 250µm (single tapes) and stacks of thickness 350 and 500µm,
both with X-Y dimensions 15 × 15mm. A screen having a square pattern
of 10 × 10mm was prepared and used for printing. This pattern was
printed and dried in normal atmosphere. The bottom surface of tape
2 Ionic conductivity obtained for GDC sample measured during synthesis parameters study. This powder is used to prepare GDC-glass composite electrolyte, GDC powder
optimized in Taguchi study showed ionic conductivity of the order of 0.11S.cm-1 at 600°C. If this powder is used for glass-ceramic composite, much better results can be expected. 3 This composition is being patented.
Ph.D Thesis 2014
Chapter 6 Page 223
was observed removing mylar to verify penetration of organic or
inorganic component of paste through tape. Such evidence was not
observed confirming that neither organics nor inorganic materials from
paste reacted with LTCC at room temperature and normal humidity
conditions. These printed tapes were kept under observation for two
days to verify inertness of the paste material with LTCC tapes. Later,
these tapes were fired using standard firing cycle recommended by the
manufacturer. The fired single tapes showed slight warpage only for
100µm thickness tape, while all other tapes and stacks showed good
flatness, confirming matching of shrinkage of paste and tape during
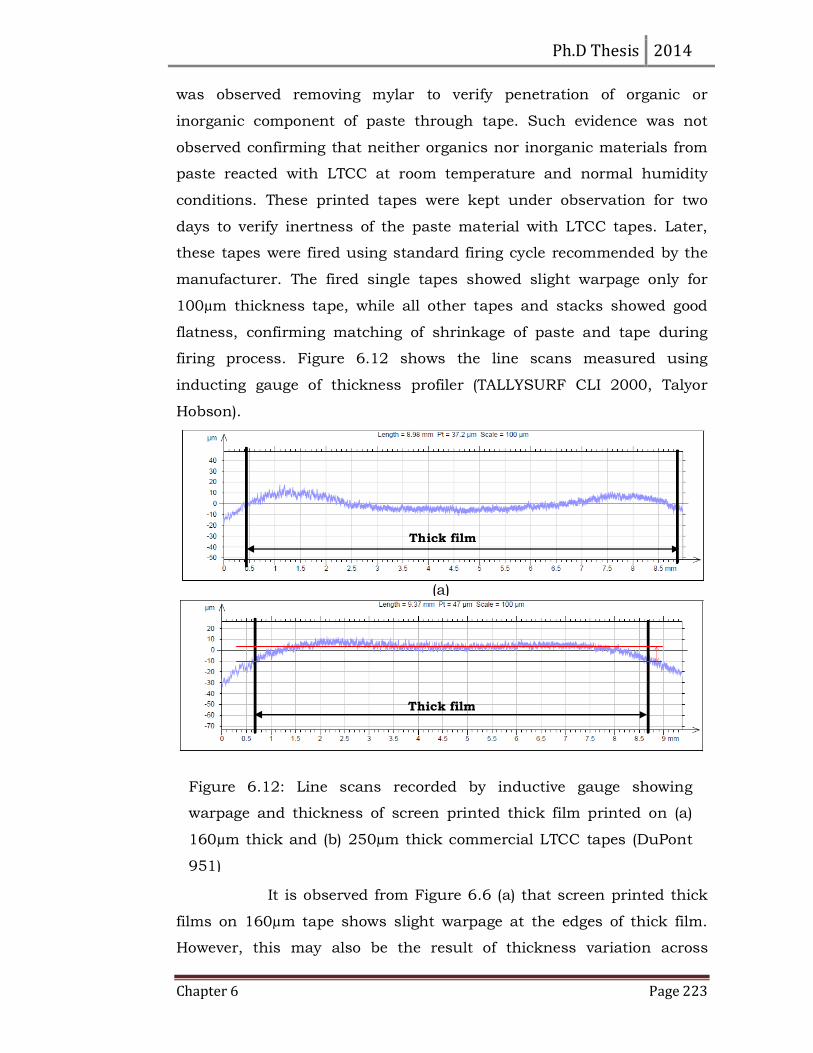
firing process. Figure 6.12 shows the line scans measured using
inducting gauge of thickness profiler (TALLYSURF CLI 2000, Talyor
Hobson).
It is observed from Figure 6.6 (a) that screen printed thick
films on 160µm tape shows slight warpage at the edges of thick film.
However, this may also be the result of thickness variation across
Thick film
(a)
Figure 6.12: Line scans recorded by inductive gauge showing
warpage and thickness of screen printed thick film printed on (a)
160µm thick and (b) 250µm thick commercial LTCC tapes (DuPont
951)
Thick film
Ph.D Thesis 2014
Chapter 6 Page 224
printing direction. The average fired thickness of thick film was 15µm.
Printing direction in this both cases was from left to right of the figure.
Figure 6.6 (b) shows surface scan of 250µm tape, the warpage on this
tape is slightly reduced than that for 160µm thick tape. The thickness
of thick film was 12µm and average warpage is observed in the range
±3µm across the ~8mm width. These warpage and thickness results are
comparable with the commercially available DuPont 6142D screen
printable thick film LTCC compatible paste (warpage ±1.8 µm over 8mm
width). The above description concludes that the prepared GDC-glass
composite thick film paste is physically compatible with LTCC.
In order to confirm chemical compatibility with LTCC, the
film surface and cross section of tape was first observed under
microscope. There was no unusual change in the appearance,
indicating less possibility of any chemical interaction. Thus, prima facie
it was concluded that LTCC tape and GDC-glass composite paste both
are compatible with each other. However, final confirmation of chemical
compatibility can be made only after analyzing the interface and the
whole sample using analytical techniques, such as, X-ray diffraction
and Raman spectroscopy etc. and through microstructural
observations. Presently, this analysis has not been completed.
Similar to GDC, different sintering aids and some proton
conducting glasses were tried for achieving low sintering temperature
for the proton ion conducting electrolyte, viz. Yttrium doped Barium
Cerate (BCYO). Following Sub-section report results of glass-BCYO
composites.
6.2.4 Effect of sintering aids on proton conducting BCYO
Bi2O3 was used as sintering aid for sol gel synthesized Yttrium
doped Barium Cerate. The pellets turned to black color after firing at
850°C. The electrical measurement by impedance brought out
occurrence of very high impedance for these pellets. The ionic
conductivity measured for these samples shows ionic conductivity in
the range of 10-6 to 10-7 S.cm-1 at 600°C. Such high impedance is
possibly a result of formation of insulating phase between Barium oxide
Ph.D Thesis 2014
Chapter 6 Page 225
and Bismuth oxide due to chemical reaction (14). Due to repeated, high
impedance observations for such composite, this aspect of interaction
was not investigated further. It was concluded that Bi2O3 is an improper
choice as sintering aid for BCYO electrolyte. Some other low melting
temperature oxides, such as, Vanadium oxide (V2O5), Antimony oxide
(Sb2O5), Thallium oxide (Tl2O5) were also used as sintering aids for
BCYO. However, there were no significant improvement in the results
obtained using these sintering aids. Table 6.7 listed sintering aids and
corresponding shrinkage, density and ionic conductivity comparison
with BCYO pellet sintered at 1350°C.
Sintering aid in
BCYO
Shrinkage when
fired at 1000°C
Density (%) Ionic conductivity at
600°C(x10-3S.cm-1)
BCYO - - 14
2% V2O5 2.3 72 3.4
2% Sb2O5 1.8 68 0.5
2% Tl2O5 1.9 78 2.2
Table 6.8: Effect of different sintering aids on shrinkage, density and
ionic conductivity of BCYO
The results presented in this table indicate that low temperature
melting oxides including Bi2O3 are not useful as sintering aid for BCYO.
The ionic conductivity lowered due to addition of theses oxides due to
disorder produced in grain boundaries and produced insulating phases
with BCYO by these oxides. Therefore, instead of inorganic oxides as
sintering aid, known proton ion conducting glasses were tried as
sintering aid in BCYO. Synthesis of glasses and their effect on
shrinkage and ionic conductivity are presented the following Sub-
section.
6.2.4.1 Effect of glasses as sintering aid
This work was carried out selecting two different glasses based on
Silica, Zirconia and P2O5. These components were selected because
glasses of these oxides are reported to be good protonic ion conductors
at 200-400°C operating temperature (15). These glasses are well known
electrolytes for Proton Electrolyte Membrane Fuel Cell (PEMFC) (16).

Ph.D Thesis 2014
Chapter 6 Page 226
Two different compositions were selected based on literature survey.
These glasses are synthesized by sol-gel method, obtained membranes
were fired at temperature range 30-600°C. A high proton conductivity of
9.3×10⁻³ S cm-1 was reported for the 83SiO2–5P2O5–2TiO2-10ZrO2
(mol%) composite at 80°C under 90% relative humidity (RH), while for
the 83SiO2–5P2O5–2ZrO2-10TiO2 (mol%) composite the conductivity was
only 7.1×10⁻³ S.cm-1 under the same conditions (16). Two
compositions of glasses were selected for this work, viz. 83SiO2–5P2O5–
2ZrO2-10TiO2 (SZPT) and 48SiO2-2ZrO2-25P2O5-25V2O5 (SZPV) (15),
(16), (17). SZPT glass was synthesized by sol-gel method and SZPV glass
was synthesized by standard solid state route.
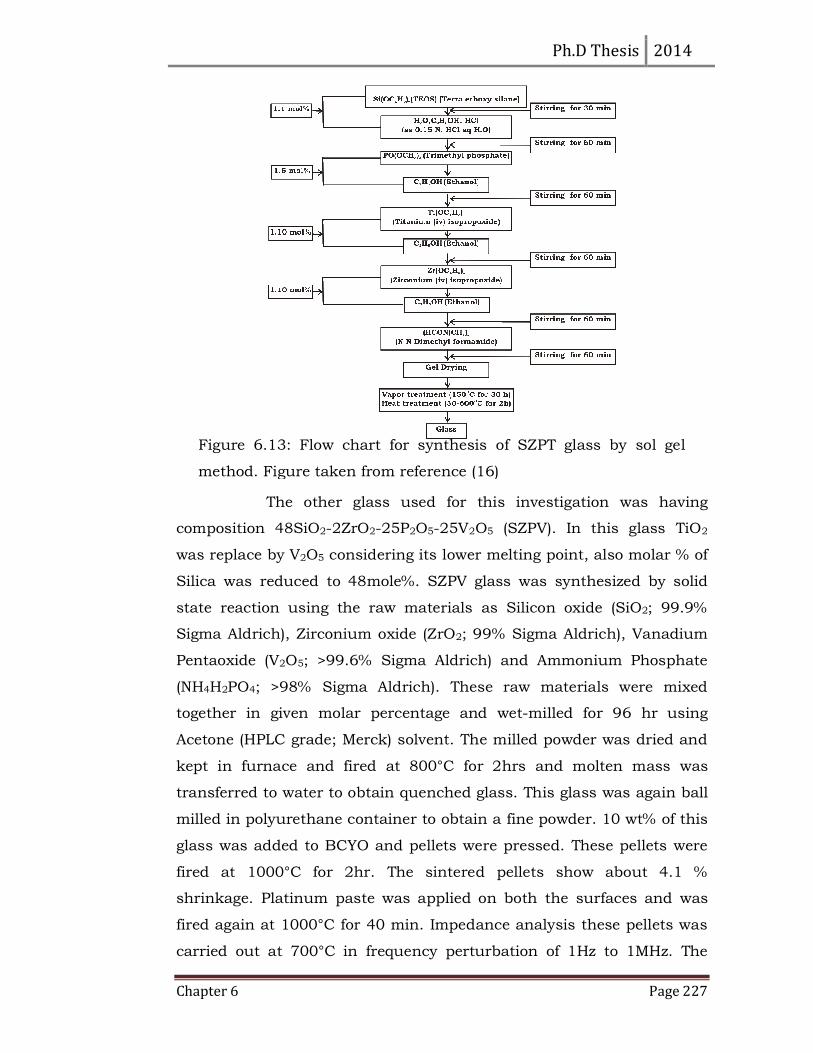
For the synthesis of SZPT glass by sol gel method, the raw
materials used were tetraethyl orthosilicate (Si(OC2H5)4, TEOS, 99%
Merck), trimethyl phosphate (PO(OCH3)3), 99% Merck), titanium-iso-
propoxide (Ti(OC4H9)4, 99% Merck), Zirconium-iso-propoxide
(Zr(OC4H9)4, 99% Merck) and N-N- Dimethyl formamide (HCON(CH3)2,
99% Merck). The experimental procedure was followed as given in
literature (16). These synthesis steps are also presented in Figure 6.15.
The SZPT glass synthesized following the steps given in flow chart
was calcined at 600°C. A black colored glassy powder was obtained.
This powder was crushed to obtain fine powder. 10 wt% of this glass
was added to BCYO and its pellets were sintered at 1000°C. However, it
was seen that these pellets show an increase in dimensions up to 1%.
This would not be suitable for LTCC applications. Further, this glass
also caused increase in impedance of the glass-BCYO composite when
tested with 10 wt% glass content (Figure 6.14). Due to these results, it
was decided not to proceed with further experiments.
Ph.D Thesis 2014
Chapter 6 Page 227
The other glass used for this investigation was having
composition 48SiO2-2ZrO2-25P2O5-25V2O5 (SZPV). In this glass TiO2
was replace by V2O5 considering its lower melting point, also molar % of
Silica was reduced to 48mole%. SZPV glass was synthesized by solid
state reaction using the raw materials as Silicon oxide (SiO2; 99.9%
Sigma Aldrich), Zirconium oxide (ZrO2; 99% Sigma Aldrich), Vanadium
Pentaoxide (V2O5; >99.6% Sigma Aldrich) and Ammonium Phosphate
(NH4H2PO4; >98% Sigma Aldrich). These raw materials were mixed
together in given molar percentage and wet-milled for 96 hr using
Acetone (HPLC grade; Merck) solvent. The milled powder was dried and
kept in furnace and fired at 800°C for 2hrs and molten mass was
transferred to water to obtain quenched glass. This glass was again ball
milled in polyurethane container to obtain a fine powder. 10 wt% of this
glass was added to BCYO and pellets were pressed. These pellets were
fired at 1000°C for 2hr. The sintered pellets show about 4.1 %
shrinkage. Platinum paste was applied on both the surfaces and was
fired again at 1000°C for 40 min. Impedance analysis these pellets was
carried out at 700°C in frequency perturbation of 1Hz to 1MHz. The
Figure 6.13: Flow chart for synthesis of SZPT glass by sol gel
method. Figure taken from reference (16)
Ph.D Thesis 2014
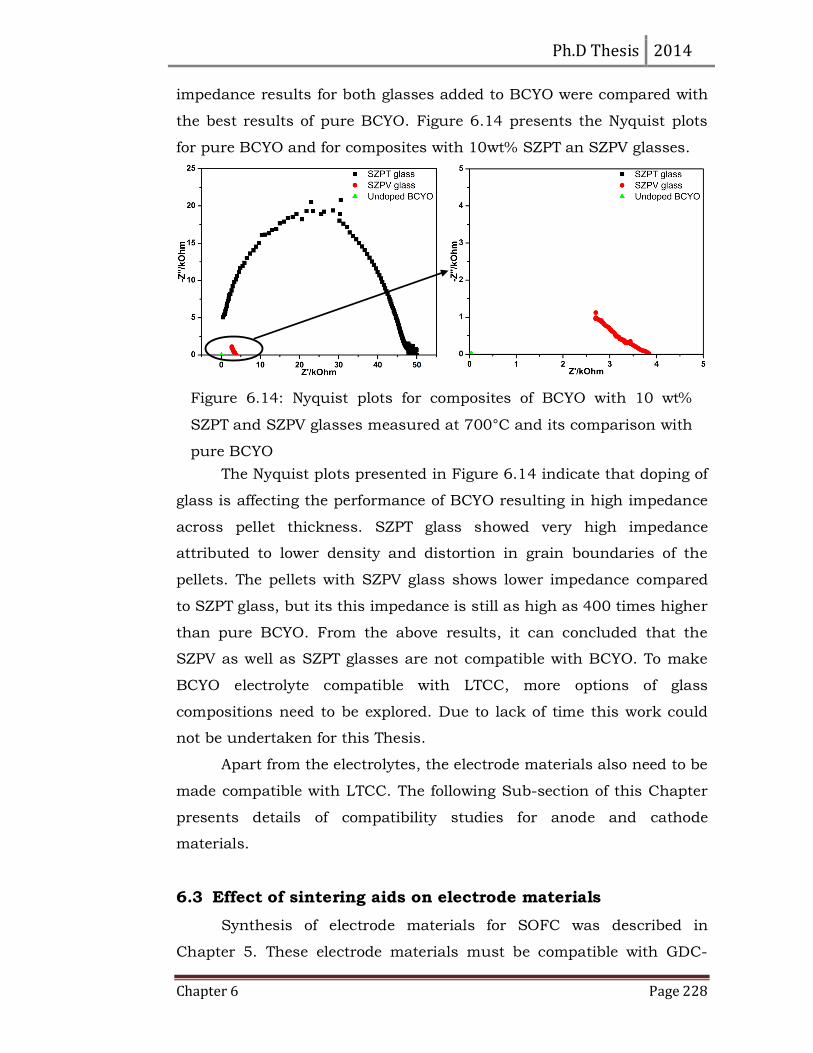
Chapter 6 Page 228
impedance results for both glasses added to BCYO were compared with
the best results of pure BCYO. Figure 6.14 presents the Nyquist plots
for pure BCYO and for composites with 10wt% SZPT an SZPV glasses.
The Nyquist plots presented in Figure 6.14 indicate that doping of
glass is affecting the performance of BCYO resulting in high impedance
across pellet thickness. SZPT glass showed very high impedance
attributed to lower density and distortion in grain boundaries of the
pellets. The pellets with SZPV glass shows lower impedance compared
to SZPT glass, but its this impedance is still as high as 400 times higher
than pure BCYO. From the above results, it can concluded that the
SZPV as well as SZPT glasses are not compatible with BCYO. To make
BCYO electrolyte compatible with LTCC, more options of glass
compositions need to be explored. Due to lack of time this work could
not be undertaken for this Thesis.
Apart from the electrolytes, the electrode materials also need to be
made compatible with LTCC. The following Sub-section of this Chapter
presents details of compatibility studies for anode and cathode
materials.
6.3 Effect of sintering aids on electrode materials
Synthesis of electrode materials for SOFC was described in
Chapter 5. These electrode materials must be compatible with GDC-
Figure 6.14: Nyquist plots for composites of BCYO with 10 wt%
SZPT and SZPV glasses measured at 700°C and its comparison with
pure BCYO
Ph.D Thesis 2014
Chapter 6 Page 229
glass composite electrolyte with respect to their physical properties
such as shrinkage, sintering temperature, Temperature co-efficient of
Expansion (TCE) and operating temperature. Amongst these matching
of shrinkage during sintering is an important parameter which must
tackled first.
As we have seen in earlier, Copper Zinc oxide (CuZnO) was
selected as anode material and Samarium and Strontium doped
Cobaltite (SSC) was selected as cathode material. CuZnO showed 14%
shrinkage when fired at 900°C, however, SSC showed such shrinkage
only when it was fired at 1100°C. Thus, these two electrode material
have higher shrinkage compared to GDC-glass composite electrolyte
and their firing temperatures are found varied from 900 to 1100°C. The
target of this study was to match their shrinkages when fired at 1000°C.
Initially, efforts were taken to make cathode material SSC
compatible with GDC-glass composite electrolyte material. This was
done by adding different weight proportion of BKVP glass in SSC and
fired at 1000°C for 40min. Shrinkage and density of the pellets were
measured after firing and found that shrinkage of SSC-glass composite
electrode was close to that of the composite electrolyte when 40% glass
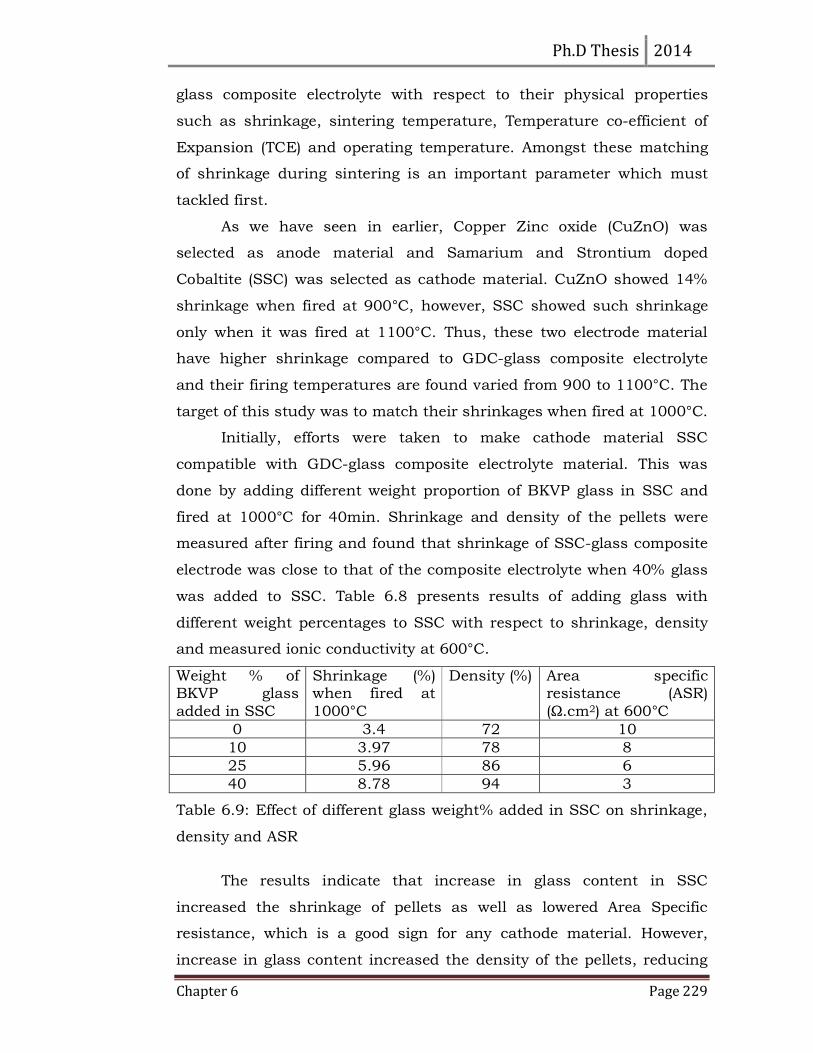
was added to SSC. Table 6.8 presents results of adding glass with
different weight percentages to SSC with respect to shrinkage, density
and measured ionic conductivity at 600°C.
Weight % of BKVP glass
added in SSC
Shrinkage (%) when fired at
1000°C
Density (%) Area specific resistance (ASR)
(Ω.cm2) at 600°C
0 3.4 72 10
10 3.97 78 8
25 5.96 86 6
40 8.78 94 3
Table 6.9: Effect of different glass weight% added in SSC on shrinkage,
density and ASR
The results indicate that increase in glass content in SSC
increased the shrinkage of pellets as well as lowered Area Specific
resistance, which is a good sign for any cathode material. However,
increase in glass content increased the density of the pellets, reducing
Ph.D Thesis 2014
Chapter 6 Page 230
their porosity. This may reduce catalytic activity of the cathode. It is
clear that ASR is lowered in presence of glass due to increase in ionic
conductivity of the pellet. TCE measured for 40 wt% glass added SSC
was measured at 600°C, which was found to be 7.2ppm/°C, which is
close to composite electrolyte. Initial results on LTCC tape by making
paste of SSC shows no evidence of chemical reaction, however, in case
of 250µm tape thickness diffusion was observed from backside of tape.
These results are better when a stack of 500µm is used as co-firing
substrate.
Hence, it can be conclude that 40 wt% BKVP glass addition in to
SSC has matching shrinkage properties with the GDC-glass composite
electrolyte and its ASR value also improves. However, increase in
density may reduce the catalytic performance. This aspect remains to
be verified.
The anode material selected for this work was Copper Zinc oxide
which shows 14% shrinkage at 900°C without any addition of sintering
aid. This oxide has melting point somewhere in between 950-1000°C
and hence its pellet melts when fired at 1000°C. Due to time limitation,
this anode material was applied after firing (post-fire process) for cell
fabrication discussed in the next Chapter.
6.4 Co-firing of SOFC material with LTCC
In this Chapter we have reported that, BKVP glass was useful for
making SOFC electrode and electrolyte materials compatible with the
LTCC materials. It is seen that the ionic conductivity results are
exceptionally good when sintered at 1000°C, when sintering
temperature lowered its ionic conductivity found lowered. On the other
hand, at 1000°C sintering temperature, anode material Copper Zinc
Oxide (CuZnO) melts and cathode material shows very high density.
Therefore, lower firing temperature is favorable for these electrode
materials. Further, LTCC firing temperature is around 875-900°C
considering silver metal is used as via filling conductor and for
conducting tracks. Increase in firing temperature in the range of 1000°C
for LTCC will require replacement of silver by gold and platinum. These
Ph.D Thesis 2014
Chapter 6 Page 231
materials are costlier and will ultimately increase the cost of fabrication.
Clearly, the present LTCC co-firing study of SOFC electrolyte materials
bring up three different sintering or co-firing options where one has
compromise either properties of electrolyte or co-firing of the fuel cell.
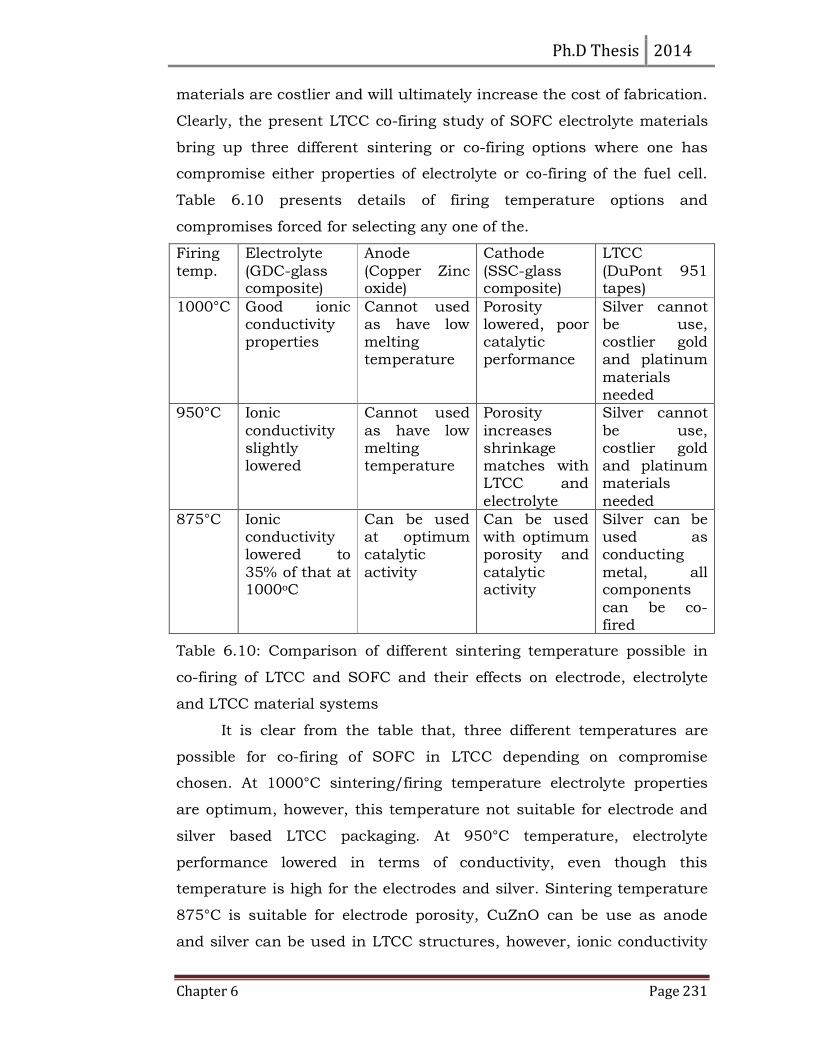
Table 6.10 presents details of firing temperature options and
compromises forced for selecting any one of the.
Firing
temp.
Electrolyte
(GDC-glass composite)
Anode
(Copper Zinc oxide)
Cathode
(SSC-glass composite)
LTCC
(DuPont 951 tapes)
1000°C Good ionic conductivity properties
Cannot used as have low melting temperature
Porosity lowered, poor catalytic performance
Silver cannot be use, costlier gold and platinum
materials needed
950°C Ionic
conductivity slightly lowered
Cannot used
as have low melting temperature
Porosity
increases shrinkage matches with LTCC and
electrolyte
Silver cannot
be use, costlier gold and platinum materials
needed
875°C Ionic conductivity lowered to
35% of that at 1000oC
Can be used at optimum catalytic
activity
Can be used with optimum porosity and
catalytic activity
Silver can be used as conducting
metal, all components
can be co-fired
Table 6.10: Comparison of different sintering temperature possible in
co-firing of LTCC and SOFC and their effects on electrode, electrolyte
and LTCC material systems
It is clear from the table that, three different temperatures are
possible for co-firing of SOFC in LTCC depending on compromise
chosen. At 1000°C sintering/firing temperature electrolyte properties
are optimum, however, this temperature not suitable for electrode and
silver based LTCC packaging. At 950°C temperature, electrolyte
performance lowered in terms of conductivity, even though this
temperature is high for the electrodes and silver. Sintering temperature
875°C is suitable for electrode porosity, CuZnO can be use as anode
and silver can be used in LTCC structures, however, ionic conductivity
Ph.D Thesis 2014
Chapter 6 Page 232
properties of electrolyte lowered to 35% of optimum. This implies that,
sintering temperature in co-firing process can be defined by user by
compromising either of properties or by choosing golden mean. Lower
sintering temperature of 875°C is recommended as it provides optimum
electrode and LTCC properties by compromising ionic conductivity
properties of GDC-glass composite electrolyte. Thus, this can be
conclude that, present work provides flexibility of selection of sintering
temperature for co-firing process of SOFC integration in LTCC.
6.5 Conclusions
This Chapter describes compatibility studies of SOFC electrolyte
and electrode materials with LTCC. Different sintering aids viz. low
temperature melting oxides and low temperature melting glasses were
used to match the properties of synthesized electrode and electrolyte
materials with LTCC, physically as well as chemically. Mostly, this
compatibility was achieved without deteriorating ionic conductivity
properties of the host material. Gadolinium doped Ceria, an oxygen ion
conducting electrolyte shows close compatibility with LTCC when 25
wt% Bismuth based alkali phosphate glass (x(Bi2O3-K2O)-y(V2O5-P2O5))
was added to GDC. This addition of glass not only resolved compatibility
issue but also enhanced the conductivity and low temperature
sinterability of GDC. This GDC-glass composite was found compatible
with LTCC in all respects. The ionic conductivity of the order of 0.034
S.cm-1 was obtained at 600°C operating temperature and 1000°C
sintering temperature, which is at least double of ionic conductivity of
undoped GDC at same operating temperature and 1350°C sintering
temperature.
In case of BCYO proton conductor, different oxides and glasses
were used to achieve LTCC compatibility. However, the compatibility
could not be achieved due to lower shrinkages and deterioration of ionic
conductivity for all the such additions. Different glasses need to be
explored for improvement in these results.
In case of electrode materials, the cathode material SSC was
made compatible with GDC-glass composite electrolyte by adding 40
Ph.D Thesis 2014
Chapter 6 Page 233
wt% BKVP glass. Its shrinkage (8.78%) was close to GDC-glass
composite electrolyte and ASR values improved to 3Ωcm2, however,
density also increased to 94% due to this addition, which may lower its
catalytic action. This, however, remains to be proved. Copper Zinc oxide
was selected as anode material due to its better catalytic activity.
However, due to its lower melting point, it can be used only through a
co-firing process. More options need to be explored for the anode.
Depending of materials properties SOFC can co-fired LTCC at
three different temperatures, however, at each sintering temperature
some of the physical and chemical properties of either electrode or
electrolyte need to be compromise. This selection of sintering
temperature is as per user requirement. Lower firing temperature
From the results presented here, it is felt that the materials are
ready for fabrication of an SOFC on at least trial basis. The next
Chapter describes efforts in this direction.
6.6 References
1. Recent Material Developments in Fast Oxide Ion Conductors.
Mairesse, J. C. Boivin and G. 1998, Chemistry of Materials, Vol.
10, pp. 2870-2888.
2. Low-temperature densification and grain growth of Bi2O3-doped-
ceria gadolinia ceramics. Vanesa Gil, Carlos Moure, Pedro Durán,
Jesus Tartaj. 2007, Solid State Ionics 178, pp. 359–365.
3. Development of Oxygen Ion Conductors: One Relevant Tendency.
Kharton, F.M.B. Marques and V.V. 2001, Ionics 11, pp. 321-326.
4. Sintering and crystallization behavior of CaMgSi2O6–NaFeSi2O6
based glass-ceramics. Ashutosh Goel, Anna Maria Ferrari, Ishu
Kansal, Maria J. Pascual, Luisa Barbieri, Federica Bondioli,
Isabella Lancellotti, Manuel J. Ribeiro, and José M. F. Ferreira.
2009, Journal of Applied Physics, Vol. 106, pp. 093502-1-7.
5. Glass transition temperature and activation energy of sintering by
optical dilatometry. Alexander Karamanov, Boris Dzhantov,
Mariano Paganelli, Davide Sighinolfi. 2013, Thermochimica Acta ,
Vol. 553, pp. 1–7.
6. Influences of the Glass Phase on Densification, Microstructure,
and Properties of Low-Temperature Co-Fired Ceramics. Markus
Ph.D Thesis 2014
Chapter 6 Page 234
Eberstein, Torsten Rabe, and Wolfgang Arno Schiller. 6, 2006,
Int. Journal Applied Ceramic Technololgy, Vol. 3, pp. 428–436.
7. Metal Phosphates as Intermediate Temperature Proton Conducting
Electrolytes. Y. J. Huang, Q. F. Li, C. Pan, T. Anfimova, J. O.
Jensen and N. J. Bjerrum. 1, 2012, ECS Transactions, Vol. 45,
pp. 99-104.
8. Ion conducting phosphate glassy materials. S.S. Das, N.P. Singh,
P.K. Srivastava. 2009, Progress in Crystal Growth and
Characterization of Materials, Vol. 55, pp. 47-62.
9. Bi8V2O17 – a stable phase in the Bi2O3–V2O5 system. W.WROBEL,
F. KROK, I. ABRAHAMS, A. KOZANECKA-SZMIGIEL, M.MALYS,
S. C. M. CHAN, J. R. DYGAS. 1, 2006, Materials Science-Poland,
Vol. 24, pp. 23-30.
10. AC conduction in semiconducting CuO-Bi203-P20, glasses.
Chakravorty, Aswini Ghosh and D. 1990, Journal of Physics:
Condensed Matter, Vol. 2, pp. 5365-5372.
11. Influence of B2O3 addition on the ionic conductivity of
Li1.5Al0.5Ge1.5(PO4)3 glass ceramics. Harsharaj S. Jadhav, Min-
Seung Cho, Ramchandra. S. Kalubarme, Jong-Sook Lee, Kyu-
Nam Jung, Kyoung-Hee Shin, Chan-Jin Park. 2013, Journal of
Power Sources, Vol. 241, pp. 502-508.
12. A Novel Sodium-Ion Rechargeable Battery. Ralph, Manickam
Minakshi and David. 29, 2013, ECS Transactions, Vol. 45, pp.
95-102.
13. Microstructure and dielectric properties of Ca-Al-B-Si-O
glass/Al2O3 composites with various alkali oxides contents. Ming
Liu, Hong-qing Zhou, Hai-kui Zhu, Zhen-xing Yue, Jian-xin Zhao.
10, October 2012, Journal of Central South University, Vol. 19,
pp. 2733-2739.
14. Dielectric Properties of Bismuth Doped Barium Titanate (BaTiO3)
Ceramics. Vittayakorn, Naratip. 12, 2006, Journal of Applied
Sciences Research, Vol. 2, pp. 1319-1322.
15. Fast proton-conducting P2O5–ZrO2–SiO2 glasses. Masayuki
Nogami, Ritsuko Nagao, Kensuke Makita, and Yoshihiro Abe. 10,
1997, Applied Physics Letters, 1323 (1997);, Vol. 71, pp. 1323-
1325.
Ph.D Thesis 2014
Chapter 6 Page 235
16. Synthesis, characterization and electrochemical properties of
SiO2–P2O5–TiO2–ZrO2 glass membranes as proton conducting
electrolyte for low-temperature H2/O2 fuel cells. Nogami, G
Lakshminarayana and Masayuki. 2009, Journal of Physics D:
Applied Physics, Vol. 42, pp. 215501- 11.
17. Structural and proton conductivity study of P2O5-TiO2-SiO2
glasses. T. Uma, S. Izuhara, M. Nogami. 2006, Journal of the
European Ceramic Society , Vol. 26, pp. 2365–2372.
18. Oxygen Ion Conduction in Oxide Materials: Selected Examples
and Basic Mechanisms. L.S.M. TRAQUEIA, F.M.B. MARQUES,
V.V. KHARTON. 2006, Boletín de la Sociedad Española de
Cerámica V, 45 [3], pp. 115-121.


![HITT Chapter 05 [Compatibility Mode]](https://img.pdfslide.net/doc/110x75/577ccf4d1a28ab9e788f6762/hitt-chapter-05-compatibility-mode.jpg)
![Chapter 1 VOLTAGE REGULATOR [Compatibility Mode]](https://img.pdfslide.net/doc/110x75/55cf943b550346f57ba07f88/chapter-1-voltage-regulator-compatibility-mode.jpg)
![Chapter 16 biodiversity [compatibility mode]](https://img.pdfslide.net/doc/110x75/55a6e0741a28ab79498b4601/chapter-16-biodiversity-compatibility-mode.jpg)
![CCNA Dis4 - Chapter 6 - Using IP Address in the Network Design_ppt [Compatibility Mode]](https://img.pdfslide.net/doc/110x75/577d21ff1a28ab4e1e96614f/ccna-dis4-chapter-6-using-ip-address-in-the-network-designppt-compatibility.jpg)

![Chapter 27 reproduction [compatibility mode]](https://img.pdfslide.net/doc/110x75/55a6dfe61a28abd0408b4603/chapter-27-reproduction-compatibility-mode.jpg)
![Chapter 6 cell energy [compatibility mode]](https://img.pdfslide.net/doc/110x75/55a8e64c1a28ab802f8b46f1/chapter-6-cell-energy-compatibility-mode.jpg)
![Chapter 8: Genetics [compatibility mode]](https://img.pdfslide.net/doc/110x75/55a96a4d1a28ab576e8b4797/chapter-8-genetics-compatibility-mode.jpg)
![Chapter 1-Intro (2) [Compatibility Mode]](https://img.pdfslide.net/doc/110x75/577d35431a28ab3a6b8ff41c/chapter-1-intro-2-compatibility-mode.jpg)
![Chapter 25: Excretion [compatibility mode]](https://img.pdfslide.net/doc/110x75/55a96b191a28ab3c6e8b4853/chapter-25-excretion-compatibility-mode.jpg)
![Chapter 1 Lecture [Compatibility Mode]](https://img.pdfslide.net/doc/110x75/577d2f351a28ab4e1eb11aa7/chapter-1-lecture-compatibility-mode.jpg)
![Chapter 1 [compatibility mode]](https://img.pdfslide.net/doc/110x75/547d4e3b5906b570378b466d/chapter-1-compatibility-mode.jpg)
![HITT Chapter 03 [Compatibility Mode]](https://img.pdfslide.net/doc/110x75/577ccf4d1a28ab9e788f6740/hitt-chapter-03-compatibility-mode.jpg)

![1 Chapter 1 [Compatibility Mode]](https://img.pdfslide.net/doc/110x75/577d22581a28ab4e1e9720aa/1-chapter-1-compatibility-mode.jpg)
![Chapter 3 Science F4 [Compatibility Mode]](https://img.pdfslide.net/doc/110x75/5571f37349795947648e0b45/chapter-3-science-f4-compatibility-mode.jpg)
![TCP CHAPTER 3 [Compatibility Mode]](https://img.pdfslide.net/doc/110x75/577dabde1a28ab223f8d1142/tcp-chapter-3-compatibility-mode.jpg)
![Chapter 6 agregate planning moi [compatibility mode] - Quản trị sản xuất](https://img.pdfslide.net/doc/110x75/5a6507cb7f8b9aa2548b602b/chapter-6-agregate-planning-moi-compatibility-mode-quan-tri-san-xuat.jpg)
![Chapter 1 - Introduction [Compatibility Mode]](https://img.pdfslide.net/doc/110x75/55cf91f1550346f57b9202f6/chapter-1-introduction-compatibility-mode.jpg)
![Chapter 23 circulation [compatibility mode]](https://img.pdfslide.net/doc/110x75/55a622aa1a28abe6278b462d/chapter-23-circulation-compatibility-mode.jpg)
![Chapter 2 - Hr Planning [Compatibility Mode]](https://img.pdfslide.net/doc/110x75/5572109a497959fc0b8d6dda/chapter-2-hr-planning-compatibility-mode.jpg)
![Chapter 9 Overview [Compatibility Mode]](https://img.pdfslide.net/doc/110x75/577d24781a28ab4e1e9c84f5/chapter-9-overview-compatibility-mode.jpg)
![CCNA Dis2 - Chapter 6 – Routing_ppt [Compatibility Mode]](https://img.pdfslide.net/doc/110x75/577d21ff1a28ab4e1e9660e3/ccna-dis2-chapter-6-routingppt-compatibility-mode.jpg)
![Chapter II [Compatibility Mode]](https://img.pdfslide.net/doc/110x75/577cdcdf1a28ab9e78ab9eab/chapter-ii-compatibility-mode.jpg)
![Chapter 2 [Compatibility Mode]- Strategic management](https://img.pdfslide.net/doc/110x75/552a3a004a7959c56d8b456a/chapter-2-compatibility-mode-strategic-management.jpg)
![HITT Chapter 04 [Compatibility Mode]](https://img.pdfslide.net/doc/110x75/577ccf4d1a28ab9e788f675d/hitt-chapter-04-compatibility-mode.jpg)
![Chapter 1 Overview [Compatibility Mode]](https://img.pdfslide.net/doc/110x75/577cd06b1a28ab9e78923323/chapter-1-overview-compatibility-mode.jpg)
![Chapter 4 internetworking [compatibility mode]](https://img.pdfslide.net/doc/110x75/55b24562bb61ebdd5f8b459f/chapter-4-internetworking-compatibility-mode.jpg)