Embed Size (px)
Citation preview
104
CHAPTER 6
DESIGN OF QOS AWARE DOMINATING SET BASED
SEMANTIC OVERLAY NETWORK (QADSON) FOR
CONTENT DISTRIBUTION
6.1 INTRODUCTION
This study focuses on designing QoS Aware Dominating set based
Semantic Overlay Network of surrogate servers (QADSON) which in turn
provides an efficient, controlled redundant and fault tolerant logical
infrastructure of the CDN by choosing the optimal number of surrogate
servers based on specific QoS constraints. Then Efficient Fault Resilient
Replica Algorithm (EFRRA) is applied to replicate the content from the
origin server to the dominant set of surrogate servers in an efficient and
reliable manner. Simulation experiments are extended to analyze the role of
QADSON in providing efficiency by maintaining uniform CDN Utility. The
effect of QoS aware dominating set in semantic overlay network formation is
investigated and how it would be useful in reducing the redundancy,
maintaining exact 1-domination and providing fault tolerance. This study also
investigates the quality of service requirements for the content distribution
and evaluate the performance of QADSON based CDN in terms of Mean
Response Time, Mean CDN Utility, Latency, Hit Ratio Percentage, Latency,
Number of Completed Requests, Rejection rate, and CDN Load.
105
QoS aware content distribution approaches
Donghyun et al (2010) studied that the problem of constructing
quality fault-tolerant Connected Dominating Sets (CDSs) in homogeneous
wireless networks, which could be defined as minimum k-Connected m-
Dominating Set ((k, m)-CDS) problem in Unit Disk Graphs (UDGs). They
found that every existing approximation algorithm for this problem was
incomplete and did not generate a feasible solution in some UDGs. Based on
these observations, they proposed a new polynomial time approximation
algorithm for computing (3,m)-CDSs. They also showed that the proposed
algorithm was correct and its approximation ratio was a constant.
Li et al (2010) proposed a new distributed CDS approximation
algorithm based on weight and performed a comparative analyze with several
existing classic distributed CDS approximation algorithms. They theoretically
proved the correctness and efficiency of the algorithm. Simulation
experiments were conducted and the simulation results showed that the
algorithm performed better than classical CDS approximation algorithms.
Raei et al (2009) proposed a connected dominating set (CDS) as the
virtual backbone in Wireless sensor network. They found that the CDS could
play a major role in routing, broadcasting, coverage and activity scheduling.
They constructed a minimum CDS (MCDS) to reduce the traffic during
communication and prolong network lifetime. Self-stabilization is a
theoretical framework of non-masking fault tolerant distributed algorithms. A
self stabilizing system can tolerate any kind and any finite number of transient
faults, such as power termination, message loss, memory corruption, and
topology change. The wireless sensor network has been modeled by disk
graph with bidirectional links (DGB), in which nodes have different
transmission range. They presented a new distributed approximation
algorithm for SS-MCDS problem in DGB (called SS-MCDS-DGB) with
106
constant approximation ratio and O(n2) time complexity using unfair central
daemon.
Pathan and Buyya (2009) presented architecture to support peering
arrangements between CDNs, based on a Virtual Organization (VO) model.
Performance can be achieved through proper policy management of
negotiated Service Level Agreements (SLAs) between peers. They also
presented a Quality of Service (QoS)-driven performance modeling approach
for peering CDNs in order to predict the user perceived performance. Their
approach has the provisions for an overloaded CDN to return to a normal state
by offloading excess requests to the peers and also providing concrete QoS
guarantee for a CDN provider.
Hossain et al (2010) proposed an efficient content distribution
technique named Similar Content Distribution Technique for Virtual
Organization. They implemented this Similar Content Distribution Technique
within Virtual Organization to increase performance by providing higher data
transfer rate. They analyzed the performance of CDN in terms of Mean
Response Time, Response Time CDF, Hit Ratio and Byte Hit Ratio.
Kassaei et al (2010) proposed an efficient distributed algorithm to
construct a CDS in general graphs. The time and message complexity of the
algorithm is linear in terms of the number of nodes and degree of the network.
Extensive simulations experiments are conducted and showed that the
proposed distributed algorithm outperformed other distributed algorithms
stated in the literature in terms of the size of the CDS. They also presented a
local implementation of the proposed distributed algorithm in location-aware
Unit Disk Graphs (UDGs). The proposed algorithm provided the flexibility to
arbitrarily adjust the trade-off between the degree of locality and the size of
the generated CDS.

107
Shakkottai and Johari (2010) proposed a hybrid content distribution
system that combines the features of peer-to-peer and a centralized client-
server content distribution system. They evaluated the benefits of a hybrid
system that combines peer-to-peer and a centralized client–server approach
against each method acting alone. They also investigated the relative
performance of peer-to-peer and centralized client–server schemes, as well as
a hybrid of the two—both from the point of view of consumers as well as the
content distributor.
Ozkasap et al (2009) proposed and designed a peer-to- peer system;
SeCond, addressing the distribution of large sized content to a large number
of end systems in an efficient manner. It employed a self-organizing epidemic
dissemination scheme for state propagation of available blocks and initiation
of block transmissions. They showed that SeCond is a scalable and adaptive
protocol which took the heterogeneity of the peers into account.
Thai et al (2009) proposed an algorithm called Connecting
Dominating Set Augmentation (CDSA) to construct a 2-connected virtual
backbone which can resist the failure of one wireless node and showed that
CDSA has guaranteed quality by proving that the size of the CDSA
constructed 2- connected backbone was within a constant factor of the
optimal 2- connected virtual backbone size. Through extensive simulations,
they demonstrated in practice, that CDSA can build a 2-connected virtual
backbone with only small overhead.
Darties et al (2009) proposed an efficient way of constructing the
wireless mesh structure associated with molecular MAC, a multichannel
access method designed for efficient packet forwarding. They presented a
formal definition of the role assignment problem, and proved its NP-
completeness. They proposed a centralized 2-approximation algorithm that
maximized the sum of radio link capacities in the molecular structure. They
108
extended this protocol so that it could operate in a distributed way still
providing the same guarantee. This distributed protocol was self-stabilizing
and robust to topology changes. Simulation results showed that the 2-
approximation distributed protocol provided an improvement in throughput
compared to other protocols.
Misra (2009) studied about a source independent multipoint relay
(MPR) based localized construction proposed by Adjih for small sized
connected dominating set (CDS). It is investigated that MPR-based CDS
does not need any knowledge of global network topology, which made it
attractive to the applications in mobile adhoc networks for providing routing
backbone. Misra (2009) introduced a reverse selection heuristics and provided
self-stabilization (SS) to MPR-based CDS algorithm. This SS-MPR-CDS
provided tolerance to SS-MPR-CDS based virtual backbone from transient
changes in topology.
Raei et al (2008) proposed Connected Dominating Set (CDS) as a
virtual backbone in wireless sensor networks. Minimum connected
Dominating Set (MCDS) is constructed to reduce the traffic during
communication and prolong network lifetime. For the MCDS problem, this
kind of the networks has been modeled in Unit Disk Graph (UDG), in which
nodes have same transmission range. A new energy-aware distributed
algorithm for MCDS problem in UDG with constant approximation ratio and
time complexity of O(n) and message complexity of O(n) was introduced.
Theoretical analysis and simulation results were also presented to verify the
efficiency of the proposed approach.
Ignacio et al (2008) found that content dissemination in disrupted
networks poses a big challenge, given that the current routing architectures of
ad hoc networks require establishing routes from sources to destinations
before the content to be disseminated between them. They presented DIRECT
109
(Disruption REsilient Content Transport), which was a content dissemination
approach for ad hoc networks that exploited in-network storage and the hop-
by-hop dissemination of named information objects. Simulation experiments
illustrated that DIRECT provides a high degree of reliability while
maintaining low levels of delivery latencies and signaling and data overhead
compared to traditional on-demand routing and epidemic routing.
Jian Ma Ni (2007) identified that constructing a connected
dominating set (CDS) in wireless network as a key technique to identify
redundant nodes and extend network lifetime. Most CDS-based algorithms
focused on building the minimal CDS to find as many redundant nodes as
possible. However, role rotation was not considered so that the dominating
nodes will run out of energy much faster than the non-dominating nodes.
They extended their investigations on existing CDS-based algorithms for
maximizing network lifetime and found that existing CDN-based algorithms
rely on the up-to-date remaining energy level (REL) information within h-hop
neighborhood to rotate node roles iteratively and global time synchronization
is required to synchronize every round. Hence, overhead on REL updating
and time synchronization could definitely lead to energy waste and packet
collision. Jian Ma et al (2007) first proposed a randomized rotation algorithm,
which can totally avoid REL updating. Then, dominating node history was
added as an enhancement to further extend network lifetime. Finally, they
proposed a broadcast-based synchronization mechanism to reduce the
synchronization overhead and assist dominating node selection. Extensive
simulations were carried out to show that their proposed algorithm could
significantly reduce overhead without sacrificing network lifetime.
Wu et al (2007) found that a k-Connected m-Dominating Set
(kmCDS) could be working as a virtual backbone in a wireless sensor
network and provide fault tolerance and routing flexibility. They observed

110
that construction of a kmCDS with the minimum size, some approximation
algorithms have been already proposed in the literature and analyzed that all
the existing algorithms only considered some special cases where k = 1,2 or k
= m. They proposed one centralized heuristic algorithm CGA and one
distributed algorithms, DDA which is deterministic, to construct a kmCDS for
general k and m. They presented simulation results to evaluate the algorithms
and they inferred from the simulation results that performance of the proposed
algorithms outperformed than the exiting approximation algorithms.
Zhi Li and Mohapatra (2004) focused on the design of QoS aware
routing protocols for overlay networks (QRONs). The goal of QRON was to
find a QoS-satisfied overlay path, while trying to balance the overlay traffic
among the OBs and the overlay links in the OSN. A subset of OBs, connected
by the overlay paths, formed an application specific overlay network for an
overlay application. The proposed QRON algorithm adopted a hierarchical
methodology that enhanced its scalability. Two different types of path
selection algorithms were analyzed. They simulated the protocols based on
the transit-stub topologies produced by GT-ITM. Simulation results have
shown that the proposed algorithms perform well in providing QoS-aware
overlay routing service.
Xueyan (2004) investigated the minimal cost replica placement
problem for QoS-aware content distribution. The problem has been
formulated under two classes of service models such as replica aware service
and replica-blind service. They considered three different cost models such as
storage cost, update cost, and their combination. Several heuristic algorithms
have been proposed and experimentally evaluated against a super-optimal
bound obtained from the relaxed linear program. The results showed that the
proposed heuristics perform close to the super-optimal bound. In replica-blind
services, the delivery paths with respect to a given origin server were
represented by a tree topology. It is shown that the optimal solution to the
111
associated replica placement problem for minimal update cost can be
computed with a time complexity linear to the number of servers. There also
exist polynomial optimal solutions to the associated replica placement
problems for minimal storage and combined costs. Dynamic programming
algorithms with time complexities square to the number of servers have been
proposed for these two problems.
Johnson et al (2001) measured the performance of two commercial
content distribution networks (CDNs), one operated by Akamai and one
operated by Digital Island. Although there is lot of differences in the
implementation of these services, both CDNs redirect requests by using DNS.
They described their simple measurement technique for a DNS-based CDN,
their measured resultant data for the two commercial services, and their
interpretation of that data. Their main conclusion was that CDNs provide a
valuable service, but that neither Akamai nor Digital Island can consistently
pick the best server of those available. It is observed that CDNs succeed not
so much by choosing an "optimal" server as by avoiding notably bad servers.
Their experimental measurements showed interesting performance properties
of the services. However, their approach has limitations such as it is focused
on latency; it does not test the load-balancing capability of a CDN; and it does
not allow a head-to-head comparison of the two CDNs on identical data.
6.2 QOS AWARE DOMINATING SET FORMATION
ALGORITHM
QoS Aware Dominating set is formed with an aim to construct a
dominating set with following properties.
1. Efficiency
2. Controlled Redundancy
3. Fault-tolerant

112
Efficient Dominating set means that dominate every vertex in the
adjacent set utmost once.
Cardinality Redundance of a graph CR (G) can be defined as the
minimum number of vertices in the adjacent set dominated more than once by
a dominating set.
Fault Tolerance is defined as the ability of the network to provide
service even when it contains a faulty component or components.
6.2.1 Exact-1 Domination and Efficiency criterion
Efficiency can be achieved by implementing the principle of
dominate every vertex in the adjacent set utmost once.
A dominating set S is called an efficient dominating set if for every
vertex u V, |N[u] S} =1. Equivalently, a dominating set is efficient if the
distance between any two vertices in S is atleast three, that is, s is a packing.
Corollary
If a graph has an efficient dominating set, then all efficient
dominating sets in G have the same cardinality, namely ).G(
Hence, efficiency can be defined as follows.
The efficiency of a dominating set S of vertices equals the number
of vertices in V – S which are dominated exactly once by a vertex in S, that is,
(S) = | {v: |N (v) S| }= 1. The efficiency of a graph equals the maximum
efficiency of any subset S V.

113
6.2.2 Controlled Redundancy criterion
Redundance
Each vertex v dominates itself and its deg v neighbors. The
influence of a vertex set S, which measures the total amount of domination
done by S, is I(S) =Sv
v)deg1( . The redundance of a graph G is the
minimum total amount of domination given that every vertex gets dominated
at total amount of domination given that every vertex gets dominated atleast
once, R(G) =min{I(S) : S is a dominating set }.
6.2.3 Fault Tolerance criterion
The behavior of a network in the presence of a fault can be
analyzed by determining the effect that removing an edge (link failure) or a
vertex (processor failure) from its underlying graph G has on the fault-tolerant
criterion.
For example, a -set in G represents a minimum set of processors
that can communicate directly with all other processors in the system. If it is
essential for file servers to have this property and that the number of
processors designated as file servers be limited, then the domination number
of G is the fault-tolerance criterion. In this above example, it is important that
)G( does not increase when G is modified by removing a vertex or an edge.
From another perspective, networks can be made fault-tolerant by providing
redundant vertices (alternate surrogate servers). Hence, we examine the
effects on )G( when G is modified by deleting a vertex or deleting or adding
an edge.

114
Fault Tolerant Criterion
For any tree T in D with n 2 , there exists a vertex v V, such that
)vT( = )T( .
Proof
Assume that T has atleast one vertex v with deg(u) 2 that is
adjacent to atleast one end vertex and atmost one non end vertex. If v is
adjacent to two or more end vertices u1 and u2, then v is in every -set for T
and )1uT( = )T( . If not, then v is adjacent to one end vertex u and
deg(v)=2.
Let T’ = T – v – u. For any graph G, if deg (u) = 1, then )uG( )G( .
Hence, )'T( )uT( )T( . However, )'T( )T( - 1.
If )'T( = )T( - 1, then )T( = )vT( . Otherwise, ).vT()T()'T(
It is inferred that removing a vertex can increase the domination
number by more than one, but can decrease it by atmost one. For examples,
removing the center vertex of a star K1,n-1 increases the domination number by
n-2; and removing an end vertex from the corona G = H . K1, for any
nontrivial connected graph, decreases it by one, but removing any other
vertex does not change the value of . The path P3k+1, for k 1, is another
example of a graph for which the removal of an end vertex decreases the
domination number by one. Furthermore, if S is a -set, then removing any
vertex in V – S cannot increase the domination number, hence, |V+ | )(G .

115
QoS Aware Dominating Set based SON (QADSON) construction
Algorithm
Step 1 : Mark all the vertices of the graph white.
Step 2 : Select the vertex with the maximal number of white
neighbors.
Step 3 : The selected vertex is marked black and its neighbors are
marked gray.
Step 4 : The algorithm then iteratively scans the gray nodes and
their white neighbors, and selects the gray node or the
pair of nodes (a gray node and one of its white
neighbors), whichever has the maximal number of white
neighbors.
Step 5 : The selected node or the selected pair of nodes is marked
black, with their white neighbors marked gray.
Step 6 : Once all the vertices are marked gray or black, the
algorithm terminates. All the black nodes form a
Dominating Set (DS).
// QoS Aware Dominating Set formation steps
Step 7 : After forming the DS, check the degree of each vertices
of the dominating set.
Step 8 : If the degree of any vertex is more than one then marks
that vertex gray and find the suitable alternate vertex as
the member of the dominating set.
// exact-1 domination
Step 9 : Check whether the following criterions are satisfied by
the DS.
// Efficiency Criterion
i. | N [u] D | = 1 for every v V (G)
// Redundance Control Criterion

116
ii. CR(G) =min{ )(GVv |N[v] D|:D} = min{I(D)}
Where D is a dominating set
// Fault Tolerance criterion
iii. For any tree T in D with n 2 , there exists a vertex
v V, such that )vT( = )T(
The QoS Aware dominating set formation algorithm is applied to
form the semantic overlay network of surrogate servers which are connected
logically to provide the logical infrastructure of the CDN, in which any
replication algorithm can replicate the content.
6.3 SIMULATION STUDY
CDNsim simulation tool developed by Stamos et al (2010) is used
to create and customize the simulation environment named QADSONCDN
which includes the following five modules.
QADSON based CDN Model
To evaluate the performance of the proposed QADSONCDN
simulation environment developed using the simulation tool CDNsim, which
simulates a main CDN infrastructure based on QoS Aware dominating set and
is implemented in the C programming language. In QADSON based CDN
infrastructure where surrogate servers are logically grouped to form the QoS
aware content distribution network backbone based on QoS constraint
dominating set construction algorithm.. So all the surrogate servers are either
member of dominated semantic overlay network of surrogate servers or
member of adjacent surrogate server set which is one hop connected with the
QADSON. Each surrogate server maintains the neighbourhood information
and knowledge about the file objects stored in all the other surrogate servers.
117
If user’s request is missed on a surrogate server which is not a member of
QADSON then the content will be searched on the adjacent surrogate server
which is the member of QADDSON and served. If the content is not available
in the adjacent surrogate server then the content will be searched in the other
surrogate server in the QADSON and served. If the content is not available in
the entire QADSON then it is pulled from origin server. By default, CDNsim
simulates a cooperative push-based CDN infrastructure, where each surrogate
server has knowledge about what content (which has been proactively pushed
to surrogate servers) is cached to all the other surrogate servers. If a user’s
request is missed on a surrogate server, then it is served by another surrogate
server. In this framework, the CDNsim simulates a CDN with 200 surrogate
servers which have been located all over the world. The default size of each
surrogate server has been defined as the 40 percent of the total bytes of the
Web server content. Each surrogate server in CDNsim is configured to
support 1,000 simultaneous connections.
Web Server Content Generator
This Web server content generator module includes modelling the
file object, its size and semantic characteristics such as type of content
mentioning static or dynamic. Usually Web server content generator module
creates two files. The first one is the graph and the second one record the
produced communities.
Client Request Stream Generator and Network Topology Generator
This captures the main characteristics of web user’s behaviour, and
built-in network topology generator to generate Waxman network topology
with 200 surrogate servers, 100000 clients and 1000 routers. In this study, we
have generated a maximum of 1 million users’ requests and each request is
for a single object. We considered that the requests arrive according to a

118
Poisson distribution with rate equal to 30. Then, the web user’s requests are
assigned to CDN’s surrogate servers taking into account the network
proximity and the surrogate server’s load, which is the typical way followed
by CDNs’ providers. This configured Waxman network topology captures a
realistic Internet topology by using BGP routing data collected from a set of
seven geographically dispersed BGP peers.
Content Distribution Algorithm Simulator
This Content Distribution Algorithm Simulator module is developed in
OMNeT++ to simulate the working of content replication algorithm. It
collects the entire file object and its semantic information from the origin
server, maintains the neighborhood information, decision making logic and
disseminates the object according to the content replication algorithm
EFRRA.
Account Manager
Account manager module is developed in the simulation test bed using
OMNeT++, used to capture the traffic information at each and every moment
and maintain the trace files and logs. These log information contains the
number of file objects stored in the surrogate servers, number of blocks
generated during block level replication, number of packets lost during
transmission, number of redundant blocks generated and transmitted and time
of initiation, time taken to reach the destination , number of completed
requests, number of requests rejected, number of requests arrived etc. These
log information can be used by the account manager to compute the Quality
of Service metrics such as Mean CDN Utility, Average Replication Time,
Delivery ratio, Reception efficiency, Mean Response Time, Latency, Hit
Ratio Percentage, Number of Completed Requests, Rejection rate and Mean
CDN Load.

119
CDN Network Simulation Set up
The distribution and arrangement of servers, routers and clients in
the network affects the performance of the CDN. Different network backbone
types result in different “neighbourhoods” of the network elements.
Therefore, the redirection of the requests and ultimately the distribution of the
content are affected. In CDNsim simulation test bed, Waxman network
topology with 1000 routers is configured. The routers retransmit network
packets using the TCP/IP protocol between the clients and the CDN. All the
network phenomena such as bottlenecks and network delays, packet routing
protocols, content distribution policies, QADSON formation mechanism are
simulated.
Table 6.1 Technical Specification of CDNsim Simulation Environment
in QADSON
Simulation Parameters Specification
Network Topology WAXMAN
Surrogate Server Cooperation
Mechanisms used
SON, DSON, EDSON, QADSON
Number of surrogate Servers 200
Number of Clients 100000
Website Size 1GB
Number of File Objects in
Website
50000
Maximum Number of Requests 1000000
Link speed 1Gbps
QoS Parameters measured at
Surrogate Server
Average Replication Time, Delivery ratio
QoS Parameters measured at
Client side
Mean Response Time, Mean CDN Utility,
Latency, Hit Ratio Percentage, Rejection
rate and CDN Load.

120
6.4 RESULTS AND DISCUSSION
6.4.1 Performance of EFRRA algorithm in terms of Average
Replication Time in SON, DSON, EDSON and QADSON
We measured the Average Replication Time of EFRRA to replicate
the different sized files in the SON, DSON, EDSON and QADSON and the
performance graph is depicted in Figure 6.1. It is observed that Average
Replication Time of EFRRA is very less in QADSON based replication set.
Figure 6.1 Performance of EFRRA in SON, DSON, EDSON and
QADSON in terms of Average Replication Time
6.4.2 Performance of EFRRA in terms of Delivery ratio in SON,
DSON, EDSON and QADSON
The Delivery ratio is defined as the ratio of the number of data
packets successfully received by the recipient surrogate server to the number
of data packets sent by the source surrogate server. The worst case Delivery
ratio of EFRRA in SON, DSON, EDSON and QADSON when the number of
EFRRA's Performance in SON, DSON, EDSON and QADSON
0
5
10
15
20
25
10
0K
B
75
0K
B
1.5
MB
3M
B
4.5
MB
6M
B
9M
B
18
MB
36
MB
54
MB
72
MB
12
8M
B
File Size
Av
era
ge
Re
pli
ca
tio
n T
ime
Avg. Replication Time of EFRRA in SON based CDN
Avg. Replication Time of EFRRA in DSON based CDN
Avg. Replication Time of EFRRA in EDSON based CDN
Avg. Replication Time of EFRRA in QADSON based CDN
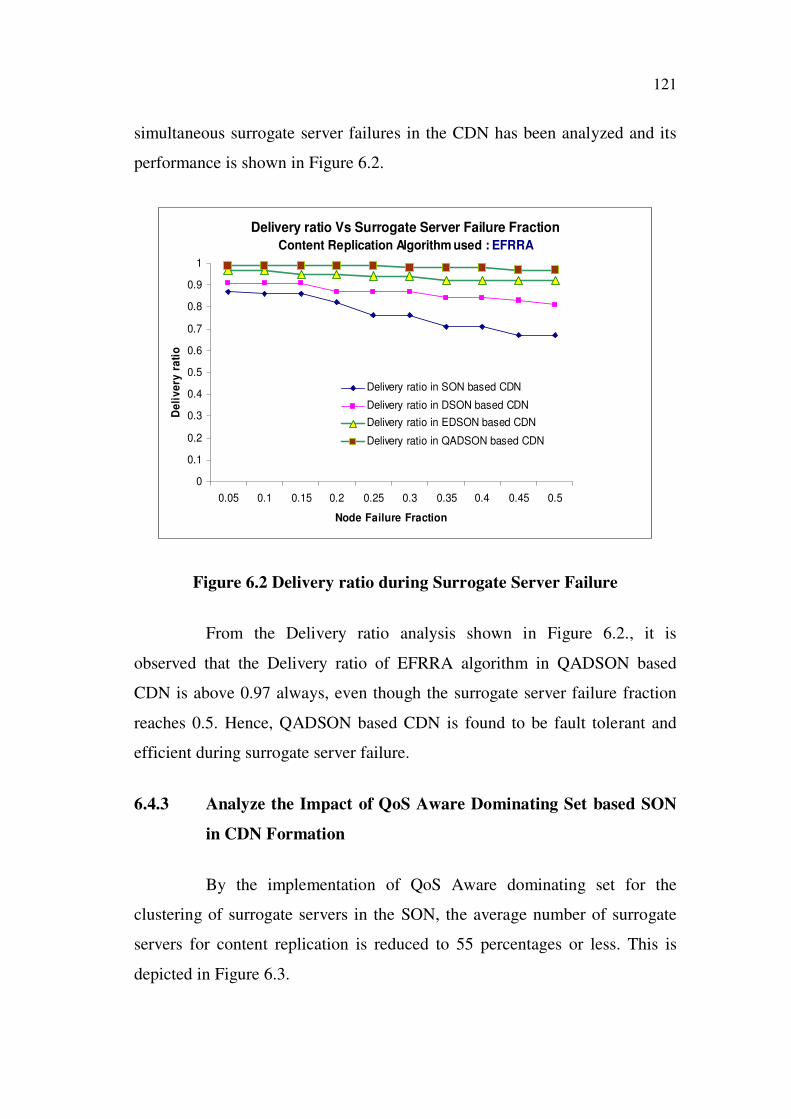
121
simultaneous surrogate server failures in the CDN has been analyzed and its
performance is shown in Figure 6.2.
Delivery ratio Vs Surrogate Server Failure Fraction
Content Replication Algorithm used : EFRRA
0
0.1
0.2
0.3
0.4
0.5
0.6
0.7
0.8
0.9
1
0.05 0.1 0.15 0.2 0.25 0.3 0.35 0.4 0.45 0.5
Node Failure Fraction
De
liv
ery
ra
tio
Delivery ratio in SON based CDN
Delivery ratio in DSON based CDN
Delivery ratio in EDSON based CDN
Delivery ratio in QADSON based CDN
Figure 6.2 Delivery ratio during Surrogate Server Failure
From the Delivery ratio analysis shown in Figure 6.2., it is
observed that the Delivery ratio of EFRRA algorithm in QADSON based
CDN is above 0.97 always, even though the surrogate server failure fraction
reaches 0.5. Hence, QADSON based CDN is found to be fault tolerant and
efficient during surrogate server failure.
6.4.3 Analyze the Impact of QoS Aware Dominating Set based SON
in CDN Formation
By the implementation of QoS Aware dominating set for the
clustering of surrogate servers in the SON, the average number of surrogate
servers for content replication is reduced to 55 percentages or less. This is
depicted in Figure 6.3.

122
Size of CDN vs Number of Surrogate Servers
0
20
40
60
80
100
120
140
160
180
200
20 40 60 80 100 120 140 160 180 200
# of Surrogate Servers
Siz
e o
f C
DN
SON based CDN construction
DSON based CDN construction
EDSON based CDN construction
QADSON based CDN construction
Figure 6.3 Reduction in Replication Set due to the impact of Equitable
Dominating Set in CDN Formation
6.4.4 Analyse the role of QoS Aware Dominating Set in surrogate
server utilization
CDN Utility is the mean of the individual net utilities of each
surrogate server in a CDN. Net Utility is a value that expresses the relation
between the number of bytes of the served content against the number of
bytes of the pulled content from origin or other surrogate servers. Net Utility
(Ui) of a surrogate server can be given by the formula.
Ui = 2 / * arctan ( ) (6.1)
– ratio between uploaded bytes to downloaded bytes.
The resulting utility value ranges to [0..1].
The value Ui can be

123
Ui = 1 if the surrogate server uploads only content
Ui = 0 if the surrogate server downloads only content
Ui = 0.5 if upload and downloads are equal
We evaluate the performance of CDN in terms of Mean CDN
Utility (UMean) which can be computed using the following formula.
UMean = 1/n *ni
iiU
1 (6.2)
We investigated the use of different overlay construction
methodologies such as Semantic Overlay Network (SON), Dominating set
based SON (DSON), Equitable Dominating Set based SON (EDSON) and
QoS Aware Dominating Set based SON in terms of Mean CDN Utility. It is
observed that QADSON based CDN is very useful in maintaining uniform
Mean CDN Utility (UMean) of 0.95. It is also found that QADSON based CDN
outperforms other CDN construction methodologies such as SON, DSON and
EDSON in terms of Mean CDN Utility. This is depicted in Figure 6.4.
Mean CDN Utility Vs Number of Surrogate Servers
0
0.1
0.2
0.3
0.4
0.5
0.6
0.7
0.8
0.9
1
40 60 80 100 120 140 160 180 200
# of Surrogate Servers
Me
an
CD
N U
tility
Mean CDN Utility in SON based CDN
Mean CDN Utility in DSON based CDN
Mean CDN Utility in EDSON based CDN
Mean CDN Utility in QADSON based CDN
Figure 6.4 Construction of SON Vs Mean CDN Utility
124
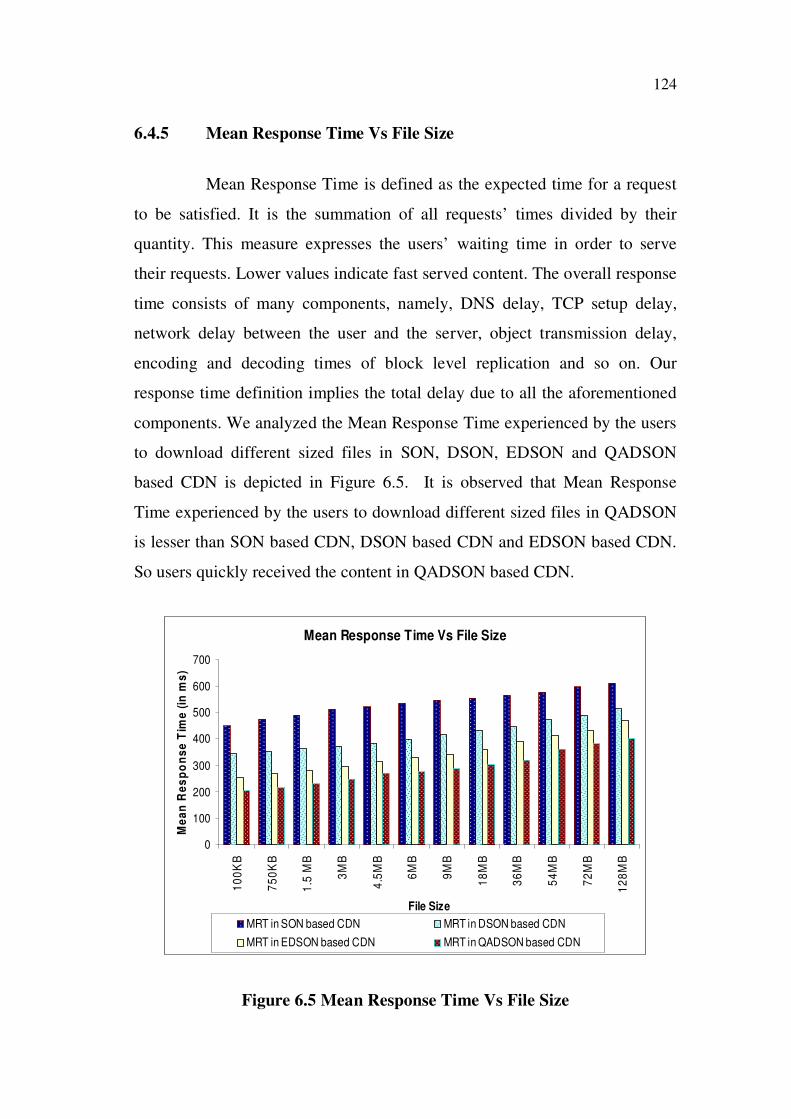
6.4.5 Mean Response Time Vs File Size
Mean Response Time is defined as the expected time for a request
to be satisfied. It is the summation of all requests’ times divided by their
quantity. This measure expresses the users’ waiting time in order to serve
their requests. Lower values indicate fast served content. The overall response
time consists of many components, namely, DNS delay, TCP setup delay,
network delay between the user and the server, object transmission delay,
encoding and decoding times of block level replication and so on. Our
response time definition implies the total delay due to all the aforementioned
components. We analyzed the Mean Response Time experienced by the users
to download different sized files in SON, DSON, EDSON and QADSON
based CDN is depicted in Figure 6.5. It is observed that Mean Response
Time experienced by the users to download different sized files in QADSON
is lesser than SON based CDN, DSON based CDN and EDSON based CDN.
So users quickly received the content in QADSON based CDN.
Mean Response Time Vs File Size
0
100
200
300
400
500
600
700
10
0K
B
75
0K
B
1.5
MB
3M
B
4.5
MB
6M
B
9M
B
18
MB
36
MB
54
MB
72
MB
12
8M
B
File Size
Me
an
Re
sp
on
se
Tim
e (
in m
s)
MRT in SON based CDN MRT in DSON based CDN
MRT in EDSON based CDN MRT in QADSON based CDN
Figure 6.5 Mean Response Time Vs File Size

125
6.4.6 Mean Response Time Vs Number of Clients
Simulation experiment is conducted by fixing the input values for
following parameters.
Maximum Number of Requests = 1,000,000
Number of File Objects = 50000
Maximum Website Size = 1GB
From the experimental results, we found that when the number of
clients increases in a network the Mean Response Time always increases. But
the increase in Mean Response Time in QADSON based CDN is uniform and
is always less than the Mean Response Times in EDSON based CDN, DSON
based CDN and SON based CDN which is depicted in Figure 6.6.
Mean Response Time Vs Number of Clients
Maximum Number of Requests = 1,000,000
Number of File Objects = 50000
Max. Website Size = 1GB
0
100
200
300
400
500
600
700
800
900
100
150
200
250
300
350
400
450
500
550
600
650
700
750
800
850
900
950
1000
Number of Clients X 102
Mean R
esp
on
se T
ime (
in m
s)
MRT in SON based CDN
MRT in DSON based CDN
MRT in EDSON based CDN
MRT in QADSON based CDN
Figure 6.6 Mean Response Time Vs Number of Clients
126
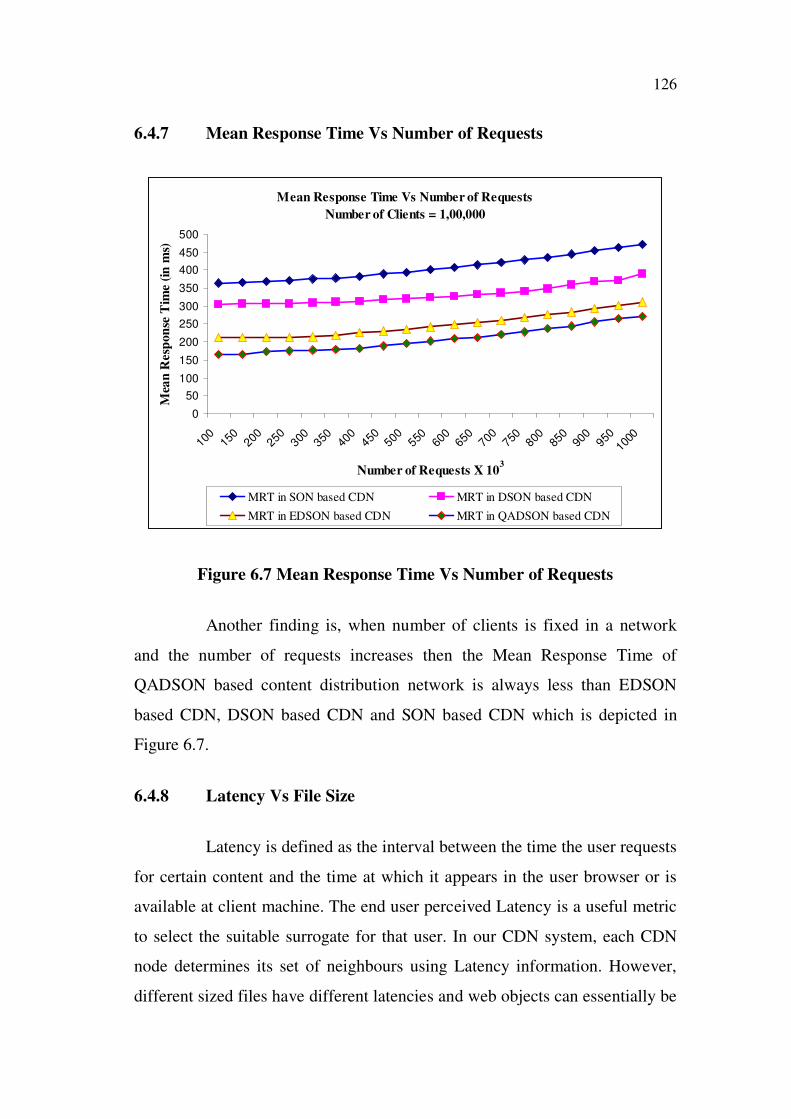
6.4.7 Mean Response Time Vs Number of Requests
Mean Response Time Vs Number of Requests
Number of Clients = 1,00,000
0
50
100
150
200
250
300
350
400
450
500
100
150
200
250
300
350
400
450
500
550
600
650
700
750
800
850
900
950
1000
Number of Requests X 103
Mea
n R
esp
on
se T
ime (
in m
s)
MRT in SON based CDN MRT in DSON based CDN
MRT in EDSON based CDN MRT in QADSON based CDN
Figure 6.7 Mean Response Time Vs Number of Requests
Another finding is, when number of clients is fixed in a network
and the number of requests increases then the Mean Response Time of
QADSON based content distribution network is always less than EDSON
based CDN, DSON based CDN and SON based CDN which is depicted in
Figure 6.7.
6.4.8 Latency Vs File Size
Latency is defined as the interval between the time the user requests
for certain content and the time at which it appears in the user browser or is
available at client machine. The end user perceived Latency is a useful metric
to select the suitable surrogate for that user. In our CDN system, each CDN
node determines its set of neighbours using Latency information. However,
different sized files have different latencies and web objects can essentially be
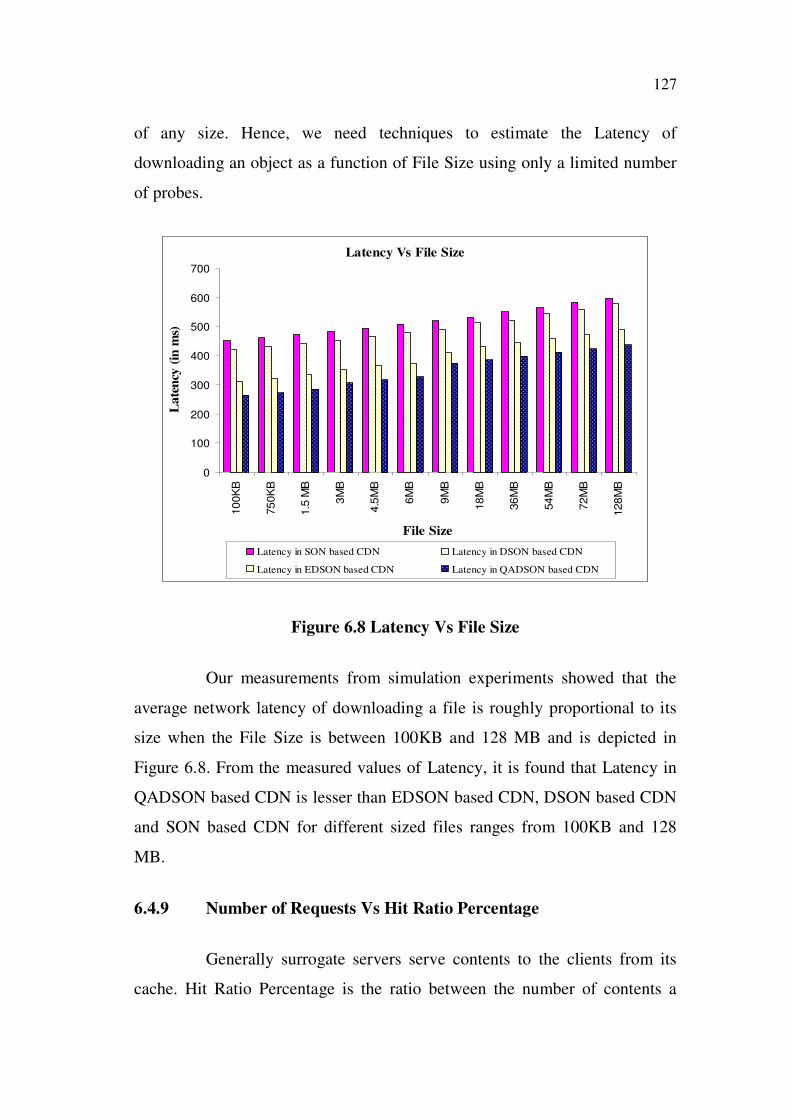
127
of any size. Hence, we need techniques to estimate the Latency of
downloading an object as a function of File Size using only a limited number
of probes.
Latency Vs File Size
0
100
200
300
400
500
600
700
100K
B
750K
B
1.5
MB
3M
B
4.5
MB
6M
B
9M
B
18M
B
36M
B
54M
B
72M
B
128M
B
File Size
Late
ncy
(in
ms)
Latency in SON based CDN Latency in DSON based CDN
Latency in EDSON based CDN Latency in QADSON based CDN
Figure 6.8 Latency Vs File Size
Our measurements from simulation experiments showed that the
average network latency of downloading a file is roughly proportional to its
size when the File Size is between 100KB and 128 MB and is depicted in
Figure 6.8. From the measured values of Latency, it is found that Latency in
QADSON based CDN is lesser than EDSON based CDN, DSON based CDN
and SON based CDN for different sized files ranges from 100KB and 128
MB.
6.4.9 Number of Requests Vs Hit Ratio Percentage
Generally surrogate servers serve contents to the clients from its
cache. Hit Ratio Percentage is the ratio between the number of contents a

128
surrogate is serving and the number of content request it is receiving. A high
Hit Ratio indicates an effective cache management policy, content distribution
policy and surrogate server cooperation. It improves network performance
and bandwidth saving.
Hit Ratio Percentages Vs Number of RequestsNumber of Clients = 100000
Number of File Objects = 50000
0
10
20
30
40
50
60
70
80
90
100
100
150
200
250
300
350
400
450
500
550
600
650
700
750
800
850
900
950
1000
Number of Requests X 103
Hit
Rati
o P
erc
en
tag
e (in
%)
Hit Ratio Percentage in SON based CDN
Hit Ratio Percentage in DSON based CDN
Hit Ratio Percentage in EDSON based CDN
Hit Ratio Percentage in QADSON based CDN
Figure 6.9 Number of Requests Vs Hit Ratio Percentage
Simulation experiment is conducted by fixing the input values for
following parameters.
Number of clients = 100000
Number of File Objects = 50000
From experimental results plotted in Figure 6.9. we can see that for
particular number of requests, Hit Ratio Percentage of QADSON based CDN
is always higher than Hit Ratio Percentages of EDSON based CDN, DSON
based CDN and SON based CDN. Also in QADSON based CDN
infrastructure most of the time the surrogates are able to serve the request, as
129
load is almost equally balanced among the surrogates, so redirection
probability is less. But in EDSON, DSON and SON based CDN request
redirection probability is higher, and in worst case it may happen that there is
no requested content in a surrogate. So the surrogate redirects the requests to
other surrogates that have those contents or sometimes to the origin server
itself.
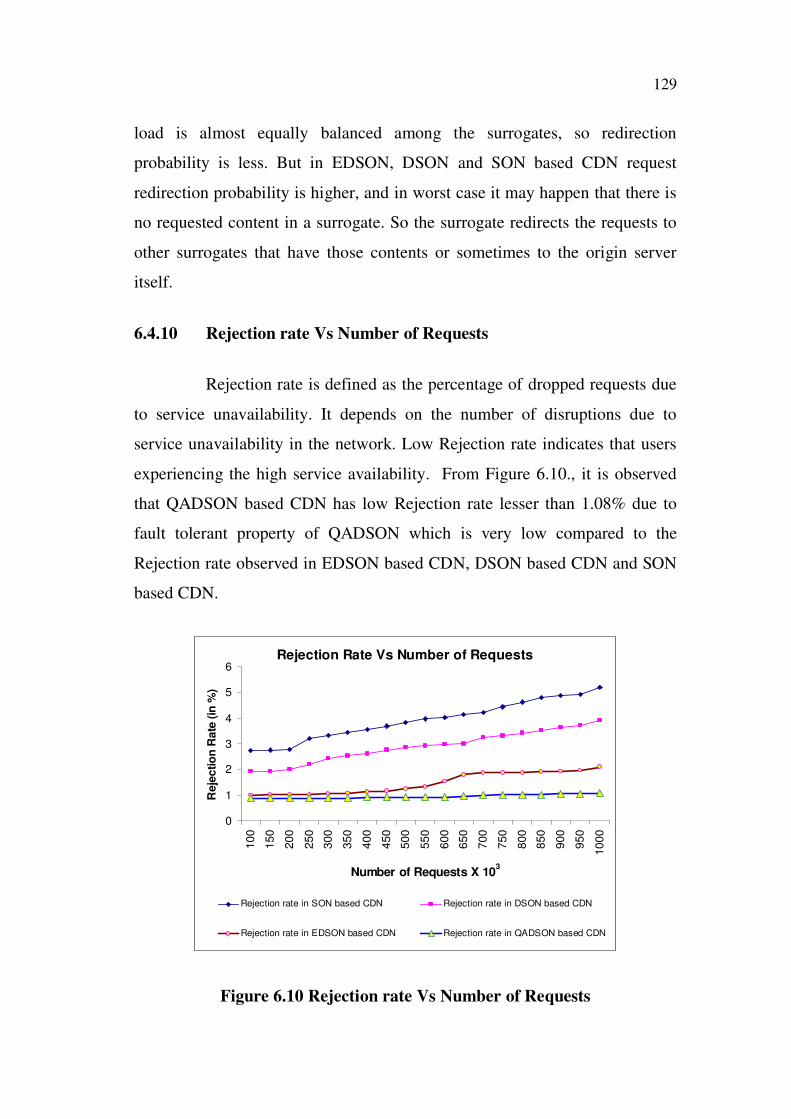
6.4.10 Rejection rate Vs Number of Requests
Rejection rate is defined as the percentage of dropped requests due
to service unavailability. It depends on the number of disruptions due to
service unavailability in the network. Low Rejection rate indicates that users
experiencing the high service availability. From Figure 6.10., it is observed
that QADSON based CDN has low Rejection rate lesser than 1.08% due to
fault tolerant property of QADSON which is very low compared to the
Rejection rate observed in EDSON based CDN, DSON based CDN and SON
based CDN.
Rejection Rate Vs Number of Requests
0
1
2
3
4
5
6
100
150
200
250
300
350
400
450
500
550
600
650
700
750
800
850
900
950
1000
Number of Requests X 103
Reje
ctio
n R
ate
(in
%)
Rejection rate in SON based CDN Rejection rate in DSON based CDN
Rejection rate in EDSON based CDN Rejection rate in QADSON based CDN
Figure 6.10 Rejection rate Vs Number of Requests

130
6.4.11 CDN Load Vs Total Number of Requests
CDN Load can be defined as the ratio of mean request arrival rate
(i.e. number of requests arrived per second) and mean service rate. From the
experimental results, we found that when the number of requests increases in
the CDN, the CDN Load always increases. But the increase in load in
QADSON based CDN is uniform and in between 0.6 to 0.7. It is also
observed that the CDN Load of QADSON based CDN is always less than the
CDN Load of EDSON based CDN, DSON based CDN and SON based CDN
which is depicted in Figure 6.11.
CDN Load Vs Number of Requests
0
0.1
0.2
0.3
0.4
0.5
0.6
0.7
0.8
0.9
1
10
0
15
0
20
0
25
0
30
0
35
0
40
0
45
0
50
0
55
0
60
0
65
0
70
0
75
0
80
0
85
0
90
0
95
0
10
00
Number of Requests X 103
CD
N L
oa
d
CDN Load in SON based CDN
CDN Load in DSON based CDN
CDN Load in EDSON based CDN
CDN Load in QADSON based CDN
Figure 6.11 CDN Load Vs Number of Requests
131
6.5 Related Contributions
QoS Aware Dominating set based Semantic Overlay Network
(QADSON) of surrogate servers is constructed to form the logical
infrastructure of CDN. Then EFRRA content replication algorithm is applied
to disseminate the content among the surrogate servers in QADSON.
Simulation experiments are conducted using CDNsim and analyzed the
performance of EFRRA algorithm in terms of Average Replication Time,
Delivery ratio in SON, DSON, EDSON and QADSON based CDN. The
effect of QoS Aware dominating set in SON formation and it’s useful in
reducing the redundancy; improving the efficiency and maintaining fault
tolerance were investigated. It is also observed that QoS aware dominating set
based SON is useful in keeping the Mean Response Time stable and much
more predictable and further noticed that Mean CDN Utility is uniform and
above 0.95. We also evaluated the performance of QADSON based CDN in
terms of Size of CDN, Mean CDN Utility, Mean Response Time, Latency,
Hit Ratio Percentage, Rejection rate and CDN Load.