Embed Size (px)
DESCRIPTION
econ ch 6
Citation preview
ECONOMIC GROWTH
Chapter 6
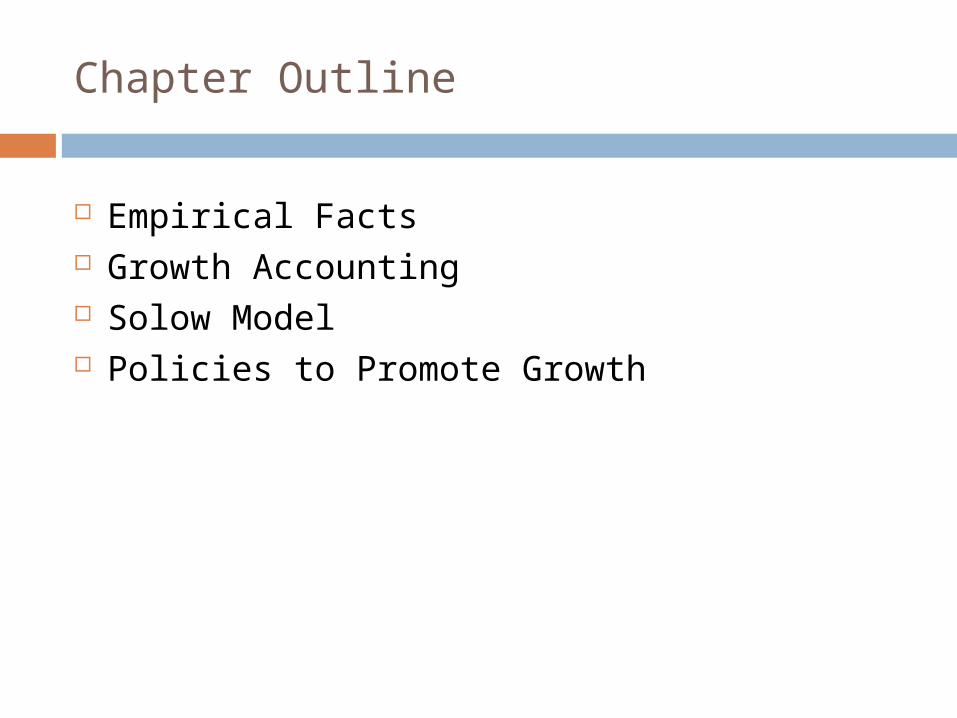
Chapter Outline
Empirical Facts Growth Accounting Solow Model Policies to Promote Growth
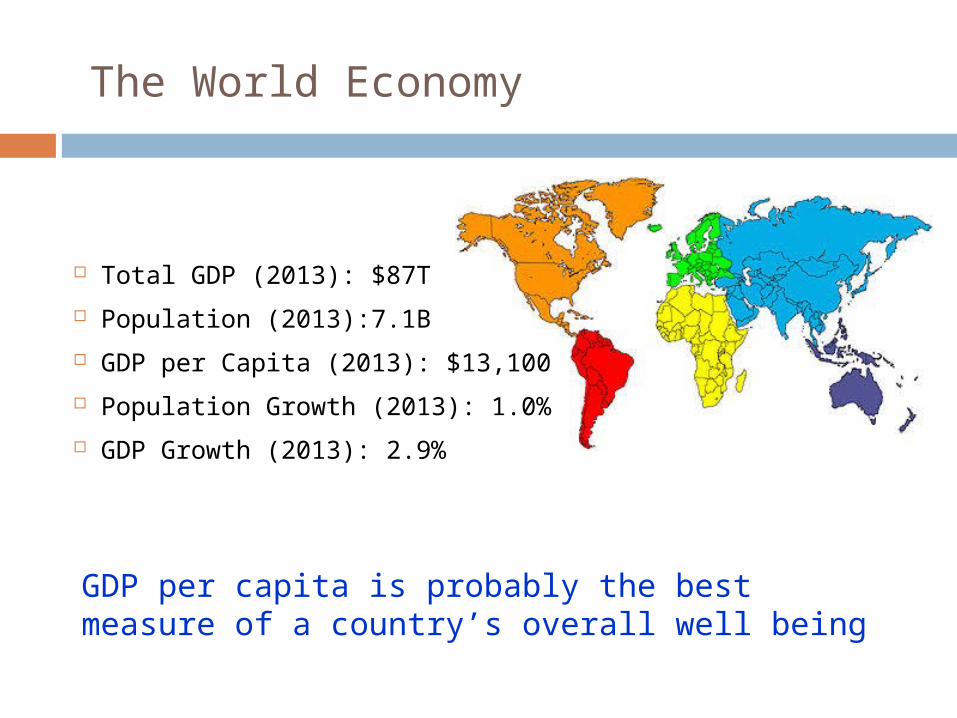
The World Economy
Total GDP (2013): $87T
Population (2013):7.1B
GDP per Capita (2013): $13,100
Population Growth (2013): 1.0%
GDP Growth (2013): 2.9%
GDP per capita is probably the best measure of a country’s overall well being
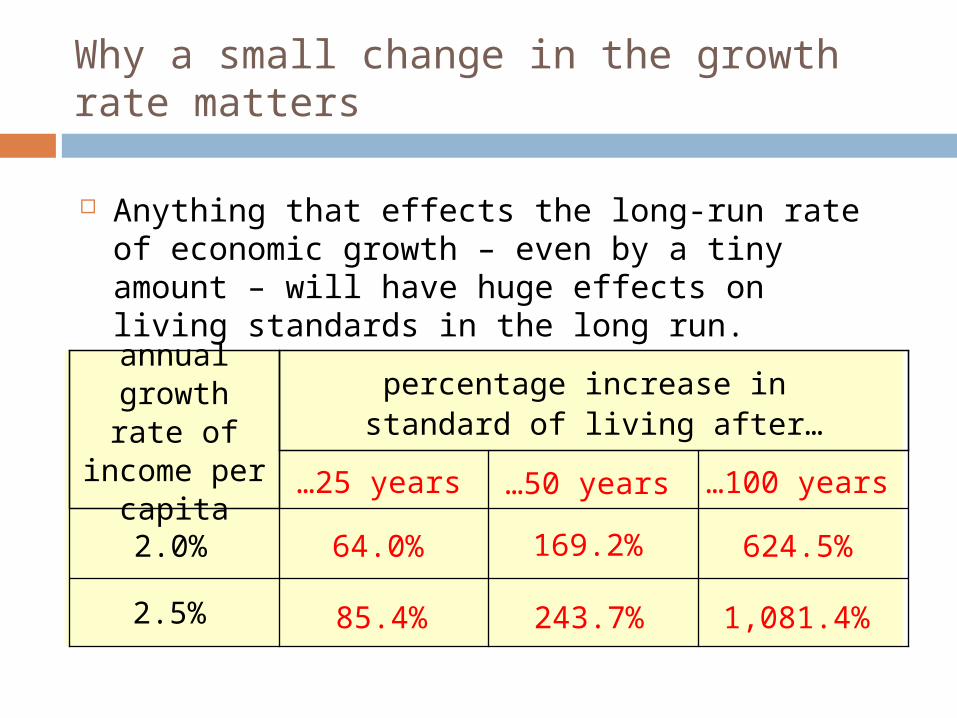
Why a small change in the growth rate matters
Anything that effects the long-run rate of economic growth – even by a tiny amount – will have huge effects on living standards in the long run.
1,081.4%243.7%85.4%
624.5%169.2%64.0%
2.5%
2.0%
…100 years…50 years…25 years
percentage increase in standard of living after…
annual growth rate of
income per capita
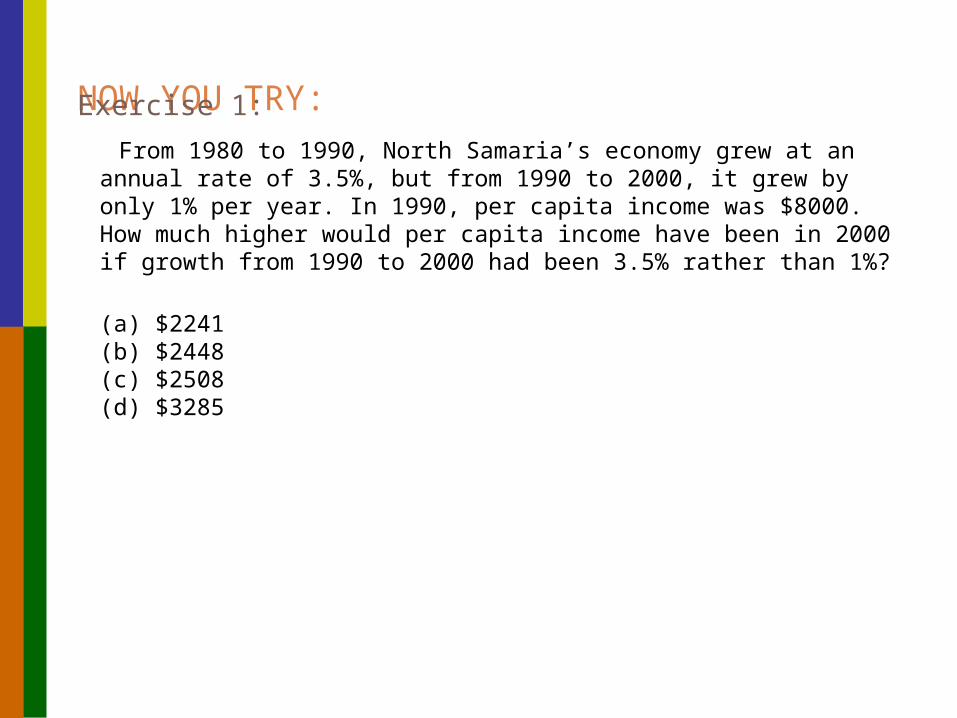
NOW YOU TRY: Exercise 1:
From 1980 to 1990, North Samaria’s economy grew at an annual rate of 3.5%, but from 1990 to 2000, it grew by only 1% per year. In 1990, per capita income was $8000. How much higher would per capita income have been in 2000 if growth from 1990 to 2000 had been 3.5% rather than 1%?
(a) $2241 (b) $2448 (c) $2508 (d) $3285

Region GDP % of World GDP
GDP Per Capita
Real GDP Growth
United States $17T 20% $53,000 1.6%
European Union $16T 18% $35,000 0.1%
Japan $4.7T 5% $36,300 2.0%
China $13T 15% $9,800 7.7%
Ghana $90B .1% $3,500 7.9%
Ethiopia $118.2B .13% $1,300 7.0%
However, note that growth rates vary significantly across countries/regions. Do you see a pattern here?
Source: CIA World Factbook (2013 Estimates)
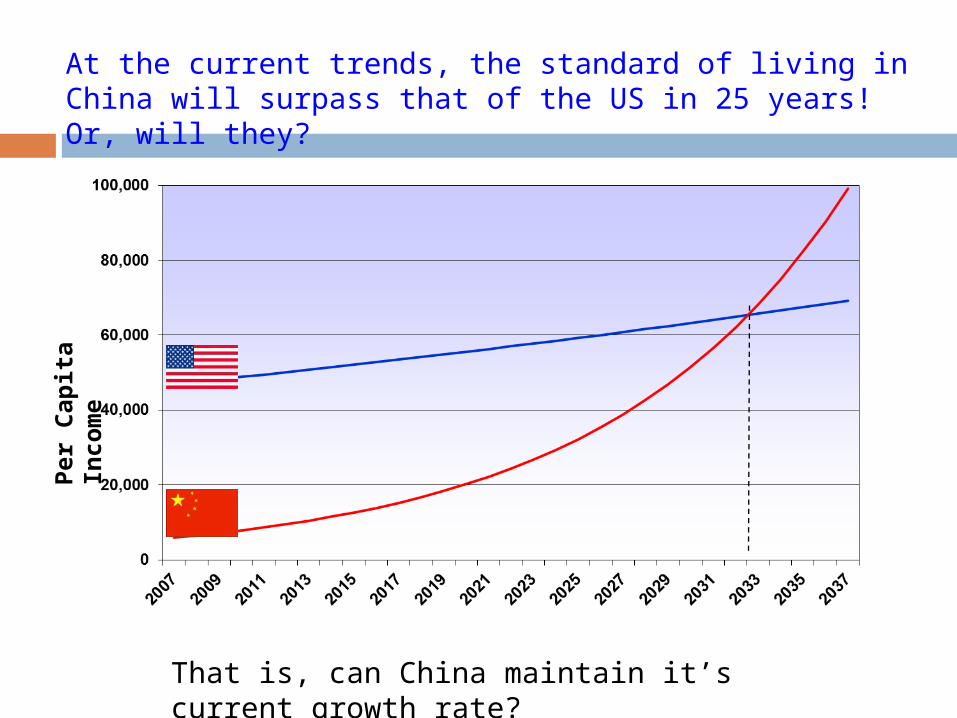
At the current trends, the standard of living in China will surpass that of the US in 25 years! Or, will they?
Per
Cap
ita
Inco
me
That is, can China maintain it’s current growth rate?
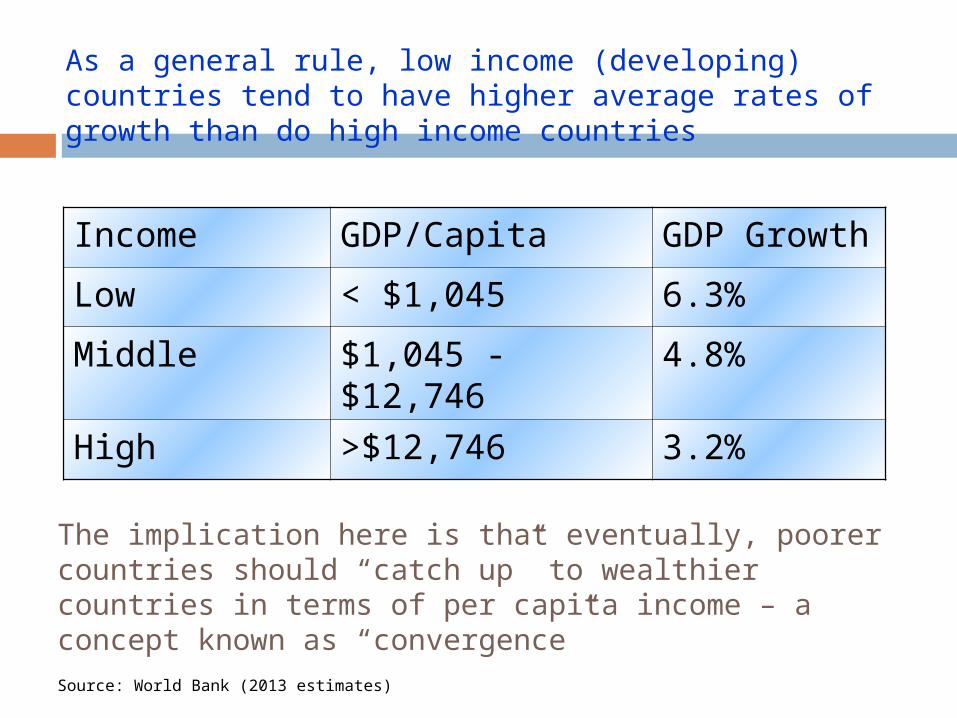
Income GDP/Capita GDP Growth
Low < $1,045 6.3%
Middle $1,045 - $12,746 4.8%
High >$12,746 3.2%
As a general rule, low income (developing) countries tend to have higher average rates of growth than do high income countries
The implication here is that eventually, poorer countries should “catch up” to wealthier countries in terms of per capita income – a concept known as “convergence”
Source: World Bank (2013 estimates)
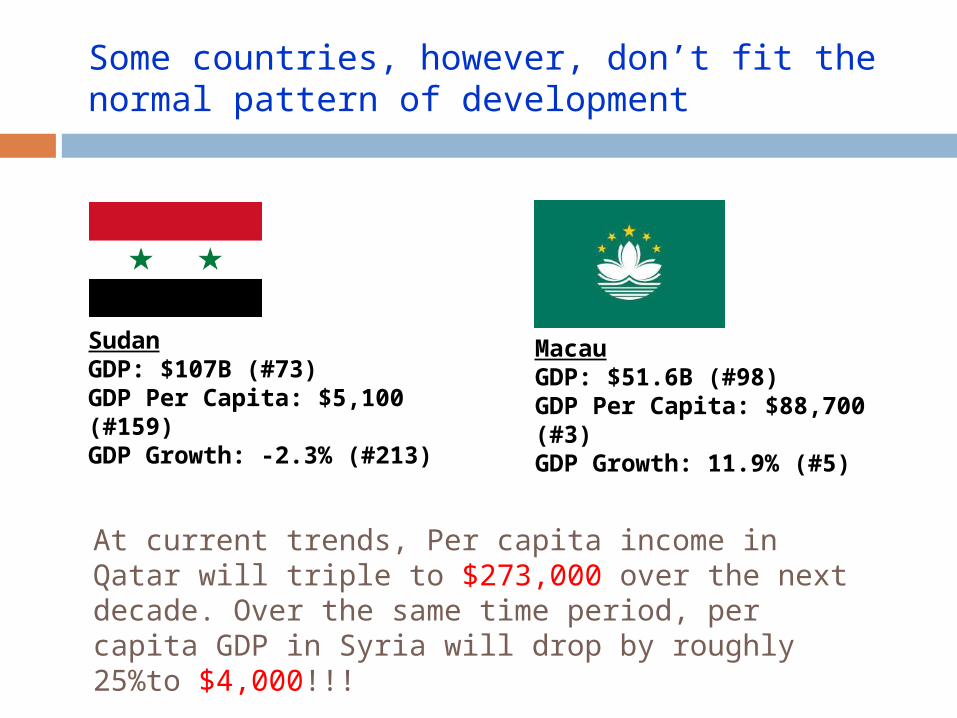
Some countries, however, don’t fit the normal pattern of development
SudanGDP: $107B (#73)GDP Per Capita: $5,100 (#159)GDP Growth: -2.3% (#213)
MacauGDP: $51.6B (#98)GDP Per Capita: $88,700 (#3)GDP Growth: 11.9% (#5)
At current trends, Per capita income in Qatar will triple to $273,000 over the next decade. Over the same time period, per capita GDP in Syria will drop by roughly 25%to $4,000!!!

Roadmap
To understand economic growth we need to understand:
1. The production function (tells us about GDP today)
2. The Solow model (tells us about GDP over time)
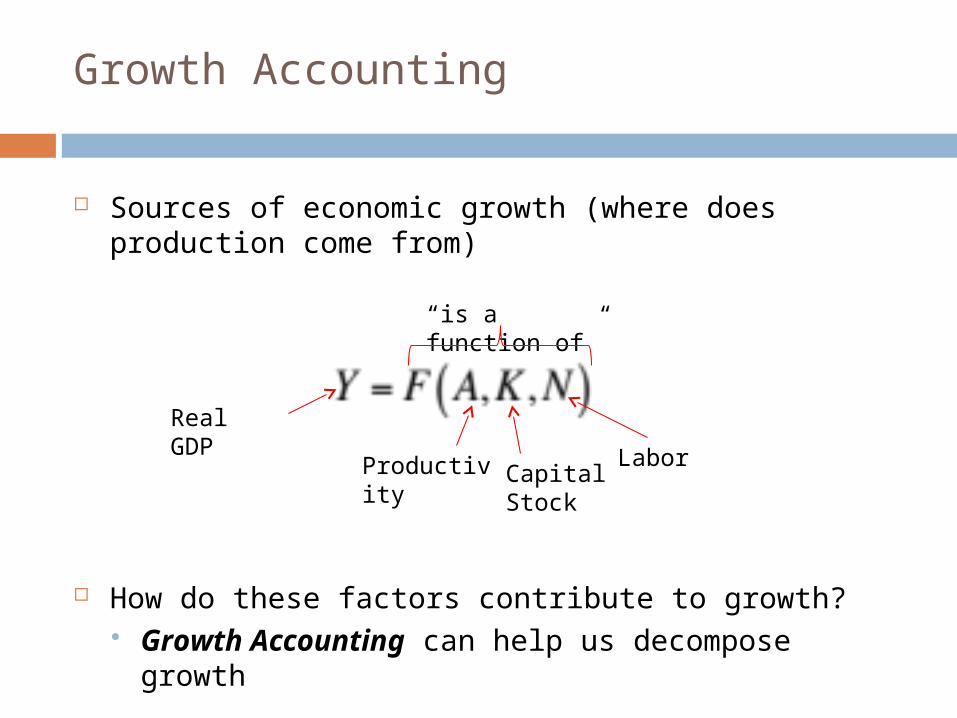
Sources of economic growth (where does production come from)
How do these factors contribute to growth? Growth Accounting can help us decompose growth
Growth Accounting
Real GDP
“is a function of”
Productivity Capital Stock
Labor
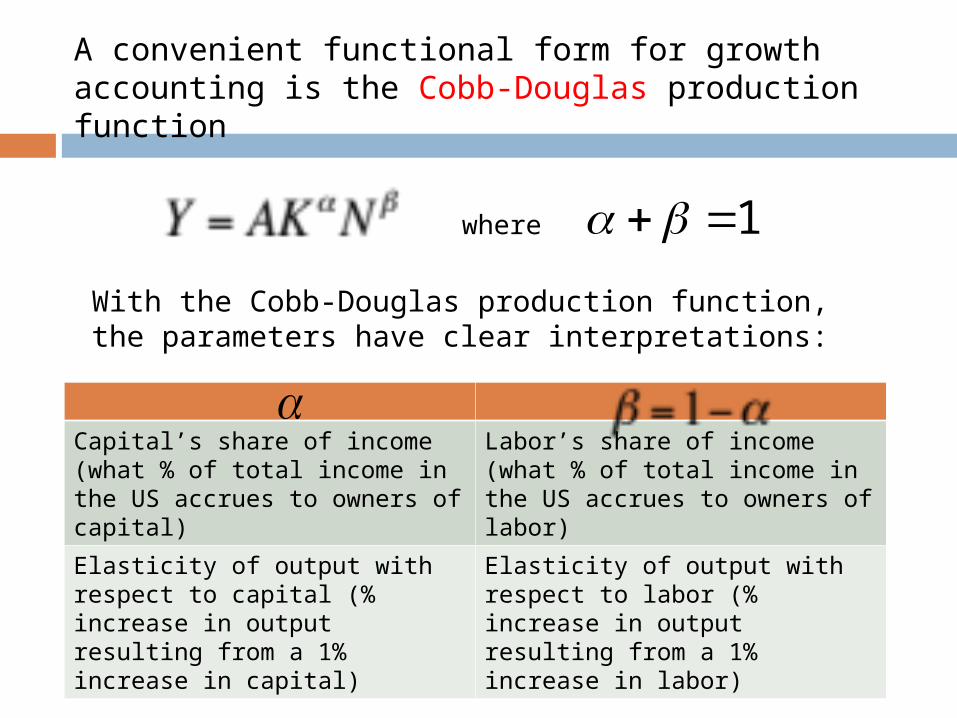
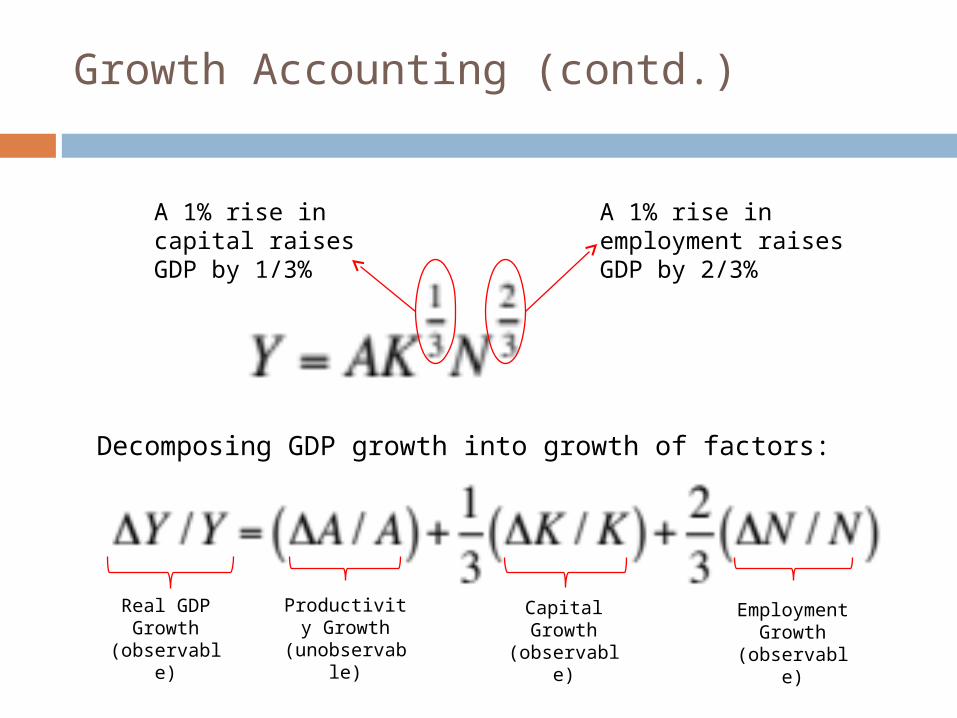
A convenient functional form for growth accounting is the Cobb-Douglas production function
where 1
With the Cobb-Douglas production function, the parameters have clear interpretations:
Capital’s share of income (what % of total income in the US accrues to owners of capital)
Labor’s share of income (what % of total income in the US accrues to owners of labor)
Elasticity of output with respect to capital (% increase in output resulting from a 1% increase in capital)
Elasticity of output with respect to labor (% increase in output resulting from a 1% increase in labor)
Growth Accounting (contd.)
A 1% rise in employment raises GDP by 2/3%
A 1% rise in capital raises GDP by 1/3%
Decomposing GDP growth into growth of factors:
Real GDP Growth
(observable)
Employment Growth
(observable)
Capital Growth
(observable)
Productivity Growth
(unobservable)
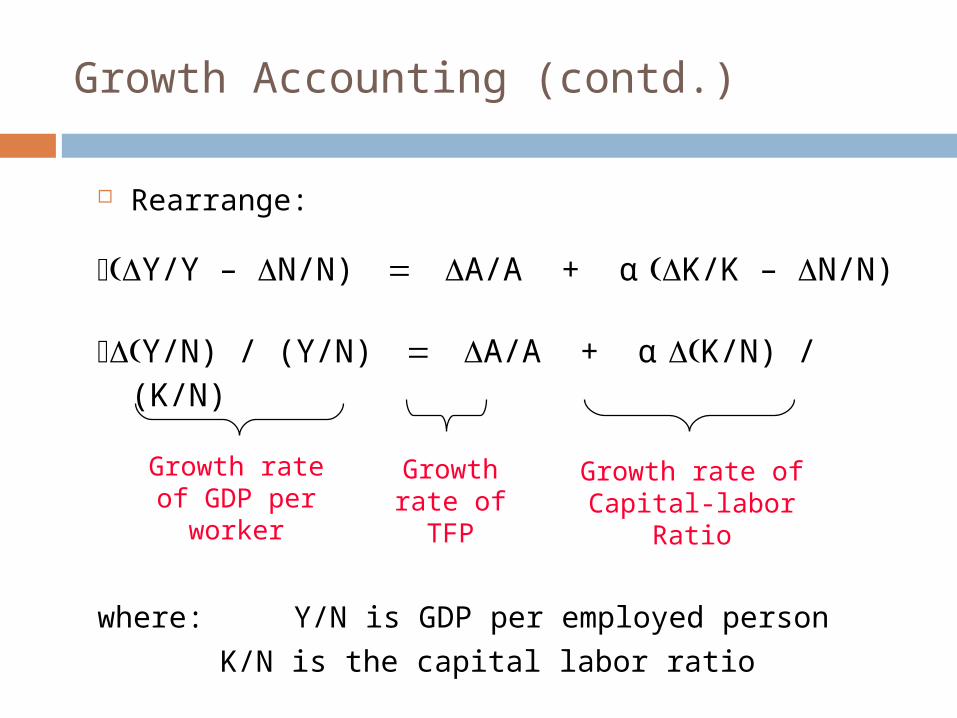
Rearrange:
Y/Y – N/N)A/A + α K/K – N/N)
Y/N) / (Y/N)A/A + α K/N) / (K/N)
where: Y/N is GDP per employed person
K/N is the capital labor ratio
Growth Accounting (contd.)
Growth rate of TFP
Growth rate of Capital-labor Ratio
Growth rate of GDP per worker
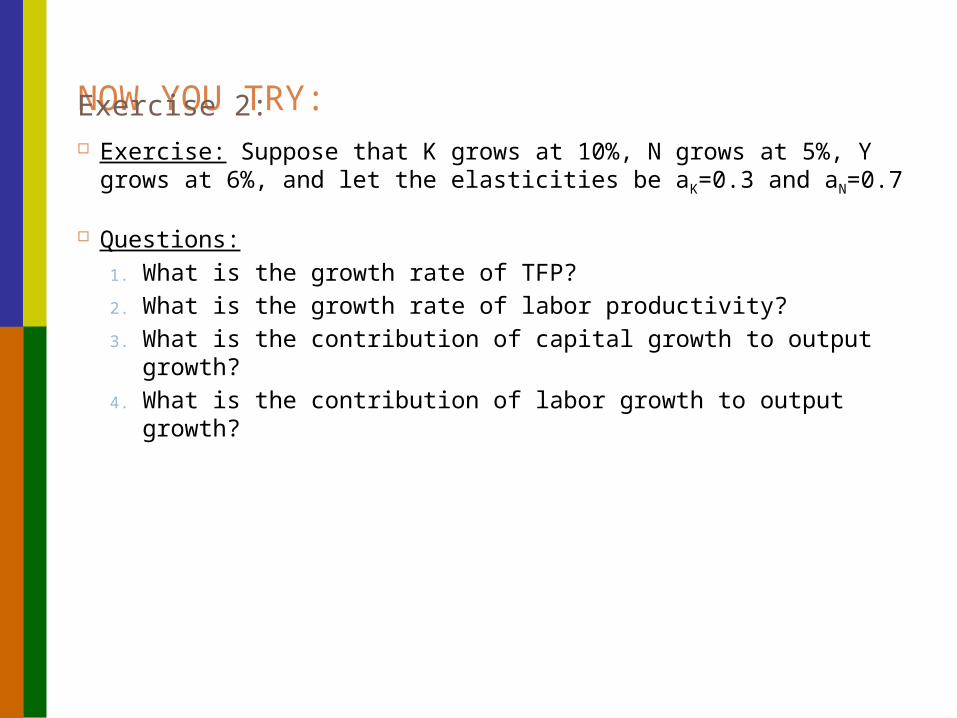
NOW YOU TRY: Exercise 2: Exercise: Suppose that K grows at 10%, N grows at 5%, Y
grows at 6%, and let the elasticities be aK=0.3 and aN=0.7
Questions:
1. What is the growth rate of TFP?
2. What is the growth rate of labor productivity?
3. What is the contribution of capital growth to output growth?
4. What is the contribution of labor growth to output growth?
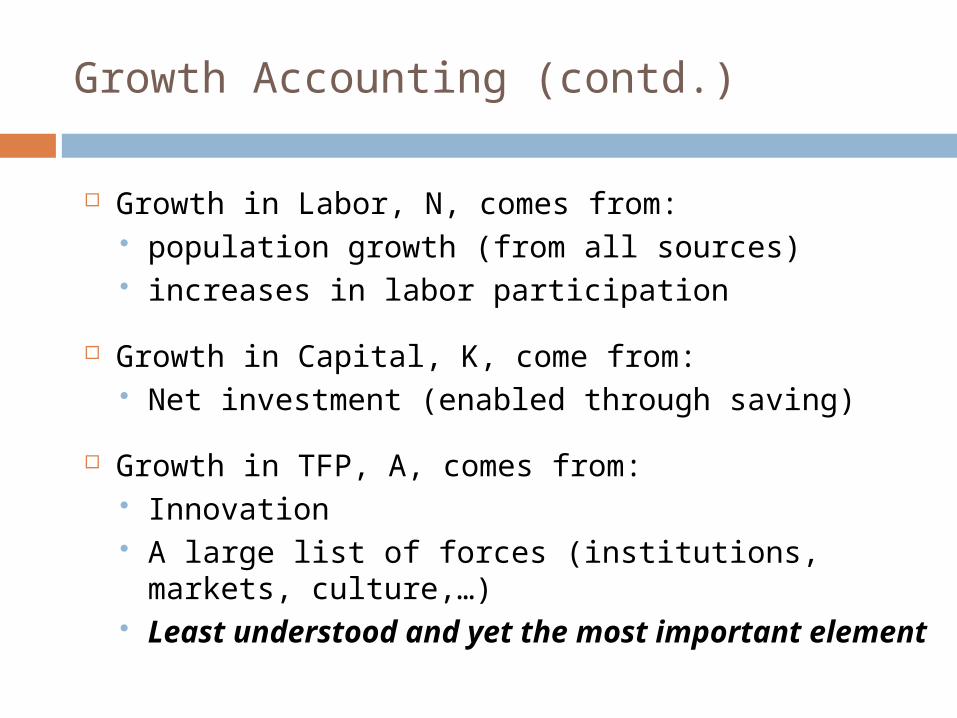
Growth in Labor, N, comes from: population growth (from all sources) increases in labor participation
Growth in Capital, K, come from: Net investment (enabled through saving)
Growth in TFP, A, comes from: Innovation A large list of forces (institutions, markets, culture,…) Least understood and yet the most important
element
Growth Accounting (contd.)
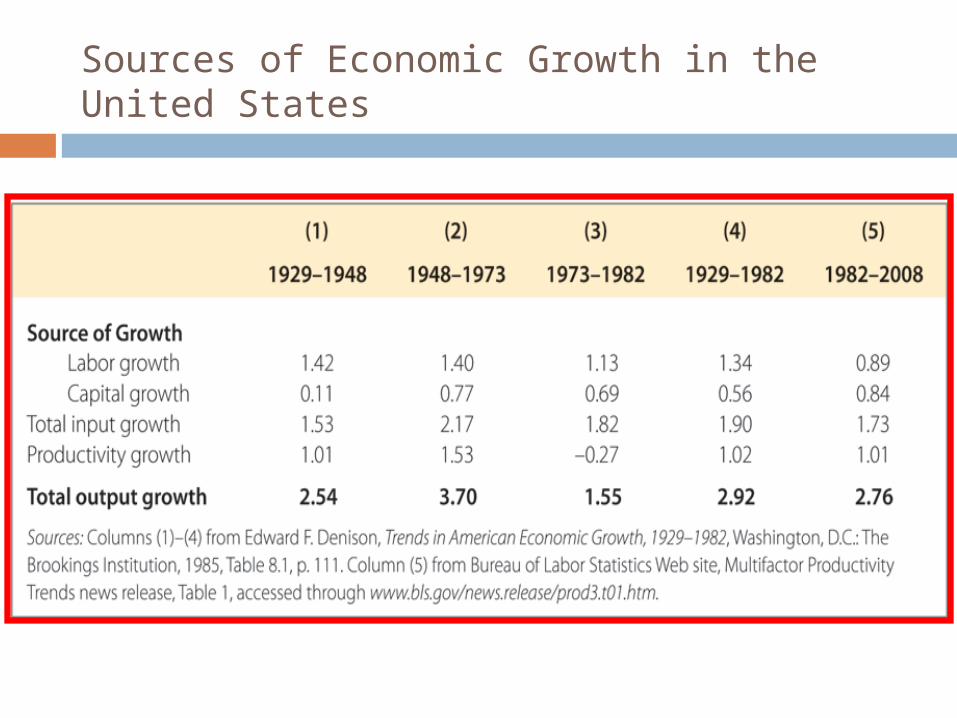
Sources of Economic Growth in the United States
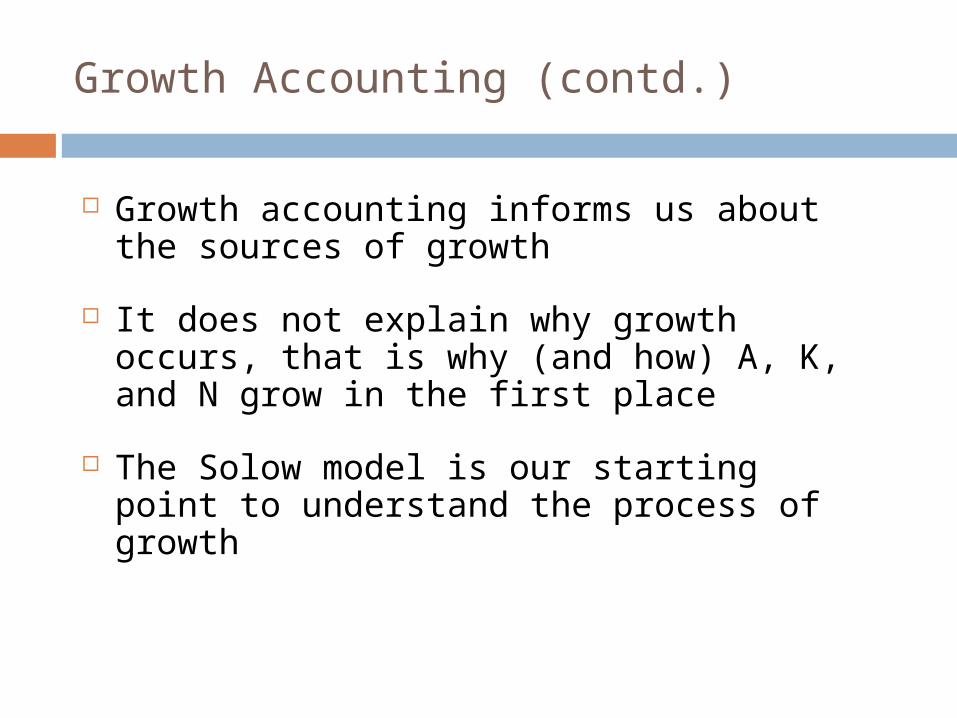
Growth accounting informs us about the sources of growth
It does not explain why growth occurs, that is why (and how) A, K, and N grow in the first place
The Solow model is our starting point to understand the process of growth
Growth Accounting (contd.)
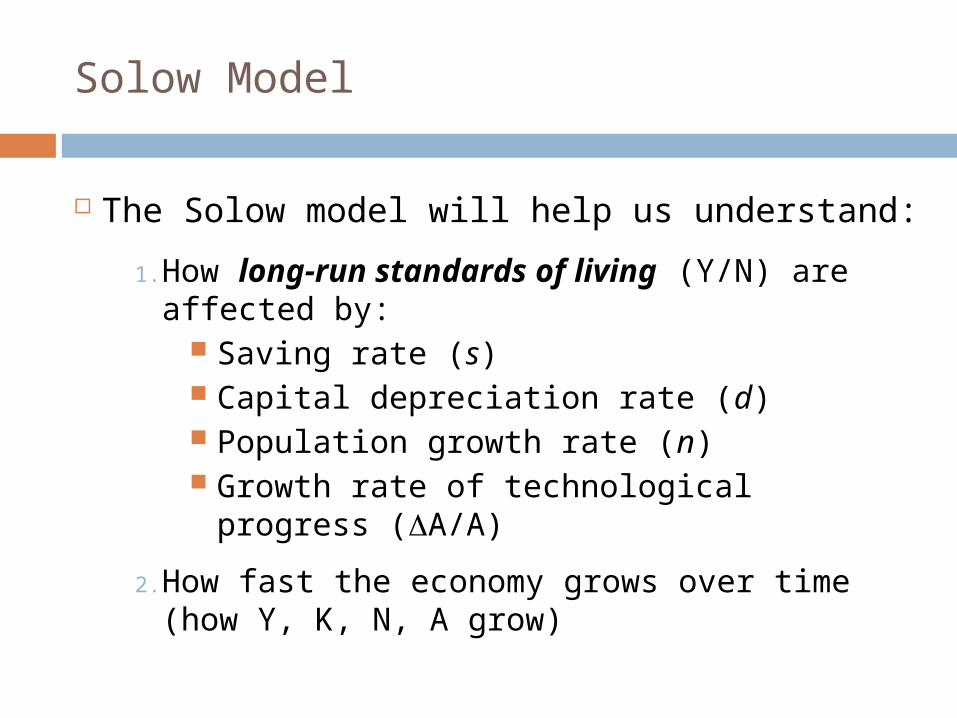
Solow Model
The Solow model will help us understand:
1. How long-run standards of living (Y/N) are affected by:
Saving rate (s) Capital depreciation rate (d) Population growth rate (n) Growth rate of technological progress (A/A)
2. How fast the economy grows over time (how Y, K, N, A grow)
Solow Model (contd.)
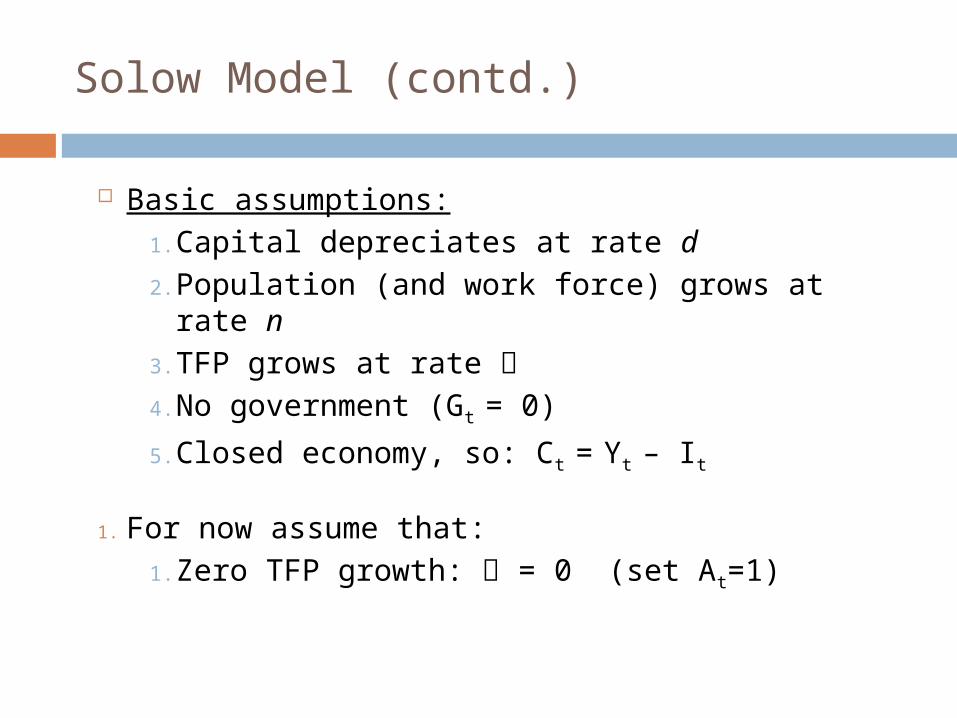
Basic assumptions:
1. Capital depreciates at rate d
2. Population (and work force) grows at rate n
3. TFP grows at rate
4. No government (Gt = 0)
5. Closed economy, so: Ct = Yt – It
1. For now assume that:
1. Zero TFP growth: = 0 (set At=1)
Solow Model (contd.)
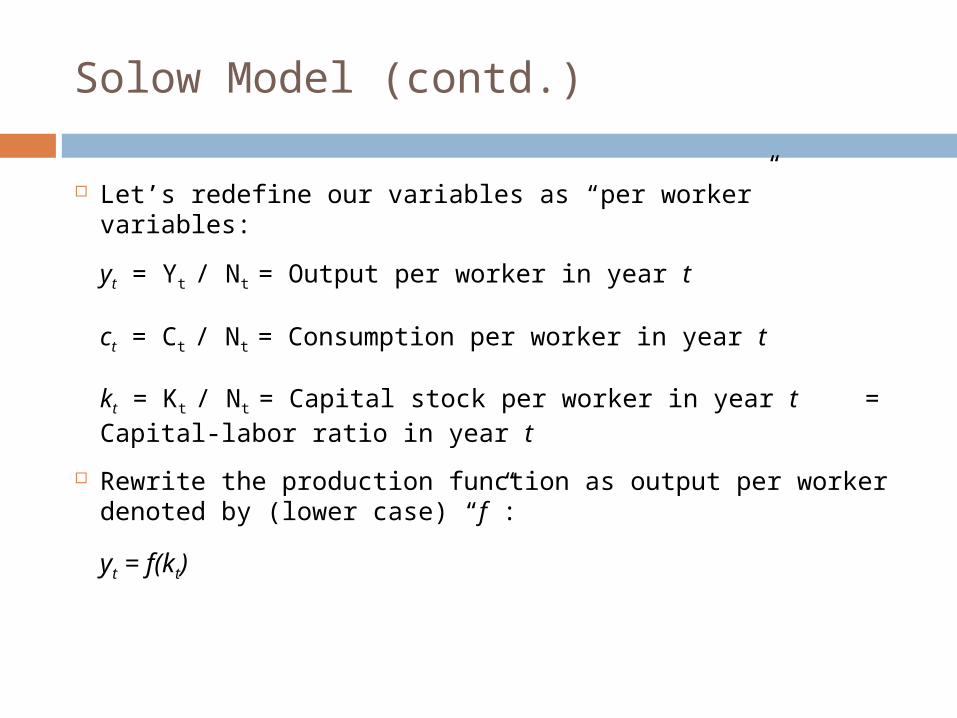
Let’s redefine our variables as “per worker” variables:
yt = Yt / Nt = Output per worker in year t
ct = Ct / Nt = Consumption per worker in year t
kt = Kt / Nt = Capital stock per worker in year t = Capital-labor ratio in year t
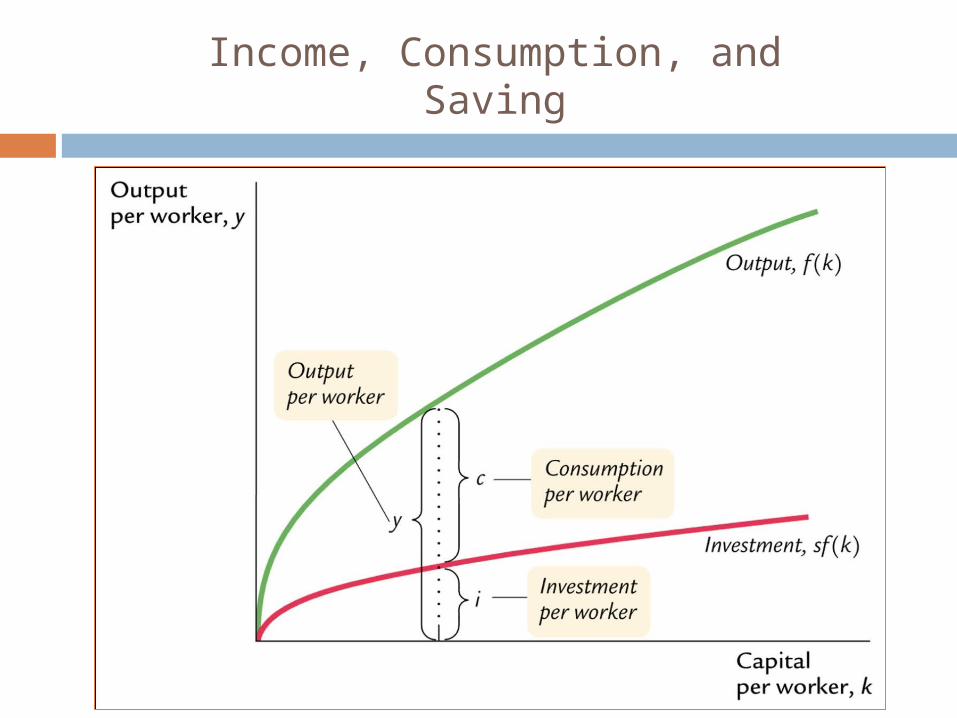
Rewrite the production function as output per worker denoted by (lower case) “f”:
yt = f(kt)
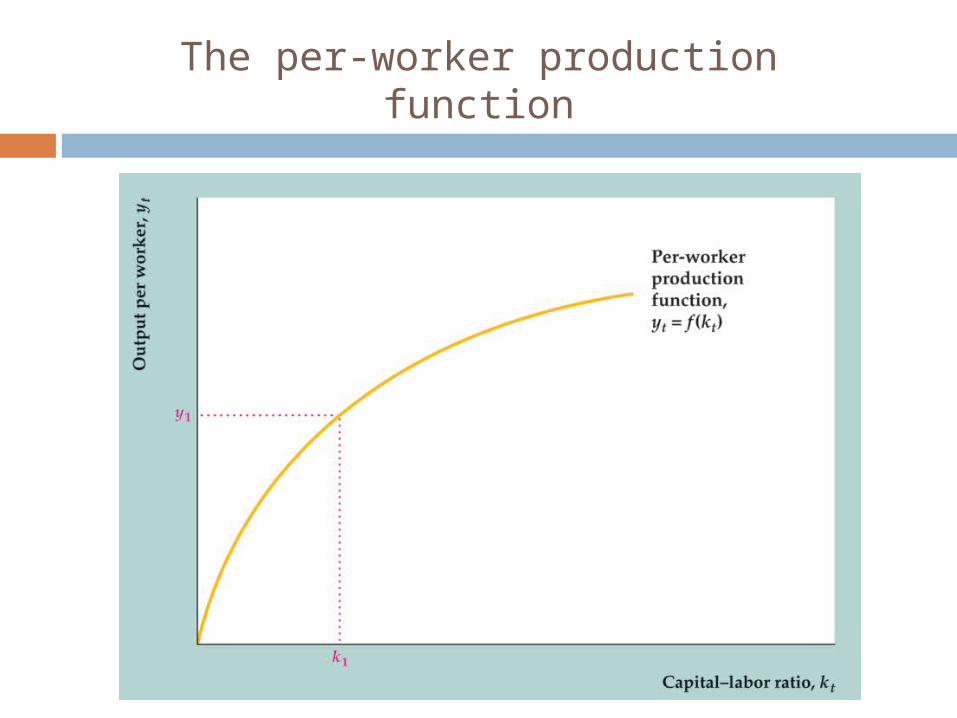
The per-worker production function
The long-run equilibrium is called the steady state equilibrium of the economy
All variables remain constant over time:
yt = y, kt = k, and ct = c
This requires that investment equal depreciation and population growth:
I = (d + n) K
Thus: C = Y – I = Y – (d + n) K (in steady state)
Solow Model (contd.)
Thus, in “per capita” terms (i.e. divide by N):
C/N = Y/N – (d + n) K/N (in steady state)
c = f(k) – (d + n) k (in steady state)
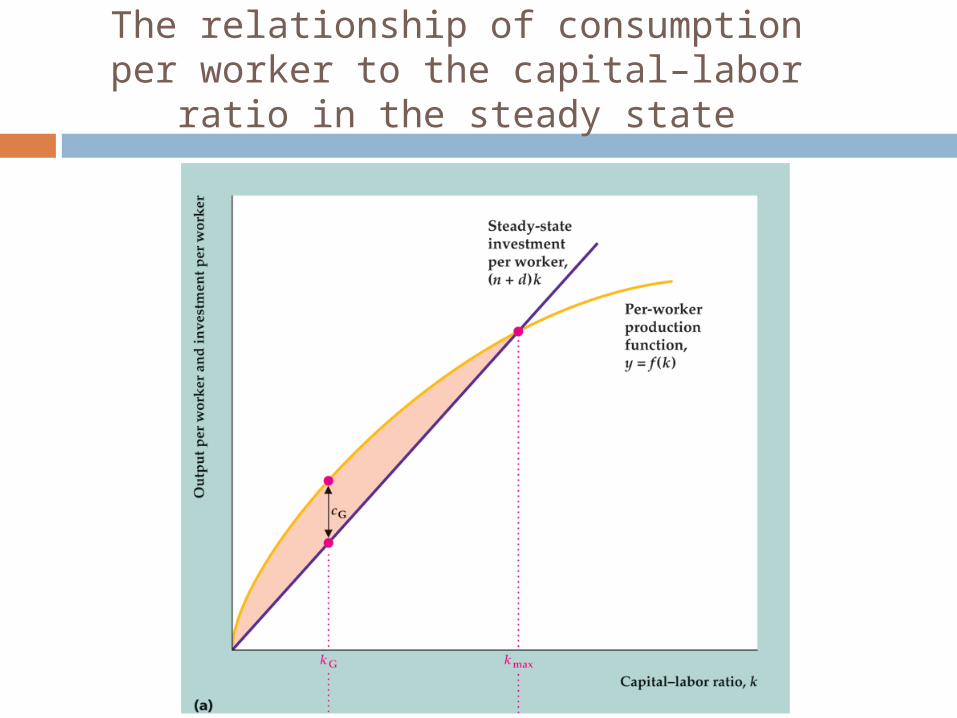
Steady State Equilibrium: kG is called the Golden Rule capital-labor ratio
At k = kG, long-term consumption is highest at cG
Notice that c rises as k rises when k< kG
Solow Model (contd.)
The relationship of consumption per worker to the capital–labor ratio in the steady state
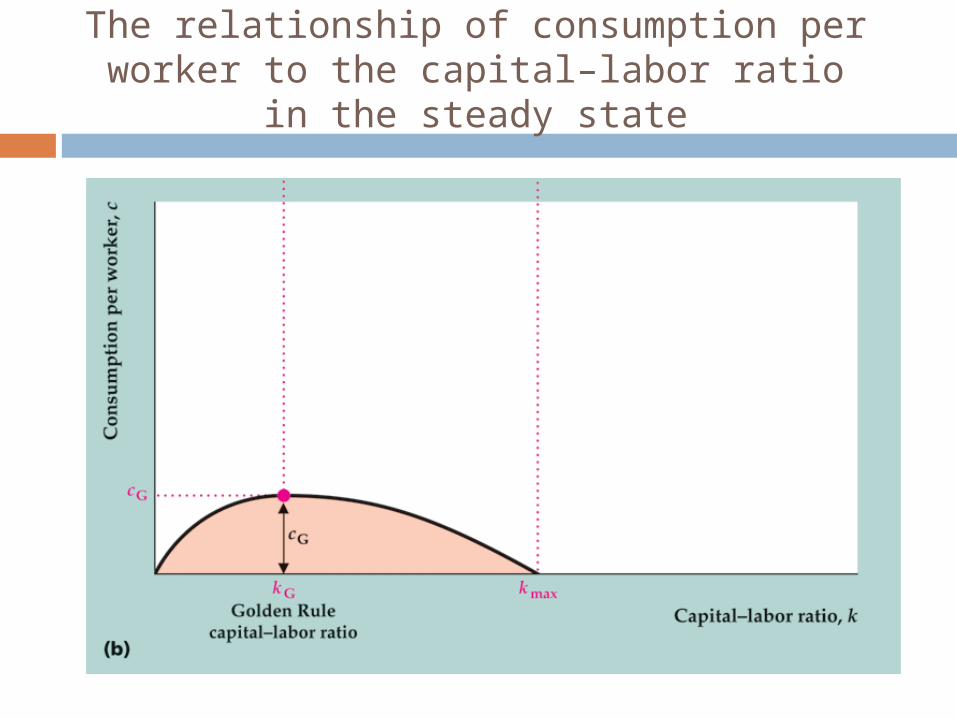
The relationship of consumption per worker to the capital–labor ratio in the steady state
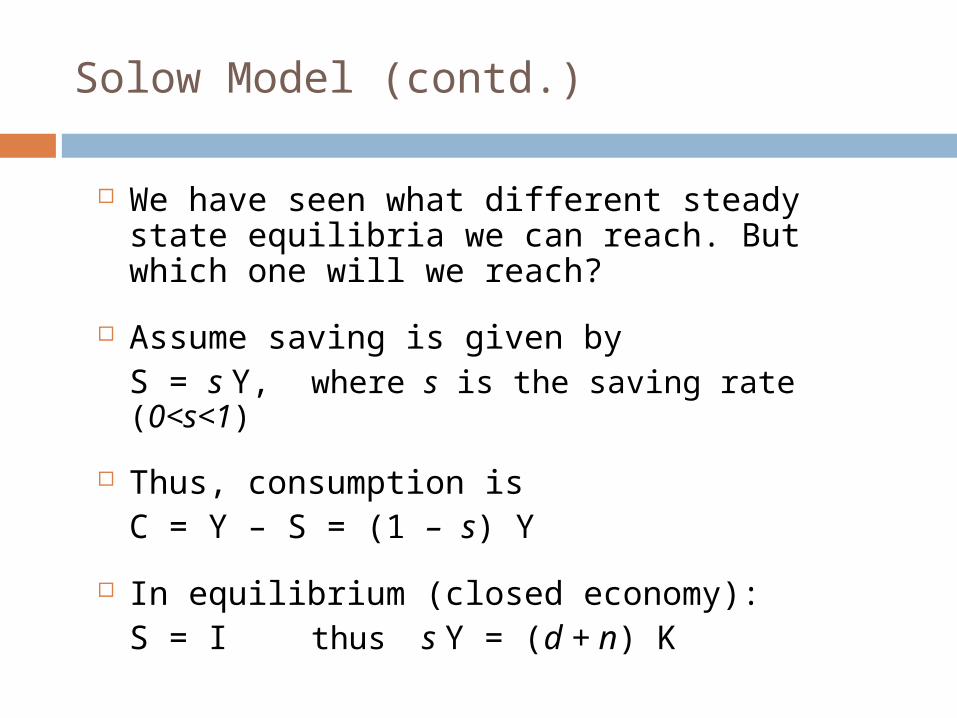
We have seen what different steady state equilibria we can reach. But which one will we reach?
Assume saving is given byS = s Y, where s is the saving rate (0<s<1)
Thus, consumption isC = Y – S = (1 – s) Y
In equilibrium (closed economy):S = I thus s Y = (d + n) K
Solow Model (contd.)
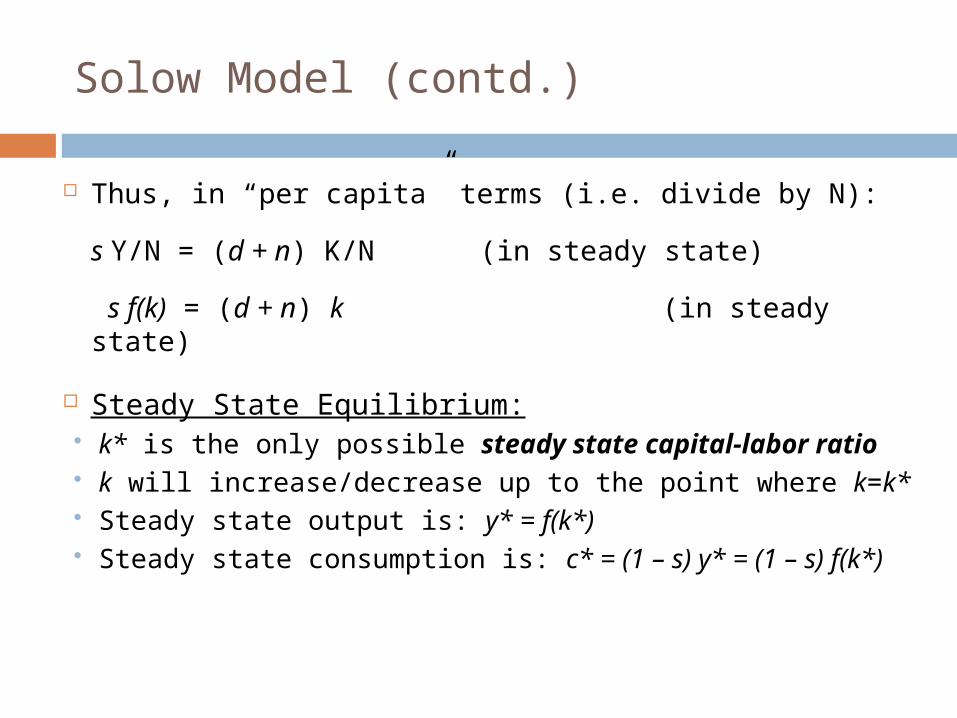
Thus, in “per capita” terms (i.e. divide by N):
s Y/N = (d + n) K/N (in steady state)
s f(k) = (d + n) k (in steady state)
Steady State Equilibrium: k* is the only possible steady state capital-labor ratio k will increase/decrease up to the point where k=k* Steady state output is: y* = f(k*) Steady state consumption is: c* = (1 – s) y* = (1 – s) f(k*)
Solow Model (contd.)
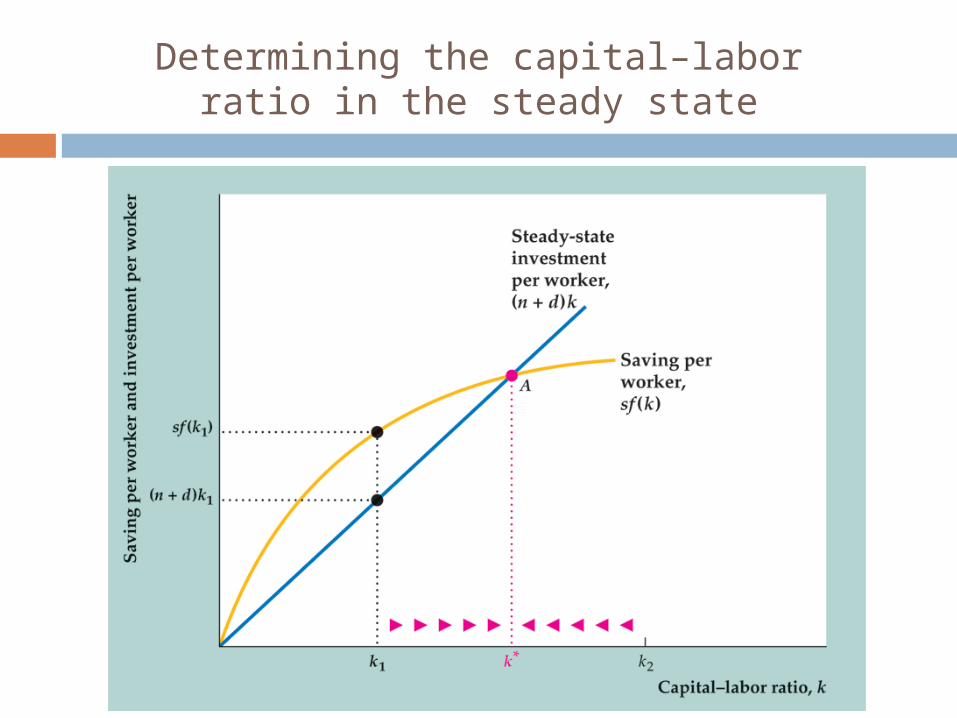
Determining the capital–labor ratio in the steady state
Income, Consumption, and Saving
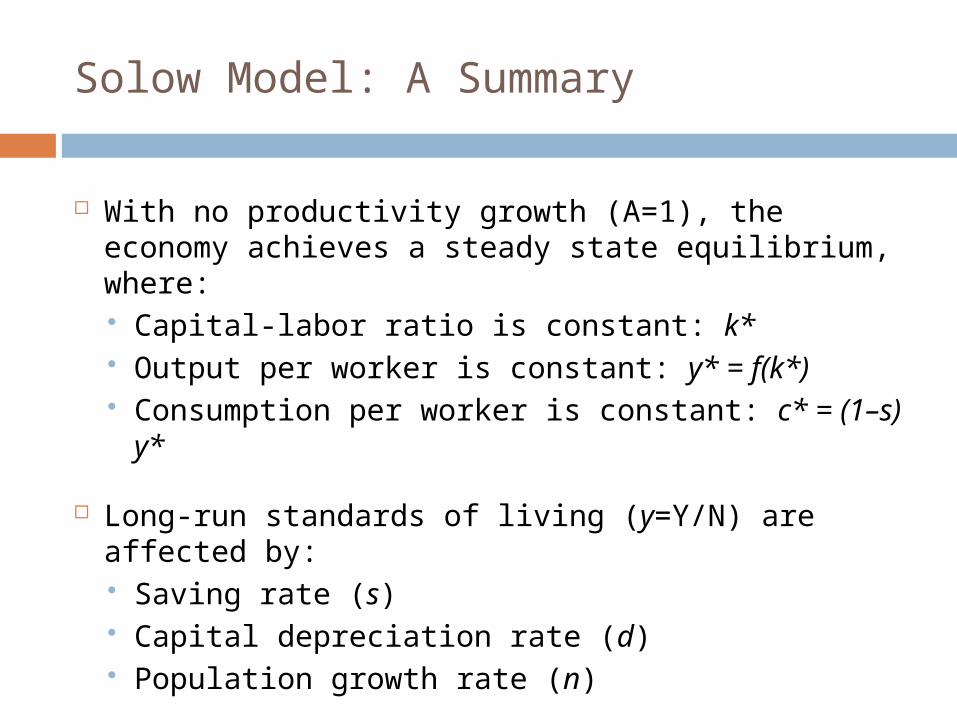
With no productivity growth (A=1), the economy achieves a steady state equilibrium, where: Capital-labor ratio is constant: k* Output per worker is constant: y* = f(k*) Consumption per worker is constant: c* = (1–s) y*
Long-run standards of living (y=Y/N) are affected by: Saving rate (s) Capital depreciation rate (d) Population growth rate (n)
Solow Model: A Summary
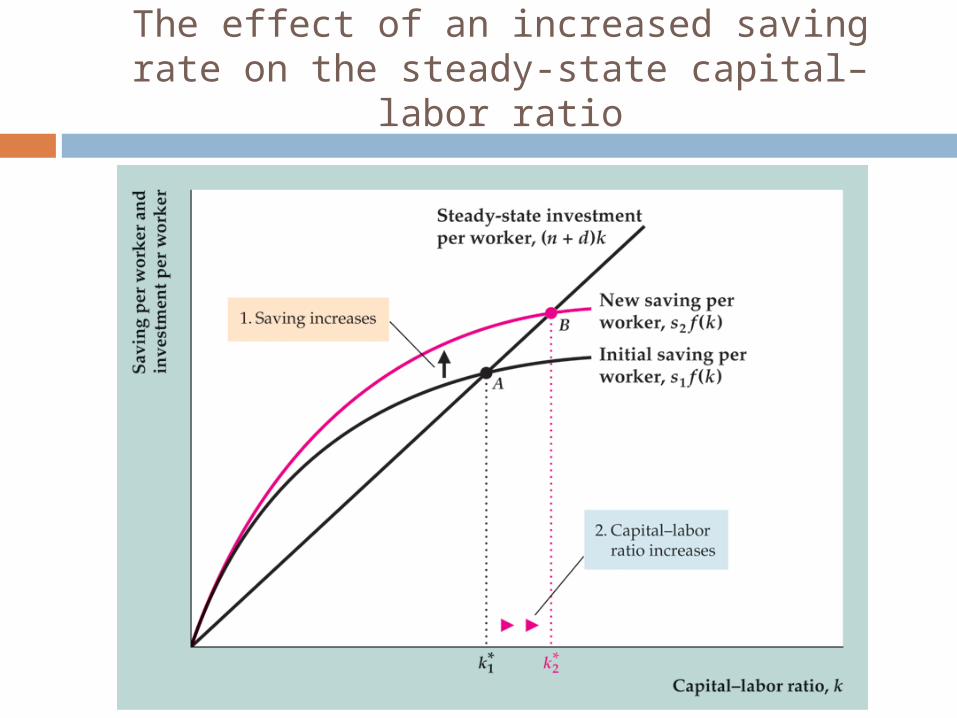
The effect of an increased saving rate on the steady-state capital–labor ratio
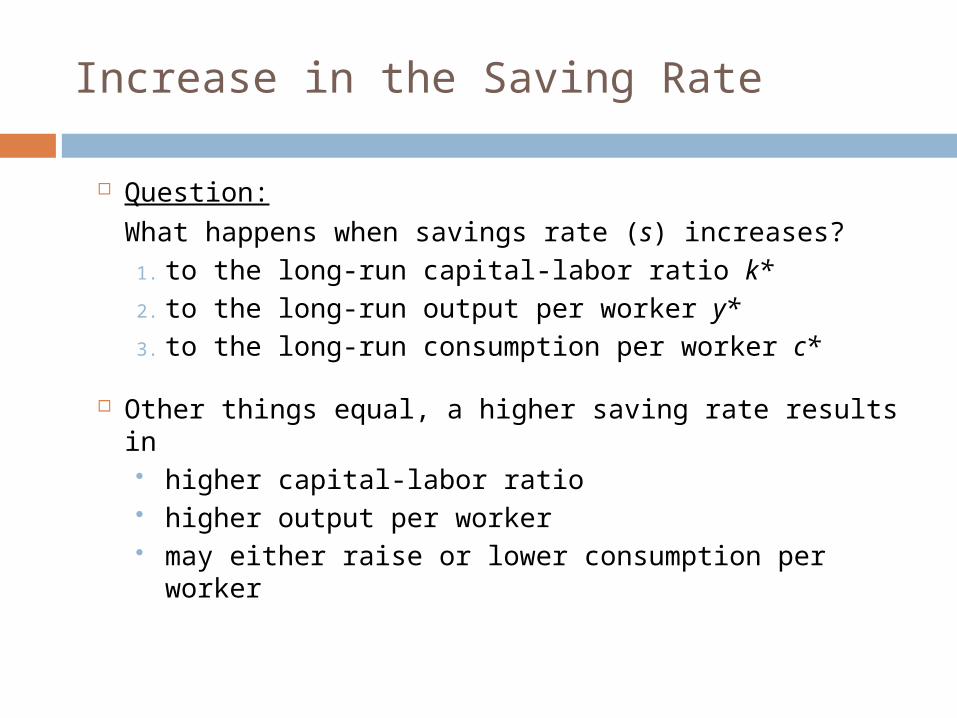
Question:
What happens when savings rate (s) increases?
1. to the long-run capital-labor ratio k*
2. to the long-run output per worker y*
3. to the long-run consumption per worker c*
Other things equal, a higher saving rate results in higher capital-labor ratio higher output per worker may either raise or lower consumption per worker
Increase in the Saving Rate
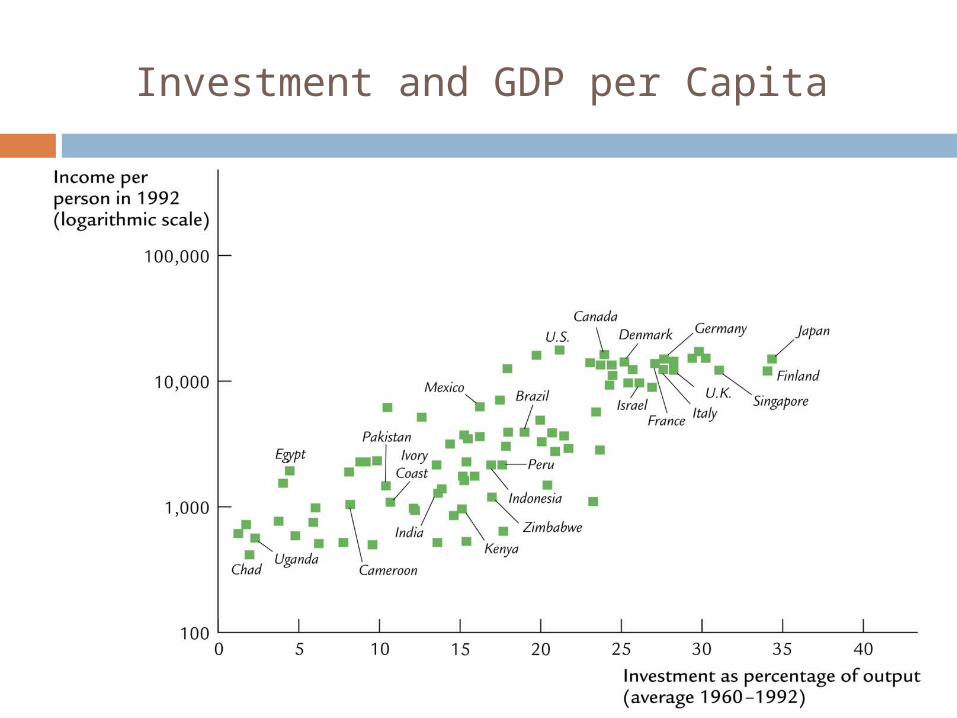
Investment and GDP per Capita
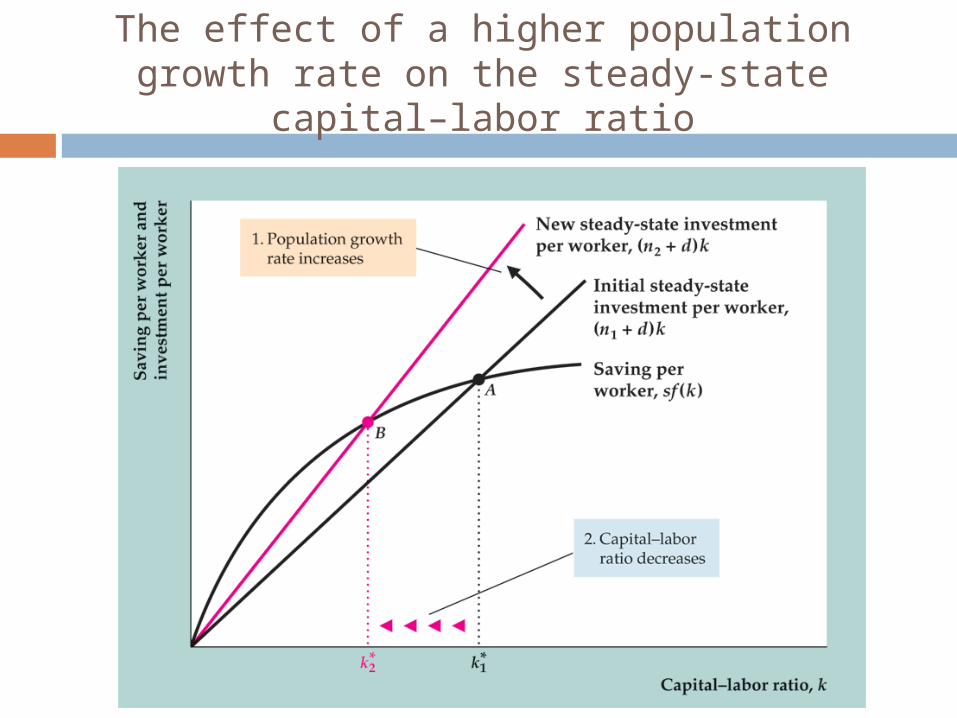
The effect of a higher population growth rate on the steady-state capital–labor ratio
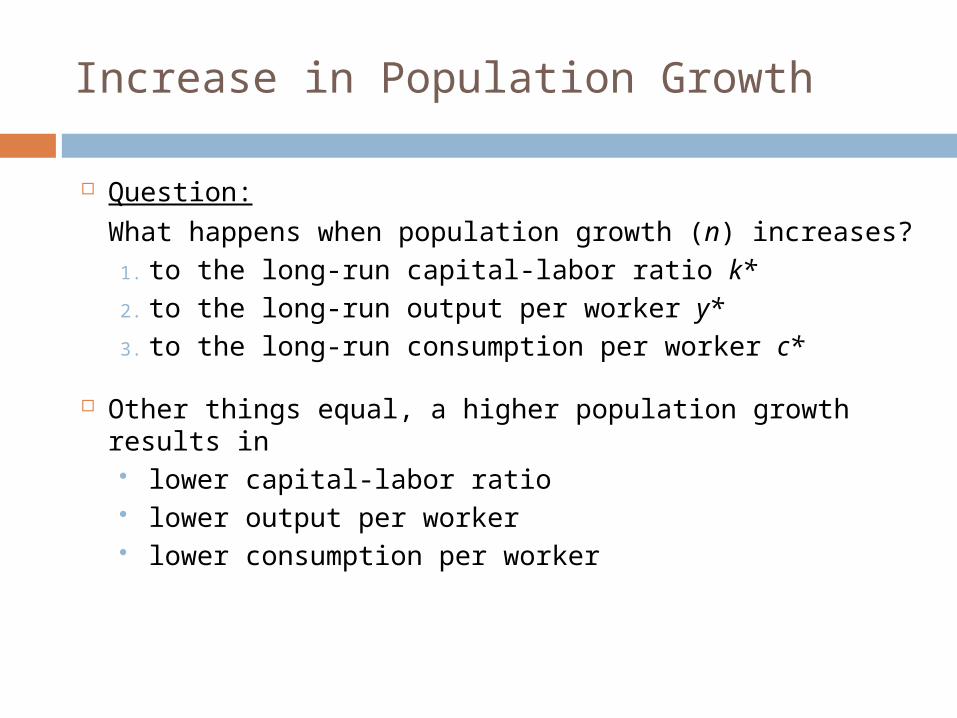
Question:
What happens when population growth (n) increases?
1. to the long-run capital-labor ratio k*
2. to the long-run output per worker y*
3. to the long-run consumption per worker c*
Other things equal, a higher population growth results in lower capital-labor ratio lower output per worker lower consumption per worker
Increase in Population Growth
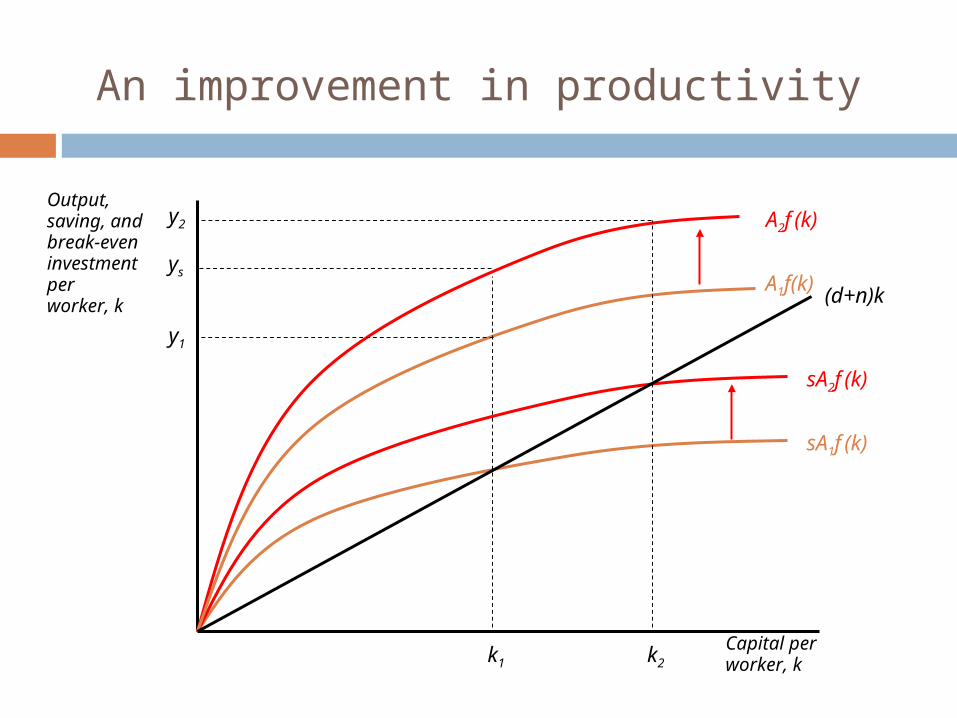
An improvement in productivity
(d+n)k
A2f (k)
sA2f (k)
A1f(k)
sA1f (k)
Capital per worker, k
Output, saving, and break-even investment per worker, k
k1 k2
y1
ys
y2
Question:What happens when there is an increase in the level of productivity (>0)?
1. to the long-run capital-labor ratio k*2. to the long-run output per worker y*3. to the long-run consumption per worker c*
Other things equal, a higher productivity results in higher capital-labor ratio higher output per worker higher consumption per worker
Improvement in Productivity
Question:
Can production per worker grow indefinitely?
1. Saving rate (s) cannot rise forever
2. Population growth (n) cannot fall forever
3. Technology (>0) can keep improving
The rate of productivity improvement is the dominant factor for economic growth
Improvement in Productivity
Using the Solow Model
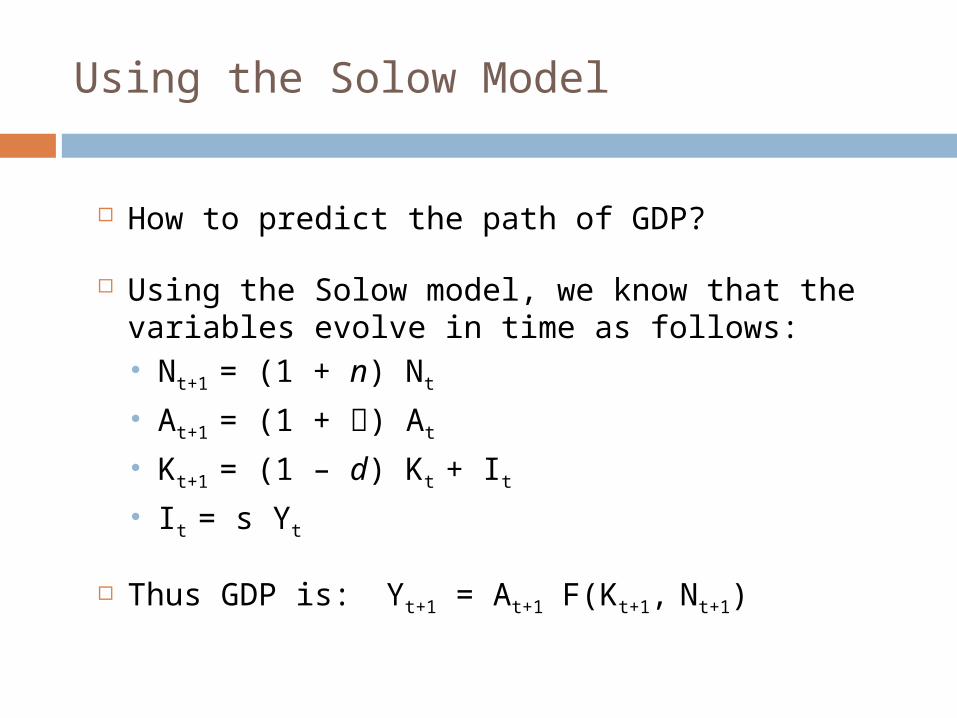
How to predict the path of GDP?
Using the Solow model, we know that the variables evolve in time as follows: Nt+1 = (1 + n) Nt
At+1 = (1 + ) At
Kt+1 = (1 – d) Kt + It
It = s Yt
Thus GDP is: Yt+1 = At+1 F(Kt+1, Nt+1)
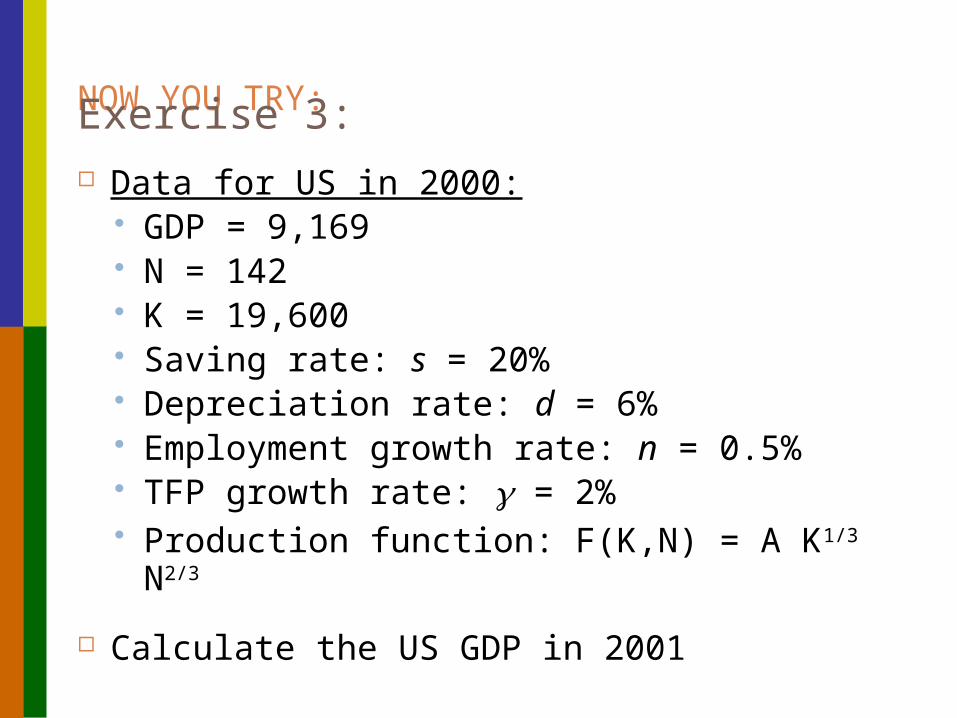
NOW YOU TRY: Exercise 3: Data for US in 2000:
GDP = 9,169 N = 142 K = 19,600 Saving rate: s = 20% Depreciation rate: d = 6% Employment growth rate: n = 0.5% TFP growth rate: = 2% Production function: F(K,N) = A K1/3
N2/3
Calculate the US GDP in 2001

Policies that may affect TFP: Policies toward innovation
Patents (i.e. good legal system) R&D incentives (i.e. aid to research)
Improving infrastructure (i.e. roads, airports, utilities, etc.)
Building human capital (i.e. education, worker training, etc.)
Good institutions (Rule of law, financial markets) Openness (i.e. facilitate international trade)
Policies to Promote Growth
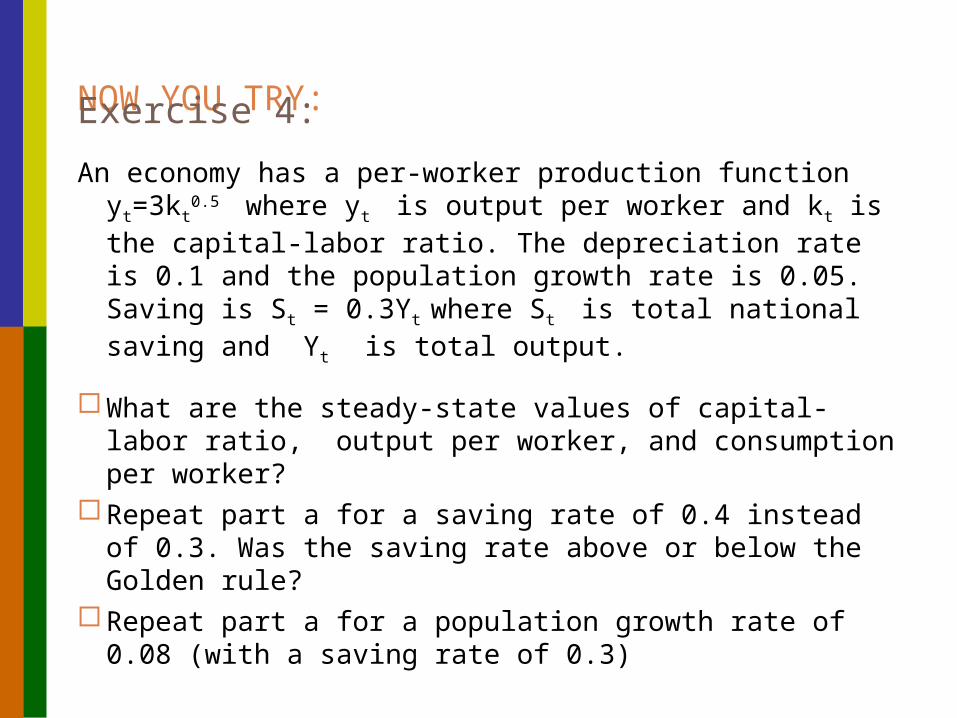
NOW YOU TRY: Exercise 4:
An economy has a per-worker production function yt=3kt0.5
where yt is output per worker and kt is the capital-labor ratio. The depreciation rate is 0.1 and the population growth rate is 0.05. Saving is St = 0.3Yt where St is total national saving and Yt is total output.
What are the steady-state values of capital-labor ratio, output per worker, and consumption per worker?
Repeat part a for a saving rate of 0.4 instead of 0.3. Was the saving rate above or below the Golden rule?
Repeat part a for a population growth rate of 0.08 (with a saving rate of 0.3)
Video
TED talk about economic growth
Short version:
http://www.youtube.com/watch?v=jbkSRLYSojo