Embed Size (px)
Citation preview
117
CHAPTER 6
GROWTH AND CHARACTERIZATION OF
g AND γ- GLYCINE SINGLE CRYSTALS
6.1 INTRODUCTION
In the field of nonlinear optical crystal growth, amino acids are
playing a vital role. Many numbers of natural amino acids are individually
exhibiting the nonlinear optical properties because they have a donor NH2 and
acceptor COOH and also intermolecular charge transfer is possible
(Davydov et al 1970). Especially natural amino acids of aspartic, glutamic,
arginine, lysine, L-alanine (Razzetti et al 2002) and γ-glycine are evidently
showing NLO activity because of an additional COOH group in the first and
NH2 group in the second. Also, some of the amino acids are used as dopants
and they enhance the material properties like ferroelectric properties (Meera
et al 2004, Mohan Kumar et al 2001). A series of semi-organic compounds
such as L-histidine tetrafluroborate, L-arginine diphosphate crystals have
been reported (Aggarwal et al 1999, Reena Ittyachan and Sagayaraj 2002)
with moderately high mechanical and chemical stability.
Complexes of amino acids with inorganic salts have been of
interest as materials for second harmonic generation (SHG). All amino acids
except glycine contain chiral carbon atoms and perhaps crystallize in the
non-centrosymmetric space group (Narayan Bhat and Dharmaprakash 2002).
Dipolar molecules possessing an electron donor group and an electron
acceptor group contribute to large second order optical nonlinearity arising
118
from the intramolecular charge transfer between two groups of opposite
nature. Although the salts of amino acids like L-Arginine (Eimerl et al 1989),
L-Histidine (Aggarwal et al 1999) and L-Proline (Hudson et al 2002) are
reported to have novel properties, the complexes of glycine with inorganic
salts are not explored very much for optical SHG so far, since glycine, the
simplest amino acid, does not possess the asymmetric carbon, it is NLO
inactive. Glycine has three polymorphic crystalline forms α, く and γ
(Albrecht and Corey 1939). Both α and β forms crystallize in
centrosymmetric space groups ruling out the possibility of optical second
harmonic generation. But γ-glycine crystallizes in non-centrosymmetric space
group P31 making it a possible candidate for NLO applications and it is found
difficult to grow the γ-glycine crystals (Iitaka 1961).
The thermodynamic stabilities of the three polymorphs of glycine
at room temperature are in the order γ > α > く (Isabelle et al 2005). It has
been recently reported that complexes of the γ- glycine can be efficient in
optical SHG with inorganic salt sodium nitrate (Narayan Bhat and
Dharmaprakash 2002). Ferroelectricity was discovered in glycine silver
nitrate (Pepinsky et al 1957). It was also reported that glycine combines with
LiNO3 (Baran et al 2003) to form single crystals but none of these are
reported to have nonlinear optical property. In this chapter the growth aspects
of g- and け-glycine single crystals from aqueous solutions in the presence of
potassium nitrate as additive in equimolar ratio are presented.
6.2 GROWTH OF g- AND γ-GLYCINE SINGLE CRYSTALS
6.2.1 Growth of g-glycine
In the g-polymorph zwitter-ions are linked via hydrogen bonds
NH…O in double antiparallel layers, the interactions between these double
119
layers being purely van der Waals. In the け-polymorph zwitter-ions form
polar helixes linked with each other via extra NH…O hydrogen bonds to give
a three-dimensional polar network.
In solution growth technique, selection of a solvent (water, ethanol,
methanol, mixed solvents, etc.,), in which solute is moderately soluble, plays
a major role. The solubility test was carried out using deionised water. The
commercially available Glycine (GLY) was used for solubility study, after
repeated recrystallization process. The solubility experiment was carried out
in Constant temperature bath (CTB) (accuracy ±0.01°C) for the temperatures
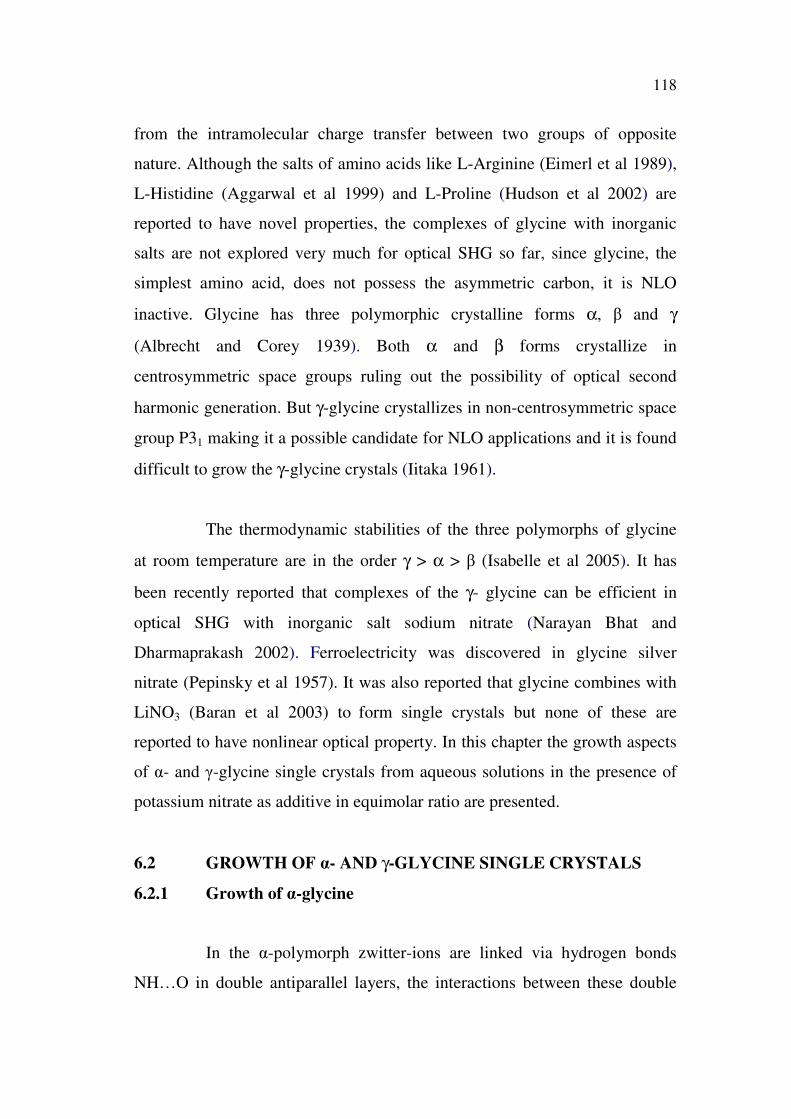
of 30°C, 35°C, 40°C, 45°C, 50°C and 55°C. The temperature dependence of
solubility of glycine is shown in Figure 6.1. The growth experiments were
performed using deionised water and mixed solvents with the help of
solubility curve, by slow evaporation technique.
The saturated solution was prepared using commercially available
glycine (CH2 NH2 COOH). g- glycine was dissolved in a 100 ml beaker using
deionised water as the solvent. The solution was stirred well for about six
hours at room temperature and the saturated solution was filtered with
Whatman (Grade No. 1) filter paper in clean vessel. The solubility of
g- glycine was estimated at different temperatures as shown in Figure 6.1.
The vessels containing the solutions were covered with perforated polythene
sheets and housed in the constant temperature bath at 33°C. The solution was
allowed for slow evaporation and nucleation was observed in 5 days and it
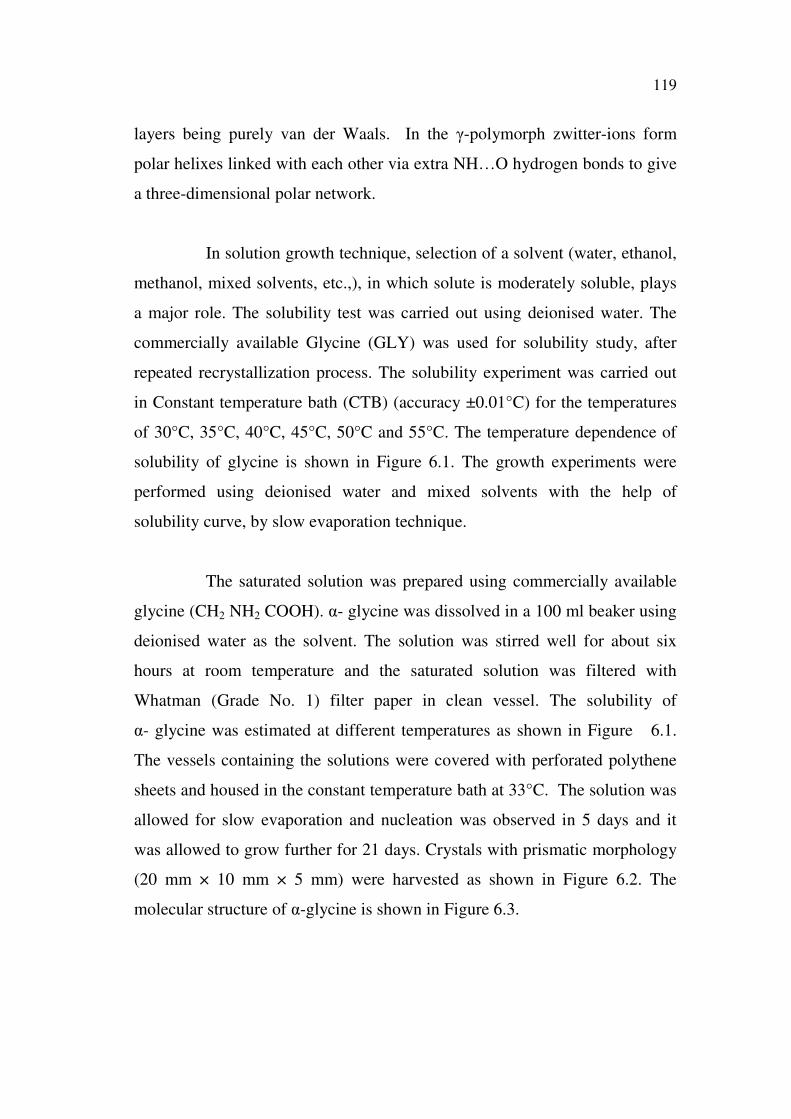
was allowed to grow further for 21 days. Crystals with prismatic morphology
(20 mm × 10 mm × 5 mm) were harvested as shown in Figure 6.2. The
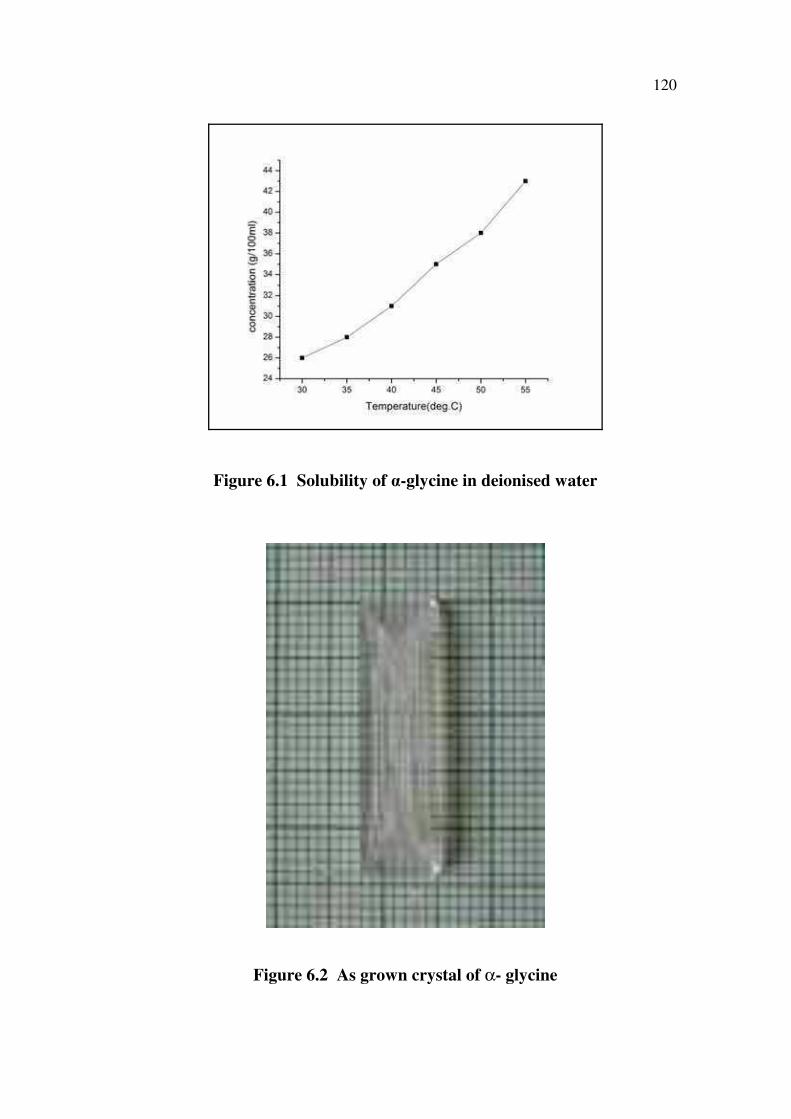
molecular structure of g-glycine is shown in Figure 6.3.
120
Figure 6.1 Solubility of g-glycine in deionised water
Figure 6.2 As grown crystal of α- glycine
121
Figure 6.3 Molecular Structure of g-glycine
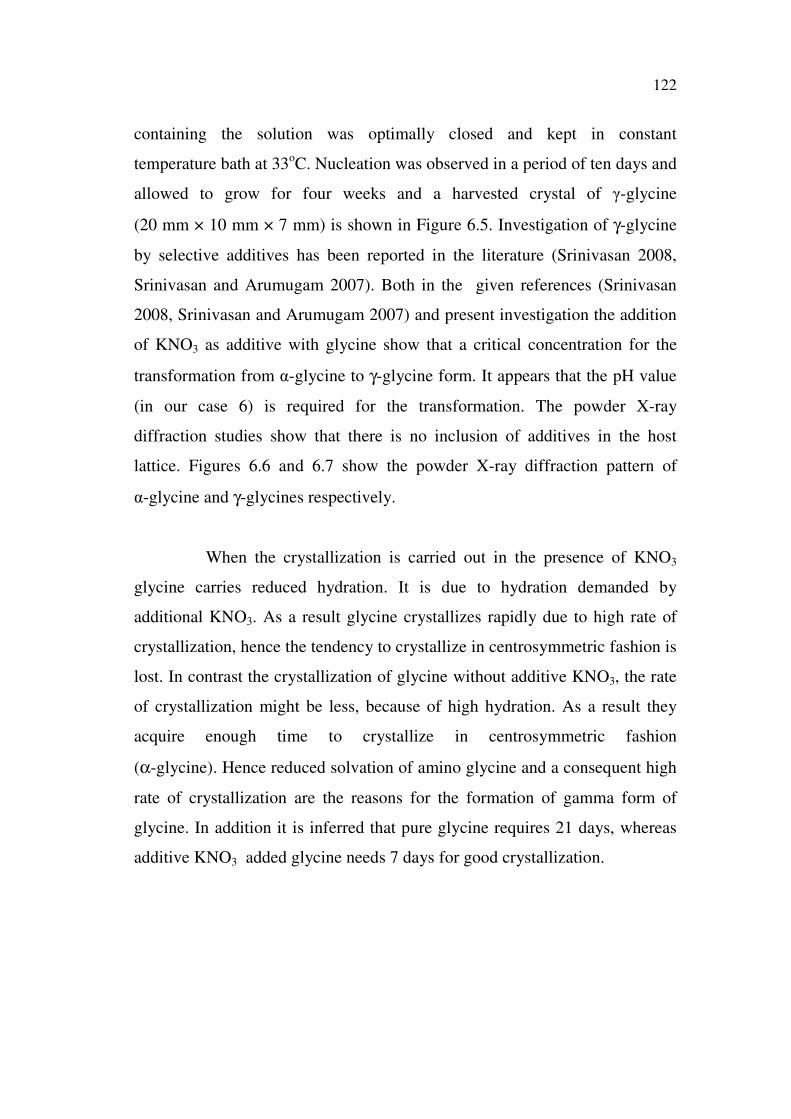
6.2.2 Synthesis and Growth of け-glycine
The saturated solution was prepared using commercially available
analytical grade glycine (CH2NH2COOH) (SRL-extra pure), KNO3
(Merck-extra pure) and deionised water. Prior to solution preparation for
crystal growth the solubility of γ-glycine in deionised water at different
temperature was estimated by the gravimetric method (Figure 6.4). It is
observed that the title compound exhibits good solubility and a positive
solubility temperature gradient in deionised water as solvent.
The γ-form of glycine single crystals were grown from glycine and
KNO3 as additive using deionised water as the solvent. Bulk size crystals
were grown by the slow evaporation solution growth method. The equimolar
ratio (1:1) of g-glycine and KNO3 were dissolved in separate beakers using
deionized water and the solutions were continuously stirred well for six hours.
The prepared solutions were mixed together and filtered using Whatman
(grade No. 1) filter paper in 100 ml degreased clean beaker. The beaker
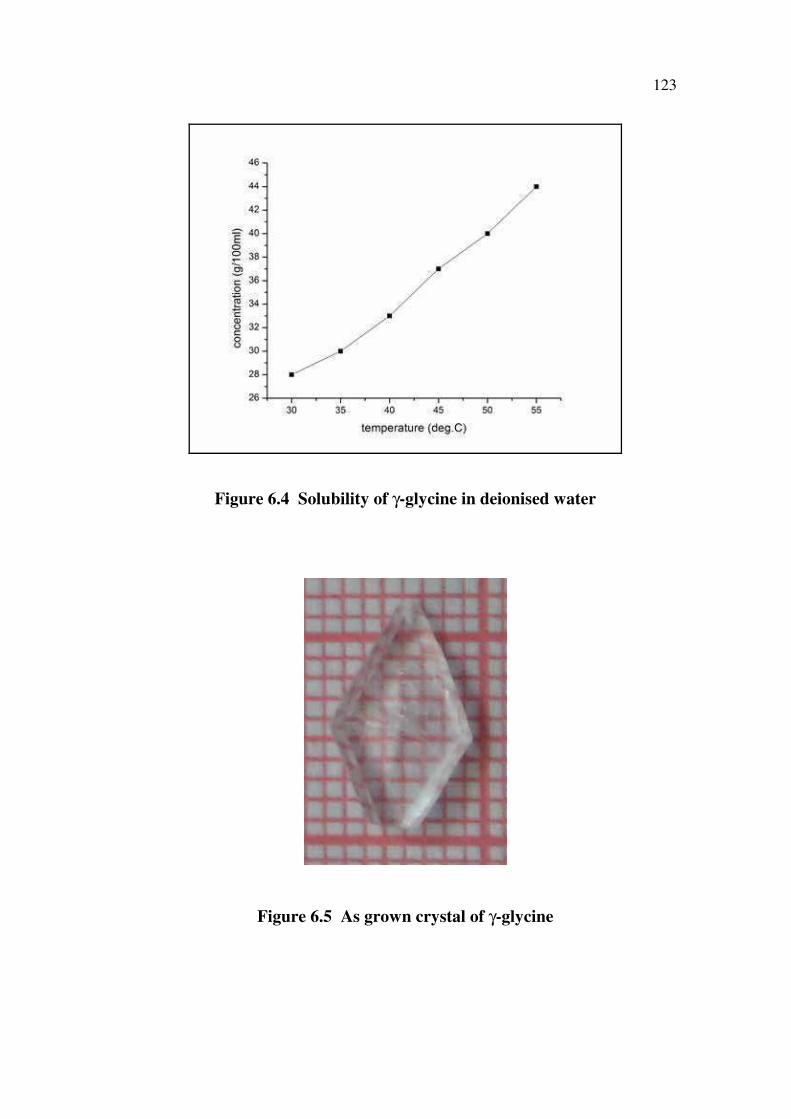
122
containing the solution was optimally closed and kept in constant
temperature bath at 33oC. Nucleation was observed in a period of ten days and
allowed to grow for four weeks and a harvested crystal of け-glycine
(20 mm × 10 mm × 7 mm) is shown in Figure 6.5. Investigation of γ-glycine
by selective additives has been reported in the literature (Srinivasan 2008,
Srinivasan and Arumugam 2007). Both in the given references (Srinivasan
2008, Srinivasan and Arumugam 2007) and present investigation the addition
of KNO3 as additive with glycine show that a critical concentration for the
transformation from g-glycine to γ-glycine form. It appears that the pH value
(in our case 6) is required for the transformation. The powder X-ray
diffraction studies show that there is no inclusion of additives in the host
lattice. Figures 6.6 and 6.7 show the powder X-ray diffraction pattern of
g-glycine and γ-glycines respectively.
When the crystallization is carried out in the presence of KNO3
glycine carries reduced hydration. It is due to hydration demanded by
additional KNO3. As a result glycine crystallizes rapidly due to high rate of
crystallization, hence the tendency to crystallize in centrosymmetric fashion is
lost. In contrast the crystallization of glycine without additive KNO3, the rate
of crystallization might be less, because of high hydration. As a result they
acquire enough time to crystallize in centrosymmetric fashion
(α-glycine). Hence reduced solvation of amino glycine and a consequent high
rate of crystallization are the reasons for the formation of gamma form of
glycine. In addition it is inferred that pure glycine requires 21 days, whereas
additive KNO3 added glycine needs 7 days for good crystallization.
123
Figure 6.4 Solubility of γ-glycine in deionised water
Figure 6.5 As grown crystal of γ-glycine
124
6.3 CHARACTERIZATION OF g-AND け-GLYCINE CRYSTALS
The grown single crystals of g- and け-glycine were confirmed by
single crystal and powder X-ray diffraction analyses. The FT-IR spectrum
was recorded by JESCO 416 PLUS FT-IR Spectrometer (KBr pellet
technique) in the range of 4000 cm-1 to 400 cm-1. The UV-Visible spectra of
g- and け-glycine crystals were recorded between 200 nm and 800 nm using a
(PERKIN ELMER LAMDA 35) UV-Vis- NIR spectrophotometer. The
thermogravimetric analysis (TGA) was carried out between 50°C and 600°C
in the nitrogen atmosphere at a heating rate of 100C/min using a STA
409 C/CD TGA unit. The dielectric behavior was studied with an LCR meter
(HIOKI 3635 model) as a function of frequency at different temperatures. The
characterization results of g- and け-glycine are presented in the following
sections.
6.3.1 X-ray Diffraction Studies
The grown crystals of g- and け-glycine were confirmed by both
single crystal and powder X-ray diffraction analyses.
6.3.1.1 Single crystal X-ray Diffraction
The single crystal XRD data of the grown α- and γ-glycine were
obtained by single crystal X-ray diffractometer (Model: ENRAF NONIUS
CAD4/MACH3) using MoKα (0.71073Å) radiation at room temperature by
the least square refinement of the setting angles of 25 reflections. From the
single crystal XRD analysis it is confirmed that the grown α-glycine
crystallizes in the monoclinic crystal system with space group P21 /n and
γ-glycine crystallizes in hexagonal crystal system with space group P31. The
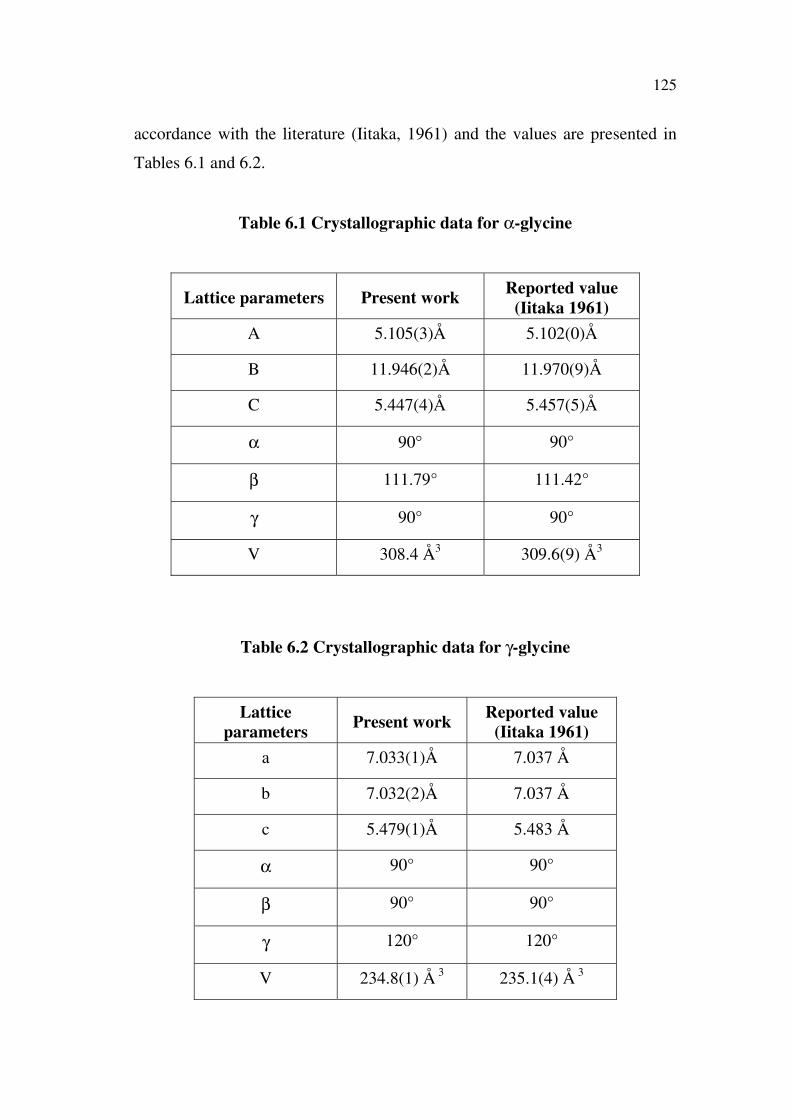
determined lattice parameter values of α- and γ-glycine crystals are in
125
accordance with the literature (Iitaka, 1961) and the values are presented in
Tables 6.1 and 6.2.
Table 6.1 Crystallographic data for α-glycine
Lattice parameters Present workReported value
(Iitaka 1961)
A 5.105(3)Å 5.102(0)Å
B 11.946(2)Å 11.970(9)Å
C 5.447(4)Å 5.457(5)Å
α 90° 90°
β 111.79° 111.42°
γ 90° 90°
V 308.4 Å3 309.6(9) Å3
Table 6.2 Crystallographic data for γ-glycine
Lattice
parametersPresent work
Reported value
(Iitaka 1961)
a 7.033(1)Å 7.037 Å
b 7.032(2)Å 7.037 Å
c 5.479(1)Å 5.483 Å
α 90° 90°
β 90° 90°
γ 120° 120°
V 234.8(1) Å 3 235.1(4) Å 3
126
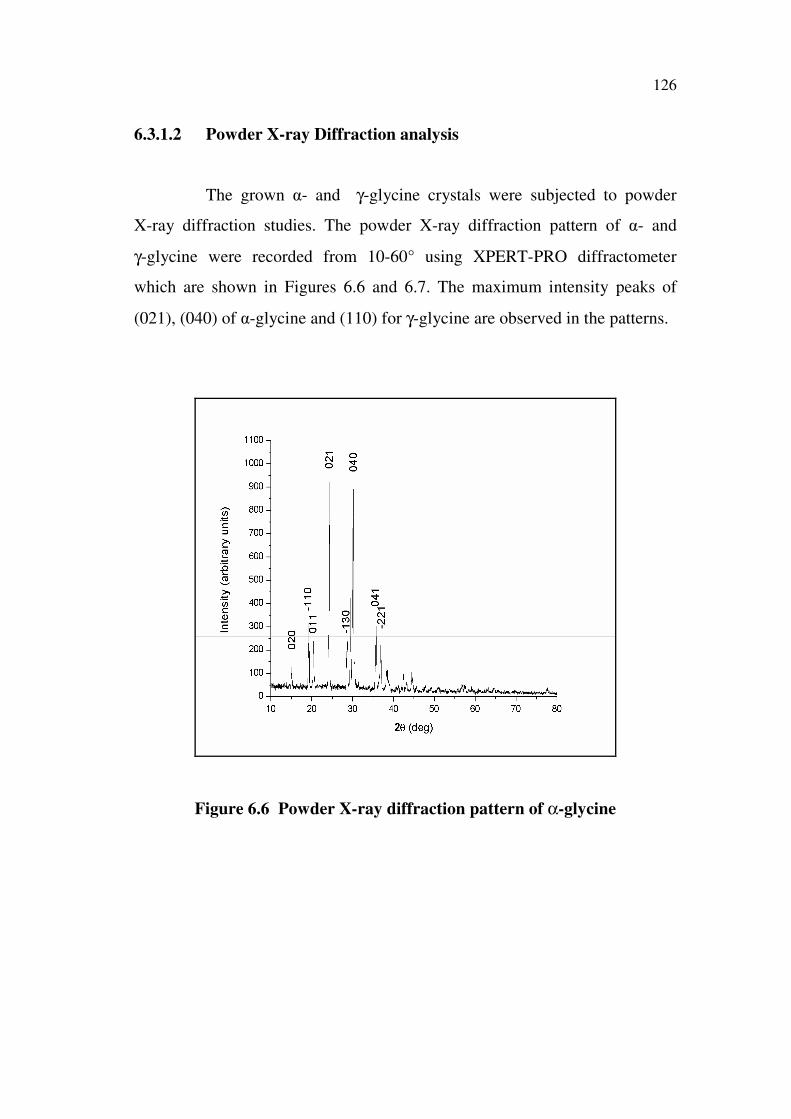
6.3.1.2 Powder X-ray Diffraction analysis
The grown g- and γ-glycine crystals were subjected to powder
X-ray diffraction studies. The powder X-ray diffraction pattern of g- and
γ-glycine were recorded from 10-60° using XPERT-PRO diffractometer
which are shown in Figures 6.6 and 6.7. The maximum intensity peaks of
(021), (040) of g-glycine and (110) for γ-glycine are observed in the patterns.
Figure 6.6 Powder X-ray diffraction pattern of α-glycine
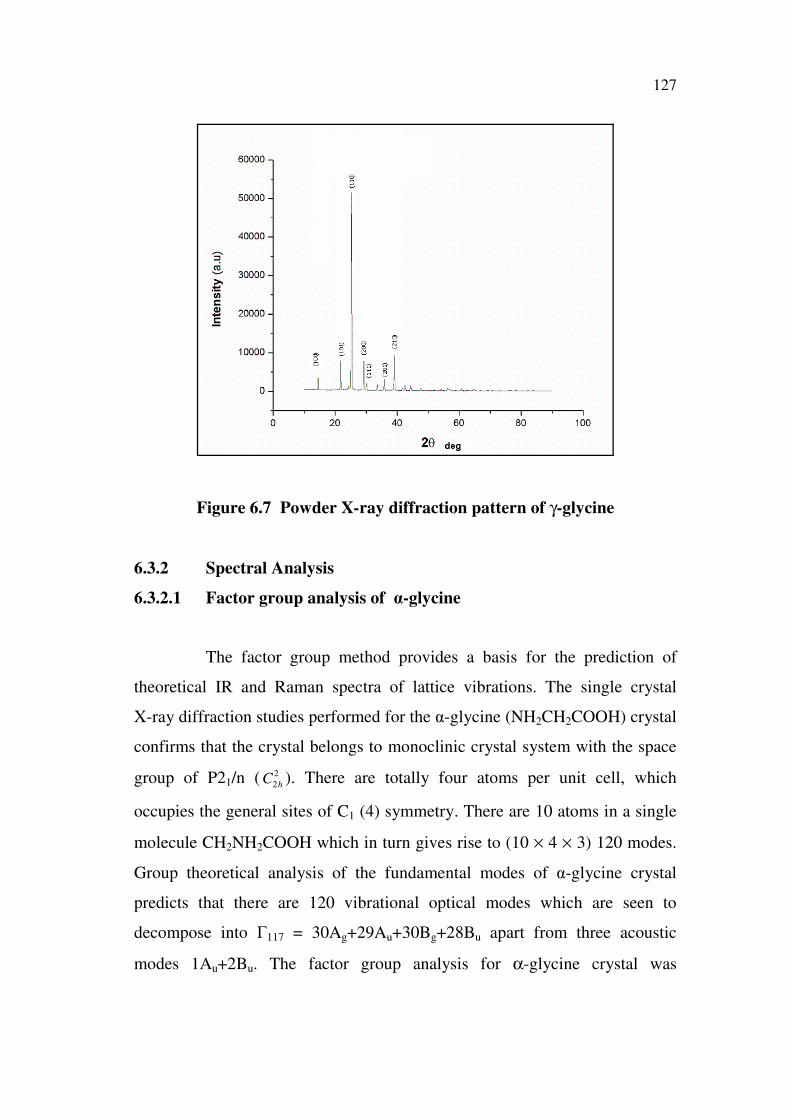
127
Figure 6.7 Powder X-ray diffraction pattern of γ-glycine
6.3.2 Spectral Analysis
6.3.2.1 Factor group analysis of g-glycine
The factor group method provides a basis for the prediction of
theoretical IR and Raman spectra of lattice vibrations. The single crystal
X-ray diffraction studies performed for the g-glycine (NH2CH2COOH) crystal
confirms that the crystal belongs to monoclinic crystal system with the space
group of P21/n ( 22h
C ). There are totally four atoms per unit cell, which
occupies the general sites of C1 (4) symmetry. There are 10 atoms in a single
molecule CH2NH2COOH which in turn gives rise to (10 × 4 × 3) 120 modes.
Group theoretical analysis of the fundamental modes of g-glycine crystal
predicts that there are 120 vibrational optical modes which are seen to
decompose into d117 = 30Ag+29Au+30Bg+28Bu apart from three acoustic
modes 1Au+2Bu. The factor group analysis for α-glycine crystal was
128
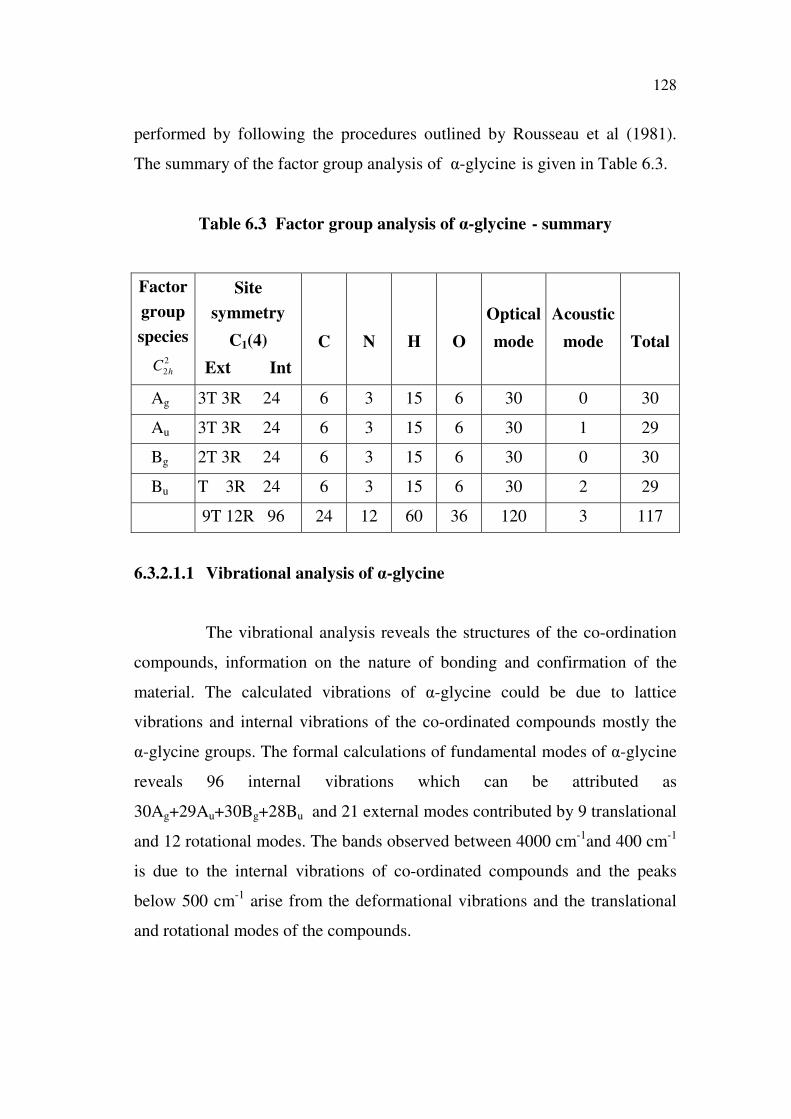
performed by following the procedures outlined by Rousseau et al (1981).
The summary of the factor group analysis of g-glycine is given in Table 6.3.
Table 6.3 Factor group analysis of g-glycine - summary
Factor
group
species
22h
C
Site
symmetry
C1(4)
Ext Int
C N H O
Optical
mode
Acoustic
mode Total
Ag 3T 3R 24 6 3 15 6 30 0 30
Au 3T 3R 24 6 3 15 6 30 1 29
Bg 2T 3R 24 6 3 15 6 30 0 30
Bu T 3R 24 6 3 15 6 30 2 29
9T 12R 96 24 12 60 36 120 3 117
6.3.2.1.1 Vibrational analysis of g-glycine
The vibrational analysis reveals the structures of the co-ordination
compounds, information on the nature of bonding and confirmation of the
material. The calculated vibrations of g-glycine could be due to lattice
vibrations and internal vibrations of the co-ordinated compounds mostly the
g-glycine groups. The formal calculations of fundamental modes of g-glycine
reveals 96 internal vibrations which can be attributed as
30Ag+29Au+30Bg+28Bu and 21 external modes contributed by 9 translational
and 12 rotational modes. The bands observed between 4000 cm-1and 400 cm-1
is due to the internal vibrations of co-ordinated compounds and the peaks
below 500 cm-1 arise from the deformational vibrations and the translational
and rotational modes of the compounds.
129
6.3.2.1.2 Internal vibrations
The internal vibrations of g-glycine are those arising from the NH3
asymmetric stretching and CH2 symmetric modes of vibrations. The internal
modes of g-glycine ions split into four components of Au (Z) and Bu (X,Y)
are IR active and Ag (XX,YY,ZZ,XY) and Bg (XZ,YZ) are Raman active. In
the title compound g-glycine, the NH3 vibrations of absorption at 3161 cm-1 is
due to asymmetric stretching. CH2 vibrations of the g-glycine have their
absorption at 3028 cm-1 is due to symmetric stretching.
6.3.2.1.3 External vibrations
The external vibrations are mainly due to the bands observed below
500 cm-1 which are due to the rotational and translational modes of vibrations
of g-glycine. The rotational modes are expected to have higher frequency and
intensity than translational modes in the Raman spectra. However the
translational modes are more intense in IR spectra (Bhattacharjee 1990,
Hanuja and Fomitsev 1980). g-glycine is found to have 21 external modes and
those vibrations can be achieved experimentally by polarized Raman
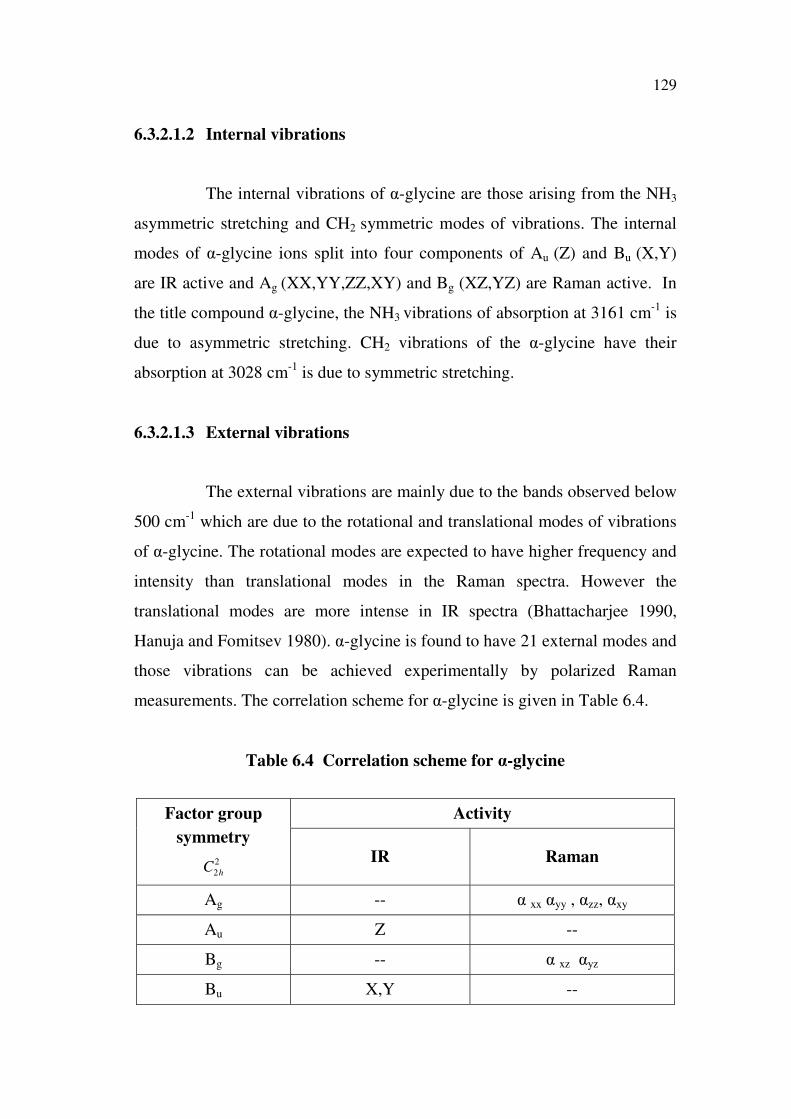
measurements. The correlation scheme for g-glycine is given in Table 6.4.
Table 6.4 Correlation scheme for g-glycine
ActivityFactor group
symmetry
22h
CIR Raman
Ag -- g xx gyy , gzz, gxy
Au Z --
Bg -- g xz gyz
Bu X,Y --
130
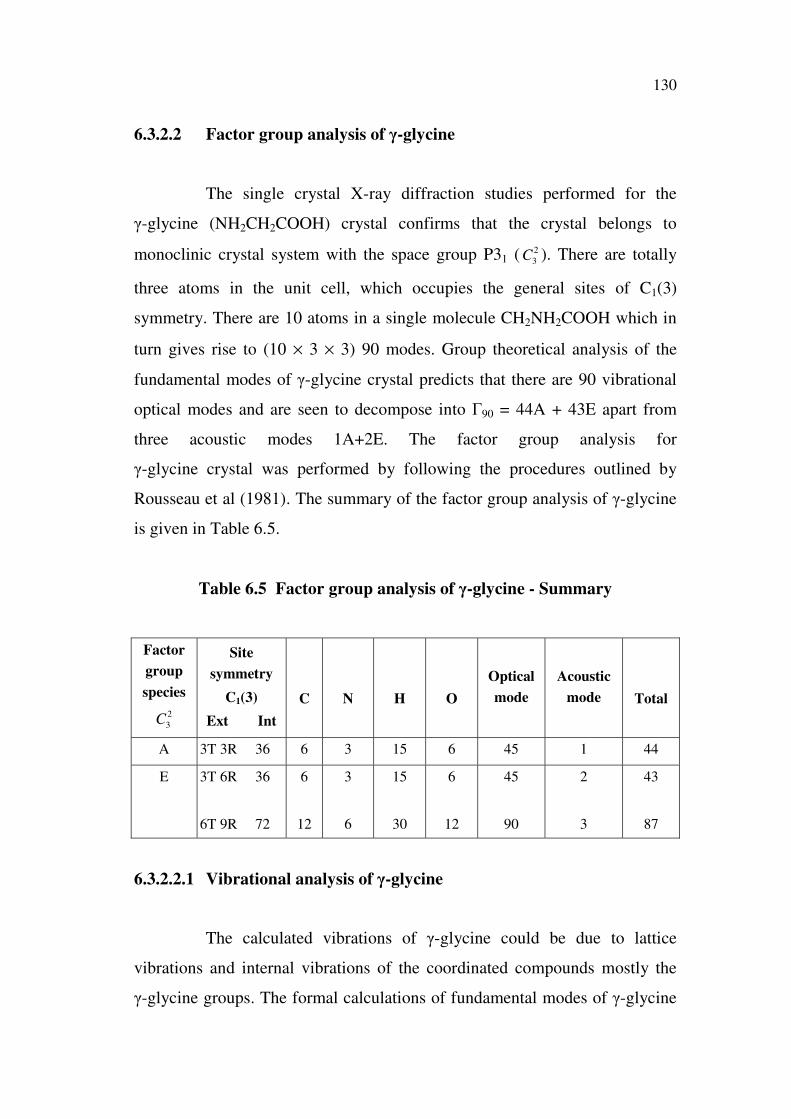
6.3.2.2 Factor group analysis of け-glycine
The single crystal X-ray diffraction studies performed for the
け-glycine (NH2CH2COOH) crystal confirms that the crystal belongs to
monoclinic crystal system with the space group P31 ( 23C ). There are totally
three atoms in the unit cell, which occupies the general sites of C1(3)
symmetry. There are 10 atoms in a single molecule CH2NH2COOH which in
turn gives rise to (10 × 3 × 3) 90 modes. Group theoretical analysis of the
fundamental modes of け-glycine crystal predicts that there are 90 vibrational
optical modes and are seen to decompose into d90 = 44A + 43E apart from
three acoustic modes 1A+2E. The factor group analysis for
け-glycine crystal was performed by following the procedures outlined by
Rousseau et al (1981). The summary of the factor group analysis of け-glycine
is given in Table 6.5.
Table 6.5 Factor group analysis of け-glycine - Summary
Factor
group
species
23C
Site
symmetry
C1(3)
Ext Int
C N H O
Optical
mode
Acoustic
mode Total
A 3T 3R 36 6 3 15 6 45 1 44
E 3T 6R 36
6T 9R 72
6
12
3
6
15
30
6
12
45
90
2
3
43
87
6.3.2.2.1 Vibrational analysis of け-glycine
The calculated vibrations of け-glycine could be due to lattice
vibrations and internal vibrations of the coordinated compounds mostly the
け-glycine groups. The formal calculations of fundamental modes of け-glycine
131
reveals 76 internal vibrations which can be attributed as 44A + 43E and 15
external modes contributed by 6 translational and 9 rotational modes. The
bands observed between 4000 cm-1 and 400 cm-1 is due to the internal
vibrations of co-ordinated compounds and the peaks below 500 cm-1 arise
from the deformational vibrations and the translational and rotational modes
of the compounds.
6.3.2.2.2 Internal vibrations
As the け-glycine molecule does not have any symmetry the internal
vibrations exhibited are of both IR and Raman active exclusive of acoustic
mode. The internal vibrations of け-glycine may be classified as those arising
from the NH3, CH2 and NO3- functional groups. These vibrations are strongly
coupled between themselves.
6.3.2.2.3 External vibrations
The external vibrations are mainly due to the bands observed below
500 cm-1 which are due to the rotational and translational modes of vibrations
of け-glycine in the present case. The rotational modes are expected to have
higher frequency and intensity than translational modes in the Raman spectra.
However the translational modes are more intense in IR spectra
(Bhattacharjee 1990, Hanuja and Fomitsev 1980). け-glycine is found to have
15 external modes and those vibrations can be achieved experimentally by
polarized Raman measurements. The correlation scheme obtained by
following the procedures of Fateley et al (2001) is given in Table 6.6.
132
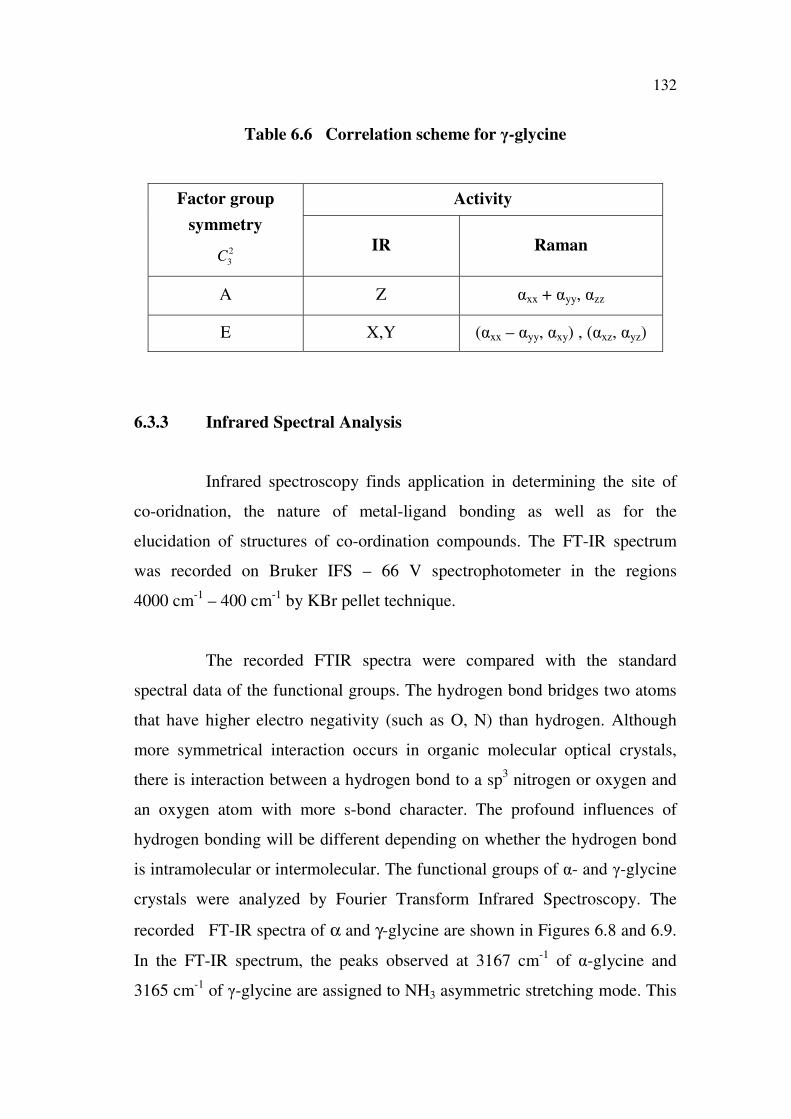
Table 6.6 Correlation scheme for け-glycine
ActivityFactor group
symmetry
23C
IR Raman
A Z gxx + gyy, gzz
E X,Y (gxx – gyy, gxy) , (gxz, gyz)
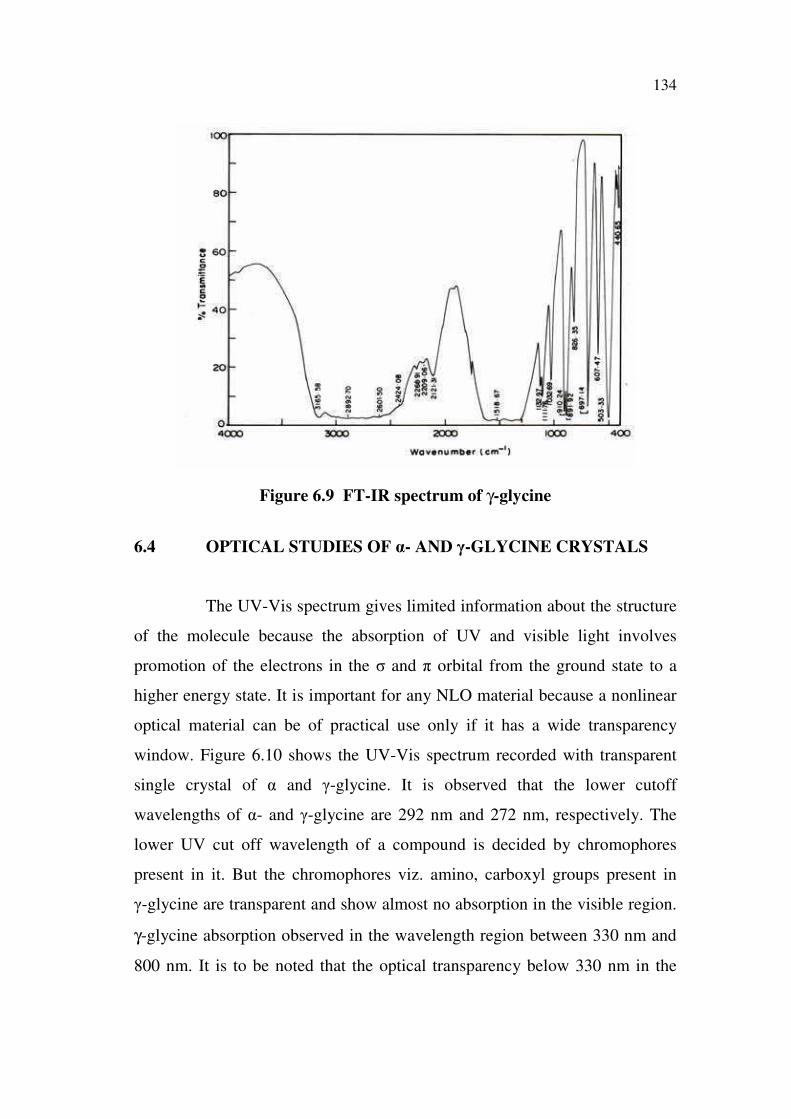
6.3.3 Infrared Spectral Analysis
Infrared spectroscopy finds application in determining the site of
co-oridnation, the nature of metal-ligand bonding as well as for the
elucidation of structures of co-ordination compounds. The FT-IR spectrum
was recorded on Bruker IFS – 66 V spectrophotometer in the regions
4000 cm-1 – 400 cm-1 by KBr pellet technique.
The recorded FTIR spectra were compared with the standard
spectral data of the functional groups. The hydrogen bond bridges two atoms
that have higher electro negativity (such as O, N) than hydrogen. Although
more symmetrical interaction occurs in organic molecular optical crystals,
there is interaction between a hydrogen bond to a sp3 nitrogen or oxygen and
an oxygen atom with more s-bond character. The profound influences of
hydrogen bonding will be different depending on whether the hydrogen bond
is intramolecular or intermolecular. The functional groups of g- and け-glycine
crystals were analyzed by Fourier Transform Infrared Spectroscopy. The
recorded FT-IR spectra of α and γ-glycine are shown in Figures 6.8 and 6.9.
In the FT-IR spectrum, the peaks observed at 3167 cm-1 of g-glycine and
3165 cm-1 of け-glycine are assigned to NH3 asymmetric stretching mode. This
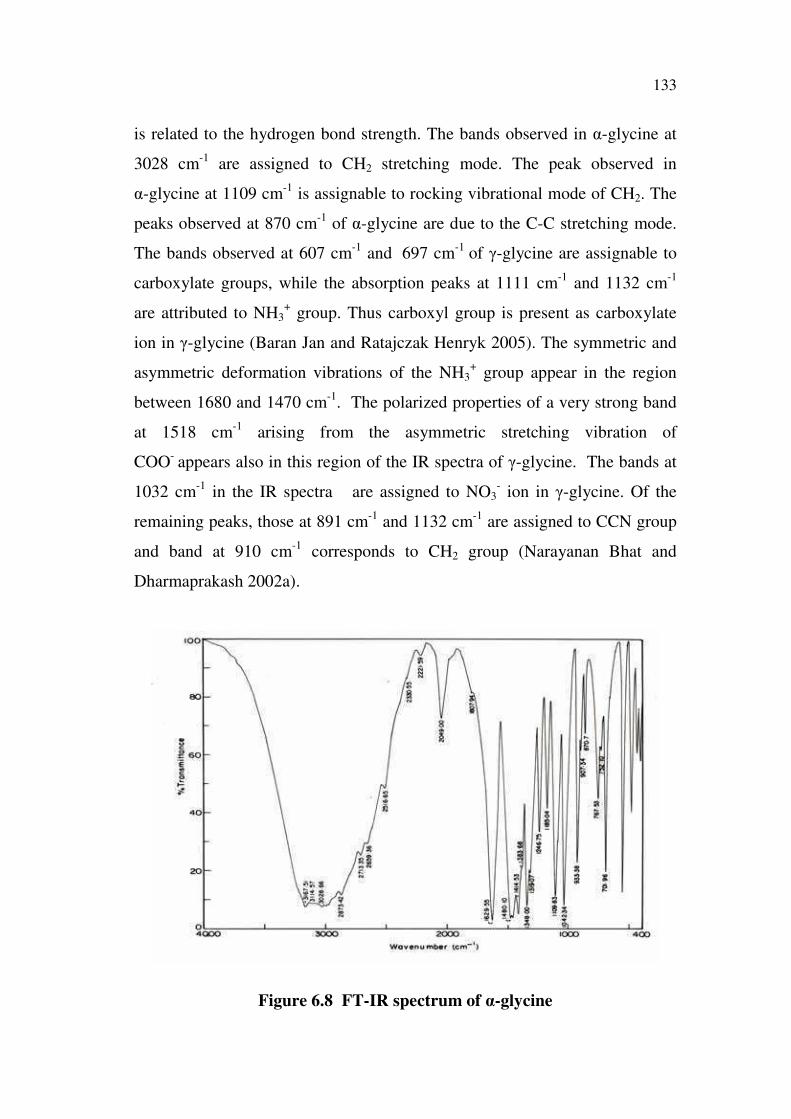
133
is related to the hydrogen bond strength. The bands observed in g-glycine at
3028 cm-1 are assigned to CH2 stretching mode. The peak observed in
g-glycine at 1109 cm-1 is assignable to rocking vibrational mode of CH2. The
peaks observed at 870 cm-1 of g-glycine are due to the C-C stretching mode.
The bands observed at 607 cm-1 and 697 cm-1 of け-glycine are assignable to
carboxylate groups, while the absorption peaks at 1111 cm-1 and 1132 cm-1
are attributed to NH3+ group. Thus carboxyl group is present as carboxylate
ion in け-glycine (Baran Jan and Ratajczak Henryk 2005). The symmetric and
asymmetric deformation vibrations of the NH3+ group appear in the region
between 1680 and 1470 cm-1. The polarized properties of a very strong band
at 1518 cm-1 arising from the asymmetric stretching vibration of
COO- appears also in this region of the IR spectra of け-glycine. The bands at
1032 cm-1 in the IR spectra are assigned to NO3- ion in け-glycine. Of the
remaining peaks, those at 891 cm-1 and 1132 cm-1 are assigned to CCN group
and band at 910 cm-1 corresponds to CH2 group (Narayanan Bhat and
Dharmaprakash 2002a).
Figure 6.8 FT-IR spectrum of g-glycine
134
Figure 6.9 FT-IR spectrum of γ-glycine
6.4 OPTICAL STUDIES OF g- AND け-GLYCINE CRYSTALS
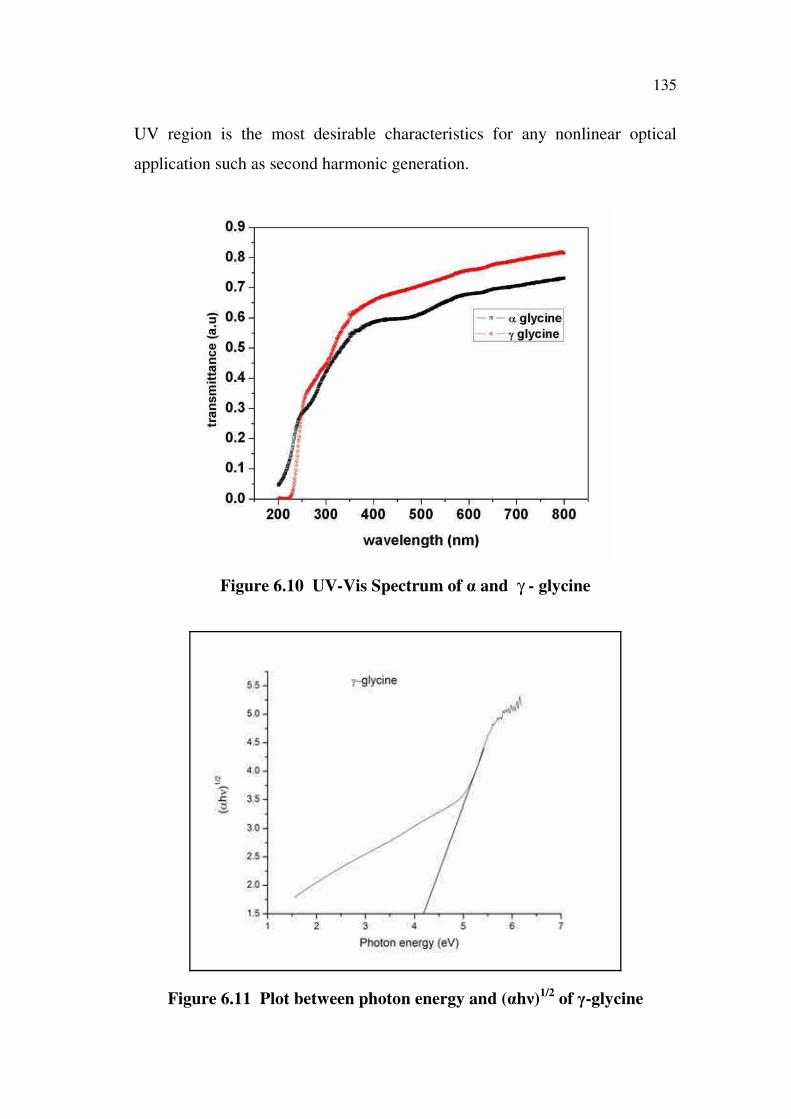
The UV-Vis spectrum gives limited information about the structure
of the molecule because the absorption of UV and visible light involves
promotion of the electrons in the j and ヾ orbital from the ground state to a
higher energy state. It is important for any NLO material because a nonlinear
optical material can be of practical use only if it has a wide transparency
window. Figure 6.10 shows the UV-Vis spectrum recorded with transparent
single crystal of g and け-glycine. It is observed that the lower cutoff
wavelengths of g- and け-glycine are 292 nm and 272 nm, respectively. The
lower UV cut off wavelength of a compound is decided by chromophores
present in it. But the chromophores viz. amino, carboxyl groups present in
け-glycine are transparent and show almost no absorption in the visible region.
γ-glycine absorption observed in the wavelength region between 330 nm and
800 nm. It is to be noted that the optical transparency below 330 nm in the
135
UV region is the most desirable characteristics for any nonlinear optical
application such as second harmonic generation.
Figure 6.10 UV-Vis Spectrum of g and γ - glycine
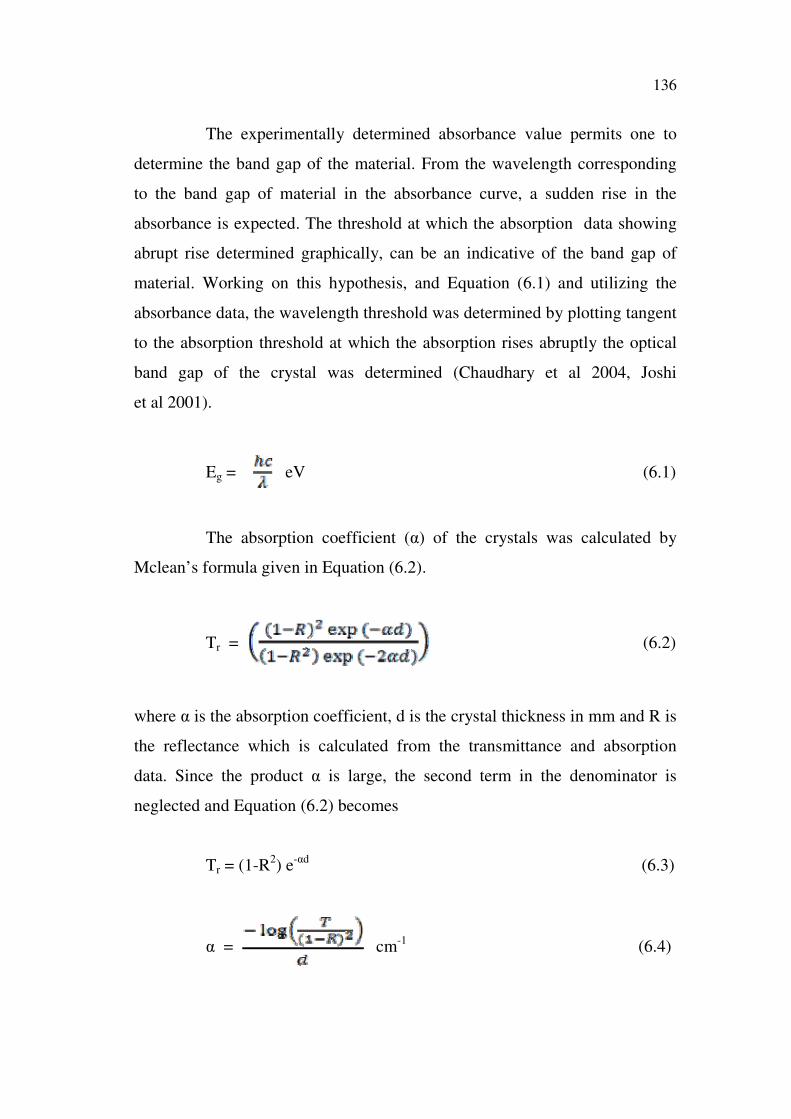
Figure 6.11 Plot between photon energy and (ghち)1/2
of け-glycine
136
The experimentally determined absorbance value permits one to
determine the band gap of the material. From the wavelength corresponding
to the band gap of material in the absorbance curve, a sudden rise in the
absorbance is expected. The threshold at which the absorption data showing
abrupt rise determined graphically, can be an indicative of the band gap of
material. Working on this hypothesis, and Equation (6.1) and utilizing the
absorbance data, the wavelength threshold was determined by plotting tangent
to the absorption threshold at which the absorption rises abruptly the optical
band gap of the crystal was determined (Chaudhary et al 2004, Joshi
et al 2001).
Eg = eV (6.1)
The absorption coefficient (g) of the crystals was calculated by
Mclean’s formula given in Equation (6.2).
Tr = (6.2)
where g is the absorption coefficient, d is the crystal thickness in mm and R is
the reflectance which is calculated from the transmittance and absorption
data. Since the product g is large, the second term in the denominator is
neglected and Equation (6.2) becomes
Tr = (1-R2) e-gd (6.3)
g = cm-1 (6.4)
137
The value of optical band gap (Figure 6.11) of け-glycine is 4.2 eV.
The internal efficiency of the device also depends upon the absorption
coefficient. Hence by tailoring the absorption coefficient and tuning the band
gap of the material, one can achieve the desired material which is suitable for
fabricating various layers of the optoelectronic devices as our requirements.
6.5 DIELECTRIC STUDIES
The dielectric studies were carried out using HIOKI 3532-50 LCR
HITESTER. The samples were prepared and mounted between the electrodes.
In order to ensure good electrical contact between the crystal and the
electrodes, the crystal faces were coated with silver paint. Extreme care was
taken that the silver paint does not spread to the sides of the crystal. The
capacitance and dissipation factor of the parallel plate capacitor formed by the
copper plate and electrode having the sample as a dielectric medium have
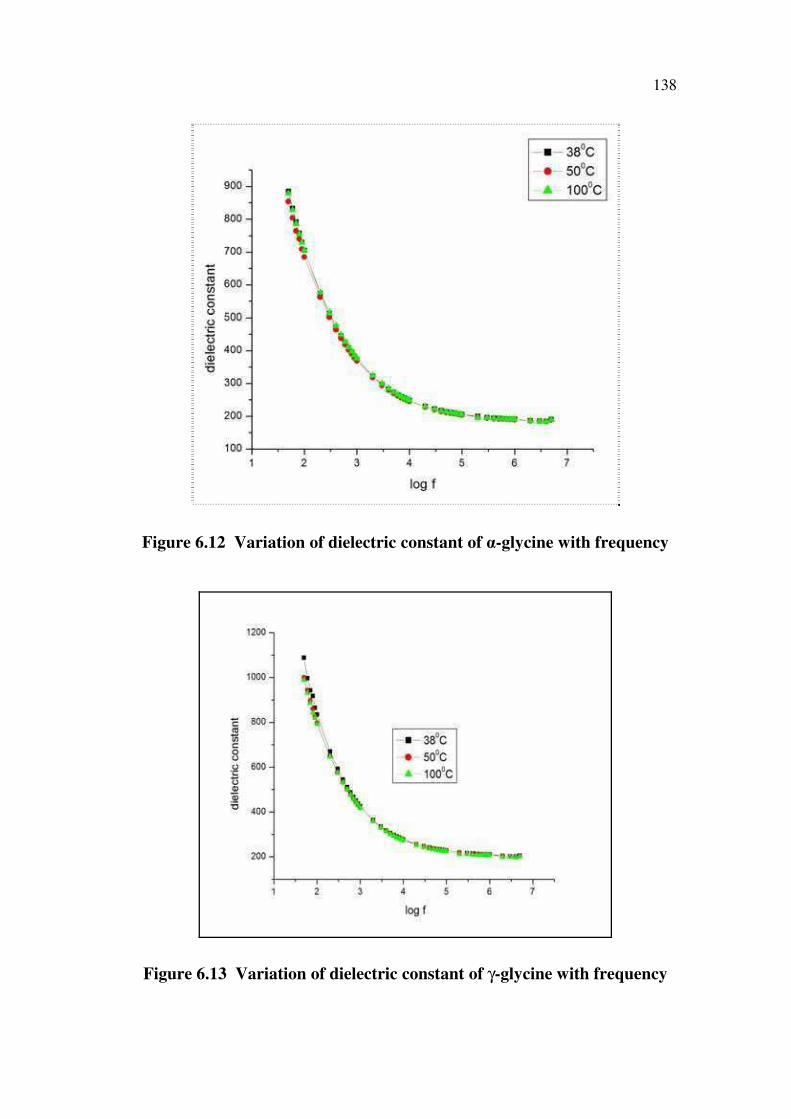
been measured. Figures 6.12 and 6.13 show the variation of dielectric
constant as a function of frequency for g- and け-glycine. It is found that the
dielectric constant of g- and け-glycine is higher at low frequencies and
decrease with increase in frequency. This may be attributed to space charge
polarization due to charged lattice defects. But at a fixed frequency, the
dielectric constant of γ-glycine is more than that of α-glycine. The γ-glycine
is more polarized and hence has high dielectric constant. For g-glycine
dielectric constant has a high value of 705 at 100 Hz and decreases to
189 at 5 MHz. Similarly for γ-glycine the dielectric constant has a high value
of 965 at 100 Hz and decreases to 228 at 5 MHz.
138
Figure 6.12 Variation of dielectric constant of g-glycine with frequency
Figure 6.13 Variation of dielectric constant of γ-glycine with frequency
139
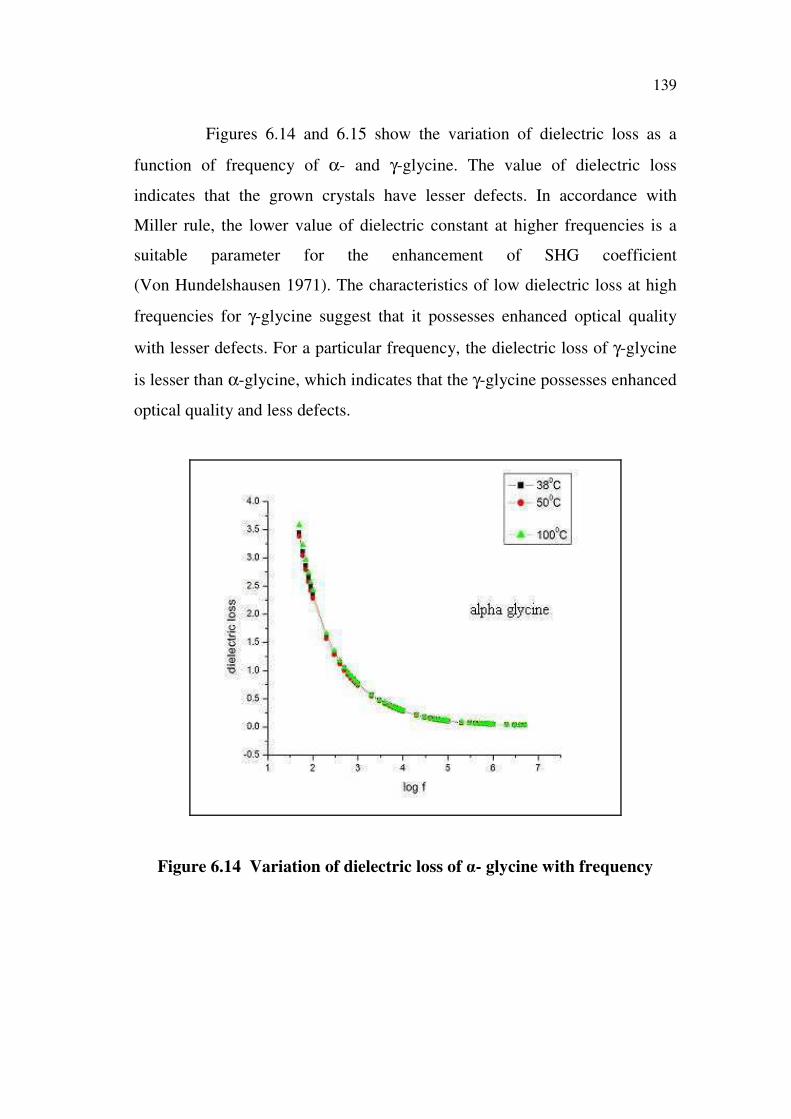
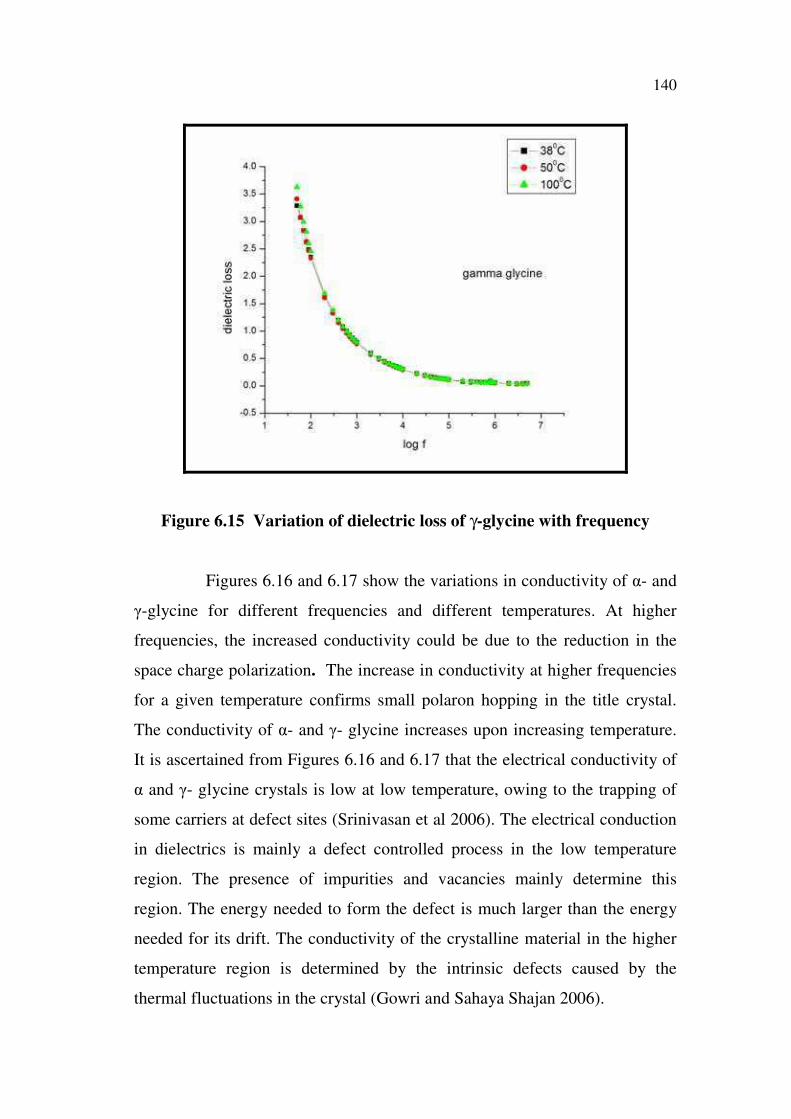
Figures 6.14 and 6.15 show the variation of dielectric loss as a
function of frequency of α- and γ-glycine. The value of dielectric loss
indicates that the grown crystals have lesser defects. In accordance with
Miller rule, the lower value of dielectric constant at higher frequencies is a
suitable parameter for the enhancement of SHG coefficient
(Von Hundelshausen 1971). The characteristics of low dielectric loss at high
frequencies for γ-glycine suggest that it possesses enhanced optical quality
with lesser defects. For a particular frequency, the dielectric loss of γ-glycine
is lesser than α-glycine, which indicates that the γ-glycine possesses enhanced
optical quality and less defects.
Figure 6.14 Variation of dielectric loss of g- glycine with frequency
140
Figure 6.15 Variation of dielectric loss of γ-glycine with frequency
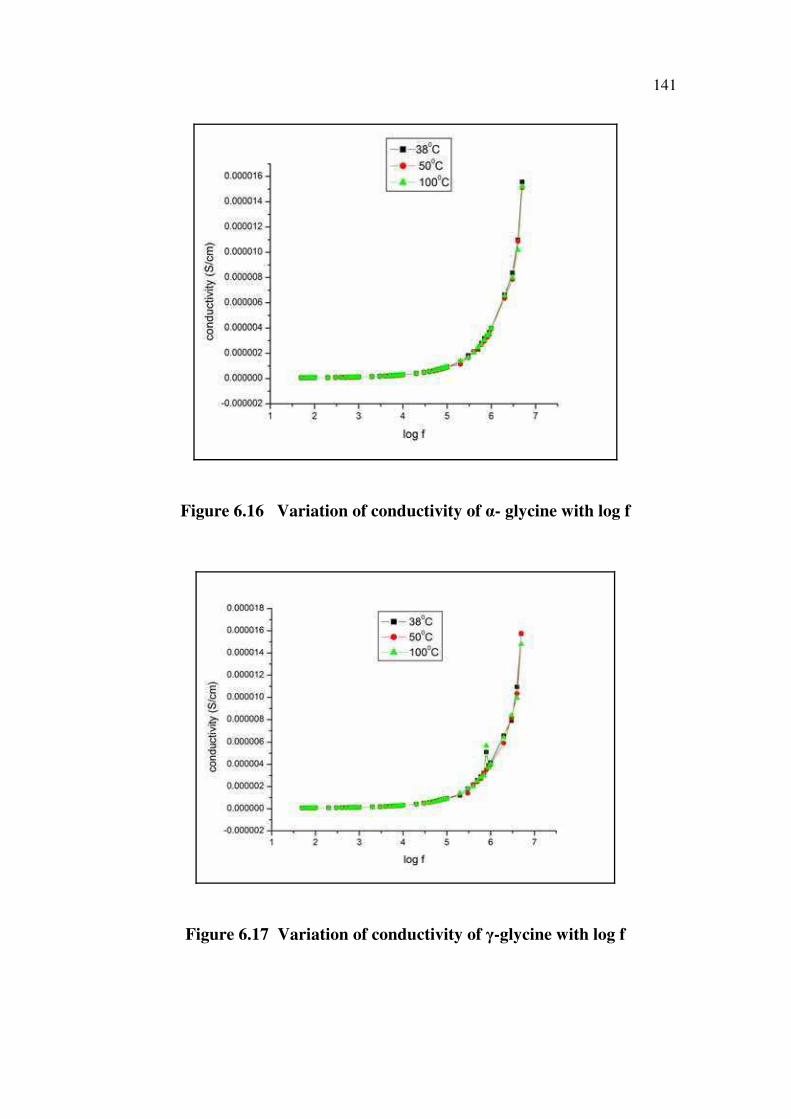
Figures 6.16 and 6.17 show the variations in conductivity of g- and
け-glycine for different frequencies and different temperatures. At higher
frequencies, the increased conductivity could be due to the reduction in the
space charge polarization. The increase in conductivity at higher frequencies
for a given temperature confirms small polaron hopping in the title crystal.
The conductivity of g- and け- glycine increases upon increasing temperature.
It is ascertained from Figures 6.16 and 6.17 that the electrical conductivity of
g and け- glycine crystals is low at low temperature, owing to the trapping of
some carriers at defect sites (Srinivasan et al 2006). The electrical conduction
in dielectrics is mainly a defect controlled process in the low temperature
region. The presence of impurities and vacancies mainly determine this
region. The energy needed to form the defect is much larger than the energy
needed for its drift. The conductivity of the crystalline material in the higher
temperature region is determined by the intrinsic defects caused by the
thermal fluctuations in the crystal (Gowri and Sahaya Shajan 2006).
141
Figure 6.16 Variation of conductivity of g- glycine with log f
Figure 6.17 Variation of conductivity of け-glycine with log f
142
6.6 TGA–DTA ANALYSIS OF g- AND け- GLYCINE CRYSTALS
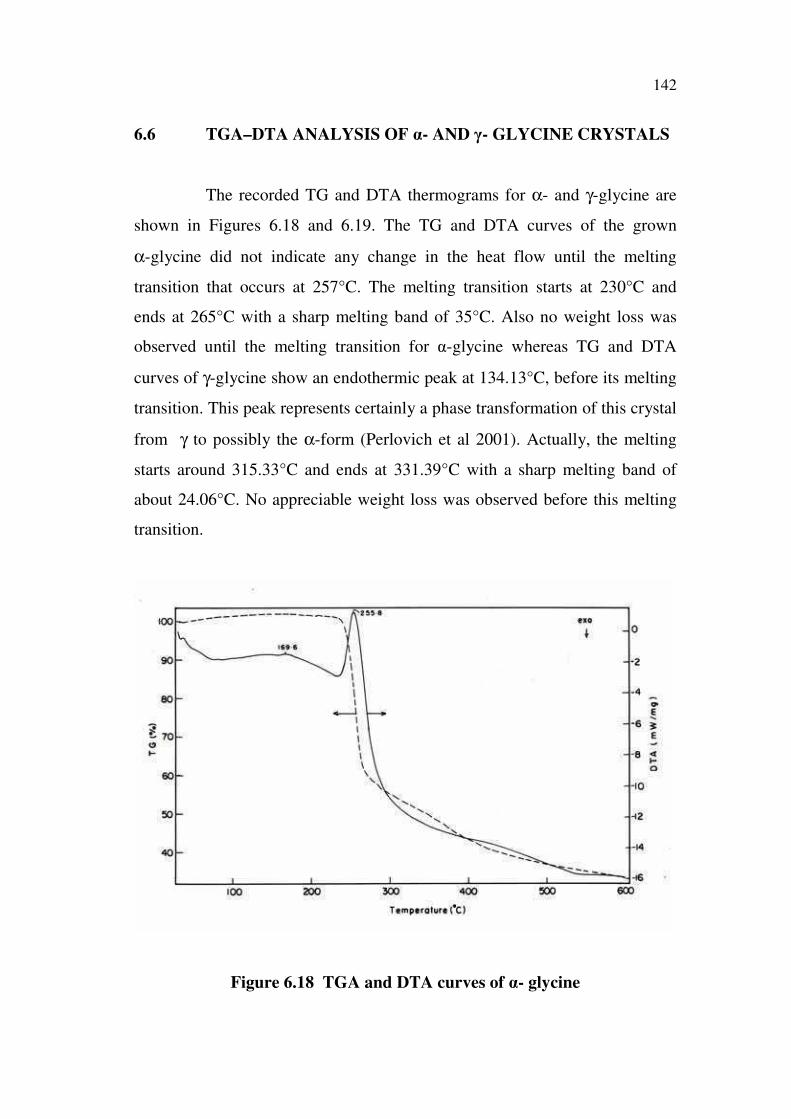
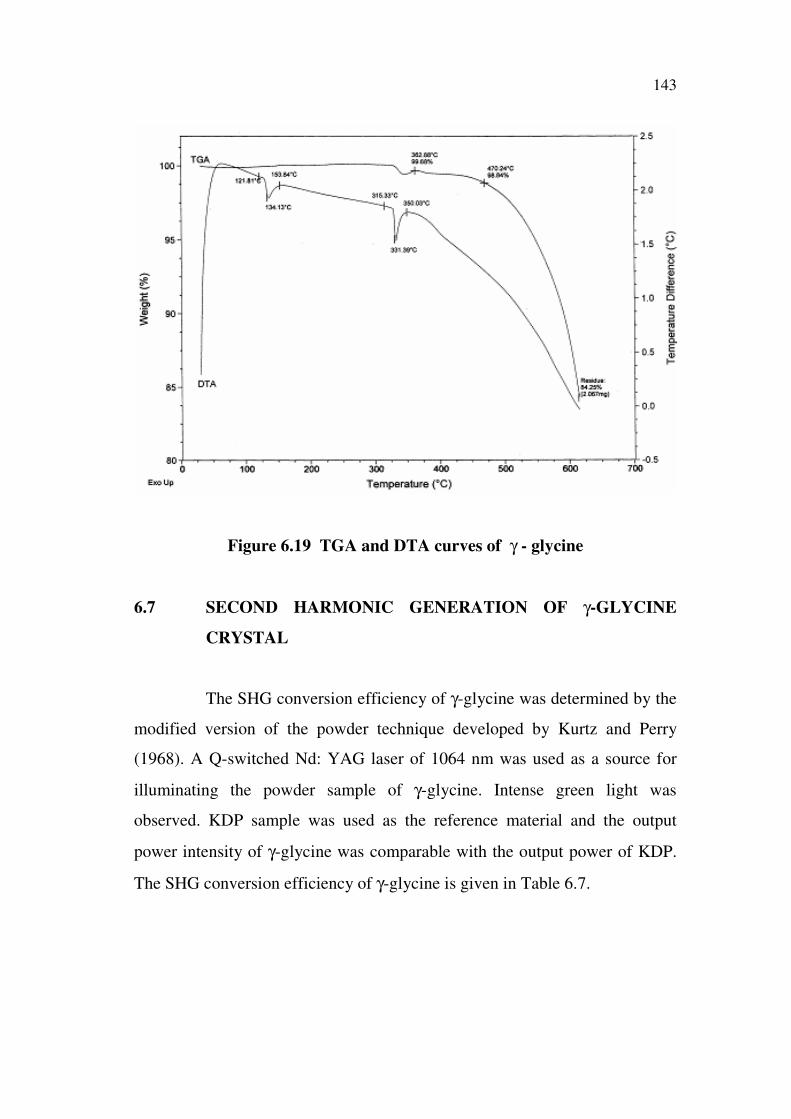
The recorded TG and DTA thermograms for α- and γ-glycine are
shown in Figures 6.18 and 6.19. The TG and DTA curves of the grown
α-glycine did not indicate any change in the heat flow until the melting
transition that occurs at 257°C. The melting transition starts at 230°C and
ends at 265°C with a sharp melting band of 35°C. Also no weight loss was
observed until the melting transition for g-glycine whereas TG and DTA
curves of γ-glycine show an endothermic peak at 134.13°C, before its melting
transition. This peak represents certainly a phase transformation of this crystal
from γ to possibly the α-form (Perlovich et al 2001). Actually, the melting
starts around 315.33°C and ends at 331.39°C with a sharp melting band of
about 24.06°C. No appreciable weight loss was observed before this melting
transition.
Figure 6.18 TGA and DTA curves of g- glycine
143
Figure 6.19 TGA and DTA curves of γ - glycine
6.7 SECOND HARMONIC GENERATION OF γ-GLYCINE
CRYSTAL
The SHG conversion efficiency of γ-glycine was determined by the
modified version of the powder technique developed by Kurtz and Perry
(1968). A Q-switched Nd: YAG laser of 1064 nm was used as a source for
illuminating the powder sample of γ-glycine. Intense green light was
observed. KDP sample was used as the reference material and the output
power intensity of γ-glycine was comparable with the output power of KDP.
The SHG conversion efficiency of γ-glycine is given in Table 6.7.
144
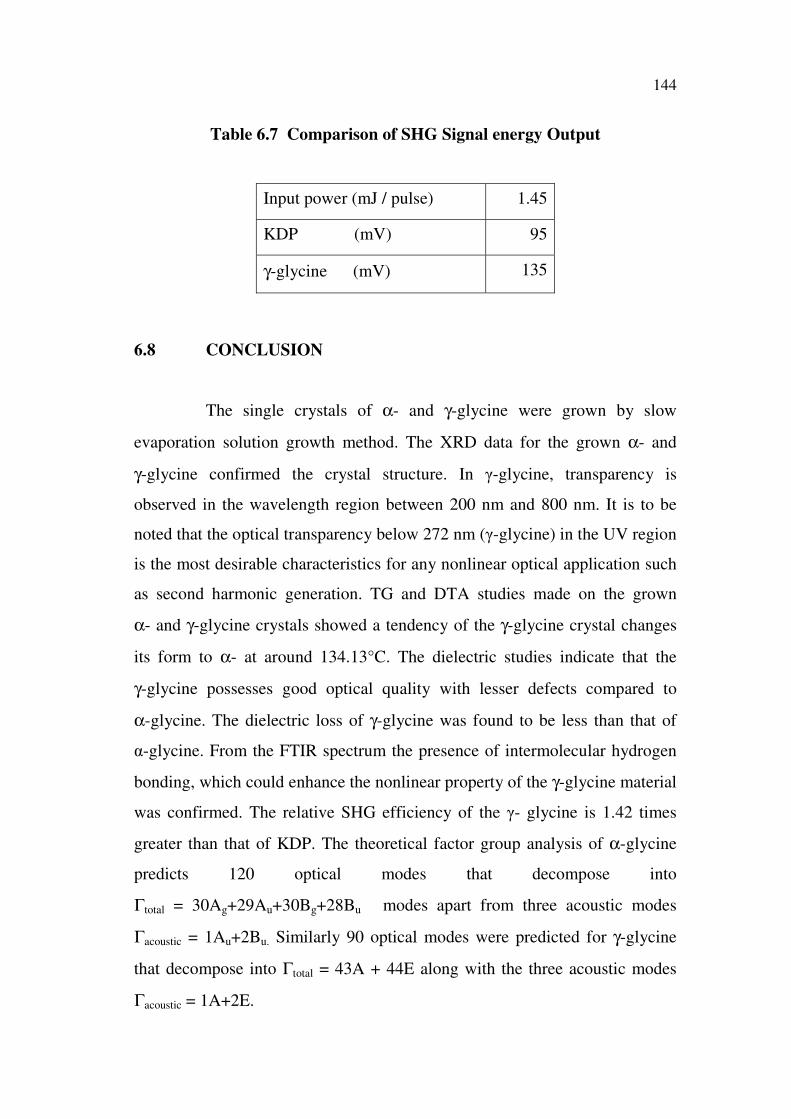
Table 6.7 Comparison of SHG Signal energy Output
Input power (mJ / pulse) 1.45
KDP (mV) 95
γ-glycine (mV) 135
6.8 CONCLUSION
The single crystals of α- and γ-glycine were grown by slow
evaporation solution growth method. The XRD data for the grown α- and
γ-glycine confirmed the crystal structure. In け-glycine, transparency is
observed in the wavelength region between 200 nm and 800 nm. It is to be
noted that the optical transparency below 272 nm (け-glycine) in the UV region
is the most desirable characteristics for any nonlinear optical application such
as second harmonic generation. TG and DTA studies made on the grown
α- and γ-glycine crystals showed a tendency of the γ-glycine crystal changes
its form to α- at around 134.13°C. The dielectric studies indicate that the
γ-glycine possesses good optical quality with lesser defects compared to
α-glycine. The dielectric loss of γ-glycine was found to be less than that of
g-glycine. From the FTIR spectrum the presence of intermolecular hydrogen
bonding, which could enhance the nonlinear property of the γ-glycine material
was confirmed. The relative SHG efficiency of the け- glycine is 1.42 times
greater than that of KDP. The theoretical factor group analysis of α-glycine
predicts 120 optical modes that decompose into
Γtotal = 30Ag+29Au+30Bg+28Bu modes apart from three acoustic modes
Γacoustic = 1Au+2Bu. Similarly 90 optical modes were predicted for γ-glycine
that decompose into Γtotal = 43A + 44E along with the three acoustic modes
Γacoustic = 1A+2E.