Embed Size (px)
Citation preview

Chapter 6
Impacts of Cogeneration
.

Contents
PageEnvironmental Effects of Cogeneration . . . . . . 221
Characteristics of Cogeneration Systems andTheir Effects on Air Quality . . . . . . . . . . . . 221
Emissions Balances: Cogeneration v.Separate Heat and Electricity. . . . . . . . . . . 229
An Air Quality Analysis of Urban DieselCogeneration. . . . . . . . . . . . . . . . . . . . . . . . 231
Emission Controls. . . . . . . . . . . . . . . . . . . . . . 233Health Effects From Cogenerator
Emissions. . . . . . . . . . . . . . . . . . . . . . . . . . . 236Effects of Some Cogeneration Technology/
Fuel Options . . . . . . . . . . . . . . . . . . . . . . . . 238Policy Options: Removing Environment-
Associated Regulatory Impediments . . . . . 239Other Potential Impacts. . . . . . . . . . . . . . . . . 241
Potential Regulatory Burden onEnvironmental Agencies . . . . . . . . . . . . . . . 242
Environmental Permitting and EnforcementAgencies . . . . . . . . . . . . . . . . . . . . . . . . . . . 242
Potential Impacts on Agency Caseloads. . . . 244Summary. . . . . . . . . . . . . . . . . . . . . . . . . . . . . 246
Economic and Sociall Implications . . . . . . . . . . 246Economic Impacts . . . . . . . . . . . . . . . . . . . . . 247Utility Planning and Regulation ., . . . . .*.* 254Other Economic and Social Impacts . . . . . . 257Centralization and Decentralization of
Electricity Generation . . . . . . . . . . . . . . . . . 259
Chapter 6 References . . . . . . . . . . . . . . . . . . . . 263
Tables
Table No.48. Effect of Cogeneration Characteristics on
Air Quality. . . . . . . . . . . . . . . . . . . . . . . . . . 22249. Uncontrolled Emissions of Competing
Combustion Technologies Using theSame Fuel, in Pounds/MMBtu Fuel Input . 223
50. Maximum Size Cogenerator NotRequiring New Source Review . . . . . . . . . 226
51. Selected Emissions Balances forCogeneration Displacing Central PowerPlus Local Heat Sources. . . . . . . . . . . . . . . 231
52.
53.
54.
554
56.
PageSummary of NOX Emission ControlTechniques for Reciprocating IC Engines . 234NOX Control Techniques that AchieveSpecific Levels of NOX Reduction . . . . . . . 235Costs of Alternative NOX Controls forDiesel Cogenerators . . . . . . . . . . . . . . . . . . . 235Emissions From Oil- and Coal-FiredDiesels . . . . . . . . . . . . . . . . . . . . . . . . . . . . . 238Approximate Costs of proceduresRequired Under the Clean Air Act . . . . . . 240
57. Penetration Scenario for Cogeneration inCalifornia and Colorado . . . . . . . . . . . . . . . 244
58. Increase in Agency Workloads Due tothe Deployment of CogenerationTechnologies in Colorado. . . . . . . . . . . . . . 245
59. Increase in Agency Workloads Due tothe Deployment of CogenerationTechnologies in California . . . . . . . . . . . . . 246
.60. Market Penetration Estimates forCogeneration . . . . . . . . . . . . . . . . . . . . . . . . 248
61. Scenarios for Cogeneration
62
6364
Implementation . . . . . . . . . . . . . . . . . . . . . . . 249Assumptions Used to Compare Capita!Costs . . . . . . . . . . . . . . . . . . . . . . . . . . . . . . 250Comparison of Capital Requirements . . . . 251Assumptions Used in EstimatingOperating and Maintenance Costs. . . . . . . 251
65. Comparison of Operating andMaintenance Costs . . . . . . . . . . . . . . . . . . . 252
66. Comparison of Construction LaborRequirements. . . . . . . . . . . . . . . . . . . . . .. ..253
67. Craft Requirements for Central StationPowerplant Construction . . . . . . . . . . . . . . 254
68. Estimated Operating and MaintenanceLabor . . . . . . . . . . . . . . . . . . . . . . . . . . . . . . 254
69. Pacific Gas & Electric Cost StructureAdjusted for PURPA, 1990 . . . . . . . . . . . . . 256
Figures
Figure No..
61. CWE Fixed Cost Structure as a Functionof Sales Growth. . . . . . . . . . . . . . . . . . . . . . 256

Chapter 6
Impacts of Cogeneration
ENVIRONMENTAL EFFECTS OF COGENERATIONThe major environmental issue that has arisen
from the promotion and deployment of cogen-eration technologies concerns whether thewidespread use of cogeneration may lead eitherto improved or degraded air quality. This issueis especially critical in urban areas, where airquality may not be in compliance with nationalambient standards or where the allowable marginfor additional emissions may be small. A corollaryissue, also critical for urban areas, concerns therelative value of promoting cogeneration by eas-ing environmental standards. Examples of sug-gested regulatory changes designed to favorcogeneration include basing emission standardson energy output rather than (currently used) fuelinput, * and awarding emissions “offsets”**created by the cogenerator’s substitution ofcogenerated electric power for utility-generatedelectric power. Clearly, the issues are intercon-nected, because cogeneration’s effect on airquality will provide a powerful argument for oragainst any changes in environmental standards.
This analysis of the environmental effects ofcogeneration focuses on these air quality issues,with a final section devoted to other potential im-pacts (such as noise). First, cogeneration is char-acterized according to a list of attributes that af-fect air quality. These attributes are then dis-cussed qualitatively and, to the extent possible,quantitatively. Next, a series of cogeneration ap-plications are evaluated to determine their “emis-sions balances:” the net emissions increases ordecreases in the total system (the utility grid pluslocal heat and electricity sources), and the netchanges at the cogenerator site. Then, an evalua-tion of an existing air quality study of cogenera-tion is presented, followed by discussions of emis-
*Because a cogenerator produces more usable energy per unitof fuel consumed than a similarly sized electric generator using thesame technology, an output-based standard would allow the co-generator to emit more pollutants per unit of fuel consumed andthus incur lower pollution control costs.
**New sources attempting to locate in an area that has not at-tained Federal ambient standards must obtain pollution “offsets”(i.e., reduced emissions), from existing sources in the area so asnot to increase total emissions.
sion controls and the health effects of exposureto the major pollutants emitted by cogenerators.The air quality evaluation concludes with a dis-cussion of the potential air quality concerns as-sociated with advanced cogeneration technolo-gies and an analysis of some suggested policy op-tions for promoting cogeneration by easing en-vironmental regulations. The chapter ends witha discussion of other potential impacts ofcogeneration, including water discharges, solidwaste disposal, noise, and cooling tower drift.
Characteristics of CogenerationSystems and Their Effects on Air Quality
The deployment of cogeneration systems mayinvolve a number of changes in the physical char-acteristics of electricity generation and (useful)heat or steam production. These physical changesmay, in turn, alter the magnitude and dispersioncharacteristics of emissions from these activities.The result will be a change in air quality.
At a minimum, cogeneration will increase fuelefficiency by replacing separate devices produc-ing either electricity or thermal energy with asingle device providing both. Thus, less fuelwould have to be burned to produce the sameenergy. Cogeneration may involve merely the ad-dition of waste heat capturing equipment to ex-isting electric generators, or the addition of tur-bines to existing steam producers; in this case,cogeneration technology is different from onlyone of the separate technologies. However, manycogeneration systems use technologies differentfrom both the separate electricity generator andheat or steam producer. Cogeneration systemsgenerally are different in scale from separateelectricity and thermal energy systems; for virtual-ly all applications except simple additions ofwaste heat recovery equipment, they are smallerin scale than the central electricity generatingsystems they substitute for, and in many applica-tions they are larger in scale than the thermalenergy systems. Cogeneration systems often use
221

—
222 ● Industrial and Commercial Cogeneratlon
a different fuel from either or both systems theyreplace, and often they have a different loca-tion–usually closer to the electricity demandsource, at times slightly farther away from thethermal demand sources.
Table 48 summarizes the separate impact onair quality of each of these cogeneration charac-teristics, assuming all other factors remain thesame. For example, a reduction in fuel burnedwill lead to decreased emissions and improvedair quality if everything else remains the same.Usually, however, lots of things have changed.For example, the substitution of several smallcogenerators for a central power station mayimply:
●
●
●
●
●
fewer controls, because most regulations in-crease in stringency as size increases;lower stacks, which have greater impacts onground level air quality per unit of emission;dispersal of powerplant emissions sources–i.e., more sources with lower emissions fromeach separate source;different technology-e. g., diesels instead offossil boilers and gas-fired furnaces;use of a different fuel—e.g., diesel fuel usedinstead of coal and natural gas.
The complex mixture of effects in this exampleand in table 48 implies that cogeneration as ageneral concept cannot be characterized easilyas environmentally beneficial or adverse. A moredetailed exploration of cogenerator characteris-tics is necessary in order to identify those cir-cumstances where the environmental value of co-generation can be defined less ambiguously.
Increase in Fuel EfficiencyAs noted above, all near-term cogeneration ap-
plications involve the use of a fuel burning tech-nology that produces both electricity and ther-mal energy, and that substitutes for a separateelectric generator and thermal system. Althoughmost applications involve a change in the scaleof electricity generation (from central station toinplant generation) and many involve a basictechnology change as well (e.g., steam turbinesto diesels), combining the production of bothelectric and thermal energy in one unit createsa substantial energy savings by itself. For exam-ple, using a diesel cogenerator in place of a dieselelectric generator and an oil-fired furnace canreduce total fuel use by at least 25 percent ifthree-quarters of the potentially usable heat can
Table 48.–Effect of Cogeneration Characteristics on Air Quality
Effect on air qualityTechnological characteristic Direct physical effect (positive or negative)
1. Increased efficiency Reduction in fuel burned Positive2. Change in scale (usually Change in pollution control Negative for electrica
smaller for electric generation, requirements (stringency Positive for heatat times larger for heat/steam increases with scale)production) Change in stack height and Negative for electric
plume rise (increases with Positive for heatscale)
Changes in design, combustion Mixedcontrol
3. Changes in fuel combustion Changes in emissions Mixedtechnology production, required controls,
types of pollutants, physicalexhaust parameters
4. Change of fuels Change in emissions Mixedproduction, type ofpollutants
5. Change of location (most often Change in emissions density Mixedfor electric generation) and distribution—electric
power more distributed, heat/steam may become morecentralized
aThe air quallty effect of replacing the electric power component of the conventional system with the electric componentof the cogeneratlon ayetem is negative.
SOURCE: OffIce of Technology Assessment.

Ch. 6—Impacts of Cogeneration .223
be recovered* (11). Similar savings can beachieved by using a gas turbine cogenerator inplace of a gas turbine electric generator and aseparate furnace. Substitution of a steam electriccogenerator for a steam electric generator andseparate low-pressure steam boiler can reducefuel use by 15 percent (42).
Such substitutions may lead to substantial re-ductions in total emissions because they eliminateemissions from the heat source. For example, adiesel cogenerator could reduce sulfur oxide(SOX) emissions by about 0.1 Ib for every 100 kilo-watthours (kWh) of electricity it generated, bydisplacing oil heat using 0.2 percent sulfur dis-tillate oil. Similarly, a gas turbine cogeneratorcould reduce nitrogen oxide (NOX) emissionsfrom a displaced oil-fired industrial boiler by 0.3lb/loo kWh (see app. B for emissions informa-tion). In some cases, however, fuel used–andthus emissions generated—by the cogenerator toproduce thermal energy and electricity may begreater than for electricity generation alone, andtheoretically total emissions could increase if theseparate thermal system that is displaced werea particularly clean one. A coal or residual oil-fired steam turbine that was used for both elec-tricity and space or process heat, for example,would add to total SOX emissions if it replaceda similarly fueled electric generator and a separateheat system that used gas or low sulfur distillateoil.
Aside from any benefits attained by reducingemissions at the fuel combustion source, thecogenerator should be credited with environmen-tal benefits from the remainder of the fuel cycle—i.e., the benefits of extracting, refining, andtransporting less fuel. For example, reducing theuse of oil for heating is most likely to reduce theimpacts of importing and refining crude oil andtransporting the refined product from refinery tomarket area. These impacts include spills of thecrude and refined product and a number of pollu-tion problems generally associated with refineries.These benefits must be balanced by any negativeeffects related to increased fuel transportation re-quirements for multiple cogeneration units.
● The reduction is 27 percent assuming a heat rate for the dieselof 10,700 Btu/kWh, potentially recoverable heat of 4,300 Btu/kWh,furnace efficiency of 80 percent.
Quantification of these costs and benefits is notattempted in this report, but it is important notto forget that they exist. In fact, as the more ac-cessible fuel reserves become exhausted and ex-traction becomes more difficult and potentiallymore damaging, the magnitude of the potentialbenefits will grow.
Different Technology and FuelAlthough the alternative to a cogeneration sys-
tem can be the identical electricity generatingtechnology (without heat recovery) with a sep-arate thermal energy source (boiler or furnace),often a cogeneration system replaces a complete-ly different (usually large-scale centralized) elec-tric generation technology. A common exampleis a cogenerator with diesel or gas turbine tech-nology being used in place of electricity suppliedby a central oil- or coal-fired steam or nuclearsteam generating plant. Also, the smaller cogen-eration systems typically use cleaner fuels (dis-tillate oil or natural gas) than central station fossilplants (coal or residual oil). The technological andfuel differences both create sharp differences inemissions rates.
Table 49 displays typical levels of uncontrolledemissions from the three major competing cogen-eration technologies; the steam turbine alsorepresents the technology used in most centralstation powerplants. Although the same fuel isassumed, there are substantial differences inNOX and carbon monoxide (CO) emissions, andsmall differences in particulate and hydrocarbonemissions. The magnitude of uncontrolled SOX
emissions is not technology-dependent becauseessentially 100 percent of the sulfur in the fuelis converted to SOX regardless of the technology.
Table 49.—UncontroIled Emissions of CompetingCombustion Technologies Using the Same
Fuei, in Pounds/MMBtu Fuei input(using 0.2% sulfur distillate oil
N OX Particuiates CO HC SOX
Low-speed dieseia. . 3.48 0.07 0.91 0.10 0.20Gas turblneb. . . . . . . 0.90 0.02 0.04 0.20Steam turbinec. . . . . 0.16 0.01 0.04 0.01 0.20aBased on sales-weighted averages for large-bore dlesels, in Environmental pro-
tection Agency (39).bBased on Environmental Protection Agency (40) and particulate emissions data
from a GE 7821B combustion turbine.cBased on Environmental ProtectIon Agency (38).
SOURCE: Office of Technology Assessment.
224 . Industrial and Commercial Cogeneration
A shift from central station electricity to dieselor gas turbine generation generally will be accom-panied by a substantial increase in NO-X emis-sions. CO emissions also will increase significantlywith diesel generation. As discussed later, how-ever, significant differences in efficiencies andemission rates among diesels and gas turbines ofdifferent sizes, configurations, and manufacturersmake it imperative that considerable caution beused in applying “average” emission factors andefficiencies to analyses of cogeneration impacts.
Aside from their relatively high levels of NOX
and CO emissions compared to alternative com-bustion technologies, diesel cogenerators face theadditional problem of producing particulate emis-sions that appear to have a possibility of causingadverse health effects because of their chemicalmakeup. The potential effects of these par-ticulate are discussed below in the section onhealth effects.
Diesel and gas turbine cogenerators must usecleaner fuels (primarily distillate oil or natural gas)than those burned in fossil-fueled powerplants(generally coal or residual oil), yielding emissionbenefits to the cogenerators. * Natural gas, for ex-ample, contains virtually no sulfur, and distillateoil may contain only 0.1 or 0.2 percent sulfurcompared with more typical 1 percent sulfurresidual oil and 1 to 5 percent sulfur coal; SOX
emissions are roughly proportional to thesepercentages. Although scrubbers will be used onnewer utility powerplants, substantial differencesamong technologies in expected SOX emissionswill remain.
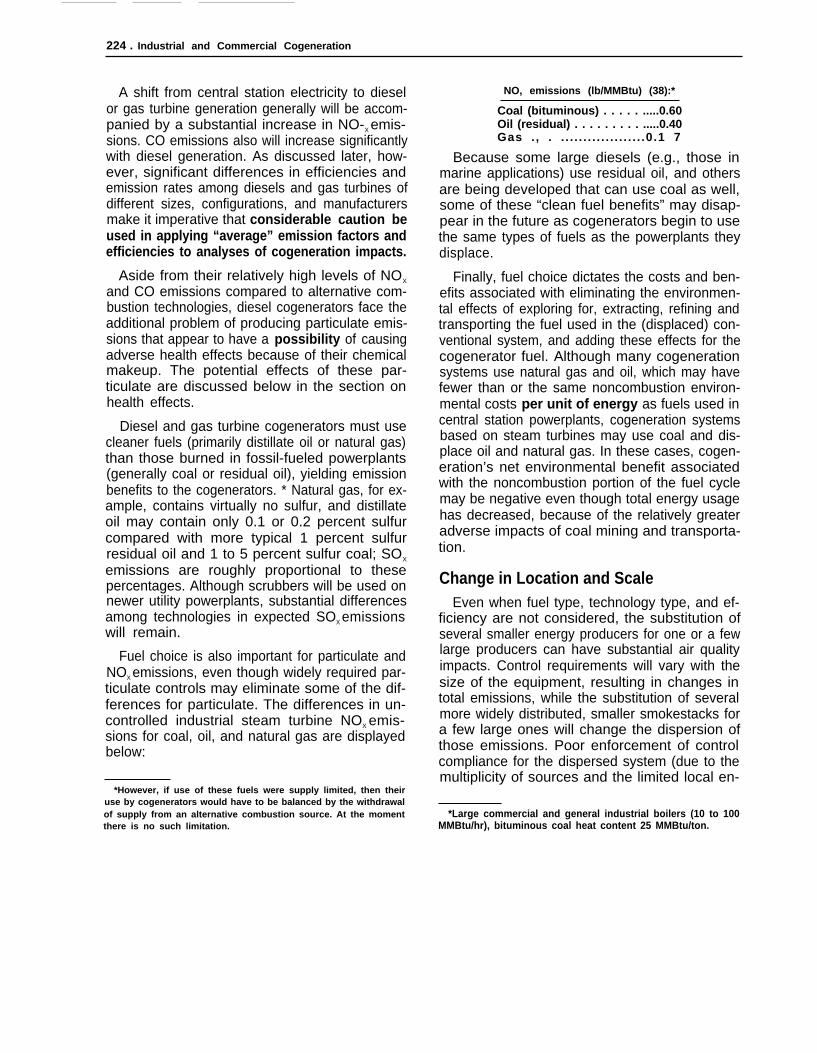
Fuel choice is also important for particulate andNOX emissions, even though widely required par-ticulate controls may eliminate some of the dif-ferences for particulate. The differences in un-controlled industrial steam turbine NOX emis-sions for coal, oil, and natural gas are displayedbelow:
*However, if use of these fuels were supply limited, then theiruse by cogenerators would have to be balanced by the withdrawalof supply from an alternative combustion source. At the momentthere is no such limitation.
NO, emissions (lb/MMBtu) (38):*
Coal (bituminous) . . . . . .....0.60Oil (residual) . . . . . . . . . .....0.40Gas . , . . . . . . . . . . . . . . . . . . . .0.1 7
Because some large diesels (e.g., those inmarine applications) use residual oil, and othersare being developed that can use coal as well,some of these “clean fuel benefits” may disap-pear in the future as cogenerators begin to usethe same types of fuels as the powerplants theydisplace.
Finally, fuel choice dictates the costs and ben-efits associated with eliminating the environmen-tal effects of exploring for, extracting, refining andtransporting the fuel used in the (displaced) con-ventional system, and adding these effects for thecogenerator fuel. Although many cogenerationsystems use natural gas and oil, which may havefewer than or the same noncombustion environ-mental costs per unit of energy as fuels used incentral station powerplants, cogeneration systemsbased on steam turbines may use coal and dis-place oil and natural gas. In these cases, cogen-eration’s net environmental benefit associatedwith the noncombustion portion of the fuel cyclemay be negative even though total energy usagehas decreased, because of the relatively greateradverse impacts of coal mining and transporta-tion.
Change in Location and ScaleEven when fuel type, technology type, and ef-
ficiency are not considered, the substitution ofseveral smaller energy producers for one or a fewlarge producers can have substantial air qualityimpacts. Control requirements will vary with thesize of the equipment, resulting in changes intotal emissions, while the substitution of severalmore widely distributed, smaller smokestacks fora few large ones will change the dispersion ofthose emissions. Poor enforcement of controlcompliance for the dispersed system (due to themultiplicity of sources and the limited local en-
*Large commercial and general industrial boilers (10 to 100MMBtu/hr), bituminous coal heat content 25 MMBtu/ton.

Ch. 6—Impacts of Cogeneration . 225
forcement capabilities of regulatory agencies) alsomay affect air quality. Of course, to the extentthat the cogenerators may represent a centraliza-tion of heat production (e.g., in a total energysystem for an apartment complex that replacesmultiple small heating units), these effects maybe reversed.
In general, control requirements for energy pro-duction technology become more stringent assize increases. Many cogenerators will be con-trolled less stringently than utility generators usingthe same combustion technologies, but con-trolled more strictly than small heating systems.Examples of the effect of size on control require-ments for each cogenerator technology are:
New steam generators and steam turbinesmust comply with Federal New Source Perform-ance Standards (NSPS) only if they are larger than250 million Btu per hour (MMBtu/hr) fuel input(45). * Smaller units are subject only to local andState rules, some of which may not be so strin-gent. Furthermore, generators larger than thiscutoff are subject to different emission limitsdepending on whether or not they are utility-operated. New utility-operated steam generatorsmust achieve 90 percent SOX control for oil andfor medium to high sulfur coal, and 70 percentfor low sulfur coal, with an upper limit of 1.2lb/MMBtu input. In addition, they are restrictedto 0.03 lb of particulate per million Btu input.in contrast, new large steam generators used asindustrial cogenerators need achieve only 1.2 lbof SOX per million Btu input and 0.10 lb of par-ticulate per million Btu input.
New gas turbines with fuel rates greater thanabout 100 MMBtu/hr must achieve 75 ppm NOX
(about 70-percent reduction from uncontrolledlevels) under Federal NSPS, whereas turbines inthe 10 to 100 MMBtu/hr range need reach only1 so ppm (40-percent reduction) (46). The iatterstandard does not go into effect until about 1983.Gas turbines smaller than 10 MMBtu/hr are sub-ject only to State and local regulations (if any),although gas turbines in this size range current-ly do not appear to be a likely technologicalchoice for cogeneration applications.
*Equivalent to about 200,000 lb of steam per hour or 25 MWof electrical capacity.
Thus, it appears that new gas turbine cogen-erators will have either emission standards equalto those of large utility gas turbines or, for thesmaller units, half as stringent. Future im-provements in the efficiency and economics ofvery small gas turbines conceivably might lead,however, to turbine cogenerators below theNSPS cutoff and thus only subject to local emis-sion standards.
Stationary diesels currently are not regulatedat the Federal level. The Environmental Protec-tion Agency (EPA) has proposed new source per-formance standards for stationary diesels above560 cubic inch displacement per cylinder, whichessentially includes most low- and medium-speeddiesels (less than 1,000 rpm) (39). In the absenceof the NSPS, it appears likely that most cogener-ators would fall in this size range. However, itis unclear whether the incentive of potential es-cape from controls might lead, upon the promul-gation of a Federal emission standard, to deploy-ment of smaller displacement diesel cogenera-tors. In fact, incentives to purchase such smallerdisplacement diesels may precede a Federalstandard; at least one EPA regional office isreported to be requiring control to the proposedNSPS level even without the benefit of a formalstandard (8).
Small cogenerators could escape the effect ofadditional emission limitations (beyond the Fed-eral NSPS) in nonattainment and prevention ofsignificant deterioration (PSD) areas (see ch. 3).These limitations are triggered by annual emis-sions of either 100 tons per year (tpy) (steam tur-bine) or 250 tpy (diesel and gas turbine) of anycriteria* pollutant (44). For example, a 1-MWdiesel achieving the proposed NSPS NOX level(600 ppm or about 2.20 lb/MMBtu) (2,39) wouldemit a maximum of 96 tpy of NOX even if it rancontinuously at full load. Thus, it could avoid thenonattainment or PSD requirements, whereas alarge utility plant could not.
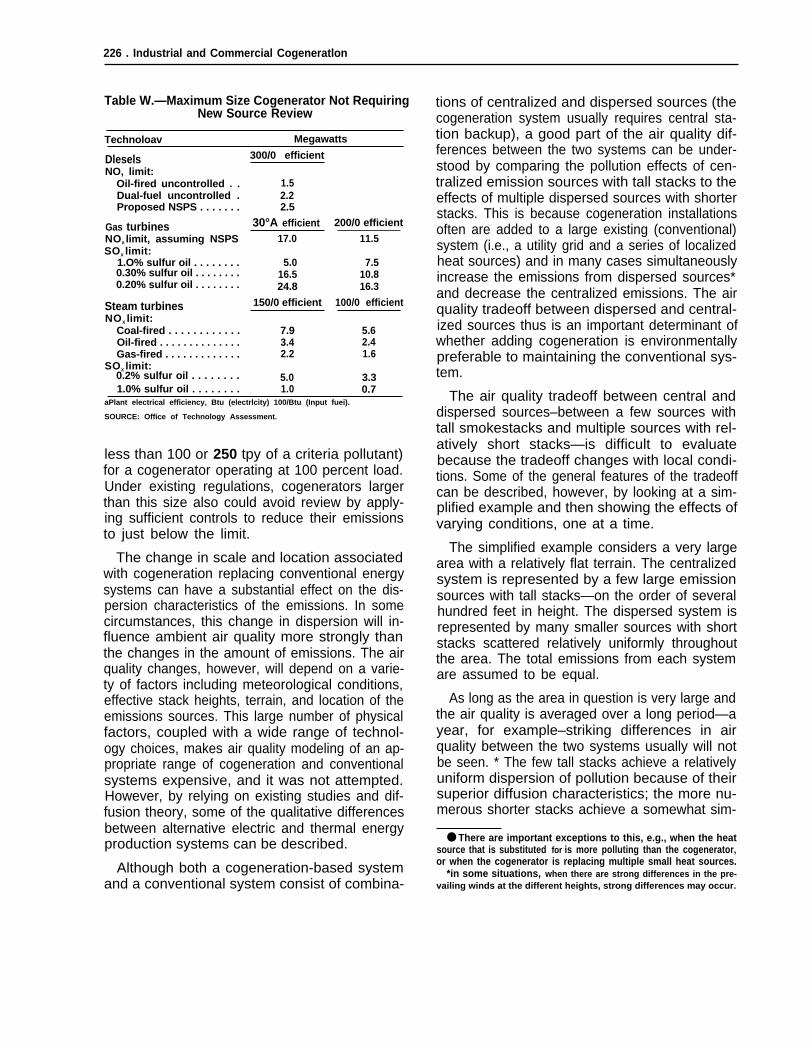
Table 50 indicates the size limit necessary toavoid a nonattainment or PSD review (i.e., to emit
*A “criteria” pollutant is one that is regulated under the CleanAir Act by a National Ambient Air Quality Standard. Current criteriapollutants are sulfur oxides, particulate matter, nitrogen dioxide,hydrocarbons, photochemical oxidants, carbon monoxide, andlead.
226 . Industrial and Commercial Cogeneratlon
Table W.—Maximum Size Cogenerator Not RequiringNew Source Review
Technoloav Megawatts
Dlesels 300/0 efficient
NO, limit:Oil-fired uncontrolled . . 1.5Dual-fuel uncontrolled . 2.2Proposed NSPS . . . . . . . 2.5
Gas turbines 30°A efficient
NOX limit, assuming NSPS 17.0SOX limit:
1.O% sulfur oil . . . . . . . . 5.00.30% sulfur oil . . . . . . . . 16.50.20% sulfur oil . . . . . . . . 24.8
Steam turbines 150/0 efficient
NOX limit:Coal-fired . . . . . . . . . . . . 7.9Oil-fired . . . . . . . . . . . . . . 3.4Gas-fired . . . . . . . . . . . . . 2.2
SOX limit:0.2% sulfur oil . . . . . . . . 5.01.0% sulfur oil . . . . . . . . 1.0
200/0 efficient
11.5
7.510.816.3
100/0 efficient
5.62.41.6
3.30.7
aPlant electrical efficiency, Btu (electrlcity) 100/Btu (Input fuei).
SOURCE: Office of Technology Assessment.
less than 100 or 250 tpy of a criteria pollutant)for a cogenerator operating at 100 percent load.Under existing regulations, cogenerators largerthan this size also could avoid review by apply-ing sufficient controls to reduce their emissionsto just below the limit.
The change in scale and location associatedwith cogeneration replacing conventional energysystems can have a substantial effect on the dis-persion characteristics of the emissions. In somecircumstances, this change in dispersion will in-fluence ambient air quality more strongly thanthe changes in the amount of emissions. The airquality changes, however, will depend on a varie-ty of factors including meteorological conditions,effective stack heights, terrain, and location of theemissions sources. This large number of physicalfactors, coupled with a wide range of technol-ogy choices, makes air quality modeling of an ap-propriate range of cogeneration and conventionalsystems expensive, and it was not attempted.However, by relying on existing studies and dif-fusion theory, some of the qualitative differencesbetween alternative electric and thermal energyproduction systems can be described.
Although both a cogeneration-based systemand a conventional system consist of combina-
tions of centralized and dispersed sources (thecogeneration system usually requires central sta-tion backup), a good part of the air quality dif-ferences between the two systems can be under-stood by comparing the pollution effects of cen-tralized emission sources with tall stacks to theeffects of multiple dispersed sources with shorterstacks. This is because cogeneration installationsoften are added to a large existing (conventional)system (i.e., a utility grid and a series of localizedheat sources) and in many cases simultaneouslyincrease the emissions from dispersed sources*and decrease the centralized emissions. The airquality tradeoff between dispersed and central-ized sources thus is an important determinant ofwhether adding cogeneration is environmentallypreferable to maintaining the conventional sys-tem.
The air quality tradeoff between central anddispersed sources–between a few sources withtall smokestacks and multiple sources with rel-atively short stacks—is difficult to evaluatebecause the tradeoff changes with local condi-tions. Some of the general features of the tradeoffcan be described, however, by looking at a sim-plified example and then showing the effects ofvarying conditions, one at a time.
The simplified example considers a very largearea with a relatively flat terrain. The centralizedsystem is represented by a few large emissionsources with tall stacks—on the order of severalhundred feet in height. The dispersed system isrepresented by many smaller sources with shortstacks scattered relatively uniformly throughoutthe area. The total emissions from each systemare assumed to be equal.
As long as the area in question is very large andthe air quality is averaged over a long period—ayear, for example–striking differences in airquality between the two systems usually will notbe seen. * The few tall stacks achieve a relativelyuniform dispersion of pollution because of theirsuperior diffusion characteristics; the more nu-merous shorter stacks achieve a somewhat sim-
● There are important exceptions to this, e.g., when the heatsource that is substituted for is more polluting than the cogenerator,or when the cogenerator is replacing multiple small heat sources.
*in some situations, when there are strong differences in the pre-vailing winds at the different heights, strong differences may occur.

Ch. 6—impacts of Cogeneration ● 227
Photo credit: Environmental Protection Agency
Photo credit Department of Housing and Urban Development
The substitution of multiple small cogenerators in urban areas in place of centrally located powerplants involves shifts inlocation, stack height, magnitude, and type of air emissions and can have significant impacts on air quality

228 ● Industrial and Commercial Cogeneration
ilar effect (albeit with many small peaks andvalleys in pollutant concentration levels) becausethey are spread out.
The actual characteristics of the choice facinga decision maker usually are quite different fromthis idealized case. Often, the short stacks—thecogenerators—are clustered within a relativelysmall area rather than being widely scattered.Short-term meteorological conditions may disruptthe smooth dispersion of pollutants from tall andshort stacks in drastically different ways. Whenthe cogenerators are located in urban areas, theirproximity to other buildings may affect emissionsdispersion. And sometimes the tall stacks–thecentral power stations—are located in a differentarea from the cogenerators. Each of these con-ditions affects air quality and must be consideredin examining the tradeoff between cogeneratorsand conventional central utility systems.
Clustering of the small sources within an urbanarea makes the dispersion characteristics of a tallstack in the same area superior to those of thesmall stacks. This is because the effective area ofdispersion of a tall stack is very large, whereasthe clustering of small sources has defeated theirpotential for geographically based dispersion.Thus, a series of emission sources with relativelyshort stacks—such as cogenerators—located in arelatively small area will have a considerablygreater impact on local (average annual) air quali-ty than a single source with a tall stack locatedin the same area.
However, if the tall stack is located some dis-tance from the cluster of short stacks, the airquality of areas at a distance from the cluster ofsmall sources may show some improvement asa result of reducing emissions from the tall stack.In situations where the problems associated withlong-distance transport of air pollution (e.g., acidrain) are considered to be more important thanexisting local air pollution problems, a switch toshort stacks may be viewed as beneficial to over-all air quality.
Short-term meteorological conditions maysubstantially change dispersion characteristicsand alter the air quality tradeoffs between shortand tall stacks. Under inversion conditions, whenhigh levels of pollutant concentrations can result
from sources under the inversion layer, thebuoyant plume from a tall stack may be able topunch through the inversion layer and, conse-quently, have minimal impact on local air quali-ty. Emissions from lower stacks, on the otherhand, are trapped beneath the layer and arepoorly dispersed. During other conditions,plumes from either tall or short stacks may beforced to ground level (“fumigation”). Underfumigating conditions, the concentration peaksfrom the few large sources with tall stacks canbe considerably larger than the concentrationspossible with a series of dispersed, smallersources with low stacks. Fumigation conditionsinclude the breakup of a night-time inversion, cer-tain kinds of shoreline wind conditions, and ther-mal instability causing looping plumes. Moun-tainous terrain can also cause powerplant plumesto touch down. Other conditions, such as thetrapping of emissions beneath elevated inver-sions, may also diminish the dispersion advan-tages of tall stacks.
Careful siting of cogenerators can be criticalin urban situations because the unique terrainconditions can adversely affect dispersion ofemissions. Plumes from cogenerator stacks maybe caught in aerodynamic downwashes causedby the action of wind around neighboring build-ings (or, in some cases, around the stack itself)and cause high pollutant concentrations in theimmediate area of the stack. In addition, theplume may impinge on surrounding buildings,especially if they are taller than the stack or fair-ly close to it.
Pollutant concentrations caused by this “urbanmeteorology” may be much higher—perhaps byan order of magnitude or more—than predictedby models assuming unobstructed dispersion. Forexample, a calculation of the effect of downwashcaused by airflow around a small building hous-ing a diesel cogenerator showed an increasein maximum ground level concentrations of NOX
from 400 micrograms per cubic meter ( ug/m3)(no downwash, 10 m stack) to 6,000 ug/m3(downwash) (5). Concentrations may be stillhigher on the faces and roofs of surroundingbuildings. Because roof areas may be used asrecreation areas or for fresh-air intake, and build-ing faces may have open windows, downwashproblems must be taken extremely seriously.

Ch 6—Impacts of Cogeneration ● 229
Aerodynamic problems from the cogenerator’sbuilding or from surrounding buildings of similarheight can be eliminated by the simple expedientof increasing the stack height. Unless surround-ing buildings are close and their height is con-siderably taller than the stack, the stack heightlevels needed either to avoid any effects or toavoid the worst downwash effects usually are notso high as to render the system infeasible. For ex-ample, for a 7 m high building with no problemsfrom surrounding buildings, stack heights thatavoid all building interaction effects are on theorder of 10 to 14 m above the roofline if the build-ing is of moderate horizontal dimensions. A 6 mstack might be tall enough to avoid the worstdownwash effects (5). The presence of nearbybuildings of similar height adds to the downwashproblem, but the additional stack height neces-sary to avoid problems is not great; for 9 m highbuildings, only 3 m would have to be added tothe stack (5). If the surrounding buildings aremuch taller than the cogenerator’s building andcloser than about three times their height, how-ever, then the cogenerator can only free itself oftheir adverse aerodynamic influence by raisingits stack above their height (5). The economic andesthetic effects of this requirement will be quitehigh in some cases.
Finally, in cases where an area’s electricity isimported from distant powerplants, the tradeoffbetween short stack cogenerators and centralpowerplants with tall stacks is complicated: theemissions from each alternative affect differentareas that may have different meteorological con-ditions, background air quality, and other factorsthat determine pollution impacts. Also, becausea utility often can choose among a variety of sup-ply alternatives, including different types ofpowerplants within its airshed (possibly using dif-ferent fuels or maintaining different levels ofpollution control) and long-distance power im-ports, the air quality tradeoff becomes still morecomplex and is difficult to evaluate properly.
One factor in this tradeoff is fairly consistent,however. New powerplants generally are locatedfar from densely populated urban areas, whereascogenerators serving urban areas are locatedthere. Thus, peak pollutant concentrationscaused by short-term unfavorable meteorological
conditions generally fall outside of the urbanareas for powerplants and inside these areas forcogenerators. Consequently, the actual popula-tion exposure due to the cogenerators may behigher than the exposure caused by the power-plant even during conditions when the cogen-erator-related concentrations are much lowerthan the concentrations associated with thepowerplant. These differences may have impor-tant implications for the health effects of alter-native centralized and decentralized systems,although there are other effects (such as ecolog-ical damage) for which the above differences areeither unimportant or imply higher costs from thepowerplants.
Emissions Balances: Cogeneration v.Separate Heat and Electricity
Computing the air quality effects of any tech-nological change is always made difficult by thecomplexity, expense, and inaccuracy of air quali-ty modeling. In the case of cogeneration, thiscomputation is further complicated by difficultiesin determining the emissions changes occurringin the central utility system and by substantialvariability in the emissions factors to be appliedto the cogenerators.
The response of the utility system to an increasein cogenerated power—a critical parameter in de-termining not only emissions impact but also oilsavings (or Ioss)—is difficult to predict. The addi-tion of significant levels of cogenerated power toa utility’s service area will affect both its currentoperations and future expansion. If the cogen-erated power represents a displacement of cur-rent electricity demand in the service area (i.e.,with retrofit of an existing facility for cogenera-tion), the utility will either reduce its own elec-tricity production or reduce power imports, withits decision based on costs, contractual obliga-tions or, perhaps, politics. It may also move upthe retirement date for an older powerplant orcancel planned capacity additions in response tocogenerators’ displacement of either current oranticipated future demand. Because most uti{itygrids draw on a mix of nuclear-, coal-, and oil-fired steam electric generators for base and in-termediate loads, and oil- or natural gas-fired tur-

230 . Industrial and Commercial Cogeneration
bines for peaking capacity (as well as hydroelec-tric and natural gas-fired steam electric plants insome parts of the country); because these plantsmay be scattered over a wide area; and becausecontrol systems for the fossil plants may varydrastically in effectiveness, the pollution implica-tions of the response of the utility system to co-generation are highly variable.
Aside from problems in computing the utilitysystem impacts, a variety of factors create ana-lytical difficulties in calculating the emissions like-ly to be produced by a cogenerator. For exam-ple, the potential variability in organic nitrogenand sulfur content of future fuel supplies for gasand steam turbines and diesels may have substan-tial impacts on the level of NOX and SOX emis-sions unless appropriate controls are applied tocompensate for fuel quality. Differences in thespecific design and duty cycle of cogeneratorsalso may create substantial variability in emissionsfrom engines of the same size and technology.CO and unburned hydrocarbon emissions fromdiesels depend on injection pressure (range:several hundred to 20,000 psi, though not for thesame size engine), engine speeds, use of a pre-combustion chamber, and other factors. NOX
emissions depend on combustion and postcom-bustion temperatures, which can vary substan-tially in diesels and gas turbines. Emissions of allthree of the above pollutants depend on load,which can vary from application to application.Data from EPA and other sources show that un-controlled diesel hydrocarbon emissions can va~by a factor of 29 (0.1 to 2.9 grams/horsepower/hour (g/hph)), CO emissions by a factor of 49 (0.3to 14.6 g/hph), and NOX emissions by a factor ofeight (2.1 to 17.1 g/hph) (39). Although controlsrequired by uniform emission standards shouldreduce this variability, it is likely that even con-trolled emission rates will vary substantially fromone installation to another, because controls areunlikely to be “fine-tuned” to account for varia-tions in fuels and operating procedures, and be-cause different manufacturers will choose dif-ferent margins of safety and control techniquesto ensure compliance.
OTA calculated the emissions impact–both atthe cogenerator site and over a larger area en-compassing the cogenerator site and the entire
utility grid—for a variety of situations where acogenerator replaces or substitutes for a moreconventional electricity and heat supply option(e.g., central station power plus onsite boiler).The results are shown in table 51. The substan-tial number of combinations of: 1) cogeneratortype and fuel, 2) central power station type andfuel, and 3) local heating type and fuel that areanalyzed, and the normalization of the calcula-tions to 100 kWh of electricity generation aredesigned to compensate in part for the site-spe-cific variability of cogeneration installations dis-cussed above. Emissions data for each of the sep-arate modules are given in appendix B, and thesedata may be readily used to compute additionalcombinations. Unfortunately, the variability inemissions factors caused by design and operatingvariations is not accounted for in table 51.
A key conclusion that can be drawn from table51 is that substituting cogeneration for more con-ventional systems will not result in automaticpollution gains or losses despite the increased ef-ficiency. If the variability not accounted for in thetable is further considered (e.g., alternative fuelcompositions, or the considerable range of emis-sions factors possible within a cogenerator tech-nology type), the potential for achieving a widerange of positive and negative emissions effectsby varying the precise cogeneration system de-sign becomes even more readily apparent.
Diesel cogeneration may be an important ex-ception to this conclusion. Diesel cogeneratorswill tend to cause a strong increase in NOX bothat the cogeneration site and in the overall regionalbalance (utility plant reduction included), main-ly because diesels are very high emitters of NOX.Although CO emissions increase by about thesame order of magnitude as NOX, the CO in-creases are far less significant because the toxiceffects of NOX occur at concentrations that areat least 10 times lower than the levels at whichCO becomes toxic.
The actual effect of diesel cogenerators onemissions and air quality will depend on thedegree of attention paid to environmental con-trol. If minimum NOX emissions were judged tobe of critical importance in a series of cogenera-tion installations in an area, appropriate selection

Ch. 6—Impacts of Cogeneration . 231
Table 51.—Selected Emissions Balances for Cogeneration Displacing Centrai PowerPius Locai Heat Sourcese (normalized to 100 kWh)
Net emissions (lb) Net emissions at cogeneratlon site (lb)
Cogenerator Replaces Central power PIUS Heat NOX Partlculates CO HC SOX NO X Partlculates CO HC SOX
Diesel (011) New coal plant Domestic gas +2.84 +0.04 + 0 . 6 5 + 0 . 0 9 – 1 . 1 2 + 3 . 3 9 +0.07 +0.90 +0.10 +0.20Older oil-fired plant Domestic oil +2.69 –0.01 + 0 . 8 8 + 0 . 0 8 – 0 . 9 3 + 3 . 3 7 +0.06 +0.89 +0.10 +0.12Existing gas turbine
(oil) peaking unit Domestic 0il +2.36 +0.02 +0.77 +0.06 +0.09 +3.37 +0.06 +0.89 +0.10 +0.12
Note: Proposed diesel NSPS subtracts 1.2 lb NOx/100 kllowatthours
SIgnlflcant changes from above:Diesel (90 percent gas, 1) 0.77 lb/100 kWh more HC
10 percent oil) Any combinations 2) 0.94 Ib/1OO kWh leas NOX
Gas turbine (NSPS) (gas) Older coal-fired plant Domestic oil –0.39 –0.29 + 0 . 0 9 + 0 . 0 3 – 4 . 5 2 + 0 . 3 0 +0.02011-fired Industrial
+0.13 +0.04 –0.14
boiler –0.80 –0.40 +0.09 +0.03 –5.17 +0.09 –0.09 +0.13 +0.04 –0.79Older oil-fired plant Coal-fired
Industrial boiler –0.84 –0.40 + 0 . 0 5 + 0 . 0 1 - 3 . 2 7 - 0 . 0 4 -0.35New coal plant
+0.09 +0.02 –2.18Gas-fired
Industrial boiler –0.28 –0.01 +0.10 +0.04 –1.31 +0.27 +0.02 +0.14 +0.05 +0.01
Note: Removing gas turbine NSPS adds 0.4 lb NOx/lOO kilowatthours
Gas turbine (NSPS) (oil) Older oil-fired plant Oil-fired Industrlalboiler –0.61 –0.09 –0.03 +0.03 –1.65 + 0 . 0 9 –0.04 +0.01 +0.04 –0.60
Older natural gas- Gas-firedfired plant Industrial boiler –0.40 +0.06 o +0.01 +0.20 +0.27 +0.07 +0.02 +0.05 +0.20
Note: removing gas turbine NSPS adds 0.8 lb NOx/100 kllowatthours
Steam turbine, coal fired Older oll-flred plant NSPS steamboiler, coal –0.38 –0.01 –0.02 o –0.49 +0.32 +0.04 +0.02 +0.01 +0.56
Older natural gas- NSPS steamfired plant boiler, coal –0.35 +0.03 o –0.03 +0.56 +0.32 +0.04 +0.02 +0.01 +0.56
Nuclear plant NSPS steamboiler, coal +0.32 +0.04 +0.02 +0.01 +0.56 +0.32 +0.04 +0.02 +0.01 +0.56
Older oil-fired plant Oil-fired Industrialboi ler +0.38 –0.13 o 0 - 0 . 1 1 + 1 . 0 8 -0.06 +0.04 +0.01 +0.94
Older oll-firedboiler c –0.37 +0.12 –0.02 –0.01 –0.12 +0.33 +0.17 +0.02 o +0.94
aSee app. A for assumptions on controls and emlsslons rates.b This might represent replaclng a number of oil-fired process heat boilers In an Industrial park with a single coal-fired cogenerator.cEssentially ldentical in (emissions per million Btu) with the older Oil-fired PowerPlant.
SOURCE: Office of Technology Assessment.
of diesel designs and use of controls could loweremissions from the level shown in table 51.
Gas turbine cogenerators do not appear tocause consistently strong changes in emissionseither locally or regionally, except for: 1 ) regionalSOX reductions due to turbines’ clean fuel re-quirements, 2) regional NOX reductions resultingfrom the increased efficiency of the cogenerationsystems, and 3) small NOX increases locally. Theregional NOX reductions would be largely lostand local increases made larger by 0.4 to 0.8lb/100 kWh if NOX controls were no longerrequired.
Finally, coal-fired steam turbine cogeneratorsare likely to create mild increases in NOX andsomewhat larger increases in SOX emissionslocally because of the increased fuel consump-tion at the site. Regional effects are mixed.
An Air Quality Analysis ofUrban Diesel Cogeneration
To our knowledge, there have been few anal-yses of the air quality effects of an areawide in-stallation of cogeneration equipment, and onlyone non hypothetical area—New York City—hasbeen modeled explicitly. Both ConsolidatedEdison (ConEd), the utility serving New York City,and the New York State Public Service Commis-sion staff have conducted dispersion modelingstudies to evaluate the impacts of installing multi-ple cogenerators with a combined electric capaci-ty of as much as 1,000 MW* (14,19,21). Theresults of these studies, which generally show
● The Con Ed analysis is reported in detail in Environmental Re-search and Technology, Inc. (19), and updated and revised inFreudenthal (21). The Public Service Commission analysis is de-
scribed in Domaracki and Sistla (14).
232 ● Industrial and Commercial Cogeneration
adverse effects on air quality, have been widelydisseminated by ConEd, which is opposed tourban cogeneration, and they have become con-troversial. Consequently, they deserve closerexamination.
The most recent study by Con Ed examines theimpact of installing 141 cogenerators in Manhat-tan, displacing 514 MW of ConEd’s capacity aswell as a considerable amount of space heating.In this study, annual nitrogen dioxide (N02) con-centrations in a large part of Manhattan werepredicted to increase by more than 14 pg/ms,with a resulting violation of Federal ambientstandards in this area (21). This most recent ver-sion of ConEd’s analysis corrects two major prob-lems affecting the results of an earlier study ex-amining the impacts of 1,086 MW of cogenera-tion capacity: collocation of multiple emissionsources and location of receptors too close toemission sources (19).
However, evaluation of the most recent Con-Ed analysis should take into account the follow-ing considerations:
1.
2.
The analysis assumes an emission rate of17.3 g/kWh of NOX for the diesels. This ap-pears to be a reasonable value for uncon-trolled oil-fired diesels, but it is substantial-ly higher than the approximately 10 g/kWhproposed for the Federal NSPS. Further-more, diesels that do considerably betterthan the assumed uncontrolled rate areavailable, so that careful selection of manu-facturers and models could yield significantlylower emissions even without adding con-trols. Consequently, the assumed emissionrate is valid only if selection of diesels ismade with no concern about their emissionrate and if manufacturers of diesels make noattempts to reduce emission rates in the nextfew years.The analysis examines only one distributionof sources and does not attempt to find amore acceptable pattern (e.g., by removinga few critical cogenerators). This implicitlyassumes that air quality considerations willplay no role in the siting of cogenerators, andthus that permitting procedures are ineffec-tive. This implicit assumption has been chal-
3.
Ienged by the State Department of PublicService (DPS) (14). DPS notes that mostcogenerators will undergo PSD reviews, andalso that proliferation of cogeneration willresult in an appropriate regulatory responseon the part of the State. DPS believes thatthe present inadequacy of regulations for co-generator siting is the result of the lack ofdevelopment activity. However, there is noguarantee that local reviews, currently con-sidered by some to be inadequate, will besufficiently upgraded in response to a surgein cogeneration activity. In the testimonycited above, the witnesses agreed that noneof the cogeneration sources included in theCon Ed analysis would have been prohibitedunder existing regulations,ConEd has assumed that commercial cogen-erators will be able to use only 50 percentof their recoverable heat (thermal efficien-cy of 52 percent), and residential cogenera-tors will use 75 percent of their recoverableheat (62 percent thermal efficiency). Avail-able studies of cogeneration assume signif-icantly higher thermal efficiencies, which inturn would change the emissions balance ofcogenerator, central power station, and fur-nace or boiler in favor of the cogenerator.As discussed in chapter 5, ConEd’s assump-tions imply no thermal storage and “elec-trical dispatch” —running the cogeneratoronly when sufficient electrical demand ex-ists. With the Public Utility RegulatoryPolicies Act of 1978 (PURPA), cogeneratorsare more likely to operate on “thermal dis-patch” and distribute any excess electricityto the grid. Consequently, their overall effi-ciencies should be higher than what Con Edassumes, with more favorable emissionsbalances.
Despite the inherent inaccuracy of diffusionmodels, especially in urban applications, it seemsprudent to consider the prediction of a generalincrease in NOX concentrations to be roughly ac-curate for the particular situation examined. Thepotential problems in ConEd’s analysis with thecogenerator thermal efficiencies should not dras-tically affect this prediction. The remaining prob-lems with the analysis, however, demand a very

Ch. 6—impacts of Cogeneration 233
careful interpretation: OTA interprets the Con-Ed analysis as showing that any additional de-velopment—including multiple installations ofdiesel cogenerators—that could produce an in-crease in local urban emissions, might create airquality problems if adequate controls were notrequired and if permits were issued withoutcareful consideration of stack height, siting, andother parameters affecting pollutant dispersion.In areas where existing air quality is not substan-tially better than the Federal ambient standards,it appears likely that some permits may have tobe denied to avoid violations of these standards.
Emission Controls
Potential air quality problems like the onesdescribed above can be ameliorated if emissionscan be controlled sufficiently. As noted previous-ly, however, controls will not automatically berequired by law in many situations, especially forsmall cogenerators such as diesels and spark-ignition engines that are not covered by FederalNSPS and may not be subject to State and localregulation. For technologies to which NSPS doapply (e.g., gas turbines) the required level of con-trol may not be as stringent as the local air quali-ty situation might call for, because most State andlocal environmental authorities are reluctant togo beyond the NSPS requirements. This sectiondescribes the available controls for NOX emis-sions from reciprocating internal combustionengines and gas turbines. Emissions from in-dustrial boilers (for steam turbine cogenerators)are not discussed, but EPA is preparing an NSPSbackground document for these emissionssources. *
Reciprocating Internal Combustion Engines
In 1979, EPA proposed an NSPS of 600 partsper million (ppm) NOX corrected to 15 percentoxygen (equivalent to about 7 g/hph or about 2.2lb/MMBtu fuel input) (2) for diesels burning oilor oil/natural gas combinations (39). This is anorder of magnitude higher than emission ratesfrom other combustion sources such as industrialboi!ers or even gas turbines (38). “Typical” un-controlled NOX levels from diesels are 11 g/hph
*A draft has been prepared by the Radian Corp.
(about 3.5 lb/MMBtu) for oil-fired engines and 8g/hph (about 2.5 lb/MMBtu) for dual-fuel engines(39). As noted above, emission levels vary wide-ly among different engine manufacturers andmodels.
Table 52 lists the wide variety of control op-tions available to reduce NOX emissions. In its ef-forts to formulate the internal combustion engineNSPS, EPA concluded that, of the methods shownin table 52, only retarded ignition timing, air-to-fuel ratio changes, decreased manifold air tem-peratures and engine derating were demon-strated to be effective and readily available forlarge engines (39). Exhaust gas recirculation andcombustion chamber modification were consid-ered to require additional development anddurability testing, and the remaining methodswere considered to have serious technical or costproblems, or to be of uncertain effectiveness forthese engines.
The available control techniques do not workidentically on diesel, dual-fuel, and natural gas-fired spark-ignition engines. Table 53 showswhich techniques will achieve emission reduc-tions of 20, 40, and 60 percent for the threeengine types; the table also shows the expectedincreases in fuel consumption with these levelsof emissions reductions. The increased fuel use,combined in some cases with higher mainte-nance costs and capital charges from add-onequipment, can cause significant increases in totalcosts; table 54 shows the increases in total an-nualized costs for different control types andemission reductions applied to diesel engines. ig-nition retard, with or without an air-to-fuel ratiochange, and a combination of air-to-fuel changeand manifold cooling can reduce NOX emissionsby 40 percent with total annualized cost increasesof less than 10 percent. This level of control wasselected by EPA for its proposed NSPS, althoughthe proposal was withdrawn.
More recent information implies that greaterNOX emission reductions than those indicated byEPA may be possible. For example, although EPArejected water induction as a viable control strat-egy because of its potential for corrosion and oilcontamination (39), the use of fuel/water emul-sions or carefully timed direct injection apparent-ly can bypass these problems (15). Control levels

234 ● Industrial and Commercial Cogeneration
Table 52.—Summary of NOX Emission Controi Techniques for Reciprocating IC Engines
BSFCa
Control Princicple of reduction Application Increase comments-limitations-- . . . . -. . .Retard Reduces Desk temperatureInjection (Cl b
Ignition (SI)c
Alr-to-fuel(A/F) Ratiochange
Derating
Increase-speed
Decreased Inlet manifoldair temperature
Exhaust gas recirculation(EGR)
External
Internal:Valve overlap or
retard
Exhaust backpressure
Chamber modlflcationPrecombustion (Cl)Stratified charge (SI)
Water lnduction
Catalytic conversion
by delaying start of com-bustion during the com-ustlon period.
Peak combustion tempera-ture Is reduced by off-stolchiometrlc operation
Reduces cylinder pressuresand temperatures.
Decreases residence timeof gases at elevated tem-perature and pressure.
Reduces peak temperature.
Dllutlon of incoming com-bustion charge with inertgases. Reduce excessoxygen and lower peakcombustion temperature.
Cooling by increased scav-enging, richer trappedair-to-fuel ratio.
Richer trapped air-to-fuelratio.
Combustion In antechamberpermits lean combustionIn main chamber (cylln-der) with less availableoxygen.
Reduces peak combustiontemperature.
Catalytic reduction of NOto N2.
An operational adjustment.Delay cam or Injectionpump timing (Cl); delayignition spark (SI).
An operational adjustment.Increase or decrease tooperate on off-stoichio-metric mixture. Resetthrottle or Increase air rate.
An operational adjustment,limits maximum bmepd
(governor setting).
Operational adjustment ordesign change.
Hardware addltlon to in-crease aftercooling or addaftercoollng (larger heatexchanger, coolant pump).
Hardware addition; plumbingto shunt exhaust to Intake;coollng may be requiredto be effective; controlsto vary rate with load.
Operational hardwaremodification: adjustmentof valve cam tlmlng.
Throttling exhaust flow.
Hardware modification; re-quires different cylinderhead.
Hardware addition: injectwater into inlet manifoldor cylinder dlrectly; effec-tive at water-to-fuel ratio1 (lb H2)/lb fuel).
Hardware addition; catalyticconverter installed In ex-haust plumbing or reduc-ing agent (e.g. ammonia)injected Into exhauststream.
Yes
Yes
Yes
Yes
No
Noe
Yes
Yes
Yes
No
No
Particularly effective with moderateamount of retard; further retardcauses high exhaust temperaturewith possible valve damage and sub-stantial BSFC Increase with smallerNOX reductions per successivedegree of retard.
Particularly effective on gas or dualfuel engines. Lean A/F effective butIlmited by mlsfirlng and poor loadresponse. Rich A/F effective but sub-stantial BSFC, HC, and CO Increase.A/F less effective for diesel-fueledengines.
Substantial Increase In BSFC with addi-tional units required to compensatefor less power. HC and CO emissionincrease also.
Practically equivalent to deratlng be-cause bmep is lowered for given bhprequirements. Compressor applica-tions constrained by vibration con-siderations. Not a feasible techniquefor existing and most new facilities.
Ambient temperatures Iimit maximumreduction. Raw water supply may beunavailable.
Substantial fouling of heat exchangerand flow passages; anticipate in-creased maintenance. May causefouling in turbocharged, aftercooledengine. Substantial Increases In COand smoke emissions. Maximum re-circulation Ilmlted by smoke at nearrated load, partlcularly for naturallyaspirated engines.
Not applicable on natural gas enginedue to potential gas leakage duringshutdown
Limited for turbocharged engines dueto choking of turbocompressor.
5 to 10 percent increase In BSFC overopen-chamber designs. Higher heatloss implies greater cooling capacity.Major design development.
Deposit buildup (requiring deminerali-zatlon); degradation of lube oil,cycling control problems
Catalytic reduction of NO is difficult inoxygen-rich envlronment.-Cost ofcatalyst or reducing agent high.Little research applied to large-boreIC engines.
aBSFC-brake specific fuel consumption.bCompression Ignition.cSpark Ignition.d bmep—brake mean effactlve pressure.e lf EGR rates not excessive.
SOURCE: Environmental Protection Agency, Standards Supporf and Environmental Impact Statement for Stationary Internal Combustion Engines (EPA-450/2.7&125a,draft, July 1979).

Ch. 6—Impacts of Cogeneration ● 235
Table 53.—NOX Control Techniques That Achieve Specific Levels of NOX Reduction
NOX Diesel Dual fuel Natural gasreduction Control (amount) Control (amount) A BSFC,a
‘/0 Control (amount) A BSFC,a ‘/o
20%0 Retard (2° to 4°) o to 4 Retard (2° to 3°) 1 to 3 Retard (4° to 5°) 1 to 4External EGR (7%) o Manifold air coollng 1 Manifold air cooling oDerate (25 to 5070) 3 to 5 External EGR (lO%) 1 External EGR (4%) oAir-to-fuel change (25%) 10 Derate (12 to 25%) O to 8 Derate (5 to 35%) 2 to 6Retard and manifold o to 1 Air-to-fuel changes (5 to IO%) o to 2 Air-to-fuel change (570) 2
air coolingRetard and manifold o to 1
air cooling and air-to-fuelchange
40% Retard (7 to 8°) 4 to 8 Retard (5°) 2 Retard (10°) 2Derate (50%) 14 to 17 Manifold air cooling 1 Derate (10 to 50%) 2 to 24Air-to-fuel change and 3 to 5 Derate (30 to 50%) 2 to 8 Air-to-fuel change (7%) 2
manifold air coolingRetard and air-to-fuel change 3 to 5 Air-to-fuel change (lO%) 2 Retard and manifold 7
air cooling andRetard and manifold cooling 3 air-to-fuel change
6 0 % Retard (16°) 19 to 24 Retard (6°) 2 Derate (10 to 50°/0) 2 to 22Retard and air-to-fuel change 21 Derate (50%) 12 Air-to-fuel change (8 to 12%) 2 to 5
Retard and air-to-fuel change 1 to 3 Retard and manifold air 7cooling and air-to-fuelchange
Table 54.-Costs of Alternative NOX Controls for Diesel Cogenerators (percent Increase In total annualized costs)
NOX control Retard External Air to fuelPercent reduction (R) Derate EGR (A) R + Ma R + M + A R + A A +M
200/0 o-3 9-31 6 8 2 340% 3-6 37-40 4 460% 14-18 16
aManlfold air cooling.
SOURCE: Office of Technology Assessment, from Environmental Protection Agency, Standards Support and Environmental Impact Statement for Stationarv Internal.Combustion Englnes (EPA-450/2-78-125a, draft, July 1979).
- .
of 50 percent or greater have been achieved withthese techniques, with some parallel decreasesin particulate emissions* (43). Another, morespeculative NOX control approach is the use ofcatalytic reduction systems. The staff of theCalifornia Air Resources Board (CARB) reportsthat NOX reductions of 90 to 95 percent can beobtained from such catalytic systems (35). Theyalso expect the systems to reduce CO emissionsby 80 percent and hydrocarbon emissions by 75percent. Catalytic reduction systems are currentlyavailable for rich-burning natural gas spark-ignition engines, and the CARB staff expects them
*Wilson (42) reported that water/fuel emulsion achieved 50 per-cent NOX reduction at full engine load with no fuel penalty. At part-Ioad (66 to 93 percent), NO, reductions of 75 percent wereachieved with a combination of exhaust gas recirculation and water/fuel emulsion.
to be available for the other engine types withina year or so, at costs below 10 percent of totalannualized costs (3). However, this projection isviewed with various degrees of skepticism byother researchers (2).
Combustion TurbinesThe Federal NSPS for large combustion turbines
(above 100 MMBtu/hr) is 75 ppm NOX correctedto 15 percent oxygen, which is equivalent toabout 0.3 lb/MMBtu NOX (40). For comparison,a typical emission factor for NOY emissions froman industrial boiler burning distillate oil is abouthalf as much, or 0.16 lb/MMBtu (38). “Typical”uncontrolled NOX levels from turbines are 0.6lb/MMBtu for natural gas-fired engines and 0.9lb/MMBtu for oil-fired engines (40). However, the

variation in emissions among different turbinedesigns and sizes and even in the same turbineunder different operating conditions is extreme-ly high. Thus, the “typical” values are of limitedusefulness in air quality analyses.
The most widely used emission control systemsfor combustion turbine NOX emissions are so-called “wet” controls, which consist of water orsteam injection into the combustion zone of theturbine. The injected fluid absorbs some of theheat of reaction, reducing peak combustion tem-peratures and, consequently, the rate of NOX for-mation. This control is accepted by the industryand does not have significant adverse side effects.Generally, a water/fuel injection ratio of 1.0 willproduce a 70- to 90-percent reduction in NOX
emissions, with a loss of fuel efficiency of 1 per-cent (40).
This range of control effectiveness, coupledwith the variability in uncontrolled emissionlevels, results in actual controlled emissions thatvary widely. EPA has measured “controlled”NOX emissions of 15 to 50 ppm for gas-fired tur-bines and 25 to 60 ppm for oil-fired turbines (40).This implies that appropriate selection of turbinedesign could allow the use of turbines in certainsituations where an “NSPS” turbine would be un-satisfactory.
Still more stringent control may be available byadding so-called “dry” controls. These are op-erating or design modifications such as exhaustgas recirculation, two-stage combustion, catalyticcombustion, and other types of modifications.NOX reductions of at least 40 percent have beendemonstrated for some dry controls, and thisreduction should be additive to any achievedwith wet controls (40).
Finally, catalytic exhaust gas cleanup systemsachieving NOX reductions of 80 to 90 percenthave been tested (40). Although these systemsdo not appear to be economically competitivewith wet and dry controls, they could be usefulif fuels with high nitrogen content were to be used(otherwise, the only viable control for NOX gen-erated by fuel-bound nitrogen is two-stage com-bustion) (40).
EPA has calculated the net NOX emission con-trol costs using wet controls for a baseload 4,000
hp industrial turbine. For a plant located closeto a water source, the controls cost about 0.6mills/kWh v. a total electricity cost of 32.5mills/kWh, or a 1.75-percent increase (40). Trans-porting water for a turbine located in an aridclimate could add considerably to this cost, how-ever. Considering this and other cost variables,EPA considers the range of potential control coststo achieve the 75 ppm NSPS to be about 1.5 to10.0 percent of the electricity cost for industrialturbines (40).
Health Effects FromCogenerator Emissions
Theoretically, any allowed increases in thedeployment of cogeneration technologies shouldhave no significant adverse effects on humanhealth due to the protection afforded by en-vironmental standards—especially the NationalAmbient Air Quality Standards (NAAQS). Asdiscussed above, however, these standards mightbe violated because of ineffective permit reviewprocesses that miss “micro” (close to the emis-sion source) effects in urban areas or that allowsmall cogenerators to escape careful analysis. Thesmallest cogenerators generally will be diesels,and these may therefore have the highest poten-tial to escape detailed review of monitoring and,possibly, to pose health hazards. Judging fromthe emissions balances displayed in table 53 andfrom other environmental analyses of cogenera-tion, the pollutants of major concern are NOX,sulfur dioxide (S02), and particulates-the latternot because of a high emission rate but becauseof their toxic character.
Due to of a variety of difficulties in measuringthe health effects of pollutants, several of theFederal ambient standards–especially the stand-ard for S02—have been criticized severely. A re-cent review in the Journal of the Air PollutionControl Association (JAPCA) concludes, however,that the standards “seem adequate to protect thehealth of the public” and, “until more data areavailable . . . should not be changed” (20). Onthe other hand, a number of other researchersdisagree, arguing that some of the standards haveproved to be unnecessarily stringent (23). Thehealth and other considerations relevant to eval-

Ch. 6—impacts of Cogeneration . 237
uating the NAAQS for S02, NOX, and par-ticulate are reviewed briefly below.
Sulfur Oxides
The 80 ug/m3 long-term standard for S02 isthe most controversial NAAQS because of thesubstantial expense involved in reducing sulfuremissions and, until recently, the lack of firmevidence of adverse health impacts from S02 ex-posure even at levels several times the currentstandards. Recent experiments, however, havedemonstrated health effects in asthmatics (in-creases in bronchoconstriction) at levels near thecurrent 24-hour standard (36). Also, exposure toS02 virtually always occurs in the presence of par-ticulate and other gases, and generally there isa heightened response from the combination ofpollutants. At levels around the ambient stand-ards (100 ug/m3 S02 and 150 ug/m3 particu-Iates, annual averages), respiratory symptoms, in-cluding general lung function impairments andincreased asthma attacks, have been detected(33).
Nitrogen Oxides
The form of most of the NOX emitted directlyby diesels and other cogenerators is nitrous oxide,or NO; eventually, the NO is transformed byphotochemical oxidation to the far more toxicN02. Because this oxidation takes sometime, thedanger associated with a cogenerator’s plume im-pacting on nearby buildings or the ground is con-siderably lessened.
At levels that maybe experienced in pollutedareas (a few hundred ug/m3), N02 appears to beassociated with lung irritation in asthmatics andsome increases in respiratory illness in the generalpopulation. According to the JAPCA review citedabove, the epidemiologic evidence for the lattereffect is not particularly strong (20). In any case,there seems to be little disagreement that the 100ug/ms (annual average) ambient standard is ade-quate to protect public health. EPA currently isinvestigating the need for a short-term standardto protect against the acute effects of brief pollu-tion episodes. It appears likely that this standardwill be no stricter than about 500 ug/m3 for 1hour.
Diesel Particulate
Aside from their relatively high levels of NOX
and CO emissions compared to alternative com-bustion technologies, diesel cogenerators face theadditional problem of producing particulate emis-sions that may cause adverse health effects. Theseeffects, if they occur, would most likely stem fromtoxic substances such as polycyclic organic ma-terial that adhere to the carbon core of the ex-haust particles. The small size of the particlescomplicates their control, allows them to remainairborne for weeks at a time, and allows deeppenetration into and retention by the lungs.
The National Academy of Sciences recently re-leased a report on diesel exhaust health effectsthat stresses the uncertainties in measuring thepotential for adverse effects of these exhausts,while emphasizing that conclusive evidence ofharm is not available (25). Some of the conclu-sions of the report are:
●
●
●
Although current epidemiologic evaluations(statistical analyses of human populations)are inadequate, the available evidenceshows no excess risk of cancer from dieselexhaust in the populations studied.Organic extracts (in which the potentiallyharmful organic compounds are removed,using a solvent, from the carbon particles towhich they adhere) of diesel particulatehave been shown to be mutagenic and car-cinogenic in animal cell and whole animalskin applications. The mutagenic and car-cinogenic potencies of these organic extractsappear to be similar to those of extracts ofgasoline engine exhaust, roofing tar, or coke-oven effluent.Unlike the extracts, inhaled whole diesel ex-haust has not been shown to be carcinogenicor mutagenic in laboratory animals. A possi-ble reason for this could be that many of thepotentially dangerous compounds may notbe released from the particles and thus maynot become biologically available to causeharm. *
*However, another reason could be that the tissue tests used forthese investigations do not adequately reflect what would actuallygo on inside the body.

238 . Industrial and Commercial Cogeneratlon
● Potentially toxic particles can accumulate inthe lungs when diesel exhaust is inhaled, butlong-term effects are uncertain. In the shortterm, cell damage (mostly reversible) canoccur because the diesel exhaust can ad-versely affect the lungs’ defense and clear-ance mechanisms; it is not clear if this iscaused by the particles or by the gases in theexhaust.
● The design and operating characteristics ofthe engine may be a significant determiningfactor in the carcinogenicity of diesel engineexhaust materials.
Evaluating the potential for harm of diesel par-ticulate from cogenerators is complicated by dif-ferences in operating characteristics between co-generators running at constant speeds and rela-tively stable loads, and mobile sources runningat varying speeds and loads. Mobile sources (fromwhich most of the emission data have been gath-ered) operate at far less optimal combustion con-ditions and produce more particulate matter. Itis not unreasonable to speculate that the humanhealth risk from diesel cogenerators per unit ofenergy input or output may be significantly lowerthan the risk from mobile diesels; however, scien-tific data with which to confirm or deny thisspeculation do not appear to be available.
Effects of Some Other CogenerationTechnology/Fuel Options
Although oil-fired and dual-fuel diesels, oil- andnatural gas-fired combustion turbines, and multi-fuel steam turbines are the most likely cogenera-tion options for the immediate future, other tech-nology or fuel choices will be open to potentialcogenerators.
Spark=lgnition EnginesFiat recently introduced a natural gas-fired
spark-ignition cogenerator—called TOTEM–based on its automobile engines. Because theTOTEM modules are extremely small (15 kw),they may escape careful permitting by localauthorities. Proliferation of such cogenerators inurban areas could conceivably lead to air quali-ty problems.
EPA data indicate that gas-fired spark-ignitionengines have higher NOX emissions than diesels(sales-weighted average of about 4.6 lb/MMBtuv. about 3.5 lb/MMBtu for diesels) (39). On theother hand, Fiat and Brooklyn Union Gas claimNOX rates of about 3 lb/MMBtu as well as extraor-dinarily high thermal efficiencies (91 percent) thatwould maximize the emission displacement ofthe cogenerator (6). Either emission level can pre-sent a problem, however, because the smallTOTEM engines would not be subject to the pro-posed NSPS for stationary internal combustionengines, and even the lower rate is quite high incomparison with competing combustion sources.
Alternate-Fuel DieselsAlthough natural gas/diesel fuel mixtures and
straight diesel fuel are used in stationary dieselstoday, residual fuel currently is used in largemarine diesel engines and will be available forstationary engines. Coal-derived fuels in the formof synthetic oil, coal slurry, and dry powderedcoal may be used in future engines (see ch. 4).
Use of residual oil in diesels should affect SOX
emission levels because residual oil generally hashigher sulfur levels than distillate fuels. Accordingto available data, however, levels of other emis-sions should not be affected significantly in com-parison to current diesels (27). Diesels using coal-derived synthetic residual oil exhibit similar char-acteristics, although synfueis that have not beenhydrotreated will contain levels of fuel-boundnitrogen that are generally higher than those innatural oils and consequently will cause elevatedNOX emissions (24).
The use of coal slurries and powdered fuelsshould adversely affect levels of NOX, SOX, andparticulate. Table 55 shows expected values of
Table 55.-Emissions From Oii- and Coai-Fired Dieseis
Emissions (lb/M MBtu)Fuel NO. so.. ParticulateDiesel Oila . . . . . . . . . . 3.46 0.2c 0.07Coal slurryb . . . . . . . . . 3.61 l .5d 3.26Coalb . . . . . . . . . . . . . . . 4.35 1 .5d 8.91aSource is app. A.bReference 47.cAssumes 0.2% sulfur distillate oil.dAssumes 2% sulfur coal, 25 MMBtu/ton.

Ch. 6—Impacts of Cogeneration ● 239
these fuels compared to average emissions fromoil-fired diesels. The level of particulate emissionsis so high as to virtually guarantee that an uncon-trolled coal-fired engine would be environmen-tally unacceptable. Based on an extrapolationfrom ConEd modeling studies (19), it is possiblethat a proliferation of such diesels in urban areaswould create significant problems with all threepollutants unless emission controls were used.
Atmospheric Fiuidized Bed
Steam turbines using coal-fired atmosphericfluidized bed (AFB) boilers can achieve low SOX
emission rates without generating large amountsof scrubber sludge, and probably will have NOX
emissions below current NSPS for steam turbines.Although the action of the bed creates potentiallyhigh levels of particulate emissions, baghousecontrols should keep actual emissions to ve~ lowlevels. The AFB boiler at Georgetown Universi-ty in Washington, D.C. (which is a potentialcogenerator although it currently does notgenerate electricity) has now been operatingwithout environmental complaints for a fewyears.
Closed-Cycle Gas Turbines
Closed-cycle gas turbines use an external heatsource to produce high-temperature gas. Al-though emissions depend on the nature of theheat source and fuel used, emission controlshould present no unusual problems.
Methanol-Fired Gas TurbinesThere is a reasonable probability that signifi-
cant quantities of methanol from biomass andcoal resources may become available within afew decades. Methanol is a suitable fuel for gasturbines and might be an advantageous fuel inturbine cogenerators because of the expectedsubstantial drop in NOX emissions. Methanol hasachieved 76-percent reductions in NOX emis-sions from large turbines because it has a signifi-
cantly lower combustion temperature than dis-tillate fuels (28).
Policy Options: Removing Environment=Associated Regulatory Impediments
In general, Federal, State, and local authoritiestreat cogenerators in an identical fashion withother stationary combustion sources. For exam-ple, both Federal NSPS and local emission stand-ards for all combustion sources are tied to fuelinput rather than energy output, and thus do notconsider the energy efficiency of the system. Inother words, two diesel generators that use thesame amount of fuel are limited to the same levelsof emissions, even if one produces more usableenergy than the other. Also, facilities are desig-nated as “major sources” subject to PSD andnonattainment review only on the basis of theiremissions output, without consideration of anyemissions reductions their use might cause inother facilities. Finally, new sources locating innonattainment areas are awarded emission off-sets only to the extent that other sources withinthe same locale agree to reduce their emissionspermanently and transfer the pollution rights ob-tained by the reduction to the new source. Thus,cogenerators are not automatically given pre-ferred treatment to account for their increasedefficiency or their displacement of centrallygenerated electricity.
It has been suggested that cogenerators shouldbe given various types of preferred treatment withregard to air quality concerns to facilitate theirmarket entry (12, 16,22). Two basic changes thathave been recommended are:
That emissions standards account for highcogenerator efficiency, either by being tiedto the energy output rather than the fuel in-put of the source, or by having separate(more lenient) standards for cogenerators.That restrictions on new sources under PSDand nonattainment area provisions of theClean Air Act (see ch. 3) be reduced or elimi-nated for cogenerators. For example, the

240 . Industrial and Commercial Cogeneration
250-tpy emissions trigger could be relaxedby allowing the cogenerator to subtract emis-sions that are eliminated at the central powerstation. Only if net emissions exceed the trig-ger levels would the provisions apply. An al-ternate or additional policy would be to shiftthe responsibility for obtaining emissions off-sets to the State, or to allow the cogeneratorto count any reduction in central stationpower generation as an offset.
Each of these policy alternatives is evaluatedbelow.
Emission Standards Based on OutputBecause cogenerators generally produce con-
siderably more useful thermal and electric energythan the same equipment generating only elec-tricity, basing emission standards on energy out-put rather than fuel input would significantlyreduce the emission control requirements for co-generators and should lower their overall costs.Thus, this policy would make cogeneration morecompetitive in the marketplace, although the ex-tent of any advantage will vary substantially fromcase to case.
The major environmental argument for this pol-icy alternative is that, for a given amount of usefulenergy, a cogenerator will produce less pollutionthan a separate generator and thermal energysource and thus should be rewarded for this ben-efit (4,41 ). This argument generally is valid onlywhen a cogenerator would replace an otherwiseidentical generator, using the same technologyand fuel. As discussed above, many cogeneratorapplications involve new technology or fuelsubstitutions (e.g., diesel cogenerators replacingsteam turbines and boilers or furnaces), as wellas changes in scale. As shown in the section onemissions balances, the net result is quite oftenan emissions increase. Furthermore, the pollu-tion impact of most concern often is the local airquality impact, and this may not be improved bythe reduced emissions at a distant powerplant asa result of the addition of cogeneration. Finally,the legislative philosophy associated with NSPSis that all important new stationary sources shouldapply the best control technology available tothem, taking into account energy, economic, and
non-air quality environmental factors. Somepotential cogenerators might try to argue thatthese energy and other considerations justify adifferent interpretation of “best technology” intheir case. Based on the analysis of the environ-mental costs and benefits of cogeneration in thisreport, however, it appears that such an argu-ment would not be valid for all cogenerators.Thus, cogeneration emission standards based onenergy output should only be applied on a case-by-case, or technology- and area-specific basis,if at all.
Changes in Offset Requirements
As shown in table 56, the costs incurred in be-ing designated a “major source” under eitherPSD or nonattainment area provisions are highand will affect the economic attractiveness ofcogeneration (17). In addition to the costs of per-forming the necessary environmental analyses,the added costs of obtaining emissions offsets (ifany are available) and installing lowest achievableemission rate (LAER) controls may effectivelyblock cogenerators (and most other types of sta-tionary sources) from locating in nonattainmentareas. Thus, policies that reduce or eliminate thereview requirements (and, for nonattainmentareas, the offset requirements) for cogeneratorswould be removing important impediments tothese technologies.
The major argument against automatically cred-iting the reduction in central station power re-quirements in applying PSD and nonattainment
Table 56.-Approximate Costs of Procedures RequiredUnder the Clean Air Act
cost toProcedure cogeneratorEngineering review . . . . . . . . . . . . . . . . . . . . . $100-500Stage 1 PSD review (attainment) . . . . . . . . . $1,000-2,000Monitoring—1 year
One pollutant . . . . . . . . . . . . . . . . . . . . . . . . $30,000Six pollutants. . . . . . . . . . . . . . . . . . . . . . . . $125,000
Stage 1 interpretive ruling(nonattainment) . . . . . . . . . . . . . . . . . . . . . . $2,000
TSP/S02 modeling . . . . . . . . . . . . . . . . . . . . . .$10,000-20,000NOTES: Any of these costs may or may not be incurred, depending on the in-
dividual case. These figures assume a simple, “major source” case.
SOURCE: Office of Technology Assessment, from Michael S, Dukakis, Gover-nor’s Commlss\on on Cogeneratlon, Cogeneration: Its Beneflts to NewEngland (Governor of Massachusetts, October 1978).

Ch. 6—impacts of Cogeneration . 241
rules is that the benefit of this reduction to theairshed in question is often either illusory or verydifficult to calculate. As noted previously, the cor-responding emission reduction may be out of theairshed altogether, or the reduced power require-ments may be shifted among different plants atdifferent times according to the utility’s economicdispatch methods and the overall supply/demandbalance of the grid. Also, when the central pow-erplant has a very tall stack, its effect on the airquality of a particular airshed maybe far less, perunit of power, than the effect of cogenerators.Finally, in the case of a large new cogenerator,the “offset” utility emissions may be from a pro-jected powerplant rather than from an existingfacility. Because any future powerplant wouldhave to comply with PSD or nonattainment re-quirements if its emissions affected the airshed,it is not logical that the plant’s replacement or“offset” —the cogenerator—should be freed fromthese requirements.
To summarize, these policy alternatives do ap-pear to be attractive if the primary objective isto promote cogeneration. However, widespreadapplication of regulatory relief to cogeneratorsas a class is difficult to justify on environmentalgrounds. On the other hand, the existence ofsituations where air quality benefits and oil sav-ings will accrue from cogenerators may justifyawarding some relief on a case-by-case or tech-nology- and area-specific basis.
Other Potential Impacts
Although the potential air quality effects are themajor environmental concern associated with co-generation systems, potential impacts from waterdischarges, solid waste disposal, noise, and cool-ing tower drift are important and must be ad-dressed satisfactorily to avoid local opposition tothese cogenerators.
Water Quality
Water discharges are associated primarily withblowdown from boilers and wet cooling systems.Pollutants of concern are suspended solids, salts,chlorine, oil and grease, and chemical corrosioninhibitors. For large coal-fired steam turbinecogenerators, potential discharge sources include
runoff from coal storage piles, scrubber effluentfrom S02 control systems, and discharges fromash quenching. These discharges are the sameas would occur in conventional steam turbinecombustion systems, although any wet coolingsystems clearly would be smaller because muchof the waste heat is captured in a cogeneratorand need not be discharged to the environment.Some of the discharges may present special prob-lems, however, because the cogenerators maybe located in urban areas whose sewage treat-ment facilities are not designed to handle in-dustrial discharges. Onsite pretreatment (beforedischarge into the municipal system) may benecessary to avoid problems from these dis-charges.
Solid Waste Disposal
Disposal of ash and scrubber sludge could alsopresent some difficulties for urban and suburbancoal-fired cogenerators due to the lack of securelandfill areas. Municipal landfills may be inade-quate due to the toxic metals content of the ash,and long-distance and expensive shipping ofthese wastes might be necessary.
Noise
Operating cogenerators and trucks supplyingfuel to cogenerators may produce high noiselevels in urban areas. For example, a recent studyof the Jersey City Total Energy Demonstrationproject, which uses diesel cogeneration, meas-ured sound levels of 65 dB(A) (loud enough tointerfere with a normal conversation) at a distanceof 75 ft from the equipment building (1 3). Thismight be considered unacceptably loud for anight-time noise level in a residential area. Similar-ly, the noise from fuel trucks may be considereddisruptive, although the effect of supplying oil-fueled furnaces and boilers may be as disruptive,if not more so, because furnaces and boilers arelikely to require more frequent fuel deliveries thancogenerators. In any case, noise control measuresare readily available. These include careful sched-uling of fuel deliveries, installing mufflers, or add-ing sound absorbing materials to equipment andbuildings to reduce engine noise.

242 ● Industrial and Commercial Cogeneratlon
Cooling Tower DriftCooling tower drift-the discharge and disper-
sal of small droplets of water from wet coolingtowers—is a potential source of problems inurban areas. These droplets will contain anticor-rosion chemicals and biocides and will have ahigh salt content caused by the concentrating ef-fect of the evaporative cooling. In the Jersey City
quate maintenance of the system led to spottingof nearby automobiles and an annoying mistingof pedestrians (1 3). Although the effects in theJersey City case appear to represent a nuisancerather than a hazard, negative community reac-tion to this as well as other visible adverse effectsof cogenerators may play a significant role in theirfurther deployment.
demonstration project mentioned above, inade-
POTENTIAL REGULATORY BURDEN ON ENVIRONMENTAL AGENCIESCogeneration usually involves shifting environ-
mental impacts-primarily effects on air quality—away from a few central powerplants to a largernumber of small sources. Although cogenerationwill not be subject to as many permitting require-ments as large central generating plants (see ch.3), multiple installations could lead to increasedpermit applications and more sources that mustbe monitored and inspected. In some areas, Stateand local environmental protection agencies maynot have the resources to accommodate such anincrease in their workload. If this is the case,cogenerators could be inadequately monitoredand controlled, and substantial adverse impactscould occur (see discussion of environmental im-pacts, above). *
To determine whether cogeneration would sig-nificantly increase the workload of environmen-tal agencies, OTA first estimated current work-loads and resources of the various Federal andState permitting agencies in two States–Coloradoand California—based on interviews with agen-cy personnel.** Those interviews also revealedcurrent management concerns about existing andfuture caseloads. Then the increased permitting,monitoring, and enforcement responsibilities at-tributable to cogeneration were calculated fromState agency market penetration projections, andcompared to the existing workloads to determinethe potential regulatory burden.
*The analysis in this section is drawn from Energy and ResourceConsultants, Inc. (17)0
**In Colorado, the Department of Natural Resources, the Officeof Energy Conservation, and the Colorado Energy Research Institutewere contacted. In California, the California Energy Commissionand the Cogeneration Task Force were contacted.
The results of this analysis suggest that cogen-eration is likely to have a minimal impact on en-vironmental caseloads in these two States be-cause the increase in agency resources neededto regulate cogeneration is very small when com-pared to existing workloads. Possible exceptionswould be areas where agencies were already un-derstaffed prior to the Federal (and many State’s)budget reductions of 1981 and 1982–usuallywater quality and right-of-way programs, orwhere economic or other legislative incentiveprograms for cogeneration impose significantnew responsibilities on agency staff.
Environmental Permitting andEnforcement Agencies
Four regulatory agencies in Colorado havedirect jurisdiction over cogeneration facilities,while approximately seven others regulate asso-ciated facilities such as transmission and distribu-tion systems.
Permitting and enforcement of the Clean AirAct are shared by the region Vlll offices of EPAand the Air Pollution Control Division of the Col-orado Department of Health. The division admin-istered approximately 400 permits in 1980 andconducted approximately 4,900 inspections. Dis-cussions with agency personnel revealed nomajor enforcement problems in 1980. EPA regionVlll administers the PSD program in Colorado.They processed 40 to 50 permit applications in1980 and they typically conduct oversight inspec-tions of roughly 10 percent of the major sourcesin the State each year.

Ch. 6—Impacts of Cogeneratlon . 243
The water programs are administered by theWater Quality Control Division of the StateDepartment of Health and by the Army Corps ofEngineers. The Water Quality Control Divisionadministers the section 401 and the NationalPollution Discharge Elimination System (NPDES)permits. The section 401 program (primarily ap-plicable in this context to transmission anddistribution systems) had one staff member whoissued 200 water quality certificates in fiscal year1980. The NPDES program also suffers from in-sufficient manpower; almost 300 applications fornew permits or for amendments to existing per-mits were awaiting action at the end of 1980.Time pressures on the staff members are felt toimpair the quality of the reviews for permits be-ing issued, possibly resulting in inadequate con-trols. The Water Quality Control Division initiates30 to 45 enforcement actions per year, but manyviolations by minor sources are ignored due tolack of manpower.
The Army Corps of Engineers administers thesection 404 permits through their district officesin Sacramento and Omaha. The Sacramento Dis-trict maintains an area office in Grand Junction,Colo., with three full-time personnel. In 1980, thisoffice issued approximately 40 applications forsection 404 or section 10 permits in process,50 violations (generally involving unpermittedwork—their biggest problem), and 150 to 175 in-dividual permits (these have a normal term of 3years, with extensions available). They also super-vised approximately so operations under generalpermits.
Applications for rights-of-way in Colorado arehandled by the State Board of Land Commissions,the Bureau of Land Management (BLM), and theU.S. Forest Service. Right-of-way applicationshave been a bottleneck in the permitting process,with application processing lasting up to 1 year.
In summary, the programs concerned withwater quality (sec. 401, sec. 404, NPDES) are atpresent less effective than they might be, duelargely to manpower limitations. Delays in proc-essing right-of-way applications in the district of-fices of BLM and the Forest Service, which inlarge measure reflect manpower limitations,change from year to year and district to district,
reflecting the variability in applications filed andresources at each district. If dispersed facilitiessharply increased the number of right-of-way ap-plications, this permit could become a severe bot-tleneck.
California environmental agencies are sub-divided into numerous regional and district of-fices (see ch. 4). For example, 46 separate airpollution control districts (APCDS) are responsi-ble for administering air permits and each districthas different permitting requirements. As a result,only sampled agency districts or regions that areconsidered representative are discussed ex-plicitly.
The 46 APCDS in California vary from ruralcounties with one full-time employee, to the BayArea and South Coast Air Quality ManagementDistricts with over 200 and 400 full-timeemployees, respectively. The Sacramento CountyAPCD employs two people to permit 150 to 200sources per year. permits require up to 2 monthsto be processed. There are no sources in thedistrict with continuous monitoring, and one ofthree inspectors visits each major source fromtwo to five times per year. Telephone contactswith these and other APCDS revealed no majorenforcement concerns in 1980.
The nine Regional Water Resources ControlBoards administer the waste discharge require-ment program in California. Region 5, head-quartered in Sacramento, has approximately 20personnel to handle all phases of the program.Approximately 150 permits are issued each year,25 percent of which are NPDES permits. Majorsources are inspected twice a year, minor sourcesperhaps once every 3 years, and about 2,000sources maintain self-monitors and reportquarterly to the regional board. Telephone con-tacts with these and several other regional boardsrevealed no major management problems.
California is included in two Corps of EngineersDistricts, Los Angeles and Sacramento. The “nav-igation” branch of the LOS Angeles District is incharge of permitting and enforcement under thesection 404 program. The Corps presently suffersfrom a manpower shortage, as revealed by theincreased number of unresolved violations (from

244 ● industrial and Commercial Cogeneration
66 to 78); enforcement generally is the lowestpriority action for the district.
Rights-of-way for dispersed generating facilitiesin California will be sought from three agencies:the State Lands Commission, BLM, and the ForestService. Conversations with agency personnel in-dicated that at present they were adequatelystaffed in 1980, with the possible exception of theForest Service.
In summary, the information collected regard-ing the caseloads and personnel of California en-vironmental agencies showed them to be, in gen-eral, better staffed than their counterpart agen-cies in Colorado. However, legislation enactedin California in 1981 that requires the State AirResources Board and the APCDS to mitigate theair quality impacts of cogenerators smaller than50 MW, and to secure offsets for them, could taxthe resources of the APCDS. Also, as in Colorado,the agencies administering the water programs(NPDES, sec. 404 and sec. 401 programs) appearto suffer from manpower shortages that result inlax enforcement. Finally, the rights-of-way forfacilities on Federal lands administered by BLMor the Forest Service could be a bottleneck in thepermitting process if the number of applicationsincreased significantly or the number of person-nel to process them decreased.
Potential Impacts on Agency Caseloads
Few market penetration estimates are availablefor cogeneration (see ch. 5). Therefore, to gaugethe effects of cogeneration permitting and en-forcement on agency caseloads, State agenciesprimarily responsible for cogeneration’s develop-ment or regulation were contacted and asked toprovide their best estimates for potential develop-ment through 2000. The results of this informalsurvey are presented in table 57. It should be em-phasized that these are not official or preciseestimates based on any formalized methodology,but instead typically were the result of “brain-storming” sessions held by agency personnel. Todetermine the permit and other regulatory re-quirements of the amount of cogeneration capac-ity shown in table 57, assumptions were madeconcerning, among other things, the size andlocation of the facilities.
Table 57.—Penetration Scenario for Cogenerationin California and Coiorado
MW capacitv installedYear California Colorado
1,700 1701990 . . . . . . . . . . . . . . . . . . . . 2,300 2301995 . . . . . . . . . . . . . . . . . . . . 3,600 3602000 . . . . . . . . . . . . . . . . . . . . 6,000 600SOURCE: Energy and Resource Consultants, Inc., Federal and State Environ-
mental Permitting and Safety Regulations for Dispersed ElectricGeneration Technologies (contractor report to the Office of TechnologyAssessment, 1980).
First, it was assumed that, in Colorado, all newcogeneration units will file an Air Pollution Emis-sions Notice (APEN). Second, PSD permits wereassumed to be required under the Clean Air Actfor all sources over 10 MW and for one-half ofthe sources under 10 MW. Third, 25 percent ofcogeneration units were assumed to require anNPDES, section 401 or 404 permit under theClean Water Act. Fourth, 25 percent of cogenera-tion units would require State and/or Federalrights-of-way, and 25 percent also were assumedto require consultations with wildlife and histor-ical agencies.
The market penetration assumptions and theirassumed regulatory requirements were combinedto estimate the increased agency responsibilitiesfor permitting and enforcement due to cogenera-tion. The results of this analysis must be viewedas one possible scenario out of many plausiblefutures due to the large uncertainties in workingwith informal market penetration estimates. How-ever, it can be stated that the results presentedbelow are a high estimate of the increasedregulatory burden because the deployment as-sumptions described above are based on size orsiting conditions that would result in many co-generators being subject to the full range ofregulatory requirements. If cogenerators tend tobe smaller or located in different areas, then theincrease in permitting and enforcement respon-sibilities would be less than that shown below.
Colorado
The projected increases in agency workloadsin Colorado due to the future deployment of co-generation technologies are presented in table58. There is expected to be an increase of less

Ch. 6—Impacts of Cogeneration ● 245
Table 58.—increase in Agency Workloads Due to the Deployment of Cogeneration Technologies in Colorado
Projected average increasesin cases per yearCurrent
Agencv staffCurrent
1981-85 1988-90 199; -95 1998-2000case load1. Air Pollution Control Division, Colorado
Department of Health:1. Air Pollution Emission Notices. . . . . . . . . 42. Inspections. . . . . . . . . . . . . . . . . . . . . . . . . . 20
Il. Region VIII–EPA:1. PSD permits . . . . . . . . . . . . . . . . . . . . . . . . . 52. Inspections. . . . . . . . . . . . . . . . . . . . . . . . . . 8
Ill. Water Quality Control Division,Colorado Department of Health:
1. NPDES permits . . . . . . . . . . . . . . . . . . . . . . 122. Sec. 401 certificates . . . . . . . . . . . . . . . . . . 13. inspections . . . . . . . . . . . . . . . . . . . . . . . . . . 12
IV. Army Corps of Engineers, Omaha District:404 applications . . . . . . . . . . . . . . . . . . . . . . . 20a
Sacramento District:404 applications (Colorado only) . . . . . . . . . 4
V. State Board of Land Commissioners(right-of-way applications andcommercial leases) . . . . . . . . . . . . . . . . . . . . . . . 1
VI. BLM-State Office (right-of-wayapplications) . . . . . . . . . . . . . . . . . . . . . . . . . . . . . 12
VII. State Division of Wildlife (consultations) . . . . 18Vlll. Colorado Historical Society
(consultations) . . . . . . . . . . . . . . . . . . . . . . . . . . . 6
480 26
318
439
781
45300
13
29
318
739
300200
1,000
113
116
22
15
475a 1 1 1 2
40 1 1 1 2
75 1 1 1 2
18575
11
11
11
22
1,200 1 1 1 2a For the entire district.
SOURCE: Energy and Resource Consultants, Inc., Federal and State Environmental Permlttlng and Safety Regulations for Dispersed Electric Generation Technologies(contractor report to the Off Ice of Technology Assessment, 1980).
than 1 percent in annual APEN filings due to co-generation during the 1981-85 period, and onlya 3-percent increase (over the 1980 base year)during 1996-2000. Increases in other types of per-mits are even smaller.
The impact on the number of inspections canbe greater (depending on the current caseload)due to the fact that a permit is only granted once,whereas each facility must be inspected everyyear. Thus, inspections are cumulative and theagency must inspect not only the facilities per-mitted this year, but also all facilities permittedin previous years that are still operating. Still, onlya 10-percent increase in the number of requiredair pollution inspections is shown through 2000.
California
Table 59 presents a similar estimate of thepotential impacts of cogeneration on agencyworkloads in California. These impacts are moredifficult to quantify because data on air and waterpermit applications are tabulated on a regional
or district basis, and statewide totals were notavailable. Table 59 is based on data from selectedCalifornia air and water quality districts that tendto be representative of the potential statewideagency impact, but the table does not includethe impact of the 1981 legislation (mentioned pre-viously) that shifts the burden of attaining offsetsunder the nonattainment area provisions of theClean Air Act to the local APCDS.
Table 59 shows that the projected number ofair and water permit applications for cogeneratorsand the subsequent enforcement cases is greaterin California than in Colorado due to the largerassumed penetration of cogeneration in Califor-nia. However, California agencies tend to havemore staff and other resources and thus theoverall workload impact can be expected to beroughly similar. But, several of the California en-vironmental agencies already are overextendedand even a minor increase in the workload orreduction in staff may be difficult to accom-modate under present conditions.

246 ● Industrial and Commercial Cogeneratlon
Table 59.—increase In Agency Workloads Due to the Deployment ofCogeneration Technologies in Caiifomia
Projected average increasesCurrent Current in cases per year
Agency staff case load 1981-85 1986-90 1991-95 1996-20001. California Air Quality Division
State-wide total . . . . . . . . . . . . . . . . . . . . . . . . 1,000+ NA 20 17 37 41Sacramento District:
1. New Source Review . . . . . . . . . . . . . . . . . . 2 175 1 1 12. Inspections . . . . . . . . . . . . . . . . . . . . . . . . . 3 3 6 9 12
II. Water Resources Control BoardState-wide total . . . . . . . . . . . . . . . . . . . . . . . . NA NA 5 4 9 10
Region 5—Sacramento:1. Waste Discharge Requirementa . . . . . . . . 20 150 22.inspections . . . . . . . . . . . . . . . . . . . . . . . . . — 1,500 3 6 9 12
Region 9—San Diego:1. Waste Discharge Requirementa . . . . . . . . 2 8 1 2 22. Inspections . . . . . . . . . . . . . . . . . . . . . . . . . 17 1,000 3 6 12 18
Ill. Army Corps of EngineersLos Angeles District:
404 applications . . . . . . . . . . . . . . . . . . . . . . . 11 120 3 2 5 6IV. State Lands Commission
(rights-of-way) . . . . . . . . . . . . . . . . . . . . . . . . . 100 450 5 4 9 10V. BLM State Office
(rights-of-way) . . . . . . . . . . . . . . . . . . . . . . . . . 15 150 5 4 9 10VI. Fish and Game Department
(consultations) . . . . . . . . . . . . . . . . . . . . . . . . . 35 10,OOO 10 9 19 20VII. Office of Historic Preservations
(consultations) . . . . . . . . . . . . . . . . . . . . . . . . . 4 20 10 9 19 20NA - Not available.aThis encompassed both the 401 and NPDES permit programs.
SOURCE: Energy and Resource Consultants, Inc., Federal and State Environmental Permitting and Safety Regulations for Dispersed Electric Generation Technologies(contractor report to the OffIce of Technology Assessment, 1980).
Summary
The data in this discussion show that, in mostcases, the deployment of cogeneration shouldonly increase State and Federal agency caseloadsby a small percentage. The resulting increases instaff workloads vary depending on present loadand resources. But many of the agencies currentlyare understaffed and not able to handle their pres-ent caseload. Thus, even small percentage in-creases in workload would represent a substan-tial burden for these agencies. Moreover, under
current policies designed to reduce Federal agen-cy budgets and staff resources and turn over moreof the responsibility for permitting, monitoring,and enforcement to already understaffed Stateagencies, the impact of cogeneration may bemore significant than suggested by these data. Ifthis is the case, then cogeneration projects couldbe delayed in the permitting process, or couldbe reviewed inadequately resulting in insufficientcontrols and enforcement, and therefore a greaterpotential for adverse environmental impacts.
ECONOMIC AND SOCIAL IMPLICATIONS
Cogeneration (and other onsite generating institutions traditionally involved in the supplytechnologies) has attracted widespread attention and demand of electric and thermal energy.not only for its potential benefits and costs for Many analysts feel that, as global stocks of oil andenergy efficiency, the environment, and utility natural gas dwindle, major changes must occurplanning and operations, but also for its possi- in the technical, economic, and institutional con-ble implications for the economic and political text for energy supply and demand in industrial-

Ch. 6—Impacts of Cogeneration ● 247
ized societies. Cogeneration and small powerproduction are likely to be a part of these energysystem changes. Moreover, many people ad-vocate the use of dispersed generating technol-ogies not solely because of the perceived tech-nical, economic, or environmental advantages,but also due to the belief that an energy systembased on these technologies will be more com-patible with traditional democratic, participatory,and pluralistic institutions than a strategy basedon continued reliance on large-scale centralizedtechnologies. Although a thorough assessment ofthese implications is beyond the scope of thisreport, some general considerations are discussedbelow.
In general, there are two ways in which tech-nological change can be associated with socialor political change: 1 ) a change in the number,type, or responsibilities of organizations asso-ciated with the production, distribution, and/oroperation of a technological system; and 2) themore general benefits and costs for individuals,groups, and society as a whole. In the contextof cogeneration, the first type of change relatesprimarily to those institutions described in chapter3–the traditional suppliers, users, and regulatorsof electric energy, while the second set of impactsconcerns the likelihood of cogeneration’s result-ing in greater centralization or decentralizationin social organization.
The general background for an analysis of thesocial and political implications of cogenerationis described in chapter 3, including the nationalenergy context, the current status of the electricutility industry, and the regulatory and institu-tional aspects of cogeneration. Clearly a funda-mental feature of the electric utility industry-itsability to provide a reliable supply of electricityat a relatively low price while maintaining itsfinancial health–has changed dramatically in re-cent years. Virtually all aspects of the technologi-cal and institutional context of the industry havecontributed to this change: capital and fuel costincreases and environmental concerns have lim-ited the choice of generating technologies andoperating conditions, and have increased theprice of electricity significantly. At the same time,the rate of demand growth has declined substan-tially, resulting in excess utility capacity in many
areas, which has contributed to utilities’ finan-cial problems. As a result of these recent changesin the status of electric utilities, the industry andits customers and regulators have sought alter-nate means of achieving the goal of reliable serv-ice at a low price. One such means is throughsmall-scale generating technologies such as co-generation.
The widespread use of cogeneration couldbring a wide array of changes to the contextdescribed in chapter 3. In general, these changescan affect the roles, responsibilities, or authorityof energy suppliers or consumers and the rela-tionships among them. Thus, with cogeneration,the traditional roles of utilities—as suppliers ofelectricity—and their customers would have tobe recast as former customers feed cogeneratedpower into the grid, and thus become suppliersof electricity themselves. Alternatively, electricutilities could own dispersed cogeneration ca-pacity and establish a new role for the industryas providing alternative energy supply options(and, in most cases, a new product–thermalenergy) rather than merely facilitating thedevelopment of those options by other parties.
This section focuses on the economic and so-cial implications of cogeneration for utilities andtheir customers. It begins with an analysis of thepotential capital cost and employment impactsof three scenarios for cogeneration market pen-etration, discusses the effects of the scenarioresults on utilities’ planning and operation, andthen briefly outlines some potential impacts inother economic sectors. The section concludeswith a review of cogeneration’s implications forthe centralization or decentralization of electricitygeneration.
Economic Impacts
Due to the large number of uncertainties aboutfuture energy development patterns, it is extreme-ly difficult to develop a quantitative—or evenqualitative—basis for comparing the economiccharacteristics of these different developmentscenarios. For example, the rate of growth in elec-tricity demand, the rate of inflation, future capitalcosts for powerplant construction, and changesin the regulatory climate all may affect the future

—
248 Industrial and Commercial Cogeneration
costs and deployment characteristics (e.g., plantsize) of utility generating capacity. Similarly,uncertainties about ownership, future capitalcosts, and the choice of technologies make it dif-ficult to project the economic effects of thewidespread use of cogeneration. Furthermore,due to the lack of recent cogeneration ex-perience, reliable data are not available for itemssuch as the operating and maintenance (O&M)labor required for cogenerators. Without a largecomputer modeling effort, clearly beyond thescope of this assessment, it is not possible todetermine the sensitivity of the economic impactsof cogeneration development to these uncertain-ties.
However, OTA wanted to be able to define theproblem areas in order to lay the groundwork forfuture impact assessments. Therefore, OTA de-veloped three rough market penetration esti-mates for cogeneration. The assumptions under-lying these rough estimates and their derivationare reviewed briefly, and then the ranges of im-pacts that could be associated with each estimateare discussed.
Market Penetration Scenarios
A wide range of penetration estimates are avail-able in the literature on cogeneration and aredisplayed in table 60. The highest estimate shownin the table—which represents 10 to 16 percentof total projected electricity generation capacity
Table 60.-Market Penetration Estimatesfor Cogeneration
Source MW QualificationsFERC 5,910 Estimate of the marginal increase in
cogeneration capacity caused byPURPA by 1995.
FERC 27,405 Estimate of the potential forcogeneration capacity in 1995.
ERA 1,312 Amount initially allowed under FUAregulations.
ERA 3,920 Likely cogeneration penetration by 1990.ERA 45,190 Maximum oil/gas-fired generating
capacity potentially displaceable bycogeneration.
SERI 93,000 Amount of central station baseloadcapacity potentially displaceable bycogeneration.
KEY: FERC—Federal Energy Regulatory Commlssion; ERA—Economic Regula-tory Admlnistration; and SERI—Solar Energy Research Instltute.
SOURCE: Off Ice of Technology Assessment.
in the year 2000-is around 70 times larger thanthe smallest. To bracket the ranges of penetra-tion estimates, OTA chose three estimates. Thefirst, a penetration of 50,000 MW by 2000, is anapproximation of the Economic Regulatory Ad-ministration’s high estimate for the maximumoil/gas electric generating capacity potentiallydisplaced by cogeneration. The implementationof 50,000 MW of cogeneration would representapproximately 5 to 8 percent of total projectedinstalled generating capacity in 2000. Second, asthe middle range, OTA chose the high numberin table 60—approximately 100,000 MW of co-generation–which would represent 10 to 16 per-cent of potential installed generating capacity in2000. Finally, in order to gauge the impacts ofphenomenal success, OTA postulated a penetra-tion of 150,000 MW by 2000, which would be16 to 24 percent of total projected installedcapacity.
Once these three penetration estimates wereestablished, it was necessary to disaggregate forthe types of utility generating capacity that wouldbe backed out by cogeneration and in what partsof the country. In order to do this it was assumedthat:
●
●
●
●
●
●
30 percent of existing oil-fired steam gen-erating capacity would be converted to coalor permanently retired;oil-fired steam plants would be backed outbefore gas-fired steam plants;only oil- and gas-fueled capacity would bebacked out (i.e., no coal, nuclear, hydro, orother non-oil/gas capacity is replaced by co-generation);steam plants would be backed out beforecombustion turbines;oil-fired combustion turbines would bebacked out before gas-fired combustion tur-bines; andno utility region would replace all its com-

Ch. 6—Impacts of Cogeneration ● 249
●
●
●
by 2000 and would not be available forreplacement by cogeneration;of the remaining 70 percent of oil steamcapacity, approximately 40 percent wouldbe replaced by cogeneration;approximately 40 percent of the gas steamcapacity would be replaced by cogenera-tion; andapproximately 1 percent of the oil-firedcombustion turbine capacity would bebacked out by cogeneration.
2. 100,000 MW penetration by 2000:● 30 percent of oil steam would be con-
verted or retired, and 75 percent of theremainder would become cogeneration;
. 75 percent of the gas steam capacitywould be backed out;
. 18 percent of the oil combustion turbinecapacity would be replaced by cogenera-tion; and
. 11 percent of the gas combustion turbinecapacity would be replaced by cogener-ation.
3. 150,000 MW penetration by 2000:●
●
●
●
30 percent of the oil steam capacity wouldbe converted or retired, and 100 percentof the remaining oil steam would becomecogeneration;100 percent of the steam gas capacitywould be backed out by cogeneration;70 percent of the oil combustion turbinecapacity would be replaced by cogenera-tion; and30 percent of the gas combustion turbinecapacity would become cogeneration.
These assumptions were applied to the nineNorth American Electric Reliability Council
regions based on 1981 regional oil and gas steamand combustion turbine capacity (i.e., theanalysis assumes no new oil/gas capacity will bebrought on-line after 1981, regardless of utilityannounced plans). Thus, these penetration esti-mates do no necessarily correspond to the re-gional cogeneration opportunities that have beenidentified in the literature. This is simultaneous-Iy a result of the linear approach to the analysisand a desire to gauge the impacts of overwhelmi-ng success for cogeneration policy and financialincentives. The results of this exercise are shownin detail in table 61.
Financial and Employment impacts
It has been claimed widely that investment insmaller capacity increments, such as cogenera-tion systems, would contribute to the improvedfinancial health of the electric utility industry.Therefore, OTA undertook a comparison of thecapital costs of the scenarios in table 61 with andwithout cogeneration. For the base case—utilitydevelopment of 50,000, 100,000, and 150,000MW of capacity without cogeneration—two setsof assumptions were used (see table 62). The first(Case A) uses coal-fired plants with scrubbers tomeet all the baseload capacity requirements. Thecapital cost for baseload coal was set at $1,014/kW (1980 dollars), the same figure used in model-ing commercial cogeneration opportunities (seech. 5). In the second base case (Case B), 50 per-cent of the baseload capacity was assumed to becoal-fired (at $1,01 4/kW) and the other 50 per-cent assumed to be nuclear powered (at $1,400/-kW, the average cost, including interest duringconstruction, for those plants that came on-linein 1979-80) (30). In both base cases, peaking
Table 61.—Scenarios for Cogeneration Implementation
50,000 MW 100,000 MW 150,000 MW
Steam oil Steam gas CT oil CT gas Total Steam oil Steam gee CT oit CT gas Total Steam 0il Steam gas CT Oil CT gas Total
ECAR . . . . . . . . . . . . . . . . . 1,190 60 21 – 1,271 2,170 120 360 115 2,765 2,66S 157 1,478 306 4,629ERCOT. . . . . . . . . . . . . . . . – 12,400 1 – 12,401 – 23,260 10 150 23,420 – 31,010 40 398MAAC . . . . . . . . . . . . . . . . 3,350 – 72 – 3,422 0,300
31,448— 1 , 3 0 0 7,625 8,366 – 5,054 68 13,510
MAIN . . . . . . . . . . . . . . . . . 1,210 200 18 – 1,428 2,275 390 320 125 3,110 3,033 514 1,245 329MARCA . . . . . . . . . . . . . . . 150
5,12165 31 – 266 285 160 565 10 1,020 376 213 2,196 21 2,806
NPCC . . . . . . . . . . . . . . . . . 7,210 10 47 — 7,267 13,526 20650 5 14,401 18,035 26 3,309 21,379SERC . . . . . . . . . . . . . . . . . 5,260 70 103 – 5,433 9,665 140 1,630 12 11,647 13,150 184 7,122 33 20,489SPP . . . . . . . . . . . . . . . . . . 2,050 2,870 15 – 10,935 3,650 16,635 265 120 20,870 5,130 22,179 1,031 322 28,662WSCCc . . . . . . . . . . . . . . . . 6,540 1,000 37 – 7,577 12,271 1,875 675 101 14,992 16,362NERC–U.S. totals. . . . . . 26,960
2,499 2,623 272 21,75622,695 345 – 50,000 50,542 42,600 6,195 663 100,OOO 67,362 56,782 24,098 1,758 150,000
CT - combustion turbine.
SOURCE: Office of Technology Assessment.

250 ● Industrial and Commercial Cogeneration
Table 62.—Assumptions Used to Compare Capitai Costs
Capital cost Amount installed (MW)Technology type ($/kW) 50,000 MW 100,000 MW 150,000 MW
Baseload:Coal-fired . . . . . . . . . . . .Nuclear . . . . . . . . . . . . . .
Peakload . . . . . . . . . . . . . . .
Diesels . . . . . . . . . . . . . . . .Gas turbines. . . . . . . . . . . .Steam turbines. . . . . . . . . .Combined cycle . . . . . . . . .
Case A Case B Case A Case B Case A— — —
$1,014 45,655 22,827.5 93,142 46,571 124,1441,400 0 22,827.5 0 46,571
200 345 345 6,858 6,858 25,85:Case C Case D Case C Case D Case C— — —
$350-800 12,500 2,500 25,000 5,000 37,500320-900 12,500 7,500 25,000 15,000 37,500
550-1,600 12,500 17,500 25,000 35,000 37,500$430-600 12.500 22.500 25.000 45.000 37.500
SOURCE: Office of Technology Assessment.
capacity was assumed to have a capital cost of$200/kW, the same figure used in the analysis inchapter 5.
Additional assumptions were needed to devel-op a capital cost comparison for meeting thesecapacity requirements with cogeneration. First,a mix of cogeneration technologies was estab-lished by selecting four mature systems–diesels,combustion turbines, steam turbines, and com-bined cycles–that represent a wide range of pos-sible cogeneration applications, and then choos-ing two sets of penetration mixes for the foursystems (see table 62). The first set (Case C)assumes that each of the technologies would con-tribute 25 percent of the capacity requirements.The second set (Case D) assumes that dieselswould contribute 5 percent, combustion turbines15 percent, steam turbines 35 percent, and com-bined cycles 45 percent. Capital costs for thesefour technologies vary widely depending on thesize of the system, the fuel used, and the in-dustrial or commercial application. Therefore, thefull range of costs given in chapter 4 was used(see table 18).
Table 63 shows the capital investment needsfor meeting the three capacity scenarios basedon these assumptions. As can be seen in table63, the assumptions used in estimating capitalcosts play a substantial role in determining theimpact of substituting cogeneration for central sta-tion capacity. For example, in the 50,000 MWscenario, the central station capital requirementsare as much as 90 percent higher than those forlower cost cogenerators, and up to 17 percentlower than those for higher cost cogenerators.
Case B
62,07262,07225,856
Case D
7,50022,50052,50067,500
Similarly, the mix of technologies affects the costcomparison, with Cases A and C having signifi-cantly lower capital requirements than Cases Band D. Equally wide ranges of results are shownfor the 100,000 and 150,000 MW scenarios.However, if the mean of the cogenerator casecosts is compared to the central station costs, thecogeneration cases require around 20 to 40 per-cent less capital than the central station cases.
Still greater uncertainties are introduced intothe capital cost comparison if one factors in in-terest costs and construction duration. The costof capital is heavily dependent on its source, in-cluding whether a project is financed throughdebt, equity, or internal funds; the source of debtor type of equity; and the interest rates and rateof return on equity. If one assumes that all fac-tors except construction duration are equal, thenthe cost of capital obviously would be lower forsmaller capacity increments such as cogenerationthan for large central station plants. However,high interest rates mean that the shorter Ieadtimefor cogenerators offers substantial short-termfinancing advantages over central station pow-erplants.
In addition to examining capital cost differ-ences, OTA also estimated differences in O&Mcosts for equal amounts of central station andcogeneration capacity. The same capacity as-sumptions as in the capital cost estimates wereused (see table 62), but additional assumptionshad to be made with regard to O&M costs andcapacity factors (see table 64). The results of theO&M cost comparison are shown in table 65. Ascan be seen in table 65, O&M costs show the

Ch. 6—impacts of Cogeneration .251
Table 63.—Comparison of Capitai Requirements (1980 dollars x 10°)
Without cogeneration With cogeneratlon Percent difference
Percent Percentdifference difference
Technology Case A Case B A-B Technology Case C Case D C-D A-C A-D B-C B-D
50,000 MW:Baseload. . . . . . . 46,294 54,106Peakload . . . . . . . 69 69
Total . . . . . . . . 46,363 54,175 15.5
100,000 MW:Baseload. . . . . . . 94,446 112,422Peakload . . . . . . . 1,372 1,372
Total . . . . . . . . 95,818 113,794 17.2
150,000 Mw:Baseload. . . . . . .125,680 149,642Peakload . . . . . . . 5,171 5,171
Total . . . . . . . . 131,051 155,013 16.8
50,000 MWDiesels . . . . . . . . . . . 4,375-10,000Gas turbines . . . . . . 4,000-11,250Steam turbines . . . . 6,875-20,000Combined cycle . . . . 5,375-10,000
Lowest total. . . . . 20,625Highest total . . . . 51,250Mean . . . . . . . . . . . 35,938
100,000 MW:Diesels . . . . . . . . . . . 8,750-20,000Gas turbines . . . . . . 8,000-22,500Steam turbines . ...13,750-40,000Combined cycle. . ..10,750-20,000
Lowest total. . . . . 41,250Highest total . . . . 102,500Mean . . . . . . . . . . . 71,875
150,000 MW:Diesels . ..........13,125-30,000Gas turbines . .....12,000-33,750Steam turbines . ...20,62540,000
875-2,0002,400-6,7509,625-28,0009,675-18,000
22,575 9 76.8 69.0 90.0 82.354,750 6.6 –10.0 –16.6 5.5 –1.138,663 7.3 25.3 18.1 40.5 33.4
1,750-4,0004,600-13,500
19,250-56,00019,350-36,000
45,150 9 79.6 71.9 93.6 66.4109,500 6.6 –6.7 –13.3 10.4 3.877,325 7.3 28.6 21.4 45.2 38.2
2,625-6,0007,200-20,250
28,875-64,000Combined cycle. . . . 16,125-30,000 29,025-54,000
Lowest total. . . . . 61,875 67,725 71.7 63.7 65.9 78.4Highest total . . . . 153,750 164,250 696 –15.9 – 2 2 . 5 0 . 8 – 5 . 8Mean . . . . . . . . . . . 107.813 115.988 7.3 19.5 12.2 35.9 28.8
aA negative percent difference means that cogeneratlon coats are higher, and a positive percent difference Indlcates that central station costs are higher.
SOURCE: Office of Technology Assessment.
Table 64.—Assumptions Used in Estimating Operating and Maintenance Costs
Annual fixed Variable ConsumableSize Capacity O&M cost O&M cost O&M cost
Type of equipment (MW) factor ($/kw) (mills/kWh) (mills/kWh)
Central station:Coal steam. . . . . . . . . . . . . . . 1,000 75% 12.9 0.90 2.6Light water reactor. . . . . . . . 1,000 75% 3.1 1.50 —Combustion turbine . . . . . . . 75 9% 0.275 2.925 —Cogeneration:Steam turbine . . . . . . . . . . . . 0.5-100 90%/45% 1.6-11.5 3.0-8.8 —Gas turbine . . . . . . . . . . . . . . 0.1-100 90%/45% 0.29-0.34 2.5-3.0 —Combined cycle. . . . . . . . . . . 4-100 90%/45% 5.0-5.5 3.0-5.1Diesel . . . . . . . . . . . . . . . . . . .0.075-30 90%/45% 6.0-8.0 5.0-10.0 –SOURCE: Off Ice of Technology Assessment.
same wide variation as capital costs, dependingon the mix of equipment types, sizes, and capaci-ty factors. In general, however, the figures in table65 suggest that O&M costs for cogeneration willbe lower than those for central station capacitywhen the cogenerators are larger units suitablefor industrial sites (i.e., steam turbines, combinedcycles), or when they are operating at a lowercapacity factor. Conversely, small cogeneratorswith a higher proportion of diesels and gas tur-bines, and those operating at a higher capacity
factor, tend to have higher O&M costs than cen-tral station capacity.
The labor requirements for construction andfor O&M of equivalent amounts of central stationand cogeneration capacity also were compared.This was extremely difficult due to a lack of con-sistent data. For example, estimated constructionwork-hour requirements by craft and region areavailable for central station capacity, but not forcogeneration. On the other hand, construction
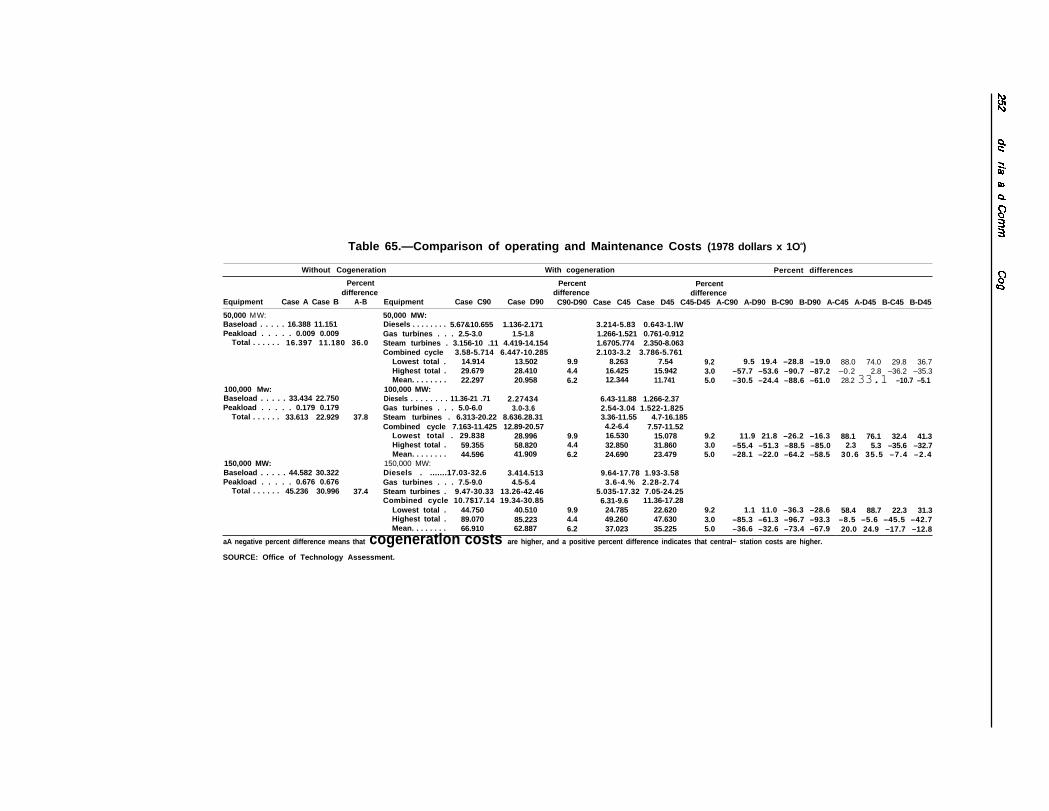
Table 65.—Comparison of operating and Maintenance Costs (1978 dollars x 1Oa)
Without Cogeneration With cogeneration Percent differences
Percent Percentdifference
Percentdifference difference
Equipment Case A Case B A-B Equipment Case C90 Case D90 C90-D90 Case C45 Case D45 C45-D45 A-C90 A-D90 B-C90 B-D90 A-C45 A-D45 B-C45 B-D45
50,000 MW: 50,000 MW:Baseload . . . . . 16.388 11.151 Diesels . . . . . . . . 5.67&10.655 1.136-2.171 3.214-5.83 0.643-1.lWPeakload . . . . . 0.009 0.009 Gas turbines . . . 2.5-3.0 1.5-1.8 1.266-1.521 0.761-0.912
Total . . . . . . 16.397 11.180 36.0 Steam turbines . 3.156-10 .11 4.419-14.154 1.6705.774 2.350-8.063Combined cycle 3.58-5.714 6.447-10.285 2.103-3.2 3.786-5.761
Lowest total . 14.914 13.502 9.9 8.263 7.54 9.2 9.5 19.4 –28.8 –19.0Highest total . 29.679 28.410 4.4 16.425 15.942 3.0 –57.7 –53.6 –90.7 –87.2Mean. . . . . . . . 22.297 20.958 6.2 12.344 11.741 5.0 –30.5 –24.4 –88.6 –61.0
100,000 Mw: 100,000 MW:Baseload . . . . . 33.434 22.750 Diesels . . . . . . . . 11.36-21 .71 2.27434 6.43-11.88 1.266-2.37Peakload . . . . . 0.179 0.179 Gas turbines . . . 5.0-6.0 3.0-3.6 2.54-3.04 1.522-1.825
Total . . . . . . 33.613 22.929 37.8 Steam turbines . 6.313-20.22 8.636.28.31 3.36-11.55 4.7-16.185Combined cycle 7.163-11.425 12.89-20.57 4.2-6.4 7.57-11.52
Lowest total . 29.838 28.996 9.9 16.530 15.078 9.2 11.9 21.8 –26.2 –16.3Highest total . 59.355 58.820 4.4 32.850 31.860 3.0 –55.4 –51.3 –88.5 –85.0Mean. . . . . . . . 44.596 41.909 6.2 24.690 23.479 5.0 –28.1 –22.0 –64.2 –58.5
150,000 MW: 150,000 MW:Baseload . . . . . 44.582 30.322 Diesels . .......17.03-32.6 3.414.513 9.64-17.78 1.93-3.58Peakload . . . . . 0.676 0.676 Gas turbines . . . 7.5-9.0 4.5-5.4 3.6-4.% 2.28-2.74
Total . . . . . . 45.236 30.996 37.4 Steam turbines . 9.47-30.33 13.26-42.46 5.035-17.32 7.05-24.25Combined cycle 10.7$17.14 19.34-30.85 6.31-9.6 11.36-17.28
Lowest total . 44.750 40.510 9.9 24.785 22.620 9.2 1.1 11.0 –36.3 –28.6Highest total . 89.070 85.223 4.4 49.260 47.630 3.0 –85.3 –61.3 –96.7 –93.3Mean. . . . . . . . 66.910 62.887 6.2 37.023 35.225 5.0 –36.6 –32.6 –73.4 –67.9
aA negative percent difference means that cogeneratlon costs are higher, and a positive percent difference indicates that central~ station costs are higher.
SOURCE: Office of Technology Assessment.
88.0 74.0 29.8 36.7–0.2 2.8 –36.2 –35.328.2 33.1 –10.7 –5.1
88.1 76.1 32.4 41.32.3 5.3 –35.6 –32.7
30.6 35.5 –7.4 –2.4
58.4 88.7 22.3 31.3–8.5 –5.6 –45.5 –42.720.0 24.9 –17.7 –12.8

Ch. 6–Irnpacts of Cogeneration ● 253
labor costs are available for cogenerators, butusually are not broken out in surveys of centralstation installation costs. Moreover, labor re-quirements and costs for central station capaci-ty vary widely by region and type and size ofcapacity.
However, in order to derive broad estimatesfor comparison purposes, the available data wereapplied to the three scenarios described abovebased on the capital and O&M cost estimates intables 63 and 65. To estimate cogeneration con-struction labor requirements in work-hours, OTAused existing estimates of labor costs and dividedby the 1979 average cost per work-hour for con-struction labor. The results were then comparedto existing estimates of work-hour requirementsfor central station powerplants (see table 66).
As with the cost estimates in tables 63 and 65,the construction labor requirements in table 66vary widely due to the wide range in the under-lying assumptions. For example, for the 50,000MW scenario, cogeneration is shown as requir-ing from 40 percent fewer to as much as 70 per-cent more work-hours than central station plants,depending on the size, type, and location of the
central station capacity, and the size and type ofcogenerators. Similar wide ranges are shown forthe 100,000 and 150,000 MW scenarios. In gen-eral, construction labor needs for cogenerationare higher than those for an eqivalent amountof central station capacity when small-to medium-sized cogeneration units are installed, and lowerwhen large cogenerators are used.
Although it is not possible to project actual con-struction labor needs without additional informa-tion on the size and type of cogeneration capacityto be used, it is possible to qualitatively comparethe types of jobs that might result. Powerplantconstruction labor may be broken down into ap-proximately 15 different craft requirements (seetable 67). Not all of the skills listed in table 67would be needed for cogeneration installation,nor would the proportion of each craft be similar(although actual craft needs for installing cogen-eration have not been published).
The location and duration of labor needs alsowill be quite different for cogeneration and cen-tral powerplants. Central station capacity con-struction is likely to occur in larger capacity in-crements at relatively isolated rural sites, and to
Table 66.–Comparison of Construction Labor Requirements (WH x 106)
Without cogeneration With cogeneration Percent dlfferencea
Percent Percentdifference difference
Technology Case A Case B A-B Technology case c Case D C-D A-C A-D B-C B-D
50,000 MW:Baseload. . . . . . . . 389.8-452.0Peakload. . . . . . . . 0.88-1.24
Lowest total. . . 370.88Highest total . . 453.24Mean . . . . . . . . . 411.98
100,000 MW:Baseload. . . . . . . . 754.45-922.1Peakload. . . . . . . . 17.59-24.63
Lowest total . . 772.04Highest total . 946.73Mean . . . . . . . . 859.39
150,000 MW:Baseload, . . . . . . 1)005 .6-1,229.0Peakload. . . . . . . . 88.3-92.8
Lowest total. . 1,071.9Highest total 1,321.8Mean . . . . . . . . . 1,196.9
497.6-646.00.88-1.24
498.48
847.24572.88
1,015 .2-1,318.017.59-24.63
1,032.791,342.631,187.7
1,353 .2-1,758.566.3-92.81,419.51,849.31,634.4
29.435.332.7
28.934.632.1
27.933.330.9
50,000 MWDiesels . . . . . . . . . . . . 72.92-186.67Gee turbines . . . . . . . 46.15-129.81Steam turbines . . . . . 132.21484.62Combined cycle , . . . 82.69-153.85
Lowest total . . . . . 333.97Highest total . . . . . 834.96Mean. . . . . . . . . . . . 584.48
100,000 MW:Dlesels . . . . . . . . . . . . 145.84-333 .34Gas turbines . . . . . . . 92.30259.82Steam turbines . . . . . 264.42-789.24Combined cycle . . . . 185.38-307.70
Lowest total . . . . . 887.94Highest total . . . . . 1,689.90Mean . . . . . . . . . . . . 1,188.9
150,000 MW:Diesels . . . . . . . . . . . . 218.76-500.01Gas turbines . . . . . . . 138.45389.43Steam turbines . . . . . 396.63-1,153.86Combined cycle . . . . 248.07-481 .55
Lowest total . . . . . 1,001.9Highest total . . . . . 2,504.9Mean . . . . . . . . . . . . 1,753.4
14.58.33.3327.69-77.89
185.05-537.96148.85-276.95
378.17926.13661.15
29.18-86.6755.38-155.78370.1-1,075.92297.7-553.9
752.341,852,31,302.3
43.74-100.0083.07-233.67
555.15-1,613.88446.55-830.85
1,128.52,778.41,953.5
11.910.410.8
11.910.410.8
11,910.410.8
10.4 1.5 39.5 28.0– 5 9 . 3 – 6 8 , 6 – 2 5 . 3 – 3 5 . 5- 3 4 . 6 – 4 5 . 0 –2.0 –12.8
14.5 2.6 42.9 31.4– 5 5 . 3 – 6 4 . 7 – 2 1 . 7 – 3 1 . 9–30.5 –41.0 1.6 –9.2
6.8 –5.1 34.5 22.8- 6 1 . 8 – 7 1 . 1 - 3 0 . 1 - 4 0 . 2- 3 7 . 7 – 4 8 . 0 – 7 . 0 – 1 7 . 8
a A negative percent difference means that cogeneration labor requirements are higher, and a posltlve percent difference Indicates that central station Iabor requirementsare higher.
SOURCE: Office of Technology Assessment.

. —
254 Industrial and Commercial Cogeneration
Table 67.—Craft Requirements for Central StationPowerplant Construction
Table 68.—Estimated Operating andMaintenance Labor
Percent of total construction labor Capacity type Size (MW) WH/MWhCraft Nuclear Fossil
Asbestos workers/insulation. . 1.6 3.5Boilermakers . . . . . . . . . . . . . . . 3.3 15.0Bricklayers/stone masons . . . . 0.4 0.5Carpenters . . . . . . . . . . . . . . . . . 11.1 8.5Cement/concrete finishers . . . 1.4 1.1Electricians . . . . . . . . . . . . . . . . 16.3 14.3Ironworkers . . . . . . . . . . . . . . . . 7.7 9.0Laborers . . . . . . . . . . . . . . . . . . . 15.0 11.8Millwrights . . . . . . . . . . . . . . . . . 2.4 2.9Operating engineers. . . . . . . . . 6.2 7.6Painters . . . . . . . . . . . . . . . . . . . 2.5 1.5Pipefitters . . . . . . . . . . . . . . . . . 26.5 18.6Sheet metalworkers . . . . . . . . . 1.5 2.0Truck drivers . . . . . . . . . . . . . . . 3.2Other workers . . . . . . . . . . . . . . 0.5 0.4SOURCE: U.S. Department of Energy, Off Ice of Energy Research; and U.S. Depart-
ment of Labor, Employment Standards Administration, Projections ofCost Duratlon, and On-Site Manual Labor Requirements for Construct-ing Electric Generating Plants, 197~19&3 DOE/lFf-O 057 andDOUCLDS/PP2, September 1979.
entail large influxes of workers (either temporaryresidents or commuters) for several years. Thesocial and economic disruption that can resultfrom powerplant construction is well docu -mented in the literature. Cogenerators, on theother hand, are more likely to be installed at com-mercial or industrial sites, usually located nearpopulation centers. Moreover, because cogen-eration would be installed in smaller capacity in-crements, fewer workers would be required foreach installation. Although the installation jobswould be of much shorter duration, they wouldoccur more frequently, providing a steadier re-gional employment profile. Thus, the potentialfor adverse socioeconomic impacts would bemuch lower with cogeneration.
Estimated requirements for O&M labor arecompared in table 68. These were not translatedinto the three scenarios due to the large numberof uncertainties and gaps in the data. However,it is clear from table 68 that the labor re-quirements for cogeneration per megawatthourof output will be greater than those for centralstation capacity. How much greater will dependon the size, type, and operating characteristicsof the cogenerator. The crafts involved (engineer-ing, fuel handling, general labor) are likely to besimilar for cogeneration and coal-fired power-plants, but, as with construction labor, the loca-tion of the jobs will be very different.
Central station. a
Nuclear . . . . . . . . . . . . . . . . . 1,000-2,000Coal . . . . . . . . . . . . . . . . . . . . 1,000-2,000Diesel
C
b
o g e n e r a t i o n :
. . . . . . . . . . . . . . . . . . 0.240.71.1352.84
Gas turbineb . . . . . . . . . . . . . 0.510.050.0
Steam turbinec . . . . . . . . . . . 15-3045-70
140-190
0.0389-0.07610.0462-0.0793
27.8-55.69.5-19.05.9-11.72.1-4.7
12.6-26.70.63-1.30.13-0.27
1.114-1.9680.378-0.4640.136-0.159
SOURCE: Office of Technology Assessment.
The above comparisons of capital and O&Mcosts and labor requirements for equivalentamounts of central station and cogenerationcapacity indicate that cogeneration has the poten-tial to reduce the cost of supplying electric powerwhile increasing the number of jobs associatedwith electricity generation. * However, dependingon the size and type of cogenerators deployed,it could have the opposite effect-higher capitalcosts and/or lower labor requirements. That is,the financial and employment effects of cogen-eration are highly correlated with economies ofscale. Based on the mean values, however, it ismore likely that cogeneration costs will be lowerand labor needs higher than those for central sta-tion powerplants.
Utility Planning and Regulation
Where utilities face financial, fuel availability,or other constraints on capacity additions, orwhere they are heavily dependent on oil-firedcapacity that cannot be converted to coal, co-
*Note that this seemingly anomalous result is possible only if co-generation installation and operation/maintenance require lessskilled (and thus lower paid) labor than central station plants, whichis likely to be the case.
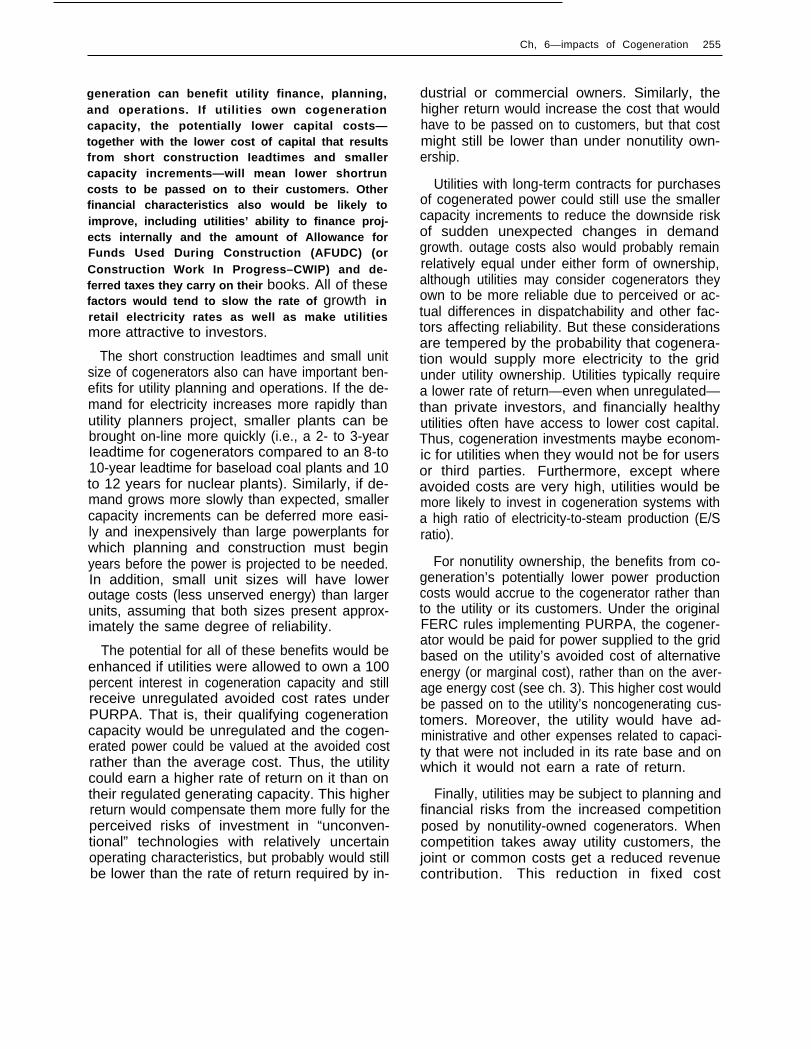
Ch, 6—impacts of Cogeneration 255
generation can benefit utility finance, planning,and operations. If utilities own cogenerationcapacity, the potentially lower capital costs—together with the lower cost of capital that resultsfrom short construction Ieadtimes and smallercapacity increments—will mean lower shortruncosts to be passed on to their customers. Otherfinancial characteristics also would be likely toimprove, including utilities’ ability to finance proj-ects internally and the amount of Allowance forFunds Used During Construction (AFUDC) (orConstruction Work In Progress–CWIP) and de-ferred taxes they carry on their books. All of thesefactors would tend to slow the rate of growth inretail electricity rates as well as make utilitiesmore attractive to investors.
The short construction Ieadtimes and small unitsize of cogenerators also can have important ben-efits for utility planning and operations. If the de-mand for electricity increases more rapidly thanutility planners project, smaller plants can bebrought on-line more quickly (i.e., a 2- to 3-yearIeadtime for cogenerators compared to an 8-to10-year leadtime for baseload coal plants and 10to 12 years for nuclear plants). Similarly, if de-mand grows more slowly than expected, smallercapacity increments can be deferred more easi-ly and inexpensively than large powerplants forwhich planning and construction must beginyears before the power is projected to be needed.In addition, small unit sizes will have loweroutage costs (less unserved energy) than largerunits, assuming that both sizes present approx-imately the same degree of reliability.
The potential for all of these benefits would beenhanced if utilities were allowed to own a 100percent interest in cogeneration capacity and stillreceive unregulated avoided cost rates underPURPA. That is, their qualifying cogenerationcapacity would be unregulated and the cogen-erated power could be valued at the avoided costrather than the average cost. Thus, the utilitycould earn a higher rate of return on it than ontheir regulated generating capacity. This higherreturn would compensate them more fully for theperceived risks of investment in “unconven-tional” technologies with relatively uncertainoperating characteristics, but probably would stillbe lower than the rate of return required by in-
dustrial or commercial owners. Similarly, thehigher return would increase the cost that wouldhave to be passed on to customers, but that costmight still be lower than under nonutility own-ership.
Utilities with long-term contracts for purchasesof cogenerated power could still use the smallercapacity increments to reduce the downside riskof sudden unexpected changes in demandgrowth. outage costs also would probably remainrelatively equal under either form of ownership,although utilities may consider cogenerators theyown to be more reliable due to perceived or ac-tual differences in dispatchability and other fac-tors affecting reliability. But these considerationsare tempered by the probability that cogenera-tion would supply more electricity to the gridunder utility ownership. Utilities typically requirea lower rate of return—even when unregulated—than private investors, and financially healthyutilities often have access to lower cost capital.Thus, cogeneration investments maybe econom-ic for utilities when they wouId not be for usersor third parties. Furthermore, except whereavoided costs are very high, utilities would bemore likely to invest in cogeneration systems witha high ratio of electricity-to-steam production (E/Sratio).
For nonutility ownership, the benefits from co-generation’s potentially lower power productioncosts would accrue to the cogenerator rather thanto the utility or its customers. Under the originalFERC rules implementing PURPA, the cogener-ator would be paid for power supplied to the gridbased on the utility’s avoided cost of alternativeenergy (or marginal cost), rather than on the aver-age energy cost (see ch. 3). This higher cost wouldbe passed on to the utility’s noncogenerating cus-tomers. Moreover, the utility would have ad-ministrative and other expenses related to capaci-ty that were not included in its rate base and onwhich it would not earn a rate of return.
Finally, utilities may be subject to planning andfinancial risks from the increased competitionposed by nonutility-owned cogenerators. Whencompetition takes away utility customers, thejoint or common costs get a reduced revenuecontribution. This reduction in fixed cost

256l Industrial and Commercial Cogeneration
coverage either endangers service to othercustomers or imposes a greater share of the costburden on them. This phenomenon is not uniqueto electric power. It has occurred in the transpor-tation industry, most dramatically with the com-petition between trucking and railroads, and thesame problems currently are being faced by thetelecommunications industry. It is essentially thesame as the issue of loss exposure raised by Con-Ed in the New York Public Service Commissionhearings on cogeneration (see ch. 3). Remediesfor such problems, insofar as they exist, must befound in the rate structure of the utility, orthrough changes in Federal policy that wouldequalize utilities’ competitive position in cogen-eration markets.
The following material analyzes the potentialeffects of competition on two utilities: Com-monwealth Edison (CWE), which is committedto major central station capacity construction,and Pacific Gas & Electric (PG&E), which is con-strained from adding large amounts of new cen-tral station capacity and has been ordered by theCalifornia Public Utilities Commission to ag-gressively seek cogeneration capacity. Back-ground information on the implementation ofPURPA in these utilities’ service areas may befound in chapter 3.
Current cost conditions in the electric powerindustry can give rise to reduced fixed costcoverage. These are illustrated for CWE in figure61, which shows the average fixed cost portionof CWE revenue requirements, based on theircurrent construction plans, for growth rates of 4,2, and O percent (CWE projects 4 percent loadgrowth). Any load growth lower than 4 percent–whether it is due to competition from onsite gen-eration or from conservation-will result in salesbelow CWE expectations and thus a rising burdenof fixed costs for remaining customers. As shownin figure 61, the larger the shortfall in sales, thefaster the fixed cost burden rises.
Turning to the California context, it is morereadily apparent that PURPA payments to cogen-erators can lead directly to reduced fixed costcoverage. PURPA payments for capacity are fixedcosts from the ratepayers’ point of view, even iftheir basis in value comes from fuel savings.
Figure 61 .—CWE Fixed Cost Structure as aFunction of Sales Growth
60
45
15
1980 1985 1988 88(A)
Year
SOURCE: Edward Kahn and Mlchael Merritt, Dispersed Electricity Generation:Planning and Regulation (contractor report to OTA, February 1981).
When a utility contracts to purchase energy froma private party, on an avoided cost basis, thePURPA payments should drop with decreasingdemand. However, this may not be the case, orat least not to any significant degree. To dem-onstrate this proposition, the cost structure ofPG&E is illustrated in table 69.
The differences between the base case and thePURPA case in table 69 are due to two factors.First, there is more than twice as much cogenera-tion in the PURPA case compared to the basecase (940 MW v. 2,000 MW). The larger amountof cogeneration represents a fulfillment of thegoal set for PG&E by the California public UtilitiesCommission. The second difference is that the
Table 69.—Pacific Gas & Electric Cost StructureAdjusted for PURPA, 1990
Base case PURPA caseFixed costs ... ... ... ... ... .$5.31 x 10⁹
$8.58 x 10⁹
Fuel . . . . . . . . . . . . . . . . . . . . . .. $5.22 x 10⁹
$3.87 X 10⁹
Sales to noncogenerators . . . . 87.4 X 10 kWh 80.8 X 10⁹ kWhFixed cost/kWh to
noncogenerators . . . . . . . . . . 80.8 mills 81.4 millsSOURCE: Edward Kahn, and Michael Merritt, Dispersed Electricity Generation:
Plannlng and Regulation (contractor reporl to the Office of TechnologyAssessment, 1981).

Ch. 6—impacts of Cogeneration . 257
base case assumes utility ownership while thePURPA case assumes private ownership.
Table 69 shows the same qualitative phenom-enon as figure 61—a rising burden of fixed orcommon costs to be borne by the nongeneratingcustomers remaining on the utility system. In thePG&E case, the shift is clearly due to the effectsof cogeneration. Moreover, a significant part ofthe increase in fixed cost comes from PURPA in-centives under the simultaneous purchase andsale provision—estimated at roughly $445 million,assuming that cogenerators will pay rates for theirown use that are roughly 70 percent of the aver-age price (18). The estimate may, of course, betoo high. If it is high, the net fixed costs wouldbe less and the risk less extreme. However, thesimultaneous purchase and sale incentive is onlyabout one-third of the fixed cost differential (445/1,270) in the two cases. Therefore, even a changein the rate structure to reduce that incentivewould not by itself eliminate the problem. Cus-tomers remaining on the utility system wouldhave fewer incentives to conserve electricity atthis point because reduced sales would only in-crease the fixed cost burden (29).
Thus, the increasing burden of fixed costs canresult from either excess capacity (CWE) or com-petition (PG&E). Of the two distinct routes to thehigh fixed cost situation, it is likely that the com-petition risk may be smaller than the excess ca-pacity risk. The reason for this is the potentialescalation in fuel costs. The calculations in table69 show fuel costs ranging from about 50 per-cent of total cost in the base case to about 37 per-cent of total cost in the PURPA case. The fuel costfraction would rise if fuel cost escalated fasterthan assumed (roughly 10 percent nominal an-nual rate). Although no one can predict futureoil prices (the dominant fuel in California), thetendency in the past has been to underpredictprice increases (29).
On the other hand, the excess capacity risk re-sults in part from the “lumpiness” of investmentin baseload facilities. New central station plantscome in large unit sizes and require long con-struction and licensing times. Further, accuratedemand forecasting is difficult, and the tenden-cy in the past has been to overestimate the future
size of the electricity market. However, demandgrowth is more sensitive to price increases thanpre-1 973 behavior seemed to indicate and largebaseload projects are difficult to adjust to reducedgrowth. Powerplant construction can be deferred(which means extra carrying cost) or canceled(which means losses). Thus, once large projectsare initiated there is a tendency to continue themregardless of changing circumstances.
Therefore, where construction commitmentsare large (as in the CWE case), the balance ofeconomic and institutional forces points towarda greater risk from excess capacity than fromcompetition. At the present time, however, therisks from cogeneration competition are morepotential than real due to its low market penetra-tion. One way utilities can deal with possiblefuture competitive threats is by trying to capturethe new markets with their own investment.
Other Economic and Social Impacts
OTA’s analysis focused on the economic andsocial impacts of cogeneration on electric utilitiesand their customers. However, cogeneration mayalso have important socioeconomic implicationsin other sectors, such as business developmentpatterns for fuel and technology suppliers andcapital markets, and the role of policy/politics inenergy supply. A detailed assessment of theseissues is beyond the scope of this report, butsome generaI considerations are outlined belowas a framework for future analysis.
PURPA’S partial deregulation of entry into theelectricity generation market has received a lotof attention for the opportunities it presents fornew and small businesses, and for the changesit may bring to existing economic sectors. For ex-ample, the primary sources of fuel for cogener-ators in the near term are not expected to be dif-ferent from the fuel sources for electric utilities(oil, gas, and coal). However, as advanced co-generation technologies with greater fuel flexibili-ty emerge, new opportunities should arise forsuppliers of alternate fuels such as municipal solidwaste (MSW), biomass, and synthetic liquids andgases. In some cases, these markets will be cap-tured by existing large energy companies seek-

258 . Industrial and Commercial Cogeneration
Photo credit: Environmental ProtectIon Agency
Advanced cogeneration technologies with greater fuel flexibility may be able to burn municipal solid waste, contributing tothe solution of waste disposal problems and providing a new source of revenue for disposal collection agencies
i n g d i v e r s i f i c a t i o n o p p o r t u n i t i e s . B u t o t h e rmarkets may be served by local governments orprivate entrepreneurs (e.g., MSW), or suppliedonsite (biomass), or captured by utilities orcogenerators themselves. For instance, one prom-ising scheme for alternate-fueled cogenerationuses a centrally located gasifier that converts coal,biomass, petroleum coke (from refineries), orother nonpremium fuels to a low- or medium-Btu gas for distribution to cogenerators within alimited radius. The gasifier could be owned jointlyby the cogenerators (e.g., in an industrial park)or by the local utility as a means of diversifyingits energy supply business. A central gasifica-tion/remote cogeneration scheme proposed byArkansas Power & Light is described in detail inchapter 5. Such a scheme would enable cogen-erators who cannot use nonpremium fuels (e.g.,due to environmental, economic, or site limita-
tions) to centralize the costs of fuel conversionand distribution. Thus, economic and policy con-siderations that discourage the use of oil and gasin cogeneration also may help to create newbusiness opportunities for a wide range of fuelsuppliers. In many cases these opportunities willgo to local distribution companies, as opposedto the large producers or distributors that sup-ply central station powerplants.
Markets for technologies also could change asa result of the widespread use of cogeneration.Electric utilities or their construction contractorsgenerally interact directly with the major manu-facturers of powerplant equipment. Cogenera-tors, on the other hand, will be more likely topurchase a total system from vendors acting asmiddlemen between manufacturers and purchas-ers. Such vendors will be able to offer a wider
Ch. 6–impacts of Cogeneration .259
range of “package” systems than a single man-ufacturer, and to tailor the package more close-ly to a user’s specific needs. Moreover, whereasutilities generally perform their own maintenance,cogeneration vendors may evolve as total servicecompanies that offer repair and maintenance aspart of the sales contract. The potential role forsuch service companies in spreading the burdenof maintenance costs and labor requirementscontributes to the uncertainty (discussed earlierin this chapter) in assessing these factors. Alter-natively, if utilities own cogenerators, they maytend to continue to deal with the major manufac-turers with which they are familiar, and to pro-vide their own maintenance.
Similar changes might appear in capital marketswith widespread investment in cogeneration. Thesmall unit size of cogenerators will mean smallerbut more frequent investments in generating ca-pacity increments. If utilities are investing, thentheir capitalization is likely to shift away fromlong-term debt and equity to short-term debtorretained earnings. Alternatively, utilities mayestablish innovative low-interest loan programsfor cogenerators. Third-party investors may playa major role due to the tax incentives introducedby the Economic Recovery Tax Act of 1981. Orpotential cogenerators may shift their investmentpriorities from process equipment to cogenera-tion. As a result of all these types of owners, newcapital markets for energy projects will be in-troduced. Traditional lending institutions such asbanks could become financiers for energy proj-ects. Investment firms will have a new option forsheltering their clients’ income. A wide range oftraditional financiers may establish leasing sub-sidiaries.
The potential impacts on fuel, technology, andcapital markets outlined above will themselveshave far-reaching effects. For example, concernis frequently expressed about the anticompetitiveaspects of utility investment in cogeneration. Itis argued that utilities may favor their own sub-sidiaries in contracting for cogenerated power,or favor one or two manufacturers or vendors ofcogeneration systems, and thus foreclose smallbusiness opportunities and/or stifle the develop-ment of innovative technologies. Similarly, utili-ty loan programs have raised questions about
competition in the banking industry, wheremarket entry traditionally has been regulated.Although these concerns may be real, closingthese markets to utilities could also stifle thedevelopment of cogeneration capacity, and itmay be more sensible to resolve any questionsabout the competitive effects of utility investmentthrough carefully drafted legislation and regula-tions, and through established legal and admin-istrative remedies.
The introduction of new fuel supply configura-tions could have significant impacts on other fuelusers as well as on land use patterns and otherenvironmental factors. If oil- or gas-fired cogen-eration achieved a significant market penetration,changes could occur in the way these fuels areallocated among noncogenerating residential,commercial, and industrial customers. Cen-tralized fuel conversion systems such as gasifierswould require new dedicated distribution sys-tems, and would strongly influence the locationof new cogenerating industries. Where fuel con-version is not centralized, fuel delivery andstorage may pose substantial problems, especially
in urban areas. If the cogeneration site is not ableto accommodate large fuel storage facilities (e.g.,30 days’ supply), then frequent deliveries couldinvolve noise and/or air pollution as well as traf-fic congestion. As with the concerns about theanticompetitive aspects of utility ownership ofcogenerators, these potential land use problemsare probably best solved through careful designand siting of cogenerators and rational local plan-ning, rather than through general disincentivesto cogeneration.
Centralization and Decentralization ofElectricity Generation
In the two decades following World War II, theelectric power industry operated under a declin-ing production cost curve even during periodsof general increases in the cost of fuels and theoverall consumer price index. The primary con-tributor to these declining costs was the captureof significant economies of scale that allowedlarger powerplants to use fuel more efficiently(see ch. 3). At the same time, obvious cost sav-

260 ● Industrial and Commercial Cogeneration
ings became associated with the location of multi-ple units on single sites, and planning responsibil-ities, decisionmaking authority, and capital assetsbecame concentrated in a rapidly diminishingnumber of institutions—primarily investor-ownedutilities (32). The resulting combination of largepowerplants concentrated at a central locationand under the authority of a limited number oflarge organizations has become known as thecentralization of the utility industry.
When engineering economies of scale were nolonger able to offset other costs for larger power-plants, and the electric power industry’s declin-ing cost curve disappeared in the late 1960’s, thevalue of such centralization became increasinglydebated. Questions have been raised about therole of centralization in the adverse environmen-tal impacts of large powerplants, in utilities’ finan-cial deterioration, and in more qualitative con-cerns such as individual’s feelings that they havelost some control over important aspects of theirlives and livelihoods. As a result, it is frequentlysuggested that the electric power industry shouldbe restructured in favor of a decentralized systembased on small-scale technologies located at ornear the point of use and subject to local or indi-vidual control. This position is advocated by awide range of groups with varying goals, but thecentral features of the argument generally areconsidered to be embodied in the writings ofAmory Lovins and colleagues on the “soft energypath” (31).
This section reviews the context of the debateover centralized and decentralized electric ener-gy systems, then analyzes the role that cogenera-tion might play within that debate. *
Technology and Values
One of the critical features of the current ener-gy policy debate is the lack of consensus on boththe facts and the values surrounding energy pol-icy. Thus, there are radically different perceptionsabout the actual nature of the “energy problem”as well as disagreements about the role energyplays in structuring social organization. One ofthe most pervasive of these disputes is over the
*Much of the following discussion is from Hoberg (26).
centralization or decentralization of electricpower production.
The point of view that argues for “decentraliza-tion” is embodied in a number of separate move-ments (e.g., appropriate technology, environ-mentalist, antinuclear), each of which has its owncriteria for evaluating energy technologies. Butthey all tend to converge with regard to proposalsfor small-scale renewable energy technologies,as embodied in the “soft-path” future firstdescribed by Lovins.
The three primary components of Lovins’ softenergy path are:
●
●
●
prompt commitment to maximizing end-useefficiency;rapid development and deployment of small-scale renewable-fueled technologies whoseenergy quality closely matches the requiredservice; andspecial transitional fossil fuel technologies.
The first component would minimize the energyinput into a given end-use function. The secondwould accelerate reliance on renewable fuels andon energy technologies that contribute to self-reliance, and the third would “tide us over” un-til the system adjustments anticipated by the firsttwo can be made. Because of Lovins’ overridingconcern with thermodynamic efficiency, cogen-eration—primarily industrial cogeneration usingcoal-fired fluidized bed combustion systems—isviewed as a major contributor to the transitionalfossil fuel technologies.
Lovins’ writings have played a major role inwinning a place for alternative technologies inthe energy policy debate. However, as in otherenergy policy areas, the facts and values sur-rounding soft energy paths are subject to debate.With respect to the facts, the uncertainties in cap-ital and operating costs and in output characteris-tics are especially important. In regard to thevalues, there is disagreement not only betweensoft and hard path advocates, but also betweendifferent segments of the alternative energy move-ment.
For example, Lovins only applies soft energytechnologies at the margin; he does not advocatethe early replacement of existing central station

—
Ch. 6—impacts of Cogeneration 261
powerplants and their accompanying transmis-sion and distribution networks. Other “appropri-ate” technology advocates focus on stand-aloneapplications that are totally incompatible with theexisting electricity supply system (e.g., windmillsor photovoltaics coupled with battery storage).Moreover, there is no real consensus among softpath advocates as to which values should pre-dominate in such technological decisions. Someplace a great deal of emphasis on fostering decen-tralization in order to gain control over the tech-nologies that affect their lives, while others em-phasize economic efficiency.
The debate about the role of cogeneration inenergy policy typifies these fact and value dis-putes in several ways. It can be a small-scale tech-nology located at the point of use, or larger sys-tems can be centrally located and the energyproducts distributed among several co-owners orcustomers. Cogenerators can use coal or otheralternate fuels as their primary energy source, butthe most economic systems for some applicationswill rely on oil or gas in the near term (e.g., gasturbines, diesels). Cogeneration can present sig-nificant energy savings when compared to cen-tral station generation and separate thermal pow-er production, but it also will be competingagainst conservation, coal, and renewable fuelson many electric systems, and its electric poweroutput is less certain. Thus, whether cogenera-tion will be a favored technology to advocatesof decentralized energy systems will dependheavily on the technology and the mode of de-ployment chosen.
Centralization and Decentralization
The concepts of centralization and decentrali-zation are critical to an assessment of the socialand institutional impacts of dispersed electricitygeneration, but are all too often left undefined.In this discussion, these terms will be used todescribe a measure of the distribution of control,authority, or autonomy throughout a system (inthis case the energy and social systems), where“control” refers to the ability to affect thebehavior of others or of the system itself. A situa-tion in which a single component controls allothers and the system itself (e.g., a monopoly ormonopsony) defines the centralized extreme,
while at the decentralized extreme each individ-ual is autonomous and therefore cannot changethe system or its components (e.g., perfect com-petition). This concept of centralization is similarto that in organization and administration theory,where the concern is locating the decision mak-ing authority within an organization or institution.The concepts of centralization and decentraliza-tion of control are particularly important to thestructure of organizations because mismatchesbetween that structure and the task it is designedto accomplish can result in inefficiencies (7).
The centralization or decentralization of con-trol should be distinguished from other conceptsthat focus on size or geographical concentration.While these factors may influence the degree ofcentralization, they do not define it. Similarly, itis useful to distinguish technical from social cen-tralization. Thus, technical systems can be de-fined in terms of their dependence on one or afew components (e.g., central dispatch of an in-terconnected electric utility system) without nec-essarily implying an equal degree of authorityover a related social system.
Centralization/Decentralizationand Cogeneration
How cogeneration fits into this definition ofcentralization and decentralization will dependon its deployment and operating characteristics.Thus, the lower minimum efficient scale of cogen-eration relative to conventional powerplants cancontribute to decentralization because the small-er size and lower costs make the technology ac-cessible to more people. On the other hand, co-generators are more complex than traditional on-site thermal energy systems (e.g., boilers, fur-naces), and they are likely to require new tech-nical and managerial skills in industrial and com-mercial enterprises that own and operate them,or in utility companies that deploy them in theirservice areas. Whether a firm decides to train oracquire its own expertise or to rely on a vendor,utility, or other service company may determinethat firm’s perceptions of autonomy.
Similarly, the resource/demand characteristicsof cogeneration, including the type of primaryenergy source and its concentration or density,

.— —
262 Industrial and Commercial Cogeneration
the type of technology and its concentration, andthe actual number of components in the re-source, conversion, and demand categories willinfluence the degree of centralization. In general,decentralization might occur if the energy re-quired within a given area is approximately equalto the energy available in that area. If energy mustbe imported, the system will be more vulnerableto external control and thus relatively centralized.Similarly, where the energy can be exported ordistributed over a larger area, a relatively central-ized dependence of dispersed users on a concen-trated resource may result.
Finally, the amount of political or social impor-tance associated with cogeneration will be asignificant factor in determining centralizationand decentralization of control. For example,PURPA encourages grid-connected cogeneration,offering economic incentives for operating char-acteristics (such as central dispatch) that increaseutilities’ control over the deployment and use ofthe technology.
Because all these characteristics will vary wide-ly, it is clear that cogeneration cannot automatic-ally be considered a decentralized technologythat will lead to a decentralized social structure.Similarly, central station powerplants will not al-ways lead to centralized social organization, al-though this has been the predominant trend inthe electric power industry. Rather, it is possibleto envision centralized technologies that contrib-ute to a decentralized social or political system,as well as decentralized technologies leading tocentralization of control. For example, FranklinRoosevelt saw centralized generation of electrici-ty with transmission to outlying areas as the keyto a decentralized society:
Sheer inertia has caused us to neglect formulat-ing a public policy that would promote the op-portunity to take advantage of the flexibility ofelectricity; that would send it out wherever andwhenever wanted at the lowest possible cost. Weare continuing the forms of overcentralization ofindustry caused by the characteristics of thesteam engine, long after we have had technicallyavailable a form of energy which should promotedecentralization of industry (34).
The central theme underlying the possibility ofsuch a centralized energy system supplying a
decentralized society is the proposition that themost effective means of preserving diversity, flex-ibility, and freedom of choice in social structureis to ensure abundant supplies of energy at thelowest possible cost (termed the “cornucopiastrategy”). The less scarce the fundamental en-ergy input, the less influence energy would haveon the structure of social organization. Cogenera-tion (and other alternative technologies) wouldbe included in the cornucopia strategy to the ex-tent that they pose economic advantages overconventional technologies. Moreover, a recentanalysis suggests that cogeneration combinedwith the centralized electricity grid will contributeto decentralization in the economy(1). This anal-ysis argues that the lack of significant scale effectsassociated with connection to a centralized gridwill mean that large firms will not have competi-tive advantages over small firms in energy access(ignoring declining block rates or relative processefficiencies). Thus, diversity and decentralizationof organizational structure in industry and busi-ness might be promoted.
The idea of centralized energy systems leadingto decentralized social organization looks moreto fragmentation of power among interest groupsand various levels of government wherein free-dom and flexibility in lifestyles are fostered andpreserved, while the appropriate technologymovement embodies a notion of decentralizationthat consists of a loosely coupled system of nearlyautonomous and self-reliant communities. Assuch, the former view can accommodate a greatdeal of specialization and differentiation in soci-etal function, at aggregate levels, that the latterfundamentally opposes.
On the other hand, it is also possible to envi-sion a decentralized energy system in a central-ized political economy. This might come aboutin two ways. One analysis considers the casewhere some combination of a deterioration in theeconomics of utility generated electricity and anenhanced competitive position of cogenerationsystems brings about an industrywide movementtowards cogeneration as the source of electricpower and process heat/steam. Because there areeconomies of scale (in capital equipment, O&M,pollution control, etc.) inherent in cogenerationdevices, the larger firms in a certain industry

Ch. 6—impacts of Cogeneration . 263
group will be able to produce energy morecheaply than the smaller firms, which would givethe larger firms a competitive advantage, contrib-uting to the elimination or absorption of smallerfirms by the larger firms. The end result is cen-tralization in industry (as measured by industrialconcentration) (26).
A second view of this configuration-decentral-ized energy systems in the context of centralizedcontrol—also could result from policy considera-tions. In fact, some commentators have suggestedthat this is the most likely result:
The most plausible vision of a renewable-en-ergy future is one that offers less freedom andless true diversity, more centralization of deci-sion, and more state (i.e., government) interfer-ence and corporate domination in our lives, thanis the case in the present society in the UnitedStates . . . (37).
Clearly, this combination of decentralized energyand centralized social organization dependsmore on policy orientations than on any of theother factors that influence the degree of central-ization/decentralization. Lovins terms this alter-native a coercive one in that it is most likely toresult from policies that mandate—rather than use
CHAPTER 61. Asbury, Joseph G., and Webb, Steven B., Central-
izing or Decentralizing: The Impact of Decentral-ized Electric Generation (Argonne, Ill.: ArgonneNational Laboratory, ANL/SPG-16, 1979).
2. Bell, Douglas, Standards Development Branch,U.S. Environmental Protection Agency, privatecommunication to OTA.
3. Bhargava, Vijay, California Air Resources Board,private communication to OTA, September 1981.
4. Bioenergy Bulletin, vol. 11, No. 3, published byU.S. DOE, Region X, Mar. 15, 1981.
5. Breitstein, L. and Gant, R. E., M/US Systems Anal-ysis–Effects of Unfavorable Meteorological Condi-tions and Buildings Configuration on Air Quality(Oak Ridge, Term.: Oak Ridge National Labora-tory, ORNL/HUD/MIUS-29, February 1976).
6. Brooklyn Union Gas/FIAT, TOTEM Technical De-scription, October 1978.
7. California Air Resources Board, Proposed Strategyfor the Control of Nitrogen Oxide Emissions from
market incentives for—a decentralized energysystem (or the proverbial distinction between thecarrot and the stick). Alternatively, such central-ization could result from demands for control ofthe impacts of decentralized technologies in thatit is easier to impose and enforce controls in acentralized manner (e.g., uniform Federal stand-ards for system design at the point of manufac-ture) than it is to monitor and enforce such con-trols at myriad points of use. At the extreme,authoritative solutions may be seen as necessaryto meet an industrial society’s need for adequateand reliable supplies of energy, or to allocatelosses in the event of an energy supply shortfall(37).
As has been seen above, cogeneration (andother dispersed generating systems) cannot nec-essarily be considered either a decentralized ora centralized energy system nor will they neces-sarily lead to either centralization or decentraliza-tion of social organization. Rather the degree ofcentralization/decentralization will depend onsite specific, market, and policy factors such asthe mode of operation, form of ownership, result-ing profit and competitive aspects, and relativepolicy emphasis on their deployment.
REFERENCESStationary Internal Combustion Engines (State ofCalifornia, October, 1979).
8. Casten, Thomas, Cogeneration DevelopmentCorp., private communication to OTA.
9. Chandler, Alfred D., Jr., Strategy and Structure:Chapters in the History of American Industrial En-terprise (Cambridge, Mass.: The MIT Press, 1962).
10. “Cogeneration Proponents Will Seek An Air ActChange Recognizing Greater Efficiencies,” InsideEPA, Apr. 3, 1981.
1 I, Consolidated Edison Co. of New York, written tes-timony before the New York State Department ofPublic Service, “Environmental Assessment of Co-generation in New York City,” Mar. 17, 1980, p.13.
12. Dadiani, John, Cogeneration—Status and Environ-mental Issues (contract 68-03-2560, draft report toEPA, 1980),
13. Davis, W. T., and Kolb, J. O., Environment/ As-sessment of Air Quality, Noise and Cooling Tower

264 ● Industrial and Commercial Cogeneration
140
15.
16.
17.
18,
19,
20.
21.
22.
23.
24.
25.
26,
27,
28.
29.
Drift From the Jersey City Total Energy Demonstra-tion (Oak Ridge, Term.: Oak Ridge National Lab-oratory, ORNUHUD/MlUS-52, June 1980).Domaracki, Alan J., and Sistla, Gopal, testimonybefore the State Department of Public Service be-fore the Commission, case No. 27574, July 1980.Dryer, Frederick, Princeton University, privatecommunication to OTA, October 1981.Dukakis, Michael S., Governor’s Commission onCogeneration, Cogeneration: Its Benefits to NewEng/and (Governor of Massachusetts, October1978).Energy and Resource Consultants, Inc., Federaland State Environmental Permitting and SafetyRegulations for Dispersed Electric GenerationTechnologies, contractor report to OTA, 1980.Environmental Defense Fund, An Alternative tothe Warner Va//ey Energy System (Berkeley, Calif.:EDF, Jlliy 1980).Environmental Research and Technology, Inc., AirQuality Impact of Diesel Cogeneration in NewYork City, Document P-A 302, November 1979.Ferris, B. G. Jr., “Health Effects of Exposure to LowLevels of Regulated Air Pollutants. A Critical Re-view,” 28J. Air Pollution Control Association 482,1978.Freudenthal, P. C., additional rebuttal testimony,New York Public Service Commission case No.27574, N O V. 13, 1980.Freudenthal, P., Consolidated Edison, privatecommunication to OTA.“General Discussion: Health Effects of Exposureto Low Levels of Regulated Air Pollutants,” J. AirPollution Control Association 28:891, 1978).Ghassemi, M. and Lyer, R., Environmental Aspectsof Synfue/ Utilization (EPA-600/7-81 -025, March1981).Griffin, H. E., et al., Health Eflects of Exposure toDiesel Exhaust (Washington, D. C.: National Acad-emy of Sciences, 1980).Hoberg, George, Electricity, Decentralization, andSociety: The Soci~Political Aspects of DispersedElectric Generating Technologies, contractor re-port to OTA, January 1981.ICF, Inc., A Technical and Economic Evaluationof Dispersed Electric Generation Technologies,contractor report to OTA, October 1980.Jarvis, P. M., “Methanol as Gas Turbine Fuel,”paper presented at the 1974 Engineering Founda-tion Conference, Methanol as an Alternate Fuel,Henneker, N. H., July 1974.Kahn, Edward, and Merritt, Michael, DispersedElectricity Generation: Planning and Regulation,contractor report to OTA, 1981.
30.
31.
32.
33.
34.
35.
36.
37.
38.
39.
40.
Komanoff, Charles, “Nuclear Costs Spiral AboveCoal,” Pub/ic Power, Sept. 10, 1981.Lovings, Amory, Sofi Energy Paths: TowardA Du-rab/e Peace (Cambridge, Mass.: Ballinger Press,1 977).Messing, Marc, Friesema, H. Paul, and Morrell,David, Centralized Power (Washington, D. C.: En-vironmental Policy Institute, 1979).Office of Technology Assessment, U.S. Congress,The Direct Use of CoaJ OTA-E-86 (Washington,D. C.: U.S. Government Printing Office, April1 979).President Franklin D. Roosevelt, speech before theWorld Power Conference, 1936, quoted in TheEnergy Controversy: Soii Path Questions and An-swens, Hugh Nash (cd.) (San Francisco: Friends ofthe Earth, 1979).Reese, R. E., and Nisenbaum, D., “Suggested Con-trol Measure for the Control of Nitrogen OxideEmissions From Stationary Internal CombustionEngines” (California Air Resources Board, May1980).Sheppard, D., et al., “Exercise Increases SulfurDioxide–induced Bronchoconstriction in Asth-matic Subjects,” Am. Rev. Resp. Dis., May 1981.Tugwell, Franklin, “Energy and Political Econ-omy,” Comparative Po/itics, October 1980.U.S. Environmental Protection Agency, Compila-tion of Air Pollutant Emission Factors (AP-42),1978.U.S. Environmental Protection Agency, StandardsSupport and Environmental Impact Statement forStationary Internal Combustion Engines (EPA-45012-78-125a, draft, July 1979).U.S. Environmental Protection Agency, StandardsSupport and Environmental Impact Statement forStationary Gas Turbines (EPA-450/2 -77-Ol 7a, Sep-tember 1977).
41. U.S. Department of Energy, Environmenta/Read-iness Document- Cogeneration (DOE/ERD-0003,1978).
42. U.S. General Accounting ~ce, /ndustria/ Cogen-eration— What It Is, How It Works, Its Potential(Washington, D.C.: U.S. Government Printing Of-fice, EMD-80-7, Apr. 29, 1980).
43. Wilson, R. P., et al, “Single-Cylinder Tests of Emis-sion Control Methods for Medium-Speed DieselEngines,” ASME paper 82-DGP-28, March 1982.
44.40 CFR 52.21, 52.24.45.40 CFR pt. 60, subpts. D,E.46.40 CFR pt. 60, subpt. GG.