Embed Size (px)
Citation preview

Build ValueChapter 6

TeamSportsMarketing.com
SPSS is still fun….
Just remember Karl “Carl” Pearson

TeamSportsMarketing.com
What factors are correlated with attendance?
Let’s run some correlations!Analyze
Correlate▪Bivariate
TeamSportsMarketing.com
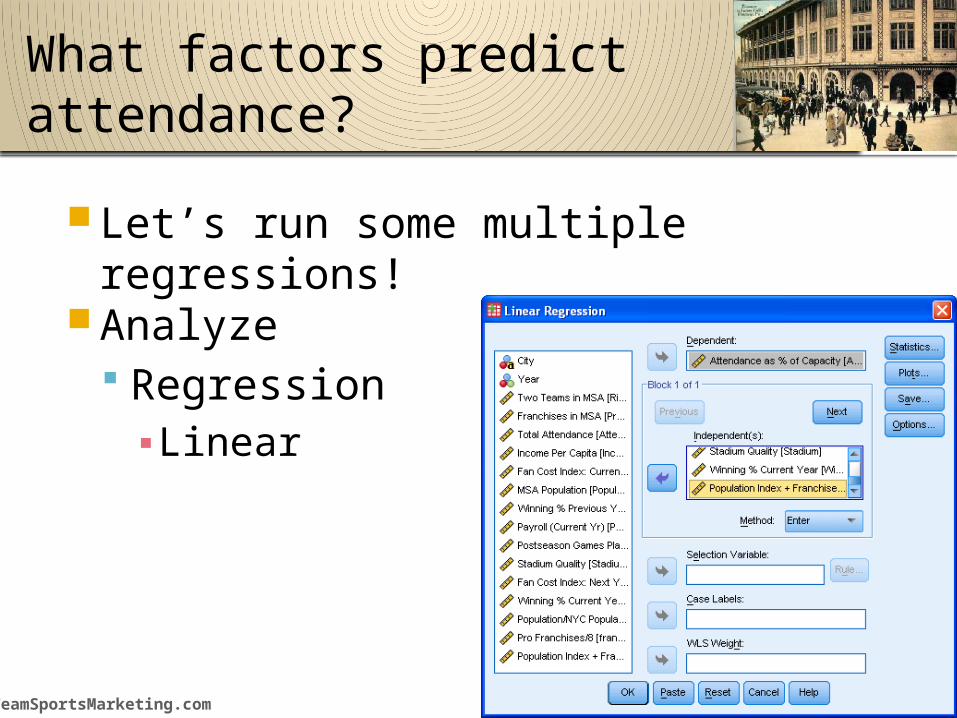
What factors predict attendance?
Let’s run some multiple regressions!Analyze
Regression▪ Linear
TeamSportsMarketing.com
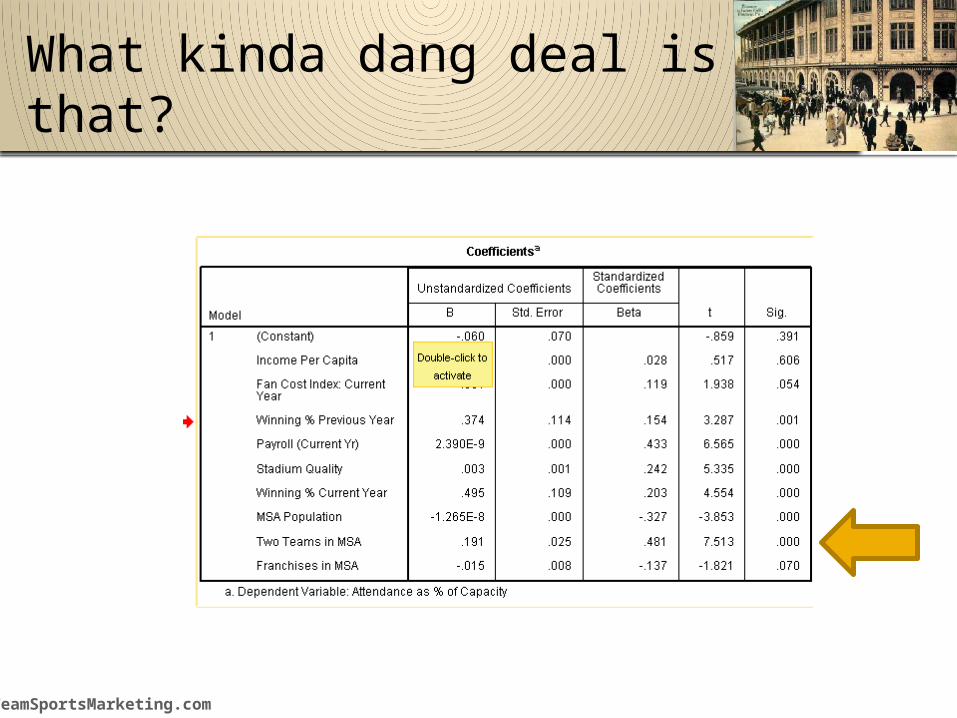
What kinda dang deal is that?

TeamSportsMarketing.com
Must be multicollinearity!!
TeamSportsMarketing.com
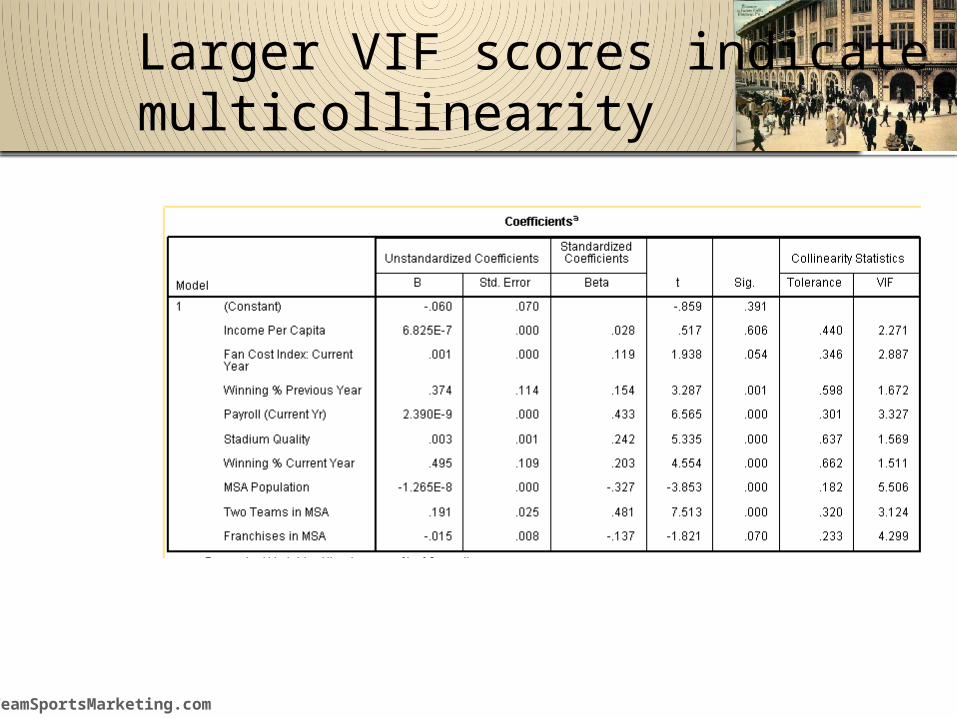
Larger VIF scores indicate multicollinearity
TeamSportsMarketing.com
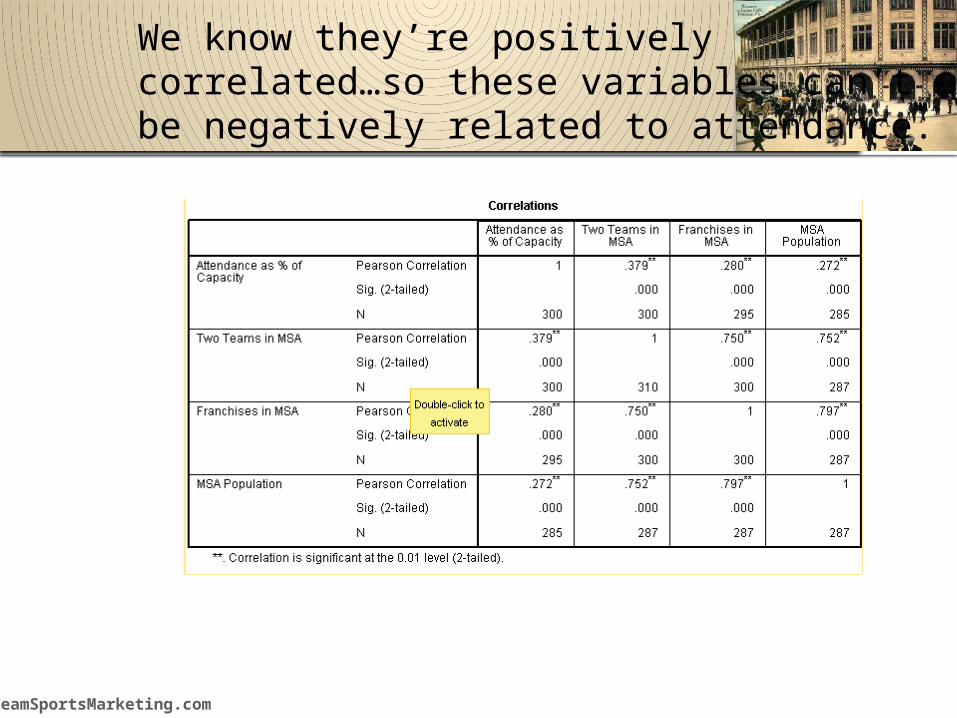
We know they’re positively correlated…so these variables can’t be negatively related to attendance.
TeamSportsMarketing.com
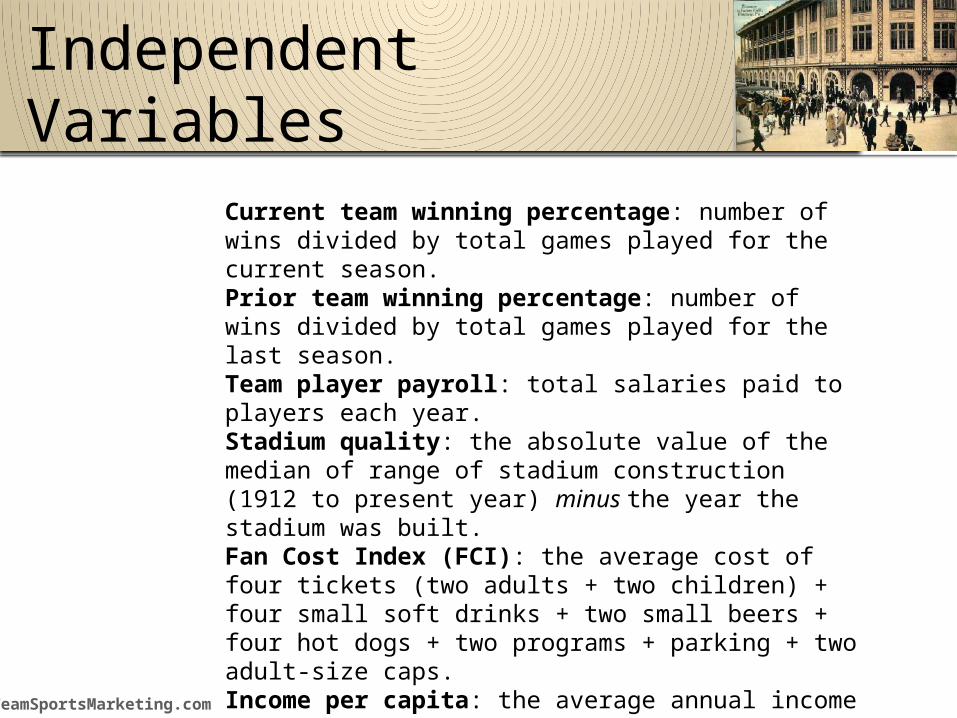
Independent Variables
Current team winning percentage: number of wins divided by total games played for the current season.Prior team winning percentage: number of wins divided by total games played for the last season.Team player payroll: total salaries paid to players each year.Stadium quality: the absolute value of the median of range of stadium construction (1912 to present year) minus the year the stadium was built.Fan Cost Index (FCI): the average cost of four tickets (two adults + two children) + four small soft drinks + two small beers + four hot dogs + two programs + parking + two adult-size caps.Income per capita: the average annual income in the metropolitan statistical area (MSA)Population Franchise Index (PFI): (population/NYC population) + (franchises in city/8) + (2 if two MLB teams; 0 if only 1)
TeamSportsMarketing.com
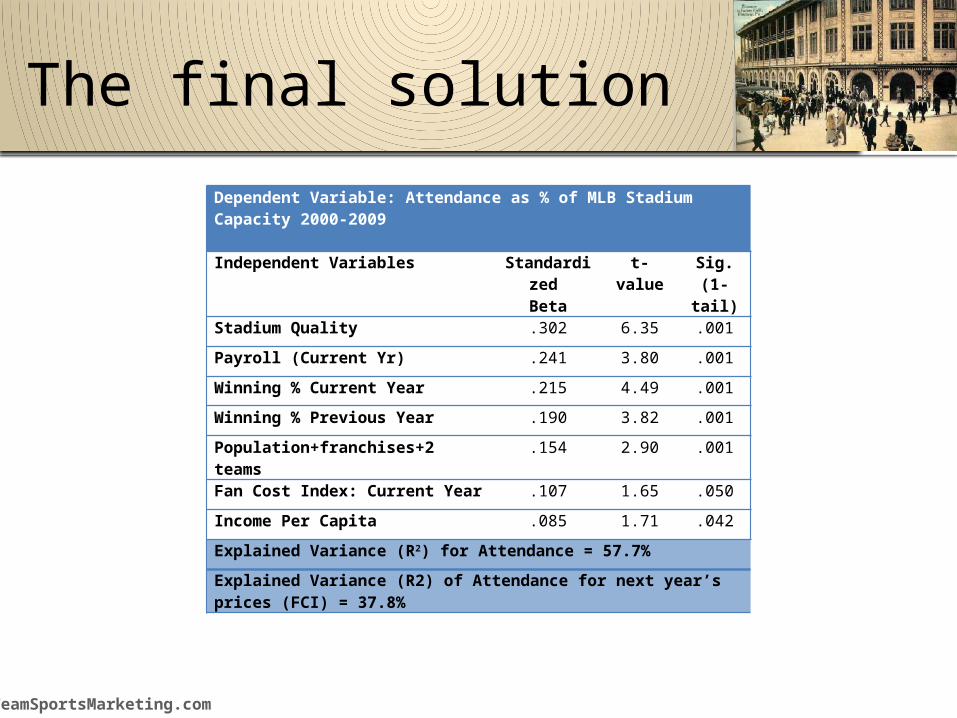
The final solution
Dependent Variable: Attendance as % of MLB Stadium Capacity 2000-2009 Independent Variables Standardize
d Beta
t-value Sig.(1-tail)
Stadium Quality .302 6.35 .001
Payroll (Current Yr) .241 3.80 .001
Winning % Current Year .215 4.49 .001
Winning % Previous Year .190 3.82 .001
Population+franchises+2 teams .154 2.90 .001
Fan Cost Index: Current Year .107 1.65 .050
Income Per Capita .085 1.71 .042
Explained Variance (R2) for Attendance = 57.7%
Explained Variance (R2) of Attendance for next year’s prices (FCI) = 37.8%
TeamSportsMarketing.com
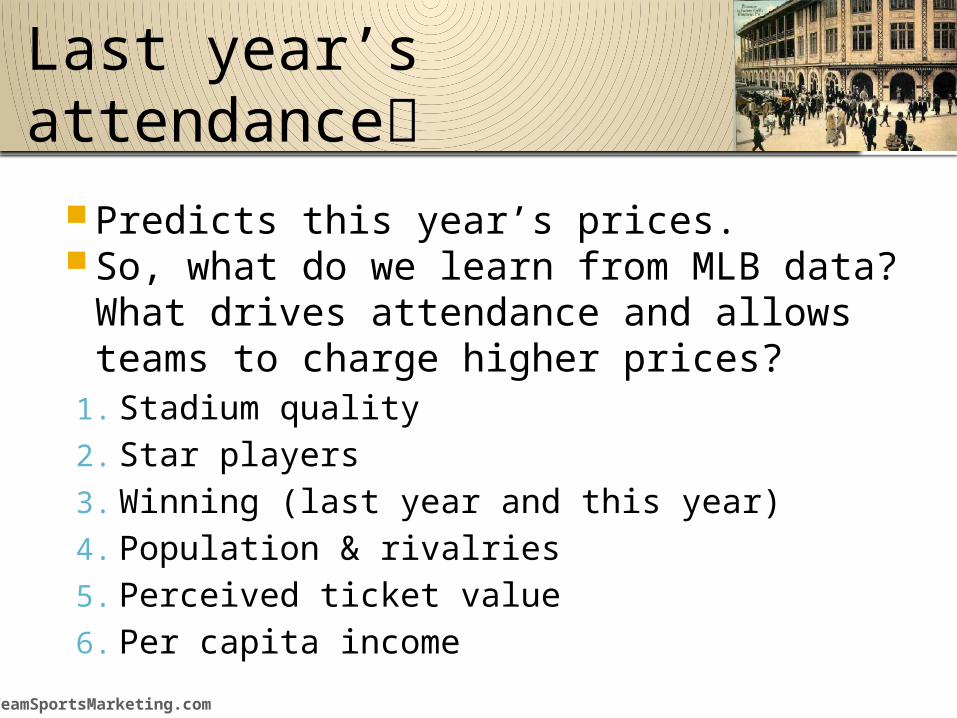
Last year’s attendance
Predicts this year’s prices. So, what do we learn from MLB data?
What drives attendance and allows teams to charge higher prices?
1. Stadium quality2. Star players3. Winning (last year and this year)4. Population & rivalries5. Perceived ticket value6. Per capita income
TeamSportsMarketing.com
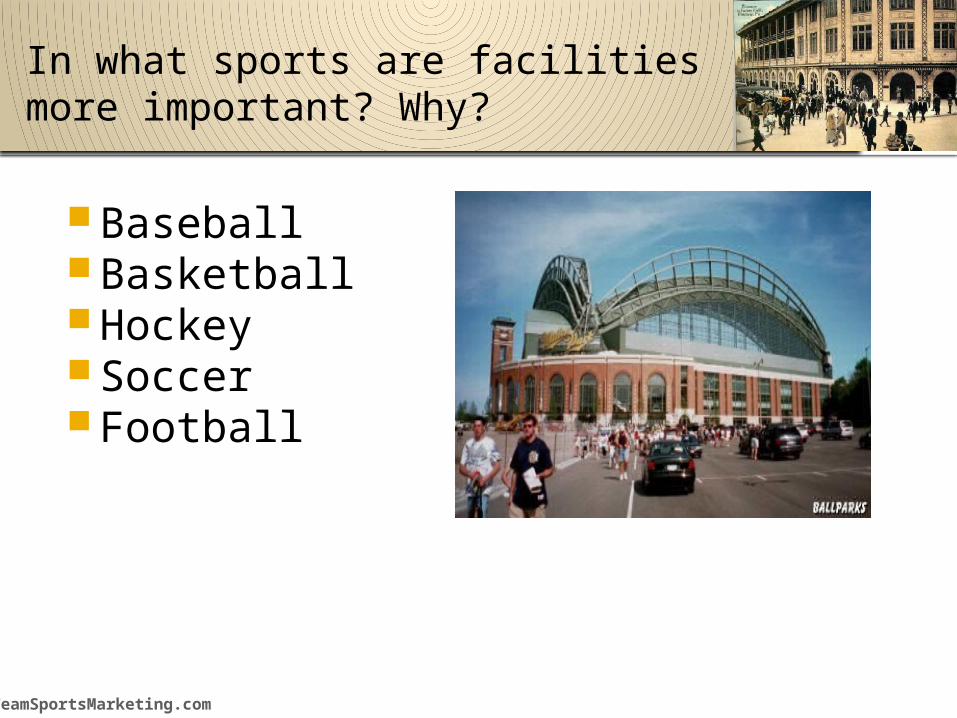
In what sports are facilities more important? Why?
BaseballBasketballHockeySoccerFootball

TeamSportsMarketing.com
Is winning everything?
What about the Florida Marlins and Tampa Bay Rays?
Is it just a Florida thing?
Or do they just have crummy stadiums and get rid of their star players?
TeamSportsMarketing.com
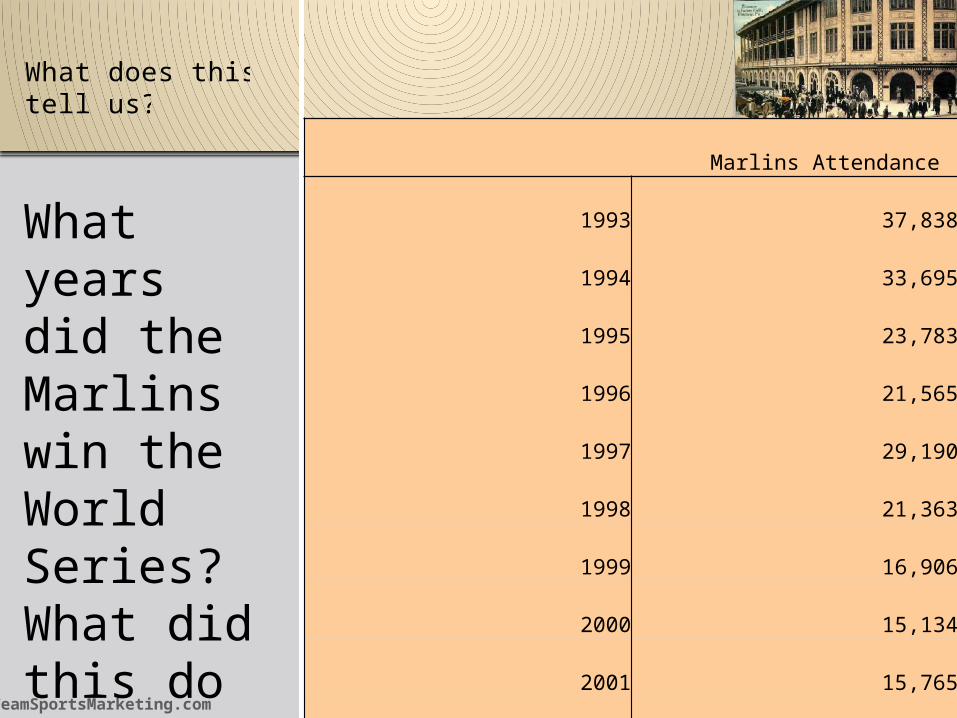
What does this tell us?
Marlins Attendance
1993 37,838
1994 33,695
1995 23,783
1996 21,565
1997 29,190
1998 21,363
1999 16,906
2000 15,134
2001 15,765
2002 10,038
2003 16,290
2004 22,091
2005 22,792
What years did the Marlins win the World Series? What did this do for them? Why?
TeamSportsMarketing.com
Population & Rivalry
Why do you think having rivalry teams in Chicago, LA, NYC, and San Francisco helps attendance?
TeamSportsMarketing.com
Why do teams offer discounts?
Sports organizations are able to charge higher prices when they have quality venues, star players, winning teams, recent winning seasons, and larger populations from which to draw.
So, which organizations are bound to be charging lower prices?
TeamSportsMarketing.com
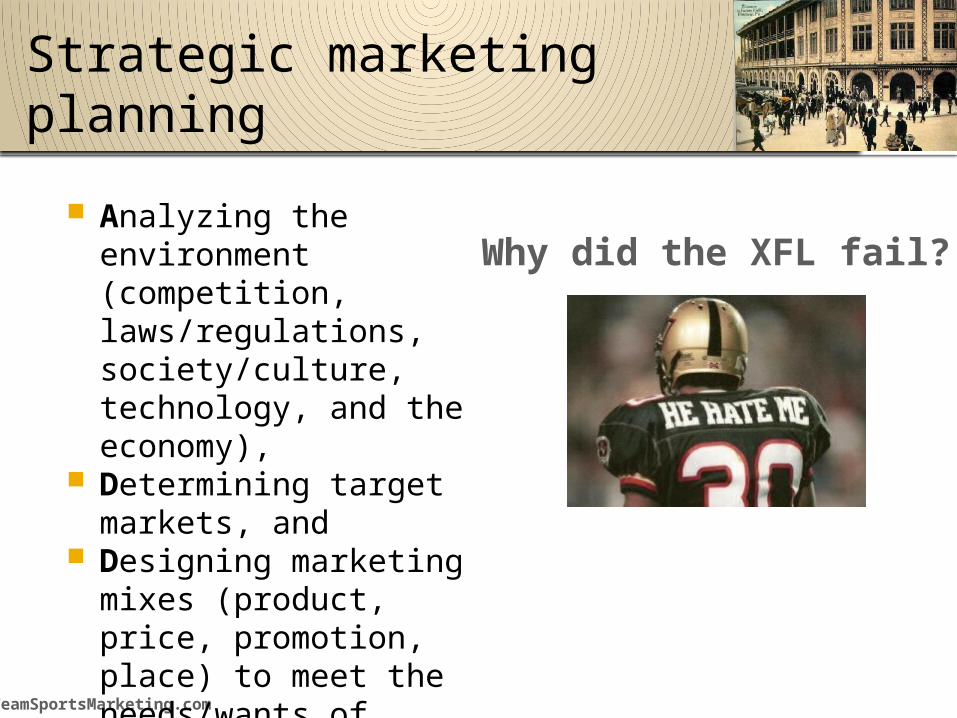
Strategic marketing planning
Analyzing the environment (competition, laws/regulations, society/culture, technology, and the economy),
Determining target markets, and
Designing marketing mixes (product, price, promotion, place) to meet the needs/wants of target markets.
Why did the XFL fail?